Danske Bank’s FX Quant...
25
1 www.danskebank.com/CI 1 Danske Bank FX Quant Strategy Danske Bank’s FX Quant Strategy Editor(s): Senior Analyst Morten Helt +45 45 12 85 18 [email protected] Analyst Kristoffer Kjær Lomholt +45 45 12 85 29 [email protected] Important disclosures and certifications are contained from page 24 of this report. 14 October 2015 • FX Quant Strategy provides a quantitative overview of the currency market, including several valuation tools and monitors, focusing on the FX options market. • This week we recommend two FX option trades: − Short EUR/GBP via a 3M seagull − Long NOK/SEK via a 6M risk reversal • Following the past weeks’ decline in implied volatility, FX volatility generally trades in neutral territory across the board, according to our model. Especially, implied volatility on short-dated options has declined substantially causing a flattening of volatility curves – most notably in EUR/scandi and USD/scandi crosses where short-dated FX options up to the 1M tenor are borderline cheap, according to our volatility valuation model. • According to our spot monitor, NOK remains significantly undervalued vis-à-vis EUR and SEK, while the two scandies are expensive relative to USD with both USD/SEK and USD/NOK trading below the short-term financial model fair value estimates of 8.2329 and 8.2190, respectively. Fundamentally, we remain medium- to long-term bullish on the NOK and think the current low levels in NOK/SEK combined with a cheap option skew offer an attractive opportunity from a risk/reward perspective to gradually build up long NOK/SEK positions. In addition, the recent month’s significant SEK appreciation challenges the Riksbank’s inflation mandate via lower import prices and we cannot rule out a Swedish rate cut already this month (albeit our main call remains a December cut). We recommend entering a 6M NOK/SEK risk reversal at zero costs. • Among the majors, our short-term financial model suggests that GBP is undervalued with EUR/GBP trading 1.3 standard deviations above the model’s fair value of 0.7325 and GBP/USD currently 1.1 standard deviations below the fair value estimate of 1.5509. Yesterday, we recommended selling EUR/GBP on continued UK growth and a BoE rate hike in Q1, see Danske Bank FX Trading Portfolio – sell EUR/GBP (13 October 2015) for more details. As an alternative to an outright short position, we recommend to position for a lower EUR/GBP via a 3M bearish seagull. We recommend to enter a ratioed (1 x 1 x 1.5) seagull structure at zero costs by buying a 0.7465 put option and selling a 0.7220 put at the same notional while selling a 0.7630 call option at 1.5 x notional. • For more details see Introducing Danske Bank's FX Quant Strategy , 5 March 2015.
-
Upload
hoangxuyen -
Category
Documents
-
view
215 -
download
1
Transcript of Danske Bank’s FX Quant...

1 www.danskebank.com/CI 1
Danske Bank FX Quant Strategy
Danske Bank’s FX Quant Strategy
Editor(s):
Senior Analyst
Morten Helt
+45 45 12 85 18
Analyst
Kristoffer Kjær Lomholt
+45 45 12 85 29
Important disclosures and
certifications are contained
from page 24 of this report.
14 October 2015
• FX Quant Strategy provides a quantitative overview of the currency market, including several valuation tools and monitors, focusing on the FX options market.
• This week we recommend two FX option trades:
− Short EUR/GBP via a 3M seagull
− Long NOK/SEK via a 6M risk reversal
• Following the past weeks’ decline in implied volatility, FX volatility generally trades in neutral territory across the board, according to our model. Especially, implied volatility on short-dated options has declined substantially causing a flattening of volatility curves – most notably in EUR/scandi and USD/scandi crosses where short-dated FX options up to the 1M tenor are borderline cheap, according to our volatility valuation model.
• According to our spot monitor, NOK remains significantly undervalued vis-à-vis EUR and SEK, while the two scandies are expensive relative to USD with both USD/SEK and USD/NOK trading below the short-term financial model fair value estimates of 8.2329 and 8.2190, respectively. Fundamentally, we remain medium- to long-term bullish on the NOK and think the current low levels in NOK/SEK combined with a cheap option skew offer an attractive opportunity from a risk/reward perspective to gradually build up long NOK/SEK positions. In addition, the recent month’s significant SEK appreciation challenges the Riksbank’s inflation mandate via lower import prices and we cannot rule out a Swedish rate cut already this month (albeit our main call remains a December cut). We recommend entering a 6M NOK/SEK risk reversal at zero costs.
• Among the majors, our short-term financial model suggests that GBP is undervalued with EUR/GBP trading 1.3 standard deviations above the model’s fair value of 0.7325 and GBP/USD currently 1.1 standard deviations below the fair value estimate of 1.5509. Yesterday, we recommended selling EUR/GBP on continued UK growth and a BoE rate hike in Q1, see Danske Bank FX Trading Portfolio – sell EUR/GBP (13 October 2015) for more details. As an alternative to an outright short position, we recommend to position for a lower EUR/GBP via a 3M bearish seagull. We recommend to enter a ratioed (1 x 1 x 1.5) seagull structure at zero costs by buying a 0.7465 put option and selling a 0.7220 put at the same notional while selling a 0.7630 call option at 1.5 x notional.
• For more details see Introducing Danske Bank's FX Quant Strategy, 5 March 2015.

2 www.danskebank.com/CI 2
Danske Bank FX Quant Strategy
Top FX option trades
14 October 2015
Trade # 1: Enter bearish 3M EUR/GBP 1:1:1.5-ratioed seagull
Trade # 2: Enter bullish 6M NOK/SEK risk reversal
Sell 3M EUR/GBP call option at strike 0.7630, 1.5 notional
Price: Cost neutral (indicative prices).
PnL at maturityRationale
Strategy
Sell 3M EUR/GBP put option at strike 0.7220
Buy 3M EUR/GBP put option at strike 0.7465
Indicative prices (spot ref. 0.7465)
According to our models:
We recommend positioning for a lower EUR/GBP by entering a bearish 3M
EUR/GBP 1:1:1.5 seagull
● EUR/GBP spot is expensive
● 3M implied volatility is close-to-expensive
● EUR/GBP option skews are neutral across tenors
-8.00
-6.00
-4.00
-2.00
0.00
2.00
4.00
6.00
8.00
0.70 0.71 0.72 0.73 0.73 0.74 0.75 0.76 0.77 0.78 0.79
PnL, %
EUR/GBP at Maturity
1:1:1.5 Bearish Seagull Spot Outright
Indicative prices (spot ref.10000)
Rationale PnL at maturity
We recommend utilising the cheap levels in NOK/SEK spot and option
skew by entering a 6M bullish risk reversal
Price: Cost neutral (indicative prices).
According to our models:
● NOK/SEK spot is cheap
Strategy
Buy 6M NOK/SEK call option at strike 1.0180
● NOK/SEK risk reversals for tenors beyond 3M are cheap
Sell 6M NOK/SEK put option at strike 0.9800
● Implied volatility is marginally expensive for longer tenors
-8.0
-6.0
-4.0
-2.0
0.0
2.0
4.0
6.0
8.0
0.94 0.96 0.98 1.00 1.02 1.04 1.06
PnL, %
NOK/SEK at Maturity
Risk Reversal Spot Outright
Source: Danske Bank Markets
Source: Danske Bank Markets
Option trades
Spot summary
Volatility summary
Skew summary
Carry summary
Appendix
Spot
Volatility
Skew
Butterfly
Correlation

3 www.danskebank.com/CI 3
Danske Bank FX Quant Strategy
Spot summary
14 October 2015
Directional signals based on model outputs
Note: ’Overall Valuation’ is based on a weighted average of model outputs
Source: Bloomberg, Danske Bank Markets
Spot ref. Overall valuation
Stdev. RSI 3M exp. % chg
EUR/NOK 9.25 Neutral 1.2 ● Overbought 47 ● 9.40 1.7%
EUR/SEK 9.26 Neutral -0.4 ● 39 ● 9.40 1.5%
USD/NOK 8.11 Very Cheap -1.3 ● Oversold 40 ● 8.55 5.5%
USD/SEK 8.12 Cheap -0.9 ● 30 ● 8.55 5.3%
NOK/SEK 1.00 Neutral -1.1 ● Oversold 46 ● 1.00 -0.2%
EUR/USD 1.14 Neutral 0.4 ● 63 ● 1.10 -3.6%
EUR/GBP 0.75 Neutral 1.3 ● Overbought 61 ● 0.72 -3.4%
EUR/JPY 136.57 Neutral 0.8 ● 57 ● 136.40 -0.1%
EUR/CHF 1.09 Neutral 1.1 ● Overbought 51 ● 1.07 -1.9%
GBP/USD 1.53 Neutral -0.8 ● 50 ● 1.53 -0.1%
USD/JPY 119.66 Neutral 0.2 ● 42 ● 124.00 3.7%
AUD/USD 0.73 Neutral -0.1 ● 59 ● 0.69 -5.1%
NZD/USD 0.67 Neutral 1.2 ● Overbought 69 ● 0.62 -8.0%
USD/CAD 1.30 Neutral 1.3 ● Overbought 37 ● 1.35 3.9%
AUD/NZD 1.08 Cheap -1.4 ● Oversold 33 ● Oversold 1.11 3.2%
EUR/HUF 311.1 Neutral 0.3 ● 45 ● 310.00 -0.4%
EUR/CZK 27.13 Neutral -0.9 ● 50 ● 27.10 -0.1%
EUR/PLN 4.23 Neutral 1.3 ● Overbought 55 ● 4.25 0.4%
EUR/RUB 71.9 Neutral 0.5 ● 47 ● 81.40 13.1%
EUR/TRY 3.36 Very Expensive 2.7 ● Very overbought 52 ● 3.48 3.5%
USD/CHF 0.96 Neutral -0.7 ● 39 ● 0.97 1.7%
USD/RUB 63.0 Cheap -1.1 ● Oversold 42 ● 74.00 17.3%
TechnicalShort-term Financial
ModelsCurrency pairs Forecast
Co
mm
od
ity
EM
Signal Signal
Sc
an
die
sM
ajo
rs
Ot
he
r
Cheap Neutral Expensive
For more details click on: STFM, Technical . or FX Forecast Update
Option trades
Spot summary
Volatility summary
Skew summary
Carry summary
Appendix
Spot
Volatility
Skew
Butterfly
Correlation

4 www.danskebank.com/CI 4
Danske Bank FX Quant Strategy
Volatility summary
14 October 2015
Note: ’Overall Valuation’ is based on a weighted average of model outputs
Source: Bloomberg, Danske Bank Markets
For more details click on: Volatility Appendix
Volatility valuation based on model outputs
Cheap Neutral Expensive
Option trades
Spot summary
Volatility summary
Skew summary
Carry summary
Appendix
Spot
Volatility
Skew
Butterfly
Correlation
Overall
valuation
Implied vol.
1W chg.
Realised vol.
Overall
valuation
Implied vol.
1W chg.
Realised vol.
Overall
valuation
Implied vol.
1W chg.
Realised vol.
Overall
valuation
Implied vol.
1W chg.
Realised vol.
EUR/NOK Neutral 9.3% 10.1% Neutral 9.6% 11.7% Neutral 9.3% 11.7% Neutral 9.4% 12.7%
EUR/SEK Neutral 6.9% 7.2% Neutral 6.7% 7.3% Neutral 6.7% 7.8% Neutral 7.1% 8.7%
USD/NOK Neutral 10.7% 11.2% Neutral 11.4% 13.6% Neutral 11.3% 13.5% Neutral 11.6% 16.1%
USD/SEK Neutral 9.9% 10.9% Neutral 9.8% 11.1% Neutral 10.0% 12.1% Neutral 10.5% 13.2%
NOK/SEK Neutral 9.1% 10.4% Neutral 9.4% 12.0% Neutral 9.1% 11.8% Neutral 9.0% 12.7%
EUR/USD Neutral 9.1% 9.8% Neutral 9.3% 10.1% Neutral 9.4% 10.9% Neutral 9.5% 11.6%
EUR/GBP Neutral 9.5% 9.6% Neutral 9.2% 9.8% Neutral 8.7% 10.2% Neutral 8.9% 9.6%
EUR/JPY Neutral 9.1% 7.7% Neutral 9.4% 8.4% Neutral 9.4% 9.3% Neutral 10.2% 11.4%
EUR/CHF Neutral 6.3% 5.7% Neutral 6.4% 6.6% Neutral 6.7% 7.5% Neutral 7.7% 19.0%
GBP/USD Neutral 6.8% 7.4% Neutral 7.0% 7.4% Neutral 7.1% 7.4% Neutral 8.1% 8.2%
USD/JPY Neutral 7.6% 7.5% Neutral 8.8% 7.9% Neutral 9.0% 9.7% Neutral 9.6% 9.5%
AUD/USD Neutral 12.0% 11.5% Neutral 12.2% 12.6% Neutral 11.8% 13.3% Neutral 11.8% 12.9%
NZD/USD Neutral 13.2% 13.0% Neutral 14.1% 14.3% Neutral 13.0% 15.1% Neutral 12.7% 14.1%
USD/CAD Neutral 9.4% 8.9% Neutral 9.2% 8.7% Neutral 8.7% 9.7% Neutral 8.7% 9.6%
AUD/NZD Neutral 9.2% 9.0% Neutral 10.0% 9.3% Neutral 9.1% 10.0% Expensive 8.7% 9.5%
EUR/HUF Neutral 6.6% 6.0% Neutral 6.6% 6.8% Neutral 7.0% 7.4% Neutral 8.1% 8.1%
EUR/CZK Neutral 4.7% 2.1% Neutral 4.7% 2.9% Neutral 4.6% 2.5% Neutral 5.0% 4.5%
EUR/PLN Neutral 6.5% 4.9% Neutral 6.6% 5.6% Neutral 6.9% 6.7% Neutral 7.4% 7.3%
EUR/TRY Neutral 14.6% 17.3% Neutral 16.0% 17.3% Neutral 14.8% 17.3% Neutral 15.0% 14.8%
EUR/RUB Neutral 23.4% 31.1% Neutral 23.0% 28.1% Neutral 22.7% 33.9% Neutral 22.8% 44.2%
USD/CHF Neutral 8.9% 10.7% Neutral 9.1% 11.1% Neutral 9.5% 10.8% Neutral 10.1% 20.4%
USD/RUB Neutral 21.5% 29.4% Neutral 22.0% 26.2% Neutral 21.8% 32.1% Neutral 22.5% 43.5%
EM
Currency pairs
Sc
an
die
sO
th
er
1M 3MM
ajo
rs
Co
mm
od
ity
2W 12M

5 www.danskebank.com/CI 5
Danske Bank FX Quant Strategy
Skew summary
14 October 2015
Note: The Z-Score is calculated on volatility adjusted 25-delta risk reversals across tenors
’Overall Valuation’ is based on a weighted average of model outputs
Source: Bloomberg, Danske Bank Markets
Skew valuation based on model outputs
Overall
valuationZ-Score
RR
absolute
1W
chg
Overall
valuationZ-Score
RR
absolute
1W
chg
Overall
valuationZ-Score
RR
absolute
1W
chg
Overall
valuationZ-Score
RR
absolute
1W
chg
EUR/NOK Neutral 0.6 0.9 Neutral 0.8 1.1 Neutral 0.9 1.3 Expensive 1.1 1.6
EUR/SEK Neutral -0.1 0.5 Neutral 0.2 0.6 Neutral -0.2 0.6 Neutral -0.1 0.8
USD/NOK Neutral -1.0 0.4 Cheap -1.1 0.6 Neutral -0.3 1.4 Neutral 0.5 2.1
USD/SEK Cheap -1.4 0.2 Cheap -1.6 0.3 Neutral -0.6 1.1 Neutral 0.4 1.9
NOK/SEK Neutral 0.3 0.0 Neutral -0.5 -0.3 Neutral -0.9 -0.4 Cheap -1.3 -0.7
EUR/USD Expensive 1.5 -0.1 Expensive 1.3 -0.4 Neutral 0.7 -1.1 Neutral -0.3 -1.9
EUR/GBP Neutral 0.6 0.0 Neutral 0.6 0.0 Neutral 0.2 -0.3 Neutral -0.2 -0.7
EUR/JPY Neutral 0.5 -0.6 Neutral 0.7 -0.7 Neutral 0.8 -1.0 Neutral 0.9 -1.7
EUR/CHF Neutral -0.4 -0.2 Neutral -0.3 -0.4 Neutral -0.4 -1.0 Neutral -0.2 -2.3
GBP/USD Expensive 1.3 -0.1 Expensive 1.2 -0.2 Expensive 1.6 -0.3 Expensive 1.4 -0.8
USD/JPY Neutral -0.5 -0.3 Neutral -0.3 -0.3 Neutral -0.1 -0.3 Neutral 0.2 -0.2
AUD/USD Neutral 0.9 -0.9 Expensive 1.1 -1.2 Expensive 1.4 -1.7 Expensive 1.2 -2.7
NZD/USD Neutral 0.5 -0.9 Neutral 0.9 -1.2 Expensive 1.2 -1.7 Expensive 1.0 -2.7
USD/CAD Very Cheap -2.2 0.0 Cheap -2.0 0.2 Cheap -1.6 0.7 Neutral -0.9 1.3
AUD/NZD Neutral 1.0 0.0 Neutral 0.9 0.0 Expensive 1.0 0.0 Expensive 1.2 0.0
EUR/HUF Neutral -1.0 0.6 Cheap -1.3 0.8 Cheap -1.8 1.2 Cheap -1.8 2.2
EUR/CZK Very Cheap -3.4 -0.8 Very Cheap -3.1 -0.9 Very Cheap -3.6 -1.0 Very Cheap -5.1 -1.3
EUR/PLN Neutral -0.4 0.7 Neutral -0.8 0.8 Cheap -1.5 1.1 Cheap -1.1 2.0
EUR/RUB Neutral -0.2 2.1 Neutral -0.4 2.8 Neutral -0.1 4.9 Neutral 0.3 8.4
EUR/TRY Neutral 0.0 1.3 Neutral 0.0 2.2 Neutral 0.1 3.4 Neutral 0.4 5.2
USD/CHF Cheap -1.2 -0.2 Cheap -1.2 -0.2 Cheap -1.2 -0.2 Neutral -1.0 -0.2
USD/RUB Neutral -0.5 2.6 Neutral -0.5 3.4 Neutral -0.3 5.4 Neutral 0.3 8.9
12MS
ca
nd
ies
Ma
jor
s
Currency pairs
2W 3MC
om
mo
dit
yE
MO
th
er
1M
Cheap Neutral Expensive
For more details click on: Skew Appendix
Option trades
Spot summary
Volatility summary
Skew summary
Carry summary
Appendix
Spot
Volatility
Skew
Butterfly
Correlation

6 www.danskebank.com/CI 6
Danske Bank FX Quant Strategy
Carry summary
14 October 2015
Carry valuation based on model outputs
Cheap Neutral Expensive
Note: ’Carry-to-risk’ is based on annualised carry relative to implied volatility (at-the-money)
Source: Bloomberg, Danske Bank Markets
Carry-to-risk Ann. Carry Carry-to-risk Ann. Carry Carry-to-risk Ann. Carry Carry-to-risk Ann. Carry
EUR/NOK -0.11 -1.1% -0.12 -1.2% -0.13 -1.3% -0.11 -1.1%
EUR/SEK 0.04 0.3% 0.04 0.3% 0.04 0.3% 0.03 0.2%
USD/NOK -0.06 -0.6% -0.06 -0.6% -0.05 -0.6% -0.02 -0.3%
USD/SEK 0.08 0.8% 0.08 0.8% 0.09 0.9% 0.10 1.0%
NOK/SEK 0.15 1.4% 0.16 1.5% 0.17 1.5% 0.14 1.3%
EUR/USD -0.05 -0.5% -0.06 -0.5% -0.07 -0.6% -0.08 -0.8%
EUR/GBP -0.07 -0.7% -0.08 -0.7% -0.09 -0.8% -0.11 -0.9%
EUR/JPY 0.00 0.0% 0.00 0.0% 0.00 0.0% 0.00 0.0%
EUR/CHF 0.10 0.6% 0.10 0.6% 0.11 0.7% 0.10 0.7%
GBP/USD 0.03 0.2% 0.03 0.2% 0.03 0.2% 0.02 0.1%
USD/JPY 0.04 0.3% 0.04 0.4% 0.08 0.7% 0.09 0.9%
AUD/USD 0.16 1.9% 0.16 2.0% 0.17 2.0% 0.14 1.6%
NZD/USD 0.20 2.7% 0.19 2.7% 0.21 2.7% 0.19 2.4%
USD/CAD -0.02 -0.2% -0.02 -0.2% -0.02 -0.2% -0.01 -0.1%
AUD/NZD -0.08 -0.7% -0.08 -0.8% -0.08 -0.8% -0.09 -0.8%
EUR/HUF -0.22 -1.5% -0.19 -1.2% -0.12 -0.8% -0.11 -0.9%
EUR/CZK 0.01 0.1% 0.02 0.1% 0.10 0.5% 0.12 0.6%
EUR/PLN -0.28 -1.8% -0.27 -1.8% -0.25 -1.7% -0.22 -1.7%
EUR/RUB -0.49 -11.5% -0.52 -12.1% -0.52 -11.8% -0.52 -11.9%
EUR/TRY -0.83 -12.0% -0.72 -11.5% -0.78 -11.6% -0.79 -11.8%
USD/CHF 0.12 1.1% 0.13 1.2% 0.14 1.4% 0.15 1.5%
USD/RUB -0.51 -10.9% -0.52 -11.5% -0.51 -11.1% -0.49 -11.0%
1M 3M 12M
Ot
he
rC
om
mo
dit
yE
M
2W
Currency pairs
Sc
an
die
sM
ajo
rs
Option trades
Spot summary
Volatility summary
Skew summary
Carry summary
Appendix
Spot
Volatility
Skew
Butterfly
Correlation
7 www.danskebank.com/CI 7
Danske Bank FX Quant Strategy
Appendix
14 October 2015
Option trades
Spot summary
Volatility summary
Skew summary
Carry summary
Appendix
Spot
Volatility
Skew
Butterfly
Correlation

8 www.danskebank.com/CI 8
Danske Bank FX Quant Strategy
Spot overview (1/3)
14 October 2015
Short-term financial models (STFM) – Overview
Spot Model Signal Deviation (%) Deviation (stdev) Model Strength
EUR/NOK 9.255 9.1040 Overbought 1.7% 1.2 0.4
EUR/SEK 9.263 9.2991 -0.4% -0.4 0.4
USD/NOK 8.110 8.2190 Oversold -1.3% -1.3 0.8
USD/SEK 8.117 8.2329 -1.4% -0.9 0.3
NOK/SEK 1.001 1.0178 Oversold -1.7% -1.1 0.3
EUR/USD 1.141 1.1382 0.3% 0.4 0.2
EUR/GBP 0.745 0.7325 Overbought 1.7% 1.3 0.3
EUR/JPY 136.570 134.1619 1.8% 0.8 -0.2
EUR/CHF 1.092 1.0587 Overbought 3.1% 1.1 0.0
GBP/USD 1.532 1.5509 -1.2% -0.8 -0.1
USD/JPY 119.660 119.3254 0.3% 0.2 0.0
AUD/USD 0.727 0.7300 -0.4% -0.1 0.1
NZD/USD 0.674 0.6539 Overbought 3.1% 1.2 0.1
USD/CAD 1.299 1.2769 Overbought 1.7% 1.3 0.3
AUD/NZD 1.079 1.1066 Oversold -2.5% -1.4 0.0
EUR/HUF 311.110 310.4817 0.2% 0.3 0.0
EUR/CZK 27.126 27.4268 -1.1% -0.9 -0.2
EUR/PLN 4.234 4.1656 Overbought 1.6% 1.3 -0.4
EUR/RUB 71.926 70.4702 2.1% 0.5 -0.5
EUR/TRY 3.358 3.1186 Very Overbought 7.7% 2.7 0.0
USD/CHF 0.957 0.9730 -1.7% -0.7 -0.1
USD/RUB 63.034 65.1916 Oversold -3.3% -1.1 -0.1
Sc
an
die
sM
ajo
rs
Co
mm
od
it
yE
MO
th
er
Cheap Neutral Expensive
Note: Linear regression models using a 200-day rolling estimation window. 2Y swap spread is
included only when spot beta is positive. Short-term financial models are partial models,
implying that there is no built-in consistency between, e.g., EUR/NOK, EUR/SEK
and NOK/SEK models
Source: Bloomberg, Danske Bank Markets calculations
Option trades
Spot summary
Volatility summary
Skew summary
Carry summary
Appendix
Spot
Volatility
Skew
Butterfly
Correlation

9 www.danskebank.com/CI 9
Danske Bank FX Quant Strategy
Spot overview (2/3)
14 October 2015
Short-term financial models (STFM) – Overview
1st
biggest misalignment:
2nd
biggest misalignment:
3rd
biggest misalignment:
AUD/USD(Model estimate:0.730) NOK/SEK(Model estimate:1.018) AUD/NZD(Model estimate:1.107)
-3.0
-2.0
-1.0
0.0
1.0
2.0
3.0
4.0
AUD/USD NOK/SEK AUD/NZD NZD/USD USD/HUF EUR/CHF EUR/CAD EUR/NOK EUR/AUD USD/CAD
Dev
iati
on
(std
ev)
Today 1W ago 2W ago . Spot above model
Spot below model
Top 5 Oversold signals
Top 5 Overbought signals
Source: Bloomberg, Danske Bank Markets
Source: Bloomberg, Danske Bank Markets Source: Bloomberg, Danske Bank Markets Source: Bloomberg, Danske Bank Markets
Option trades
Spot summary
Volatility summary
Skew summary
Carry summary
Appendix
Spot
Volatility
Skew
Butterfly
Correlation

10 www.danskebank.com/CI 10
Danske Bank FX Quant Strategy
Spot overview (3/3)
14 October 2015
Technical spot overview
Note: Trend direction and strength computed using ‘DMI’ analysis (range-trade defined as ADX line <25), trend support/resistance computed using ‘Trender’
algorithm, Bollinger bands computed on 30-period window, RSI computed on 14-period window (oversold defined as <30, overbought defined as >70)
Source: Bloomberg, Danske Bank Markets
Spot 1M change Bollinger-bands 20-DMA 50-DMA 1M Low-High ADX RSI
Direction Strength Sup./Res. -/+ 2 std dev
EUR/NOK 9.2459 -0.2% 9.0528 / 9.5552 9.3385 9.2749 9.1517 / 9.6281 19.5 46.6
EUR/SEK 9.2620 -0.8% 9.2411 / 9.4842 9.3529 9.4280 9.2343 / 9.5304 15.7 38.5
USD/NOK 8.1033 -1.0% 7.9990 / 8.5447 8.2955 8.2662 8.0464 / 8.6017 19.7 40.3
USD/SEK 8.1176 -1.6% 8.2868 8.3082 8.4038 8.0958 / 8.4947 30.5 29.9
NOK/SEK 1.0018 -0.6% 1.0151 1.0017 1.0168 0.9798 / 1.0217 34.6 46.3
EUR/USD 1.1410 0.8% 1.1093 / 1.1404 1.1258 1.1221 1.1105 / 1.146 23.7 62.7
EUR/GBP 0.7451 1.5% 0.7331 0.7366 0.7284 0.7197 / 0.7493 27.1 61.2
EUR/JPY 136.4900 0.5% 132.8309 / 137.2817135.1275 135.8452 133.16 / 137.45 15.3 57.3
EUR/CHF 1.0911 -0.4% 1.0840 / 1.1005 1.0920 1.0879 1.0824 / 1.0999 18.2 51.1
GBP/USD 1.5314 -0.7% 1.5076 / 1.5544 1.5286 1.5407 1.5108 / 1.5659 16.9 50.3
USD/JPY 119.6200 -0.3% 121.0934 120.0285 121.0822 118.68 / 121.24 34.7 42.2
AUD/USD 0.7267 1.8% 0.7182 0.7129 0.7168 0.6937 / 0.7382 25.4 59.1
NZD/USD 0.6741 6.3% 0.6564 0.6467 0.6465 0.6237 / 0.675 27.2 69.0
USD/CAD 1.2989 -2.1% 1.2938 / 1.3470 1.3186 1.3183 1.2901 / 1.3457 23.2 37.0
AUD/NZD 1.0780 -4.3% 1.0762 / 1.1363 1.1025 1.1089 1.0768 / 1.1348 21.4 33.1
EUR/HUF 311.2300 -0.6% 309.6302 / 315.6658312.1910 312.5176 309.43 / 316 13.8 45.1
EUR/CZK 27.1240 0.3% 27.0447 27.1457 27.0848 27.023 / 27.311 32.4 50.2
EUR/PLN 4.2348 0.6% 4.1905 / 4.2570 4.2281 4.2165 4.1816 / 4.2586 12.5 54.9
EUR/RUB 72.0014 -5.8% 69.6904 / 78.0015 72.8219 73.9543 68.861 / 77.1907 18.2 46.5
EUR/TRY 3.3636 -3.0% 3.2878 / 3.4675 3.3700 3.3120 3.2599 / 3.4762 23.3 52.3
USD/CHF 0.9563 -1.1% 0.9595 / 0.9827 0.9701 0.9697 0.9528 / 0.9844 21.9 39.4
USD/RUB 63.1077 -6.5% 61.5064 / 69.8303 64.6970 65.8247 60.8291 / 69.2088 21.4 41.6Ot
he
rE
M
TrendCurrency pairs
Sc
an
die
sM
ajo
rs
Co
mm
od
ity
Option trades
Spot summary
Volatility summary
Skew summary
Carry summary
Appendix
Spot
Volatility
Skew
Butterfly
Correlation

11 www.danskebank.com/CI 11
Danske Bank FX Quant Strategy
Volatility overview (1/5)
14 October 2015
Straddle histograms
Source: Bloomberg, Danske Bank Markets
Cheap Neutral Expensive
Option trades
Spot summary
Volatility summary
Skew summary
Carry summary
Appendix
Spot
Volatility
Skew
Butterfly
Correlation
2W 1M 3M 1Y
EUR/NOK 24% 22% 19% 29%
EUR/SEK 31% 29% 24% 29%
USD/NOK 46% 41% 39% 40%
USD/SEK 49% 47% 45% 55%
NOK/SEK 29% 26% 26% 28%
EUR/USD 45% 41% 46% 51%
EUR/GBP 28% 27% 27% 33%
EUR/JPY 49% 46% 43% 48%
EUR/CHF 21% 21% 18% 25%
GBP/USD 53% 49% 43% 49%
USD/JPY 54% 45% 39% 52%
AUD/USD 42% 39% 42% 52%
NZD/USD 41% 37% 40% 51%
USD/CAD 34% 30% 34% 44%
AUD/NZD 33% 28% 34% 29%
EUR/HUF 43% 41% 40% 30%
EUR/CZK 42% 44% 45% 54%
EUR/PLN 48% 53% 49% 57%
EUR/TRY 33% 33% 42% 50%
EUR/RUB 10% 9% 14% 21%
USD/CHF 50% 45% 45% 32%
USD/RUB 10% 10% 14% 38%
Straddle price compared to historical distribution of changes in spot pricesProfit probability (long straddle position)
Co
mm
od
ity
1M: EURRUB (Most expensive) 1M: EURPLN (Cheapest)Currency pairs
Sc
an
die
sM
ajo
rs
Profit probabilites are calculated as the frequency of changes in spot prices in each currency pair (since 2000) large enough to generate profit on a long (delta neutral) straddle position.
Oth
er
EM
3M: EURRUB (Most expensive) 3M: EURPLN (Cheapest)
1Y: EURRUB (Most expensive) 1Y: EURPLN (Cheapest)
0%
5%
10%
15%
20%
23%15%7%-1%-9%-17%Percentage change in spot
0%
5%
10%
15%
20%
13%9%5%1%-3%-7%-11%Percentage change in spot
Break even
at --3.95%
Break even at
+6.41% Break even
at --1.31%
Break even
at +1.65%
0%
5%
10%
15%
40%27%14%1%-12%-25%-38%Percentage change in spot
0%
5%
10%
15%
22%15%8%1%-6%-13%-20%Percentage change in spot
Break even
at --5.47%
Break even
at +12.71%
Break even
at --2.27%
Break even
at +3.28%
0%
5%
10%
40%27%14%1%-12%-25%-38%Percentage change in spot
Break even
at --3.50%
Break even
at +33.30%
0%
5%
10%
27%18%9%0%-9%-18%-27%Percentage change in spot
Break even
at --3.97%Break even
at +7.89%

12 www.danskebank.com/CI 12
Danske Bank FX Quant Strategy
Volatility overview (2/5)
14 October 2015
Range Trade Monitor
Cheap Neutral Expensive
Note: Ratio is based on actual range relative to the delta-neutral straddle price. ADX indicates the
trend strengths of the specific currency pairs.
Source: Bloomberg, Danske Bank Markets
Option trades
Spot summary
Volatility summary
Skew summary
Carry summary
Appendix
Spot
Volatility
Skew
Butterfly
Correlation
Top 3 expensive Top 3 expensive Top 3 expensive
1 EUR/CHF 84 pips 108 pips 0.8 18.2 1 EUR/CZK 2880 pips 2846 pips 1.0 32.4 1 EUR/CZK 3260 pips 5067 pips 0.6 32.4
2 EUR/CZK 1600 pips 2011 pips 0.8 32.4 2 USD/JPY 256 pips 237 pips 1.1 34.7 2 EUR/HUF 103000 pips 87306 pips 1.2 13.8
3 EUR/PLN 492 pips 428 pips 1.1 12.5 3 EUR/CHF 189 pips 158 pips 1.2 18.2 3 EUR/JPY 677 pips 517 pips 1.3 15.3
Top 3 cheapest Top 3 cheapest Top 3 cheapest
1 USD/NOK 4990 pips 1349 pips 3.7 19.7 1 USD/NOK 5553 pips 2077 pips 2.7 19.7 1 EUR/RUB 221071 pips 65356 pips 3.4 18.2
2 USD/CAD 552 pips 184 pips 3.0 23.2 2 NZD/USD 513 pips 213 pips 2.4 27.2 2 EUR/TRY 6076 pips 2015 pips 3.0 23.3
3 EUR/NOK 4002 pips 1347 pips 3.0 19.5 3 AUD/NZD 580 pips 242 pips 2.4 21.4 3 NOK/SEK 856 pips 364 pips 2.3 34.6
1 month strategies
Delta-neutral
straddle
Ratio* ADX**# FX Actual range FX Actual range Delta-neutral
straddle
Ratio* ADX**#
3 month strategies2 week strategies
# FX Actual range Delta-neutral
straddle
Ratio* ADX**
EUR/CHF
USD/NOK
EUR/CZK
USD/NOK
EUR/CZK
EUR/RUB
1.08
1.09
1.10
1.11
16/09 26/09 06/10 16/10 26/10
7.90
8.00
8.10
8.20
8.30
8.40
8.50
8.60
8.70
16/09 26/09 06/10 16/10 26/10
26.80
26.90
27.00
27.10
27.20
27.30
27.40
27.50
19/08 02/09 16/09 30/09 14/10 28/10 11/11
7.80
7.90
8.00
8.10
8.20
8.30
8.40
8.50
8.60
8.70
19/08 02/09 16/09 30/09 14/10 28/10 11/11
26.50
26.75
27.00
27.25
27.50
27.75
28.00
04/02 04/04 04/06 04/08 04/10
50.00
55.00
60.00
65.00
70.00
75.00
80.00
85.00
04/02 04/04 04/06 04/08 04/10

13 www.danskebank.com/CI 13
Danske Bank FX Quant Strategy
Volatility overview (3/5)
14 October 2015
Term-structure overview
Note: Term structure is based on implied volatility (at-the-money)
Source: Bloomberg, Danske Bank Markets
2.5%5.0%7.5%
10.0%12.5%15.0%17.5%20.0%22.5%25.0%27.5%
1W 1M 3M 6M 12M
EUR/NOK
1Y interval Now Average Last week
2.5%
5.0%
7.5%
10.0%
12.5%
15.0%
17.5%
1W 1M 3M 6M 12M
EUR/SEK
1Y interval Now Average Last week
2.5%5.0%7.5%
10.0%12.5%15.0%17.5%20.0%22.5%25.0%
1W 1M 3M 6M 12M
USD/NOK
1Y interval Now Average Last week
5.0%
7.5%
10.0%
12.5%
15.0%
17.5%
20.0%
22.5%
1W 1M 3M 6M 12M
USD/SEK
1Y interval Now Average Last week
2.5%5.0%7.5%
10.0%12.5%15.0%17.5%20.0%22.5%25.0%
1W 1M 3M 6M 12M
NOK/SEK
1Y interval Now Average Last week
0.0%
5.0%
10.0%
15.0%
20.0%
1W 1M 3M 6M 12M
EUR/USD
1Y interval Now Average Last week
2.5%
5.0%
7.5%
10.0%
12.5%
15.0%
17.5%
1W 1M 3M 6M 12M
EUR/GBP
1Y interval Now Average Last week
2.5%
5.0%
7.5%
10.0%
12.5%
15.0%
17.5%
20.0%
1W 1M 3M 6M 12M
EUR/JPY
1Y interval Now Average Last week
0.0%
5.0%
10.0%
15.0%
20.0%
25.0%
30.0%
35.0%
40.0%
1W 1M 3M 6M 12M
EUR/CHF
1Y interval Now Average Last week
Option trades
Spot summary
Volatility summary
Skew summary
Carry summary
Appendix
Spot
Volatility
Skew
Butterfly
Correlation

14 www.danskebank.com/CI 14
Danske Bank FX Quant Strategy
Volatility overview (4/5)
14 October 2015
Term-structure overview
Note: Term structure is based on implied volatility (at-the-money)
Source: Bloomberg, Danske Bank Markets
2.5%
5.0%
7.5%
10.0%
12.5%
15.0%
17.5%
1W 1M 3M 6M 12M
GBP/USD
1Y interval Now Average Last week
2.5%
5.0%
7.5%
10.0%
12.5%
15.0%
17.5%
1W 1M 3M 6M 12M
USD/JPY
1Y interval Now Average Last week
2.5%
5.0%
7.5%
10.0%
12.5%
15.0%17.5%
20.0%
22.5%
1W 1M 3M 6M 12M
AUD/USD
1Y interval Now Average Last week
2.5%
5.0%
7.5%
10.0%
12.5%
15.0%
1W 1M 3M 6M 12M
USD/CAD
1Y interval Now Average Last week
5.0%
7.5%
10.0%
12.5%
15.0%
17.5%
20.0%
1W 1M 3M 6M 12M
NZD/USD
1Y interval Now Average Last week
2.5%
5.0%
7.5%
10.0%
12.5%
15.0%
1W 1M 3M 6M 12M
AUD/NZD
1Y interval Now Average Last week
0.0%
5.0%
10.0%
15.0%
1W 1M 3M 6M 12M
EUR/HUF
1Y interval Now Average Last week
0.0%
2.5%
5.0%
7.5%
10.0%
1W 1M 3M 6M 12M
EUR/CZK
1Y interval Now Average Last week
2.5%
5.0%
7.5%
10.0%
12.5%
1W 1M 3M 6M 12M
EUR/PLN
1Y interval Now Average Last week
Option trades
Spot summary
Volatility summary
Skew summary
Carry summary
Appendix
Spot
Volatility
Skew
Butterfly
Correlation

15 www.danskebank.com/CI 15
Danske Bank FX Quant Strategy
Volatility overview (5/5)
14 October 2015
Term-structure overview
5.0%15.0%25.0%35.0%45.0%55.0%65.0%75.0%85.0%95.0%
1W 1M 3M 6M 12M
EUR/RUB
1Y interval Now Average Last week
5.0%
7.5%
10.0%
12.5%
15.0%
17.5%
20.0%
1W 1M 3M 6M 12M
EUR/TRY
1Y interval Now Average Last week
2.5%
7.5%
12.5%
17.5%
22.5%
27.5%
32.5%
37.5%
1W 1M 3M 6M 12M
USD/CHF
1Y interval Now Average Last week
5.0%15.0%25.0%35.0%45.0%55.0%65.0%75.0%85.0%
1W 1M 3M 6M 12M
USD/RUB
1Y interval Now Average Last week
0.0%
10.0%
20.0%
1W 1M 3M 6M 12M
EUR/AUD
1Y interval Now Average Last week
5.0%
10.0%
15.0%
20.0%
1W 1M 3M 6M 12M
EUR/NZD
1Y interval Now Average Last week
0.0%
5.0%
10.0%
15.0%
20.0%
1W 1M 3M 6M 12M
EUR/CAD
1Y interval Now Average Last week
0.0%
10.0%
20.0%
30.0%
1W 1M 3M 6M 12M
USD/HUF
1Y interval Now Average Last week
0.0%
10.0%
20.0%
1W 1M 3M 6M 12M
USD/CZK
1Y interval Now Average Last week
Note: Term structure is based on implied volatility (at-the-money)
Source: Bloomberg, Danske Bank Markets
Option trades
Spot summary
Volatility summary
Skew summary
Carry summary
Appendix
Spot
Volatility
Skew
Butterfly
Correlation

16 www.danskebank.com/CI 16
Danske Bank FX Quant Strategy
Skew overview (1/4)
25-delta risk reversal (percentile, volatility adjusted) by currency pair and across currency pairs
14 October 2015
Cheap Neutral Expensive
Source: Bloomberg, Danske Bank Markets
EURNOK
EURSEK
USDNOK
USDSEK
NOKSEK
EURUSD
EURGBP
EURJPY
EURCHF
GBPUSDUSDJPY
AUDUSD
NZDUSD
USDCAD
AUDNZD
EURHUF
EURCZK
EURPLN
EURRUB
EURTRY
USDCHF
USDRUB
EURAUD
EURNZD
EURCAD
USDCZK
0
10
20
30
40
50
60
70
80
90
100
0 10 20 30 40 50 60 70 80 90 100
Percentile across
currencies, 5Y history
Percentile for single cross, 5Y history
Volatility Adjusted 3M 25-Delta Risk Reversal, percentile overview
Cheap Expensive
Exp
ensi
veC
hea
p
Absolute RR zero-percentile
Option trades
Spot summary
Volatility summary
Skew summary
Carry summary
Appendix
Spot
Volatility
Skew
Butterfly
Correlation

17 www.danskebank.com/CI 17
Danske Bank FX Quant Strategy
Skew overview (2/4)
25-delta risk reversals (Z-scores, volatility adjusted) by currency pairs and tenors
14 October 2015
2W 1M 3M 6M 12Y 2W 1M 3M 6M 12Y 2W 1M 3M 6M 12Y
0.6 0.8 0.9 0.9 1.1 -0.1 0.2 -0.2 -0.1 -0.1 -1.0 -1.1 -0.3 0.3 0.5
2W 1M 3M 6M 12Y 2W 1M 3M 6M 12Y 2W 1M 3M 6M 12Y
-1.4 -1.6 -0.6 0.2 0.4 0.3 -0.5 -0.9 -1.0 -1.3 1.5 1.3 0.7 -0.1 -0.3
2W 1M 3M 6M 12Y 2W 1M 3M 6M 12Y 2W 1M 3M 6M 12Y
0.6 0.6 0.2 0.0 -0.2 0.5 0.7 0.8 0.8 0.9 -0.4 -0.3 -0.4 -0.3 -0.2
NOK/SEK EUR/USD
1M Risk Reversal History
EUR/NOK EUR/SEK USD/NOK
EUR/GBP EUR/JPY EUR/CHF
Vol Adjust. Z-Score
Vol Adjust. Z-Score
1M Risk Reversal History
1M Risk Reversal History
USD/SEK
Vol Adjust. Z-Score
-0.5
0
0.5
1
1.5
2
2.5
3
3.5
Oct
-14
Nov
-14
Dec
-14
Jan
-15
Feb
-15
Mar
-15
Ap
r-1
5
May
-15
Jun
-15
Jul-1
5
Au
g-1
5
Sep
-15
Oct
-15
3M Abs. RR 5Y Mean +/-2 Stdev
0.00
0.50
1.00
1.50
2.00
Oct
-14
Nov
-14
Dec
-14
Jan
-15
Feb
-15
Mar
-15
Ap
r-1
5
May
-15
Jun
-15
Jul-1
5
Au
g-1
5
Sep
-15
Oct
-15
3M Abs. RR 5Y Mean +/-2 Stdev
-0.500.000.501.001.502.002.503.003.504.00
Oct
-14
Nov
-14
Dec
-14
Jan
-15
Feb
-15
Mar
-15
Ap
r-1
5
May
-15
Jun
-15
Jul-1
5
Au
g-1
5
Sep
-15
Oct
-15
3M Abs. RR 5Y Mean +/-2 Stdev
0.00
0.50
1.00
1.50
2.00
2.50
3.00
3.50
Oct
-14
Nov
-14
Dec
-14
Jan
-15
Feb
-15
Mar
-15
Ap
r-1
5
May
-15
Jun
-15
Jul-1
5
Au
g-1
5
Sep
-15
Oct
-15
3M Abs. RR 5Y Mean +/-2 Stdev
-2.50
-2.00
-1.50
-1.00
-0.50
0.00
0.50
1.00
Oct
-14
Nov
-14
Dec
-14
Jan
-15
Feb
-15
Mar
-15
Ap
r-1
5
May
-15
Jun
-15
Jul-1
5
Au
g-1
5
Sep
-15
Oct
-15
3M Abs. RR 5Y Mean +/-2 Stdev
-4.00-3.50-3.00-2.50-2.00-1.50-1.00-0.500.000.50
Oct
-14
Nov
-14
Dec
-14
Jan
-15
Feb
-15
Mar
-15
Ap
r-1
5
May
-15
Jun
-15
Jul-1
5
Au
g-1
5
Sep
-15
Oct
-15
3M Abs. RR 5Y Mean +/-2 Stdev
-2.00
-1.50
-1.00
-0.50
0.00
0.50
1.00
Oct
-14
Nov
-14
Dec
-14
Jan
-15
Feb
-15
Mar
-15
Ap
r-1
5
May
-15
Jun
-15
Jul-1
5
Au
g-1
5
Sep
-15
Oct
-15
3M Abs. RR 5Y Mean +/-2 Stdev
-6.00
-5.00
-4.00
-3.00
-2.00
-1.00
0.00
1.00
Oct
-14
Nov
-14
Dec
-14
Jan
-15
Feb
-15
Mar
-15
Ap
r-1
5
May
-15
Jun
-15
Jul-1
5
Au
g-1
5
Sep
-15
Oct
-15
3M Abs. RR 5Y Mean +/-2 Stdev
-6.00
-4.00
-2.00
0.00
2.00
4.00
Oct
-14
Nov
-14
Dec
-14
Jan
-15
Feb
-15
Mar
-15
Ap
r-1
5
May
-15
Jun
-15
Jul-1
5
Au
g-1
5
Sep
-15
Oct
-15
3M Abs. RR 5Y Mean +/-2 Stdev
-3.50
-3.00
-2.50
-2.00
-1.50
-1.00
-0.50
0.00
0.50
Oct
-14
Nov
-14
Dec
-14
Jan
-15
Feb
-15
Mar
-15
Ap
r-1
5
May
-15
Jun
-15
Jul-1
5
Au
g-1
5
Sep
-15
Oct
-15
3M Abs. RR 5Y Mean +/-2 Stdev
-2.00
-1.50
-1.00
-0.50
0.00
0.50
1.00
1.50
Oct
-14
Nov
-14
Dec
-14
Jan
-15
Feb
-15
Mar
-15
Ap
r-1
5
May
-15
Jun
-15
Jul-1
5
Au
g-1
5
Sep
-15
Oct
-15
3M Abs. RR 5Y Mean +/-2 Stdev
-5.00
-4.00
-3.00
-2.00
-1.00
0.00
Oct
-14
Nov
-14
Dec
-14
Jan
-15
Feb
-15
Mar
-15
Ap
r-1
5
May
-15
Jun
-15
Jul-1
5
Au
g-1
5
Sep
-15
Oct
-15
3M Abs. RR 5Y Mean +/-2 Stdev
-5.00
-4.00
-3.00
-2.00
-1.00
0.00
Oct
-14
Nov
-14
Dec
-14
Jan
-15
Feb
-15
Mar
-15
Ap
r-1
5
May
-15
Jun
-15
Jul-1
5
Au
g-1
5
Sep
-15
Oct
-15
3M Abs. RR 5Y Mean +/-2 Stdev
0.00
0.50
1.00
1.50
2.00
2.50
3.00
Oct
-14
Nov
-14
Dec
-14
Jan
-15
Feb
-15
Mar
-15
Ap
r-1
5
May
-15
Jun
-15
Jul-1
5
Au
g-1
5
Sep
-15
Oct
-15
3M Abs. RR 5Y Mean +/-2 Stdev
-0.80
-0.60
-0.40
-0.20
0.00
0.20
0.40
Oct
-14
Nov
-14
Dec
-14
Jan
-15
Feb
-15
Mar
-15
Ap
r-1
5
May
-15
Jun
-15
Jul-1
5
Au
g-1
5
Sep
-15
Oct
-15
3M Abs. RR 5Y Mean +/-2 Stdev
0.00
1.00
2.00
3.00
4.00
5.00
Oct
-14
Nov
-14
Dec
-14
Jan
-15
Feb
-15
Mar
-15
Ap
r-1
5
May
-15
Jun
-15
Jul-1
5
Au
g-1
5
Sep
-15
Oct
-15
3M Abs. RR 5Y Mean +/-2 Stdev
-2.00
-1.00
0.00
1.00
2.00
3.00
4.00
Oct
-14
Nov
-14
Dec
-14
Jan
-15
Feb
-15
Mar
-15
Ap
r-1
5
May
-15
Jun
-15
Jul-1
5
Au
g-1
5
Sep
-15
Oct
-15
3M Abs. RR 5Y Mean +/-2 Stdev
0.00
1.00
2.00
3.00
4.00
5.00
Oct
-14
Nov
-14
Dec
-14
Jan
-15
Feb
-15
Mar
-15
Ap
r-1
5
May
-15
Jun
-15
Jul-1
5
Au
g-1
5
Sep
-15
Oct
-15
3M Abs. RR 5Y Mean +/-2 Stdev
Cheap Neutral Expensive
Note: The charts illustrate historical movements in the absolute 1M 25-delta risk reversals
Source: Bloomberg, Danske Bank Markets
Option trades
Spot summary
Volatility summary
Skew summary
Carry summary
Appendix
Spot
Volatility
Skew
Butterfly
Correlation

18 www.danskebank.com/CI 18
Danske Bank FX Quant Strategy
Skew overview (3/4)
14 October 2015
-0.5
0
0.5
1
1.5
2
2.5
3
3.5
Oct
-14
Nov
-14
Dec
-14
Jan
-15
Feb
-15
Mar
-15
Ap
r-1
5
May
-15
Jun
-15
Jul-1
5
Au
g-1
5
Sep
-15
Oct
-15
3M Abs. RR 5Y Mean +/-2 Stdev
0.00
0.50
1.00
1.50
2.00
Oct
-14
Nov
-14
Dec
-14
Jan
-15
Feb
-15
Mar
-15
Ap
r-1
5
May
-15
Jun
-15
Jul-1
5
Au
g-1
5
Sep
-15
Oct
-15
3M Abs. RR 5Y Mean +/-2 Stdev
-0.500.000.501.001.502.002.503.003.504.00
Oct
-14
Nov
-14
Dec
-14
Jan
-15
Feb
-15
Mar
-15
Ap
r-1
5
May
-15
Jun
-15
Jul-1
5
Au
g-1
5
Sep
-15
Oct
-15
3M Abs. RR 5Y Mean +/-2 Stdev
0.00
0.50
1.00
1.50
2.00
2.50
3.00
3.50
Oct
-14
Nov
-14
Dec
-14
Jan
-15
Feb
-15
Mar
-15
Ap
r-1
5
May
-15
Jun
-15
Jul-1
5
Au
g-1
5
Sep
-15
Oct
-15
3M Abs. RR 5Y Mean +/-2 Stdev
-2.50
-2.00
-1.50
-1.00
-0.50
0.00
0.50
1.00
Oct
-14
Nov
-14
Dec
-14
Jan
-15
Feb
-15
Mar
-15
Ap
r-1
5
May
-15
Jun
-15
Jul-1
5
Au
g-1
5
Sep
-15
Oct
-15
3M Abs. RR 5Y Mean +/-2 Stdev
-4.00-3.50-3.00-2.50-2.00-1.50-1.00-0.500.000.50
Oct
-14
Nov
-14
Dec
-14
Jan
-15
Feb
-15
Mar
-15
Ap
r-1
5
May
-15
Jun
-15
Jul-1
5
Au
g-1
5
Sep
-15
Oct
-15
3M Abs. RR 5Y Mean +/-2 Stdev
-2.00
-1.50
-1.00
-0.50
0.00
0.50
1.00
Oct
-14
Nov
-14
Dec
-14
Jan
-15
Feb
-15
Mar
-15
Ap
r-1
5
May
-15
Jun
-15
Jul-1
5
Au
g-1
5
Sep
-15
Oct
-15
3M Abs. RR 5Y Mean +/-2 Stdev
-6.00
-5.00
-4.00
-3.00
-2.00
-1.00
0.00
1.00
Oct
-14
Nov
-14
Dec
-14
Jan
-15
Feb
-15
Mar
-15
Ap
r-1
5
May
-15
Jun
-15
Jul-1
5
Au
g-1
5
Sep
-15
Oct
-15
3M Abs. RR 5Y Mean +/-2 Stdev
-6.00
-4.00
-2.00
0.00
2.00
4.00
Oct
-14
Nov
-14
Dec
-14
Jan
-15
Feb
-15
Mar
-15
Ap
r-1
5
May
-15
Jun
-15
Jul-1
5
Au
g-1
5
Sep
-15
Oct
-15
3M Abs. RR 5Y Mean +/-2 Stdev
2W 1M 3M 6M 12Y 2W 1M 3M 6M 12Y 2W 1M 3M 6M 12Y
1.3 1.2 1.6 1.4 1.4 -0.5 -0.3 -0.1 0.0 0.2 0.9 1.1 1.4 1.4 1.2
2W 1M 3M 6M 12Y 2W 1M 3M 6M 12Y 2W 1M 3M 6M 12Y
0.5 0.9 1.2 1.2 1.0 -2.2 -2.0 -1.6 -1.1 -0.9 1.0 0.9 1.0 1.1 1.2
2W 1M 3M 6M 12Y 2W 1M 3M 6M 12Y 2W 1M 3M 6M 12Y
-1.0 -1.3 -1.8 -1.9 -1.8 -3.4 -3.1 -3.6 -4.0 -5.1 -0.4 -0.8 -1.5 -1.6 -1.1
Vol Adjust. Z-Score
Vol Adjust. Z-Score
EUR/HUF
1M Risk Reversal History
Vol Adjust. Z-Score
NZD/USD
GBP/USD
USD/CAD AUD/NZD
EUR/CZK EUR/PLN
USD/JPY AUD/USD
-3.50
-3.00
-2.50
-2.00
-1.50
-1.00
-0.50
0.00
0.50
Oct
-14
Nov
-14
Dec
-14
Jan
-15
Feb
-15
Mar
-15
Ap
r-1
5
May
-15
Jun
-15
Jul-1
5
Au
g-1
5
Sep
-15
Oct
-15
3M Abs. RR 5Y Mean +/-2 Stdev
-2.00
-1.50
-1.00
-0.50
0.00
0.50
1.00
1.50
Oct
-14
Nov
-14
Dec
-14
Jan
-15
Feb
-15
Mar
-15
Ap
r-1
5
May
-15
Jun
-15
Jul-1
5
Au
g-1
5
Sep
-15
Oct
-15
3M Abs. RR 5Y Mean +/-2 Stdev
-5.00
-4.00
-3.00
-2.00
-1.00
0.00
Oct
-14
Nov
-14
Dec
-14
Jan
-15
Feb
-15
Mar
-15
Ap
r-1
5
May
-15
Jun
-15
Jul-1
5
Au
g-1
5
Sep
-15
Oct
-15
3M Abs. RR 5Y Mean +/-2 Stdev
-5.00
-4.00
-3.00
-2.00
-1.00
0.00
Oct
-14
Nov
-14
Dec
-14
Jan
-15
Feb
-15
Mar
-15
Ap
r-1
5
May
-15
Jun
-15
Jul-1
5
Au
g-1
5
Sep
-15
Oct
-15
3M Abs. RR 5Y Mean +/-2 Stdev
0.00
0.50
1.00
1.50
2.00
2.50
3.00
Oct
-14
Nov
-14
Dec
-14
Jan
-15
Feb
-15
Mar
-15
Ap
r-1
5
May
-15
Jun
-15
Jul-1
5
Au
g-1
5
Sep
-15
Oct
-15
3M Abs. RR 5Y Mean +/-2 Stdev
-0.80
-0.60
-0.40
-0.20
0.00
0.20
0.40
Oct
-14
Nov
-14
Dec
-14
Jan
-15
Feb
-15
Mar
-15
Ap
r-1
5
May
-15
Jun
-15
Jul-1
5
Au
g-1
5
Sep
-15
Oct
-15
3M Abs. RR 5Y Mean +/-2 Stdev
0.00
1.00
2.00
3.00
4.00
5.00
Oct
-14
Nov
-14
Dec
-14
Jan
-15
Feb
-15
Mar
-15
Ap
r-1
5
May
-15
Jun
-15
Jul-1
5
Au
g-1
5
Sep
-15
Oct
-15
3M Abs. RR 5Y Mean +/-2 Stdev
-2.00
-1.00
0.00
1.00
2.00
3.00
4.00
Oct
-14
Nov
-14
Dec
-14
Jan
-15
Feb
-15
Mar
-15
Ap
r-1
5
May
-15
Jun
-15
Jul-1
5
Au
g-1
5
Sep
-15
Oct
-15
3M Abs. RR 5Y Mean +/-2 Stdev
0.00
1.00
2.00
3.00
4.00
5.00
Oct
-14
Nov
-14
Dec
-14
Jan
-15
Feb
-15
Mar
-15
Ap
r-1
5
May
-15
Jun
-15
Jul-1
5
Au
g-1
5
Sep
-15
Oct
-15
3M Abs. RR 5Y Mean +/-2 Stdev
-5.00
0.00
5.00
10.00
15.00
20.00
Oct
-14
Nov
-14
Dec
-14
Jan
-15
Feb
-15
Mar
-15
Ap
r-1
5
May
-15
Jun
-15
Jul-1
5
Au
g-1
5
Sep
-15
Oct
-15
3M Abs. RR 5Y Mean +/-2 Stdev
0.00
1.00
2.00
3.00
4.00
5.00
Oct
-14
Nov
-14
Dec
-14
Jan
-15
Feb
-15
Mar
-15
Ap
r-1
5
May
-15
Jun
-15
Jul-1
5
Au
g-1
5
Sep
-15
Oct
-15
3M Abs. RR 5Y Mean +/-2 Stdev
-4.00
-3.00
-2.00
-1.00
0.00
1.00
2.00
3.00
Oct
-14
Nov
-14
Dec
-14
Jan
-15
Feb
-15
Mar
-15
Ap
r-1
5
May
-15
Jun
-15
Jul-1
5
Au
g-1
5
Sep
-15
Oct
-15
3M Abs. RR 5Y Mean +/-2 Stdev
-5.00
0.00
5.00
10.00
15.00
20.00
25.00
Oct
-14
Nov
-14
Dec
-14
Jan
-15
Feb
-15
Mar
-15
Ap
r-1
5
May
-15
Jun
-15
Jul-1
5
Au
g-1
5
Sep
-15
Oct
-15
3M Abs. RR 5Y Mean +/-2 Stdev
-0.50
0.00
0.50
1.00
1.50
2.00
Oct
-14
Nov
-14
Dec
-14
Jan
-15
Feb
-15
Mar
-15
Ap
r-1
5
May
-15
Jun
-15
Jul-1
5
Au
g-1
5
Sep
-15
Oct
-15
3M Abs. RR 5Y Mean +/-2 Stdev
-0.50
0.00
0.50
1.00
1.50
2.00
Oct
-14
Nov
-14
Dec
-14
Jan
-15
Feb
-15
Mar
-15
Ap
r-1
5
May
-15
Jun
-15
Jul-1
5
Au
g-1
5
Sep
-15
Oct
-15
3M Abs. RR 5Y Mean +/-2 Stdev
-1.50
-1.00
-0.50
0.00
0.50
Oct
-14
Nov
-14
Dec
-14
Jan
-15
Feb
-15
Mar
-15
Ap
r-1
5
May
-15
Jun
-15
Jul-1
5
Au
g-1
5
Sep
-15
Oct
-15
3M Abs. RR 5Y Mean +/-2 Stdev
0.00
1.00
2.00
3.00
4.00
5.00
6.00
7.00
Oct
-14
Nov
-14
Dec
-14
Jan
-15
Feb
-15
Mar
-15
Ap
r-1
5
May
-15
Jun
-15
Jul-1
5
Au
g-1
5
Sep
-15
Oct
-15
3M Abs. RR 5Y Mean +/-2 Stdev
0.00
0.50
1.00
1.50
2.00
2.50
3.00
3.50
4.00
Oct
-14
Nov
-14
Dec
-14
Jan
-15
Feb
-15
Mar
-15
Ap
r-1
5
May
-15
Jun
-15
Jul-1
5
Au
g-1
5
Sep
-15
Oct
-15
3M Abs. RR 5Y Mean +/-2 Stdev
Cheap Neutral Expensive
25-delta risk reversals (Z-scores, volatility adjusted) by currency pairs and tenors
Note: The charts illustrate historical movements in the absolute 1M 25-delta risk reversals
Source: Bloomberg, Danske Bank Markets
Option trades
Spot summary
Volatility summary
Skew summary
Carry summary
Appendix
Spot
Volatility
Skew
Butterfly
Correlation

19 www.danskebank.com/CI 19
Danske Bank FX Quant Strategy
Skew overview (4/4)
14 October 2015
-3.50
-3.00
-2.50
-2.00
-1.50
-1.00
-0.50
0.00
0.50
Oct
-14
Nov
-14
Dec
-14
Jan
-15
Feb
-15
Mar
-15
Ap
r-1
5
May
-15
Jun
-15
Jul-1
5
Au
g-1
5
Sep
-15
Oct
-15
3M Abs. RR 5Y Mean +/-2 Stdev
-2.00
-1.50
-1.00
-0.50
0.00
0.50
1.00
1.50
Oct
-14
Nov
-14
Dec
-14
Jan
-15
Feb
-15
Mar
-15
Ap
r-1
5
May
-15
Jun
-15
Jul-1
5
Au
g-1
5
Sep
-15
Oct
-15
3M Abs. RR 5Y Mean +/-2 Stdev
-5.00
-4.00
-3.00
-2.00
-1.00
0.00
Oct
-14
Nov
-14
Dec
-14
Jan
-15
Feb
-15
Mar
-15
Ap
r-1
5
May
-15
Jun
-15
Jul-1
5
Au
g-1
5
Sep
-15
Oct
-15
3M Abs. RR 5Y Mean +/-2 Stdev
-5.00
-4.00
-3.00
-2.00
-1.00
0.00
Oct
-14
Nov
-14
Dec
-14
Jan
-15
Feb
-15
Mar
-15
Ap
r-1
5
May
-15
Jun
-15
Jul-1
5
Au
g-1
5
Sep
-15
Oct
-15
3M Abs. RR 5Y Mean +/-2 Stdev
0.00
0.50
1.00
1.50
2.00
2.50
3.00
Oct
-14
Nov
-14
Dec
-14
Jan
-15
Feb
-15
Mar
-15
Ap
r-1
5
May
-15
Jun
-15
Jul-1
5
Au
g-1
5
Sep
-15
Oct
-15
3M Abs. RR 5Y Mean +/-2 Stdev
-0.80
-0.60
-0.40
-0.20
0.00
0.20
0.40
Oct
-14
Nov
-14
Dec
-14
Jan
-15
Feb
-15
Mar
-15
Ap
r-1
5
May
-15
Jun
-15
Jul-1
5
Au
g-1
5
Sep
-15
Oct
-15
3M Abs. RR 5Y Mean +/-2 Stdev
0.00
1.00
2.00
3.00
4.00
5.00
Oct
-14
Nov
-14
Dec
-14
Jan
-15
Feb
-15
Mar
-15
Ap
r-1
5
May
-15
Jun
-15
Jul-1
5
Au
g-1
5
Sep
-15
Oct
-15
3M Abs. RR 5Y Mean +/-2 Stdev
-2.00
-1.00
0.00
1.00
2.00
3.00
4.00
Oct
-14
Nov
-14
Dec
-14
Jan
-15
Feb
-15
Mar
-15
Ap
r-1
5
May
-15
Jun
-15
Jul-1
5
Au
g-1
5
Sep
-15
Oct
-15
3M Abs. RR 5Y Mean +/-2 Stdev
0.00
1.00
2.00
3.00
4.00
5.00
Oct
-14
Nov
-14
Dec
-14
Jan
-15
Feb
-15
Mar
-15
Ap
r-1
5
May
-15
Jun
-15
Jul-1
5
Au
g-1
5
Sep
-15
Oct
-15
3M Abs. RR 5Y Mean +/-2 Stdev
2W 1M 3M 6M 12Y 2W 1M 3M 6M 12Y 2W 1M 3M 6M 12Y
-0.2 -0.4 -0.1 0.2 0.3 0.0 0.0 0.1 0.3 0.4 -1.2 -1.2 -1.2 -1.1 -1.0
2W 1M 3M 6M 12Y 2W 1M 3M 6M 12Y 2W 1M 3M 6M 12Y
-0.5 -0.5 -0.3 0.1 0.3 1.5 1.4 1.1 1.0 1.0 1.2 1.1 0.9 0.8 0.9
2W 1M 3M 6M 12Y 2W 1M 3M 6M 12Y 2W 1M 3M 6M 12Y
1.8 2.1 1.9 1.6 1.4 -0.9 -1.3 -1.4 -1.1 -1.0 -1.3 -1.2 -0.7 -0.6 -0.9
USD/RUB
Vol Adjust. Z-Score
EUR/RUB
Vol Adjust. Z-Score
EUR/CAD USD/HUF USD/CZK
Vol Adjust. Z-Score
EUR/TRY USD/CHF
EUR/AUD EUR/NZD
-5.00
0.00
5.00
10.00
15.00
20.00
Oct
-14
Nov
-14
Dec
-14
Jan
-15
Feb
-15
Mar
-15
Ap
r-1
5
May
-15
Jun
-15
Jul-1
5
Au
g-1
5
Sep
-15
Oct
-15
3M Abs. RR 5Y Mean +/-2 Stdev
0.00
1.00
2.00
3.00
4.00
5.00
Oct
-14
Nov
-14
Dec
-14
Jan
-15
Feb
-15
Mar
-15
Ap
r-1
5
May
-15
Jun
-15
Jul-1
5
Au
g-1
5
Sep
-15
Oct
-15
3M Abs. RR 5Y Mean +/-2 Stdev
-4.00
-3.00
-2.00
-1.00
0.00
1.00
2.00
3.00
Oct
-14
Nov
-14
Dec
-14
Jan
-15
Feb
-15
Mar
-15
Ap
r-1
5
May
-15
Jun
-15
Jul-1
5
Au
g-1
5
Sep
-15
Oct
-15
3M Abs. RR 5Y Mean +/-2 Stdev
-5.00
0.00
5.00
10.00
15.00
20.00
25.00
Oct
-14
Nov
-14
Dec
-14
Jan
-15
Feb
-15
Mar
-15
Ap
r-1
5
May
-15
Jun
-15
Jul-1
5
Au
g-1
5
Sep
-15
Oct
-15
3M Abs. RR 5Y Mean +/-2 Stdev
-0.50
0.00
0.50
1.00
1.50
2.00
Oct
-14
Nov
-14
Dec
-14
Jan
-15
Feb
-15
Mar
-15
Ap
r-1
5
May
-15
Jun
-15
Jul-1
5
Au
g-1
5
Sep
-15
Oct
-15
3M Abs. RR 5Y Mean +/-2 Stdev
-0.50
0.00
0.50
1.00
1.50
2.00
Oct
-14
Nov
-14
Dec
-14
Jan
-15
Feb
-15
Mar
-15
Ap
r-1
5
May
-15
Jun
-15
Jul-1
5
Au
g-1
5
Sep
-15
Oct
-15
3M Abs. RR 5Y Mean +/-2 Stdev
-1.50
-1.00
-0.50
0.00
0.50
Oct
-14
Nov
-14
Dec
-14
Jan
-15
Feb
-15
Mar
-15
Ap
r-1
5
May
-15
Jun
-15
Jul-1
5
Au
g-1
5
Sep
-15
Oct
-15
3M Abs. RR 5Y Mean +/-2 Stdev
0.00
1.00
2.00
3.00
4.00
5.00
6.00
7.00
Oct
-14
Nov
-14
Dec
-14
Jan
-15
Feb
-15
Mar
-15
Ap
r-1
5
May
-15
Jun
-15
Jul-1
5
Au
g-1
5
Sep
-15
Oct
-15
3M Abs. RR 5Y Mean +/-2 Stdev
0.00
0.50
1.00
1.50
2.00
2.50
3.00
3.50
4.00
Oct
-14
Nov
-14
Dec
-14
Jan
-15
Feb
-15
Mar
-15
Ap
r-1
5
May
-15
Jun
-15
Jul-1
5
Au
g-1
5
Sep
-15
Oct
-15
3M Abs. RR 5Y Mean +/-2 Stdev
Cheap Neutral Expensive
25-delta risk reversals (Z-scores, volatility adjusted) by currency pairs and tenors
Note: The charts illustrate historical movements in the absolute 1M 25-delta risk reversals
Source: Bloomberg, Danske Bank Markets
Option trades
Spot summary
Volatility summary
Skew summary
Carry summary
Appendix
Spot
Volatility
Skew
Butterfly
Correlation

20 www.danskebank.com/CI 20
Danske Bank FX Quant Strategy
Butterfly overview (1/2)
Butterfly valuation based on model outputs
14 October 2015
Cheap Neutral Expensive
Overall
valuationZ-Score
Butterfly
absolute
1W
chg
Overall
valuationZ-Score
Butterfly
absolute
1W
chg
Overall
valuationZ-Score
Butterfly
absolute
1W
chg
Overall
valuationZ-Score
Butterfly
absolute
1W
chg
EUR/NOK Neutral 0.2 0.3 Neutral -0.3 0.3 Neutral -0.4 0.3 Cheap -1.4 0.4
EUR/SEK Neutral -0.3 0.2 Neutral -0.3 0.2 Neutral -0.9 0.2 Cheap -1.4 0.3
USD/NOK Expensive 1.3 0.3 Neutral 0.5 0.2 Neutral 0.1 0.3 Neutral -0.1 0.4
USD/SEK Neutral 0.7 0.2 Neutral 1.0 0.2 Expensive 1.0 0.3 Neutral 0.8 0.4
NOK/SEK Neutral 0.0 0.2 Neutral -0.5 0.2 Neutral -0.7 0.3 Neutral -1.0 0.4
EUR/USD Neutral 0.7 0.2 Neutral -0.3 0.2 Cheap -1.1 0.3 Cheap -1.2 0.3
EUR/GBP Neutral -0.3 0.2 Neutral -0.9 0.2 Neutral -0.4 0.3 Neutral -0.3 0.4
EUR/JPY Neutral 0.3 0.3 Neutral -0.2 0.3 Neutral -0.1 0.4 Neutral 0.3 0.6
EUR/CHF Neutral -0.3 0.5 Neutral -0.4 0.4 Neutral -0.3 0.6 Neutral -0.2 0.9
GBP/USD Expensive 1.9 0.2 Neutral 0.3 0.2 Neutral -1.0 0.2 Cheap -1.2 0.3
USD/JPY Neutral 0.7 0.3 Neutral 0.5 0.3 Neutral 0.5 0.4 Expensive 1.7 0.6
AUD/USD Very Expensive 2.1 0.4 Neutral 0.2 0.3 Neutral -0.8 0.4 Cheap -1.1 0.5
NZD/USD Neutral 0.4 0.3 Neutral -0.6 0.3 Neutral -0.7 0.4 Neutral -0.7 0.6
USD/CAD Neutral -0.9 0.2 Cheap -1.5 0.2 Cheap -1.2 0.2 Cheap -1.3 0.3
AUD/NZD Neutral 0.8 0.2 Neutral -0.7 0.2 Cheap -1.5 0.2 Very Cheap -2.3 0.2
EUR/HUF Neutral 0.1 0.3 Neutral -0.4 0.3 Neutral -1.0 0.4 Neutral -0.8 0.6
EUR/CZK Neutral 0.3 0.5 Neutral 0.6 0.5 Neutral 0.4 0.6 Neutral 0.5 0.8
EUR/PLN Neutral -0.8 0.2 Cheap -1.5 0.2 Very Cheap -2.2 0.2 Cheap -1.5 0.5
EUR/RUB Neutral -0.2 0.8 Neutral -0.2 0.9 Neutral 0.1 1.3 Neutral 0.7 2.4
EUR/TRY Neutral -0.8 0.3 Cheap -1.2 0.4 Cheap -1.1 0.6 Neutral 0.4 1.2
USD/CHF Neutral 0.9 0.2 Neutral -0.3 0.2 Neutral -0.5 0.3 Neutral -0.7 0.4
USD/RUB Neutral -0.1 0.9 Neutral -0.3 0.9 Neutral 0.5 1.5 Neutral 0.9 2.6
12MS
ca
nd
ies
Ma
jor
s
Currency pairs
2W 3MC
om
mo
dit
yE
MO
th
er
1M
Note: The Z-Score is calculated on volatility adjusted 25-delta butterflies across tenors
’Overall Valuation’ is based on a weighted average of model outputs
Source: Bloomberg, Danske Bank Markets
Option trades
Spot summary
Volatility summary
Skew summary
Carry summary
Appendix
Spot
Volatility
Skew
Butterfly
Correlation

21 www.danskebank.com/CI 21
Danske Bank FX Quant Strategy
Butterfly overview (2/2)
25-delta butterfly (percentile, volatility adjusted) by currency pair and across currency pairs
14 October 2015
Cheap Neutral Expensive
Source: Bloomberg, Danske Bank Markets
EURNOK
EURSEK
USDNOK
USDSEKNOKSEK
EURUSD
EURGBP
EURJPY
EURCHF
GBPUSD
USDJPY
AUDUSD
NZDUSD
USDCAD
AUDNZD
EURHUF
EURCZK
EURPLN
EURRUB
EURTRY
USDCHF
USDRUB
EURAUD
EURNZDEURCAD
USDHUFUSDCZK
0
10
20
30
40
50
60
70
80
90
100
0 10 20 30 40 50 60 70 80 90 100
Percentile across
currencies, 5Y history
Percentile for single cross, 5Y history
Volatility Adjusted 3M 25-Delta Butterfly
Expensive
Exp
ensi
veC
hea
p
Cheap
Option trades
Spot summary
Volatility summary
Skew summary
Carry summary
Appendix
Spot
Volatility
Skew
Butterfly
Correlation
22 www.danskebank.com/CI 22
Danske Bank FX Quant Strategy
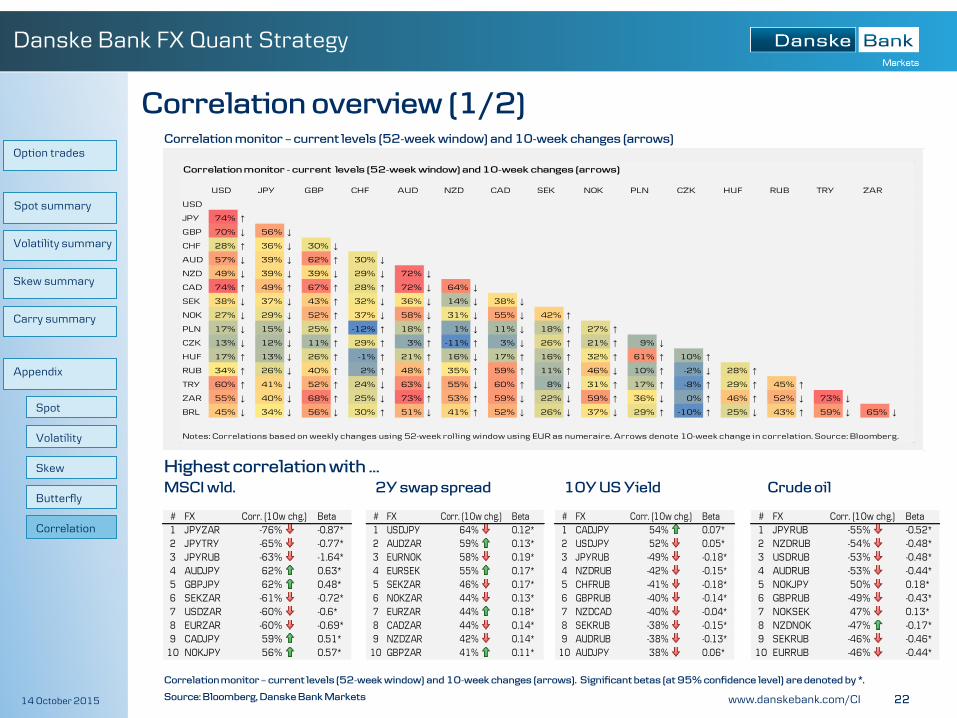
Correlation overview (1/2)
14 October 2015
Correlation monitor – current levels (52-week window) and 10-week changes (arrows)
Highest correlation with … MSCI wld. 2Y swap spread 10Y US Yield Crude oil
Correlation monitor - current levels (52-week window) and 10-week changes (arrows)
USD
JPY 74% ↑
GBP 70% ↓ 56% ↓
CHF 28% ↑ 36% ↓ 30% ↓
AUD 57% ↓ 39% ↓ 62% ↑ 30% ↓
NZD 49% ↓ 39% ↓ 39% ↓ 29% ↓ 72% ↓
CAD 74% ↑ 49% ↑ 67% ↑ 28% ↑ 72% ↓ 64% ↓
SEK 38% ↓ 37% ↓ 43% ↑ 32% ↓ 36% ↓ 14% ↓ 38% ↓
NOK 27% ↓ 29% ↓ 52% ↑ 37% ↓ 58% ↓ 31% ↓ 55% ↓ 42% ↑
PLN 17% ↓ 15% ↓ 25% ↑ -12% ↑ 18% ↑ 1% ↓ 11% ↓ 18% ↑ 27% ↑
CZK 13% ↓ 12% ↓ 11% ↑ 29% ↑ 3% ↑ -11% ↑ 3% ↓ 26% ↑ 21% ↑ 9% ↓
HUF 17% ↑ 13% ↓ 26% ↑ -1% ↑ 21% ↑ 16% ↓ 17% ↑ 16% ↑ 32% ↑ 61% ↑ 10% ↑
RUB 34% ↑ 26% ↓ 40% ↑ 2% ↑ 48% ↑ 35% ↑ 59% ↑ 11% ↑ 46% ↓ 10% ↑ -2% ↓ 28% ↑
TRY 60% ↑ 41% ↓ 52% ↑ 24% ↓ 63% ↓ 55% ↓ 60% ↑ 8% ↓ 31% ↑ 17% ↑ -8% ↑ 29% ↑ 45% ↑
ZAR 55% ↓ 40% ↓ 68% ↑ 25% ↓ 73% ↑ 53% ↑ 59% ↓ 22% ↓ 59% ↑ 36% ↓ 0% ↑ 46% ↑ 52% ↓ 73% ↓
BRL 45% ↓ 34% ↓ 56% ↓ 30% ↑ 51% ↓ 41% ↑ 52% ↓ 26% ↓ 37% ↓ 29% ↑ -10% ↑ 25% ↓ 43% ↑ 59% ↓ 65% ↓
Notes: Correlations based on weekly changes using 52-week rolling window using EUR as numeraire. Arrows denote 10-week change in correlation. Source: Bloomberg.
NZDUSD JPY GBP CHF AUD RUB TRY ZARCAD SEK NOK PLN CZK HUF
# FX Corr. (10w chg.) Beta1 JPYZAR -76% -0.87*2 JPYTRY -65% -0.77*3 JPYRUB -63% -1.64*4 AUDJPY 62% 0.63*5 GBPJPY 62% 0.48*6 SEKZAR -61% -0.72*7 USDZAR -60% -0.6*8 EURZAR -60% -0.69*9 CADJPY 59% 0.51*
10 NOKJPY 56% 0.57*
# FX Corr. (10w chg.) Beta1 USDJPY 64% 0.12*2 AUDZAR 59% 0.13*3 EURNOK 58% 0.19*4 EURSEK 55% 0.17*5 SEKZAR 46% 0.17*6 NOKZAR 44% 0.13*7 EURZAR 44% 0.18*8 CADZAR 44% 0.14*9 NZDZAR 42% 0.14*
10 GBPZAR 41% 0.11*
# FX Corr. (10w chg.) Beta1 CADJPY 54% 0.07*2 USDJPY 52% 0.05*3 JPYRUB -49% -0.18*4 NZDRUB -42% -0.15*5 CHFRUB -41% -0.18*6 GBPRUB -40% -0.14*7 NZDCAD -40% -0.04*8 SEKRUB -38% -0.15*9 AUDRUB -38% -0.13*
10 AUDJPY 38% 0.06*
# FX Corr. (10w chg.) Beta1 JPYRUB -55% -0.52*2 NZDRUB -54% -0.48*3 USDRUB -53% -0.48*4 AUDRUB -53% -0.44*5 NOKJPY 50% 0.18*6 GBPRUB -49% -0.43*7 NOKSEK 47% 0.13*8 NZDNOK -47% -0.17*9 SEKRUB -46% -0.46*
10 EURRUB -46% -0.44*
Correlation monitor – current levels (52-week window) and 10-week changes (arrows). Significant betas (at 95% confidence level) are denoted by *.
Source: Bloomberg, Danske Bank Markets
Option trades
Spot summary
Volatility summary
Skew summary
Carry summary
Appendix
Spot
Volatility
Skew
Butterfly
Correlation

23 www.danskebank.com/CI 23
Danske Bank FX Quant Strategy
Correlation overview (2/2)
14 October 2015
Highest correlation with … EUR/USD USD/JPY EUR/GBP EUR/CHF
EUR/SEK EUR/NOK EUR/CZK EUR/HUF
AUD/USD NZD/USD EUR/RUB EUR/PLN
# Asset Corr. (10w chg.) Beta1 EURGBP 70% 0.91*2 Ger. equit. -56% -0.32*3 Rel. equit. -55% -0.55*4 NZDUSD 54% 0.54*5 USDCAD -53% -0.76*6 IT10YGOV 44% 0.06*7 AUDUSD 44% 0.47*8 SP10YGOV 39% 0.05*9 EURCHF 38% 0.69*
10 USDJPY -37% -0.52*
# Asset Corr. (10w chg.) Beta1 Jap. equit. 67% 0.29*2 2Y swp. spr. 64% 0.12*3 US2YSWP 64% 0.11*4 US2YGOV 63% 0.1*5 US10YSWP 53% 0.05*6 10Y swp. spr. 53% 0.07*7 US10YGOV 52% 0.05*8 Gold -51% -0.29*9 US equit. 48% 0.31*
10 Rel. equit. -48% -0.29*
# Asset Corr. (10w chg.) Beta1 EURUSD 70% 0.54*2 Ger. equit. -59% -0.26*3 Itraxx -46% -0.56*4 EURCHF 43% 0.6*5 Global equit. -42% -0.29*6 US equit. -41% -0.28*7 VIX 40% 0*8 IT10YGOV 40% 0.04*9 SP10YGOV 40% 0.04*
10 Jap. equit. -38% -0.17*
# Asset Corr. (10w chg.) Beta1 EURGBP 43% 0.31*2 EURUSD 38% 0.21*3 Rel. equit. -30% -0.11*4 Itraxx -29% -0.26*5 Ger. equit. -25% -0.086 USDTRY -25% -0.137 NZDUSD 24% 0.138 IT10YGOV 21% 0.029 GR10YGOV 19% 0
10 EURPLN 18% 0.18
# Asset Corr. (10w chg.) Beta1 2Y swp. spr. 55% 0.17*2 EURNOK 40% 0.28*3 EURPLN -40% -0.23*4 10Y swp. spr. 35% 0.07*5 FX volatility -30% -0.03*6 USDCAD 29% 0.13*7 NZDUSD -27% -0.09*8 EURGBP -24% -0.19 EURUSD -19% -0.06
10 Copper -18% -0.04
# Asset Corr. (10w chg.) Beta1 2Y swp. spr. 58% 0.19*2 EURSEK 40% 0.59*3 10Y swp. spr. 29% 0.06*4 NZDUSD -25% -0.125 EURPLN -23% -0.26 G10 Carry -23% -0.137 USDCAD 21% 0.148 SP10YGOV -21% -0.019 IT10YGOV -17% -0.01
10 EURUSD -17% -0.08
# Asset Corr. (10w chg.) Beta1 IT10YGOV 33% 0.01*2 SP10YGOV 31% 0.01*3 EURCHF 26% 0.124 NZDUSD 25% 0.065 USDTRY -23% -0.056 G10 Carry 20% 0.067 Itraxx -20% -0.088 FX volatility -18% -0.019 US2YSWP -17% -0.01
10 USDCAD -17% -0.06
# Asset Corr. (10w chg.) Beta1 EURPLN 61% 0.61*2 Itraxx -38% -0.33*3 Ger. equit. -36% -0.11*4 VIX 35% 0*5 Global equit. -34% -0.17*6 FX volatility 33% 0.05*7 Zinc -30% -0.09*8 IT10YGOV 29% 0.02*9 US equit. -27% -0.13*
10 SP10YGOV 27% 0.02*
# Asset Corr. (10w chg.) Beta1 NZDUSD 69% 0.65*2 USDCAD -63% -0.84*3 G10 Carry 58% 0.68*4 USDTRY -46% -0.4*5 EURUSD 44% 0.41*6 Global equit. 42% 0.36*7 Copper 38% 0.24*8 FX volatility -34% -0.09*9 US equit. 33% 0.27*
10 Gold 29% 0.21*
# Asset Corr. (10w chg.) Beta1 AUDUSD 69% 0.74*2 USDCAD -62% -0.89*3 EURUSD 54% 0.53*4 USDTRY -41% -0.39*5 G10 Carry 41% 0.51*6 Gold 35% 0.28*7 EURGBP 33% 0.42*8 EURSEK -27% -0.83*9 Copper 26% 0.17
10 EURNOK -25% -0.53
# Asset Corr. (10w chg.) Beta1 VIX 55% 0.01*2 Global equit. -53% -1.38*3 US equit. -51% -1.28*4 Ger. equit. -48% -0.78*5 Crude oil -46% -0.44*6 Itraxx -44% -2*7 EURGBP 40% 1.49*8 G10 Carry -40% -1.44*9 US10YSWP -38% -0.15*
10 US10YGOV -37% -0.14*
# Asset Corr. (10w chg.) Beta1 FX volatility 41% 0.06*2 EURSEK -40% -0.68*3 Zinc -39% -0.12*4 Itraxx -31% -0.27*5 IT10YGOV 27% 0.02*6 EURGBP 25% 0.187 Global equit. -25% -0.128 Ger. equit. -24% -0.089 VIX 24% 0
10 EURNOK -23% -0.27
Correlation monitor – current levels (52-week window) and 10-week changes (arrows). Significant betas (at 95% confidence level) are denoted by *.
Source: Bloomberg, Danske Bank Markets
Option trades
Spot summary
Volatility summary
Skew summary
Carry summary
Appendix
Spot
Volatility
Skew
Butterfly
Correlation

24 www.danskebank.com/CI 24
Danske Bank FX Quant Strategy
Disclosures
This research report has been prepared by Danske Bank Markets, a division of Danske Bank A/S (‘Danske Bank’). The authors of this research report are Morten Thrane Helt, Senior Analyst, and Kristoffer Kjær Lomholt, Analyst.
Analyst certification. Each research analyst responsible for the content of this research report certifies that the views expressed in the research report accurately reflect the research analyst’s personal view about the financial instruments and issuers covered by the research report. Each responsible research analyst further certifies that no part of the compensation of the research analyst was, is or will be, directly or indirectly, related to the specific recommendations expressed in the research report.
Regulation. Danske Bank is authorised and subject to regulation by the Danish Financial Supervisory Authority and is subject to the rules and regulation of the relevant regulators in all other jurisdictions where it conducts business. Danske Bank is subject to limited regulation by the Financial Conduct Authority and the Prudential Regulation Authority (UK). Details on the extent of the regulation by the Financial Conduct Authority and the Prudential Regulation Authority are available from Danske Bank on request.
The research reports of Danske Bank are prepared in accordance with the Danish Society of Financial Analysts’ rules of ethics and the recommendations of the Danish Securities Dealers Association.
Conflicts of interest. Danske Bank has established procedures to prevent conflicts of interest and to ensure the provision of high-quality research based on research objectivity and independence. These procedures are documented in Danske Bank’s research policies. Employees within Danske Bank’s Research Departments have been instructed that any request that might impair the objectivity and independence of research shall be referred to Research Management and the Compliance Department. Danske Bank’s Research Departments are organised independently from and do not report to other business areas within Danske Bank.
Research analysts are remunerated in part based on the overall profitability of Danske Bank, which includes investment banking revenues, but do not receive bonuses or other remuneration linked to specific corporate finance or debt capital transactions.
Financial models and/or methodology used in this research report. Calculations and presentations in this research report are based on standard econometric tools and methodology as well as publicly available statistics for each individual security, issuer and/or country. Documentation can be obtained from the authors on request.
Risk warning. Major risks connected with recommendations or opinions in this research report, including a sensitivity analysis of relevant assumptions, are stated throughout the text.
Date of first publication. See the front page of this research report for the date of first publication.

25 www.danskebank.com/CI 25
Danske Bank FX Quant Strategy
General disclaimer
This research has been prepared by Danske Bank Markets (a division of Danske Bank A/S). It is provided for informational purposes only. It does not constitute or form part of, and shall under no circumstances be considered as, an offer to sell or a solicitation of an offer to purchase or sell any relevant financial instruments (i.e. financial instruments mentioned herein or other financial instruments of any issuer mentioned herein and/or options, warrants, rights or other interests with respect to any such financial instruments) (‘Relevant Financial Instruments’).
The research report has been prepared independently and solely on the basis of publicly available information that Danske Bank considers to be reliable. While reasonable care has been taken to ensure that its contents are not untrue or misleading, no representation is made as to its accuracy or completeness and Danske Bank, its affiliates and subsidiaries accept no liability whatsoever for any direct or consequential loss, including without limitation any loss of profits, arising from reliance on this research report.
The opinions expressed herein are the opinions of the research analysts responsible for the research report and reflect their judgement as of the date hereof. These opinions are subject to change, and Danske Bank does not undertake to notify any recipient of this research report of any such change nor of any other changes related to the information provided in this research report.
This research report is not intended for retail customers in the United Kingdom or the United States.
This research report is protected by copyright and is intended solely for the designated addressee. It may not be reproduced or distributed, in whole or in part, by any recipient for any purpose without Danske Bank’s prior written consent.
Disclaimer related to distribution in the United States
This research report is distributed in the United States by Danske Markets Inc., a U.S. registered broker-dealer and subsidiary of Danske Bank, pursuant to SEC Rule 15a-6 and related interpretations issued by the U.S. Securities and Exchange Commission. The research report is intended for distribution in the United States solely to ‘U.S. institutional investors’ as defined in SEC Rule 15a-6. Danske Markets Inc. accepts responsibility for this research report in connection with distribution in the United States solely to ‘U.S. institutional investors’.
Danske Bank is not subject to U.S. rules with regard to the preparation of research reports and the independence of research analysts. In addition, the research analysts of Danske Bank who have prepared this research report are not registered or qualified as research analysts with the NYSE or FINRA but satisfy the applicable requirements of a non-U.S. jurisdiction.
Any U.S. investor recipient of this research report who wishes to purchase or sell any Relevant Financial Instrument may do so only by contacting Danske Markets Inc. directly and should be aware that investing in non-U.S. financial instruments may entail certain risks. Financial instruments of non-U.S. issuers may not be registered with the U.S. Securities and Exchange Commission and may not be subject to the reporting and auditing standards of the U.S. Securities and Exchange Commission.