Danish forest development during the last 3000 years reconstructed from regional pollen data
11
EC6GRAPHY 22: 53-62, Copenhagen 1999 Danish forest development during the last 3000 years reconstructed from regional pollen data Richard Bradshaw and Bjorn H. Holmqvist Bradshaw, R, and Holmqvist, B. H. 1999. Danish forest development during the last 3000 years reeonstructed from regional pollen data. - Ecography 22: 53-62. Most present Danish forest types are a direct result of recent silvicultural practice. We use fossil pollen data converted into estimates of tree abundance to map the development of forest types during the last 3000 radioearbon yr. The forest types were clusters in an artificial neural network based on all available European Holocene pollen data. Diverse deciduous forest types found 3000 yr ago were replaced by less diverse Fi:/g»,v-dominated types over a period of 2000 yr. The present day map contained many new combinations of tree species, dominated by Picea and Pimis. The association between the increase in non-forest communities and establish- ment of Fagus suggests that anthropogenic activity has accelerated the loss of species-rich deciduous forest with abundant .4lmis, Ciiryhis, Quercus and Filiu. We conclude that the natural forest composition of Denmark would be deciduous forest today with a significant presence of Fugus sylvatica. Recent forest development has created a break in compositional continuity with the past that is unnatural and has posed problems for forest-dependent biota. R. Brads/urn- ([email protected]), Dept of Fmironiiicntal History and Climate, Geological Survey of Denmark and Greenland, Thoraiej 8. DK-2400 Copenhagen NV\ Denmark. - B. H. Hoinujvist, Dept of Quaternary Geology, Lund Univ.. Formaiigen 13, SE-223 63 Lund, Sweden. Many west Europeati lartdscapes have beeti simplified and steered by management far from a "natural", (we define the natural condition as the undomesticated state of plants or animals and the state of the physical environ- ment prior to human exploitation), condition during the last 250 yr. The consequence ofthis management has been a considerable improvement in the efficiency of agricul- tural and forest production, but at the expense of natural biodiversity. Now there is excess production capacity for curifent local needs and a general re-assessment of land-use policy. In the forestry sector there have been recent increases both in European forest area and in standing volume, and a simultaneous increase in aware- ness of threatened species and loss of natural forest values (Franklin 1993), In response to public pressure there has been a renewed interest in nature-based forestry systems that utilise forests with key characteristics of natural conditions (Bradshaw et al. 1994, Larsen 1995), Accepted 16 June 1998 Copyright © ECOGRAPHY 1999 ISSN 0906-7590 Printed in Ireland - all rights reserved The definition of natural conditions in the cultural landscapes of Europe is problematic. Anthropogenic activities have influenced forests throughout the Holocene period, and no true virgin forest areas remain (Peterken 1996), However reconstructions of changing forest composition during the Holocene show how the present situation has arisen, and permit the distinction of recent compositional developments from those with a long history. Interpretation of the changing patterns in vegetation using independent methods will help iden- tify the surviving elements of natural conditions on the landscape. In this paper we present and interpret maps generated using calibrated fossil pollen data of tree and forest type distributions in Denmark during the last 3000 yr. Previous mapped summaries of pollen data have been made at a continental scale covering the entire Holocene (Davis 1976, Delcourt and Delcourt 1981, ECOGRAPHY 22:1 (1999) 53
-
Upload
richard-bradshaw -
Category
Documents
-
view
212 -
download
0
Transcript of Danish forest development during the last 3000 years reconstructed from regional pollen data

E C 6 G R A P H Y 22: 53-62, Copenhagen 1999
Danish forest development during the last 3000 yearsreconstructed from regional pollen data
Richard Bradshaw and Bjorn H. Holmqvist
Bradshaw, R, and Holmqvist, B. H. 1999. Danish forest development during the last3000 years reeonstructed from regional pollen data. - Ecography 22: 53-62.
Most present Danish forest types are a direct result of recent silvicultural practice.We use fossil pollen data converted into estimates of tree abundance to map thedevelopment of forest types during the last 3000 radioearbon yr. The forest typeswere clusters in an artificial neural network based on all available EuropeanHolocene pollen data. Diverse deciduous forest types found 3000 yr ago werereplaced by less diverse Fi:/g»,v-dominated types over a period of 2000 yr. The presentday map contained many new combinations of tree species, dominated by Picea andPimis. The association between the increase in non-forest communities and establish-ment of Fagus suggests that anthropogenic activity has accelerated the loss ofspecies-rich deciduous forest with abundant .4lmis, Ciiryhis, Quercus and Filiu. Weconclude that the natural forest composition of Denmark would be deciduous foresttoday with a significant presence of Fugus sylvatica. Recent forest development hascreated a break in compositional continuity with the past that is unnatural and hasposed problems for forest-dependent biota.
R. Brads/urn- ([email protected]), Dept of Fmironiiicntal History and Climate, GeologicalSurvey of Denmark and Greenland, Thoraiej 8. DK-2400 Copenhagen NV\ Denmark.- B. H. Hoinujvist, Dept of Quaternary Geology, Lund Univ.. Formaiigen 13, SE-22363 Lund, Sweden.
Many west Europeati lartdscapes have beeti simplified andsteered by management far from a "natural", (we definethe natural condition as the undomesticated state ofplants or animals and the state of the physical environ-ment prior to human exploitation), condition during thelast 250 yr. The consequence ofthis management has beena considerable improvement in the efficiency of agricul-tural and forest production, but at the expense of naturalbiodiversity. Now there is excess production capacity forcurifent local needs and a general re-assessment ofland-use policy. In the forestry sector there have beenrecent increases both in European forest area and instanding volume, and a simultaneous increase in aware-ness of threatened species and loss of natural forest values(Franklin 1993), In response to public pressure there hasbeen a renewed interest in nature-based forestry systemsthat utilise forests with key characteristics of naturalconditions (Bradshaw et al. 1994, Larsen 1995),
Accepted 16 June 1998
Copyright © ECOGRAPHY 1999ISSN 0906-7590Printed in Ireland - all rights reserved
The definition of natural conditions in the culturallandscapes of Europe is problematic. Anthropogenicactivities have influenced forests throughout theHolocene period, and no true virgin forest areas remain(Peterken 1996), However reconstructions of changingforest composition during the Holocene show how thepresent situation has arisen, and permit the distinctionof recent compositional developments from those witha long history. Interpretation of the changing patternsin vegetation using independent methods will help iden-tify the surviving elements of natural conditions on thelandscape. In this paper we present and interpret mapsgenerated using calibrated fossil pollen data of tree andforest type distributions in Denmark during the last3000 yr.
Previous mapped summaries of pollen data havebeen made at a continental scale covering the entireHolocene (Davis 1976, Delcourt and Delcourt 1981,
ECOGRAPHY 22:1 (1999) 53

1987, Huntley and Birks 1983. Jacobson et al. 1987.Htintley 1990a. b). and at a national scale both torsingle points of time (Birks et al. 1975. Bennett 1989)and tor the Holocene (Ralska-Jasiewiczowa 1983.Birks 1989). Pollen data were converted into estimatesof tree abundance for individual taxa in some of thesestudies (Huntley and Birks 1983. Delcourt and Del-court 1987) but Bjorse and Bradshaw (1998) were thefirst to calibrate pollen data and use them to maptbrest types. Pollen calibration methodology has ad-vanced considerably in recent years (Sugita 1994). anddespite probletns with long-distance (background) pol-len, calibration of raw pollen data yields a far lessbiased reconstruction of former vegetation than doesthe use of uncalibrated data. Maps generated using thecalibrated data are more accessible to scientists unfa-miliar with the interpretation of raw palynologicaldata.
Our main aim in this paper is to examine the linksbetween present Danish forest composition and thereconstructed record of tbrest development during thelast 3000 yr. We discuss the relationship betweenpresent forest conditions and the past and investigatethe driving forces for long-term forest development.Our working hypothesis is that present-day tbrestshave lost their compositional continuity with the tbresttypes that dominated much of the Holocene resultingin major consequences for biodiversity. We also dis-cuss ways in which we can interpret our maps to helpin the development of species mixtures appropriate forfuture Danish silvicultural practice where the goal is toincrease the natural elements in the forested landscape.
Material and methods
The data were selected from the Danish pollen datathat formed part of the NORDMAP data base held atLund Univ. (Berglund 1991). The chief criteria for siteselection were: 1) regional pollen sites with comparablepollen source areas. 2) sustained, high proportions oftree pollen during the last 3000 yr. 3) good datingcontrol, and 4) geographical cover of the whole coun-try. Fourteen sites were seleeted of which 11 were onJutland, one on Fyn and two on Zealand. Seven timeslices were chosen at 500 radiocarbon year intervalsfrom 3000 BP up to present. The temporal resolutionavailable did not justify closer sampling than the 500-yr intervals seleeted as a comparison of multiple sitesmakes high demands upon dating control. Pollen per-eentage data were calculated based on a tree pollensum eomprising the tbllowing pollen types: Alnti.s. Be-tula, Carpiuus. Corvlus. Fagtis. Fraxinus, Pieea, Piints.Quereus. Tilia, Ulinus.
The pollen data were converted into estimates oftree abundanee following Bjorse et al. (1996) using
the coefficients listed in Table 1. Tree distributionmaps were generated for each time slice using theprogram SURFER. Interpolation was carried out bykriging grids of 70x61 cells in 5 x 5 km squares.Thirty-three woody taxa trom the entire EuropeanPollen Database were calibrated using the coefficientsin Table I. Taxa not included in that table were ofminor importance in Denmark and coefficients of 1.0(slope) and 0.0 (intercept) were used. This data setwas used to train a self-organising map (Kohonen1989) which belongs to a class of unsupervised artifi-cial neural networks. The techniqtie is designed toachieve 1) vector quantitication of the input set. 2)dimensional reduction of the input space. The numberof classes was set to 32. The result was a classifica-tion model for woody vegetation based on all avail-able European pollen data. This forest classificationmodel was applied to the Danish tree distributionmaps to generate maps of forest types tor the selectedtime slices.
Results
Tree distribution maps
The data permit the compilation of individual treedistribution maps at the time periods under study, andwe present two speeies Fagus sylvatiea and A hutsglutinosa (Fig. 1). Fagtis is an example of a speciesthat has increased in importance during the time pe-riod under study, whereas Ahnts has reduced in impor-tance relative to other tree species. The maps arebased on percentage tree data and so merely refleetchanging proportions of the species on the landseape.As total forest cover altered, the absolute populationsizes of most tree species will have ehanged. Thesechanges can not be shown on the maps.
Table 1. Calibration coefficients used to transform pollenpercentage values into estimates of tree abundance.
Taxon
AhiesA eerAtmtsBettilaCarpiinisC'orylusFagusFraxinusPiceaPinusPopulusQiiet'ettsSalixFiliaVlinus
Slope
0.440.241.593.270.942.500.790.330.221.130.091.281.570.250.78
Intercept
0.000.006.800.000.000.000.200.001.635.500.001.501.020.000.00
Reference
Delcourt and DelcourtDelcourt and DelcourtPrentice et al. 1987Prentice et al. 1987Andersen 1970Bradshaw 1981Prentice et al. 1987Webb et al. 1981Bjorse et al. 1996Prentice et al. 1987Delcourt and DelcourtPrentice et al. 1987Delcourt and DelcourtDelcourt and DelcourtWebb et al. 1981
19871987
1987
19871987
54 ECOGRAPHY 22:1 (1999)

a)
AInus0 10 20 30 40 50 60 70 80 90 100 AInus at present
AInus at 2000 BP AInus at 2500 BP AInus at 3000 BPFig. 1, Species distribution maps for seven time-slices for a) AInus glutinosa and b) Fagus sylvatica. The units are percentage oftotal forest cover. The data points from which the maps are constructed are marked by black spots.
ECOGRAPHY 22:1 (1999) 55

b)
Fagus0 10 20 30 40 50 60 70 80 90 100
Fagus at present
Fagus at 2000
Fig. 1. Continued.
56
Fagus at 2500 B Fagus at 3000 BF
ECOGRAPHY 22;1 (1999)

H
Qu
r-l r t f
Fagus shows a clear pattern of spread from the east,and probably never became widespread in western Jut-land (Odgaard 1994). The proportion of Fagus in Danishforests increased continuously until 500 BP and subse-quently declined. A similar dynamic has been describedfrom southern Sweden (Malmstrom 1939, Bjorse et al.1996). AInus shows a constant loss of importance throughtime, with the greatest reductions in regions where Fagusbecomes important. Fagus avoids waterlogged soils, andthe inverse relationship between the two species suggeststhat a reduction in area of waterlogged soils has occurredthroughout the period under study.
Classification of European forest types
The neural network generated 32 forest types based oncalibrated Holocene pollen assemblages from Europe.Thirteen of these types were represented in Denmark inat least one of the seven time-slices selected for the study.The vector representations within each forest type of the10 major calibrated pollen taxa out of the total of 33 usedin the study are shown in Table 2. The types were namedaccording to the dominant taxon or group of taxa. Someof the Danish forest types include taxa that do not occurin Denmark today, and probably did not in the pasteither. With the exception of Abies in the Fagus type andJuniperus in the Tilia type, these exotic components neverexceed 10% of the type and arise because the forest typesare based on pollen data from all of Europe. Using thismethod a robust classification was developed that isapplicable throughout Europe, even though individualtaxa may be absent from parts of the range of eaeh foresttype (Huntley 1990b).
Forest type maps
The forest type maps summarise the major compositionalchanges that have occurred in Danish forests during thelast 3000 yr (Eig. 2). The dominant forest type 3000 yrago was the Alnus-Corylus type which comprised 94'Mi offorest cover. This was displaced during the subsequent2000 yr by two types with a major component of Fagussylvatica, {Fagus and Fagus-Quercus type). Each time-slice between 500 and 3000 BP was represented by 4-6forest types. The present-day pattern is diverse with 9mapped forest types. Fagus is the most abundant type,but comprises just under 40% of the forested area. Bycontrast the two Fagus types together represented 96%of the forested area at 500 BP.
Discussion
Major changes in forest composition
The maps are a good means of visuahsing the landscape-scale changes in forest composition that have occurred
ECOGRAPHY 22:1 (1999) 57

Fagus• n Fagus-QuercusI I QuercusI I Corylus
L___J Alnus-Corylus
I Ililia
AInus-Pinus
Picea-Pinus
Picea
Pinus
Pjcea-Pinus-Betula
Picea-Quercus
I ' I Pinus-Betula
• Site location
forest at 2000
forest at present
forest at 3000 BP
Fig. 2. Forest types occurring in Denmark at seven time-slices.
58 ECOGRAPHY 22:1 (1999)
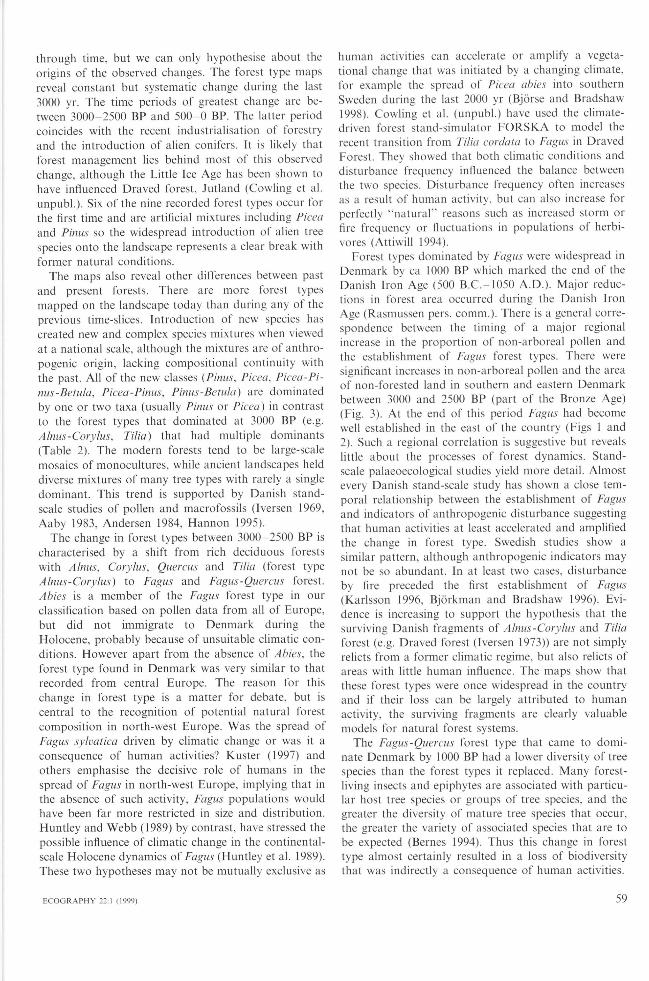
through time, but we can only hypothesise about theorigins of the observed changes. The forest type mapsreveal constant but systematic change during the last3000 yr. The time periods of greatest change are be-tween 3000-2500 BP and 500-0 BP. The latter periodcoincides with the recent industrialisation of forestryand the introduction of alien conifers. It is likely thatforest management lies behind most of tliis observedchange, although the Little Ice Age has been shown tohave influenced Draved forest, Jutland (Cowling et al.unpubl.). Six of the nine recorded forest types occur forthe first time and are artificial mixtures including Piceaand Pinus so the widespread introduction of alien treespecies onto the landscape represents a clear break withformer natural conditions.
The maps also reveal other differences between pastand present forests. There are more forest typesmapped on the landscape today than during any of theprevious time-slices. Introduction of new species hascreated new and complex species mixtures when viewedat a national scale, although the mixtures are of anthro-pogenic origin, lacking compositional continuity withthe past. All of the new classes (Pinus. Picea. Picea-Pi-nus-Betula, Picea-Pinus, Pinus-Betuia) are dominatedby one or two taxa (usually Pimis or Picea) in contrastto the forest types that dominated at 3000 BP (e.g.Alnus-Corylus, Tilia) that had multiple dominants(Table 2). The modern forests tend to be large-scalemosaics of monocultures, while ancient landscapes helddiverse mixtures of many tree types with rarely a singledominant. This trend is supported by Danish stand-scale studies of pollen and macrofossils (Iversen 1969,Aaby 1983, Andersen 1984, Hannon 1995).
The change in forest types between 3000-2500 BP ischaracterised by a shift from rich deciduous forestswith AInus, Corylus, Quercus and Tdia (forest typeAlnus-Corylus) to Fagus and Fagus-Quercus forest.Abies is a member of the Fagus forest type in ourclassification based on pollen data from all of Europe,but did not immigrate to Denmark during theHolocene, probably because of unsuitable climatic con-ditions. However apart from the absence of Abies, theforest type found in Denmark was very similar to thatrecorded from central Europe. The reason for thischange in forest type is a matter for debate, but iscentral to the recognition of potential natural forestcomposition in north-west Europe. Was the spread ofFagus sylvatica driven by climatic change or was it aconsequence of human activities? Kuster (1997) andothers emphasise the decisive role of humans in thespread of Fagus in north-west Europe, implying that inthe absence of such activity, Fagus populations wouldhave been far more restricted in size and distribution.Huntley and Webb (1989) by contrast, have stressed thepossible influence of climatic change in the continental-scale Holocene dynamics of Fagus (Huntley et al. 1989).These two hypotheses may not be mutually exclusive as
human activities can accelerate or amplify a vegeta-tional change that was initiated by a changing climate,for example the spread of Picea abies into southernSweden during the last 2000 yr (Bjorse and Bradshaw1998). Cowling et al. (unpubl.) have used the climate-driven forest stand-simulator EORSKA to model therecent transition from Tilia cordata to Fagus in DravedEorest. They showed that both climatic conditions anddisturbance frequency influenced the balance betweenthe two species. Disturbance frequency often increasesas a result of human activity, but can also increase forperfectly "natural" reasons such as increased storm orfire frequency or fluctuations in populations of herbi-vores (Attiwill 1994).
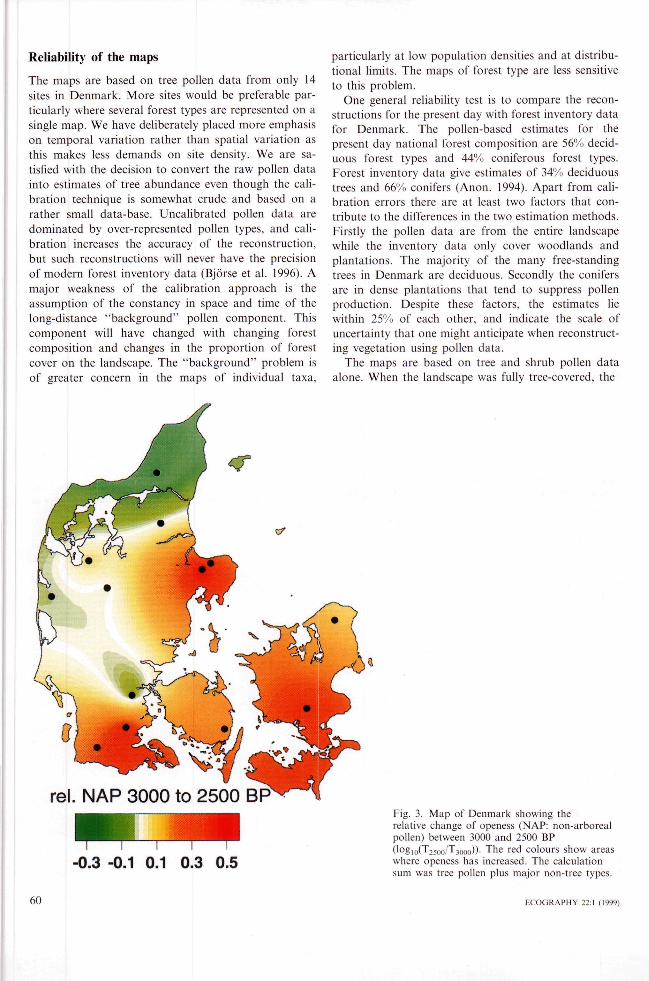
Eorest types dominated by Fagus were widespread inDenmark by ca 1000 BP which marked the end of theDanish Iron Age (500 B.C.-1050 A.D.). Major reduc-tions in forest area occurred during the Danish IronAge (Rasmussen pers. comm.). There is a general corre-spondence between the timing of a major regionalincrease in the proportion of non-arboreal pollen andthe establishment of Fagus forest types. There weresignificant increases in non-arboreal pollen and the areaof non-forested land in southern and eastern Denmarkbetween 3000 and 2500 BP (part of the Bronze Age)(Eig. 3). At the end of this period Fagus had becomewell established in the east of the country (Eigs 1 and2). Such a regional correlation is suggestive but revealslittle about the processes of forest dynamics. Stand-scale palaeoecological studies yield more detail. Almostevery Danish stand-scale study has shown a close tem-poral relationship between the establishment of Fagusand indicators of anthropogenic disturbance suggestingthat human activities at least accelerated and amplifiedthe change in forest type. Swedish studies show asimilar pattern, although anthropogenic indicators maynot be so abundant. In at least two cases, disturbanceby fire preceded the first establishment of Fagus(Karlsson 1996, Bjorkman and Bradshaw 1996). Evi-dence is increasing to support the hypothesis that thesurviving Danish fragments of Alnus-Corylus and Tiliaforest (e.g. Draved forest (Iversen 1973)) are not simplyrelicts from a former climatic regime, but also relicts ofareas with little human influence. The maps show thatthese forest types were once widespread in the countryand if their loss can be largely attributed to humanactivity, the surviving fragments are clearly valuablemodels for natural forest systems.
The Fagus-Quercus forest type that came to domi-nate Denmark by 1000 BP had a lower diversity of treespecies than the forest types it replaced. Many forest-living insects and epiphytes are associated with particu-lar host tree species or groups of tree species, and thegreater the diversity of mature tree species that occur,the greater the variety of associated species that are tobe expected (Bernes 1994). Thus this change in foresttype almost certainly resulted in a loss of biodiversitythat was indirectly a consequence of human activities.
ECOGR.'^PHY 22:1 (1999) 59
Reliability of the maps
The maps are based on tree pollen data from only 14sites in Denmark, More sites would be preferable par-ticularly where several forest types are represented on asingle map. We have deliberately placed more emphasison temporal variation rather than spatial variation asthis makes less demands on site density. We are sa-tisfied with the decision to convert the raw pollen datainto estimates of tree abundance even though the cali-bration technique is somewhat crude and based on arather small data-base, Uncalibrated pollen data aredominated by over-represented pollen types, and cali-bration increases the accuracy of the reconstruction,but such reconstructions will never have the precisionof modern forest inventory data (Bjorse et al, 1996), Amajor weakness of the calibration approach is theassumption of the constancy in space and time of thelong-distance "background" pollen component. Thiscomponent will have changed with changing forestcomposition and changes in the proportion of forestcover on the landscape. The "background" problem isof greater concern in the maps of individual taxa,
particularly at low population densities and at distribu-tional limits. The maps of forest type are less sensitiveto this problem.
One general reliability test is to compare the recon-structions for the present day with forest inventory datafor Denmark, The pollen-based estimates for thepresent day national forest composition are 56% decid-uous forest types and 44% coniferous forest types.Forest inventory data give estimates of 34% deciduoustrees and 66"/. conifers (Anon, 1994), Apart from cali-bration errors there are at least two factors that con-tribute to the differences in the two estimation methods.Firstly the pollen data are from the entire landscapewhile the inventory data only cover woodlands andplantations. The majority of the many free-standingtrees in Denmark are deciduous. Secondly the conifersare in dense plantations that tend to suppress pollenproduction. Despite these factors, the estimates liewithin 25% of each other, and indieate the scale ofuncertainty that one might anticipate when reconstruct-ing vegetation using pollen data.
The maps are based on tree and shrub pollen dataalone. When the landscape was fully tree-covered, the
rel. NAP 3000 to 2500 BP
-0.3 -0.1 0.1 0.3 0.5
Fig. 3. Map of Denmark showing therelative change of openess (NAP: non-arborealpollen) between 3000 and 2500 BP(log||,(T,5o,,/T3ooo))- The red colours show areaswhere openess has increased. The calculationsum was tree pollen plus major non-tree types.
60 ECOGRAPHY 22:1 (1999)

maps are a reasonably faithful representations of real-ity. As tree cover is removed the maps become potentialforest cover, where the surviving forest areas are ex-trapolated over the entire landscape. It is premature toestimate and map the extent of forest eover during thepast, as such estimates would require a high density ofsites and a better understanding of pollen representa-tion in open and half-open landscapes than is presentlyavailable (Gaillard et al, 1997), Plum (1989) estimatedforest (in the broadest sense) cover in Denmark to be20-25'^ around 1600 A,D, with a minimum of ca2-4% in 1805, The figures are likely to be far higherthan these for all the mapped time-slices except for thepresent day.
Conclusions
We conclude that the natural forest composition ofDenmark would be deciduous forest today with a sig-nificant presence of Fagus sylvatiea. Eormer humanaetivities have favoured Fagus at the expense of avaried mixture of tree species, from amongst whichTilia eordata and Ainus glutinosa have suffered thegreatest population reductions. Superimposed on thislong-term shift in forest types that has been acceleratedby human activity is recent plantation forestry usingprimarily exotic species. The result has been an almosteomplete break of compositional continuity with thepast that is unnatural and has posed problems forforest-dependent biota. Eorests such as Draved Skovwhere Tilia eordata has survived until the present timeare important reference sites. An increased use of spe-cies mixtures in forestry, with particular emphasis onspecies that were formerly abundant, would increaseforest biodiversity and move the landscape closer topotential natural conditions, Sueh a policy would helpachieve conservation goals but also ereate forests with aproven record of surviving the climatic changes thathave taken place earlier in the Holocene. Rapid climatechange is one potential threat facing managed forests ofthe future.
Acknowledgements - We wish to thank Bent Odgaard fororganising the Danish pollen data. The data comprised pub-lished and unpublished material held at the Geological Surveyof Denmark and Greenland that was contributed by BentAaby, Svend 'Elesterkob' Andersen, Harald Krogh, TageNilsson, Bent Odgaard, Peter Rasmussen and Per Walthers.All open access pollen data from the European Pollen Data-base were used to construct the forest types. We thank con-tributors to the database and the EU Environment programmefor its snpport. We thank Bjorn Berglund, Peter Eriis Moller,Ingmar Kronfeldt, Peter Rasmussen and Bent Odgaard forcomments and advice. Brian Huntley's comments as a refereewere valuable. The work was funded by the ELJ EAIR pro-gramme through project RENEORS (EAIR1-CT95-()42O), theSwedish Natural Science Research Council and the GeologicalSurvey of Denmark and Greenland.
ReferencesAaby, B, 198,3. Eorest development, soil genesis and human
activity illustrated by pollen and hypfia analysis of twoneighbouring podzols in Draved Eorest, Denmark. - Geol.Surv. Denm. II 114: l - f l 4 .
Andersen, S, T. 1970, The relative pollen productivity ofNorth European trees, and correction factors for treepollen spectra. - Geol, Surv. Denm. II 96: 1-99.
Andersen, S. T. 1984, Eorests at Lovenholm, Djursland, Den-mark at present and in the past. - Biol. Skr. Dan. Vid,Selsk. 24: 1-208.
Anon. 1994. Skove og plantager 1990. - Danmarks Statistikand Skov- and Naturstyrelsen,
Attiwill, P. M. 1994. The disturbance of forest ecosystems: theecological basis for conservation management. - Eor.Ecol. Manage, 63: 247-300.
Bennett, K. D. 1989. A provisional map of forest types for theBritish Isles 5000 years ago, - J. Quat, Sci, 4: 141-144,
Berglund, B. E. 1991. Pollen proxy data from the Nordiccountries. - In: Erenzcl, B. (ed,). Evaluation of climateproxy data in relation to the European Holocene. Eischer,pp. 29-36,
Bernes, C. 1994. Biological diversity in Sweden: a countrystudy. - Monitor Series No. 14, Statens naturvardsverk,Solna, Sweden.
Birks, H. J. B. 1989. Holocene isochrone maps and patterns oftree-sprcadine in the British Isles. - ,1. Biogeogr. 16: 503-540,
Birks, H. J. B., Deacon, ,1. and Peglar, S, 1975. Pollen mapsfor the British Isles 5000 years ago. - Proc, R. Soc. Lond,B. 189: 87-105.
Bjorkman, E, and Bradshaw, R, 1996, The immigration ofFagus sylvatica E. and Picea ahies L, into a natural foreststand in southern Sweden during the last 2000 years. - J.Biogeogr. 23: 235-244,
Bjorse, G, and Bradshaw, R. H, W. f998. 2000 years of forestdynamics in southern Sweden: suggestions for forest man-agement. - Eor. Ecol. Manage, 104: 15-26,
Bjorse, G., Bradshaw, R. H. W. and Michelson, D. B. 1996.Calibration of regional pollen data to construct maps offormer forest types in southern Sweden. - J. Palaeolimnol16: 67-78.
Bradshaw, R. H. W. 1981, Modern pollen-representation fac-tors for woods in south-east England. - J. Ecol. 69: 45-70.
Bradshaw, R. H. W., Gemmel, P. and Bjorkman, E, 1994.Development of nature-based silvicultural models in south-ern Sweden: the scientific background. - Eor. LandscapeRes. I: 95-110,
Davis, M. B. 1976, Pleistocene biogeography of temperatedeciduous forests. - Geoscience Man 13: 13-26.
Delcourt, P. A, and Delcourt H, R. 1981. Vegetation maps foreastern North America: 40,000 yr B.P, to the present. - In:Romans, R. C. (ed.). Geobotany II. Plenum Press, pp123-165.
Delcourt, P. A. and Delcourt, H. R. 1987. Eong-term forestdynamics of the temperate zone. - Ecol. Stud, 63.Springer.
Eranklin, ,1. E. 1993. Preserving biodiversity: species, ecosys-tems, or land.scapes? - Ecol. Appl. 3: 202-205.
Gaillard, M.-J., Brostrom, A, and Sugita, S. 1997. Quantifica-tion of landscape openness in the past inferred from pollendata. - European Res. Conf. on The Ecol. Setting ofEurope: from the past to the future. Impact of humans onthe environment of Europe since the end of the Ice Age,Castelvecchio Pascoli, Italy.
Hannon, G. 1995. Plant macrofossil analysis and the immigra-tion and extinction of tree species, - European Res. Conf.on The Ecol. Setting of Europe: from the past to thefuture. The establishment of plant and animal communitiesin Europe since the last glaciation, Ea Eonde les Maures,Erance,
Huntley, B. 1990a. European post-glacial forests: composi-tional changes in response to climatic change J VegSci, 1: 507-518.
ECOGRAPHY 22:1 (1999) 61

t-lunlley, B. 1990b. European vegetation history; paiaeovegeta-tion maps from pollen data - 13 OUO yr BP to present. -J. Quat. Sci. .r 10,V I22.
Huntley, B. and Birks, H. ,1. B. 1983. An atlas of past andpresent pollen maps for Europe; 0-13000 years ago. -Cambridge Univ. Press.
Huntley, B, and Webb, T. ttl 1989. Migration: species' re-sponse to climatic variations caused by changes in theearth's orbit. J. Biogeogr. 16; 5-19.
Huntley, B., Bartlein, P, J. and Prentice, I. C. 1989. CHmaticcontrol of the distribution and abundance of beech {FagusL.) in Europe and North America. - J. Biogeogr. 16;551-560.
tversen, J. 1969. Retrogressive development of a forest ecosys-tem demonstrated by pollen diagrams from fossil mor. -Oikos (suppl.) 12; 35-49.
Ivcrscn, J. 1973. The development of Denmark's nature sincethe last glacial. - Geol. Surv. of Denmark. V. Series. No.7-C. Geology of Denmark 111. C. A. Reitzels forlag,Copenhagen.
,lacobson, G. L. Jr., Webb, T. Ill and Grimm, E. C. 1987.Patterns and rates of vegetation change during the glacia-tioii of eastern North America. - In; Ruddiman, W. E.and Wright, H. E. Jr (eds). North America and the adja-eent oceans during the last deglaciation. The geology ofNorth America, K'-3. Geol. Soc. Am., pp. 277-287.
Karlsson, M. 1996. Vegetationshistoria for en artrik bokskog iHalland. M.Sc. thesis, Swedish Univ. of Agrieult. Sci.,Alnarp, Sweden,
Kohoncn, T. 1989. Self-organisation and associative memory.Springer.
Kuster, H. 1997. The role of farming in the postglacial expan-sion of beech and hornbeam in the oak woodlands ofcentral Europe. - The Holocene 7; 339-342.
Larsen, J, B. 1995. Ecological stability of forests and sustain-able silviculture. - Eor, Ecol. Manage, 73; 85-96.
Malmstrom, C. 1939. Hallands skogar under de senaste 300aren. - Medd. Statens Skogsforsoksanstalt 31; 171-300.
Odgaard, B, V. 1994. The Holocene vegetation history ofnorthern West .lutland, Denmark. Opera Bot. 123; 1-171.
Peterken, G. F. 1996. Natural woodland. Eeology and conser-vation in northern temperate regions, - Cambridge Univ.Press.
Plum, P. M. 1989. Udviklingcn i skovlovgivningen. - In;Naturen i skoven. Miljoministeriet, Skov-ogNatiirstyrelsen, Denmark, pp. 67-68.
Prentice, I. C , Berglund, B. E. and Olsson, T. 1987. Quantita-tive forest-composition sensing characteristics of pollensamples of Swedish lakes. - Boreas 16; 43-54,
Ralska-Jasiewiczowa, M. 1983. tsopollen maps for Poland;0-11000 years BP. New Phytol, 49; 133-175.
Sugita, S. 1994. Pollen representation of vegetation in Quater-nary sediments; theory and method in patchy veeetation. -J. Ecol. 82; 881 897.
Webb, T. Ill et al. 1981. Estimating plant abundances frompollen percentages; the use of rearession analysis. -Palaeobot. Palynol. 34; 269 300,
62 ECOGRAPtlY 22:1 (