Daniel Kong - Sustainable Cities Fall 2014 - Final Paper
19
Daniel Kong NYU Wagner Professor Carlos Restrepo Sustainable Cities, Fall 2014 Final Paper – Option A Through the examination of available indicators, it is possible to assess whether a city is moving towards longterm sustainability. This paper will focus on better understanding the longterm sustainability trajectory of the Lower Manhattan region. While it would be even more revealing to examine the entirety of Manhattan as a whole, because of its sheer size and complexity, as well as the constraints of this paper, one would be concerned its massive size may overwhelm our hope of making any meaningful observations. To clarify, the Lower Manhattan region consists of the remainder of Manhattan south of 14th Street. Utilizing economic, social, environmental, and composite indicators, Lower Manhattan will be evaluated for the various ways sustainability can be developed in a metropolitan area. Most references to such indicators will be taken from New York City’s current sustainability plan, PlaNYC. With the focus being on Lower Manhattan’s sustainability, PlaNYC will inform our understanding of what is taking place in Lower Manhattan and whether or not it will be sustainable in the longterm. PlaNYC was an initiative created by former Mayor Michael Bloomberg in 2007 to meet the needs of New York City in year 2030. These expected needs included accounting for the changing climate conditions, evolving economy, and aging infrastructure for its future 9.1 million residents. To be able to successfully prepare for such a daunting responsibility, Mayor Bloomberg coordinated the efforts of over 25 City agencies and experts from academia, businesses, and civic/community organizations. The Mayor’s Office of LongTerm Planning and Sustainability (OLTPS) would oversee the development of the
-
Upload
daniel-kong -
Category
Documents
-
view
125 -
download
0
Transcript of Daniel Kong - Sustainable Cities Fall 2014 - Final Paper
1
Daniel Kong NYU Wagner Professor Carlos Restrepo Sustainable Cities, Fall 2014
Final Paper – Option A
Through the examination of available indicators, it is possible to assess whether a
city is moving towards long-‐term sustainability. This paper will focus on better
understanding the long-‐term sustainability trajectory of the Lower Manhattan region.
While it would be even more revealing to examine the entirety of Manhattan as a whole,
because of its sheer size and complexity, as well as the constraints of this paper, one would
be concerned its massive size may overwhelm our hope of making any meaningful
observations. To clarify, the Lower Manhattan region consists of the remainder of
Manhattan south of 14th Street. Utilizing economic, social, environmental, and composite
indicators, Lower Manhattan will be evaluated for the various ways sustainability can be
developed in a metropolitan area. Most references to such indicators will be taken from
New York City’s current sustainability plan, PlaNYC. With the focus being on Lower
Manhattan’s sustainability, PlaNYC will inform our understanding of what is taking place in
Lower Manhattan and whether or not it will be sustainable in the long-‐term.
PlaNYC was an initiative created by former Mayor Michael Bloomberg in 2007 to
meet the needs of New York City in year 2030. These expected needs included accounting
for the changing climate conditions, evolving economy, and aging infrastructure for its
future 9.1 million residents. To be able to successfully prepare for such a daunting
responsibility, Mayor Bloomberg coordinated the efforts of over 25 City agencies and
experts from academia, businesses, and civic/community organizations. The Mayor’s Office
of Long-‐Term Planning and Sustainability (OLTPS) would oversee the development of the
2
initiative while working alongside with the Mayor’s Office of Recovery and Resiliency
(ORR) to ensure its implementation. To provide accountability to their plans while
remaining flexible to update and revise as necessary, the initiative mandated to develop
updates to their initiative every four years while also providing annual progress reports.1
Much of our understanding of the Lower East Side’s current state of sustainability will
come from these reports.
While traditional contributors to the issue of sustainability such as those in the non-‐
profit and private sectors will be cited, as mentioned, much reference will be made to
PlaNYC and New York City’s government. This is because of the influence that current
sustainability regulations and policies have over the general activity of the two non-‐public
fields. However, while PlaNYC will be discussed in much detail, it should be noted that this
paper would not be an exhaustive list of all projects nor even a list of all projects relevant to
the Lower Manhattan region, but rather a discussion of several select items that appear
most appropriate to identify.
ECONOMIC INDICATORS
Economic indicators provide a statistic to demonstrate the current and future
economic performances by a particular industry, sector, or for the purposes of this paper, a
city. Such indicators may often include, but are not limited to, areas such unemployment,
housing trends, inflation, and consumer activity. As intricate and complex as New York City
is, so should our expectation be of an initiative that will attempt to make any attempt to
affect any of the aforementioned indicators. PlaNYC currently targets ten areas of impact:
Housing and Neighborhoods, Parks and Public Spaces, Brownfields, Waterways, Water 1 "About PlaNYC." PlaNYC. Nyc.gov, n.d. Web. 09 Dec. 2014. 2 PlaNYC PROGRESS REPORT:Sustainability & Resiliency 2014. N.p.: City of New York, n.d. PlaNYC. Nyc.gov.
3
Supply, Transportation, Energy, Air Quality, Solid Waste, and Climate Change. The most
relevant of these areas for usage as an economic indicator may be the initiative’s work in
the Housing and Neighborhoods sector. According to its original plan, the Mayor’s
administration sought to create affordable and sustainable homes for the oncoming 1
million New Yorkers in 2030. This included the creation of 314,000 housing units, having
over 70% of them within a ½ mile of public transportation, and the preservation or
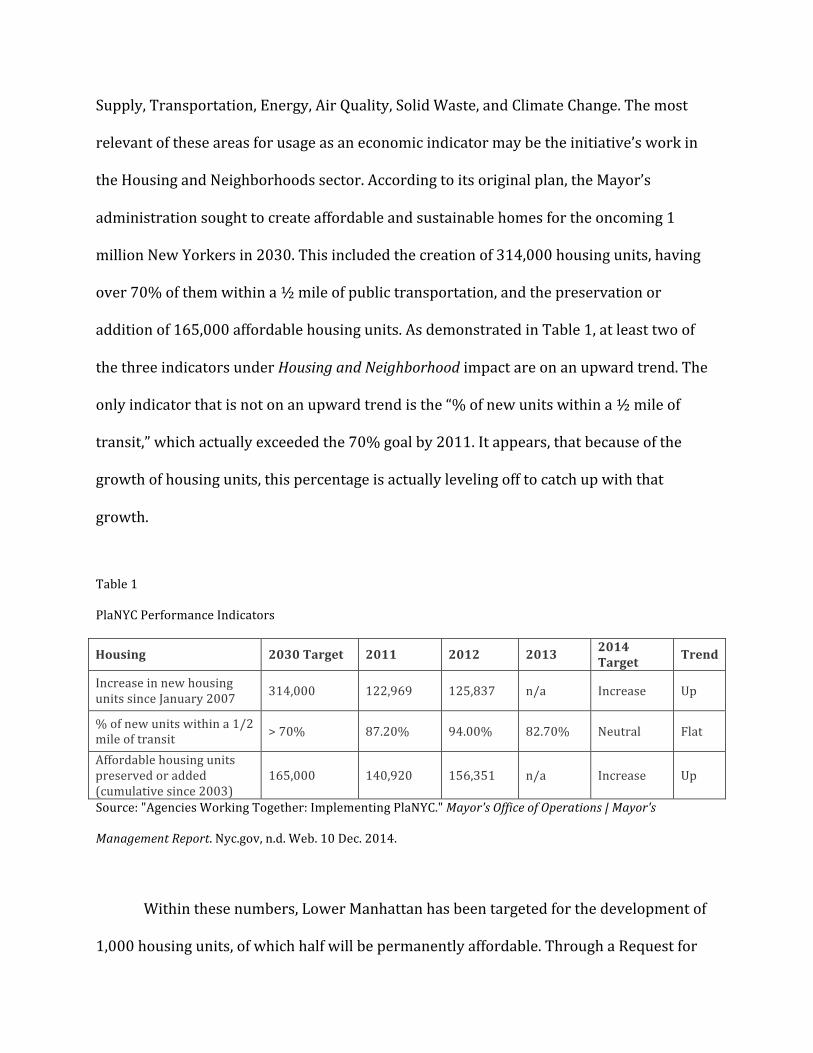
addition of 165,000 affordable housing units. As demonstrated in Table 1, at least two of
the three indicators under Housing and Neighborhood impact are on an upward trend. The
only indicator that is not on an upward trend is the “% of new units within a ½ mile of
transit,” which actually exceeded the 70% goal by 2011. It appears, that because of the
growth of housing units, this percentage is actually leveling off to catch up with that
growth.
Table 1
PlaNYC Performance Indicators
Housing 2030 Target 2011 2012 2013 2014 Target Trend
Increase in new housing units since January 2007 314,000 122,969 125,837 n/a Increase Up
% of new units within a 1/2 mile of transit > 70% 87.20% 94.00% 82.70% Neutral Flat
Affordable housing units preserved or added (cumulative since 2003)
165,000 140,920 156,351 n/a Increase Up
Source: "Agencies Working Together: Implementing PlaNYC." Mayor's Office of Operations | Mayor's
Management Report. Nyc.gov, n.d. Web. 10 Dec. 2014.
Within these numbers, Lower Manhattan has been targeted for the development of
1,000 housing units, of which half will be permanently affordable. Through a Request for
4
Proposal (RFP) that will impact the Seward Park area of the Lower East Side, this 1,000-‐
unit project was set to begin development in September 2013 but was indefinitely
postponed. With the project entitled “Essex Crossing,” it appears there may have been
challenges in having enough resources to both improve existing units while simultaneously
identify new units for the future. The initiative is working alongside the New York City
Housing Authority (NYCHA) to reevaluate their assets for this endeavor. Nonetheless, to
date, the initiative has been able to identify and begin work for underutilized locations in
Seward Park.2
A discussion of the government’s role in improving the economy of Lower
Manhattan would not be complete without identifying recovery efforts after Hurricane
Sandy. Given the devastation that was caused in 2012 upon citizens and businesses alike, it
would be absolutely critical to address the needs of those most impacted by the storm.
Working alongside New York City’s Economic Development Corporation (NYCEDC), PlaNYC
recently released RFPs for businesses, non-‐profit organizations and joint ventures to
participate in a $90 million competition to seek ideas to transform 5 areas in New York City
that were heavily impacted by Hurricane Sandy. With the goal of moving towards long-‐
term economic growth, South Manhattan has been designated as one of the five areas to
receive the City’s Community Development Block Grants for Disaster Relief. Titled the
“Neighborhood Game-‐Changer Investment Competition,” the competition also has elements
of the traditional public-‐private partnerships as it intends to translate private investments
into various benefits for the most affected neighborhoods. These benefits would include
2 PlaNYC PROGRESS REPORT:Sustainability & Resiliency 2014. N.p.: City of New York, n.d. PlaNYC. Nyc.gov. Web. 10 Dec. 2014.., 35.
5
job-‐creation, community development, improving accessibility, and generating economic
activity, particularly in demand for goods and services.3
SOCIAL INDICATORS
Social indicators, like economic indicators, also provide a statistic of performance
but rather than pertaining to measures of the economy, primarily involve areas of social
concern such as human well-‐being or the quality of life. In some instances, it may seem that
the two types of indicators overlap. This is because it would be difficult to argue that they
are mutually exclusive and play no role in affecting one other. In fact, quality of life can
definitely affect the economic robustness and vice versa. However, for the purposes of this
paper, social indicators will refer primarily to the quality of life, equality among diverse
people groups, and social welfare.
While New York City may possibly be the most diverse city in the world, it is not
without its need for improving its progress in social justice and equality. Within PlaNYC, an
area that has provided much opportunity for measuring social indicators has been the
city’s work in improving Brownfield locations. Upon surveying the existence of
Brownfields, PlaNYC found that many Brownfields were actually located in typically low-‐
income communities. This seemingly harmless scenario has led to two major problems that
have now garnered the attention of the initiative. The first challenge was to address
communities that contained contaminated and untreated brownfields. Neighborhoods that
have been homes to such fields have missed out on the possibility for available spaces that
could be utilized for affordable housing as well as businesses that would generate new jobs
for locals. A second challenge has been the economic effect that a contaminated and 3 "NYCEDC Announces $90 Million "Game-‐Changer" Competition to Create Economic Growth in Neighborhoods Impacted by Hurricane Sandy." Press Releases. Nycedc.com, n.d. Web. 10 Dec. 2014.
6
unattractive brownfield would have on its local community. Such communities face a
disproportionate amount of economic dampening and historically end up being at a
disadvantage, suffering from geographic and social inequality. 4
According to New York City’s Office of Environmental Remediation (OER), which is
overseeing the Brownfield Cleanup Program (BCP), it is currently in the process of
redeveloping over 500 properties, where about 70% include historically underserved
neighborhoods. OER has estimated that these projects may eventually lead to 16 million
square feet of new building space, 3,900 new units of affordable housing, and 6,400
permanent new jobs that will result from the hundreds of new businesses that may arise. 5
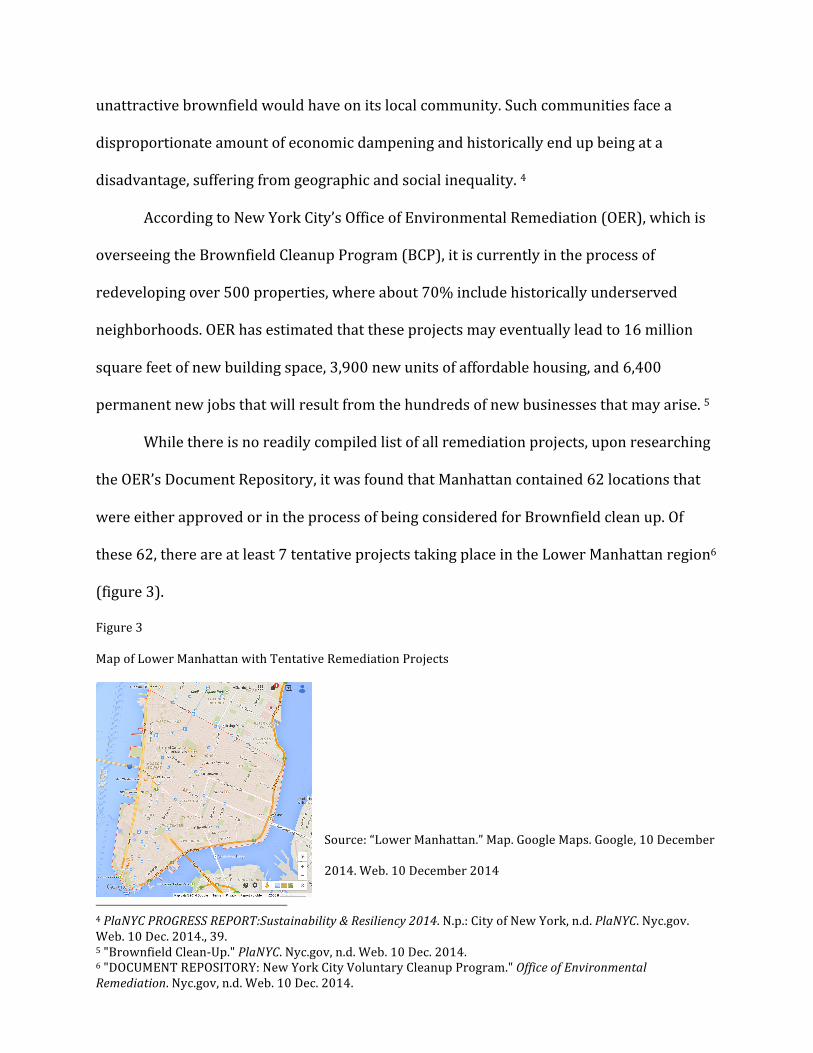
While there is no readily compiled list of all remediation projects, upon researching
the OER’s Document Repository, it was found that Manhattan contained 62 locations that
were either approved or in the process of being considered for Brownfield clean up. Of
these 62, there are at least 7 tentative projects taking place in the Lower Manhattan region6
(figure 3).
Figure 3
Map of Lower Manhattan with Tentative Remediation Projects
Source: “Lower Manhattan.” Map. Google Maps. Google, 10 December
2014. Web. 10 December 2014
4 PlaNYC PROGRESS REPORT:Sustainability & Resiliency 2014. N.p.: City of New York, n.d. PlaNYC. Nyc.gov. Web. 10 Dec. 2014., 39. 5 "Brownfield Clean-‐Up." PlaNYC. Nyc.gov, n.d. Web. 10 Dec. 2014. 6 "DOCUMENT REPOSITORY: New York City Voluntary Cleanup Program." Office of Environmental Remediation. Nyc.gov, n.d. Web. 10 Dec. 2014.
7
While most Brownfield remediation projects are currently taking place outside of
Manhattan, the initiative has sparked a sustainable usage of the clean soil that is being
excavated from the targeted sites. Rather than transporting the excavated soil to quarries
outside New York City, OER has created the NYC Clean Soil Bank to allow local public and
private developers to take advantage of this newly dugout soil. By recycling this soil, there
will be decreases in the financial costs of trucking out and trucking in soil. As for
environmental and social costs, there will be less soil that is traditionally hauled to inner-‐
city, open-‐air soil transfer stations. These stations attract high truck congestion, exhaust,
dust and debris, and create environments, which are detrimental to the well-‐being of the
local communities. Thus recycled soil has the possibility of reducing the disproportionate
negative effects that continue to weigh on these disadvantaged neighborhoods. 7
While Lower Manhattan may not be the recipient of much Brownfield work,
developers within this downtown region may benefit from a lower rate than they would
usually pay for out-‐of-‐city soil and simultaneously benefit communities who have
traditionally bore the brunt of the negative externalities from imported/exported soil.
According to the OER, developers who participate in recycling brownfield soil may help
save the City save around $50,000 to $100,000 per brownfield development project.8 These
savings to cost and environment make brownfield development all the more appealing and
as mentioned, will result in greater social benefits for the communities they inhabit.
ENVIRONMENTAL INDICATORS
Environmental indicators generally refer to measures of humanity’s effects on the
integrity of its natural environment. Involving factors such as air quality, land preservation, 7 "NYC Clean Soil Bank." Office of Environmental Remediation. Nyc.gov, n.d. Web. 10 Dec. 2014. 8 Ibid
8
water and energy conservation, and waste generation, a common trend in recent years has
also been the idea of going “green.” For the purposes of this paper, environmental
indicators will refer to such measures as well as Lower Manhattan’s progress towards
becoming a “green” community. Given the large size of Lower Manhattan and the
impracticality of generalizing its environmental impact amidst such a diverse population of
people, this paper will only examine a few aspects of the PlaNYC as well as a few local
initiatives to improve its sustainability.
While PlaNYC includes a number of indicators that will measure the initiative’s
ability to create economically and socially sustainably impacts, it is most known for its goal
of making New York City more environmentally sustainable. In fact, as per the City, all of
the 10 aforementioned goals of Mayor Bloomberg’s original plans were to eventually
culminate in a citywide gas emission reduction of 30% by 2030.9 As will be discussed later
on, this plan now intends to stretch to 2050 with emission reductions by 80%.
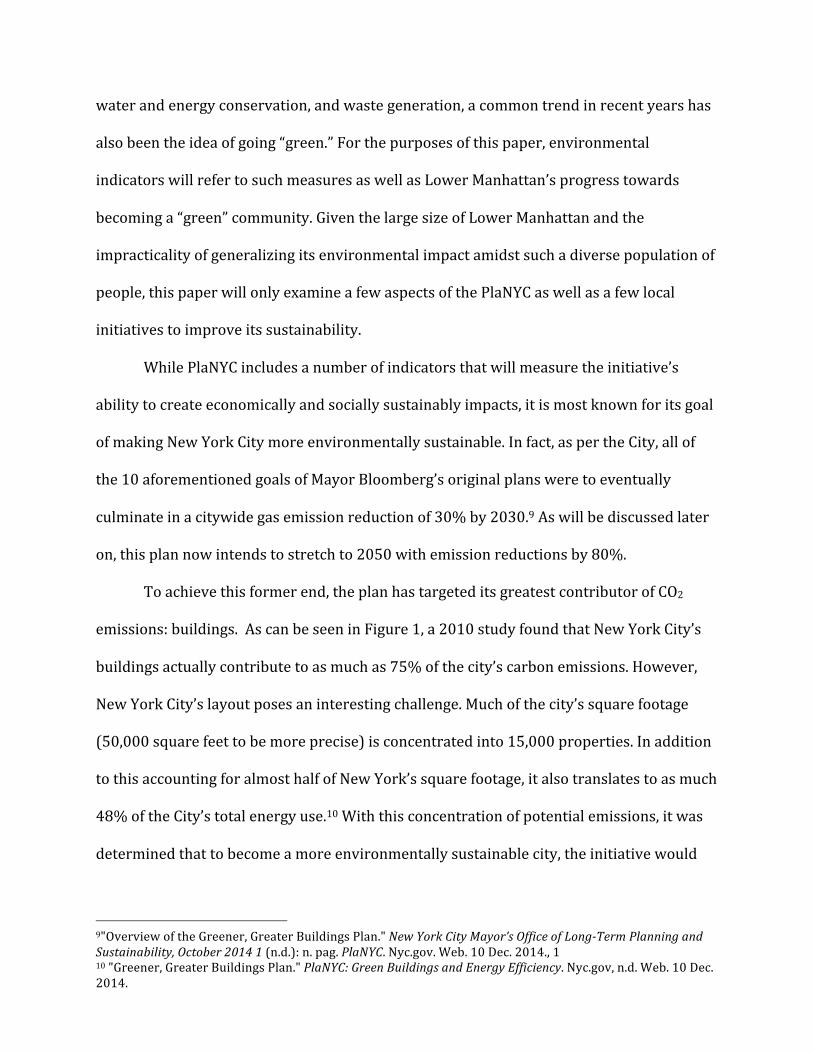
To achieve this former end, the plan has targeted its greatest contributor of CO2
emissions: buildings. As can be seen in Figure 1, a 2010 study found that New York City’s
buildings actually contribute to as much as 75% of the city’s carbon emissions. However,
New York City’s layout poses an interesting challenge. Much of the city’s square footage
(50,000 square feet to be more precise) is concentrated into 15,000 properties. In addition
to this accounting for almost half of New York’s square footage, it also translates to as much
48% of the City’s total energy use.10 With this concentration of potential emissions, it was
determined that to become a more environmentally sustainable city, the initiative would
9"Overview of the Greener, Greater Buildings Plan." New York City Mayor’s Office of Long-‐Term Planning and Sustainability, October 2014 1 (n.d.): n. pag. PlaNYC. Nyc.gov. Web. 10 Dec. 2014., 1 10 "Greener, Greater Buildings Plan." PlaNYC: Green Buildings and Energy Efficiency. Nyc.gov, n.d. Web. 10 Dec. 2014.
9
require more than just improving how we construct and renovate new buildings. But there
needed to be extra effort to address the ones already existing.
Figure 1
2010 Citywide CO2 Emissions by Sector
Source: "Overview of the Greener, Greater Buildings Plan." New York City Mayor’s Office of Long-‐Term
Planning and Sustainability, October 2014 1 (n.d.): n. pag. PlaNYC. Nyc.gov. Web. 10 Dec. 2014.
This extra effort would be known as the Greener, Greater Buildings Plan (GGBP).
With the main goal of creating energy transparency, it currently consists of four main
components: meeting New York State’s energy codes, annual benchmark data reporting,
energy auditing every ten years, and finally lighting and sub-‐metering upgrades of large
non-‐residential spaces.11 In the process of achieving energy transparency, PlaNYC believes
that this package of policies will have various economic and social benefits for New York
City. These benefits would come in the form of thousands of construction-‐related jobs,
financial benefits for building owners, as well as the reduction of air pollution from lower
energy usage.12
11 "Overview of the Greener, Greater Buildings Plan." New York City Mayor’s Office of Long-‐Term Planning and Sustainability, October 2014 1 (n.d.): n. pag. PlaNYC. Nyc.gov. Web. 10 Dec. 2014., 2 12 Ibid., 3
10
To help facilitate a greener Lower Manhattan, the Alliance for Downtown New York
(also known as the “Downtown Alliance”) offers a number of statistics and resources for
business owners, tenants, and visitors interested in supporting an environmentally
sustainable downtown district. Lower Manhattan is currently home to almost 5 million
square feet of green real estate. This includes Leadership in Energy and Environmental
Design (LEED) certified and EnergyStar rated spaces.13 The Downtown Alliance currently
manages the Downtown-‐Lower Manhattan Business Improvement District (BID) and
visitors to Lower Manhattan can be directed to green-‐minded organizations, a listing of
green real estate, and even a green toolkit for tenants.14
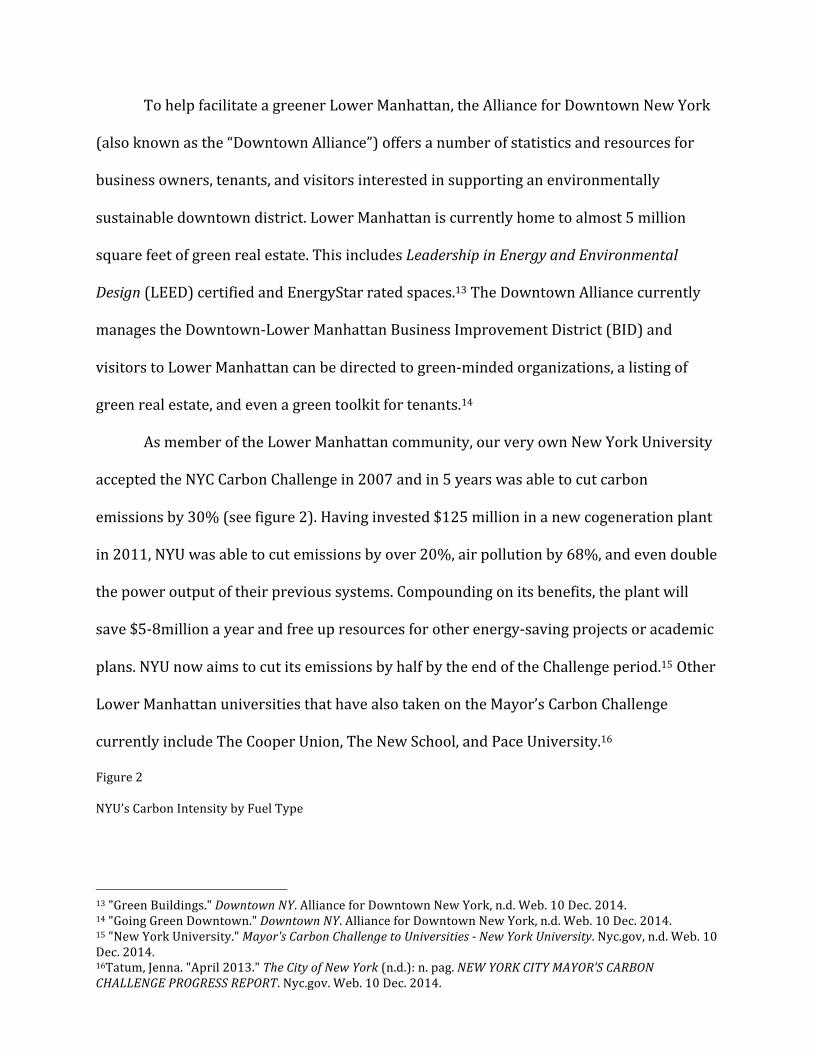
As member of the Lower Manhattan community, our very own New York University
accepted the NYC Carbon Challenge in 2007 and in 5 years was able to cut carbon
emissions by 30% (see figure 2). Having invested $125 million in a new cogeneration plant
in 2011, NYU was able to cut emissions by over 20%, air pollution by 68%, and even double
the power output of their previous systems. Compounding on its benefits, the plant will
save $5-‐8million a year and free up resources for other energy-‐saving projects or academic
plans. NYU now aims to cut its emissions by half by the end of the Challenge period.15 Other
Lower Manhattan universities that have also taken on the Mayor’s Carbon Challenge
currently include The Cooper Union, The New School, and Pace University.16
Figure 2
NYU’s Carbon Intensity by Fuel Type
13 "Green Buildings." Downtown NY. Alliance for Downtown New York, n.d. Web. 10 Dec. 2014. 14 "Going Green Downtown." Downtown NY. Alliance for Downtown New York, n.d. Web. 10 Dec. 2014. 15 "New York University." Mayor's Carbon Challenge to Universities -‐ New York University. Nyc.gov, n.d. Web. 10 Dec. 2014. 16Tatum, Jenna. "April 2013." The City of New York (n.d.): n. pag. NEW YORK CITY MAYOR’S CARBON CHALLENGE PROGRESS REPORT. Nyc.gov. Web. 10 Dec. 2014.
11
Source: "New York University." Mayor's Carbon Challenge to Universities -‐ New York University. Nyc.gov, n.d.
Web. 10 Dec. 2014.
Just on the other side of 4th Street, the “Model Block Project” also stands as
testament to how a community under the direction of public-‐private partnerships can band
together to create an entirely environmentally sustainable city street. Conceived by former
Manhattan Borough President Scott Stringer in 2011, the Model Block Project, as a result of
his Go Green Lower East Side Campaign, offered low-‐income residents along East 4th Street
the opportunity to weatherize their roofs to reduce cooling costs in the summer and
receive State-‐sponsored energy-‐efficient appliances.17 Partnering with dozens of non-‐
profit, private, and public organizations and leaders, Stringer’s goal was to drastically
reduce energy consumption and minimize electricity use for an entire city block. If
successful, it would act as model for other low-‐income portions of the city. For low-‐income
neighborhoods, instituting such sustainable practices wherever possible not only provide
positive environmental benefits, but also act as vital steps towards preserving the low costs
that sustain low-‐income housing.
17 "Going Green Adds up to Saving Green on E. 4th St. Block." The Villager Newspaper. Thevillager.com, n.d. Web. 10 Dec. 2014.
12
COMPOSITE INDICATORS
Being that Composite Indicators involve combining a variety of multiple data sets
and indicators, it would seem that they would be the most relevant and ideal for usage in a
metropolitan region as complex and interconnected as Lower Manhattan. This did not
seem to be the case as implied by the lack of readily available data that discussed such
indicators for the region in question. As mentioned during class, the Human Development
Index and the Ecological Footprint are typical examples of such composite indicators that
have been developed in recent years. Some may argue that because of the recent inception
of these tools as well as the still-‐developing science of better understanding our
environmental impact, it would be safe to expect that such indicators for a region as
specific as Lower Manhattan may not be as readily available as for a region such as Boston
or Philadelphia. This is understandable since Lower Manhattan is neither a city nor is
considered a major metropolitan region distinguished apart from New York City.
Fortunately, one tool was found that would be able to isolate environmental impact
information that was as location-‐specific as zip codes.
At the University of California, Berkley’s Renewable and Appropriate Energy Lab, a
research consortium known as the CoolClimate Network (CCN) has been developed to
provide user-‐friendly carbon footprint management tools. This consortium includes
environmental boards throughout the country, the World Wildlife Fund, for-‐profit partners,
and even some international organizations. Utilizing national household survey
information, one of the tools CCN has created has been a Carbon Footprint Map that
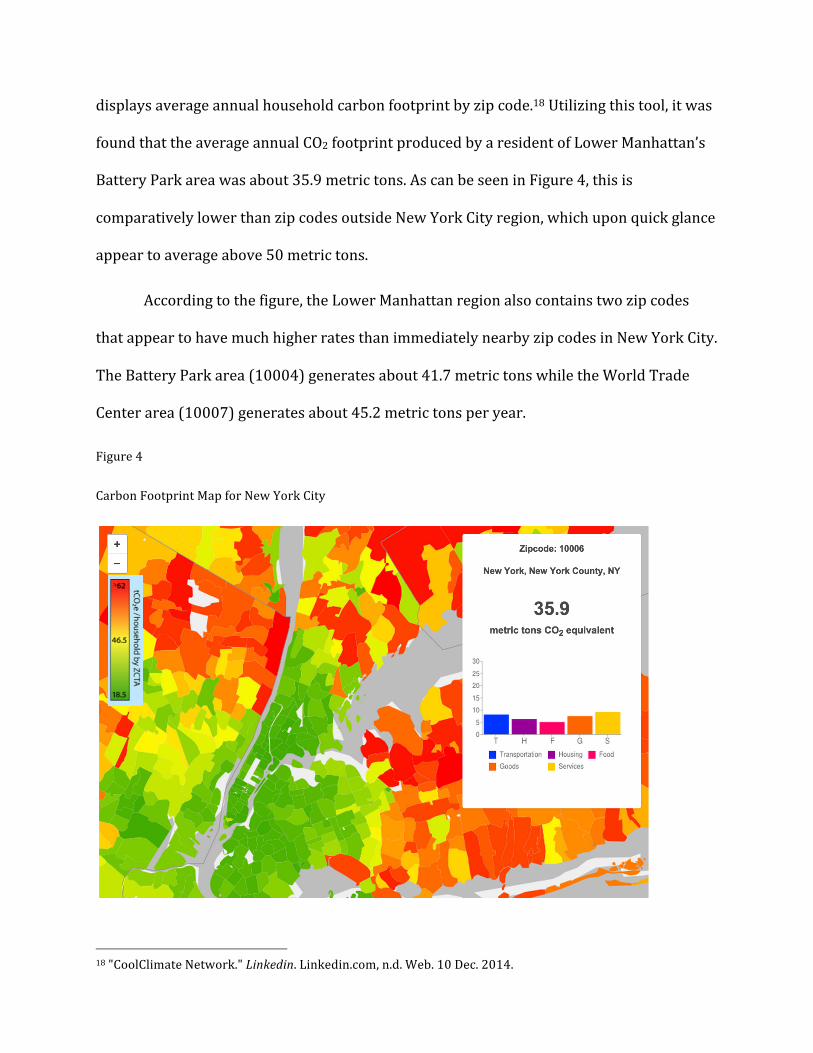
13
displays average annual household carbon footprint by zip code.18 Utilizing this tool, it was
found that the average annual CO2 footprint produced by a resident of Lower Manhattan’s
Battery Park area was about 35.9 metric tons. As can be seen in Figure 4, this is
comparatively lower than zip codes outside New York City region, which upon quick glance
appear to average above 50 metric tons.
According to the figure, the Lower Manhattan region also contains two zip codes
that appear to have much higher rates than immediately nearby zip codes in New York City.
The Battery Park area (10004) generates about 41.7 metric tons while the World Trade
Center area (10007) generates about 45.2 metric tons per year.
Figure 4
Carbon Footprint Map for New York City
18 "CoolClimate Network." Linkedin. Linkedin.com, n.d. Web. 10 Dec. 2014.
14
Source: Source: UC Berkeley CoolClimate Network, Average Annual Household Carbon Footprint (2013).
DISCUSSION AND CONCLUSION
In a city as diverse and developed as NYC, it would be difficult to confidently
propose any obvious data gaps. With enough research, one could most likely find any type
of data in question. In fact, it may even be unsettling as to how thorough and to the level of
minutiae some data can be. While data gaps may not be the most immediate challenge,
perhaps the gap to narrow would be the accessibility and ease of finding data on New York
City's sustainability efforts. It is not uncommon to hear how difficult it can be to navigate
the City's bureaucratic system to find answers. This difficulty seemed to also lend itself to
the City's online system while trying to navigate it for further elaboration to issues raised
during the writing of this paper. If it was as difficult as it was for a relatively computer-‐
savvy, candidate of a Master’s Degree in Public Administration, one can only imagine how
much more difficult it may be for the average citizen to navigate the City's online system,
let alone find ways to participate in its sustainability efforts.
A specific challenge in utilizing available PlaNYC’s information has been its lack of
specific data regarding the whereabouts of its impact. While the annual Progress Reports
mention various statistics and percentages, there is no indication of the specific locations of
some of these impacts. For example, while the report mentions specific projects such as the
adAPT NYC Competition to design the best micro-‐unit apartment complex, the
MillionTreesNYC project to develop our urban forest, and the Green Owner Nights events
to inform small and medium business owners about best “green” practices, it was only
through individually searching each project online that more information about where they
have been taking place and their specific details could be found. For less computer savvy
15
readers, it may have been helpful to provide a simple link for each of the projects listed so
as not to lose the engagement of potential supporters.
Thus, perhaps in the case of a very developed metropolitan area such as New York
City, a vital inquiry of data could be for the perception of its citizens regarding the ease of
joining the sustainability goals of its city. While it can be suggested that this facilitation of
civil involvement can be managed by non-‐profit and public service organizations
traditionally expected to drive such goals, it should be noted how surprisingly difficult it
was to even find such organizations in New York City at all.
As it stands, in New York City, it seems that much of the drive for sustainability is
being generated from the City’s government whereby its framework is extending outward
to include participation from local stakeholders. Thus it is not uncommon to find that many
non-‐governmental major sustainability initiatives, such as the $125 million cogeneration
plant owned by NYU, are those that have taken advantage of the City’s various participatory
mechanisms, such as the Mayor’s Carbon Challenge.
This past September, Mayor Bill de Blasio ambitiously declared that New York City
would commit to reducing its carbon emission by 80% (of 2005 emission levels) by 2050.
Initially targeting all government and public buildings, the Mayor intends to retrofit these
3,000 buildings within the next ten years. This will lead to an additional decrease by 10%
of building-‐based greenhouse gas emissions and savings of $8.5 billion in energy within
this span of ten years. It is believed that such a trajectory may also provide up to 3,500
additional jobs in the construction and energy sector.19 While at first glance, this may seem
too ambitious to believe can actually happen, remembering that since 2007, 97% of the
19 "Mayor De Blasio Commits to 80 Percent Reduction of Greenhouse Gas Emissions by 2050." The Official Website of the City of New York NYC. Nyc.gov, 21 Sept. 2014. Web. 10 Dec. 2014.
16
plan’s 127 initiatives were launched within its first year and almost two thirds were
achieved before 2009 can be quite reassuring in the capabilities of our City.20
From researching the various stakeholders and projects that are currently involved
in creating a sustainable Lower Manhattan, it was visible to see that this unique region of
New York City was in good standing towards a long-‐tern sustainable future. While PlaNYC
has provided an adequate framework to guide New York’s sustainability plans, initiatives
and projects continue to emerge from the most local level. Whether in the area of
economic, environmental, or social plans, this level of involvement is believed to be the
most vital to helping long-‐term plan remain and stay its course.
Regarding PlaNYC, it seems that the greatest indicators that Lower Manhattan will
become sustainable has been the various levels of engagement and opportunity the
initiative has provided for its citizens. A very apt example would be the aforementioned
“Neighborhood Game-‐Changer Investment Competition” sponsored by the NYCEDC.
Whether in international development projects or local economic development, I have
learned during my educational experience at Wagner that a decentralized approach that
incorporates community-‐level ideas into the planning process, while also including local
capacity into its implementation has a greater chance of sustainability than a project that
has been remotely planned and top-‐down implemented.
20 "MAYOR BLOOMBERG PRESENTS AN UPDATE TO PLANYC: A GREENER, GREATER NEW YORK." News from the Blueroom. NYC.gov, n.d. Web. 10 Dec. 2014.
17
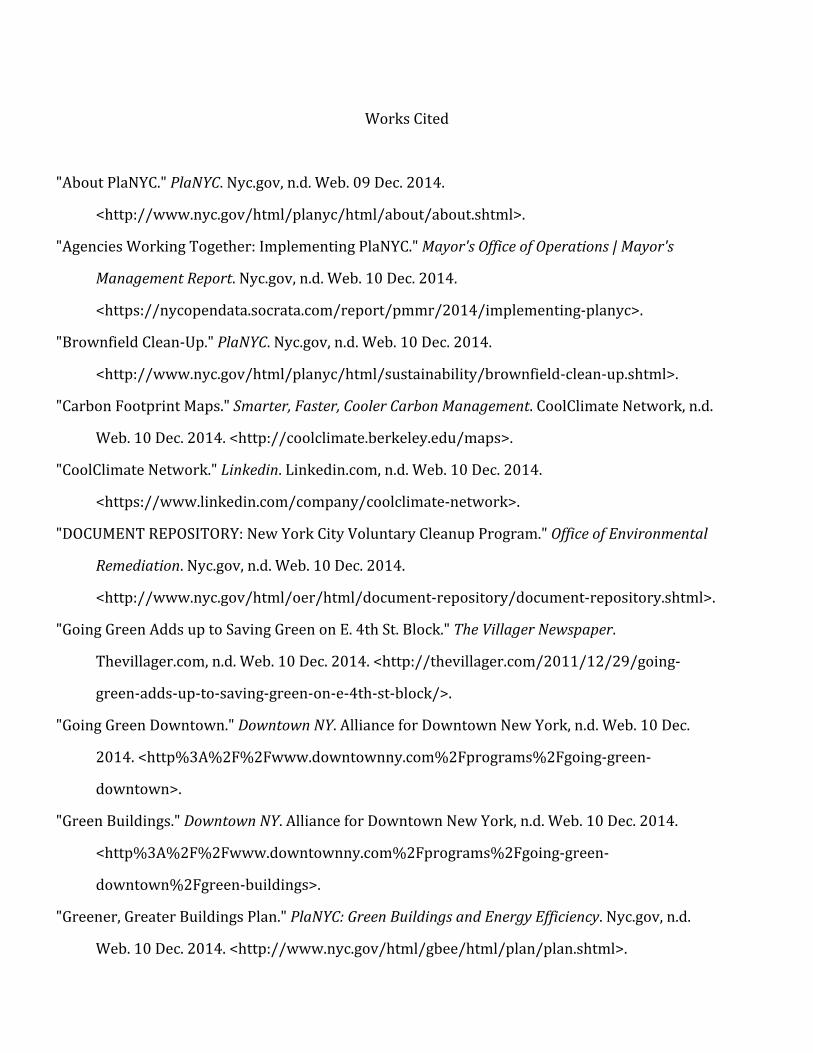
Works Cited
"About PlaNYC." PlaNYC. Nyc.gov, n.d. Web. 09 Dec. 2014.
<http://www.nyc.gov/html/planyc/html/about/about.shtml>.
"Agencies Working Together: Implementing PlaNYC." Mayor's Office of Operations | Mayor's
Management Report. Nyc.gov, n.d. Web. 10 Dec. 2014.
<https://nycopendata.socrata.com/report/pmmr/2014/implementing-‐planyc>.
"Brownfield Clean-‐Up." PlaNYC. Nyc.gov, n.d. Web. 10 Dec. 2014.
<http://www.nyc.gov/html/planyc/html/sustainability/brownfield-‐clean-‐up.shtml>.
"Carbon Footprint Maps." Smarter, Faster, Cooler Carbon Management. CoolClimate Network, n.d.
Web. 10 Dec. 2014. <http://coolclimate.berkeley.edu/maps>.
"CoolClimate Network." Linkedin. Linkedin.com, n.d. Web. 10 Dec. 2014.
<https://www.linkedin.com/company/coolclimate-‐network>.
"DOCUMENT REPOSITORY: New York City Voluntary Cleanup Program." Office of Environmental
Remediation. Nyc.gov, n.d. Web. 10 Dec. 2014.
<http://www.nyc.gov/html/oer/html/document-‐repository/document-‐repository.shtml>.
"Going Green Adds up to Saving Green on E. 4th St. Block." The Villager Newspaper.
Thevillager.com, n.d. Web. 10 Dec. 2014. <http://thevillager.com/2011/12/29/going-‐
green-‐adds-‐up-‐to-‐saving-‐green-‐on-‐e-‐4th-‐st-‐block/>.
"Going Green Downtown." Downtown NY. Alliance for Downtown New York, n.d. Web. 10 Dec.
2014. <http%3A%2F%2Fwww.downtownny.com%2Fprograms%2Fgoing-‐green-‐
downtown>.
"Green Buildings." Downtown NY. Alliance for Downtown New York, n.d. Web. 10 Dec. 2014.
<http%3A%2F%2Fwww.downtownny.com%2Fprograms%2Fgoing-‐green-‐
downtown%2Fgreen-‐buildings>.
"Greener, Greater Buildings Plan." PlaNYC: Green Buildings and Energy Efficiency. Nyc.gov, n.d.
Web. 10 Dec. 2014. <http://www.nyc.gov/html/gbee/html/plan/plan.shtml>.
18
"MAYOR BLOOMBERG PRESENTS AN UPDATE TO PLANYC: A GREENER, GREATER NEW
YORK." News from the Blueroom. NYC.gov, n.d. Web. 10 Dec. 2014.
<http://www.nyc.gov/portal/site/nycgov/menuitem.c0935b9a57bb4ef3daf2f1c701c789a
0/index.jsp?pageID=mayor_press_release&catID=1194&doc_name=http%3A%2F%2Fww
w.nyc.gov%2Fhtml%2Fom%2Fhtml%2F2011a%2Fpr129-‐
11.html&cc=unused1978&rc=1194&ndi=1>.
"Mayor De Blasio Commits to 80 Percent Reduction of Greenhouse Gas Emissions by 2050." The
Official Website of the City of New York NYC. Nyc.gov, 21 Sept. 2014. Web. 10 Dec. 2014.
<http://www1.nyc.gov/office-‐of-‐the-‐mayor/news/451-‐14/mayor-‐de-‐blasio-‐commits-‐80-‐
percent-‐reduction-‐greenhouse-‐gas-‐emissions-‐2050-‐starting-‐with#/0>.
"New York University." Mayor's Carbon Challenge to Universities -‐ New York University. Nyc.gov,
n.d. Web. 10 Dec. 2014. <http://www.nyc.gov/html/gbee/html/challenge/nyu.shtml>.
"NYC Clean Soil Bank." Office of Environmental Remediation. Nyc.gov, n.d. Web. 10 Dec. 2014.
<http://www.nyc.gov/html/oer/html/nyc-‐clean-‐soil-‐bank/nyc-‐clean-‐soil-‐bank.shtml>.
"NYCEDC Announces $90 Million "Game-‐Changer" Competition to Create Economic Growth in
Neighborhoods Impacted by Hurricane Sandy." Press Releases. Nycedc.com, n.d. Web. 10
Dec. 2014. <http://www.nycedc.com/press-‐release/nycedc-‐announces-‐90-‐million-‐game-‐
changer-‐competition-‐create-‐economic-‐growth>.
"Overview of the Greener, Greater Buildings Plan." New York City Mayor’s Office of Long-‐Term
Planning and Sustainability, October 2014 1 (n.d.): n. pag. PlaNYC. Nyc.gov. Web. 10 Dec.
2014.
<http://www.nyc.gov/html/gbee/downloads/pdf/greener_greater_buildings_plan.pdf>.
PlaNYC PROGRESS REPORT:Sustainability & Resiliency 2014. N.p.: City of New York, n.d. PlaNYC.
Nyc.gov. Web. 10 Dec. 2014.
<http://www.nyc.gov/html/planyc2030/downloads/pdf/140422_PlaNYCP-‐
Report_FINAL_Web.pdf>.
Tatum, Jenna. "April 2013." The City of New York (n.d.): n. pag. NEW YORK CITY MAYOR’S CARBON
CHALLENGE PROGRESS REPORT. Nyc.gov. Web. 10 Dec. 2014.

19
<http://www.nyc.gov/html/gbee/downloads/pdf/mayors_carbon_challenge_progress_rep
ort.pdf>.