Danger in the Air -...
61
Danger in the Air: Unhealthy Air Days in 2010 and 2011 SEPTEMBER 2011
Transcript of Danger in the Air -...

Danger in the Air:Unhealthy Air Days in 2010 and 2011
SEPTEMBER 2011

2

3
Danger in the Air: Unhealthy Air Days in 2010 and 2011
Courtney Abrams,Environment America
Research & Policy Center
September 2011

4
Acknowledgements
The author wishes to thank Tony Dutzik of Frontier Group and Ann Weeks and John Graham of the Clean Air Task Force for their review of this report. The author also wishes to thank David Mintz of the Air Quality Analysis Group of the Office of Air Quality Planning and Standards at the U.S. Environmental Protection Agency, Nathan Willcox and Lauren Randall of Environment America Research & Policy Center and Breanna Becker for their assistance.
Environment America Research & Policy Center is grateful to the New York Community Trust for making this report possible.
The author bears responsibility for any factual errors. The recommendations and views expressed in this report are those of Environment America Research & Policy Center and do not necessarily reflect the views of our funders or those who provided review.
© 2011 Environment America Research & Policy Center
Environment America Research & Policy Center is a 501(c)(3) organization. We are dedicated to protecting America’s air, water and open spaces. We investigate problems, craft solutions, educate the public and decision makers, and help Americans make their voices heard in local, state and national debates over the quality of our environment and our lives. For more information about Environment America Research & Policy Center, please visit www.environmentamerica.org/center.
Cover photo: “Downtown Los Angeles, as seen from the Getty Center,” credit: Asparagirl, Creative Commons; and “Silhouette of Asthma,” credit: themohers, Creative Commons. Design and Layout: Caroline Herr Design

5
Table of Contents
Executive Summary 1
Smog Pollution Threatens Public Health 4
Sources of Smog Pollution 6
Standards Must Be Set to Protect Public Health 7 National Health Standard for Ozone 7 Alerting the Public: Air Quality Index 7
Report Findings 9 The Smoggiest Metropolitan Areas in 2010 9 National Rankings 9 Rankings By Population Size 10 Rankings by Geography 13 The Smoggiest Metropolitan Areas So Far in 2011 16 Worse Than We Thought: Additional Days of Unhealthy Air in 2010 and 2011 17
Policy Recommendations 18
Methodology 20
Appendices 21 Appendix A. National Ranking of Metropolitan Areas by Smog Days in 2010 21 Appendix B. Metropolitan Areas Ranked by Smog Days in 2010 by Population Size 29 Smog Days in 2010 in Large Metropolitan Areas 29 Smog Days in 2010 in Mid-Sized Metropolitan Areas 31 Smog Days in 2010 in Small Metropolitan Areas 34 Appendix C. Metropolitan Areas Ranked by Smog Days in 2010 Within Each State 37 Appendix D. Smog Days in 2011 by Combined Statistical Areas, through August 21, 2011 48 Appendix E. Smog Days in 2010 by State 51
Endnotes 53


1
A ll Americans should be able to breathe clean air. But pollution from power plants and ve-hicles puts the health of our nation’s children
and families at risk. Ground-level ozone, the main component of smog, is one of the most harmful and one of the most pervasive air pollutants. According to the American Lung Association, nearly half of all Americans – 48 percent – still live in areas with unhealthy levels of smog pollution. Studies show that on days with high concentrations of smog pollution in the air, children and adults suffer more asthma attacks, increased respiratory difficulty, and reduced lung function. Exposure to smog pollution can exac-erbate respiratory illness and even cause premature death. Sensitive populations including children, the elderly, and people with respiratory illness are particularly at risk of the adverse health effects of air pollution.
Though air quality has improved significantly in the last decade as a result of policies at the state and fed-eral level, there is still much to be done, as there are millions of people living in metropolitan areas around the country exposed to multiple days each summer when the air is unhealthy to breathe. This report ranks metropolitan areas for their unhealthy air days in 2010 and 2011.
This report also presents data indicating that the prob-lem may have been even worse than we thought. Be-cause the national health standard for smog pollution set in 2008 was set at a level that scientists agree is not protective of public health, people across the country have been exposed to days of poor air quality each summer without even knowing it. We have calculated the additional days on which the air was unhealthy to breathe, according to a pollution threshold that is more consistent with what scientists say is necessary to protect public health. But because the 2008 standard was set too loosely, the public was not alerted to these days of unhealthy air.
The major data and findings of our report are broken down into the following categories:
Executive Summary
There are millions of people living
in metropolitan areas around
the country exposed to multiple
days each summer when the air
is unhealthy to breathe.

2
National rankings of the smoggiest metropolitan areas across the country in 2010: The top five smog-giest metropolitan areas in the country in 2010 were in California. Riverside-San Bernardino, CA ranked as the smoggiest metropolitan area in the country with 110 smog days – meaning that the area, home to more than 3 million residents, had unhealthy air on one out of three days in 2010. Baltimore, MD; Washington, DC-MD-VA-WV; Philadelphia, PA-NJ; Houston, TX; and Atlanta, GA made up the rest of the top-ten smoggiest metropolitan areas list for 2010.
Rankings of smoggiest cities across the country by population size:
• Of large metropolitan areas, or those with populations over 1 million people, Riverside-San Bernardino, California suffered the worst smog pollution in 2010 by far, with 41 more days than the area in second place: Los Angeles-Long Beach, CA. The top five continue with Baltimore, MD; Washing-ton, DC-VA-MD-WV; and Philadelphia, PA-NJ. Two metropolitan areas in each of the following states were among the top 20 smoggiest large areas for 2010: New Jersey, New York, North Carolina, Ohio, Pennsyl-vania, and Texas.
• Among mid-sized metropolitan areas, or those with populations between 250,000 and 1 million people, areas in California again topped the list for worst smog pol-lution, followed by areas in Tennessee, Dela-ware, New Jersey, Louisiana, Alabama and Ohio. The top twenty smoggiest mid-sized metropolitan areas include three areas in both Ohio and Pennsylvania and two areas each in Louisiana, Texas and Connecticut.
• San Luis Obispo-Atascadero-Paso Robles, California was the smoggiest small metro-politan area (population less than 250,000) in 2010. Three places in Wisconsin were among the top 10 smoggiest small metro-politan areas.
State-by-state rankings of smog in 2010: Across the state of California, there were 135 days in 2010, or more than a third of the year, when at least part of the state experienced smog levels exceeding the health standard. California, Texas, Utah, Maryland, Pennsylvania, New Jersey, Ohio and New York each had at least 30 days in 2010 when part of the state experienced smog levels exceeding the health stan-dard – as many as a month’s worth of days when breathing the air could put people’s health at risk. Seventeen states experienced at least one “red alert” day for unhealthy air, indicating pollution levels high enough in a particular area so that anyone could start experiencing adverse health effects. Nine states did not record any days in 2010 on which levels of smog pol-lution exceeded the standard: Alaska, Hawaii, Idaho, Montana, Nebraska, North Dakota, South Dakota, Vermont and Wyoming.
National rankings of the smoggiest metropolitan areas across the country in 2011, through August 21: The areas of Los Angeles-Long Beach-Riverside, CA; Atlanta-Sandy Springs-Gainesville, GA-AL; Fresno-Madera, CA; Washington-Baltimore-North-ern Virginia, DC-MD-VA-WV; and New York-New-ark-Bridgeport, NY-NJ-CT-PA are the top five areas with the most smog days so far this summer, through August 21, 2011.
The air was unhealthy to breathe many more times in 2010 and in 2011 than the public was alerted to because the 2008 standard was not set at a level to protect public health. To demonstrate the discrepancy between the ozone standard set in 2008 (75 parts per billion) and a level that scientists agree is more protective of public health (60-70 parts per billion), this report also looks at the number of times that air monitors recorded a level of 71-75 ppb in 2010, and calculates how many additional days in each metropolitan area the public was exposed to un-healthy air according to a more protective level of 70 ppb. For example, in the Riverside-San Bernardino, CA area, there were 110 days when pollution levels exceeded the existing health standard, but there were an additional 25 days on which pollution levels ex-ceeded a level that scientists agree is more protective of public health.

3
Policy Recommendations To protect the health of our children and people across the country, many steps can be taken both at the state and federal level to reduce dangerous pollution.
First, EPA must set a National Ambient Air Quality Standard for ground-level ozone within the range of 60 to 70 parts per billion averaged over eight hours, as unanimously recommended by the independent board of air experts and scientists created under the Clean Air Act to provide periodic review and recom-mendations on air quality standards. The Obama ad-ministration considered updating the 2008 standard, but decided in early September 2011 to abandon this effort and update the standard in 2013.
Pollution from cars and trucks, which accounts for a third of smog-forming nitrogen oxide emissions in the United States, must be cleaned up by developing cleaner and more efficient vehicles and by improving and expanding public transportation systems.
State and federal governments should accelerate the transition away from fossil fuels and toward a clean energy economy, by passing policies to ensure we get more of our energy from clean, renewable sources such as wind and solar power.
Lastly, Congress should eliminate subsidies that help keep our nation dependent on polluting fossil fuels that put our health and environment at risk.
credit: “Los Angeles Smog,” Ben Amstutz, Creative Commons.

4
Outdoor or “ambient” air pollution in the Unit-ed States is a direct threat to public health. Ground-level ozone, the primary component of
smog, is one of the most harmful air pollutants and is also one of the most pervasive. According to the American Lung Association, nearly half of all Ameri-cans - 48 percent - live in areas with unhealthy levels
of smog pollution.i Children, older adults, and people with respiratory illness are particularly vulnerable to the health effects of smog pollution.
Repeated exposure to smog pollution can cause permanent lung damage and even premature death. Smog pollution reacts with airway tissues and pro-
Smog Pollution Threatens Public Health
On days with high levels of smog pollution:
• Deaths from cardiovascular and respiratory causes increase, according to a 14-year study conducted in 95 U.S. cities.iv
• Hospitals admit increased numbers of patients for respiratory and cardiovascular disease.v Sci-entists have estimated that typical summertime smog pollution is responsible for up to half of all respiratory hospital admissions on bad air days.vi
• More people visit hospital emergency rooms for asthma, pneumonia and upper respiratory infections.vii According to a RAND Corporation health study, in California alone, high levels of smog pollution contributed to nearly 30,000 emergency room visits and hospital admissions and $193 million in hospital medical care expenses from 2005 to 2007.viii
• Children and adults suffer more asthma attacks, increased respiratory difficulty and reduced lung function.ix Approximately 3.2 million children and nearly 9.5 million adults with asthma live in regions with very high levels of smog pollution.x According to the U.S. Department of Health and Human Services, approximately 5,000 asthma-related deaths occur each year in the United States.xi
• Even healthy adults can experience a reduction in lung function of between 15 percent and more than 20 percent from exposure to low levels of ozone over several hours of moderate exercise.xii
• More adults miss work and more children miss school due to illness.xiii

5
duces inflammation similar to sunburn on the inside of the lungs. This inflammation makes lung tissues less elastic, more sensitive to allergens, and less able to ward off infections.ii Exposure to smog can cause coughing, wheezing and throat irritation. Constant exposure to smog over time permanently damages lung tissues, decreases the ability to breathe normally, and exacerbates or even causes chronic diseases like asthma.iii Studies show that on days with high con-centrations of smog pollution in the air, children and adults suffer more asthma attacks, increased respira-tory difficulty and reduced lung function.
Damaging health effects from smog pollution can oc-cur without any noticeable signs. People who live in areas with frequently high smog levels may find that their initial symptoms go away over time – particu-larly when exposure to high smog levels continues for several days;xiv yet smog pollution still causes lung damage even when acute symptoms are not notice-able. Smog exposure can also impact prenatal health, with research finding that in-utero exposure to smog pollution is associated with lower birth weight and intrauterine growth retardation.xv
Children, older adults, people who are active outdoors and people with existing respiratory system ailments suffer most from smog pollution. The American Lung Association estimates that more than 54 million people under the age of 18 or over the age of 65 live in coun-ties in the United States with unhealthy levels of smog pollution.xvi Because children’s respiratory systems are still developing, children who grow up in areas with high levels of smog pollution are at risk for developing permanently diminished lung capacity, increasing the risk of lung disease later in life.xvii Additionally, older adults exposed to high levels of smog pollution may experience an accelerated decline in lung function.xviii
For individuals suffering from asthma, exposure to smog pollution can make the lungs more sensitive to allergens and/or trigger a narrowing of the pathways of the lungs, so that breathing becomes like trying to suck a thick milkshake through a straw.xix
Additionally, smog pollution poses greater risks to people suffering from chronic bronchitis, emphysema, cardiovascular disease and diabetes.xx
credit: “Inhalation,” Vladislav Gajic, Shutterstock

6
Sources of Smog Pollution
2008 is the most recent year for which complete emissions data are available. While EPA estimates emissions data annually, the agency inventories sources only every three years.
O zone is a clear gas composed of three oxygen at-oms that occurs both in the Earth’s upper atmo-sphere and at ground level. Ozone that occurs in
the upper atmosphere is generally natural in origin and forms a protective layer that shields life on Earth from the sun’s harmful ultra-violet rays. This “good” ozone layer extends upward from approximately 6 to 30 miles above the Earth’s surface.xxi At ground level, however, ozone can cause serious health problems.
Ground-level ozone, the primary component of smog, is not emitted directly from pollution sources but rather forms when nitrogen oxide (NOx) emissions and volatile organic compounds (VOCs) react in
the presence of heat and sunlight. Smog pollution is of particular concern during the summer months, from May to October, because higher temperatures and more abundant sunlight result in the build-up of higher ozone concentrations, putting public health at risk from smog pollution.
NOx and VOCs are produced by a variety of indus-trial and transportation sources. Burning fossil fuels to power our transportation sector, generate electric-ity, and power other industry produces 92 percent of all U.S. NOx emissions (see Figure 1)xxii. VOCs come from a range of sources, including transportation and industrial facilities (see Figure 2)xxiii.
Figure 1. U.S. NOx Emissions by Sector, 2008 Figure 2. U.S. VOC Emissions by Sector, 2008
industrial processes
7%
other fossil fuel burning
(industrial and commercial
boilers) 11%
other 1%
transportation non-road
29%
cars and trucks 33%
cars and trucks 26%
solvent use 23%
industrial processes
18%
transportation non-road
19%
other 14%
power plants 19%

7
Standards Must Be Set to Protect Public Health
NatiONal hEalth StaNdaRd FOR OzONE
Under the Clean Air Act, the U.S. Environmental Protection Agency (EPA) has set National Ambient Air Quality Standards (NAAQS) for several pollut-ants, including ground-level ozone pollution. The pri-mary health-based standards are required by law to be set at levels that are protective of public health with an adequate margin of safety, reflecting the latest science on the health impacts of the pollutant being regulated. Under the law, these standards must be re-evaluated and revised as necessary every five years. EPA is not permitted to take costs of implementation into ac-count in setting NAAQS for a pollutant. Areas with high levels of pollution exceeding the standards must implement clean-up measures to protect public health.
In 2008, EPA updated the ozone standard from 80 parts per billion (ppb) averaged over an 8-hour period (set in 1997) to 75 ppb, to increase public health pro-tections. However, this 75 ppb standard, set by then Administrator Stephen L. Johnson, was weaker than the recommendation of the independent board of air experts and scientists, the Clean Air Scientific Advi-sory Committee (CASAC), created by the Clean Air Act to provide recommendations to EPA’s periodic re-view of the NAAQS. After reviewing more than 1,700 studies of the health impacts of ozone, the CASAC
unanimously recommended that the 2008 primary ozone standard be set within the range of 60-70 ppb averaged over eight hours, to protect public health. Scientists thus agree that the 2008 standard of 75 ppb is not adequate to protect public health.
In January 2010, EPA Administrator Lisa P. Jackson formally decided to reconsider the 2008 primary stan-dard for ozone. In March 2011, the CASAC again re-iterated its position that the science supports a tighter standard within 60-70 ppb in order to protect public health. However, in early September 2011, the Obama administration announced that it would not update the standard until 2013.
alERtiNg thE PUbliC: aiR qUality iNdEx
EPA’s Air Quality Index (AQI) is based on the nation-al health-based ambient air quality standards and is meant to help people understand what local air quality means to their health. Local news outlets report air quality by the AQI to inform the public of the best ways to protect their health at varying levels of air pol-lution.
The AQI has color-coded categories ranging from green (good air quality) to purple (very unhealthy air quality). The “orange-alert” level indicates to the pub-

8
lic that air pollution levels are high enough to affect sensitive populations, including children, older adults, and people with respiratory or cardiovascular illness. At the “red-alert” level, anyone may begin to experi-ence some adverse health effects, and members of sen-sitive groups may experience more serious effects. The AQI is standardized across pollutants on a 0-300 scale,
where 100 equals the current air quality standard for each pollutant.
See Figure 3 for a detailed look at EPA’s Air Quality Index for ground-level ozone and what it means for public health.
Figure 3. EPa’s air quality index for ground-level Ozonexxiv
AQI Level of Health Concern
8-Hour Ozone Concentration (parts per billion)
EPA’s Recommendations to Protect Health
0-50 Green (good) 0-59 ppb None.
51-100 Yellow (moderate) 60-75 ppb Unusually sensitive people should consider reducing prolonged or heavy exertion.
101-150 Orange (Unhealthy for Sensitive Groups)
76-95 ppb The following groups should reduce prolonged or heavy outdoor exertion: people with lung disease, such as asthma; children and older adults; people who are active outdoors.
151-200 Red (Unhealthy) 96-115 ppb The following groups should avoid prolonged or heavy outdoor exertion: people with lung disease, such as asthma; children and older adults; people who are active outdoors. Everyone else should limit prolonged outdoor exertion.
201-300 Purple (Very Unhealthy) 116-374 ppb The following groups should avoid all outdoor exertion: people with lung disease, such as asthma; children and older adults; people who are active outdoors. Everyone else should limit outdoor exertion.

9
Report Findings
T his report examines smog pollution levels in 2010 and 2011 from the nation’s networks of ozone air quality monitors, as reported to the
U.S. EPA from the states. Though air quality has improved significantly in the last decade, there is still much to be done, as there are millions of people living in metropolitan areas around the country exposed to multiple days each summer when the air is unhealthy to breathe.
This report documents the number of days that smog pollution levels exceeded the 2008 national ozone standard for the calendar year 2010 and for 2011 through Aug 21, 2011, by metropolitan area. Met-ropolitan areas have varying numbers of air quality monitors, so we’ve analyzed air quality primarily by the number of “smog days,” or days on which at least one air quality monitor in the given area exceeded the national primary ozone standard. We’ve used U.S. Census-designated Metropolitan Statistical Areas and Primary Metropolitan Statistical Areas for the geographic breakdown of metropolitan areas for 2010, and larger Combined Statistical Areas that encompass multiple cities for 2011.
This report also presents data indicating that the problem may have been worse than we thought. We’ve calculated the number of additional days that the air was unhealthy to breathe according to the latest scientific studies, but that the public was not
alerted to because the 2008 standard was set outside of scientific recommendations.
thE SmOggiESt mEtROPOlitaN aREaS iN 2010
National Rankings The top five smoggiest metropolitan areas in the country in 2010 were in California. Riverside-San Bernardino, CA ranked as the smoggiest city in the country with 110 smog days – meaning that the area, home to more than 3 million residents, had unhealthy air on one out of three days in 2010. Twenty-four of those days were categorized as “red-alert days,” mean-ing that air quality was so poor that anyone could experience adverse health effects, and that sensitive populations – children, the elderly, and people with respiratory illness – could experience worse effects. The Riverside-San Bernardino area also experienced the only two “purple-alert” days recorded in a metro-politan area in 2010, where the air was so unhealthy that everyone was alerted to limit their outdoor ex-ertion, and sensitive groups were alerted to avoid all outdoor exertion.
Areas along the East Coast and in Texas made up the rest of the top ten smoggiest areas list for 2010. See Table 1 for the top twenty smoggiest metropolitan ar-eas in the country, and Appendix A for a full ranking of metropolitan areas across the country.

10
table 1. top Smoggiest areas in the United States, 2010
Rankings by Population Size In addition to the national rankings, we ranked met-ropolitan areas based on smog days in two other ways to draw comparisons among areas of similar size and geography, since smog pollution levels can vary highly across both spectrums. For example, larger cities may experience more smog pollution than smaller cities due to increased vehicle and industrial emissions. In order to compare cities of similar sizes, we divided metropolitan areas into three categories, and ranked them by the number of smog days within those size categories: large metropolitan areas with populations above 1 million, mid-sized metropolitan areas with populations between 250,000 and 1 million, and small metropolitan areas with populations under 250,000. Second, since smog pollution varies by geog-raphy as well, we’ve ranked metropolitan areas within each state for smog days. The top areas in each of these
categories is discussed below, and for the full ranking of metropolitan areas by size, see Appendix B; for the full list of metropolitan areas ranked by smog days within each state, see Appendix C.
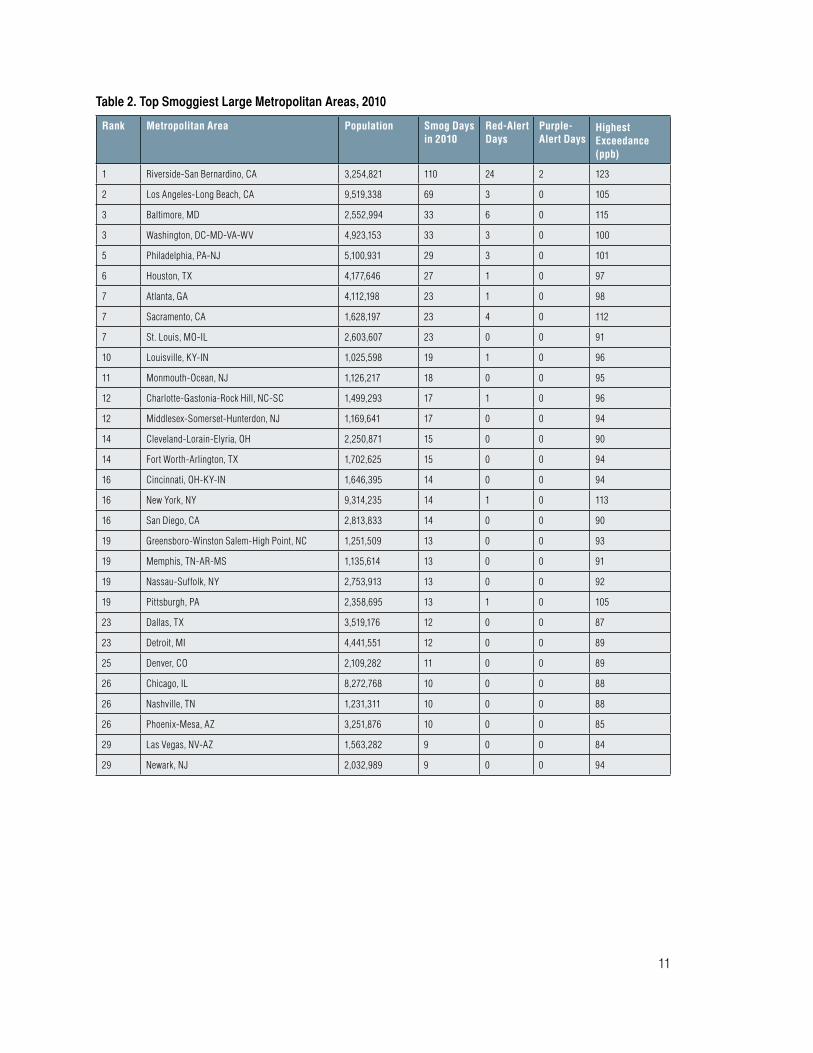
Of large metropolitan areas, or those with popula-tions over 1 million people, Riverside-San Bernardi-no, California suffered the worst smog pollution in 2010 by far, with 41 more smog days than the area in second place: Los Angeles-Long Beach, CA. The top five continue with Baltimore, MD; Washington, DC-VA-MD-WV; and Philadelphia, PA-NJ. Two met-ropolitan areas in each of the following states were among the top 20 smoggiest large areas: New Jersey, New York, North Carolina, Ohio, Pennsylvania and Texas. A list of the top 30 large metropolitan areas with the worst smog pollution in 2010 can be found in Table 2.
Rank Metropolitan Area Population Smog Days in 2010
Red-Alert Days
Purple-Alert Days
Highest Exceedance (ppb)
1 Riverside-San Bernardino, CA 3,254,821 110 24 2 123
2 Visalia-Tulare-Porterville, CA 368,021 78 6 0 104
3 Bakersfield, CA 661,645 69 10 0 107
3 Los Angeles-Long Beach, CA 9,519,338 69 3 0 105
5 Fresno, CA 922,516 42 6 0 104
6 Baltimore, MD 2,552,994 33 6 0 115
6 Washington, DC-MD-VA-WV 4,923,153 33 3 0 100
8 Philadelphia, PA-NJ 5,100,931 29 3 0 101
9 Houston, TX 4,177,646 27 1 0 97
10 Atlanta, GA 4,112,198 23 1 0 98
10 Sacramento, CA 1,628,197 23 4 0 112
10 St. Louis, MO-IL 2,603,607 23 0 0 91
13 Knoxville, TN 687,249 20 0 0 84
14 Louisville, KY-IN 1,025,598 19 1 0 96
15 Monmouth-Ocean, NJ 1,126,217 18 0 0 95
15 Wilmington-Newark, DE-MD 586,216 18 0 0 90
17 Charlotte-Gastonia-Rock Hill, NC-SC 1,499,293 17 1 0 96
17 Middlesex-Somerset-Hunterdon, NJ 1,169,641 17 0 0 94
17 San Luis Obispo-Atascadero-Paso Robles, CA 246,681 17 0 0 90
20 Cleveland-Lorain-Elyria, OH 2,250,871 15 0 0 90
20 Fort Worth-Arlington, TX 1,702,625 15 0 0 94
20 Trenton, NJ 350,761 15 0 0 95
11
table 2. top Smoggiest large metropolitan areas, 2010
Rank Metropolitan Area Population Smog Days in 2010
Red-Alert Days
Purple-Alert Days
Highest Exceedance (ppb)
1 Riverside-San Bernardino, CA 3,254,821 110 24 2 123
2 Los Angeles-Long Beach, CA 9,519,338 69 3 0 105
3 Baltimore, MD 2,552,994 33 6 0 115
3 Washington, DC-MD-VA-WV 4,923,153 33 3 0 100
5 Philadelphia, PA-NJ 5,100,931 29 3 0 101
6 Houston, TX 4,177,646 27 1 0 97
7 Atlanta, GA 4,112,198 23 1 0 98
7 Sacramento, CA 1,628,197 23 4 0 112
7 St. Louis, MO-IL 2,603,607 23 0 0 91
10 Louisville, KY-IN 1,025,598 19 1 0 96
11 Monmouth-Ocean, NJ 1,126,217 18 0 0 95
12 Charlotte-Gastonia-Rock Hill, NC-SC 1,499,293 17 1 0 96
12 Middlesex-Somerset-Hunterdon, NJ 1,169,641 17 0 0 94
14 Cleveland-Lorain-Elyria, OH 2,250,871 15 0 0 90
14 Fort Worth-Arlington, TX 1,702,625 15 0 0 94
16 Cincinnati, OH-KY-IN 1,646,395 14 0 0 94
16 New York, NY 9,314,235 14 1 0 113
16 San Diego, CA 2,813,833 14 0 0 90
19 Greensboro-Winston Salem-High Point, NC 1,251,509 13 0 0 93
19 Memphis, TN-AR-MS 1,135,614 13 0 0 91
19 Nassau-Suffolk, NY 2,753,913 13 0 0 92
19 Pittsburgh, PA 2,358,695 13 1 0 105
23 Dallas, TX 3,519,176 12 0 0 87
23 Detroit, MI 4,441,551 12 0 0 89
25 Denver, CO 2,109,282 11 0 0 89
26 Chicago, IL 8,272,768 10 0 0 88
26 Nashville, TN 1,231,311 10 0 0 88
26 Phoenix-Mesa, AZ 3,251,876 10 0 0 85
29 Las Vegas, NV-AZ 1,563,282 9 0 0 84
29 Newark, NJ 2,032,989 9 0 0 94

12
San Luis Obispo-Atascadero-Paso Robles, California was the smoggiest small metropolitan area (popula-tion less than 250,000) in 2010. Three places in Wis-consin were among the top 10 (see Table 4).
table 3. top Smoggiest mid-Sized metropolitan areas, 2010
table 4. top Smoggiest Small metropolitan areas, 2010
Rank Metropolitan Area
Population Smog Days in 2010
Red-Alert Days
Highest Exceedance (ppb)
1 Visalia-Tulare-Porterville, CA
368,021 78 6 104
2 Bakersfield, CA 661,645 69 10 107
3 Fresno, CA 922,516 42 6 104
4 Knoxville, TN 687,249 20 0 84
5 Wilmington-Newark, DE-MD
586,216 18 0 90
6 Trenton, NJ 350,761 15 0 95
7 Baton Rouge, LA 602,894 14 0 89
7 Birmingham, AL 921,106 14 0 88
7 Hamilton-Middletown, OH
332,807 14 0 86
10 Beaumont-Port Arthur, TX
385,090 13 0 91
10 Lancaster, PA 470,658 13 0 95
10 Ventura, CA 753,197 13 0 90
13 Allentown-Bethlehem-Easton, PA
637,958 12 0 94
14 Dayton-Springfield, OH
950,558 11 0 82
14 Modesto, CA 446,997 11 1 96
14 Stamford-Norwalk, CT
353,556 11 0 91
17 Richmond-Petersburg, VA
996,512 10 2 98
18 Bridgeport, CT 459,479 9 0 80
18 Shreveport-Bossier City, LA
392,302 9 0 90
20 Canton-Massillon, OH
406,934 8 0 88
20 Galveston-Texas City, TX
250,158 8 0 91
20 Greenville-Spartanburg-Anderson, SC
962,441 8 0 82
20 Reading, PA 373,638 8 0 87
Rank Metropolitan Area
Population Smog Days in 2010
Red-Alert Days
Highest Exceedance (ppb)
1 San Luis Obispo-Atascadero-Paso Robles, CA
246,681 17 0 90
2 Brazoria, TX 241,767 11 0 94
2 Merced, CA 210,554 11 1 96
4 Danbury, CT 217,980 7 1 97
4 Kenosha, WI 149,577 7 0 89
4 Sheboygan, WI 112,646 7 0 92
7 Jamestown, NY 139,750 6 0 89
7 Longview-Marshall, TX
208,780 6 0 80
7 Racine, WI 188,831 6 0 84
7 Vineland-Millville-Bridgeton, NJ
146,438 6 0 83
11 Dover, DE 126,697 5 0 92
11 Hagerstown, MD
131,923 5 0 90
11 Lake Charles, LA
183,577 5 0 84
11 New Bedford, MA
175,198 5 0 81
11 Parkersburg-Marietta, WV-OH
151,237 5 0 79
16 Chico-Paradise, CA
203,171 4 0 78
16 Sharon, PA 120,293 4 0 82
16 Steubenville-Weirton, OH-WV
132,008 4 0 83
16 Wheeling, WV-OH
153,172 4 0 82
16 Yuma, AZ 160,026 4 0 84
21 Altoona, PA 129,144 3 0 84
21 Charlottesville, VA
159,576 3 0 79
Among mid-sized metropolitan areas, or those with populations between 250,000 and 1 million people, areas in California again topped the list for worst smog pollution, followed by areas in Tennessee, Dela-ware, New Jersey, Louisiana, Alabama and Ohio. See Table 3 for the top twenty rankings among mid-sized metropolitan areas, which include three areas in both Ohio and Pennsylvania and two areas each in Louisi-ana, Texas and Connecticut.

13
Rankings by geographySmog pollution varies by geography, as well. Some states create more pollution than others, and other states are subject to air pollution blowing into their borders from upwind states. Some states also have geography and weather patterns that make them inherently more subject to the development of smog than others. We’ve both ranked metropolitan areas within each state for smog days (see Table 5 for the smoggiest area in each state and Appendix C for a full list of metropolitan areas by state) and calculated the number of smog days for each state as a whole (Table 6). The numbers presented for full states in-clude all the ozone-monitoring stations in the state, including monitoring stations not in metropolitan statistical areas.
Across the state of California, there were 135 days in 2010, or more than a third of the year, when at least part of the state experienced smog levels exceeding the health standard. California, Texas, Utah, Maryland, Pennsylvania, New Jersey, Ohio and New York each experienced at least 30 days in 2010 when part of the state experienced smog levels exceeding the health standard – as many as a month’s worth of days when breathing the air could put people’s health at risk. Seventeen states experienced at least one “red alert” day for unhealthy air, indicating pollution levels high enough in a particular area so that anyone could start experiencing adverse health effects. Nine states did not record any days on which levels of smog pollution exceeded the standard in 2010: Alaska, Hawaii, Idaho, Montana, Nebraska, North Dakota, South Dakota, Vermont and Wyoming.
table 5. Smoggiest metropolitan area in Each State, 2010
State Metropolitan Area Population Smog Days in 2010
Red-Alert Days
Purple-Alert Days
Highest Exceedance (ppb)
Alabama Birmingham, AL 921,106 14 0 0 88
Arizona Phoenix-Mesa, AZ 3,251,876 10 0 0 85
Arkansas Memphis, TN-AR-MS 1,135,614 13 0 0 91
California Riverside-San Bernardino, CA 3,254,821 110 24 2 123
Colorado Denver, CO 2,109,282 11 0 0 89
Connecticut Stamford-Norwalk, CT 353,556 11 0 0 91
DC Washington, DC-MD-VA-WV 4,923,153 33 3 0 100
Delaware Wilmington-Newark, DE-MD 586,216 18 0 0 90
Florida Pensacola, FL 412,153 3 0 0 88
Georgia Atlanta, GA 4,112,198 23 1 0 98
Illinois St. Louis, MO-IL 2,603,607 23 0 0 91
Indiana Louisville, KY-IN 1,025,598 19 1 0 96
Kansas Kansas City, MO-KS 1,776,062 6 0 0 84
Kentucky Louisville, KY-IN 1,025,598 19 1 0 96
Louisiana Baton Rouge, LA 602,894 14 0 0 89
Maine Portland, ME 243,537 2 1 0 96
Portsmouth-Rochester, NH-ME 240,698 2 0 0 81
Maryland Baltimore, MD 2,552,994 33 6 0 115
Washington, DC-MD-VA-WV 4,923,153 33 3 0 100
Massachusetts New Bedford, MA 175,198 5 0 0 81
Springfield, MA 591,932 5 0 0 91
Michigan Detroit, MI 4,441,551 12 0 0 89
Mississippi Memphis, TN-AR-MS 1,135,614 13 0 0 91
Missouri St. Louis, MO-IL 2,603,607 23 0 0 91

14
State Metropolitan Area Population Smog Days in 2010
Red-Alert Days
Purple-Alert Days
Highest Exceedance (ppb)
Nevada Las Vegas, NV-AZ 1,563,282 9 0 0 84
New Hampshire Boston, MA-NH 3,406,829 3 0 0 83
New Jersey Philadelphia, PA-NJ 5,100,931 29 3 0 101
New Mexico Las Cruces, NM 174,682 2 0 0 84
New York New York, NY 9,314,235 14 1 0 113
North Carolina Charlotte-Gastonia-Rock Hill, NC-SC 1,499,293 17 1 0 96
Ohio Cleveland-Lorain-Elyria, OH 2,250,871 15 0 0 90
Oklahoma Oklahoma City, OK 1,083,346 3 0 0 79
Oregon Portland-Vancouver, OR-WA 1,918,009 1 0 0 94
Salem, OR 347,214 1 0 0 78
Pennsylvania Philadelphia, PA-NJ 5,100,931 29 3 0 101
Rhode Island New London-Norwich, CT-RI 293,566 3 0 0 78
Providence-Fall River-Warwick, RI-MA 1,188,613 3 0 0 86
South Carolina Charlotte-Gastonia-Rock Hill, NC-SC 1,499,293 17 1 0 96
Tennessee Knoxville, TN 687,249 20 0 0 84
Texas Houston, TX 4,177,646 27 1 0 97
Utah Salt Lake City-Ogden, UT 1,333,914 4 0 0 91
Virginia Washington, DC-MD-VA-WV 4,923,153 33 3 0 100
Washington Portland-Vancouver, OR-WA 1,918,009 1 0 0 94
Seattle-Bellevue-Everett, WA 2,414,616 1 0 0 77
West Virginia Washington, DC-MD-VA-WV 4,923,153 33 3 0 100
Wisconsin Kenosha, WI 149,577 7 0 0 89
Sheboygan, WI 112,646 7 0 0 92
table 5. Smoggiest metropolitan area in Each State, 2010, Continued

15
State Smog Days in 2010
Red-Alert Days
Purple-Alert Days
Highest Concentration (ppb)
California 135 37 2 123
Texas 48 1 97
Utah* 45 15 5 123
Maryland 43 7 115
New Jersey 35 2 111
Pennsylvania 35 3 105
Ohio 33 94
New York 30 1 113
Tennessee 29 88
Georgia 28 1 98
North Carolina 26 1 96
Illinois 25 88
Missouri 25 91
Virginia 25 3 98
Connecticut 24 1 101
Louisiana 23 93
Kentucky 21 1 96
Colorado 19 89
DC 18 1 100
Delaware 18 2 98
Indiana 18 86
Alabama 15 88
Arizona 14 85
Massachusetts 14 1 100
Michigan 14 91
Wisconsin 11 95
State Smog Days in 2010
Red-Alert Days
Purple-Alert Days
Highest Concentration (ppb)
Nevada 10 84
West Virginia 10 89
Florida 9 88
Arkansas 8 91
Maine 8 1 96
New Hampshire 8 82
Oklahoma 8 86
South Carolina 8 82
Washington 8 2 110
Kansas 7 83
Mississippi 7 84
Rhode Island 6 86
New Mexico 4 84
Oregon 2 94
Iowa 1 77
Minnesota 1 76
Alaska 0 53
Hawaii 0 52
Idaho 0 73
Montana 0 65
Nebraska 0 71
North Dakota 0 70
South Dakota 0 69
Vermont 0 71
Wyoming 0 72
table 6. States Ranked by Smog days, 2010
*In Utah, all but 5 of the smog days recorded occurred in Jan-Mar at monitoring stations in the desert, likely as a result of natural gas exploration, and not from the usual culprits of vehicles and power plants. Smog days are more likely during summer months because pollution from vehicles and power plants reacts with heat and sunlight to form smog.

16
the Smoggiest metropolitan areas So Far in 2011This report also documents preliminary data on smog pollution for the summer of 2011, through August 21, 2011. As this data is preliminary from EPA, it is not broken down into the distinct metropolitan areas through which the 2010 data was reported. Rather, the data is presented for broader Combined Statisti-cal Areas, which are larger geographic areas that encompass multiple cities, as designated by the U.S.
Census. The areas of Los Angeles-Long Beach-River-side, CA; Atlanta-Sandy Springs-Gainesville, GA-AL; Fresno-Madera, CA; Washington-Baltimore-Northern Virginia, DC-MD-VA-WV; and New York-Newark-Bridgeport, NY-NJ-CT-PA are the top five areas with the most smog days so far this summer. A list of the top 25 areas for smog pollution in 2011 can be found in Table 7, and a full list of all areas can be found in Appendix D.
table 7. top Smoggiest Combined Statistical areas, 2011 through aug 21 - Preliminary
Rank Combined Statistical Area
Smog Days in 2011
Red-Alert Days
Purple-Alert Days
Highest Exceedance (ppb)
1 Los Angeles-Long Beach-Riverside, CA
85 21 3 136
2 Atlanta-Sandy Springs-Gainesville, GA-AL
34 94
3 Fresno-Madera, CA 28 1 104
3 Washington-Baltimore-Northern Virginia, DC-MD-VA-WV
28 7 114
5 New York-Newark-Bridgeport, NY-NJ-CT-PA
27 7 114
6 Sacramento--Arden-Arcade--Yuba City, CA-NV
23 1 97
6 St. Louis-St. Charles-Farmington, MO-IL
23 2 102
8 Charlotte-Gastonia-Salisbury, NC-SC
21 91
9 Cincinnati-Middletown-Wilmington, OH-KY-IN
20 1 97
10 Dallas-Fort Worth, TX 19 95
11 Philadelphia-Camden-Vineland, PA-NJ-DE-MD
18 3 101
12 Denver-Aurora-Boulder, CO
17 1 106
Rank Combined Statistical Area
Smog Days in 2011
Red-Alert Days
Purple-Alert Days
Highest Exceedance (ppb)
12 Oklahoma City-Shawnee, OK
17 86
14 Birmingham-Hoover-Cullman, AL
15 1 98
14 Chicago-Naperville-Michigan City, IL-IN-WI
15 93
14 Houston-Baytown-Huntsville, TX
15 2 112
14 Knoxville-Sevierville-La Follette, TN
15 1 98
14 Louisville/Jefferson County-Elizabethtown- Scottsburg, KY-IN
15 2 100
14 Tulsa-Bartlesville, OK 15 95
20 Baton Rouge-Pierre Part, LA
12 90
20 Kansas City-Overland Park-Kansas City, MO-KS
12 90
22 Cleveland-Akron-Elyria, OH
11 90
22 Pittsburgh-New Castle, PA
11 84
24 Detroit-Warren-Flint, MI
10 88
24 Little Rock-North Little Rock-Pine Bluff, AR
10 84

17
Worse than We thought: additional days of Unhealthy air in 2010 and 2011A strong science-based public health standard is criti-cal to limit dangerous air pollution, but also to alert the public to unhealthy air and ways to protect health. When the standard is set outside of the boundaries of the latest scientific recommendations, as it was in 2008, it means the public may be unknowingly ex-posed to unhealthy levels of air pollution.
To demonstrate the discrepancy between the ozone standard set in 2008 (75 parts per billion) and a level that scientists agree is more protective of public health (60-70 parts per billion), this report also looks at the number of times that air monitors recorded smog pol-lution levels of 71-75 ppb in 2010, and calculates how many additional days in each metropolitan area the public was exposed to unhealthy air according to a more protective level of 70 ppb. These numbers il-lustrate that the air was unhealthy to breathe many more times in 2010 and 2011 than was reported to the public.
We’ve calculated additional days of unhealthy air for all metropolitan areas in 2010, states as a whole in 2010, and for Combined Statistical Areas in 2011. For example, in the Riverside-San Bernardino, CA area, there were 110 days when pollution levels exceeded the existing health standard, but there were an additional 25 days on which pollution levels exceeded a level that scientists agree is more protective of public health. The top 25 metropolitan areas with the most total days on which the area’s air was unhealthy to breathe ac-cording to a more protective standard can be found in Table 8, with a side-by-side comparison between the area’s smog days in 2010 and additional days of un-healthy air, with three metropolitan areas experiencing 100 or more days of unhealthy air. The additional days of unhealthy air for each metropolitan area in 2010 can be found in Appendix A, listed according to smog day rankings, and in Appendix C, listed by state.
The additional days of unhealthy air for each state in 2010 can be found in Appendix E, and the additional days for each Combined Statistical Area in 2011 can be found in Appendix D, each with a side-by-side com-parison to smog days in 2010.
table 8. top metropolitan areas with the most total days the air was Unhealthy to breathe according to a more Protective Standard, 2010
Rank Metropolitan Area
Population Total Days the Air Was Unhealthy to Breathe According to a More Protective Standard
Smog Days in 2010
Additional Days the Air Was Unhealthy to Breathe
1 Riverside-San Bernardino, CA
3,254,821 135 110 25
2 Los Angeles-Long Beach, CA
9,519,338 101 69 32
3 Visalia-Tulare-Porterville, CA
368,021 100 78 22
4 Bakersfield, CA 661,645 93 69 24
5 Fresno, CA 922,516 59 42 17
6 Baltimore, MD 2,552,994 50 33 17
6 Washington, DC-MD-VA-WV
4,923,153 50 33 17
8 Knoxville, TN 687,249 47 20 27
9 St. Louis, MO-IL
2,603,607 41 23 18
10 Atlanta, GA 4,112,198 39 23 16
11 Sacramento, CA 1,628,197 38 23 15
12 Charlotte-Gastonia-Rock Hill, NC-SC
1,499,293 37 17 20
13 Philadelphia, PA-NJ
5,100,931 36 29 7
14 Louisville, KY-IN
1,025,598 35 19 16
15 Houston, TX 4,177,646 34 27 7
16 Middlesex-Somerset-Hunterdon, NJ
1,169,641 33 17 16
17 San Luis Obispo-Atascadero-Paso Robles, CA
246,681 32 17 15
18 Las Vegas, NV-AZ
1,563,282 31 9 22
19 Birmingham, AL 921,106 30 14 16
19 Cincinnati, OH-KY-IN
1,646,395 30 14 16
19 Wilmington-Newark, DE-MD
586,216 30 18 12
22 Greensboro-Winston Salem-High Point, NC
1,251,509 29 13 16
22 Trenton, NJ 350,761 29 15 14
24 Nashville, TN 1,231,311 28 10 18
24 New York, NY 9,314,235 28 14 14

18
Policy Recommendations
Thanks to the steps EPA has already taken, air quality standards and emission controls are re-ducing emissions of dangerous smog-forming
pollution from power plants and cars, and pollution levels have decreased in recent years. In addition, this summer EPA finalized its Cross-State Air Pollution Rule to reduce emissions of nitrogen oxides and sulfur dioxides from power plants in the eastern half of the country in order to protect families and communities downwind of dangerous smog and soot pollution. This rule is expected to save as many as 34,000 lives in 2014, and will help downwind communities meet national smog and soot standards to keep their resi-dents safe.
However, the science is clear that the national primary standard for ozone set in 2008 at 75 parts per billion is not sufficiently protective of public health. As a result, emissions from power plants and vehicles are still too high and the public is breathing unhealthy air far too often. The primary national health standard is also what informs the Air Quality Index, EPA’s tool for communicating to the public and communities that ambient air pollution levels are high enough to put public health at risk. The public has a right to know when the air is unhealthy to breathe, and having a standard that does not adhere to what the science says is sufficiently protective means that the public is sometimes unaware of unhealthy pollution levels, and
as such, may not be prepared to take precautionary measures to protect their health or the health of their families.
To protect public health, EPA must set a National Ambient Air Quality Standard for ground-level ozone within the range of 60-70 parts per billion av-eraged over eight hours. This range was unanimously recommended to EPA prior to the 2008 rulemaking by the Clean Air Scientific Advisory Committee – the independent board of air experts and scientists created under the Clean Air Act to provide periodic review and recommendations on air quality standards – after they reviewed more than 1,700 studies on the health effects of smog pollution. The Clean Air Act requires that the standard be set based on protecting public health, and therefore must be set to meet the scientific recommendations.
However, the science is clear that
the national primary standard for
ozone set in 2008 at 75 parts per
billion is not sufficiently protective
of public health.

19
credit: Lina Hayes, Creative Commons
Pollution from cars and trucks accounts for a third of smog-forming nitrogen oxide emissions in the United States, and steps should be taken to reduce that pollution. Vehicles should have the most up-to-date pollution control technology, and public trans-portation systems should be improved and expanded to enable people to drive less in their daily lives.
State and federal governments should accelerate the transition away from fossil fuels and toward a clean energy economy. Clean, renewable energy sources such as wind and solar power don’t pollute our air and will never run out. Twenty-nine states already require a portion of their energy to be generated from clean, renewable sources; those states should increase their clean energy standards, and other states and the
federal government should adopt policies to ensure we get more of our energy from clean, renewable sources.
Lastly, Congress should eliminate subsidies that help keep our nation dependent on polluting fossil fuels. For decades, the coal and oil industry have been given hand-outs from the federal government. A 2009 report by the Environmental Law Institute found that traditional fossil fuels received more than five times more federal subsidies—including direct spending and tax breaks—than traditional renewables received during 2002-2008.xxv Electricity production incentives should target energy sources that provide benefits to our environment and our economy and that don’t put our health at risk.

20
Methodology
W e obtained data on exceedances of the pri-mary National Ambient Air Quality Stan-dard for ozone, set in 2008 at 75 parts per
billion averaged over eight hours, from the U.S. EPA for 2010, and for 2011 through August 21, 2011. We obtained the 2010 data from EPA’s AirExplorer online tool, accessed the weeks of August 17-28, 2011. The 2011 data cited here is preliminary data compiled by EPA from multiple EPA sources and has not yet been verified; EPA does not use unverified data for regula-tory purposes.
For each ozone-monitoring site, we obtained the maxi-mum daily 8-hour ozone concentrations exceeding 75 parts per billion (ppb). We define a “smog day” as a day on which at least one monitor in a given metropolitan area exceeded the 8-hour ozone standard. We also ob-tained maximum daily 8-hour ozone concentrations of 71-75 ppb and calculated additional days of un-healthy air that each metropolitan area experienced, as the scientific community has recommended a standard within the range of 60-70 ppb to better protect public health. We calculated this data for 2010 for each met-ropolitan area and for each state. The numbers for each metropolitan area may not add up to the numbers for the particular state, because some ozone-monitoring stations are located outside of metropolitan areas. We calculated this data for 2011 for Combined Statisti-cal Areas, which are broader geographic regions that encompass multiple cities.
A state can mark an exceedance of a standard as an
“exceptional event” when it is caused by an unusual or naturally occurring event that is not reasonably con-trolled, such as a fire or fireworks. The data for 2010 does not include exceptional events; however, the data for 2011 may include exceptional events, as it is pre-liminary from EPA.
Metropolitan Statistical Areas (MSA) and Combined Statistical Areas (CSAs) are defined by the Office of Management and Budget. EPA compiles air quality data by MSA and CSA, as well as by county, state, and individual air quality monitors. We chose to present data by MSA and CSA to highlight pollution problems that put the public at risk in cities across the country.
The populations presented in this report for MSAs are from the 2000 decennial U.S. Census. This is because the U.S. Census only compiles population data by MSA every ten years and the data for MSA popula-tions from the 2010 decennial census will not be ready until 2013.
We define a “smog day” as a day
on which at least one monitor in a
given metropolitan area exceeded
the 8-hour ozone standard.

21
Appendices
appendix a. National Ranking of metropolitan areas by Smog days in 2010
Rank Metropolitan Area Population Smog Days in 2010
Red-Alert Days
Purple-Alert Days
Additional Days the Air Was Unhealthy to Breathe According to a More Protective Standard
Highest Concentration (ppb)
1 Riverside-San Bernardino, CA 3,254,821 110 24 2 25 123
2 Visalia-Tulare-Porterville, CA 368,021 78 6 0 22 104
3 Bakersfield, CA 661,645 69 10 0 24 107
3 Los Angeles-Long Beach, CA 9,519,338 69 3 0 32 105
5 Fresno, CA 922,516 42 6 0 17 104
6 Baltimore, MD 2,552,994 33 6 0 17 115
6 Washington, DC-MD-VA-WV 4,923,153 33 3 0 17 100
8 Philadelphia, PA-NJ 5,100,931 29 3 0 7 101
9 Houston, TX 4,177,646 27 1 0 7 97
10 Atlanta, GA 4,112,198 23 1 0 16 98
10 Sacramento, CA 1,628,197 23 4 0 15 112
10 St. Louis, MO-IL 2,603,607 23 0 0 18 91
13 Knoxville, TN 687,249 20 0 0 27 84
14 Louisville, KY-IN 1,025,598 19 1 0 16 96
15 Monmouth-Ocean, NJ 1,126,217 18 0 0 9 95
15 Wilmington-Newark, DE-MD 586,216 18 0 0 12 90
17 Charlotte-Gastonia-Rock Hill, NC-SC 1,499,293 17 1 0 20 96
17 Middlesex-Somerset-Hunterdon, NJ 1,169,641 17 0 0 16 94
17 San Luis Obispo-Atascadero-Paso Robles, CA
246,681 17 0 0 15 90
20 Cleveland-Lorain-Elyria, OH 2,250,871 15 0 0 10 90

22
Rank Metropolitan Area Population Smog Days in 2010
Red-Alert Days
Purple-Alert Days
Additional Days the Air Was Unhealthy to Breathe According to a More Protective Standard
Highest Concentration (ppb)
20 Fort Worth-Arlington, TX 1,702,625 15 0 0 3 94
20 Trenton, NJ 350,761 15 0 0 14 95
23 Baton Rouge, LA 602,894 14 0 0 9 89
23 Birmingham, AL 921,106 14 0 0 16 88
23 Cincinnati, OH-KY-IN 1,646,395 14 0 0 16 94
23 Hamilton-Middletown, OH 332,807 14 0 0 9 86
23 New York, NY 9,314,235 14 1 0 14 113
23 San Diego, CA 2,813,833 14 0 0 7 90
29 Beaumont-Port Arthur, TX 385,090 13 0 0 11 91
29 Greensboro-Winston Salem-High Point, NC 1,251,509 13 0 0 16 93
29 Lancaster, PA 470,658 13 0 0 9 95
29 Memphis, TN-AR-MS 1,135,614 13 0 0 11 91
29 Nassau-Suffolk, NY 2,753,913 13 0 0 12 92
29 Pittsburgh, PA 2,358,695 13 1 0 6 105
29 Ventura, CA 753,197 13 0 0 5 90
36 Allentown-Bethlehem-Easton, PA 637,958 12 0 0 9 94
36 Dallas, TX 3,519,176 12 0 0 12 87
36 Detroit, MI 4,441,551 12 0 0 6 89
39 Brazoria, TX 241,767 11 0 0 7 94
39 Dayton-Springfield, OH 950,558 11 0 0 10 82
39 Denver, CO 2,109,282 11 0 0 16 89
39 Merced, CA 210,554 11 1 0 14 96
39 Modesto, CA 446,997 11 1 0 8 96
39 Stamford-Norwalk, CT 353,556 11 0 0 2 91
45 Chicago, IL 8,272,768 10 0 0 10 88
45 Nashville, TN 1,231,311 10 0 0 18 88
45 Phoenix-Mesa, AZ 3,251,876 10 0 0 15 85
45 Richmond-Petersburg, VA 996,512 10 2 0 15 98
49 Bridgeport, CT 459,479 9 0 0 9 80
49 Las Vegas, NV-AZ 1,563,282 9 0 0 22 84
49 Newark, NJ 2,032,989 9 0 0 9 94
49 Shreveport-Bossier City, LA 392,302 9 0 0 8 90
53 Canton-Massillon, OH 406,934 8 0 0 10 88
53 Galveston-Texas City, TX 250,158 8 0 0 6 91
53 Greenville-Spartanburg-Anderson, SC 962,441 8 0 0 13 82
53 New Orleans, LA 1,337,726 8 0 0 7 93
appendix a. National Ranking of metropolitan areas by Smog days in 2010, Continued

23
appendix a. National Ranking of metropolitan areas by Smog days in 2010, Continued
Rank Metropolitan Area Population Smog Days in 2010
Red-Alert Days
Purple-Alert Days
Additional Days the Air Was Unhealthy to Breathe According to a More Protective Standard
Highest Concentration (ppb)
53 Reading, PA 373,638 8 0 0 15 87
58 Bergen-Passaic, NJ 1,373,167 7 0 0 10 94
58 Danbury, CT 217,980 7 1 0 8 97
58 Fort Collins-Loveland, CO 251,494 7 0 0 14 82
58 Hartford, CT 1,183,110 7 0 0 2 89
58 Kenosha, WI 149,577 7 0 0 5 89
58 San Jose, CA 1,682,585 7 0 0 2 91
58 Sheboygan, WI 112,646 7 0 0 5 92
65 Atlantic-Cape May, NJ 354,878 6 0 0 3 85
65 Chattanooga, TN-GA 465,161 6 0 0 11 82
65 Columbus, OH 1,540,157 6 0 0 14 88
65 Jamestown, NY 139,750 6 0 0 10 89
65 Jersey City, NJ 608,975 6 1 0 5 111
65 Kansas City, MO-KS 1,776,062 6 0 0 16 84
65 Longview-Marshall, TX 208,780 6 0 0 12 80
65 Milwaukee-Waukesha, WI 1,500,741 6 0 0 5 92
65 Norfolk-Virginia Beach-Newport News, VA-NC
1,569,541 6 1 0 9 97
65 Racine, WI 188,831 6 0 0 0 84
65 Vineland-Millville-Bridgeton, NJ 146,438 6 0 0 5 83
76 Dover, DE 126,697 5 0 0 7 92
76 Evansville-Henderson, IN-KY 296,195 5 0 0 13 77
76 Hagerstown, MD 131,923 5 0 0 6 90
76 Lake Charles, LA 183,577 5 0 0 4 84
76 New Bedford, MA 175,198 5 0 0 0 81
76 Parkersburg-Marietta, WV-OH 151,237 5 0 0 7 79
76 Raleigh-Durham-Chapel Hill, NC 1,187,941 5 0 0 9 83
76 Springfield, MA 591,932 5 0 0 4 91
84 Akron, OH 694,960 4 0 0 9 82
84 Albany-Schenectady-Troy, NY 875,583 4 0 0 5 84
84 Chico-Paradise, CA 203,171 4 0 0 9 78
84 Dutchess County, NY 280,150 4 0 0 2 92
84 Grand Rapids-Muskegon- Holland, MI
1,088,514 4 0 0 7 79
84 Harrisburg-Lebanon-Carlisle, PA 629,401 4 0 0 5 87
84 Huntington-Ashland, WV-KY-OH 315,538 4 0 0 8 79
84 Mobile, AL 540,258 4 0 0 6 85

24
Rank Metropolitan Area Population Smog Days in 2010
Red-Alert Days
Purple-Alert Days
Additional Days the Air Was Unhealthy to Breathe According to a More Protective Standard
Highest Concentration (ppb)
84 Oakland, CA 2,392,557 4 1 0 4 97
84 Salt Lake City-Ogden, UT 1,333,914 4 0 0 7 91
84 San Antonio, TX 1,592,383 4 0 0 7 87
84 Santa Barbara-Santa Maria-Lompoc, CA 399,347 4 0 0 3 83
84 Sharon, PA 120,293 4 0 0 5 82
84 Steubenville-Weirton, OH-WV 132,008 4 0 0 7 83
84 Stockton-Lodi, CA 563,598 4 0 0 4 95
84 Vallejo-Fairfield-Napa, CA 518,821 4 0 0 0 89
84 Wheeling, WV-OH 153,172 4 0 0 3 82
84 York, PA 381,751 4 0 0 12 88
84 Youngstown-Warren, OH 594,746 4 0 0 4 89
84 Yuma, AZ 160,026 4 0 0 4 84
104 Altoona, PA 129,144 3 0 0 5 84
104 Austin-San Marcos, TX 1,249,763 3 0 0 7 80
104 Boston, MA-NH 3,406,829 3 0 0 5 83
104 Charlottesville, VA 159,576 3 0 0 1 79
104 El Paso, TX 679,622 3 0 0 5 87
104 Erie, PA 280,843 3 0 0 5 83
104 Hickory-Morganton-Lenoir, NC 341,851 3 0 0 4 82
104 Indianapolis, IN 1,607,486 3 0 0 13 83
104 New London-Norwich, CT-RI 293,566 3 0 0 5 78
104 Oklahoma City, OK 1,083,346 3 0 0 8 79
104 Orange County, CA 2,846,289 3 1 0 3 96
104 Pensacola, FL 412,153 3 0 0 5 88
104 Providence-Fall River-Warwick, RI-MA 1,188,613 3 0 0 3 86
104 Scranton-Wilkes-Barre-Hazleton, PA 624,776 3 0 0 5 82
104 Syracuse, NY 732,117 3 0 0 3 82
104 Toledo, OH 618,203 3 0 0 3 91
104 Worcester, MA-CT 511,389 3 0 0 2 83
121 Athens, GA 153,444 2 0 0 3 84
121 Augusta-Aiken, GA-SC 477,441 2 0 0 4 81
121 Biloxi-Gulfport-Pascagoula, MS 363,988 2 0 0 10 82
121 Clarksville-Hopkinsville, TN-KY 207,033 2 0 0 6 77
121 Columbia, SC 536,691 2 0 0 4 81
121 Corpus Christi, TX 380,783 2 0 0 6 78
121 Fayetteville, NC 302,963 2 0 0 5 86
appendix a. National Ranking of metropolitan areas by Smog days in 2010, Continued

25
Rank Metropolitan Area Population Smog Days in 2010
Red-Alert Days
Purple-Alert Days
Additional Days the Air Was Unhealthy to Breathe According to a More Protective Standard
Highest Concentration (ppb)
121 Fort Walton Beach, FL 170,498 2 0 0 1 84
121 Gary, IN 631,362 2 0 0 4 80
121 Greeley, CO 180,936 2 0 0 5 78
121 Johnson City-Kingsport-Bristol, TN-VA 480,091 2 0 0 4 80
121 Johnstown, PA 232,621 2 0 0 3 85
121 Joplin, MO 157,322 2 0 0 4 82
121 Lafayette, LA 385,647 2 0 0 8 79
121 Las Cruces, NM 174,682 2 0 0 1 84
121 Lima, OH 155,084 2 0 0 3 78
121 Little Rock-North Little Rock, AR 583,845 2 0 0 6 80
121 Macon, GA 322,549 2 0 0 2 80
121 Montgomery, AL 333,055 2 0 0 6 79
121 Nashua, NH 190,949 2 0 0 0 81
121 Newburgh, NY-PA 387,669 2 0 0 6 87
121 Orlando, FL 1,644,561 2 0 0 6 81
121 Panama City, FL 148,217 2 0 0 3 82
121 Portland, ME 243,537 2 1 0 2 96
121 Portsmouth-Rochester, NH-ME 240,698 2 0 0 1 81
121 Redding, CA 163,256 2 0 0 12 76
121 State College, PA 135,758 2 0 0 4 78
121 Tampa-St. Petersburg-Clearwater, FL 2,395,997 2 0 0 8 87
121 Topeka, KS 169,871 2 0 0 0 82
121 Tulsa, OK 803,235 2 0 0 6 78
121 Wichita, KS 545,220 2 0 0 10 77
152 Albuquerque, NM 712,738 1 0 0 2 78
152 Asheville, NC 225,965 1 0 0 3 76
152 Benton Harbor, MI 162,453 1 0 0 4 79
152 Boulder-Longmont, CO 291,288 1 0 0 5 82
152 Buffalo-Niagara Falls, NY 1,170,111 1 0 0 7 77
152 Charleston, WV 251,662 1 0 0 2 87
152 Columbus, GA-AL 274,624 1 0 0 1 79
152 Elmira, NY 91,070 1 0 0 2 77
152 Flagstaff, AZ-UT 122,366 1 0 0 3 81
152 Fort Smith, AR-OK 207,290 1 0 0 0 79
152 Fort Wayne, IN 502,141 1 0 0 0 76
152 Greenville, NC 133,798 1 0 0 2 81
152 Houma, LA 194,477 1 0 0 7 79
appendix a. National Ranking of metropolitan areas by Smog days in 2010, Continued

26
Rank Metropolitan Area Population Smog Days in 2010
Red-Alert Days
Purple-Alert Days
Additional Days the Air Was Unhealthy to Breathe According to a More Protective Standard
Highest Concentration (ppb)
152 Huntsville, AL 342,376 1 0 0 3 81
152 Jacksonville, FL 1,100,491 1 0 0 3 84
152 Kalamazoo-Battle Creek, MI 452,851 1 0 0 0 76
152 Lakeland-Winter Haven, FL 483,924 1 0 0 1 77
152 Lawrence, MA-NH 396,230 1 0 0 3 76
152 Lawton, OK 114,996 1 0 0 1 81
152 Manchester, NH 198,378 1 0 0 0 77
152 Miami, FL 2,253,362 1 0 0 2 85
152 New Haven-Meriden, CT 542,149 1 0 0 1 76
152 Owensboro, KY 91,545 1 0 0 6 80
152 Pittsfield, MA 84,699 1 0 0 5 80
152 Portland-Vancouver, OR-WA 1,918,009 1 0 0 1 94
152 Provo-Orem, UT 368,536 1 0 0 6 84
152 Reno, NV 339,486 1 0 0 2 77
152 Roanoke, VA 235,932 1 0 0 5 76
152 Rocky Mount, NC 143,026 1 0 0 3 81
152 Salem, OR 347,214 1 0 0 0 78
152 San Francisco, CA 1,731,183 1 0 0 0 77
152 Sarasota-Bradenton, FL 589,959 1 0 0 4 80
152 Seattle-Bellevue-Everett, WA 2,414,616 1 0 0 2 77
152 St. Joseph, MO 102,490 1 0 0 5 81
152 West Palm Beach-Boca Raton, FL 1,131,184 1 0 0 1 76
152 Williamsport, PA 120,044 1 0 0 5 76
152 Wilmington, NC 233,450 1 0 0 0 79
Anchorage, AK 260,283 0 0 0 0 50
Ann Arbor, MI 578,736 0 0 0 1 74
Appleton-Oshkosh-Neehan, WI 358,365 0 0 0 1 72
Bellingham, WA 166,814 0 0 0 0 52
Bismarck, ND 94,719 0 0 0 0 64
Bloomington-Normal, IL 150,433 0 0 0 1 72
Boise City, ID 432,345 0 0 0 1 73
Brownsville-Harlingen-San Benito, TX 335,227 0 0 0 2 72
Cedar Rapids, IA 191,701 0 0 0 1 73
Champaign-Urbana, IL 179,669 0 0 0 0 62
Charleston-North Charleston, SC 549,033 0 0 0 2 74
Colorado Springs, CO 516,929 0 0 0 2 73
Columbia, MO 135,454 0 0 0 2 71
appendix a. National Ranking of metropolitan areas by Smog days in 2010, Continued

27
Rank Metropolitan Area Population Smog Days in 2010
Red-Alert Days
Purple-Alert Days
Additional Days the Air Was Unhealthy to Breathe According to a More Protective Standard
Highest Concentration (ppb)
Davenport-Moline-Rock Island, IA-IL 359,062 0 0 0 1 71
Daytona Beach, FL 493,175 0 0 0 1 71
Decatur, AL 145,867 0 0 0 3 73
Decatur, IL 114,706 0 0 0 0 69
Des Moines, IA 456,022 0 0 0 0 66
Dothan, AL 137,916 0 0 0 2 75
Duluth-Superior, MN-WI 243,815 0 0 0 1 71
Elkhart-Goshen, IN 182,791 0 0 0 0 69
Eugene-Springfield, OR 322,959 0 0 0 1 74
Fargo-Moorhead, ND-MN 174,367 0 0 0 0 67
Fayetteville-Springdale-Rogers, AR 311,121 0 0 0 1 74
Flint, MI 436,141 0 0 0 3 75
Florence, AL 142,950 0 0 0 1 72
Fort Lauderdale, FL 1,623,018 0 0 0 1 72
Fort Myers-Cape Coral, FL 440,888 0 0 0 1 71
Fort Pierce-Port St. Lucie, FL 319,426 0 0 0 0 68
Gadsden, AL 103,459 0 0 0 0 68
Gainesville, FL 217,955 0 0 0 1 71
Grand Junction, CO 116,255 0 0 0 0 70
Green Bay, WI 226,778 0 0 0 1 73
Honolulu, HI 876,156 0 0 0 0 52
Jackson, MS 440,801 0 0 0 1 73
Janesville-Beloit, WI 152,307 0 0 0 1 71
Killeen-Temple, TX 312,952 0 0 0 6 75
La Crosse, WI-MN 126,838 0 0 0 0 69
Lansing-East Lansing, MI 447,728 0 0 0 1 75
Laredo, TX 193,117 0 0 0 0 70
Lexington, KY 479,198 0 0 0 5 75
Lincoln, NE 250,291 0 0 0 0 59
Madison, WI 426,526 0 0 0 0 70
McAllen-Edinburg-Mission, TX 569,463 0 0 0 0 66
Medford-Ashland, OR 181,269 0 0 0 0 68
Melbourne-Titusville-Palm Bay, FL 476,230 0 0 0 0 66
Minneapolis-St. Paul, MN-WI 2,968,806 0 0 0 3 75
Missoula, MT 95,802 0 0 0 0 57
Monroe, LA 147,250 0 0 0 3 71
appendix a. National Ranking of metropolitan areas by Smog days in 2010, Continued

28
Rank Metropolitan Area Population Smog Days in 2010
Red-Alert Days
Purple-Alert Days
Additional Days the Air Was Unhealthy to Breathe According to a More Protective Standard
Highest Concentration (ppb)
Muncie, IN 118,769 0 0 0 1 73
Naples, FL 251,377 0 0 0 0 64
Ocala, FL 258,916 0 0 0 2 74
Olympia, WA 207,355 0 0 0 0 60
Omaha, NE-IA 716,998 0 0 0 2 71
Peoria-Pekin, IL 347,387 0 0 0 3 72
Rochester, MN 124,277 0 0 0 0 65
Rochester, NY 1,098,201 0 0 0 6 74
Rockford, IL 371,236 0 0 0 0 66
Salinas, CA 401,762 0 0 0 0 70
Santa Cruz-Watsonville, CA 255,602 0 0 0 0 59
Santa Fe, NM 147,635 0 0 0 1 71
Santa Rosa, CA 458,614 0 0 0 0 68
Savannah, GA 293,000 0 0 0 0 70
Sioux Falls, SD 172,412 0 0 0 0 68
South Bend, IN 265,559 0 0 0 0 65
Spokane, WA 417,939 0 0 0 0 67
Springfield, IL 201,437 0 0 0 1 72
Springfield, MO 325,721 0 0 0 0 70
St. Cloud, MN 167,392 0 0 0 0 70
Tacoma, WA 700,820 0 0 0 0 69
Tallahassee, FL 284,539 0 0 0 0 69
Terra Haute, IN 149,192 0 0 0 0 66
Tucson, AZ 843,746 0 0 0 3 75
Tuscaloosa, AL 164,875 0 0 0 0 63
Tyler, TX 174,706 0 0 0 6 75
Utica-Rome, NY 299,896 0 0 0 1 72
Victoria, TX 84,088 0 0 0 1 73
Waco, TX 213,517 0 0 0 2 75
Wausau, WI 125,834 0 0 0 0 64
Yolo, CA 168,660 0 0 0 2 72
Yuba City, CA 139,149 0 0 0 3 75
appendix a. National Ranking of metropolitan areas by Smog days in 2010, Continued

29
appendix b. metropolitan areas Ranked by Smog days in 2010 by Population Size
Smog days in 2010 in large metropolitan areas
Rank Metropolitan Area Population Smog Days in 2010
Red-Alert Days
Purple-Alert Days
Highest Concentration (ppb)
1 Riverside-San Bernardino, CA 3,254,821 110 24 2 123
2 Los Angeles-Long Beach, CA 9,519,338 69 3 0 105
3 Baltimore, MD 2,552,994 33 6 0 115
3 Washington, DC-MD-VA-WV 4,923,153 33 3 0 100
5 Philadelphia, PA-NJ 5,100,931 29 3 0 101
6 Houston, TX 4,177,646 27 1 0 97
7 Atlanta, GA 4,112,198 23 1 0 98
7 Sacramento, CA 1,628,197 23 4 0 112
7 St. Louis, MO-IL 2,603,607 23 0 0 91
10 Louisville, KY-IN 1,025,598 19 1 0 96
11 Monmouth-Ocean, NJ 1,126,217 18 0 0 95
12 Charlotte-Gastonia-Rock Hill, NC-SC 1,499,293 17 1 0 96
12 Middlesex-Somerset-Hunterdon, NJ 1,169,641 17 0 0 94
14 Cleveland-Lorain-Elyria, OH 2,250,871 15 0 0 90
14 Fort Worth-Arlington, TX 1,702,625 15 0 0 94
16 Cincinnati, OH-KY-IN 1,646,395 14 0 0 94
16 New York, NY 9,314,235 14 1 0 113
16 San Diego, CA 2,813,833 14 0 0 90
19 Greensboro-Winston Salem-High Point, NC 1,251,509 13 0 0 93
19 Memphis, TN-AR-MS 1,135,614 13 0 0 91
19 Nassau-Suffolk, NY 2,753,913 13 0 0 92
19 Pittsburgh, PA 2,358,695 13 1 0 105
23 Dallas, TX 3,519,176 12 0 0 87
23 Detroit, MI 4,441,551 12 0 0 89
25 Denver, CO 2,109,282 11 0 0 89
26 Chicago, IL 8,272,768 10 0 0 88
26 Nashville, TN 1,231,311 10 0 0 88
26 Phoenix-Mesa, AZ 3,251,876 10 0 0 85
29 Las Vegas, NV-AZ 1,563,282 9 0 0 84
29 Newark, NJ 2,032,989 9 0 0 94
31 New Orleans, LA 1,337,726 8 0 0 93
32 Bergen-Passaic, NJ 1,373,167 7 0 0 94
32 Hartford, CT 1,183,110 7 0 0 89
32 San Jose, CA 1,682,585 7 0 0 91
35 Columbus, OH 1,540,157 6 0 0 88
35 Kansas City, MO-KS 1,776,062 6 0 0 84
35 Milwaukee-Waukesha, WI 1,500,741 6 0 0 92
35 Norfolk-Virginia Beach-Newport News, VA-NC
1,569,541 6 1 0 97

30
Rank Metropolitan Area Population Smog Days in 2010
Red-Alert Days
Purple-Alert Days
Highest Concentration (ppb)
39 Raleigh-Durham-Chapel Hill, NC 1,187,941 5 0 0 83
40 Grand Rapids-Muskegon-Holland, MI 1,088,514 4 0 0 79
40 Oakland, CA 2,392,557 4 1 0 97
40 Salt Lake City-Ogden, UT 1,333,914 4 0 0 91
40 San Antonio, TX 1,592,383 4 0 0 87
44 Austin-San Marcos, TX 1,249,763 3 0 0 80
44 Boston, MA-NH 3,406,829 3 0 0 83
44 Indianapolis, IN 1,607,486 3 0 0 83
44 Oklahoma City, OK 1,083,346 3 0 0 79
44 Orange County, CA 2,846,289 3 1 0 96
44 Providence-Fall River-Warwick, RI-MA 1,188,613 3 0 0 86
50 Orlando, FL 1,644,561 2 0 0 81
50 Tampa-St. Petersburg-Clearwater, FL 2,395,997 2 0 0 87
52 Buffalo-Niagara Falls, NY 1,170,111 1 0 0 77
52 Jacksonville, FL 1,100,491 1 0 0 84
52 Miami, FL 2,253,362 1 0 0 85
52 Portland-Vancouver, OR-WA 1,918,009 1 0 0 94
52 San Francisco, CA 1,731,183 1 0 0 77
52 Seattle-Bellevue-Everett, WA 2,414,616 1 0 0 77
52 West Palm Beach-Boca Raton, FL 1,131,184 1 0 0 76
Fort Lauderdale, FL 1,623,018 0 0 0 72
Minneapolis-St. Paul, MN-WI 2,968,806 0 0 0 75
Rochester, NY 1,098,201 0 0 0 74
appendix b. metropolitan areas Ranked by Smog days in 2010 by Population Size, Continued
Smog days in 2010 in large metropolitan areas

31
Rank Metropolitan Area Population Smog Days in 2010
Red-Alert Days
Purple-Alert Days
Highest Concentration (ppb)
1 Visalia-Tulare-Porterville, CA 368,021 78 6 0 104
2 Bakersfield, CA 661,645 69 10 0 107
3 Fresno, CA 922,516 42 6 0 104
4 Knoxville, TN 687,249 20 0 0 84
5 Wilmington-Newark, DE-MD 586,216 18 0 0 90
6 Trenton, NJ 350,761 15 0 0 95
7 Baton Rouge, LA 602,894 14 0 0 89
7 Birmingham, AL 921,106 14 0 0 88
7 Hamilton-Middletown, OH 332,807 14 0 0 86
10 Beaumont-Port Arthur, TX 385,090 13 0 0 91
10 Lancaster, PA 470,658 13 0 0 95
10 Ventura, CA 753,197 13 0 0 90
13 Allentown-Bethlehem-Easton, PA 637,958 12 0 0 94
14 Dayton-Springfield, OH 950,558 11 0 0 82
14 Modesto, CA 446,997 11 1 0 96
14 Stamford-Norwalk, CT 353,556 11 0 0 91
17 Richmond-Petersburg, VA 996,512 10 2 0 98
18 Bridgeport, CT 459,479 9 0 0 80
18 Shreveport-Bossier City, LA 392,302 9 0 0 90
20 Canton-Massillon, OH 406,934 8 0 0 88
20 Galveston-Texas City, TX 250,158 8 0 0 91
20 Greenville-Spartanburg-Anderson, SC 962,441 8 0 0 82
20 Reading, PA 373,638 8 0 0 87
24 Fort Collins-Loveland, CO 251,494 7 0 0 82
25 Atlantic-Cape May, NJ 354,878 6 0 0 85
25 Chattanooga, TN-GA 465,161 6 0 0 82
25 Jersey City, NJ 608,975 6 1 0 111
28 Evansville-Henderson, IN-KY 296,195 5 0 0 77
28 Springfield, MA 591,932 5 0 0 91
30 Akron, OH 694,960 4 0 0 82
30 Albany-Schenectady-Troy, NY 875,583 4 0 0 84
30 Dutchess County, NY 280,150 4 0 0 92
30 Harrisburg-Lebanon-Carlisle, PA 629,401 4 0 0 87
30 Huntington-Ashland, WV-KY-OH 315,538 4 0 0 79
30 Mobile, AL 540,258 4 0 0 85
30 Santa Barbara-Santa Maria-Lompoc, CA 399,347 4 0 0 83
30 Stockton-Lodi, CA 563,598 4 0 0 95
30 Vallejo-Fairfield-Napa, CA 518,821 4 0 0 89
30 York, PA 381,751 4 0 0 88
appendix b. metropolitan areas Ranked by Smog days in 2010 by Population Size
Smog days in 2010 in mid-Sized metropolitan areas

32
Rank Metropolitan Area Population Smog Days in 2010
Red-Alert Days
Purple-Alert Days
Highest Concentration (ppb)
30 Youngstown-Warren, OH 594,746 4 0 0 89
41 El Paso, TX 679,622 3 0 0 87
41 Erie, PA 280,843 3 0 0 83
41 Hickory-Morganton-Lenoir, NC 341,851 3 0 0 82
41 New London-Norwich, CT-RI 293,566 3 0 0 78
41 Pensacola, FL 412,153 3 0 0 88
41 Scranton-Wilkes-Barre-Hazleton, PA 624,776 3 0 0 82
41 Syracuse, NY 732,117 3 0 0 82
41 Toledo, OH 618,203 3 0 0 91
41 Worcester, MA-CT 511,389 3 0 0 83
50 Augusta-Aiken, GA-SC 477,441 2 0 0 81
50 Biloxi-Gulfport-Pascagoula, MS 363,988 2 0 0 82
50 Columbia, SC 536,691 2 0 0 81
50 Corpus Christi, TX 380,783 2 0 0 78
50 Fayetteville, NC 302,963 2 0 0 86
50 Gary, IN 631,362 2 0 0 80
50 Johnson City-Kingsport-Bristol, TN-VA 480,091 2 0 0 80
50 Lafayette, LA 385,647 2 0 0 79
50 Little Rock-North Little Rock, AR 583,845 2 0 0 80
50 Macon, GA 322,549 2 0 0 80
50 Montgomery, AL 333,055 2 0 0 79
50 Newburgh, NY-PA 387,669 2 0 0 87
50 Tulsa, OK 803,235 2 0 0 78
50 Wichita, KS 545,220 2 0 0 77
64 Albuquerque, NM 712,738 1 0 0 78
64 Boulder-Longmont, CO 291,288 1 0 0 82
64 Charleston, WV 251,662 1 0 0 87
64 Columbus, GA-AL 274,624 1 0 0 79
64 Fort Wayne, IN 502,141 1 0 0 76
64 Huntsville, AL 342,376 1 0 0 81
64 Kalamazoo-Battle Creek, MI 452,851 1 0 0 76
64 Lakeland-Winter Haven, FL 483,924 1 0 0 77
64 Lawrence, MA-NH 396,230 1 0 0 76
64 New Haven-Meriden, CT 542,149 1 0 0 76
64 Provo-Orem, UT 368,536 1 0 0 84
64 Reno, NV 339,486 1 0 0 77
64 Salem, OR 347,214 1 0 0 78
64 Sarasota-Bradenton, FL 589,959 1 0 0 80
Anchorage, AK 260,283 0 0 0 50
appendix b. metropolitan areas Ranked by Smog days in 2010 by Population Size, Continued
Smog days in 2010 in mid-Sized metropolitan areas

33
Rank Metropolitan Area Population Smog Days in 2010
Red-Alert Days
Purple-Alert Days
Highest Concentration (ppb)
Ann Arbor, MI 578,736 0 0 0 74
Appleton-Oshkosh-Neehan, WI 358,365 0 0 0 72
Boise City, ID 432,345 0 0 0 73
Brownsville-Harlingen-San Benito, TX 335,227 0 0 0 72
Charleston-North Charleston, SC 549,033 0 0 0 74
Colorado Springs, CO 516,929 0 0 0 73
Davenport-Moline-Rock Island, IA-IL 359,062 0 0 0 71
Daytona Beach, FL 493,175 0 0 0 71
Des Moines, IA 456,022 0 0 0 66
Eugene-Springfield, OR 322,959 0 0 0 74
Fayetteville-Springdale-Rogers, AR 311,121 0 0 0 74
Flint, MI 436,141 0 0 0 75
Fort Myers-Cape Coral, FL 440,888 0 0 0 71
Fort Pierce-Port St. Lucie, FL 319,426 0 0 0 68
Honolulu, HI 876,156 0 0 0 52
Jackson, MS 440,801 0 0 0 73
Killeen-Temple, TX 312,952 0 0 0 75
Lansing-East Lansing, MI 447,728 0 0 0 75
Lexington, KY 479,198 0 0 0 75
Lincoln, NE 250,291 0 0 0 59
Madison, WI 426,526 0 0 0 70
McAllen-Edinburg-Mission, TX 569,463 0 0 0 66
Melbourne-Titusville-Palm Bay, FL 476,230 0 0 0 66
Naples, FL 251,377 0 0 0 64
Ocala, FL 258,916 0 0 0 74
Omaha, NE-IA 716,998 0 0 0 71
Peoria-Pekin, IL 347,387 0 0 0 72
Rockford, IL 371,236 0 0 0 66
Salinas, CA 401,762 0 0 0 70
Santa Cruz-Watsonville, CA 255,602 0 0 0 59
Santa Rosa, CA 458,614 0 0 0 68
Savannah, GA 293,000 0 0 0 70
South Bend, IN 265,559 0 0 0 65
Spokane, WA 417,939 0 0 0 67
Springfield, MO 325,721 0 0 0 70
Tacoma, WA 700,820 0 0 0 69
Tallahassee, FL 284,539 0 0 0 69
Tucson, AZ 843,746 0 0 0 75
Utica-Rome, NY 299,896 0 0 0 72
appendix b. metropolitan areas Ranked by Smog days in 2010 by Population Size, Continued
Smog days in 2010 in mid-Sized metropolitan areas

34
Rank Metropolitan Area Population Smog Days in 2010
Red-Alert Days
Purple-Alert Days
Highest Concentration (ppb)
1 San Luis Obispo-Atascadero-Paso Robles, CA 246,681 17 0 0 90
2 Brazoria, TX 241,767 11 0 0 94
2 Merced, CA 210,554 11 1 0 96
4 Danbury, CT 217,980 7 1 0 97
4 Kenosha, WI 149,577 7 0 0 89
4 Sheboygan, WI 112,646 7 0 0 92
7 Jamestown, NY 139,750 6 0 0 89
7 Longview-Marshall, TX 208,780 6 0 0 80
7 Racine, WI 188,831 6 0 0 84
7 Vineland-Millville-Bridgeton, NJ 146,438 6 0 0 83
11 Dover, DE 126,697 5 0 0 92
11 Hagerstown, MD 131,923 5 0 0 90
11 Lake Charles, LA 183,577 5 0 0 84
11 New Bedford, MA 175,198 5 0 0 81
11 Parkersburg-Marietta, WV-OH 151,237 5 0 0 79
16 Chico-Paradise, CA 203,171 4 0 0 78
16 Sharon, PA 120,293 4 0 0 82
16 Steubenville-Weirton, OH-WV 132,008 4 0 0 83
16 Wheeling, WV-OH 153,172 4 0 0 82
16 Yuma, AZ 160,026 4 0 0 84
21 Altoona, PA 129,144 3 0 0 84
21 Charlottesville, VA 159,576 3 0 0 79
23 Athens, GA 153,444 2 0 0 84
23 Clarksville-Hopkinsville, TN-KY 207,033 2 0 0 77
23 Fort Walton Beach, FL 170,498 2 0 0 84
23 Greeley, CO 180,936 2 0 0 78
23 Johnstown, PA 232,621 2 0 0 85
23 Joplin, MO 157,322 2 0 0 82
23 Las Cruces, NM 174,682 2 0 0 84
23 Lima, OH 155,084 2 0 0 78
23 Nashua, NH 190,949 2 0 0 81
23 Panama City, FL 148,217 2 0 0 82
23 Portland, ME 243,537 2 1 0 96
23 Portsmouth-Rochester, NH-ME 240,698 2 0 0 81
23 Redding, CA 163,256 2 0 0 76
23 State College, PA 135,758 2 0 0 78
23 Topeka, KS 169,871 2 0 0 82
38 Asheville, NC 225,965 1 0 0 76
38 Benton Harbor, MI 162,453 1 0 0 79
appendix b. metropolitan areas Ranked by Smog days in 2010 by Population Size
Smog days in 2010 in Small metropolitan areas

35
Rank Metropolitan Area Population Smog Days in 2010
Red-Alert Days
Purple-Alert Days
Highest Concentration (ppb)
38 Elmira, NY 91,070 1 0 0 77
38 Flagstaff, AZ-UT 122,366 1 0 0 81
38 Fort Smith, AR-OK 207,290 1 0 0 79
38 Greenville, NC 133,798 1 0 0 81
38 Houma, LA 194,477 1 0 0 79
38 Lawton, OK 114,996 1 0 0 81
38 Manchester, NH 198,378 1 0 0 77
38 Owensboro, KY 91,545 1 0 0 80
38 Pittsfield, MA 84,699 1 0 0 80
38 Roanoke, VA 235,932 1 0 0 76
38 Rocky Mount, NC 143,026 1 0 0 81
38 St. Joseph, MO 102,490 1 0 0 81
38 Williamsport, PA 120,044 1 0 0 76
38 Wilmington, NC 233,450 1 0 0 79
Bellingham, WA 166,814 0 0 0 52
Bismarck, ND 94,719 0 0 0 64
Bloomington-Normal, IL 150,433 0 0 0 72
Cedar Rapids, IA 191,701 0 0 0 73
Champaign-Urbana, IL 179,669 0 0 0 62
Columbia, MO 135,454 0 0 0 71
Decatur, AL 145,867 0 0 0 73
Decatur, IL 114,706 0 0 0 69
Dothan, AL 137,916 0 0 0 75
Duluth-Superior, MN-WI 243,815 0 0 0 71
Elkhart-Goshen, IN 182,791 0 0 0 69
Fargo-Moorhead, ND-MN 174,367 0 0 0 67
Florence, AL 142,950 0 0 0 72
Gadsden, AL 103,459 0 0 0 68
Gainesville, FL 217,955 0 0 0 71
Grand Junction, CO 116,255 0 0 0 70
Green Bay, WI 226,778 0 0 0 73
Janesville-Beloit, WI 152,307 0 0 0 71
La Crosse, WI-MN 126,838 0 0 0 69
Laredo, TX 193,117 0 0 0 70
Medford-Ashland, OR 181,269 0 0 0 68
Missoula, MT 95,802 0 0 0 57
Monroe, LA 147,250 0 0 0 71
Muncie, IN 118,769 0 0 0 73
Olympia, WA 207,355 0 0 0 60
appendix b. metropolitan areas Ranked by Smog days in 2010 by Population Size, Continued
Smog days in 2010 in Small metropolitan areas

36
Rank Metropolitan Area Population Smog Days in 2010
Red-Alert Days
Purple-Alert Days
Highest Concentration (ppb)
Rochester, MN 124,277 0 0 0 65
Santa Fe, NM 147,635 0 0 0 71
Sioux Falls, SD 172,412 0 0 0 68
Springfield, IL 201,437 0 0 0 72
St. Cloud, MN 167,392 0 0 0 70
Terra Haute, IN 149,192 0 0 0 66
Tuscaloosa, AL 164,875 0 0 0 63
Tyler, TX 174,706 0 0 0 75
Victoria, TX 84,088 0 0 0 73
Waco, TX 213,517 0 0 0 75
Wausau, WI 125,834 0 0 0 64
Yolo, CA 168,660 0 0 0 72
Yuba City, CA 139,149 0 0 0 75
appendix b. metropolitan areas Ranked by Smog days in 2010 by Population Size, Continued
Smog days in 2010 in Small metropolitan areas

37
appendix C. metropolitan areas Ranked by Smog days in 2010 Within Each State
AlabamaMetropolitan Area Population Smog
Days in 2010
Red-Alert Days
Purple-Alert Days
Highest Concentration (ppb)
Additional Days the Air Was Unhealthy to Breathe According to a More Protective Standard
Birmingham, AL 921,106 14 0 0 88 16
Mobile, AL 540,258 4 0 0 85 6
Montgomery, AL 333,055 2 0 0 79 6
Columbus, GA-AL 274,624 1 0 0 79 1
Huntsville, AL 342,376 1 0 0 81 3
Decatur, AL 145,867 0 0 0 73 3
Dothan, AL 137,916 0 0 0 75 2
Florence, AL 142,950 0 0 0 72 1
Gadsden, AL 103,459 0 0 0 68 0
Tuscaloosa, AL 164,875 0 0 0 63 0
AlaskaAnchorage, AK 260,283 0 0 0 50 0
ArizonaPhoenix-Mesa, AZ 3,251,876 10 0 0 85 15
Las Vegas, NV-AZ 1,563,282 9 0 0 84 22
Yuma, AZ 160,026 4 0 0 84 4
Flagstaff, AZ-UT 122,366 1 0 0 81 3
Tucson, AZ 843,746 0 0 0 75 3
ArkansasMemphis, TN-AR-MS 1,135,614 13 0 0 91 11
Little Rock-North Little Rock, AR 583,845 2 0 0 80 6
Fort Smith, AR-OK 207,290 1 0 0 79 0
Fayetteville-Springdale-Rogers, AR 311,121 0 0 0 74 1
CaliforniaRiverside-San Bernardino, CA 3,254,821 110 24 2 123 25
Visalia-Tulare-Porterville, CA 368,021 78 6 0 104 22
Bakersfield, CA 661,645 69 10 0 107 24
Los Angeles-Long Beach, CA 9,519,338 69 3 0 105 32
Fresno, CA 922,516 42 6 0 104 17
Sacramento, CA 1,628,197 23 4 0 112 15
San Luis Obispo-Atascadero-Paso Robles, CA
246,681 17 0 0 90 15
San Diego, CA 2,813,833 14 0 0 90 7
Ventura, CA 753,197 13 0 0 90 5
Merced, CA 210,554 11 1 0 96 14

38
California
Metropolitan Area Population Smog Days in 2010
Red-Alert Days
Purple-Alert Days
Highest Concentration (ppb)
Additional Days the Air Was Unhealthy to Breathe According to a More Protective Standard
Modesto, CA 446,997 11 1 0 96 8
San Jose, CA 1,682,585 7 0 0 91 2
Chico-Paradise, CA 203,171 4 0 0 78 9
Oakland, CA 2,392,557 4 1 0 97 4
Santa Barbara-Santa Maria-Lompoc, CA 399,347 4 0 0 83 3
Stockton-Lodi, CA 563,598 4 0 0 95 4
Vallejo-Fairfield-Napa, CA 518,821 4 0 0 89 0
Orange County, CA 2,846,289 3 1 0 96 3
Redding, CA 163,256 2 0 0 76 12
San Francisco, CA 1,731,183 1 0 0 77 0
Salinas, CA 401,762 0 0 0 70 0
Santa Cruz-Watsonville, CA 255,602 0 0 0 59 0
Santa Rosa, CA 458,614 0 0 0 68 0
Yolo, CA 168,660 0 0 0 72 2
Yuba City, CA 139,149 0 0 0 75 3
ColoradoDenver, CO 2,109,282 11 0 0 89 16
Fort Collins-Loveland, CO 251,494 7 0 0 82 14
Greeley, CO 180,936 2 0 0 78 5
Boulder-Longmont, CO 291,288 1 0 0 82 5
Colorado Springs, CO 516,929 0 0 0 73 2
Grand Junction, CO 116,255 0 0 0 70 0
ConnecticutStamford-Norwalk, CT 353,556 11 0 0 91 2
Bridgeport, CT 459,479 9 0 0 80 9
Danbury, CT 217,980 7 1 0 97 8
Hartford, CT 1,183,110 7 0 0 89 2
New London-Norwich, CT-RI 293,566 3 0 0 78 5
Worcester, MA-CT 511,389 3 0 0 83 2
New Haven-Meriden, CT 542,149 1 0 0 76 1
Washington, DCWashington, DC-MD-VA-WV 4,923,153 33 3 0 100 17
DelawareWilmington-Newark, DE-MD 586,216 18 0 0 90 12
Dover, DE 126,697 5 0 0 92 7
appendix C. metropolitan areas Ranked by Smog days in 2010 Within Each State, Continued

39
Florida
Metropolitan Area Population Smog Days in 2010
Red-Alert Days
Purple-Alert Days
Highest Concentration (ppb)
Additional Days the Air Was Unhealthy to Breathe According to a More Protective Standard
Pensacola, FL 412,153 3 0 0 88 5
Fort Walton Beach, FL 170,498 2 0 0 84 1
Orlando, FL 1,644,561 2 0 0 81 6
Panama City, FL 148,217 2 0 0 82 3
Tampa-St. Petersburg-Clearwater, FL 2,395,997 2 0 0 87 8
Jacksonville, FL 1,100,491 1 0 0 84 3
Lakeland-Winter Haven, FL 483,924 1 0 0 77 1
Miami, FL 2,253,362 1 0 0 85 2
Sarasota-Bradenton, FL 589,959 1 0 0 80 4
West Palm Beach-Boca Raton, FL 1,131,184 1 0 0 76 1
Daytona Beach, FL 493,175 0 0 0 71 1
Fort Lauderdale, FL 1,623,018 0 0 0 72 1
Fort Myers-Cape Coral, FL 440,888 0 0 0 71 1
Fort Pierce-Port St. Lucie, FL 319,426 0 0 0 68 0
Gainesville, FL 217,955 0 0 0 71 1
Melbourne-Titusville-Palm Bay, FL 476,230 0 0 0 66 0
Naples, FL 251,377 0 0 0 64 0
Ocala, FL 258,916 0 0 0 74 2
Tallahassee, FL 284,539 0 0 0 69 0
GeorgiaAtlanta, GA 4,112,198 23 1 0 98 16
Chattanooga, TN-GA 465,161 6 0 0 82 11
Athens, GA 153,444 2 0 0 84 3
Augusta-Aiken, GA-SC 477,441 2 0 0 81 4
Macon, GA 322,549 2 0 0 80 2
Columbus, GA-AL 274,624 1 0 0 79 1
Savannah, GA 293,000 0 0 0 70 0
HawaiiHonolulu, HI 876,156 0 0 0 52 0
IdahoBoise City, ID 432,345 0 0 0 73 1
IllinoisSt. Louis, MO-IL 2,603,607 23 0 0 91 18
Chicago, IL 8,272,768 10 0 0 88 10
appendix C. metropolitan areas Ranked by Smog days in 2010 Within Each State, Continued

40
Illinois
Metropolitan Area Population Smog Days in 2010
Red-Alert Days
Purple-Alert Days
Highest Concentration (ppb)
Additional Days the Air Was Unhealthy to Breathe According to a More Protective Standard
Bloomington-Normal, IL 150,433 0 0 0 72 1
Champaign-Urbana, IL 179,669 0 0 0 62 0
Davenport-Moline-Rock Island, IA-IL 359,062 0 0 0 71 1
Decatur, IL 114,706 0 0 0 69 0
Peoria-Pekin, IL 347,387 0 0 0 72 3
Rockford, IL 371,236 0 0 0 66 0
Springfield, IL 201,437 0 0 0 72 1
IndianaLouisville, KY-IN 1,025,598 19 1 0 96 16
Cincinnati, OH-KY-IN 1,646,395 14 0 0 94 16
Evansville-Henderson, IN-KY 296,195 5 0 0 77 13
Indianapolis, IN 1,607,486 3 0 0 83 13
Gary, IN 631,362 2 0 0 80 4
Fort Wayne, IN 502,141 1 0 0 76 0
Elkhart-Goshen, IN 182,791 0 0 0 69 0
Muncie, IN 118,769 0 0 0 73 1
South Bend, IN 265,559 0 0 0 65 0
Terra Haute, IN 149,192 0 0 0 66 0
IowaCedar Rapids, IA 191,701 0 0 0 73 1
Davenport-Moline-Rock Island, IA-IL 359,062 0 0 0 71 1
Des Moines, IA 456,022 0 0 0 66 0
Omaha, NE-IA 716,998 0 0 0 71 2
KansasKansas City, MO-KS 1,776,062 6 0 0 84 16
Topeka, KS 169,871 2 0 0 82 0
Wichita, KS 545,220 2 0 0 77 10
KentuckyLouisville, KY-IN 1,025,598 19 1 0 96 16
Cincinnati, OH-KY-IN 1,646,395 14 0 0 94 16
Evansville-Henderson, IN-KY 296,195 5 0 0 77 13
Huntington-Ashland, WV-KY-OH 315,538 4 0 0 79 8
Clarksville-Hopkinsville, TN-KY 207,033 2 0 0 77 6
Owensboro, KY 91,545 1 0 0 80 6
Lexington, KY 479,198 0 0 0 75 5
appendix C. metropolitan areas Ranked by Smog days in 2010 Within Each State, Continued

41
Louisiana
Metropolitan Area Population Smog Days in 2010
Red-Alert Days
Purple-Alert Days
Highest Concentration (ppb)
Additional Days the Air Was Unhealthy to Breathe According to a More Protective Standard
Baton Rouge, LA 602,894 14 0 0 89 9
Shreveport-Bossier City, LA 392,302 9 0 0 90 8
New Orleans, LA 1,337,726 8 0 0 93 7
Lake Charles, LA 183,577 5 0 0 84 4
Lafayette, LA 385,647 2 0 0 79 8
Houma, LA 194,477 1 0 0 79 7
Monroe, LA 147,250 0 0 0 71 3
MainePortland, ME 243,537 2 1 0 96 2
Portsmouth-Rochester, NH-ME 240,698 2 0 0 81 1
MarylandBaltimore, MD 2,552,994 33 6 0 115 17
Washington, DC-MD-VA-WV 4,923,153 33 3 0 100 17
Wilmington-Newark, DE-MD 586,216 18 0 0 90 12
Hagerstown, MD 131,923 5 0 0 90 6
MassachusettsNew Bedford, MA 175,198 5 0 0 81 0
Springfield, MA 591,932 5 0 0 91 4
Boston, MA-NH 3,406,829 3 0 0 83 5
Providence-Fall River-Warwick, RI-MA 1,188,613 3 0 0 86 3
Worcester, MA-CT 511,389 3 0 0 83 2
Lawrence, MA-NH 396,230 1 0 0 76 3
Pittsfield, MA 84,699 1 0 0 80 5
MichiganDetroit, MI 4,441,551 12 0 0 89 6
Grand Rapids-Muskegon-Holland, MI 1,088,514 4 0 0 79 7
Benton Harbor, MI 162,453 1 0 0 79 4
Kalamazoo-Battle Creek, MI 452,851 1 0 0 76 0
Ann Arbor, MI 578,736 0 0 0 74 1
Flint, MI 436,141 0 0 0 75 3
Lansing-East Lansing, MI 447,728 0 0 0 75 1
MinnesotaDuluth-Superior, MN-WI 243,815 0 0 0 71 1
Fargo-Moorhead, ND-MN 174,367 0 0 0 67 0
appendix C. metropolitan areas Ranked by Smog days in 2010 Within Each State, Continued

42
MinnesotaMetropolitan Area Population Smog
Days in 2010
Red-Alert Days
Purple-Alert Days
Highest Concentration (ppb)
Additional Days the Air Was Unhealthy to Breathe According to a More Protective Standard
La Crosse, WI-MN 126,838 0 0 0 69 0
Minneapolis-St. Paul, MN-WI 2,968,806 0 0 0 75 3
Rochester, MN 124,277 0 0 0 65 0
St. Cloud, MN 167,392 0 0 0 70 0
MississippiMemphis, TN-AR-MS 1,135,614 13 0 0 91 11
Biloxi-Gulfport-Pascagoula, MS 363,988 2 0 0 82 10
Jackson, MS 440,801 0 0 0 73 1
MissouriSt. Louis, MO-IL 2,603,607 23 0 0 91 18
Kansas City, MO-KS 1,776,062 6 0 0 84 16
Joplin, MO 157,322 2 0 0 82 4
St. Joseph, MO 102,490 1 0 0 81 5
Columbia, MO 135,454 0 0 0 71 2
Springfield, MO 325,721 0 0 0 70 0
MontanaMissoula, MT 95,802 0 0 0 57 0
NebraskaLincoln, NE 250,291 0 0 0 59 0
Omaha, NE-IA 716,998 0 0 0 71 2
NevadaLas Vegas, NV-AZ 1,563,282 9 0 0 84 22
Reno, NV 339,486 1 0 0 77 2
New HampshireBoston, MA-NH 3,406,829 3 0 0 83 5
Nashua, NH 190,949 2 0 0 81 0
Portsmouth-Rochester, NH-ME 240,698 2 0 0 81 1
Lawrence, MA-NH 396,230 1 0 0 76 3
Manchester, NH 198,378 1 0 0 77 0
New JerseyPhiladelphia, PA-NJ 5,100,931 29 3 0 101 7
Monmouth-Ocean, NJ 1,126,217 18 0 0 95 9
appendix C. metropolitan areas Ranked by Smog days in 2010 Within Each State, Continued

43
New JerseyMetropolitan Area Population Smog
Days in 2010
Red-Alert Days
Purple-Alert Days
Highest Concentration (ppb)
Additional Days the Air Was Unhealthy to Breathe According to a More Protective Standard
Middlesex-Somerset-Hunterdon, NJ 1,169,641 17 0 0 94 16
Trenton, NJ 350,761 15 0 0 95 14
Newark, NJ 2,032,989 9 0 0 94 9
Bergen-Passaic, NJ 1,373,167 7 0 0 94 10
Atlantic-Cape May, NJ 354,878 6 0 0 85 3
Jersey City, NJ 608,975 6 1 0 111 5
Vineland-Millville-Bridgeton, NJ 146,438 6 0 0 83 5
New Mexico
Las Cruces, NM 174,682 2 0 0 84 1
Albuquerque, NM 712,738 1 0 0 78 2
Santa Fe, NM 147,635 0 0 0 71 1
New York
New York, NY 9,314,235 14 1 0 113 14
Nassau-Suffolk, NY 2,753,913 13 0 0 92 12
Jamestown, NY 139,750 6 0 0 89 10
Albany-Schenectady-Troy, NY 875,583 4 0 0 84 5
Dutchess County, NY 280,150 4 0 0 92 2
Syracuse, NY 732,117 3 0 0 82 3
Newburgh, NY-PA 387,669 2 0 0 87 6
Buffalo-Niagara Falls, NY 1,170,111 1 0 0 77 7
Elmira, NY 91,070 1 0 0 77 2
Rochester, NY 1,098,201 0 0 0 74 6
Utica-Rome, NY 299,896 0 0 0 72 1
North Carolina
Charlotte-Gastonia-Rock Hill, NC-SC 1,499,293 17 1 0 96 20
Greensboro-Winston Salem-High Point, NC 1,251,509 13 0 0 93 16
Norfolk-Virginia Beach-Newport News, VA-NC
1,569,541 6 1 0 97 9
Raleigh-Durham-Chapel Hill, NC 1,187,941 5 0 0 83 9
Hickory-Morganton-Lenoir, NC 341,851 3 0 0 82 4
Fayetteville, NC 302,963 2 0 0 86 5
Asheville, NC 225,965 1 0 0 76 3
Greenville, NC 133,798 1 0 0 81 2
Rocky Mount, NC 143,026 1 0 0 81 3
Wilmington, NC 233,450 1 0 0 79 0
appendix C. metropolitan areas Ranked by Smog days in 2010 Within Each State, Continued

44
North DakotaMetropolitan Area Population Smog
Days in 2010
Red-Alert Days
Purple-Alert Days
Highest Concentration (ppb)
Additional Days the Air Was Unhealthy to Breathe According to a More Protective Standard
Bismarck, ND 94,719 0 0 0 64 0
Fargo-Moorhead, ND-MN 174,367 0 0 0 67 0
OhioCleveland-Lorain-Elyria, OH 2,250,871 15 0 0 90 10
Cincinnati, OH-KY-IN 1,646,395 14 0 0 94 16
Hamilton-Middletown, OH 332,807 14 0 0 86 9
Dayton-Springfield, OH 950,558 11 0 0 82 10
Canton-Massillon, OH 406,934 8 0 0 88 10
Columbus, OH 1,540,157 6 0 0 88 14
Parkersburg-Marietta, WV-OH 151,237 5 0 0 79 7
Akron, OH 694,960 4 0 0 82 9
Huntington-Ashland, WV-KY-OH 315,538 4 0 0 79 8
Steubenville-Weirton, OH-WV 132,008 4 0 0 83 7
Wheeling, WV-OH 153,172 4 0 0 82 3
Youngstown-Warren, OH 594,746 4 0 0 89 4
Toledo, OH 618,203 3 0 0 91 3
Lima, OH 155,084 2 0 0 78 3
OklahomaOklahoma City, OK 1,083,346 3 0 0 79 8
Tulsa, OK 803,235 2 0 0 78 6
Fort Smith, AR-OK 207,290 1 0 0 79 0
Lawton, OK 114,996 1 0 0 81 1
OregonPortland-Vancouver, OR-WA 1,918,009 1 0 0 94 1
Salem, OR 347,214 1 0 0 78 0
Eugene-Springfield, OR 322,959 0 0 0 74 1
Medford-Ashland, OR 181,269 0 0 0 68 0
PennsylvaniaPhiladelphia, PA-NJ 5,100,931 29 3 0 101 7
Lancaster, PA 470,658 13 0 0 95 9
Pittsburgh, PA 2,358,695 13 1 0 105 6
Allentown-Bethlehem-Easton, PA 637,958 12 0 0 94 9
Reading, PA 373,638 8 0 0 87 15
Harrisburg-Lebanon-Carlisle, PA 629,401 4 0 0 87 5
Sharon, PA 120,293 4 0 0 82 5
appendix C. metropolitan areas Ranked by Smog days in 2010 Within Each State, Continued

45
PennsylvaniaMetropolitan Area Population Smog
Days in 2010
Red-Alert Days
Purple-Alert Days
Highest Concentration (ppb)
Additional Days the Air Was Unhealthy to Breathe According to a More Protective Standard
York, PA 381,751 4 0 0 88 12
Altoona, PA 129,144 3 0 0 84 5
Erie, PA 280,843 3 0 0 83 5
Scranton-Wilkes-Barre-Hazleton, PA 624,776 3 0 0 82 5
Johnstown, PA 232,621 2 0 0 85 3
Newburgh, NY-PA 387,669 2 0 0 87 6
State College, PA 135,758 2 0 0 78 4
Williamsport, PA 120,044 1 0 0 76 5
Rhode IslandNew London-Norwich, CT-RI 293,566 3 0 0 78 5
Providence-Fall River-Warwick, RI-MA 1,188,613 3 0 0 86 3
South CarolinaCharlotte-Gastonia-Rock Hill, NC-SC 1,499,293 17 1 0 96 20
Greenville-Spartanburg-Anderson, SC 962,441 8 0 0 82 13
Augusta-Aiken, GA-SC 477,441 2 0 0 81 4
Columbia, SC 536,691 2 0 0 81 4
Charleston-North Charleston, SC
549,033 0 0 0 74 2
South DakotaSioux Falls, SD 172,412 0 0 0 68 0
TennesseeKnoxville, TN 687,249 20 0 0 84 27
Memphis, TN-AR-MS 1,135,614 13 0 0 91 11
Nashville, TN 1,231,311 10 0 0 88 18
Chattanooga, TN-GA 465,161 6 0 0 82 11
Clarksville-Hopkinsville, TN-KY 207,033 2 0 0 77 6
Johnson City-Kingsport-Bristol, TN-VA 480,091 2 0 0 80 4
TexasHouston, TX 4,177,646 27 1 0 97 7
Fort Worth-Arlington, TX 1,702,625 15 0 0 94 3
Beaumont-Port Arthur, TX 385,090 13 0 0 91 11
Dallas, TX 3,519,176 12 0 0 87 12
Brazoria, TX 241,767 11 0 0 94 7
appendix C. metropolitan areas Ranked by Smog days in 2010 Within Each State, Continued

46
TexasMetropolitan Area Population Smog
Days in 2010
Red-Alert Days
Purple-Alert Days
Highest Concentration (ppb)
Additional Days the Air Was Unhealthy to Breathe According to a More Protective Standard
Galveston-Texas City, TX 250,158 8 0 0 91 6
Longview-Marshall, TX 208,780 6 0 0 80 12
San Antonio, TX 1,592,383 4 0 0 87 7
Austin-San Marcos, TX 1,249,763 3 0 0 80 7
El Paso, TX 679,622 3 0 0 87 5
Corpus Christi, TX 380,783 2 0 0 78 6
Brownsville-Harlingen-San Benito, TX 335,227 0 0 0 72 2
Killeen-Temple, TX 312,952 0 0 0 75 6
Laredo, TX 193,117 0 0 0 70 0
McAllen-Edinburg-Mission, TX 569,463 0 0 0 66 0
Tyler, TX 174,706 0 0 0 75 6
Victoria, TX 84,088 0 0 0 73 1
Waco, TX 213,517 0 0 0 75 2
UtahSalt Lake City-Ogden, UT 1,333,914 4 0 0 91 7
Flagstaff, AZ-UT 122,366 1 0 0 81 3
Provo-Orem, UT 368,536 1 0 0 84 6
VirginiaWashington, DC-MD-VA-WV 4,923,153 33 3 0 100 17
Richmond-Petersburg, VA 996,512 10 2 0 98 15
Norfolk-Virginia Beach-Newport News, VA-NC
1,569,541 6 1 0 97 9
Charlottesville, VA 159,576 3 0 0 79 1
Johnson City-Kingsport-Bristol, TN-VA 480,091 2 0 0 80 4
Roanoke, VA 235,932 1 0 0 76 5
WashingtonPortland-Vancouver, OR-WA 1,918,009 1 0 0 94 1
Seattle-Bellevue-Everett, WA 2,414,616 1 0 0 77 2
Bellingham, WA 166,814 0 0 0 52 0
Olympia, WA 207,355 0 0 0 60 0
Spokane, WA 417,939 0 0 0 67 0
Tacoma, WA 700,820 0 0 0 69 0
West VirginiaWashington, DC-MD-VA-WV 4,923,153 33 3 0 100 17
Parkersburg-Marietta, WV-OH 151,237 5 0 0 79 7
Huntington-Ashland, WV-KY-OH 315,538 4 0 0 79 8
appendix C. metropolitan areas Ranked by Smog days in 2010 Within Each State, Continued
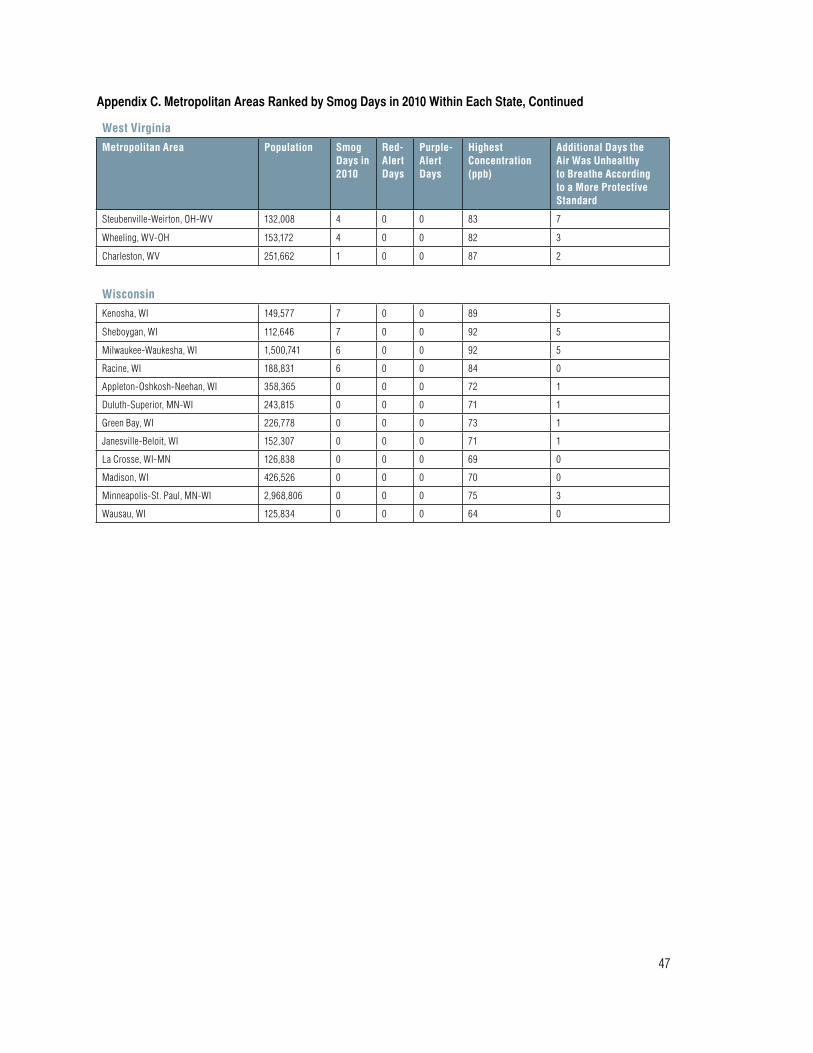
47
West Virginia
Metropolitan Area Population Smog Days in 2010
Red-Alert Days
Purple-Alert Days
Highest Concentration (ppb)
Additional Days the Air Was Unhealthy to Breathe According to a More Protective Standard
Steubenville-Weirton, OH-WV 132,008 4 0 0 83 7
Wheeling, WV-OH 153,172 4 0 0 82 3
Charleston, WV 251,662 1 0 0 87 2
WisconsinKenosha, WI 149,577 7 0 0 89 5
Sheboygan, WI 112,646 7 0 0 92 5
Milwaukee-Waukesha, WI 1,500,741 6 0 0 92 5
Racine, WI 188,831 6 0 0 84 0
Appleton-Oshkosh-Neehan, WI 358,365 0 0 0 72 1
Duluth-Superior, MN-WI 243,815 0 0 0 71 1
Green Bay, WI 226,778 0 0 0 73 1
Janesville-Beloit, WI 152,307 0 0 0 71 1
La Crosse, WI-MN 126,838 0 0 0 69 0
Madison, WI 426,526 0 0 0 70 0
Minneapolis-St. Paul, MN-WI 2,968,806 0 0 0 75 3
Wausau, WI 125,834 0 0 0 64 0
appendix C. metropolitan areas Ranked by Smog days in 2010 Within Each State, Continued

48
appendix d. Smog days in 2011 by Combined Statistical areas, through august 21, 2011
Combined Statistical Area Smog Days in 2011
Red-Alert Days
Purple-Alert Days
Additional Days the Air Was Unhealthy to Breathe According to a More Protective Standard
Highest Concentration (ppb)
Albany-Schenectady-Amsterdam, NY 1 1 82
Ames-Boone, IA 0 0 66
Appleton-Oshkosh-Neenah, WI 1 3 76
Asheville-Brevard, NC 2 2 77
Atlanta-Sandy Springs-Gainesville, GA-AL 34 18 94
Baton Rouge-Pierre Part, LA 12 13 90
Bend-Prineville, OR 0 0 56
Birmingham-Hoover-Cullman, AL 15 1 13 98
Boston-Worcester-Manchester, MA-RI-NH 8 7 91
Brownsville-Harlingen-Raymondville, TX 0 0 66
Buffalo-Niagara-Cattaraugus, NY 6 3 92
Charlotte-Gastonia-Salisbury, NC-SC 21 19 91
Chattanooga-Cleveland-Athens, TN-GA 4 2 79
Chicago-Naperville-Michigan City, IL-IN-WI 15 7 93
Cincinnati-Middletown-Wilmington, OH-KY-IN 20 1 10 97
Claremont-Lebanon, NH-VT 0 0 63
Cleveland-Akron-Elyria, OH 11 9 90
Columbia-Newberry, SC 7 10 85
Columbus-Auburn-Opelika, GA-AL 0 1 71
Columbus-Marion-Chillicothe, OH 7 10 88
Corpus Christi-Kingsville, TX 0 1 75
Dallas-Fort Worth, TX 19 17 95
Dayton-Springfield-Greenville, OH 8 10 85
Denver-Aurora-Boulder, CO 17 1 18 106
Des Moines-Newton-Pella, IA 0 0 68
Detroit-Warren-Flint, MI 10 3 88
Dothan-Enterprise-Ozark, AL 0 0 70
Fargo-Wahpeton, ND-MN 0 0 61
Fond du Lac-Beaver Dam, WI 2 3 82
Fort Wayne-Huntington-Auburn, IN 2 3 77
Fresno-Madera, CA 28 1 17 104
Grand Rapids-Muskegon-Holland, MI 6 3 2 104
Greensboro--Winston-Salem--High Point, NC 7 8 85
Greenville-Spartanburg-Anderson, SC 6 9 89
Gulfport-Biloxi-Pascagoula, MS 0 6 75
Harrisburg-Carlisle-Lebanon, PA 4 6 85
Hartford-West Hartford-Willimantic, CT 6 0 92
Houston-Baytown-Huntsville, TX 15 2 11 112
Huntsville-Decatur, AL 2 3 78
Indianapolis-Anderson-Columbus, IN 5 11 89
Jackson-Yazoo City, MS 3 0 85

49
appendix d. Smog days in 2011 by Combined Statistical areas, through august 21, 2011, Continued
Combined Statistical Area Smog Days in 2011
Red-Alert Days
Purple-Alert Days
Additional Days the Air Was Unhealthy to Breathe According to a More Protective Standard
Highest Concentration (ppb)
Johnson City-Kingsport-Bristol (Tri-Cities), TN-VA 2 3 80
Kansas City-Overland Park-Kansas City, MO-KS 12 13 90
Knoxville-Sevierville-La Follette, TN 15 1 19 98
Lafayette-Acadiana, LA 1 0 76
Lafayette-Frankfort, IN 1 0 77
Lake Charles-Jennings, LA 0 1 72
Lansing-East Lansing-Owosso, MI 0 0 52
Las Vegas-Paradise-Pahrump, NV 9 15 90
Lexington-Fayette--Frankfort--Richmond, KY 5 1 82
Lima-Van Wert-Wapakoneta, OH 2 6 76
Little Rock-North Little Rock-Pine Bluff, AR 10 4 84
Longview-Marshall, TX 4 6 89
Los Angeles-Long Beach-Riverside, CA 85 21 3 20 136
Louisville/Jefferson County-Elizabethtown-Scottsburg, KY-IN 15 2 13 100
Macon-Warner Robins-Fort Valley, GA 6 6 86
Madison-Baraboo, WI 0 0 70
Milwaukee-Racine-Waukesha, WI 4 4 87
Minneapolis-St. Paul-St. Cloud, MN-WI 1 0 80
Mobile-Daphne-Fairhope, AL 2 3 78
Monroe-Bastrop, LA 0 0 70
Montgomery-Alexander City, AL 0 2 73
Nashville-Davidson--Murfreesboro--Columbia, TN 9 4 86
New Orleans-Metairie-Bogalusa, LA 5 8 83
New York-Newark-Bridgeport, NY-NJ-CT-PA 27 7 5 114
Oklahoma City-Shawnee, OK 17 8 86
Omaha-Council Bluffs-Fremont, NE-IA 0 0 70
Orlando-Deltona-Daytona Beach, FL 7 4 81
Paducah-Mayfield, KY-IL 2 3 89
Peoria-Canton, IL 1 0 89
Philadelphia-Camden-Vineland, PA-NJ-DE-MD 18 3 9 101
Pittsburgh-New Castle, PA 11 10 84
Portland-Lewiston-South Portland, ME 2 3 90
Raleigh-Durham-Cary, NC 6 17 88
Reno-Sparks-Fernley, NV 2 0 81
Rochester-Batavia-Seneca Falls, NY 0 1 74
Rockford-Freeport-Rochelle, IL 0 1 75
Sacramento--Arden-Arcade--Yuba City, CA-NV 23 1 10 97
Salt Lake City-Ogden-Clearfield, UT 7 8 83
San Jose-San Francisco-Oakland, CA 2 2 84
San Juan-Caguas-Fajardo, PR 0 0 51

50
Combined Statistical Area Smog Days in 2011
Red-Alert Days
Purple-Alert Days
Additional Days the Air Was Unhealthy to Breathe According to a More Protective Standard
Highest Concentration (ppb)
Santa Fe-Espanola, NM 0 0 65
Sarasota-Bradenton-Punta Gorda, FL 3 2 83
Savannah-Hinesville-Fort Stewart, GA 0 0 67
Seattle-Tacoma-Olympia, WA 0 0 70
Shreveport-Bossier City-Minden, LA 2 7 78
Sioux City-Vermillion, IA-NE-SD 0 0 51
South Bend-Elkhart-Mishawaka, IN-MI 5 5 85
St. Louis-St. Charles-Farmington, MO-IL 23 2 13 102
Syracuse-Auburn, NY 2 0 78
Toledo-Fremont, OH 4 5 84
Tulsa-Bartlesville, OK 15 13 95
Tyler-Jacksonville, TX 0 5 73
Washington-Baltimore-Northern Virginia, DC-MD-VA-WV 28 7 15 114
Wausau-Merrill, WI 0 0 70
Wichita-Winfield, KS 4 7 83
Williamsport-Lock Haven, PA 0 1 71
York-Hanover-Gettysburg, PA 5 4 84
Youngstown-Warren-East Liverpool, OH-PA 4 4 85
appendix d. Smog days in 2011 by Combined Statistical areas, through august 21, 2011, Continued

51
appendix E. Smog days in 2010 by State
State Smog Days in 2010
Red-Alert Days
Purple-Alert Days
Additional Days the Air Was Unhealthy to Breathe According to a More Protective Standard
Highest Concentration (ppb)
Alabama 15 25 88
Alaska 0 0 53
Arizona 14 23 85
Arkansas 8 17 91
California 135 37 2 23 123
Colorado 19 24 89
Connecticut 24 1 13 101
DC 18 1 16 100
Delaware 18 2 20 98
Florida 9 17 88
Georgia 28 1 21 98
Hawaii 0 0 52
Idaho 0 1 73
Illinois 25 17 88
Indiana 18 19 86
Iowa 1 4 77
Kansas 7 14 83
Kentucky 21 1 26 96
Louisiana 23 21 93
Maine 8 1 1 96
Maryland 43 7 18 115
Massachusetts 14 1 11 100
Michigan 14 16 91
Minnesota 1 2 76
Mississippi 7 10 84
Missouri 25 24 91
Montana 0 0 65
Nebraska 0 2 71
Nevada 10 25 84
New Hampshire 8 5 82
New Jersey 35 2 13 111
New Mexico 4 6 84
New York 30 1 22 113
North Carolina 26 1 31 96
North Dakota 0 0 70
Ohio 33 23 94
Oklahoma 8 14 86
Oregon 2 0 94
Pennsylvania 35 3 18 105
Rhode Island 6 4 86

52
State Smog Days in 2010
Red-Alert Days
Purple-Alert Days
Additional Days the Air Was Unhealthy to Breathe According to a More Protective Standard
Highest Concentration (ppb)
South Carolina 8 14 82
South Dakota 0 0 69
Tennessee 29 35 88
Texas 48 1 20 97
Utah* 45 15 5 25 123
Vermont 0 3 71
Virginia 25 3 27 98
Washington 8 2 2 110
West Virginia 10 12 89
Wisconsin 11 7 95
Wyoming 0 2 72
*In Utah, all but 5 of the smog days recorded occurred in Jan-Mar at monitoring stations in the desert, likely as a result of natural gas exploration, and not from the usual culprits of vehicles and power plants. Of the 25 additional days of unhealthy air, 19 are during summer months. Smog days are more likely during summer months because pollution from vehicles and power plants reacts with heat and sunlight to form smog.
appendix E. Smog days in 2010 by State, Continued

53
Endnotes
i American Lung Association, State of the Air 2011
ii M. Lippman, “Health Effects of Ozone: A Critical Review,” Journal of the Air Pollution Control Asso-ciation 39: 672-695, 1989; I. Mudway and F. Kelley, “Ozone and the Lung: A Sensitive Issue,” Molecular Aspects of Medicine 21: 1-48, 2000; M. Gilmour et al., “Ozone-Enhanced Pulmonary Infection with Streptococcus Zooepidemicus in Mice: The Role of Alveolar Macrophage Function and Capsular Viru-lence Factors,” American Review of Respiratory Dis-ease 147: 753-760.
iii Kendall Powell, “Ozone Exposure Throws Monkey Wrench Into Infant Lungs,” Nature Medicine, Vol-ume 9, Number 5, May 2003; R. McConnell et al., “Asthma in Exercising Children Exposed to Ozone: A Cohort Study,” The Lancet 359: 386-391, 2002; N. Kunzli et al., “Association Between Lifetime Ambient Ozone Exposure and Pulmonary Function in College Freshmen – Results of a Pilot Study,” Environmental Research 72: 8-16, 1997; I.B. Tager et al., “Chronic Exposure to Ambient Ozone and Lung Function in Young Adults,” Epidemiology 16: 751-9, November 2005.
iv Bell, Michelle L., et al. “Ozone and Short-term Mortality in 95 Urban Communities, 1987-2000,” 17 November 2004.
v Joel Schwartz, “Air Pollution and Hospital Admissions for the Elderly in Birmingham, Alabama,” American Journal of Epidemiology 139: 589-98, 15 March 1994; Joel Schwartz, “Air Pollution and Hospital Admissions for the Elderly in Detroit, Michigan,” American Jour-nal of Respiratory Critical Care Medicine 150: 648-55, 1994; Joel Schwartz “PM10, Ozone, and Hospital Admissions for the Elderly in Minneapolis-St. Paul, Minnesota,” Archives of Environmental Health 49: 366-374, 1994; Joel Schwartz, “Short-Term Fluctua-tions in Air Pollution and Hospital Admissions of the Elderly for Respiratory Disease,” Thorax 50: 531-538, 1995; J. Schwartz and R. Morris, “Air Pollution and Hospital Admissions for Cardiovascular Disease in Detroit, Michigan,” American Journal of Epidemiol-ogy 142: 23-25, 1995; Joel Schwartz, “Air Pollution and Hospital Admissions for Respiratory Disease,” Epidemiology 7: 20-28, 1996; Joel Schwartz, “Air Pol-lution and Hospital Admissions for Cardiovascular Disease in Tucson,” Epidemiology 8: 371-377, 1997.
vi George Thurston et al., “Respiratory Hospital Ad-missions and Summertime Haze Air Pollution in Toronto, Ontario: Consideration of the Role of Acid Aerosols,” Environmental Research 65: 271-290, 1994; R. Burnett et al., “The Role of Particulate Size and Chemistry in the Association Between Summer-time Ambient Air Pollution and Hospitalization for Cardio-respiratory Disease,” Environmental Health

54
Perspectives 105: 614-620, 1997; R. Burnett et al., “Association Between Ozone and Hospitalization for Respiratory Diseases in 16 Canadian Cities,” Environ-mental Research 72: 24-31, 1997.
vii R. Cody et al., “The Effect of Ozone Associated with Summertime Photochemical Smog on the Fre-quency of Asthma Visits to Hospital Emergency Departments,” Environmental Research 58: 184-194, 1992; C. Weisel et al., “Relationship Between Sum-mertime Ambient Ozone Levels and Emergency De-partment Visits for Asthma in Central New Jersey,” Environmental Health Perspectives 103, Supplement 2: 97-102, 1995; Jennifer Peel et al., “Ambient Air Pollution and Respiratory Emergency Department Visits,” Epidemiology 6:164-174, March 2005.
viii Romley, John A. et al, “The Impact of Air Quality on Hospital Spending,” RAND Health, 2010, down-loaded from http://www.rand.org/pubs/technical_re-ports/2010/RAND_TR777.pdf.
ix George Thurston et al., “Summertime Haze Air Pol-lution and Children with Asthma,” American Journal of Respiratory Critical Care Medicine 155: 654-660, February 1997; A. Whittemore and E. Korn, “Asthma and Air Pollution in the Los Angeles Area,” Ameri-can Journal of Public Health, 70: 687-696, 1980; J. Schwartz et al., “Acute Effects of Summer Air Pollu-tion on Respiratory Symptom Reporting in Children,” American Journal of Respiratory Critical Care Medi-cine 150: 1234-1242, 1994; M. Friedman et al., “Im-pact of Changes in Transportation and Commuting Behaviors During the 1996 Summer Olympic Games in Atlanta on Air Quality and Childhood Asthma,” Journal of the American Medical Association 285: 897-905, 2001; Janneane Gent et al., “Association of Low-level Ozone and Fine Particles with Respiratory Symptoms in Children with Asthma,” Journal of The American Medical Association 290, 1859-1867, 8 Oc-tober 2003; E.W. Triche et al, “Low Level Ozone Ex-posure and Respiratory Symptoms in Infants,” Envi-ronmental Health Perspectives doi:10.1289/ehp.8559 (available at dx.doi.org), online 29 December 2005.
x American Lung Association, State of the Air 2011
xi U.S. Department of Health and Human Services,
National Heart, Lung, and Blood Institute, “National Asthma Education and Prevention Program.”
xii U.S. Environmental Protection Agency, “Health and Environment Effects of Ground-Level Ozone,” 9 February 2011.
xiii B. Ostro and S. Rothschild, “Air Pollution and Acute Respiratory Morbidity: An Observational Study of Multiple Pollutants,” Environmental Research 50: 238-47, 1989; F. Gilliland et al., “The Effects of Ambi-ent Air Pollution on School Absenteeism Due to Re-spiratory Illness,” Epidemiology 12: 43-54, 2001; H. Park et al., “Association of Air Pollution with School Absenteeism Due to Illness,” Archives of Pediatric and Adolescent Medicine 156: 1235-1239, 2002.
xiv U.S. Environmental Protection Agency, “Ozone and Your Health,” 2010.
xv Salam MT, Millstein J, Li Y-F, Lurmann FW, Mar-golis HG, Gilliland FD, “Birth outcomes and prenatal exposure to ozone, carbon monoxide, and particulate matter: results from the children’s health study,” 2005.
xvi American Lung Association, State of the Air 2011
xvii Kunzli N, Lurmann F, Segal M, Ngo L, Balmes J, Tager IB. Association Between Lifetime Ambient Ozone Exposure and Pulmonary Function in College Freshmen - Results of a Pilot Study. Environmental Research, 1997.
xviii U.S. Environmental Protection Agency, “Ozone and Your Health,” 2010.
xix Allergens: U.S. Environmental Protection Agency, “Ozone and Your Health,” 2010; Asthma attack im-pacts: U.S. Environmental Protection Agency, “Health and Environment Effects of Ground-Level Ozone,” 9 February 2011.
xx American Lung Association, State of the Air, 2010.
xxi U.S. Environmental Protection Agency (EPA), “Ozone: Good Up High, Bad Nearby,” 2003. Here-after referred to as “Ozone: Good Up High, Bad Nearby.”
xxii U.S. EPA National Emissions Inventory, Na-

55
tional Sector Emissions for 2008, accessed at http://neibrowser.epa.gov/eis-public-web/download/data-set.html?datasetType=NationalSector&inventoryYear=2008 on 8/1/2011
xxiii Ibid.
xxiv EPA Air Quality Index: A Guide to Air Quality and Your Health, August 2009.
xxv Environmental Law Institute, Estimating U.S. Government Subsidies to Energy Sources: 2002-2008, September 2009.


![ftpcontent.worldnow.comftpcontent.worldnow.com/wkow/newsdocs/2009WIstateprayers[1].pdf · The invocation today will be given by ... story of Solomon becoming King of ... God appears](https://static.fdocuments.us/doc/165x107/5aea4ce67f8b9a585f8c3778/1pdfthe-invocation-today-will-be-given-by-story-of-solomon-becoming-king-of.jpg)