Produced Water Treatment For Recycle 22 nd IPEC – Denver, CO Dan Mueller, P.E.

June 11, 2021
TO: INTERESTED PARTIES
RE: Grace Dairy, Chippewa County
The Minnesota Pollution Control Agency (MPCA) has approved the Findings of Fact, Conclusions of Law, and Order for a Negative Declaration on the need for an Environmental Impact Statement on the Grace Dairy project. The Findings of Fact, Conclusions of Law, and Order document concludes that this project does not have the potential for significant environmental effects. The decision for a Negative Declaration completes the state environmental review process under the revised Environmental Quality Board rules, Minn. R. ch. 4410. Final governmental decisions on the granting of permits or approvals for the project may now be made.
These documents are available for review at the Minneapolis Public Library at 300 Nicollet Mall, Minneapolis (see the Minneapolis Public Library website at https://mplslibrary.com/ for COVID-19 access information). They can also be viewed at Montevideo-Chippewa County Library at 224 S First Street, Montevideo, MN. MPCA offices are closed at this time; however, the document can be viewed on MPCA‘s website at https://www.pca.state.mn.us/regulations/projects-under-mpca-review.
We want to express our appreciation for comments submitted on the Environmental Assessment Worksheet. Comments and responses to them have been incorporated into the Findings of Fact, Conclusions of Law, and Order and have been considered by MPCA staff during the permit process for the proposed project.
Sincerely,
Dan R Card, P.E. This document has been electronically signed.
Dan R. Card, P.E. Supervisor, Environmental Review Unit St. Paul Office Resource Management and Assistance Division
DRC:bt
p-ear2-178b

Printed on recycled paper containing at least 30% fibers from paper recycled by consumers
STATE OF MINNESOTA
MINNESOTA POLLUTION CONTROL AGENCY
IN THE MATTER OF THE DECISION ON THE NEED FOR AN ENVIRONMENTAL IMPACT STATEMENT FOR THE PROPOSED GRACE DAIRY GRACE TOWNSHIP CHIPPEWA COUNTY, MINNESOTA
FINDINGS OF FACT CONCLUSIONS OF LAW AND ORDER
Pursuant to Minn. ch. 4410, the Minnesota Pollution Control Agency (MPCA) staff prepared and distributed an Environmental Assessment Worksheet (EAW) for the proposed Grace Dairy. Based on the MPCA staff environmental review, the EAW, comments and information received during the comment period, and other information in the record of the MPCA, the MPCA hereby makes the following Findings of Fact, Conclusions of Law, and Order.
FINDINGS OF FACT
Project Description 1. Riverview, LLP (Riverview) proposes to build a new 10,500 head Jersey dairy feedlot in Section 23,
Grace Township, in Chippewa County (Project).
2. Riverview will construct the following structures:
One 16’ x 32’ enclosed shed with concrete floor for the temporary storage of dead animals (facility 107)
One 145’ x 240’ enclosed shed with concrete floor (facility 111) that will hold multiple feedstuffs
One 100’ x 200’ shed with gravel floor for dry straw bale storage (facility 112)
One 72’ x 80’ shop (facility 113)
One 610’ x 320’ cross-ventilated confinement free-stall barn with concrete floor (facility 114) that will house 1,600 animal units (AU) of Jersey cows
One 610’ x 1,206’ cross-ventilated confinement free-stall barn with concrete floor (facility 115) that will house 8,900 AU of Jersey cows
One 40’ x 610’ covered vehicle drive alley that connects facility 114 and 115
One 72’ x 265’ holding pen with concrete floor (facility 117) that will temporarily house milk cows that are being transported to the milking parlor (facility 118)
One 124’ x 210’ milking parlor (facility 118)
One weight scale (facility 119)
One 850’ x 850’ asphalt pad for storage of covered feedstuffs such as silage, haylage, etc. (facility 120)
Two 12,000-gallon aboveground diesel fuel storage tanks and containment area (facility 121)
Three stormwater basins (201, 203 and 204)
Two on-site apartment buildings
One on-site production well for dairy use or groundwater monitoring
Three off-site production wells for dairy use
One potable well for domestic use

On the Need for an Environmental Impact Statement Findings of Fact Grace Dairy Conclusions of Law Grace Township, Chippewa County And Order
2
3. Riverview will construct the following manure storage structures:
Two 725’ x 475’ clay-lined liquid manure storage area (LMSA) basins that are 21’ deep (facilities 101 and 102) with synthetic covers
One 150’ x 455’ LMSA that is 21’ deep (facility 103) with a straw cover
One 545’ x 475’ LMSA that is 21’ deep (facility 104) with a synthetic cover
One 340’ x 590’ LMSA that is 21’ deep (facility 105) with a synthetic cover
One 310’ x 310’ concrete slab used for storage of separated manure solids (facility 106)
One 120’ x 140’ shed with concrete floors for the processing and temporary storage of separated manure solids (facility 108)
One 36’ x 36’ concrete tank that is 12’ deep for temporary manure storage (facility 109)
One 80’ x 150’ concrete box that is 11’ deep for the temporary capture of feed pad runoff (facility 110)
One 16’ x 32’ concrete tank that is 16’ deep for temporary storage of parlor wash water (facility 116)
One 230’ x 650’ runoff basin that is 10’ deep for the temporary capture and storage of feed pad runoff (facility 202)
4. Riverview plans to begin construction and operation of the Project in the spring of 2021. However,
Riverview’s actual construction dates are dependent upon the completion of the environmental review process, issuance of the Minnesota Department of Natural Resources (DNR) Water Appropriation Permit, a DNR License to Cross Public Lands and Waters, the State of Minnesota General Animal Feedlot National Pollutant Discharge Elimination System (NPDES) Permit (Feedlot Permit MNG440000), and Conditional Use Permit and Septic Permit from Chippewa County.
5. The Project will generate approximately 86 million gallons of manure annually. Riverview will collect manure generated in the barn and holding pen using self-propelled vacuum wagons, and transport it to the manure storage tank. Riverview will route the manure through screw-press solid separators to retain the manure solids for use as cow bedding in the dairy barn free-stalls. The liquid manure is transferred to area farmers for application to cropland in the fall following harvest.
6. Riverview does not control or own any of the land for the manure application sites designated for
the Project. The manure recipient controls the land on all of the manure application sites designated for the Project.
7. Riverview will transfer all manure to farms in the area where a commercial animal waste technician (CAWT) will inject the manure into fields. Manure application is a replacement for commercial fertilizer. The CAWT will land apply manure to cropland according to Riverview’s MPCA-approved Manure Management Plan (MMP).
8. Riverview applied for coverage under the new Feedlot General NPDES Permit MNG440000 on November 6, 2019.
Procedural History
9. An EAW is a brief document designed to provide the basic facts necessary for the Responsible
Governmental Unit (RGU) to determine whether an Environmental Impact Statement (EIS) is
On the Need for an Environmental Impact Statement Findings of Fact Grace Dairy Conclusions of Law Grace Township, Chippewa County And Order
3
required for a proposed project or to initiate the scoping process for an EIS (Minn. R. 4410.0200, subp. 24). The MPCA is the RGU for this Project.
10. Minn. R. 4410.4300, subp. 1 requires preparation of an EAW for the Project because it is the
construction of an animal feedlot with a capacity of 1,000 AU or more, which exceeds the threshold identified in subp 29. A.
11. The MPCA provided public notice of the Project as follows:
a. The Environmental Quality Board (EQB) published the notice of availability of the EAW for public comment in the EQB Monitor on March 30, 2021 as required by Minn. R. 4410.1500.
b. The EAW was available for review on the MPCA website at: www.pca.state.mn.us/eaw. c. The MPCA provided a news release to media in Willmar, Benson, Morris, Olivia, Montevideo,
Marshall, and Kerkhoven Minnesota, and other state-wide interested parties, on March 30, 2021.
d. Riverview’s application for permit coverage under the Feedlot Permit was open for public comment from March 30, 2021, through April 29, 2021.
12. During the 30-day comment period on the EAW ending on April 29, 2021, the MPCA received
comments from the Minnesota State Historic Preservation Office, the Minnesota Department of Natural Resources, the Minnesota Center for Environmental Advocacy, and 15 comments from community members. The MPCA also received one late comment letter on April 30, 2021; this untimely comment did not include any new or significant information.
13. On May 3, 2021, the MPCA requested and was granted approval from the EQB for a 15-day
extension of the decision making process on the need for an EIS for the Project in accordance with Minn. R. 4410.1700 Subpart 2. B.
14. The list of comment letters received during the 30-day public comment period are included as Appendix A to these Findings.
15. The MPCA prepared written responses to the comments received during the 30-day public comment
period. These responses are included as Appendix B to these Findings.
Criteria for Determining the Potential for Significant Environmental Effects
16. The MPCA shall base its decision on the need for an EIS on the information gathered during the EAW
process and the comments received on the EAW (Minn. R. 4410.1700, subp. 3). The MPCA must order an EIS for projects that have the potential for significant environmental effects (Minn. R. 4410.1700, subp. 1). In deciding whether a project has the potential for significant environmental effects, the MPCA must compare the impacts that may be reasonably expected to occur from the Project with the criteria set forth in Minn. R. 4410.1700, subp. 7. These criteria are:
A. Type, extent, and reversibility of environmental effects.
B. Cumulative potential effects. The responsible governmental unit (RGU) shall consider the
following factors: whether the cumulative potential effect is significant; whether the contribution from the project is significant when viewed in connection with other contributions

On the Need for an Environmental Impact Statement Findings of Fact Grace Dairy Conclusions of Law Grace Township, Chippewa County And Order
4
to the cumulative potential effect; the degree to which the project complies with approved mitigation measures specifically designed to address the cumulative potential effect; and the efforts of the proposer to minimize the contributions from the project.
C. The extent to which the environmental effects are subject to mitigation by ongoing public
regulatory authority. The RGU may rely only on mitigation measures that are specific and that can be reasonably expected to effectively mitigate the identified environmental impacts of the project.
D. The extent to which environmental effects can be anticipated and controlled as a result of other
available environmental studies undertaken by public agencies or the project proposer, including other EISs.
The MPCA Findings with Respect to Each of These Criteria
Are Set Forth Below Type, Extent, and Reversibility of Environmental Effects 17. The first criterion that the MPCA must consider when determining if a project has the potential for
significant environmental effects is the “type, extent, and reversibility of environmental effects” Minn. R. 4410.1700, subp. 7. A. The MPCA findings with respect to this criterion are set forth below.
18. The types of impacts that are reasonably expected to occur from the Project include the following:
Surface water and groundwater quality
Groundwater appropriation
Air quality related to hydrogen sulfide, ammonia, odor, and greenhouse gas (GHG) emissions
19. With respect to the extent and reversibility of impacts that are reasonably expected to occur from
the Project, the MPCA makes the following Findings.
Surface Water and Groundwater Quality 20. The EAW outlines construction and operational best management practices Riverview will use to
comply with the water quality discharge standards of Minn. R. 7020.2003 and the Feedlot Permit, Part 16. This includes the requirement to manage the operation of the Project to contain all contaminated runoff and the direct precipitation up to the volume from a 25 year 24 hour storm event.
21. Minn. R. 7020.2015 and the Feedlot Permit Part 26 requires that all animals at the feedlot must not
be allowed to enter waters of the state.
22. The Project will result in the creation of more than 1 acre of new impervious surface, therefore, in compliance with Minn. R. 7090.2020 and the Feedlot Permit, Part 4.6, Riverview is required to install permanent stormwater treatment. Riverview will install a series of permanent stormwater runoff basins on the Project site to collect, filter, treat and discharge the runoff.

On the Need for an Environmental Impact Statement Findings of Fact Grace Dairy Conclusions of Law Grace Township, Chippewa County And Order
5
23. Storage of liquid manure is required to be in a structure that meets the design criteria of Minn. R. 7020.2100. Additionally, subp. 4 and the Feedlot Permit, Part 4.2, states that a design engineer (a professional engineer licensed in the state of Minnesota or a Natural Resources Conservation Service (NRCS) staff person having NRCS approval authority for the project) is required to design and oversee construction of liquid manure storage structures.
24. As required by Minn. R. 7020.2100, a perimeter tile will be installed around the LMSAs in order to
protect the liners of the structure from impacts due to water table fluctuation and reduce external groundwater pressure on the walls. The perimeter tile system is required to have access for visual observation, as described in the Feedlot Permit, Part 11.3, to ensure the storage system is functioning properly.
25. Riverview must maintain records of all inspections as part of the operation and maintenance for the
LMSAs. Riverview will follow the Operation and Maintenance Plan submitted as part of its Feedlot Permit application. The plan is integral to the Feedlot Permit, and must meet the requirements of Minn. R. 7020.2100.
26. Storage of solid manure is required to be done in accordance with Minn. R. 7020.2125.
27. The Feedlot Permit requires that the Permittee manage all manure in accordance with its MPCA-
approved MMP. The MMP describes how manure generated at the feedlot is land applied in a way that maximizes the benefits to cropland, meets all rules and regulations, and protects surface water and groundwater quality.
28. Minnesota’s “Final Animal Agriculture Generic Environmental Impact Statement” (2002) and the University of Minnesota Agriculture Extension Program state that manure not only supplies nutrients, but can also improve the biological and physical properties of soil, making it more productive and less erosive. Manure provides valuable organic matter to soil that improves soil tilth, aids in the retention of water and nutrients, and promotes growth of beneficial microorganisms. Manure, when properly used as part of a soil management program, improves soil quality, builds soil structure, and increases the level of soil organic matter. Commercial fertilizers cannot provide these same improvements to soil properties.
29. All intensively farmed cropland in Minnesota receives applications of nutrients to promote crop growth. The addition of nutrients from any source to the environment creates a potential for environmental impact when that application is not performed responsibly. The MMP for the Project requires that nutrients from manure be applied in accordance with the Feedlot Permit and Minn. R. 7020.2225.
30. In order to minimize the potential for nitrate leaching into the groundwater at the manure
application sites, manure will be applied at nitrogen-based agronomic rates for the type of crop grown in accordance with Minn. R. 7020.2225, subp. 3 and the Feedlot Permit Part 13.3. Nitrogen contributions from all sources, including commercial fertilizers, must be accounted for when determining the application rate of manure. The total of nitrogen from all sources cannot exceed the agronomic needs of the crop.

On the Need for an Environmental Impact Statement Findings of Fact Grace Dairy Conclusions of Law Grace Township, Chippewa County And Order
6
31. In order to minimize impacts from surface runoff at the manure application sites, all manure application is required to observe setbacks to waters, open tile intakes, sinkholes, mines, quarries, and wells as required in Minn. R. 7020.2225 and the Feedlot Permit. Where a county also has setback requirements, application of manure must follow the most restrictive of the state or county setback requirements.
32. The Feedlot Permit requires transport of manure in a manner to prevent it from leaking or spilling on to public roadways. If manure leakage or spillage does occur, it must be cleaned up and land applied in accordance with Minn. R. 7020.2010 and the Feedlot Permit.
33. Riverview has identified 12,114 acres of cropland available for manure application. Based upon the
approved MMP, this is adequate for land application of the manure at agronomic rates. 34. When Riverview transfers ownership of its manure to a third-party recipient, the Feedlot Permit
requires Riverview, prior to or at the time of manure land application, to provide the manure recipient with the most current manure nutrient analysis. The recipient of the manure must ensure that the agronomic rates of the crop are not exceeded by the application of nutrients from manure, including contributions from any other source. The recipient is also required to keep records of the manure applications, including location, rate, nutrients and nutrients applied. These records are identical to those required to be kept when manure ownership is not transferred.
35. The MMP for the Project indicates all manure applications will be injected using a knife injection
system, which further limits potential impacts due to runoff from the land application sites. This also limits the potential for bacterial transport from the manure application sites to waters.
36. When a CAWT is hired to spread the manure, they must keep records of the quantity and nutrient
content of the manure delivered as well as the location and rate of application.
37. As required by the Feedlot Permit Section 24.2, Riverview must keep records of manure application activities for the six most recent years. The records must include the amount and nutrient content of manure, location where the manure is applied, and the rate of application.
38. The MPCA finds that, when manure is applied in accordance with the MMP required by the Feedlot
Permit, the amount of nutrients in stormwater runoff from the fields used for manure application will be similar to the existing conditions resulting from nutrient application via commercial fertilizer.
39. The MPCA finds that the mitigation measures specified above, including those in the Feedlot Permit and MMP, will prevent or minimize potential water quality impacts.
40. The MPCA does not reasonably expect significant adverse impacts to water quality; however, if they were to occur, Riverview must modify the operation and management of the Project. The MPCA would require modification of the Feedlot Permit coverage for those items found to cause pollution of waters, including modification of the MMP, for impacts from land application, and the impacts to waters would be reversed.
41. The MPCA finds that information presented in the EAW and other information in the environmental
review record are adequate to assess potential impacts to the quality of surface water and groundwater that are reasonably expected to occur from the Project.

On the Need for an Environmental Impact Statement Findings of Fact Grace Dairy Conclusions of Law Grace Township, Chippewa County And Order
7
42. The MPCA finds the Project, as proposed, does not have the potential for significant environmental effects based on the type, extent and reversibility of impacts related to surface water and groundwater quality, which are reasonably expected to occur.
Groundwater Appropriation 43. After construction completion, Riverview will appropriate approximately 120 million gallons per year
(MGPY) from three off-site production wells and one on-site production well for the Project. 44. This level of water use will require Riverview to obtain a DNR Water Appropriation Permit for the
Project because it is over the DNR’s permitting threshold of 1 MGPY. Riverview has applied for the DNR Water Appropriation Permit.
45. Riverview has installed one production well on-site along the western property boundary (206’ deep)
and one production well off-site (213’ deep). These two wells were used to conduct aquifer tests by Riverview.
46. Based on the first aquifer test on the Project site, the DNR determined that the total estimated water appropriation for the Project in that location would not be sustainable, and an off-site well field would be required.
47. Riverview plans to construct two more production wells off-site pending receipt of all necessary permits. All off-site wells will be constructed in an off-site well field approximately five miles south of the Project site in the SE ¼ of Section 15, T118N, R39W, Havelock Township, Chippewa County.
48. The second aquifer test was conducted by Riverview in collaboration with DNR Groundwater Unit staff
at the off-site well field. The data was used to determine aquifer parameters such that the proposed pumping rate of 320 gallons per minute and annual maximum of 120 MGPY is reasonable and within safe yield guidelines over the expected life of the project (20 years). In the January 19, 2021 Riverview-Grace Dairy Aquifer Test Summary, the DNR concluded that, "Surface water resources are not likely to be impacted by the Riverview pumping at this site.”
49. According to the January 19, 2021 DNR Riverview-Grace Dairy Aquifer Test Summary, the cumulative
effects of all the pumping in the area including the Project in the off-site well field demonstrated that Riverview can remain within confined aquifer threshold levels that have been established to maintain the sustainability of the aquifer resource. Long-term monitoring of the source aquifer will also be required as a condition of an issued Water Appropriation Permit.
50. As outlined in the January 19, 2021 DNR Riverview-Grace Dairy Aquifer Test Summary, the DNR has
established a two-tiered confined aquifer protection threshold to ensure the long-term viability of the pumped aquifer and to prevent the exceedance of the aquifer safe yield. These thresholds allow for appropriation from the aquifer, but establish minimum water level elevations to be maintained as a safeguard to protect the structural integrity of the aquifer itself. The pumping proposed for the Project is not expected to lower water in the on-site observation well levels below the 50% confined aquifer threshold elevation over the life of the Project.
On the Need for an Environmental Impact Statement Findings of Fact Grace Dairy Conclusions of Law Grace Township, Chippewa County And Order
8
51. The DNR is the permitting authority for appropriating waters of the state in Minnesota. The DNR Water Appropriations Permit allows for a reasonable use of water if the use does not negatively impact surrounding wells or other water resources.
52. The purpose of the DNR Water Appropriation Permit is to ensure water resources are managed so
that adequate supply is available for long-range seasonal requirements for domestic, agricultural, fish and wildlife, recreational, power, navigational, and water quality control.
53. Minn. Stat. 103G.265 requires the DNR to manage water resources to ensure an adequate supply to
meet long-range seasonal requirements for domestic, agricultural, fish and wildlife, recreational, power, navigation, and quality control purposes. The Water Appropriation Permit Program exists to balance competing management objectives that include both development and protection of Minnesota's water resources.
54. Minn. Stat. 103G.261 establishes domestic water use as the highest priority of the State’s water when supplies are limited. If a well interference arises as described in Minn. R. 6115.0730, subp. 1. C., the DNR has a standard procedure for investigating the matter. If the DNR finds a commercial operator is causing interference, the operator must correct it.
55. Unauthorized pumping or use of the well or other water resources is subject to enforcement under Minn. Stat. ch. 103. Upon completion of an investigation, a permit for water appropriation may be limited, amended, or denied in accordance with applicable laws and rules for the protection of the public interests and the sustainability of Minnesota’s water resources.
56. All potentially significant environmental effects, if any, confirmed through the aquifer test will be
addressed and mitigated by DNR’s ongoing regulatory authority through its water appropriation permit process.
57. Due to the DNR oversight and permitting of water appropriations, the MPCA does not expect
significant adverse impacts to water appropriation. However, if the DNR determines there is well interference based on concerns or well interference claims, the operator must fix the causes of the interference. Thus, the impacts to water appropriations would then be reversed. The MPCA finds that any water appropriation impacts that may occur from the Project are reversible.
58. The MPCA finds that the Project, as proposed, does not have the potential for significant
environmental effects based on the type, extent, and reversibility of impacts related to water appropriations that are reasonably expected to occur.
Air Quality 59. Riverview conducted air dispersion modeling in November 2019 to estimate the atmospheric
concentrations of hydrogen sulfide, ammonia, and the intensity of odorous gases at the Project property lines and nearest neighbors.
60. Riverview’s air modeling used the American Meteorological Society Regulatory Model (AERMOD)
developed by the American Meteorological Society and the U.S. Environmental Protection Agency (EPA). The model evaluated the air quality impacts of the Project. AERMOD is a widely accepted air dispersion model, which uses conservative assumptions to predict air quality.

On the Need for an Environmental Impact Statement Findings of Fact Grace Dairy Conclusions of Law Grace Township, Chippewa County And Order
9
61. Riverview will utilize clay-lined LMSAs with synthetic covers and one straw covered LMSA for
temporary storage. These are operational and design features to avoid and minimize adverse air and odor emissions.
Air Quality Related to Hydrogen Sulfide Emissions
Minnesota Ambient Air Quality Standards (MAAQS) 62. The air modeling predicts that the Project will comply with the 30 parts per billion (ppb) hydrogen
sulfide MAAQS. Under the hydrogen sulfide MAAQS, the third exceedance of the MAAQS within any 5-day period is a violation. The high-third-high is the third highest predicted concentration at each modeling receptor. This result is used because the hydrogen sulfide standard only considers the third exceedance a violation. The air modeling demonstrates compliance when the high-third-high hydrogen sulfide concentration (added to background concentration) for any 5-day period at each property-line receptor is less than 30 ppb.
63. The air modeling predicts that the Project emissions alone will result in a maximum property-line
hydrogen sulfide concentration of 6.7 ppb. The estimated ambient air concentration for hydrogen sulfide in the Project area is 17 ppb. The total (Project emissions plus existing background) hydrogen sulfide concentration is predicted to be 23.7 ppb at the Project’s property lines.
Sub-Chronic Inhalation Health Risk Value (iHRV)
64. The air modeling predicts that the Project will not exceed the 10 micrograms per cubic meter
(μg/m3) subchronic (13-week) hydrogen sulfide iHRV at neighboring residences. iHRVs are concentrations of chemicals emitted to air that are unlikely to pose a significant risk of harmful effects when humans are exposed to those concentrations over a specified period.
65. The air modeling predicts that the Project emissions alone will result in a maximum monthly
hydrogen sulfide concentration of 0.13 μg/m3 at the nearest residence. The estimated hydrogen sulfide background concentration in the Project area is 1.0 μg/m3. The predicted total maximum monthly hydrogen sulfide concentration at the neighboring residences is 1.13 μg/m3. Note that while the iHRV is for a 13-week period, AERMOD is not capable of averaging concentrations for that time-period, so a monthly averaging period was used instead. The monthly averaging period is acceptable because it produces a more conservative or protective prediction than the 13-week period.
66. Based on the air modeling results discussed above, the MPCA finds that hydrogen sulfide emissions
expected from the Project do not present the potential for significant environmental effects. Air Quality Related to Ammonia Emissions
Acute iHRV 67. The air modeling predicts that the Project will not exceed the 3,200 μg/m3 (1-hour) acute ammonia
iHRV at the Project’s property-line.

On the Need for an Environmental Impact Statement Findings of Fact Grace Dairy Conclusions of Law Grace Township, Chippewa County And Order
10
68. The air modeling predicts that the Project emissions alone will result in a maximum hourly property-line ammonia concentration of 1,290 μg/m3. The estimated ammonia background concentration in the Project area is 150 μg/m3. The maximum total (Project emissions plus existing background) property-line ammonia concentration is predicted to be 1,440 μg/m3.
Chronic iHRV
69. The air modeling predicts that the Project will not exceed the 80 μg/m3 (1-year) chronic ammonia iHRV at neighboring residences to the Project site.
70. The air modeling predicts that the Project emissions alone will result in a maximum 1-year time
averaged ammonia concentration of 5.5 μg/m3 at the neighboring residences. The estimated ammonia background concentration in the Project area is 5.7 μg/m3. The maximum total (Project emissions plus existing background) ammonia concentration is predicted to be 11.2 μg/m3 at the nearest residences.
71. Based on the air modeling results discussed above, the MPCA finds that ammonia emissions
expected from the Project do not present the potential for significant environmental effects. Air Quality Related to Odor Emissions
72. Although the state of Minnesota has not established ambient air quality standards to regulate odor, Riverview completed air dispersion modeling for odor. Modeling for odor calculates both the maximum intensity on an hourly basis, as well as the most common intensity on an hourly basis.
73. The modeled maximum hourly odor intensity at the Project’s property lines is 147 odor units per
cubic meter (OU/m3) and occurs at the south boundary line. This predicted odor intensity is considered “moderate” as defined by the air modeling report used in the EAW for this Project. For at least 99.9% of the time, e.g. the most common intensity modeled, the modeled hourly odor intensities at the Project’s property-lines were less than the 83 OU threshold for faint odors.
74. The modeled maximum hourly odor intensity, at the nearest residences, is 80 OU/m3. This predicted
an odor intensity to be considered “faint.” 75. Riverview has submitted an air emissions and odor management plan to the MPCA with its Feedlot
Permit application. The plan includes measures that Riverview will take to minimize the generation of odors from its proposed feedlot and associated manure application activities. Riverview will use belowground manure storage pits and immediately inject manure into the soil as its manure application method to minimize odors. Riverview has also taken measures as listed in Section 6B of the EAW to further reduce odors.
76. Based on the modeling results discussed above, the MPCA finds that the expected odor at
Riverview’s property lines and nearby residences does not present the potential for significant environmental effects.
Air Quality Related to Greenhouse Gas Emissions 77. The MPCA considered GHG emission sources that are within the scope of the Project.

On the Need for an Environmental Impact Statement Findings of Fact Grace Dairy Conclusions of Law Grace Township, Chippewa County And Order
11
78. The primary GHG emissions from dairy operations are methane (CH4) from manure storage and enteric fermentation, and nitrous oxide (N2O) from manure storage and manure land application.
79. The Project will directly release GHG emissions, which have the ability to widely disperse within the
atmosphere and which vary both in terms of their global warming potential and their persistence in the atmosphere.
80. To provide a common unit of measure, the MPCA uses the individual global warming potential of methane and nitrous oxide to convert to carbon dioxide equivalency (CO2e).
81. Using EPA emission factors, the MPCA estimates that after construction, the Project will release
approximately 76,106 tons of CO2e annually from enteric fermentation, manure storage, and land application of manure.
82. There are no Minnesota or National Ambient Air Quality Standards for GHGs.
83. At this time, there are no federal or Minnesota thresholds of GHG significance for determining impacts of GHG emissions from an individual project on global climate change.
84. In the absence of a threshold of GHG significance, the MPCA looks to existing regulation. Minn. R.
4410.4300, subp. 15, Part B, establishes a mandatory category requiring preparation of an EAW for stationary source facilities generating 100,000 tons per year (TPY) of GHGs. The purpose of an EAW is to assess environmental effects associated with a proposed project to aid in the determination of whether an EIS is needed. On the premise of GHG emissions, environmental review regulations establish 100,000 TPY as a “trigger” to prepare an EAW to aid in determining potential significant environmental effects. A reasonable conclusion is that the Project’s GHG emissions below 100,000 TPY are not considered significant.
Summary of Air Quality Impacts
85. The MPCA expects the Project to meet applicable air quality standards and criteria. 86. With respect to the reversibility of air quality impacts expected to occur from the Project, air
emissions from the Project will continue while it remains in operation and would cease only if the Project were temporarily or permanently closed.
87. If excessive air emissions, violations of the hydrogen sulfide MAAQS, or exceedances of the iHRVs
for hydrogen sulfide and ammonia were to occur, air quality impacts are likely to be correctable. The MPCA could initiate an investigation and require Riverview to make operation and maintenance changes. Therefore, the MPCA finds that any impacts on air quality that may occur from the Project are reversible.
88. The MPCA finds that information presented in the EAW and other information in the environmental
review record are adequate to assess the impacts on air quality that are reasonably expected to occur as a result of the Project.
89. The MPCA finds the Project, as proposed, does not have the potential for significant environmental
effects based on the type, extent, and reversibility of impacts on air quality that are reasonably expected to occur from the Project.

On the Need for an Environmental Impact Statement Findings of Fact Grace Dairy Conclusions of Law Grace Township, Chippewa County And Order
12
Cumulative Potential Effects 90. The second criterion that the MPCA must consider when determining if a project has the potential
for significant environmental effects is the “cumulative potential effects.” In making this determination, the MPCA must consider “whether the cumulative potential effect is significant; whether the contribution from the project is significant when viewed in connection with other contributions to the cumulative potential effect; the degree to which the project complies with approved mitigation measures specifically designed to address the cumulative potential effects; and the efforts of the proposer to minimize the contributions from the project,” Minn. R. 4410.1700, subp. 7 B. The MPCA Findings with respect to this criterion are set forth below.
91. The EAW, public comments, and MPCA follow-up evaluation did not disclose any related or
anticipated future projects that may interact with this Project in such a way as to result in significant cumulative potential environmental effects.
92. The EAW addressed the following areas for cumulative potential effects for the proposed Project:
Surface water and groundwater quality
Groundwater appropriation
Air quality Surface Water and Groundwater Quality 93. The Project and its associated manure application sites are within the Chippewa River and
Minnesota River watersheds in Swift, Chippewa, and Yellow Medicine counties. 94. The Project and its manure application sites are in areas where the land use is predominantly
agricultural. 95. Shakopee Creek (east line to Shakopee Lake) is the closest listed impaired waterbody to the Project. 96. Shakopee Creek (AUID: 07020005-734) is within the Chippewa River Watershed and is
approximately 150 feet from the closest of Riverview’s proposed manure application sites in Section 7 of Township 119N. This reach is approximately 3 miles northeast of the Project site. MPCA’s draft 2020 impaired waters list identifies this reach of the creek as being impaired for aquatic life due to poor benthic macroinvertebrates bioassessments and also for aquatic recreation due to high Escherichia coli.
97. A Total Maximum Daily Load (TMDL) plan for Shakopee Creek (AUID: 07020005-734) was approved
for Escherichia coli in 2017 (TMDL ID PRJ07668-001). A TMDL plan has not been completed for benthic macroinvertebrates bioassessments yet. The target date for completion is 2023.
98. Riverview will design and build the Project as a total confinement operation. This limits the potential
for precipitation coming in contact with the animals or manure generated at the feedlot and creating contaminated runoff.
99. All manure will be stored within a storage structure approved by the MPCA and meet the design
requirements of Minn. R. ch. 7020, which limits the potential for impacts to surface or groundwater

On the Need for an Environmental Impact Statement Findings of Fact Grace Dairy Conclusions of Law Grace Township, Chippewa County And Order
13
quality. Riverview is required by the Feedlot Permit Part 21.2 to examine any LMSA drain tile outlet monthly for water flow and signs of discoloration or odor in any water in the drain tile.
100. Minn. R. 7020.2003 and the Feedlot Permit prohibit discharge of manure, manure contaminated
runoff, or process wastewater from the animal feedlot to waters of the state except when authorized by the Feedlot Permit as a result of extreme or chronic rainfall events. As a result, the discharge of manure or manure-contaminated runoff to waters of the state from the production area is not reasonably expected to occur.
101. All manure application must occur at agronomic rates and comply with Minn. R. ch. 7020, the
Feedlot Permit, county setback requirements, as well as all other applicable federal, state, and local rules, whichever are the most restrictive.
102. Land application of manure from the Project will be required to follow the MPCA-approved MMP. 103. If a manure spill occurs, Riverview will be required to comply with an Emergency Response Plan
developed as part of the Feedlot Permit application process and incorporated into the Feedlot Permit. Minn. Stat. 115.061 and the Feedlot Permit Part 27.2 requires that all manure spills be reported directly to the agency or to the Minnesota Duty Officer and that all responsible parties take immediate action to stop the discharge and recover the material.
104. Proper operation and management of the Project and adherence to appropriate manure land
application practices in the MPCA-approved MMPs will limit the potential of manure and/or manure-contaminated stormwater runoff from impacting waters of the state.
105. Since Riverview’s Feedlot Permit and MMP will require preventative measures to protect surface
water and groundwater quality, the MPCA does not anticipate the Project will contribute to any potential adverse effect on water quality. Therefore, the MPCA finds that the Project is not expected to contribute significantly to adverse cumulative potential effects on water quality.
Groundwater Appropriation
106. There is currently one well on the Project site and one well in the off-site well field. Two additional
wells will be installed in the off-site well field for the Project. The existing wells are registered with the Minnesota Department of Health (MDH). Riverview expects to use 120 MGPY, for a total consumption of approximately 2.4 billion gallons over 20 years.
107. The Project will result in a withdrawal of over 1 MGPY and, therefore a DNR Water Appropriation
Permit will be required for the Project. Riverview has submitted an application for a Water Appropriation Permit for the Project to the DNR.
108. The purpose of the DNR Water Appropriation Permit is to ensure water resources are managed so
that adequate supply is available for long-range seasonal requirements for domestic, agricultural, fish and wildlife, recreational, power, navigational, and water quality control. The permit program balances competing management objectives, including both the development and protection of water resources. Minn. Stat. § 103G.261 establishes domestic water use as the highest priority of the state’s water when supplies are limited. If a well interference arises, the DNR has a standard

On the Need for an Environmental Impact Statement Findings of Fact Grace Dairy Conclusions of Law Grace Township, Chippewa County And Order
14
procedure for investigating the matter. If the DNR determines that a commercial operator is causing the problem, the operator must correct it.
109. Based on the regulatory oversight of the DNR in issuing a Water Appropriation Permit that ensures
adequate supply, the MPCA finds that the Project is not expected to contribute significantly to adverse cumulative potential effects on water appropriation.
Air Quality 110. The MPCA evaluated cumulative potential effects on air quality by comparing the MAAQS for
hydrogen sulfide, iHRVs for hydrogen sulfide and ammonia, and odor intensity thresholds with concentrations in the air predicted by air modeling.
111. The air modeling analysis included the estimated emissions from the Project, emissions from nearby feedlots, and incorporated conservative background concentrations to account for other possible sources of emissions in the area. Riverview estimated air concentrations for these pollutants at the residences closest to the Project.
112. All modeled air pollutant concentrations for the Project were below the health-based criteria used in the analyses. Therefore, the MPCA finds that cumulative potential effects on air quality will not be significant in the Project area, and the Project will not contribute significantly to adverse cumulative potential effects on air quality.
113. Global climate change results from the total accumulation of GHG emissions in the Earth’s
atmosphere, as well as other man-made and natural factors. The GHG composition of the Earth’s atmosphere is changing and causing the planet’s climate to change.
114. While it may be possible to model the effects of the incremental GHG emissions associated with the
Project (e.g., a social cost of carbon estimate based on a modeling framework that considers the social cost of each marginal ton of CO2e), as a matter of empirical observation, it would be impossible to ‘see’ the effects signal observationally amidst the internal noise of the global climate system. In other words, the available models might be used, and the results of those models might be extrapolated to give MPCA some idea of physical impacts caused by the amount of GHGs emitted from the Project. However, significant uncertainty would remain, especially as to when and where the physical impacts might occur.
115. It is not within the current state of the science to provide an analysis of the impact that the Project-
related GHG emissions will have on the environment. 116. It is impossible to know whether and when reliable data regarding Project GHG emissions’ impact on
the environment will become available, and any study of cumulative impacts of GHGs would necessarily go well beyond evaluating the impacts solely from the Project.
117. The information on Project impacts that might be developed from any such GHG/climate modeling
cannot be reasonably obtained as required for an EAW (Minn. R. 4410.1700, subp. 2a). 118. There are no Minnesota or National Ambient Air Quality Standards for GHGs.

On the Need for an Environmental Impact Statement Findings of Fact Grace Dairy Conclusions of Law Grace Township, Chippewa County And Order
15
119. Riverview plans to implement the following GHG mitigations in construction or operation of the Project:
Variable frequency drives (also known as variable speed drives) will be installed on nearly half of all of the motors at Grace Dairy, reducing energy consumption between 20-30%. Examples include well pumps, milk handling pumps, manure pumps, parlor motors, among others;
Ventilation fans will be managed based on temperature and climate factors to reduce run time as much as possible, conserving energy;
A plate cooler will act as a heat exchanger to capture heat from milk cooling equipment and used to heat portions of the parlor building as well as water used on-site;
High-efficiency LED lighting will be installed and used throughout the Project;
Livestock watering tanks and the freestall barn will not require electricity as the area stays warm enough from the cows’ body heat;
Livestock misters will be operated with temperature sensors to limit use;
Riverview plans to buy renewable electricity from its utility provider for Grace Dairy, however will retain operational flexibility if market conditions change;
All of the farmland to be used for feed production at Grace Dairy is already in crop production. Since Grace Dairy will not trigger new crop production, and it will create a local market for those crops that are already being grown, the transportation distance of those crops will be reduced, potentially reducing GHGs;
Grace Dairy will create a new market for alfalfa, which is a perennial crop known to create a carbon sink, thereby reducing GHG emissions from the nearby acres that will be used for alfalfa production;
120. Regarding Minn. R. 4410.1700 subp. 7B, items 76 through 83 analyze whether the cumulative
potential effect is significant and whether the contribution from the project is significant when viewed in connection with other contributions to the cumulative potential effect.
121. The MPCA finds that for the reasons stated in items 113 through 120, the cumulative potential
effect of Project GHG impacts, as proposed, does not have the potential for significant environmental effects related to cumulative potential effects based on the Project’s GHG emissions that are reasonably expected to occur.
Cumulative Effects – Summary 122. Based on information on the Project obtained from air modeling reports and Feedlot Permit
application processes, information on water quality, groundwater appropriation, and air quality, including GHG emissions presented in the EAW, and consideration of potential effects due to related or anticipated future projects, the MPCA does not expect significant cumulative effects from this Project.
123. The MPCA finds the Project, as proposed, does not have the potential for significant environmental
effects related to cumulative potential effects that are reasonably expected to occur. The Extent to Which the Environmental Effects Are Subject to Mitigation by Ongoing Public Regulatory Authority

On the Need for an Environmental Impact Statement Findings of Fact Grace Dairy Conclusions of Law Grace Township, Chippewa County And Order
16
124. The third criterion that the MPCA must consider when determining if a project has the potential for significant environmental effects is "the extent to which the environmental effects are subject to mitigation by ongoing public regulatory authority. The RGU may rely only on mitigation measures that are specific and that can be reasonably expected to effectively mitigate the identified environmental impacts of the project." Minn. R. 4410.1700, subp. 7. C. The MPCA Findings with respect to this criterion are set forth below.
125. The following permits or approvals will be required for the Project:
Unit of Government Permit or Approval Required
MPCA NPDES Feedlot Permit
DNR Water Appropriation Permit License to Cross Public Lands and Waters
Chippewa County Conditional Use Permit Septic Permit
126. MPCA Feedlot Permit. The MPCA requires Riverview to obtain a Feedlot Permit for the Project. The
Feedlot Permit incorporates construction and operation requirements and includes operating plans as attachments that address manure management, emergency response protocols, and odor/air quality management. The attachments will be an enforceable condition of the Feedlot Permit.
127. Construction Stormwater. Construction stormwater requirements are incorporated by reference
into the Feedlot Permit. Owners of feedlots not seeking Feedlot Permit coverage are still required to comply with all requirements of the current MPCA construction stormwater general permit but are not required to obtain construction stormwater permit coverage, unless the construction will disturb 5 or more acres.
128. DNR Water Appropriation Permit. There are currently two wells constructed for the Project. Two
additional wells will be installed. The existing wells are registered with MDH. Riverview expects to use approximately 120 MGPY, for a total consumption of approximately 2.4 billion gallons over 20 years.
129. State law requires a Water Appropriations Permit for users withdrawing more than 10,000 gallons of
water daily, or 1 MGPY. Riverview has applied for a DNR Individual Water Appropriation Permit. 130. The DNR Water Appropriation Permit ensures the well user manages water resources so that
adequate supply is available for long-range seasonal requirements for domestic, agriculture, fish and wildlife, recreation, power, navigation, and water quality control. State law establishes domestic use as the highest priority when water supplies are limited, and, when well interference occurs, the DNR follows a standardized procedure of investigation.
131. License to Cross Public Lands and Waters. A license is required for the passage of any utility over,
under or across any state land or public waters. Standards and criteria of the DNR include route design, structure design, construction methods, safety considerations, and right-of-way maintenance to provide maximum protection and preservation of the natural environment and to minimize any adverse effects, which may result from utility crossings.
132. Chippewa County Conditional Use Permit. Riverview is required to obtain all required building and
conditional use permits required by local units of government to ensure compliance with local

On the Need for an Environmental Impact Statement Findings of Fact Grace Dairy Conclusions of Law Grace Township, Chippewa County And Order
17
ordinances. The Conditional Use Permit will address local zoning, environmental, regulatory, and other requirements needed to avoid adverse effects on adjacent land.
133. Chippewa County Septic Permit. The Chippewa County Subsurface Sewage Treatment System
Ordinance and local sewage treatment system program regulates the siting, design, installation, alteration, operation, inspection, maintenance, monitoring and management of the subsurface sewage treatment system on all lands in the county except incorporated areas that administer a program by ordinance within their jurisdiction.
134. The above-listed permits include general and specific requirements for mitigation of environmental
effects of the Project. The MPCA finds that the environmental effects of the Project are subject to mitigation, as explained in these Findings and the EAW, by ongoing public regulatory authority.
The Extent to Which Environmental Effects can be Anticipated and Controlled as a Result of Other Available Environmental Studies Undertaken by Public Agencies or the Project Proposer, Including Other EISs 135. The fourth criterion that the MPCA must consider is “the extent to which environmental effects can
be anticipated and controlled as a result of other available environmental studies undertaken by public agencies or the project proposer, including other EISs,” Minn. R. 4410.1700, subp. 7. D. The MPCA Findings with respect to this criterion are set forth below.
136. Although not exhaustive, the MPCA reviewed the following documents as part of the environmental
impact analysis for the proposed Project:
Data presented in the EAW
Feedlot Permit application, with construction specifications, MMP, and attachments
Air Dispersion Modeling Report
U.S. Government’s U.S. Greenhouse Gas Emissions and Sinks: 1990-2016 (2018)
MPCA’s legislative report Greenhouse gas emissions in Minnesota: 1990-2016 (2019)
MPCA’s report Greenhouse gas reduction potential of agricultural best management practices (2019)
The Center for Climate Strategies in Collaboration with Minnesota State Agencies’ report
Minnesota Climate Strategies and Economic Opportunities (2016)
Minnesota’s “Final Animal Agriculture Generic Environmental Impact Statement” (2002)
Permits and environmental review of similar projects
DNR Aquifer Test Report Summary
TMDL recommended Best Management Practices
137. The MPCA also relies on information provided by Riverview, persons commenting on the EAW, staff experience, and other available information obtained by staff.
138. The environmental effects of the Project have been addressed by the design and permit
development processes, and by ensuring conformance with regional and local plans. No elements of the Project pose the potential for significant environmental effects that are not addressed or mitigated by the requirements of the permits listed above or in the EAW.

On the Need for an Environmental Impact Statement Findings of Fact Grace Dairy Conclusions of Law Grace Township, Chippewa County And Order
18
139. Based on the environmental review, previous environmental studies by public agencies or Riverview, andstaff expertise and experience on similar projects, the MPCA finds that the environmental effects of theProject that are reasonably expected to occur can be anticipated and controlled.
140. The MPCA adopts the rationale stated in the attached Responses to Comments (Appendix B) as thebasis for response to any issues not specifically addressed in these Findings.
CONCLUSIONS OF LAW
141. The MPCA has jurisdiction in determining the need for an EIS for this Project. The EAW, the permitdevelopment process, and the evidence in the record are adequate to support a reasoned decisionregarding the potential significant environmental effects that are reasonably expected to occur fromthis Project.
142. The MPCA investigated areas for potential significant environmental effects. The Project design andpermits ensure Riverview will take appropriate mitigation measures to address significant effects.The MPCA expects the Project to comply with all environmental rules, regulations, and standards.
143. Based on a comparison of the impacts that are reasonably expected to occur from the Project withthe criteria established in Minn. R. 4410.1700 subp. 7, the Project does not have the potential forsignificant environmental effects.
144. An EIS is not required for the proposed Grace Dairy feedlot project.
145. Any Findings that might properly be termed conclusions and any conclusions that might properly betermed findings are hereby adopted as such.
ORDER
146. The Minnesota Pollution Control Agency determines that there are no potential significantenvironmental effects reasonably expected to occur from the Grace Dairy project and that there isno need for an Environmental Impact Statement.
IT IS SO ORDERED
__________________________________________ Laura Bishop, Commissioner Minnesota Pollution Control Agency
June 11, 2021 ________________________________________ _ Date

APPENDIX A
Minnesota Pollution Control Agency
Grace Dairy, Chippewa County Environmental Assessment Worksheet (EAW)
LIST OF COMMENT LETTERS RECEIVED
1. Chuck Meidl. Email received March 31, 2021 and April 2, 2021. 2. Tesa Siverhus. Email received April 7, 2021. 3. Mike Yost. Email received April 14, 2021. 4. Matt Claussen. Email received April 18, 2021. 5. Marc Stevens. Email received April 19, 2021. 6. Gloria Sufflow. Email received April 24, 2021. 7. Roger Fisher. Letter received April 26, 2021. 8. Corinne and Delbert Kimpling. Letter received April 26, 2021. 9. Dennis Schulz. Email received April 25, 2021. 10. Sarah Beimers, State Historic Preservation Office. Letter received April 27, 2021. 11. Henry W. and Gladys Arends. Emailed received April 27, 2021. 12. Josh Koenen. Email received April 27, 2021. 13. Steve and Heather Sufflow. Email received April 28, 2021. 14. Kent D. Bosch. Email received April 28, 2021. 15. Joy Anderson, Minnesota Center for Environmental Advocacy. Letter received April 29, 2021. 16. Kirby Hettver. Emailed received April 29, 2021. 17. Joanne Boettcher, Minnesota Department of Natural Resources. Letter received April 29, 2021. 18. Jerlyn and Dean Nordaune. Emailed received April 27, 2021.

APPENDIX B
Minnesota Pollution Control Agency
Grace Dairy, Chippewa County Environmental Assessment Worksheet (EAW)
RESPONSES TO COMMENTS ON THE EAW
1. Chuck Meidl. Email received March 31, 2021 (comments 1-1 and 1-2) and April 2, 2021 (comment
1-3).
Comment 1-1: Commenter states that Riverview pushes small farmers out and turns the area into a mega dairy farm. Response: The comment is beyond the scope of the EAW because information on this issue would not inform a reasoned decision about the potential for significant environmental effects of the Project under Minn. R. 4410.1700. Comment 1-2: Commenter states that extra traffic during harvest season makes travel unsafe on township and county roads. Response: Traffic will access the Project site from the county road to the west. Riverview has been in contact with the County on this plan and will work with the County on any future needs. The Project is projected to increase the average daily traffic by 38 vehicles, which is about 5% of the current traffic in the area. During operation of the Project, Riverview expects an average of 250 vehicles per week. Traffic will peak during harvest time. Further, the Minnesota Pollution Control Agency (MPCA) does not have decision-making authority over local roads and traffic. The commenter should address this concern with the local government unit that regulates roads in question. The MPCA encourages Riverview to work out an agreement with Grace Township for road maintenance. Comment 1-3: Commenter states that the aquifers will suffer with two dairies within 5 miles of each other drawing them down to unsafe levels and impacting nearby wells of landowners. Response: An aquifer test completed in late 2019 at the Project site in Grace Township showed that only 80 gallons per minute could be appropriated from the site in order to remain within confined aquifer threshold levels. Riverview chose to find an alternative water-supply location for Project. Production wells will be constructed in an off-site well field approximately 5 miles south of the Project site in the SE 1/4 of Section 15, T118N, R39W, Havelock Township, Chippewa County. An aquifer test was conducted in collaboration with Minnesota Department of Natural Resources (DNR) Groundwater Unit staff at the off-site well field. The data was collected and submitted according to acceptable protocols. The data was used for the final determination that the aquifer parameters, such that the proposed pumping rate of 320 gallons per minute and annual maximum of 120 million gallons per year, is reasonable and within safe yield guidelines over the expected life of the project (20 years) as defined by Minn. R. §6115.0630, subp. 16. The DNR concluded that “surface water resources are not likely to be impacted by the Riverview pumping at this site.”

Grace Dairy, Chippewa County Responses to Comments on the Grace Township, Minnesota Environmental Assessment Worksheet
2
Additionally, the DNR has regulatory authority for withdrawal permitting and water use management. Groundwater appropriations are addressed through the DNR Water Appropriations Permit program.
Minn. Stat. 103G.265 requires the DNR to manage water resources to ensure an adequate supply to meet long-range seasonal requirements for domestic, agricultural, fish and wildlife, recreational, power, navigation, and quality control purposes. The purpose of the DNR Water Appropriation Permit is to ensure water resources are managed so that adequate supply is available for long-range seasonal requirements for domestic, agricultural, fish and wildlife, recreational, power, navigational, and water quality control.
Minn. R. 6115.0740 provides the DNR with a process to ensure that an aquifer’s safe yield is not exceeded and Minn. Stat. § 103G.261 establishes domestic water use as the highest priority of the State’s water when supplies are limited. If a well interference arises, the DNR has a standard procedure for investigating the matter. If the DNR finds a commercial operator is causing interference, the operator must correct it.
Minn. R. 6115.0740 also describes the process for resolving water use conflicts. The Rule states that existing and proposed users must develop and submit a plan for proportionate distribution of the available water. The rule requires that DNR approve the plan. If the proposed and existing permittees cannot reach resolution regarding allocation of the available water, the DNR has the authority to develop a new plan, modify the proposed plan, issue new permits, and amend existing permits based on that plan. Options for resolving the conflict include but are not limited to: modifying existing and proposed appropriations, restricting the timing of withdrawals, and seeking alternative water supplies.
Further, Minn. Stat. § 116D.04, subd. 16 requires an EAW to “include an assessment of the water resources available for appropriation.” The DNR required Riverview to perform an aquifer test as part of their permitting process to determine aquifer sustainability at the site and at the off-site well field. The DNR provided an Aquifer Test Report Summary for the Project to the MPCA, which is included as Attachment 17 to the EAW. The MPCA evaluated this assessment of water resources available for appropriation in the EAW and made it available for the public to review.
Minn. R. 6115.0670, subp. 3 states that a Water Appropriation Permit cannot be issued if the appropriation: Is inadequate to provide the amounts of water proposed to be appropriated based on the quantity of available waters of the state in the area involved; Is not reasonable, practical, and does not adequately protect public safety and promote the public welfare; Is not consistent with approved state, regional, and local water and related land resources management plants, provided that regional and local plans are consistent with statewide plans; Presents an unresolved conflict between competing users for the waters involved and the conflict has not been resolved pursuant to provision of part 6115.0740; or if there is not sufficient hydrological data for the determination of potential effects from appropriation.
2. Tesa Siverhus. Email received April 7, 2021. Comment 2-1: Commenter is concerned about the addition of another large farm to the area, and that the animals are not pastured. Response: The comment concerning pastured animals is beyond the scope of the EAW because information on this issue would not inform a reasoned decision about the potential for significant

Grace Dairy, Chippewa County Responses to Comments on the Grace Township, Minnesota Environmental Assessment Worksheet
3
environmental effects of the Project under Minn. R. 4410.1700. Cumulative effects from the addition of a large dairy to the area were analyzed in Section 11 of the EAW. Comment 2-2: Commenter is concerned about the number of acres of cropland required to run the operation and that it will take away from smaller, local operations. Commenter asks what happens if Riverview does not have 7,300 acres available one year. Response: The EAW requires the proposer to demonstrate that they have more than the adequate amount of acreage to apply manure. Riverview has identified over 12,114 acres available for manure application (Attachment 6a-6n of the EAW) although only 7,300 acres will be needed annually. The acres have the capacity to receive manure fertilizer for the replacement of crop nutrient needs. Some of the available acres that could receive manure may or may not be available in any given year based on many factors, including but not limited to: the desire by both parties involved to apply the manure, crop rotation, and weather. It is unlikely that nearly 5,000 of the available 12,114 acres would be unavailable for land application in a given year such that there would be insufficient acreage remaining for manure application. The EAW is written based on guidelines in Minn. R. 4410.1700, subp. 6 which states that "In deciding whether a project has the potential for significant environmental effects the RGU shall compare the impacts that may be reasonably expected to occur from the project…" Riverview has manure application agreements in place demonstrating sufficient interest from nearby independent farmers. Riverview states that in their experience operating similar dairy farms, they have never had difficulty finding sufficient acreage for land application of manure. The manure agreements Riverview has with the landowners continue from year to year unless cancelled by either party on any given year. Before manure application season, Riverview will obtain verbal agreements with the neighboring farms to transfer the ownership of manure. Riverview will calculate the number of acres needed based on the volume of manure in the liquid manure storage areas, which is determined by using the depth and the design volume chart found in the Feedlot Permit. Based on Riverview’s previous experience in applying manure in west central Minnesota, spring application of manure due to bad weather the previous fall is rare. From time to time, Riverview may land apply some manure during the spring and summer months. Summer application could occur on a growing crop such as alfalfa. Comment 2-3: Commenter asks what happens if excrement spills or leaks into the waterways. Response: The primary goal of the Feedlot Permit is to ensure that waters are not contaminated by the runoff or leachate from feedlots, manure storage or stockpiles, and cropland with improperly applied manure. Riverview will implement best management practices (BMPs) through its MPCA-approved Manure Management Plan (MMP), an enforceable part of the Feedlot Permit. The MMP is designed to aid in protection of surface and groundwater. If manure spills on a public roadway, the hauler must remove and properly dispose of it in accordance with Minn. R. 7020.2010, Transportation of Manure. Riverview will take the following actions to minimize impacts to water quality:
If a manure spill occurs, comply with the Emergency Response Plan in its Feedlot Permit
Design and build the Project as a total confinement operation
Design the feed pad to collect all runoff for storage in the liquid manure storage areas
Grace Dairy, Chippewa County Responses to Comments on the Grace Township, Minnesota Environmental Assessment Worksheet
4
The Emergency Response Plan in the Feedlot Permit for Riverview can be seen by following MPCA’s public information request procedures found here: https://www.pca.state.mn.us/about-mpca/information-requests. 3. Mike Yost. Email received April 14, 2021. Comment 3-1: Commenter states that they are in favor of Grace Dairy based on their past experiences with Riverview. Commenter states there have been few nuisance issues, the operations are clean, runoff is contained, manure application is renewable and replaces commercial fertilizer, and that introducing alfalfa as an alternative crop has various environmental benefits. Commenter states the Project will have a positive effect on the local economy and community. Response: The comment is noted. 4. Matt Claussen. Email received April 18, 2021. Comment 4-1: Commenter states that they are in favor of the Project based on their past experiences with Riverview. Response: The comment is noted. 5. Marc Stevens. Email received April 19, 2021. Comment 5-1: Commenter states that they are in favor of the Project and looks forward to reaching their farm’s environmental goals by utilizing Riverview’s manure and being able to add alfalfa to their crop rotation. Response: The comment is noted. 6. Gloria Sufflow. Email received April 24, 2021. Comment 6-1: Commenter states that they are not in favor of the Project due to water quality concerns in their well. The commenter asks about future water supply issues in dry years and states that there is not a sufficient amount of water to meet the demands of the Project. Response: Please see response to comment 1-3. Comment 6-2: Commenter is concerned about extra traffic for road conditions on the county road due to the Project. Response: Traffic will access the Project site from the county road to the west. Riverview has been in contact with the County on this plan and will work with the County on any future needs. The Project is projected to increase the average daily traffic by 38 vehicles, which is about 5% of the current traffic in the area. During operation of the Project, Riverview expects an average of 250 vehicles per week. Traffic will peak during harvest time.

Grace Dairy, Chippewa County Responses to Comments on the Grace Township, Minnesota Environmental Assessment Worksheet
5
The MPCA does not have decision-making authority over local roads and traffic. The commenter should address this concern with the local government unit that regulates the roads in question. The MPCA encourages Riverview to work out an agreement with Grace Township for road maintenance. 7. Roger Tischer. Letter received April 26, 2021. Comment 7-1: Commenter is concerned about the amount of water the Project will use and asks who is responsible for the resolutions. Response: Please see response to comment 1-3. Additionally, responsibilities and resolutions are partially delegated to the DNR. Minn. R. 6115.0740 provides the DNR with a process to ensure that an aquifer’s safe yield is not exceeded and Minn. Stat. § 103G.261 establishes domestic water use as the highest priority of the State’s water when supplies are limited. If a well interference arises, the DNR has a standard procedure for investigating the matter. If the DNR finds a commercial operator is causing interference, the operator must correct it. 8. Corinne and Delbert Kimpling. Letter received April 26, 2021. Comment 8-1: Commenter is concerned about their water quality and the available quantity after the Project drilled test wells near their residence. Additionally, the commenter states that the testing for Riverview was conducted in relatively wet years and will not be representative of dry years. Response: Please see response to comment 1-3. Comment 8-2: Commenter is concerned about odors from the manure that will be applied to lands near their residence. Response: There are no State regulations for odor. However, Riverview completed air modeling for odor from the Project. The maximum odor intensity calculated for the nearest residence, about 2,600 feet away, is below the “faint” odor threshold. See Attachment 14 of the EAW for more information on the odor modeling. Figure 18 of that attachment shows odor intensity dispersion mapping from the Project site. The MPCA includes odor in the modeling for feedlot EAWs to provide local decision-makers with expected odor levels from the Project. It is up to local decision-makers to decide how they will utilize the information in their permitting process. The Project has operational and design features to avoid and minimize adverse air and odor emissions, including synthetic basin covers and a manure separation system. Riverview’s removal of the manure solids from the liquid before storing the liquid in the liquid manure storage areas eliminates the need for manure agitation, which is a source of odor. Riverview will only use agitation in the straw covered basin. The solid manure is dry and compacted with tractors, thereby reducing odor emissions. Comment 8-3: Commenter asks how wildlife will be kept from Riverview’s food source and if the method will be humane. Response: To mitigate potential impacts to nearby wildlife, and to prevent disease transmission between wildlife and cows, Riverview will: store grains in on-site bins or the covered commodity shed, store feedstuffs on a covered asphalt pad, and prevent wildlife access to the cows by using distressed-animal sounds and/or predator decoys if necessary to deter unwanted animals.

Grace Dairy, Chippewa County Responses to Comments on the Grace Township, Minnesota Environmental Assessment Worksheet
6
9. Dennis Schulz. Email received April 25, 2021. Comment 9-1: The commenter is concerned with the amount of water the Project will use and changes to water quality. Response: Please see response to comment 1-3. Comment 9-2: The commenter states that they no longer want to provide their acreage for manure land application as shown in the EAW. They are concerned with the smell in the surrounding area during manure applications in the fall. Response: As provided in the provisions of the signed document, seen in Attachment 6a of the EAW, the commenter is able to change or cancel the agreement to provide Riverview with acreage to apply manure by submitting the request to Riverview in writing by September 1 of any given year. For odor concerns, please see response to comment 8-2. 10. Sarah Beimers, State Historic Preservation Office. Letter received April 27, 2021. Comment 10-1: There are no properties listed in the National or State Registers of Historic Places and no known or suspected archaeological properties in the area that will be affected by this project. Response: The comment is noted. 11. Henry W. and Gladys Arends. Email received April 27, 2021. Comment 11-1: Commenter states that they signed a waiver with the County, Attachment 15 of the EAW, and would like to withdraw that waiver because they are no longer in favor of the project being built so close to their farm. Response: Riverview will need to resolve the waiver issue with the County and the commenter as the MPCA does not have the authority to remove it from the County’s records. When the EAW went on public notice, the waiver was valid public information. Comment 11-2: Commenter is concerned about odor from manure and barns. Response: See response to comment 8-2. Comment 11-3: Commenter is concerned about water quality in their well. Response: Please see response to comment 1-3. Comment 11-4: Commenter is concerned about damage to the roads from the traffic and equipment. Response: The MPCA does not have decision-making authority over local roads and traffic. The commenter should address this concern with the local government unit that regulates the roads in question. The MPCA encourages Riverview to work out an agreement with Grace Township for road maintenance.

Grace Dairy, Chippewa County Responses to Comments on the Grace Township, Minnesota Environmental Assessment Worksheet
7
12. Josh Koenen. Email received April 27, 2021. Comment 12-1: Commenter is concerned about the quality of their drinking water and the amount of water the Project will use. Response: Please see response to comment 1-3. Comment 12-2: Commenter is concerned about manure being injected into fields and flooding into nearby water resources. Response: Riverview does not apply the manure themselves as manure ownership is voluntarily transferred to a third party. The third party is responsible to comply with County manure application setbacks and ordinances as described in Section 5 of the EAW, as well as State setbacks and rules, whichever is more stringent. These setbacks are designed to protect water and other resources. In addition, Riverview will provide the recipient with the most current nutrient analysis, and a receipt with a description of the minimum requirements and regulations for manure application as required by the Feedlot Permit and Minn. R. 7020.225, subp. 1.D. Manure application must be performed by a Commercial Animal Waste Technician (CAWT) who will inject it beneath the soil at agronomic rates. 13. Steve and Heather Sufflow. Letter received April 28, 2021. Comment 13-1: Commenter is concerned about the amount of water the Project will use and how it will impact water quality. Response: Please see response to comment 1-3. Comment 13-2: Commenter states that the roads cannot handle an increase in traffic and heavy equipment. Response: The MPCA does not have decision-making authority over local roads and traffic. The commenter should address this concern with the local government unit that regulates the roads in question. The MPCA encourages Riverview to work out an agreement with Grace Township for road maintenance. 14. Kent Bosch. Letter received April 28, 2021. Comment 14-1: Commenter states that they are in favor of the Project because they believe the dairy will benefit the surrounding area by: providing locally produced commodities, lower transportation costs and thus less road wear and tear, greater biodiversity by adding alfalfa into crop rotations which will benefit soil and water, cheaper source of local fertilizer, increased tax capacity that will reduce property tax burdens, and providing jobs in the local economy. Commenter further states they have had positive business dealings with Riverview in the past, and that they run clean operations. Response: The comment is noted. 15. Joy Anderson, Minnesota Center for Environmental Advocacy (MCEA). Letter received April 29,
2021.

Grace Dairy, Chippewa County Responses to Comments on the Grace Township, Minnesota Environmental Assessment Worksheet
8
Comment 15-1: The commenter states the MPCA must order an Environmental Impact Statement (EIS) because Grace Dairy’s [greenhouse gas] emissions have the potential for significant environmental impacts. If all the emission sources (e.g. beyond barn/manure storage, enteric fermentation, and manure land application) and pollutants (e.g. beyond methane and nitrous oxide) were counted, the total CO2 equivalent emissions would exceed 100,000 tons per year. In that case, MPCA should order an EIS. Response: The existing Minnesota Rules for environmental review do not have an established threshold for greenhouse gas (GHG) emissions triggering a mandatory EIS. Although the MPCA has mentioned the 100,000 tons per year mandatory EAW GHG threshold in previous Findings of Fact for feedlots, this does not imply that exceeding that threshold would automatically require an EIS for the project or that it is an indicator of significance. This threshold serves as a signal from regulatory language where Project emissions may warrant a closer analysis for considering whether they have the potential for significant environmental effects. Additionally, emissions below that threshold would not reasonably be considered significant since the 100,000 tons per year is merely the threshold at which an EAW is mandatory. Project emissions were calculated below 100,000 tons per year using existing MPCA protocol, tools, and methodologies established for animal feedlots. The need for an EIS is not based merely on the existence of GHG emissions, rather it is based on the potential for significant environmental effects. The MPCA is required to evaluate the potential for significant impacts from project based on all four criteria outlined in Minn. R. 4410.1700, subp. 7. These criteria do not exclude the possibility that a project’s GHG emissions could be determined to cause significant environmental effects and necessitate an EIS. The Commissioner of the MPCA, following the criteria in Minn. R. 4410.1700, subp. 7, will make the determination on if there is any necessary information lacking in the record after carefully reviewing all the information in the EAW, written public comments, and the Response to Comments. Upon reviewing all of the available information, should the Commissioner determine “that information necessary to a reasoned decision about the potential for, or significance of, one or more possible environmental impacts is lacking, but could be reasonably obtained,” shall either “A. make a positive declaration and include within the scope of the EIS appropriate studies to obtain the lacking information; or B. postpone the decision on the need for an EIS, for not more than 30 days or such other period of time as agreed upon by the RGU and proposer, in order to obtain the lacking information.” (Minn. R. 4410.1700, subp. 2a). Comment 15-2: The commenter states that the EAW fails to take a hard look and fully account for all GHG emission sources (e.g. energy use (onsite and off-site), off-road/on-road mobile sources, agricultural and land use practices, non-combustion industrial processes, waste management, construction) and pollutants beyond methane and nitrous oxide that will result from Grace Dairy. MPCA’s estimates of GHG emissions are too narrow in scope and underestimate the project’s total emissions. Response: The MPCA acknowledged, in the EAW, the constraints that would be necessary to develop a full life-cycle analysis of GHG emissions for any project. Further, the effects on the environment are challenging to quantify and evaluate due to complexities of global climate, operational and site-specific factors, and local geography, among other items referenced. In addition, the EAW explains that the potential GHG emissions are estimates and do not consider all GHG emissions that the Project could possibly create, induce, or offset. The MPCA applied its technical experience with GHG emissions
Grace Dairy, Chippewa County Responses to Comments on the Grace Township, Minnesota Environmental Assessment Worksheet
9
inventories and existing MPCA environmental review practices to determine which project-related activities to quantify. The MPCA quantified the sources listed in the EAW because they are within the scope of the Project, and these are the sources MPCA uses at this time to estimate GHG emissions for the entire agricultural sector on a statewide basis. The Draft Recommendations: Integrating Climate Information into MEPA Program Requirements (Draft Recommendations) mentioned by the commenter are the product of the Interagency Environmental Review Climate Technical Team (Technical Team), not the Environmental Quality Board (EQB) as the commenter suggests. The EQB is still working with the Technical Team to determine how climate change should be incorporated into environmental review, and has not acted on the Draft Recommendations. The Draft Recommendations were intended for public engagement that will be used to refine and modify final considerations by the EQB Board later this summer. The Grace Dairy EAW was developed and on public notice while the Draft Recommendations were open for comment from February 17, 2021 to April 9, 2021, and received a total of 990 comments. Comments were intended to identify any flaws, barriers, and/or opportunities in the Draft Recommendations. Without being able to review all of the valuable input and revise the Draft Recommendations accordingly, at this time it is imprudent for MPCA Environmental Review to incorporate Draft Recommendations when the MPCA’s GHG experts have developed a feedlot-specific GHG quantification tool that is consistent with the methodologies for conducting our state-wide GHG inventory that are appropriate for such projects. At this time, EQB is evaluating comments received on draft Technical Team recommendations and final Responsible Government Unit (RGU) guidance is not yet available. Until and unless the EQB Board has the opportunity to act under its Minnesota Environmental Policy Act (MEPA) authority to determine the appropriate information needed in an EAW, such as final guidance or regulation for all projects in Minnesota undergoing environmental review, the MPCA must act within its capacity as a RGU to determine the appropriate tools and methodologies for projects currently underway, including Grace Dairy. Once EQB guidance is final, MPCA Environmental Review will evaluate its approach for EAWs, including feedlot projects, and incorporate any changes needed to ensure consistency of the approach and quality of analysis. MPCA Environmental Review may include additional GHG sources in future EAWs based on guidance from the EQB. Comment 15-3: The commenter states that the MPCA can estimate the scope of the GHG emissions using existing tools. Response: Please see response to comment 15-2 for details on why the MPCA will not be incorporating the Draft Recommendations, which include reference to some of EPA’s emission factors and models, at this time. Part of the intention of the Technical Team is to ensure government agencies, members of the public, and project proposers have adequate resources and access to sources of climate change-related data and information. The MPCA concurs that there are several models available for GHG quantification; however, the assumptions underlying each have several variables that need authentication before they can be used. The MPCA is relying on EQB to determine the best models for use in quantification of GHG emissions for all RGUs. Until the EQB publishes further guidance on this issue, the MPCA has decided to quantify direct GHG emission sources within the scope and boundaries confined to the Project area and the EAW.

Grace Dairy, Chippewa County Responses to Comments on the Grace Township, Minnesota Environmental Assessment Worksheet
10
The scientific community generally has consensus on the Intergovernmental Panel on Climate Change (IPCC) methodology for GHG. Under the 2016 Paris Climate Accords, all international reporting for purposes of compliance is done using the IPCC construct. The same is true for the reporting under the earlier 1992 UN Framework Convention on Climate Change, of which the U.S. is a signatory. To stay within the scientific mainstream in developing the GHG information in the EAW, the MPCA also uses this framework. To venture outside of this framework risks using data that does not have general scientific consensus in regulatory decision-making. The MPCA uses the IPCC (Fifth Assessment Report) in the EAW to maintain consistency with present MPCA practice, and to remain firmly within the scientific mainstream on issues of GHG quantification, CO2-equivalence, and choice of Global Warming Potential integration period. Comment 15-4: Commenter states that the EAW fails to consider the effects of the GHG emissions from Grace Dairy and that MPCA failed to perform an adequate cumulative potential effects analysis to determine the impacts of GHG emissions from Grace Dairy. Response: The MPCA considers the cumulative effects analysis related to GHGs provided in the EAW to be sufficient based on current requirements in existing EQB rules. Conducting this analysis using Draft Recommendations is imprudent. This is further discussed in response to comment 15-2. The purpose of the EAW process is to disclose information about potential environmental impacts of a project. The EAW is defined by state statute as a “brief document which is designed to set out the basic facts necessary to determine whether an EIS is required for a proposed action” (Minn. Stat. § 116D.04, subd. 1a). The EAW form consists of 20 questions focusing on potential environmental effects, and these questions generally provide the information needed to determine if the project will have significant environmental impacts as outlined in Minn. R. 4410.1200. A project may still reach the significance threshold as part of a cumulative effect although individually it may be considered a minor contribution. The effects of additional GHG emissions from Grace Dairy on global climate would likely be undetectable within the interannual variability of the climate system. These effects remain legitimate, but outside of usable modeling, would be impossible to extract from the observational evidence of the climate system. To conduct full-scale modeling of the global climate system would be outside the scope of an EAW. The Grace Dairy GHG emission increases would have an effect that can be demonstrated based on the best available current science, but as a matter of observational measurement, that effect probably cannot be extracted from empirical evidence of the operation of the climate system. Comment 15-5: Commenter states that MPCA failed to consider how Grace Dairy’s emissions will affect Minnesota’s Achievement of Next Generation Energy Act goals. Response: It is important to note that the Next Generation Energy Act targets are statewide reduction goals, not project-specific mandatory thresholds/requirements, with progress measured across sectors and the economy as a whole. Although all contributions to climate change are not negligible, and all projects may have an incremental effect on Minnesota’s ability to meet the goals, to discuss the Next Generation Energy Act in relation to one specific project is currently outside the scope of MPCA Environmental Review. The EQB is still working to determine how climate change will be incorporated into environmental review. Once EQB guidance is final, it may include information on whether and how to incorporate

Grace Dairy, Chippewa County Responses to Comments on the Grace Township, Minnesota Environmental Assessment Worksheet
11
discussion of project impacts on and achievement of the Next Generation Energy Act reduction goals into environmental review. This is further discussed in response to comment 15-2. Comment 15-6: Commenter states that the EAW fails to analyze options for mitigating the GHG emissions from Grace Dairy. The EAW fails to analyze the feasibility and impacts of potential mitigation measures that could be implemented at Grace Dairy. Response: In an EAW, environmental review is conducted based on the project as proposed and those mitigation measures a project proposer plans to implement and that the MPCA is reasonably confident will occur. The MPCA is unable to require specific mitigation actions through its environmental review process. Once EQB guidance is final, it may include information on whether and how to incorporate discussion of GHG mitigation into environmental review. This is further discussed in response to comment 15-2. Additionally, Minn. R. 4410.1200 states that the EAW shall address “resource protection measures that have been incorporated into the project design.” The EAW is based on readily available information and is not intended to be an exhaustive document or research paper. The robust analysis and discussion of mitigation measures the commenter is asking for is more suitable in an EIS than an EAW. However, the MPCA is required to determine the need for an EIS based on the four criteria outlined in Minn. R. 4410.1700, subp. 7, which does not require the need for an EIS simply to do more analysis. The MPCA considers the GHG mitigation discussion provided in the EAW to be sufficient based on current practice and requirements. Riverview plans to implement the following GHG mitigations in the construction and operation of the Project:
Variable frequency drives (also known as variable speed drives) will be installed on nearly half of all of the motors at Grace Dairy, reducing energy consumption between 20-30%. Examples include well pumps, milk handling pumps, manure pumps, parlor motors, among others;
Ventilation fans will be managed based on temperature and climate factors to reduce run time as much as possible, conserving energy;
A plate cooler will act as a heat exchanger to capture heat from milk cooling equipment and used to heat portions of the parlor building as well as water used on-site;
High-efficiency LED lighting will be installed and used throughout the Project;
Livestock watering tanks and the freestall barn will not require electricity as the area stays warm enough from the cows’ body heat;
Livestock misters will be operated with temperature sensors to limit use;
Riverview plans to buy renewable electricity from its utility provider for Grace Dairy, however will retain operational flexibility if market conditions change;
All of the farmland to be used for feed production at Grace Dairy is already in crop production. Since Grace Dairy will not trigger new crop production, and it will create a local market for those crops that are already being grown, the transportation distance of those crops will be reduced, potentially reducing GHGs;
Grace Dairy will create a new market for alfalfa, which is a perennial crop known to create a carbon sink, thereby reducing GHG emissions from the nearby acres that will be used for alfalfa production;

Grace Dairy, Chippewa County Responses to Comments on the Grace Township, Minnesota Environmental Assessment Worksheet
12
Comment 15-7: Commenter states that MPCA must supplement the EAW or order an EIS to analyze the cumulative effects of Grace Dairy’s manure application on water quality. Commenter states that the EAW is incomplete without a full analysis of the cumulative effects of the manure from all feedlots in the region in the Chippewa River Watershed on impaired water bodies. Commenter further states, “Merely asserting that there will be no effects from such a massive injection of manure into the county does not qualify as a legitimate analysis.” Response: The MPCA notes that agricultural activities in this region already contribute to degrading surface water quality through the use of fertilizer. A third party that currently contributes to degrading surface water quality through fertilizer application switching to manure will not further exacerbate conditions. Riverview’s MMP requires record keeping, including the accounting for nitrogen within the manure to demonstrate that application is conducted at an agronomic rate. This level of management of nutrient application is not required for the use of commercial fertilizers. Furthermore, manure will be incorporated via injection, which provides enhanced soil tilth, a beneficial property of soil that helps retain moisture and reduce runoff from fields (MPCA: Runoff reductions with incorporated manure, May 2018, wq-f1-08). Riverview has adequate quantity of cropland to utilize the nutrients generated from the Project. The MPCA does a cumulative impacts analysis of land application of manure by looking at the impaired waters in the area. If there are impaired waters in the area, then there is a cumulative impact. MPCA then reviews the Project’s MMP to determine if it is compliant with recommended BMPs related to the identified impairment. The identified impairments in the Grace Dairy area for Shakopee and Dry Weather Creeks are for aquatic life and recreation due to E. coli, Chlorpyrifos, and Fecal coliform. The recommended BMPs for controlling pathogens and bacteria are to store the manure in anaerobic pits and to incorporate the manure as soon as possible when being land applied. Grace Dairy will store all of its manure in anaerobic basins prior to land application. Additionally, the CAWT must ensure compliance and will be incorporating the manure at the time of land application. Minn. R. 4410.0400, subp. 3 states, “When environmental review documents are required on a project, the proposer of the project and any other person shall supply any data reasonably requested by the RGU which the proposer has in his or her possession or to which the proposer has reasonable access.” MPCA rules do not require MMPs on feedlots under 300 animal units (AUs) nor does MPCA maintain the MMPs on feedlots between 300-1,000 AU. Thus, a review of all the land application of manure from all feedlots in the region is beyond the standard of data to which the proposer has reasonable access to and is beyond the scope for an EAW. Environmental review does not require that a Project eliminate water pollution as asserted by the commenter, but rather demonstrate that the Project does not have the potential for significant environmental effects to water quality. The commenter also assumes that BMPs will not be followed by third party farmers and thus could impact water quality when they apply manure. Other feedlots in the region have similar requirements and regulations to those of Riverview such as following setbacks, using a licensed CAWT, following BMPs, among others. The Environmental Review program relies on the regulation of the project proposer in its analysis, otherwise every project could be considered to have the potential for significant environmental effects, as impacts would not be reversible as explained in Minn. R. 4410.1700, subp. 7. The consideration of regulatory-required mitigation measures is justified in Minn. R. 4410.1700, subp. 7B, which states in part, “the degree to which the project complies with approved mitigation measures specifically designed to address the cumulative potential effect” as well

Grace Dairy, Chippewa County Responses to Comments on the Grace Township, Minnesota Environmental Assessment Worksheet
13
subp. 7C, which states in part, “the extent to which the environmental effects are subject to mitigation by ongoing public regulatory authority.” Riverview submitted a MMP with its application for a Feedlot Permit. The MPCA has determined that the MMP is consistent with the land application rules in Minn. R. 7020.2225 and the Feedlot Permit. Riverview will not be allowed to over-apply manure. Riverview’s Feedlot Permit and associated MMP for the Project require that manure application occur at agronomic rates based on previous crop harvested, the available nutrients, and the crop to be grown. The MMP is an integral and enforceable part of the Feedlot Permit, thus Riverview and any third party receiving the manure from Riverview will be responsible for complying with the MMP. Riverview’s MMP included plans specifically for transferred manure, including providing the recipient of the manure information regarding the feedlot rule requirements. The MPCA provides oversight of Riverview’s compliance with feedlot rules and Feedlot Permit through its compliance, enforcement, and permitting programs. MPCA feedlot program staff are responsible for enforcing the requirements of the Feedlot Permit. If the MPCA becomes aware of any potential violations or noncompliance, they have the authority to take appropriate enforcement action. The agronomic rate requirement found in the feedlot rules and the Individual National Pollutant Discharge Elimination System (NPDES) Feedlot Permit is just one of many requirements that are designed to protect ground and surface water quality. Other manure application related requirements in the feedlot rules and the Individual NPDES Feedlot Permit include: manure and soil testing, setbacks to sensitive features, soil hydraulic loading restrictions, soil texture restrictions, application of manure prior to predicted rainfall events of one-half inch restrictions, cover crop requirements based on timing of manure application, and manure applications restrictions based on application methods and the time of year/field conditions. It is a combination of all the feedlot rules and Individual NPDES Feedlot Permit requirements that protect ground and surface water quality. Therefore, it is reasonable to assume that all of these measures, in accordance with the criteria in Minn. R. 4410.1700, subp. 7, specifically in relation to mitigation measures, reversibility, and subjectivity to ongoing regulatory authority, were considered in the cumulative potential effects analysis in the EAW to determine protectiveness of water quality. Comment 15-8: The commenter states that if Grace Dairy, as the fourth largest concentrated animal feeding operation in the state, is not considered significant, it is unlikely any dairy farm could ever be. Response: The EQB Rules do not list upper limit thresholds on the number of AUs required for an EIS. As an RGU, the MPCA evaluates the potential for significant environmental effects for an EAW on a case-by-case basis in accordance with the four criteria listed in Minn R. 4410.1700, subp. 7, not the number of AUs. Depending on the project specifics, a negative or positive declaration on the need for an EIS may be ordered. 16. Kirby Hettver. Letter received April 29, 2021. Comment 16-1: Commenter states they support of the Project due to the addition of alfalfa, which enhances soil health, and perennial forage crop production in the community. Response: The comment is noted.

Grace Dairy, Chippewa County Responses to Comments on the Grace Township, Minnesota Environmental Assessment Worksheet
14
17. Joanne Boettcher, The Minnesota Department of Natural Resources. Email received April 29, 2021.
Comment 17-1: Commenter states that the Grace Marshes Wildlife Management Area (WMA) is the highest quality prairie in the area and provides wildlife habitat, recreational opportunities, and hosts rare and special concern species that are dependent on that landscape. Commenter believes the Project will inevitably change the nature of the WMA in several ways and asks Riverview to consider re-locating. Response: The MPCA relayed this request to Riverview and provided a discussion of the potential environmental impacts to the WMA in Section 2C of the EAW. Comment 17-2: Commenter states this Project is estimated to increase traffic, presumably mostly large trucks, in addition to Highway 40’s traffic. Commenter states concern for the increased traffic and associated noise, emissions, and visual impacts on local roads will disrupt the human and wildlife users of the WMA. The commenter suggests that Riverview pave roads adjacent to the Project and WMA to reduce road dust as well as plan for truck routes to minimize travel past the WMA. Response: MPCA relayed this request to Riverview who will have to coordinate with the corresponding road authority. The WMA is currently adjacent to Highway 40, and the Project is expected to increase traffic there by about 5%. Comment 17-3: Commenter states that manure contains invasive weed seeds and nutrients that will be applied adjacent to the WMA and can ruin a native plant community. The commenter requests a setback for manure application, at a minimum per the county ordinance which requires 100 feet of separation from wetlands. The commenter further requests that manure not be placed within 100 feet of all WMA boundaries. Response: Riverview and third parties will be required to comply with all manure application setbacks, including the County’s 100-foot separation setback from wetlands as they apply to the WMA’s boundaries. Comment 17-4: Commenter states that dairy operations often shift local fields from corn/bean to alfalfa. Alfalfa cuttings may impact grass nesting birds when cuttings occur prior to mid-July or August. Commenter states that due to abundant grasslands in the area, birds are present and likely to move into alfalfa fields to nest, resulting in bird and nest casualties and an eventual population sink. The commenter suggests that alfalfa cuttings near the WMA be planned to avoid bird ground nesting season or that cuttings are done with very high frequency to limit the available habitat. Response: The comment is noted. MPCA relayed this information to Riverview; however, the cropping decisions of farmers adjacent to the WMAs are made independently of the Project and are outside the scope of the EAW. Comment: 17-5: Commenter states the WMA uses fire to manage vegetation. While burning conditions are carefully selected to reduce smoke, substantial smoke may cross the dairy footprint during prescribed burns. Response: The MPCA relayed this information to Riverview as it is outside the scope of the EAW.

Grace Dairy, Chippewa County Responses to Comments on the Grace Township, Minnesota Environmental Assessment Worksheet
15
Comment 17-6: The commenter states that the WMA is used by white-tailed deer as a wintering area. Any stored forage that is not inside an exclusion fence could be susceptible to deer depredation which may introduce risk for deer to bovine and bovine to deer disease and parasite transmission, including bovine tuberculosis and liver flukes. The commenter suggests that deer fencing be installed. Response: The MPCA relayed this information to Riverview to encourage the avoidance of fatalities. To mitigate potential impacts to nearby wildlife, and to prevent disease transmission between wildlife and cows, Riverview will: store grains in on-site bins or the covered commodity shed, store feedstuffs on a covered asphalt pad, and prevent wildlife access to the cows by using distressed-animal sounds and/or predator decoys if necessary to deter unwanted animals. Comment 17-7: Commenter suggests that Riverview offset the overall environmental impact of the Project including methane gas production, climate change, and groundwater. The commenter offers the restoration of the 40-acre department of waters wetland number 12004500 as an option. Response: The MPCA relayed this information to Riverview as this suggestion is outside our ability to regulate through permitting or the EAW. The comment is beyond the scope of the EAW because information on this issue would not inform a reasoned decision about the potential for significant environmental effects of the Project under Minn. R. 4410.1700. 18. Jerlyn and Dean Nordaune. Email received April 27, 2021. Comment 18-1: The commenter is concerned about the amount of water the Project will use. Response: Please see response to comment 1-3. Comment 18-2: The commenter states that they are not in favor of granting an easement to pipe water across their land. Response: The comment is beyond the scope of the EAW because information on this issue would not inform a reasoned decision about the potential for significant environmental effects of the Project under Minn. R. 4410.1700. This is a local land use issue and the commenter should address this concern with the local government unit that regulates land use.

-----Original Message----- From: Chuck & Jeanne Meidl <[email protected]> Sent: Friday, April 02, 2021 8:38 AM To: Ness, Jenna (MPCA) <[email protected]> Subject: Re: grace dairy
If I may I would like to make another comment on the proposed dairy. The aquifers are going to suffer. By Dumont MN there will be 2 dairy's within 5 miles of each other. You can not have 20,000 cows that close without adversarially effecting the aquifers. These proposed dairy's will draw the aquifers down to unsafe levels and will effect landowners wells around the dairy's. thank you, Chuck Meidl
On 4/1/2021 7:17 AM, Ness, Jenna (MPCA) wrote: > Chuck,>> I have received your comment and will ensure it gets incorporated with a response in the Response to Comments that is part of the final package, the Finding of Fact. >> Thank you for submitting your concerns, >> Jenna Ness | Project Manager > Environmental Review Unit> 651.757.2276>> Our mission is to protect and improve the environment and human health.>>>> -----Original Message-----> From: Chuck & Jeanne Meidl <[email protected]>> Sent: Wednesday, March 31, 2021 9:22 AM> To: Ness, Jenna (MPCA) <[email protected]>> Subject: grace dairy>> This message may be from an external email source.> Do not select links or open attachments unless verified. Report all suspicious emails to Minnesota ITServices Security Operations Center.>> ________________________________ >> When is enough, enough. > Riverview continues to push the small farmers out while turning our countryside into a mega dairyfarms. During harvest seasons the extra traffic makes unsafe to travel on township and county roads.> Chuck Meidl> Barrett, MN>> NOTICE: This email (including attachments) is covered by the
1

> Electronic Communications Privacy Act, 18 U.S.C. 2510-2521. This email > may be confidential and may be legally privileged. If you are not the > intended recipient, you are hereby notified that any retention, > dissemination, distribution, or copying of this communication is > strictly prohibited. Please reply back to the sender that you have > received this message in error, then delete it. Thank you

2
From: Tesa Siverhus-Maus <[email protected]> Sent: Wednesday, April 07, 2021 2:58 PM To: Ness, Jenna (MPCA) <[email protected]> Subject: Grace Dairy MN
Dear Jenna, I am writing to you today to let you know of my dislike for yet another large so-called farm. I fear that many have no idea what a large 'farm' does not only now, but the future. I am concerned that 10,500 living animals NEVER set foot on grass and pasture, have not much room to move freely. They are treated like milk machines, and when they have young, they are taken from them and fed in little houses. Not very nice to the living animal. I really wish Riverview would make the public aware that their cows never see sunshine and touch pasture. Another concern is they need 7300 acres of cropland, and more than 12,000 available? Who owns that and do you realize it is taking away from small family farms? And what happens if you don't have 7300 acres available one year? What happens when the containers of urine and manure spill or leak into our waterways? Living in the next township over, yes it concerns me. I could go on, but I am sure you get my point. I thank you kindly for reading this. I know your job is not easy.
Respectfully, Tesa Siverhus Maynard, MN
Project Description Riverview, LLP proposes to build a 10,500 head Jersey dairy feedlot in Section 23, Grace Township, Chippewa County. Cows will be housed in a cross-ventilated, total confinement, free-stall barn. Clay-lined basins with impermeable covers will collect and store manure and wastewater. Liquid manure will be transferred to area farmers for use as fertilizer on cropland.
This message may be from an external email source. Do not select links or open attachments unless verified. Report all suspicious emails to Minnesota IT Services Security Operations Center.

-----Original Message----- From: [email protected] <[email protected]> Sent: Wednesday, April 14, 2021 5:11 PM To: Ness, Jenna (MPCA) <[email protected]> Subject: Grace Dairy
This message may be from an external email source. Do not select links or open attachments unless verified. Report all suspicious emails to Minnesota IT Services Security Operations Center.
________________________________
Ms. Ness, I am attaching a letter in support of the proposed Grace Dairy in Chippewa county.
Sincerely
Mike Yost NOTICE: This email (including attachments) is covered by the Electronic Communications Privacy Act, 18 U.S.C. 2510-2521. This email may be confidential and may be legally privileged. If you are not the intended recipient, you are hereby notified that any retention, dissemination, distribution, or copying of this communication is strictly prohibited. Please reply back to the sender that you have received this message in error, then delete it. Thank you
3

April 14, 2021
Jenna Ness
Project Manager
520 Lafayette Road N
St. Paul, MN 55155
Ms. Ness,
I am writing to support the approval of the permit allowing Riverview LLP to build the proposed Grace Dairy in Chippewa County. I am a farmer and landowner near the proposed Grace Dairy site and have over twenty years of experience with Riverview and their dairy sites in west central Minnesota. I support the permit for the Grace Dairy for several reasons.
1. We live less than two miles from one of Riverview’s existing sites and have experienced few if any nuisance issues. No flies, minimal odor, and only slight increase in traffic.
2. Their existing sites are impeccably neat, and runoff is contained. 3. Manure application is done by injection, soil tests are used to determine the quantity
applied and manure is a renewable product that replaces thousands of tons of commercial fertilizer.
4. The Grace Dairy will require hundreds of acres of alfalfa. An alternative crop for the area’s corn and soybean farmers. It is a perennial crop that prevents soil erosion, promotes soil health, sequesters carbon, and provides excellent bee habitat.
5. I have toured multiple dairies from the southwestern United Sates to New England. None are as well operated as a Riverview dairy.
6. The Grace dairy would have a positive effect on our community, environmentally, economically, and socially.
I strongly support the proposed Grace Dairy.
Sincerely,
Michael W. Yost

From: Matthew Claussen <[email protected]> Sent: Sunday, April 18, 2021 2:39 PM To: Ness, Jenna (MPCA) <[email protected]> Subject: Riverview Grace Dairy
Hi Jenna,
My name is Matt Claussen and I am a land owner near the Riverview Grace Dairy. We have had past experience with Riverview and it has been very positive. We are in favor of the Grace Dairy moving forward.
Thanks for your time,
Matt Claussen
This message may be from an external email source. Do not select links or open attachments unless verified. Report all suspicious emails to Minnesota IT Services Security Operations Center.
4

From: Marc Stevens <[email protected]> Sent: Monday, April 19, 2021 7:19 AM To: Ness, Jenna (MPCA) <[email protected]> Subject: Fwd: Grace Dairy Permit
I am writing to ask for approval of the Grace Dairy livestock permit application as submitted.
I am a fourth generation farmer in Grace township. When I returned home to farm after college I intended to raise livestock along with corn, soybeans, and sugar beets. I quickly learned animal agriculture was becoming vertically integrated and/or large scale to be successful. My family didn’t have inroads or experience in that style of farming.
In researching Riverview Dairies I found them to be extremely conscientious in their treatment of the environment and the communities they grow into. I am excited to see the crops I raise used locally and to add alfalfa to our rotation. Riverview will help my farm reach our environmental goals by adding additional deep rooted crop acres and manure as a fertilizer source.
In conclusion farmers need to continue to improve environmentally and in productivity to feed a growing population while protecting our future. I don’t think you will find a better risk than Riverview.
This message may be from an external email source. Do not select links or open attachments unless verified. Report all suspicious emails to Minnesota IT Services Security Operations Center.
5

From: gloria sulflow <[email protected]> Sent: Saturday, April 24, 2021 8:31 PM To: Ness, Jenna (MPCA) <[email protected]> Subject: Grace Dairy
Dear Jenna,
Enclosed is my letter regarding Grace Dairy. Please confirm that you have received my letter.
Gloria Sulflow
This message may be from an external email source. Do not select links or open attachments unless verified. Report all suspicious emails to Minnesota IT Services Security Operations Center.
6

Gloria Sulflow 3060 40th Avenue NE Maynard, MN 56260
320 367-2714
April 24, 2021
Minnesota Pollution Control Agency 520 Lafayette Road North St. Paul, MN 55155-4194
RE: Grace Dairy, Chippewa County SW 1/4, Section 23 Grace Township Chippewa County, Minnesota
Dear Jenna Ness:
I am writing this letter to oppose the above mentioned project for the 10,500 head dairy farm in Grace Township.
I live approximately 1 mile from the proposed Grace Dairy. I am concerned about my water quality. My water is rusty and has some black flecks in it since they started this project. In addition, my well has not been monitored consistently since they started drilling. The years 2019 and 2020 were wet years, what happens to our water tables when we have a dry year. Will I be able to continue to drink the water once they pump all this water out of my area. It is also proposed to pump water five miles away from the dairy. This in and of itself, should tell you that this dairy expansion project should not be in this area. There is not sufficient water to meet the demands of this project.
The roads in this area are also not made for this kind of traffic. County Road 5 isn’t the only road that will be affected. During spring thaws and rain falls our roads have severe ruts that are nearly impassible as it is. I can’t imagine the damage these large trucks and equipment are going to do to our roads.
In addition, my home currently has two hog confinement barns and a dairy farm very close to me. How much water can be taken from this area? How much water pumping can this area sustain before I am driven from my home. This area can’t sustain any additional commercial feedlots.
As a community what benefit does this large commercial feedlot offer us?
Sincerely,
Gloria Sulflow
6

From: Scott Williams <[email protected]> Sent: Monday, April 26, 2021 10:18 AM To: Ness, Jenna (MPCA) <[email protected]> Subject: Grace Dairy EAW Comments
Jenna, I had two landowners stop in and ask if I would submit their comments for the Grace Dairy EAW that is open for comment right now.
Please replay that you received these comments.
Scott Williams, Director Chippewa County Land & Resource Mgmt.
This message may be from an external email source. Do not select links or open attachments unless verified. Report all suspicious emails to Minnesota IT Services Security Operations Center.
7

I a. m /(}rov, J;,,_� -tL (-.,➔ I Irr i.v; "'9 V '
G J--tc-e.. nu Irv E fJ LJ j )1 C A /,,;,,1J,> tJ,:, / V
a. roric-n-- h _Q {- ours i'< TAt
1) .kl./ ,,, v , / ( .,. s , Tr-/
lA,-� )"\ I< I..J IJ--ovi 1-e
Y'-t"(-oo h �, j, le ;:. u 1,-- ;J.. f wt' II Cl 1, d A (/ iv
-]19;.-./ "J.,f,Jo-,;....J
C o f,,, ;,, .,,,.., is
Coun-fv j. '1
/
Q ,,,.,,,.,f
iv t" fl, -r/2J I
�or ';/,,_ ,,,
)',,_) h hA'r & fq__
0 f· /...v R f'.-,, Y
� II Lv ,L I c:;
Wl!IU( cl Th ,. f- ),_ � ,, �..JI� ,.J
s· ;' >-i c� ,....� l'--1
P-- ;;c:;:_ /
ihe
7
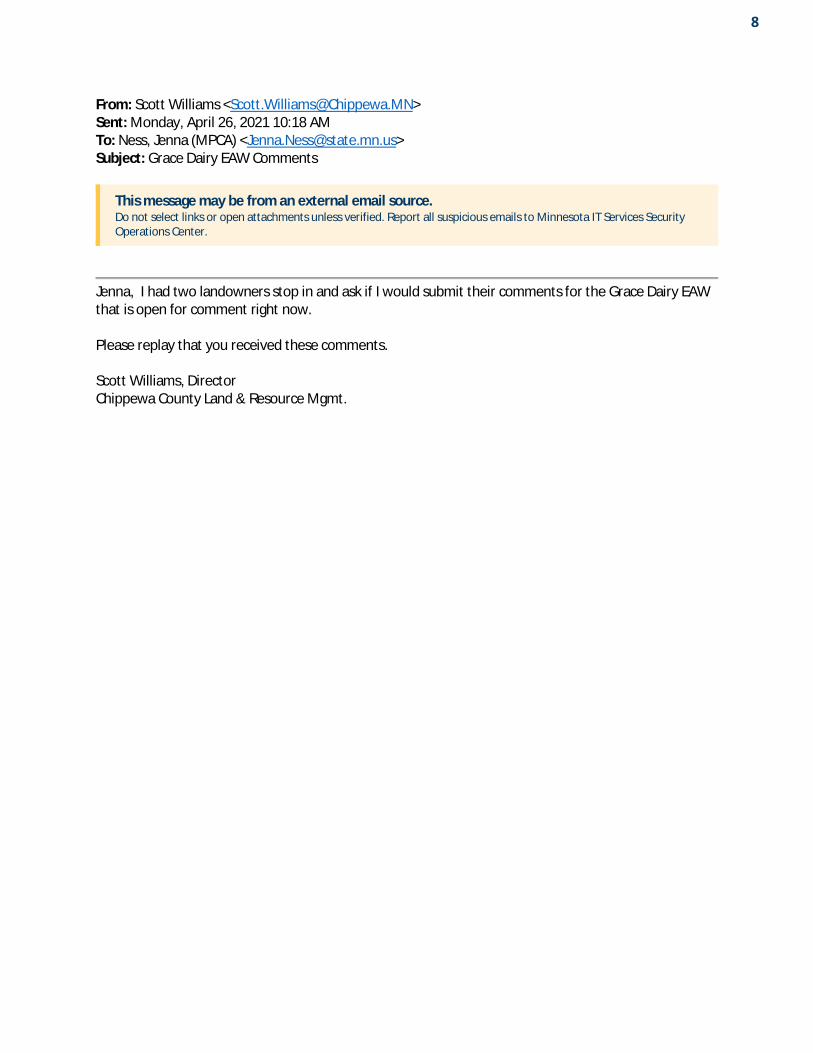
From: Scott Williams <[email protected]> Sent: Monday, April 26, 2021 10:18 AM To: Ness, Jenna (MPCA) <[email protected]> Subject: Grace Dairy EAW Comments
Jenna, I had two landowners stop in and ask if I would submit their comments for the Grace Dairy EAW that is open for comment right now.
Please replay that you received these comments.
Scott Williams, Director Chippewa County Land & Resource Mgmt.
This message may be from an external email source. Do not select links or open attachments unless verified. Report all suspicious emails to Minnesota IT Services Security Operations Center.
8

8


9

MINNESOTA STATE HISTORIC PRESERVATION OFFICE
50 Sherburne Avenue ▪ Administration Building 203 ▪ Saint Paul, Minnesota 55155 ▪ 651-201-3287
mn.gov/admin/shpo ▪ [email protected]
AN EQUAL OPPORTUNITY AND SERVICE PROVIDER
April 27, 2021
Jenna Ness MN Pollution Control Agency 520 Lafayette Road N St. Paul, MN 55155-4194
RE: EAW – Grace Dairy T119 R39 S23 SW, Grace Twp, Chippewa County SHPO Number: 2021-1486
Dear Jenna Ness:
Thank you for providing this office with a copy of the Environmental Assessment Worksheet (EAW) for the above-referenced project.
Based on our review of the project information, we conclude that there are no properties listed in the National or State Registers of Historic Places and no known or suspected archaeological properties in the area that will be affected by this project.
Please note that this comment letter does not address the requirements of Section 106 of the National Historic Preservation Act of 1966 and 36 CFR § 800. If this project is considered for federal financial assistance, or requires a federal permit or license, then review and consultation with our office will need to be initiated by the lead federal agency. Be advised that comments and recommendations provided by our office for this state-level review may differ from findings and determinations made by the federal agency as part of review and consultation under Section 106.
Please contact Kelly Gragg-Johnson, Environmental Review Specialist, at [email protected] if you have any questions regarding our review of this project.
Sincerely,
Sarah J. Beimers Environmental Review Program Manager
10

From: Stacey Sik <[email protected]> Sent: Tuesday, April 27, 2021 3:18 PM To: Ness, Jenna (MPCA) <[email protected]> Subject: Riverview Dairy in Grace Township ,Chippewa County.
Jenna Ness. April 27,2021
I'm writing to you on behalf of my parents Henry W. & Gladys Arends. Henry signed a waiver awhile ago (attachment 15). He would like to withdraw from that because he is no longer in favor of the Dairy being built so close to his farm. The amount of water used could severely affect the water quality in our well. The odor from the amount of manure spread & the barns themselves. The damage to the roads from the traffic & equipment.
Sincerely,
Henry W.& Gladys Arends
4085 40th Ave NE Maynard MN
320-220-3853
This message may be from an external email source. Do not select links or open attachments unless verified. Report all suspicious emails to Minnesota IT Services Security Operations Center.
11

From: Josh Koenen <[email protected]> Sent: Tuesday, April 27, 2021 9:26 PM To: Ness, Jenna (MPCA) <[email protected]> Subject: Grace Dairy Chippewa County MN
To Whom it Concerns:
We have some concerns that we would like to express concerning the Grace Dairy.
The first concern that we have is the feature and quality of our drinking water if the Grace Dairy goes through we may have to start using filtration systems, as of now we have been able to maintain good drinking water without the use of filtration systems and would like to maintain this. When they did their pump test in the summer of 2020 our water quality deteriorated, developed an odor and become cloudy in color, so we are concerned if Grace Dairy goes through with this our water will decline and stay this way.
The second concern that we have is it seems like 350 gallons a minutes, 24 hours a day, 365 days a year seems like a lot especially when there are 5 house holds within a one mile radius of the main proposed well site which is at the intersection of Chippewa County 5 and Chippewa County 13.
Lastly when it comes time for manure are they going to flood inject manure like the rest of the dairies Riverview owns and operates in the area? Seems when they are done injecting manure in the fall there is a lot of manure lakes in the area fields, which can and will tamper our water ways and water sources when it runs off.
Sincerely a concerned resident,
Josh Koenen
This message may be from an external email source. Do not select links or open attachments unless verified. Report all suspicious emails to Minnesota IT Services Security Operations Center.
12

From: Heather Sulflow <[email protected]> Sent: Wednesday, April 28, 2021 8:31 PM To: Ness, Jenna (MPCA) <[email protected]> Subject: Grace Township, Chippewa County Feedlot
Steve and Heather Sulflow 3075 40th Ave NE
Maynard, MN 56260
April 28, 2021 Minnesota Pollution Control Agency 520 Lafayette Road North St. Paul, MN 55155-4194
RE: Grace Dairy, Chippewa County SW ¼, Section 23 Grace Township Chippewa County, Minnesota
Dear Jenna Ness:
We are writing with concerns of the aforementioned project of the 10,500 head dairy farm in Grace Township.
We live about a mile from the proposed site in Grace Township. We are very concerned about the amount of water being used at this facility and the quality of water at our home. Since drilling for water has started for this project, we have noticed more contaminants in our water as well as we sometimes have a bad odor to our water. This does not make using or drinking our water very appealing. This facility is taking water from up to 5 miles from the barns. This is a concern that they need more water than this area has to give. We are very concerned that this could potentially dry up our personal well. If that should happen, who is going to dig us a new one?
We also currently have two hog confinement barns as well as another dairy barn very close to our farm. We live in a very rural area by choice. Why do all these confinement barns have to be placed all in close proximity? We enjoy being outdoors. We do not look forward to an increase in traffic due to another barn being built. Our roads, which the county does maintain, cannot handle all the heavy equipment and extra traffic on them.
Please listen to our concerns. We don’t feel that our area can sustain having another large animal feedlot. Our home has been here for several generations, we do not want to be driven from it due to another expanding commercial feedlot that drains every last drop of water from us.
Sincerely,
Steve and Heather Sulflow
13

From: Kent Bosch <[email protected]> Sent: Wednesday, April 28, 2021 11:30 PM To: Ness, Jenna (MPCA) <[email protected]> Subject: Grace Dairy public comment
Jenna,
Please find attached to this email my comments regarding the permit referenced below:
Facility name and location: Grace Dairy, Chippewa County SW 1/4 , Section 23 Grace Township Chippewa County, Minnesota
Please confirm you got these comments and they will be considered and included in the record.
Thanks, Kent D Bosch6035 10th Ave NEMontevideo, MN 56265320 226 3237
TO: MPCA RE: Grace Dairy permits public comment
My name is Kent Bosch. I live and farm on a third generation farm with my wife Janet in Grace Township in Chippewa County, MN. We have three grown children, two of which have hopes of returning to farm here as forth generation farmers after their college education. Our home is approx. two miles northwest of the proposed site. I am a co-owner of CK Bosch Farms which is a family farm based one mile north west of the Grace Dairy site.
I have reviewed the EAW for Grace dairy and find it to be very thorough and acceptable based on the science involved in protecting the environment.
I am in favor of this dairy farm being permitted, built, and operated close to our farm business for the following reasons:
Grace Dairy will benefit the surrounding farmers and farmland by: n Providing a closer end user of the commodities produced locally.n Result in less transportation costs to get our crops to market. This means less fuel
consumed and less road wear and tear by our farming operation.n Provide more opportunity for greater bio diversity introducing more alfalfa in our crop
rotation. This is a great deep rooted crop that is a great option to hold soil and water on ourland.
This message may be from an external email source. Do not select links or open attachments unless verified. Report all suspicious emails to Minnesota IT Services Security Operations Center.
14

n Provide a much needed new source of natural fertilizer high in organic matter building soil health and fertility at a lower cost than commercial fertilizer.
n Provide a significant increase in our local taxing district tax capacity thereby reducing the property tax burden on other local farm businesses.
n Provide needed jobs and local economy and more people moving to and living in our otherwise shrinking community.
I also wanted to speak to our experience with the Riverview Dairy organization. We have been able to be involved in selling silage and purchasing manure from them on a limited basis from Swenoda Dairy 4 miles northwest of our home. They have operated with integrity, professional management and business conduct. In other words, they are good neighbors. I have also noted the tremendous apparent concern and attention paid to protecting the environment. I grew up with livestock feedlots and a small dairy herd in our back yard. I have never seen a cleaner, or more odor and fly free environment for cows. I do not know how many of my neighbors submitted public comments but I know that based on the number of them who are excited about selling crop and purchasing manure that there are many of us who live and farm here that want this project to be operating as soon as possible. Respectfully Submitted, Kent D Bosch

From: Aaron Decker <[email protected]> Sent: Thursday, April 29, 2021 8:44 AM To: Ness, Jenna (MPCA) <[email protected]> Cc: Joy Anderson <[email protected]>; Eric Lindberg <[email protected]> Subject: MCEA Comments on Grace Dairy
Ms. Ness,
Attached please find comments from Minnesota Center for Environmental Advocacy regarding the Environmental Assessment Worksheet for Grace Dairy, Chippewa County.
Your acknowledgement of receipt of this e-mail and attachment is requested and appreciated.
Thank you.
--
Due to COVID-19 , MCEA's staff is working remotely for now.Be Safe, Stay Well.
Aaron Stabenow Decker Legal Assistant Minnesota Center for Environmental Advocacy
Website: www.mncenter.orgFacebook: www.facebook.com/MCEA1974 Twitter: @MCEA1974 Instagram: @MCEA1974
This message may be from an external email source. Do not select links or open attachments unless verified. Report all suspicious emails to Minnesota IT Services Security Operations Center.
15

April 29, 2021 Ms. Jenna Ness Project Manager VIA E-MAIL Minnesota Pollution Control Agency 520 Lafayette Road North St. Paul, MN 55155 [email protected] Re: Environmental Assessment Worksheet for Grace Dairy, Chippewa County Dear Ms. Ness, Minnesota Center for Environmental Advocacy (“MCEA”) appreciates the opportunity to comment on the Environmental Assessment Worksheet for the Grace Dairy, Chippewa County. This gives MCEA the opportunity to comment on the need to fully account for and analyze greenhouse gas emissions of concentrated animal feeding operations and to consider the effects of adding more manure to the already impaired watershed near the project.
Please see our comments for further discussion. Again, we thank you for the opportunity to continue these important discussions regarding the protection of our state’s environment. Sincerely, /s/ Joy Anderson Joy Anderson Senior Staff Attorney JA/ad Enclosure

1
Minnesota Center for Environmental Advocacy’s Comments on the Environmental Assessment Worksheet for
Grace Dairy
April 29, 2021
INTRODUCTION
The Grace Dairy project in Chippewa County is the second massive Confined Animal
Feeding Operation (“CAFO”) by agribusiness giant Riverview, LLP (“Riverview”) to be subject
to environmental review by the Minnesota Pollution Control Agency (“MPCA”) in the past eight
months. Like Riverview’s new Waukon Dairy in Norman County, if constructed Grace Dairy
would house 10,500 units of Jersey dairy cows, create more than 76,000 tons of greenhouse gas
(“GHG”) emissions, use more than 120 million gallons of water, and produce more than 86 million
gallons of manure annually. Grace Dairy would be tied with Waukon Dairy for fourth-largest
CAFO in Minnesota. The potential for significant environmental effects—from GHGs, water use,
and manure contamination—is immense.
Yet, the Environmental Assessment Worksheet (“EAW”) for Grace Dairy fails to fully
analyze several critical issues, leaving its assessment incomplete. First, the EAW fails to analyze
the GHG emissions that will emanate from this huge CAFO and the effects those emissions will
have on climate change. Second, the EAW lacks a full assessment of the cumulative effects of
applying so much additional manure to fields in a region where surface waters are already impaired
with agricultural pollutants.
This operation is massive—about 45 times the size of an average Minnesota dairy farm—
and proposed by the largest player in Minnesota’s dairy industry.1 This is not a family farm, but
1 See Adam Belz, Milking cows on an industrial scale arrives in western Minnesota, and some farmers shudder, STAR TRIBUNE (Aug. 11, 2018), https://www.startribune.com/milking-cows-on-an-industrial-scale-arrives-in-western-minnesota-and-some-farmers-shudder/490589351/?refresh=true.

2
an industrial farming facility. Like most industrial complexes, Grace Dairy has the potential to
pollute the air, water, and land around it. CAFOs have been linked to water and air pollution, lower
life expectancy and higher rates of infant deaths, and other environmental and health hazards.2
Thus far, MPCA has allowed Riverview to build massive CAFOs like Waukon Dairy without a
full Environmental Impact Statement (“EIS”) to study their effects. And Riverview has responded
by proposing more giant CAFOs, like the current proposal. Just like other large corporations
engaged in activities that have a massive impact on Minnesota’s environment, Riverview has the
resources and the responsibility to fully study and disclose those impacts before receiving
governmental approval for its project.
Before Grace Dairy receives any permit approvals, MPCA must study all of Grace Dairy’s
possible effects on Minnesota’s environment, including its GHG emissions and potential for water
pollution from additional manure. At a minimum, Grace Dairy’s EAW should be supplemented to
include and fully analyze the missing information, so that MPCA can completely and accurately
determine whether Grace Dairy has the potential for significant environmental effects. With a
project of this scale, however, based even on the incomplete information contained in the EAW,
MPCA should recognize the potential for significant environmental effects and order an EIS to
further study those effects.
I. MPCA MUST ORDER AN EIS BECAUSE GRACE DAIRY’S GHG EMISSIONS HAVE THE POTENTIAL FOR SIGNIFICANT ENVIRONMENTAL EFFECTS
First, the EAW fails to fully account for Grace Dairy’s GHG emissions or fully analyze
their potential for significant environmental effects. This Project will have 10,500 cows, and even
under the MPCA’s accounting, which leaves out emissions from a number of sources, it will
2 See Charlie Mitchell & Austin Frerick, The Hog Barons, VOX (April 19, 2021), https://www.vox.com/the-highlight/22344953/iowa-select-jeff-hansen-pork-farming.

3
produce 76,106 tons of CO2-e GHG emissions per year.3 Although MPCA asserts that there are no
standards to apply or methods to quantify the effects of these emissions, in fact last December the
Minnesota Environmental Quality Board (“EQB”) issued a draft of its recommendations for
integrating climate information into environmental review (“EQB Draft Recommendations”),4
which explains in detail how MPCA should analyze GHG emissions in this and other EAWs. Even
though MPCA is a member of the EQB and undoubtedly aware of the recommendations, it ignored
them in its GHG analysis for Grace Dairy. MPCA should add this information to the EAW, or
order an EIS to fully study the effects of these emissions.
The EAW Fails To Account For All GHG Emissions That Will Result From Grace Dairy.
1. Minnesota law and public policy require a full accounting of all GHG emissions from Grace Dairy as part of the environmental review.
Under MEPA, a responsible governmental unit must consider all impacts “that may be
reasonably expected to occur from the project” to determine whether Grace Dairy has “the
potential for significant environmental effects.”5 The agency must take a “hard look” at the issues
involved, and “genuinely engage[ ] in reasoned decision making.”6 As the Minnesota Court of
Appeals explained, the environmental review process must include an analysis of GHG emissions
3 MPCA, Grace Dairy Environmental Assessment Worksheet 3, 30 (March 30, 2021) [hereinafter “EAW”]. The EAW indicates Grace Dairy will include 10,500 animal units of Jersey dairy cows, which this comment will assume means 10,500 mature dairy cows of less than 1,000 lbs. MPCA, Feedlot Animal Unit Capacity Calculator, https://www.pca.state.mn.us/sites/default/files/wq-f3-30.xls. 4 Minn. Envt’l Quality Bd., DRAFT Recommendation: Integrating Climate Information into MEPA Program Requirements, EQB-member Environmental Review Interagency Climate Technical Team (Dec. 2020) [hereinafter “EQB Draft Recommendations”] (attached as Ex. 1). 5 Minn. R. 4410.1700, subp. 6. 6 Citizens Advocating Responsible Dev. v. Kandiyohi Cty. Bd. of Comm’rs, 713 N.W.2d 817, 832 (Minn. 2006).

4
for any project where emissions are “reasonably expected” to occur with a potential for significant
environmental effects.7
A consideration of GHG emissions aligns with Minnesota law and policy, which call for
steep reductions in GHG emissions throughout the state. Minnesota’s 2007 Next Generation
Energy Act (“NGEA”) acknowledges the threat GHG emissions pose to public health and welfare
by setting state goals to reduce statewide GHG emissions, with an ultimate goal of reducing
emissions in the state 80% below 2005 levels by 2050.8 Unfortunately, Minnesota has fallen short
of its 2015 goal to decrease GHG emissions 15% below the 2005 baseline, and Minnesota is not
on track to meet the 2025 goal of a 30% decrease.9 The agricultural sector is particularly off-track:
methane and nitrous oxide emissions from agriculture actually increased between 2005 and 2016.10
Recognizing that Minnesota needs to redouble its efforts to address the existential threat of climate
change, Gov. Walz has created a Climate Change Subcabinet and an Advisory Council on Climate
Change, which are working to develop strategies to help Minnesota meet or exceed its GHG
emission reduction goals.11
7 In re Denial of a Contested Case Hearing Request, No. A19-0207, 2019 WL 5106666, at *7-8 (Minn. App. Oct. 14, 2019). This is consistent with the numerous federal courts that have also concluded GHG emissions are a significant threat that an agency must evaluate in environmental review. See, e.g., Ctr. for Biological Diversity v. Nat’l Highway Traffic Safety Admin., 538 F.3d 1172, 1217 (9th Cir. 2008) (concluding the cumulative impacts analysis in the environmental assessment failed to adequately assess cumulative impacts of greenhouse gas emissions as required by NEPA); Border Power Plant Working Grp. v. Dep’t of Energy, 260 F. Supp. 2d 997, 1028 (S.D. Cal. 2003) (finding an environmental assessment under NEPA was inadequate when it failed to consider the project’s carbon dioxide emissions given their status as a greenhouse gas). 8 Minn. Stat. § 216H.02, subd. 1, subd. 2 (2019). 9 Frank Kohlasch, Climate Change Subcabinet Update Report 2 (Dec. 2020), available at https://climate.state.mn.us/sites/climate-action/files/2021-01/ClimateChangeSubcabinetReport_2020_cc-mn3-01.pdf. 10 MPCA, Greenhouse gas emissions in Minnesota: 1990-2016 (2019), https://www.pca.state.mn.us/sites/default/files/lraq-2sy19.pdf [hereinafter “GHG in Minn.”]. 11 Kolasch, supra note 9, at 2.

5
As part of Minnesota’s efforts to address climate change, the state agency tasked with
developing rules for the environmental review process has recognized that GHG emissions need
to be considered in EAWs. In January 2020, the EQB convened a team to provide
recommendations regarding the inclusion of climate change-related information in environmental
review documents.12 Now, the EQB has issued, and received public comment on, draft
recommendations for the inclusion of climate related information in environmental review. The
EQB Draft Recommendations call for EAWs to include a full GHG analysis, including a
quantification of GHG emissions, the sources of those emissions, and mitigation planning.13 In
addition, for projects emitting more than 25,000 tons annually, the recommendations call for
further mitigation discussions, the net lifetime GHG emissions from the project, and how the
emissions may affect achievement of the state’s NGEA goals.14 The MPCA Commissioner chairs
the EQB. And the EQB is undertaking its efforts because it recognizes that a full analysis of GHG
emissions and mitigation opportunities is not only consistent with the spirit of Minnesota’s climate
laws and policy but because it is required by the Minnesota Environmental Policy Act (“MEPA”).
MEPA requires this analysis today.
The EAW, however, does not contain any of the required analysis identified by the EQB.
To comply with Minnesota law and public policy, MPCA must include a full and complete
accounting and analysis of the GHG emissions from Grace Dairy and their expected
environmental effects in the EAW. The MPCA, by law, leads Minnesota’s efforts to address
climate change; notably, the MPCA Commissioner chairs the Governor’s Climate Change
Subcabinet, where its role is to focus on meeting NGEA goals and encourage climate adaptation
12 EQB Draft Recommendations, supra note 4, at 2. 13 Id. at 9. 14 Id.

6
by government and the public.15 It is long past time for the MPCA to acknowledge in EAWs what
it has known for many years—that GHGs have significant environmental effects, and that an
accurate environmental analysis for a large industrial project like Grace Dairy requires a thorough
accounting of all its emissions and a full analysis of potential mitigations. MPCA can no longer
simply throw up its hands and “entirely fail[ ] to consider an important aspect of the problem.”16
Indeed, the MPCA’s intransigence in the face of an urgent need to address the climate crisis and a
wealth of available resources and information for project-specific solutions and mitigations is a
textbook example of a decision that “represents the agency’s will, rather than its judgment.”17
2. MPCA’s estimates of Grace Dairy’s GHG emissions are too narrow in scope and underestimate the project’s total emissions.
The EAW presents only a fractional picture of the GHGs that will be directly and indirectly
emitted from a feedlot with 10,500 dairy cows, thereby significantly underestimating Grace
Dairy’s environmental impact. The EAW estimates emissions from only three sources—manure
storage, enteric fermentation, and manure land application—and only for two GHGs—methane
and nitrous oxide.18 The EAW concludes that these emissions will produce an estimated 76,106
tons of CO2-equivalent emissions per year.19
But MPCA fails to account for other numerous sources of GHG emissions, resulting in a
calculation that significantly underestimates Grace Dairy’s total emissions. Notably, MPCA’s
approach does not meet the requirements of the EQB Draft Recommendations, which call for
quantification and discussion of all GHG emission sources, including energy use (whether
produced onsite or purchased from an off-site source), off-road and on-road mobile emissions
15 Kohlasch, supra note 9, Appendix L at 51. 16 Trout Unlimited, Inc. v. Minn. Dep’t of Agric., 528 N.W.2d 903, 907 (Minn. App. 1995). 17 Id. 18 EAW at 22. 19 Id.

7
sources, agricultural and land use practices, non-combustion industrial process emissions, waste
management, and construction.20 As explained in the EQB Draft Recommendations,
In the carbon footprint, GHG emission sources include all project sources of GHGs found within the property line of the project proposer or offsite from sources under contract or the control of the project proposer, plus offsite emissions associated with the generation of purchased electricity or solid waste disposal services. Project emissions include all emissions that are likely to occur in the operating phase of the project, as well as its construction phase.21
Counting all of these emissions would provide a much different perspective on the Grace
Dairy proposal. Grace Dairy’s plans include huge new barns, a milking parlor, other agricultural
buildings, and two on-site apartment buildings, all of which will require energy for electricity,
heating and cooling, appliances, and milking equipment.22 The dairy will use many vehicles,
including delivery vehicles, employee transportation, farm vehicles, and heavy machinery, which
will burn fuel and generate emissions. Producing and processing feed for 10,500 dairy cows also
will create significant emissions. And Grace Dairy’s construction-related emissions also will be
considerable. However, none of these emissions are accounted for in the EAW, even though the
EQB Draft Recommendations require them all to be counted.
MPCA itself concedes several of these deficiencies, noting:
The potential GHG emissions . . . are only estimates and do not consider all GHG emissions that the Project could create or induce. For example, GHG emissions are not calculated for electricity generation that is required to operate lighting, heating, milk pumping equipment, etc. Also not included are GHG emissions from fuel combustion required to deliver feed, animals, and milk, and to operate farm equipment used in growing feed, processing feed, and applying manure.23
20 EQB Draft Recommendations, supra note 4, at 21. 21 Id. at 25. 22 EAW at 3. 23 EAW at 22.

8
These sources, however, can generate a significant portion of an agricultural project’s
environmental impact. The Food and Agricultural Organization of the United Nations estimates
that feed production and processing alone account for 45% of GHG emissions from livestock
production.24 Furthermore, ICF International estimates that carbon dioxide emissions from energy
use account for 14% of all agricultural emissions across the United States.25 Management of
livestock waste—one of the only sources quantified in the EAW—accounts for only 12% of total
agricultural GHG emissions.26
Clearly, the EAW significantly underestimates the emissions that will result from this
project. MPCA cannot limit its analysis to a narrow set of emission sources—such an analysis fails
to comply with MEPA because it does not fully account for Grace Dairy’s potentially significant
environmental effects. MEPA requires MPCA to consider all environmental impacts “that may be
reasonably expected to occur from the project.”27 This means MPCA must consider not just some
or a select few, but all of Grace Dairy’s reasonably estimable GHG emissions.28 But the EAW
fails to do so.
3. MPCA can estimate the proper scope of GHG emissions using existing tools.
MPCA cannot avoid quantifying GHG emissions from all of Grace Dairy’s sources by
asserting that they are too difficult to calculate. There are many simple, readily available tools to
quantify GHG emissions that MPCA can use. Notably, the EQB Draft Recommendations describe
24 Food and Agric. Org. of the UN, Global Database of GHG Emissions Related to Feed Crops: Methodology 4 (2017), http://www.fao.org/3/a-i8276e.pdf. 25 ICF Int’l, Greenhouse Gas Mitigation Options and Costs for Agricultural Land and Animal Production within the United States 1.4 (2013), https://www.usda.gov/sites/default/files/documents/GHG_mitigation_Options.pdf. 26 Id. 27 Minn. R. 4410.1700, subd. 6. 28 Denial of a Contested Case Hearing Request, 2019 WL 5106666, at *7-8.

9
in detail how to perform a GHG analysis, including how to properly quantify emissions, and
MPCA could use this guidance to inform its analysis.
MPCA chose to quantify emissions from only manure storage, enteric fermentation, and
manure land application based on emission factors the U.S. Environmental Protection Agency
(“EPA”) developed for estimating total feedlot GHG emissions.29 MPCA states that it has
previously used these emission factors in estimating GHG emissions from feedlots in statewide
inventories of emissions and therefore used those same categories and emissions factors for this
Project as well.30 But the statewide assessment and the EAW for Grace Dairy are not the same. In
the state-wide assessment, MPCA accounted for some agricultural emissions in other sectors; for
example, emissions due to agricultural use of electricity were included in the electricity sector, and
emissions from farm trucks were included in the transportation sector.31 Accordingly, all emissions
would be accounted for in some sector within the assessment. But in the EAW, MPCA does not
divide emissions accounting into sectors, so the emissions from electricity and transportation
simply are not counted at all. This is not consistent with MEPA’s requirement that the reviewing
agency consider any impacts “that may be reasonably expected to occur from the project”32 or with
the Court of Appeals directive that MPCA take a “hard look” at GHG emissions when the
emissions from a project have the potential for significant environmental effects.33
29 EAW at 22. 30 Id. 31 See MPCA, Greenhouse Gas Emissions in Minnesota: 1970-2008, at 30, 61 (2012), https://www.pca.state.mn.us/sistes/default/files/p-gen4-08.pdf (showing that emissions for farm vehicles are not separated out from the transportation sector and explaining that emissions associated with electricity consumption are estimated separately as electric power sector emissions). 32 Minn. R. 4410.1700, subp. 6. 33 Denial of a Contested Case Hearing Request, 2019 WL 5106666, at *7.

10
In addition, MPCA cannot justify its limited accounting of GHG emissions by asserting
that manure storage, enteric fermentation, and manure land application are the sources for which
EPA provides emissions factors.34 Notably, EPA also provides emissions factors for other
components of the agricultural sector, including those not accounted for in the EAW. For instance,
EPA has produced emissions factors for electricity generation,35 calculating carbon dioxide
emissions per gallon of fuel,36 and methane and nitrous oxide emissions per gallon of fuel used in
agricultural equipment.37 The EQB Draft Recommendations call for using emission factors to
calculate GHGs, and provide both emissions factors and simplified equations for calculation
emissions using those factors.38 This includes emissions factors for fossil fuel combustion from
mobile sources, refrigeration and space cooling, soil nitrogen management, and electricity
purchased from off-site sources, among others.39 In addition, as an alternative method, the EQB
Draft Recommendations list two online tools that specifically quantify GHG emissions for
agricultural operations—Cool Farm Tool, and COMET-Planner.40 Given the ease of use and
availability of this data, MPCA cannot assert that the emissions from all of Grace Dairy’s activities
would be too difficult to calculate.
B. The EAW Fails To Consider The Effects Of The GHG Emissions From Grace Dairy.
In addition to undercounting Grace Dairy’s GHG emissions, the EAW entirely fails to
consider the potential effects those emissions might have in advancing climate change. While
34 EAW at 22. 35 EPA, Emission Factors for Greenhouse Gas Inventories, Table 6 (2020), https://www.epa.gov/sites/production/files/2020-04/documents/ghg-emission-factors-hub.pdf. 36 EPA, Greenhouse Gas Inventory Guidance: Direct Emissions from Mobile Combustion Sources, App’x at 15 (2016). 37 Id. at 22. 38 EQB Draft Recommendations, supra note 4, at 31, 34-43. 39 Id. at 34-43. 40 Id. at 32.

11
MPCA asserts that it simply is not possible to analyze the impacts the emissions might have,
MEPA in fact obligates MPCA to perform this analysis, and guidance documents provide a
framework for how it may do so, by examining the cumulative effects of the emissions and their
effects on the achievement of the Minnesota NGEA goals.
1. MPCA failed to perform a cumulative potential effects analysis to determine the impacts of GHG emissions from Grace Dairy.
Because climate change results from the incremental addition of GHG emissions from
millions of individual sources that collectively have a large impact, an effective EAW must
examine the cumulative effects of a project’s GHG emissions. MEPA rules specifically
acknowledge that even a project that individually has only a small environmental footprint may
still have the potential for significant effects when cumulative effects are considered.41 This
analysis is an integral part of MPCA’s obligation to determine if Grace Dairy has the potential for
significant environmental effects, and MPCA is not allowed to ignore it.42 But the EAW avoids
this responsibility, simply asserting, “The Project’s incremental contribution to global GHGs
cannot be translated into effects on climate change globally or regionally.”43
Again, the EQB Draft Recommendations provide guidance for the agency in meeting its
obligations under MEPA. The recommendations require agencies to discuss the project’s
cumulative potential effects, “including current Minnesota climate trends and anticipated climate
change in the general location of the project” to determine whether the project creates a potential
for significant environmental effects due to the cumulative impacts.44 This is necessary because
41 Minn. R. 4410.1700, subd. 7. 42 Pope Cty. Mothers v. Minn. Pollution Control Agency, 594 N.W.2d 233, 237 (Minn. App. 1999) (holding MPCA did not engage in reasoned decision making when it failed to consider the cumulative environmental effects of multi-site feedlot operation). 43 EAW at 29. 44 EQB Draft Recommendations, supra note 4, at 23.

12
“government decision makers and the public will benefit from understanding how the proposed
project may contribute GHG emissions along with other GHG emission sources in the
environmentally relevant area.”45 The EQB Draft Recommendations explain that when analyzing
cumulative effects, an agency “should consider if other existing, or planned future sources of GHG
emissions are identified within the jurisdiction of the [agency].”46
Accordingly, the EAW should include a discussion of expected climate change impacts in
Chippewa County, current and expected future sources of GHG emissions in the county, and
whether the additional expected emissions from Grace Dairy will have a cumulative effect on the
environment when combined with these other emissions. All of this analysis, however, is missing
from the EAW.
2. MPCA failed to consider how Grace Dairy’s emissions will affect Minnesota’s achievement of NGEA goals.
After quantifying cumulative impacts, MPCA must consider Grace Dairy’s emissions in
context with Minnesota’s goals for reducing GHG emissions. Again, this is required by MEPA as
reflected in the EQB Draft Recommendations, which require the agency to “quantify the proposed
project’s predicted net lifetime GHG emissions and how those predicted emissions may affect
achievement of the Minnesota Next Generation Energy Act goals and/or other more stringent state
or local GHG reduction goals.”47
In this case, this could include an analysis of (1) Minnesota’s lack of progress in meeting
the NGEA goals; (2) agriculture’s role in that failure to meet the NGEA goals; and (3) Grace
Dairy’s effect on Minnesota’s ability to meet the NGEA goals. Again, all of this information is
readily available to MPCA, which published numerous reports about climate impacts and
45 Id. at 33. 46 Id. 47 Id. at 22.

13
Minnesota’s progress in reducing GHG emissions, including Greenhouse Gas Emissions in
Minnesota: 1990-201648 and Greenhouse Gas Reduction Potential of Agricultural Best
Management Practices49 in 2019 (“2019 Reports”). The 2019 Reports contain information about
climate change in Minnesota and agriculture’s contribution to our state GHG emissions. Some
examples of relevant information include:
“To reduce the impacts of climate change, Minnesota has set a goal to reduce greenhouse gas emissions by 80 percent by 2050, but we are behind schedule.”50
“Without continued support and additional effort, we are not likely to achieve the goals of the [NGEA].”51
“Agriculture accounts for approximately one-quarter of Minnesota’s greenhouse gas emissions, so strategies to reduce emissions from this sector are critical to reaching statewide goals.”52
Agriculture is the largest source of nitrous oxide and methane emissions in the state.53
This information demonstrates the unique role that agriculture plays in Minnesota’s GHG
emissions. It clarifies that Minnesota cannot achieve its GHG reduction goals without reductions
from the agricultural sector when agriculture is the state’s largest source of nitrous oxide and
methane emissions. Perhaps more importantly, the 2019 Reports also show that the portions of the
agricultural sector relevant to Grace Dairy have not achieved emissions reductions. In fact,
emissions from key agricultural sectors have actually increased during a period in which they were
supposed to decrease. For example, while the NGEA called for emissions across the board to
48 GHG in Minn., supra note 10. 49 MPCA, Greenhouse Gas Reduction Potential of Agricultural Best Management Practices (2019), https://www.pca.state.mn.us/sites/default/files/p-gen4-19.pdf [hereinafter “Agriculture BMPs”]. 50 Id. 51 GHG in Minn., supra note 10, at 15. 52 Agriculture BMPs, supra note 46, at Executive Summary (emphasis added). 53 GHG in Minn., supra note 10, at 2, 8.

14
decrease 15% from 2005 to 2015,54 during that same period nitrous oxide emissions from crop
agriculture increased about 12% and methane emissions from animal agriculture increased about
8%.55
MPCA failed to include this critical information and context in the EAW. The EAW does
not mention that Minnesota needs to take more aggressive action than in the past in order to achieve
the NGEA’s goals, and it fails to note that Minnesota is studying additional ways to reduce
emissions dramatically across all emitting sectors, including agriculture. Instead, the EAW creates
a misleading picture of Minnesota’s progress on GHG emissions, combining the agriculture and
forestry sectors to describe a 2% reduction in emissions compared to the 2005 baseline, while
failing to note that the forestry sector is entirely responsible for the decrease and offsetting
increases from agriculture.56 At the same time, the EAW downplays the effects of climate change,
asserting that, for example, species may “shift” out of Minnesota, or forests of aspen and birch
may be “replaced” by oak and hickory, instead of truthfully stating that many of those trees and
species will die.57 Shockingly, the EAW even asserts that “moderate climate change may increase
agricultural yields and food production,” parroting a frequent assertion by fossil fuel companies
that an increase in global temperature could actually be beneficial instead of catastrophic.58 An
accurate assessment of climate change in Minnesota would describe effects including more
extremely hot days of over 95 degrees, which can be particularly dangerous in urban heat islands
and harmful to crops; more frequent heavy rains and storms, which will damage crops, homes, and
54 Minn. Stat. § 216H.02. 55 GHG in Minn., supra note 10, at 8. 56 EAW at 29. 57 Id. 58 Id.

15
businesses, while also threatening lives with flash flooding; and loss of habitats and animal,
aquatic, and plant life.59
Even without connecting Grace Dairy to particular climate change impacts— like a specific
increase in temperature or storm frequency—MPCA can still analyze Grace Dairy’s potential for
significant environmental impacts. Indeed, MPCA must do so under MEPA. By adding context
about cumulative GHG emissions, the lack of progress toward Minnesota’s NGEA goals, and
Grace Dairy’s effect on Minnesota’s ability to reach those goals, MPCA will be able to more
accurately assess whether Grace Dairy has the potential for significant environmental effects.
C. The EAW Fails To Analyze Options For Mitigating The GHG Emissions From Grace Dairy.
Finally, MEPA requires that the EAW include a robust discussion of mitigation measures
that could reduce Grace Dairy’s climate change impacts. Currently, the EAW does not include a
complete discussion of the mitigation measures that Riverview could adopt to reduce Grace
Dairy’s GHG emissions. To make an informed decision regarding the potential for significant
environmental effects, MPCA must have information about whether there are ways that those
effects could be alleviated.
1. The EAW must include a full analysis of mitigation measures as part of an environmental review.
To fulfill the purpose of environmental review, MPCA must provide a robust discussion
of potential mitigation measures sufficient for meaningful public review. MEPA’s purpose
includes “understanding the impact which a proposed project will have on the environment,” and
making the information about impacts “available to governmental units and citizens early in the
59 MPCA, Effects of climate change in Minnesota, https://www.pca.state.mn.us/air/effects- climate-change-minnesota [hereinafter “Climate Change in Minn.”].
16
decision making process.”60 The Minnesota Supreme Court agreed with the U.S. Supreme Court’s
analysis in Robertson v. Methow Valley Citizens Council that a mitigation analysis in an EAW
“gives the public the assurance that the agency has indeed considered environmental concerns in
its decisionmaking process . . . and, perhaps more significantly, provides a springboard for public
comment.”61 Here, the public is entitled to information about mitigation measures Riverview could
implement to reduce Grace Dairy’s environmental effects early enough to allow meaningful
comments on how Riverview should modify or improve the feedlot. This information must also
be included for the benefit of other permitting agencies that rely on the EAW as the best available
information about a project’s environmental effects. By identifying practices Riverview can use to
avoid, minimize, or compensate for its GHG emissions in the EAW, governmental units that issue
permits and approvals can require improvements that make Grace Dairy a better, more resilient
operation.
Rules and guidance make clear that the mitigation discussion should include both the
practices Riverview plans to implement and those practices Riverview could implement. The
Minnesota Rules governing environmental review require that an EAW include a mitigation
discussion on measures the proposer plans to implement. Under Minn. R. 4410.1200, all EAWs
are required to discuss “resource protection measures that have been incorporated into the project
design”—in other words, mitigation measures planned as part of a project. This makes sense—the
agency cannot truly determine a project’s potential for significant environmental effects if the
EAW is silent on the degree that the effects may be mitigated. The animal feedlot Alternative
EAW Form implements this rule, requiring an EAW to describe “any proposed feedlot design
60 Minn. R. 4410.0300, subd. 3. 61 Minn. Ctr. for Envtl. Advocacy, 644 N.W.2d at 468 (quoting Robertson v. Methow Valley Citizens Council, 490 U.S. 332, 349 (1989).

17
features or air or odor emission mitigation measures to be implemented to avoid or minimize
potential adverse impacts and discuss their anticipated effectiveness.“62 This language makes clear
that the EAW must detail mitigation measures a facility plans to implement to reduce its emissions,
as well as the efficacy of those practices.
In addition, EQB guidance confirms the EAW must include a discussion of mitigation
practices that could be implemented. According to EQB guidance:
Information that reduces uncertainties about impacts and their significance belongs in an EAW. Any information that helps clarify the likelihood or level of significance of a potential impact is useful in an EAW because it helps the RGU make a better determination about the need for an EIS. It could be . . . information about how the impact could be mitigated and how that mitigation will be imposed.”63
Again, the animal feedlot Alternative EAW Form implements this guidance by requiring a
discussion, for all identified impacts, of “any alternatives or mitigative measures that have been or
may be considered.”64
The EQB Draft Recommendations make these requirements even more explicit, requiring
(for projects with more than 25,000 tons of emissions per year) quantifications and discussions of
“alternative mitigation measures considered to minimize or eliminate adverse effects from the
proposed project’s GHG emissions, and any mitigation measures considered to address the
cumulative potential effects of GHG emissions” and “selected mitigation method(s), including
quantification of the anticipated reductions; by GHG and by emissions source.”65 The guidance
lists a number of potential mitigation measures and explains that an EAW “should include
62 EAW at 18. 63 EQB, EAW Guidelines: Preparing Environmental Assessment Worksheets 5 (2013), https://www.eqb.state.mn.us/sites/default/files/documents/EAW%20guidelines%20revision.pdf. 64 EAW at 31 (emphasis added). 65 EQB Draft Recommendations, supra note 4, at 22.

18
complete descriptions of all mitigation activities considered for reducing the proposed project’s
GHG emissions. Quantification and a detailed assessment of the selected mitigation activity, as
well as justification for why that mitigation activity was selected, should also be included.”66
Clearly, a full mitigation analysis, both of mitigation methods considered and those selected, needs
to be included in the EAW to comply with MEPA and to fully analyze Grace Dairy’s potential for
significant environmental effects.
2. The EAW must analyze the feasibility and impacts of potential mitigation measures that could be implemented at Grace Dairy.
The EAW includes only a brief mitigation analysis, asserting that use of manure avoids
emissions associated with commercial fertilizer production, and that converting land from other
crops to alfalfa for cattle feed and increased use of cover crops can also decrease GHG emissions.67
This analysis is perfunctory and speculative, with no certainty that any of these methods will
actually offset emissions: farmers might not replace commercial fertilizer when they apply manure,
for example, and there are no express plans for Riverview or anyone else to convert row crops to
alfalfa or use additional cover crops. For a full mitigation analysis, MPCA should consider
measures including, for example, methods of improving energy efficiency, green construction
methods, and the addition of renewable energy sources.
First, Riverview could mitigate GHG emissions by improving energy efficiency. The more
energy efficient a farm is, the fewer GHGs emissions will be produced. This is extremely important
for dairy farms, which use more energy than almost any other agricultural operation.68 The milking
process can be made more efficient using a variable speed drive on the milking pump, which causes
66 Id. at 32. 67 EAW at 22. 68 Andy Pressman, Dairy farm energy efficiency (April 20, 2011), http://www.milkproduction.com/Library/Scientific-articles/Management/Dairy-farm-energy-efficiency/#:~:text=Summary, and%20storing %2C%20ventilation%20and%20lighting.
19
the motor to run at the lowest possible output needed to give adequate vacuum for the milking
system.69 This can reduce the energy used by the pump as much as 60%.70 The energy needed to
cool milk can be significantly reduced by installing a heat exchanger to cool milk before it enters
a tank and using more efficient variable speed pumps to pump milk through the plate cooler.71 In
addition, the heat absorbed in cooling the milk can be recovered through a heat exchange system,
which can then heat water to be used in milking.72 Other practices to increase efficiency include
installing LED lighting, choosing high-efficiency fans for ventilation, using an energy efficient
feed storage and delivery system, and selecting energy-free livestock watering systems.73
Second, Riverview could change its cattle feed—both the way it is grown and its contents.
Altering cattle feed rations can significantly reduce methane produced. Studies show that a
seaweed supplement, for example, can reduce methane by up to 80%.74 In addition, Riverview
should require using BMPs on the land used to grow cattle feed (e.g., no chemicals, cover cropping,
minimal or no tillage, elimination of synthetic fertilizers). Use of these practices has the potential
to sequester GHGs at a rate of approximately one to two tons of CO2-e per acre per year.75
69 Daniel Ciolkosz, Penn State Extension, How a Dairy Farmer Can Improve Energy Efficiency, https://extension.psu.edu/how-a-dairy-farmer-can-improve-energy-efficiency. 70 Id. 71 Farm Carbon Toolkit, Energy efficiency advice for dairy farmers, https://farmcarbontoolkit.org.uk/toolkit/energy-efficiency-advice-dairy-farmers. 72 Id. 73 Jonathan Susser, Energy Efficiency Opportunities in Agriculture (Sept. 14, 2018), https://www.advancedenergy.org/2018/09/14/energyefficiencyagriculture/. 74 Colette Kirk, Mitigating Methane Production in Dairy Farming, REDDANE FARMING (Dec. 5, 2019), https://reddanefarming.com/advice/mitigating-methane-production-in-dairy-farming/; see also Jennifer L. Satterfield, Altering Dairy Cattle Feed to Reduce Methane Production, in 2 Brian H. Lower et al., ENVIRONMENTAL SCIENCEBITES § 3.5 (2018), available at https://ohiostate.pressbooks.pub/sciencebitesvolume2/chapter/3-5-altering-dairy-cattle-feed-to-reduce-methane-production/. 75 Jack Kittredge, Soil Carbon Restoration: Can Biology do the Job? 8-9 (2015), available at https://www.nofamass.org/sites/default/files/2015_White_Paper_web.pdf.

20
Third, Riverview could reduce emissions during Grace Dairy’s construction. Riverview
could use materials with recycled content or with low-carbon or “green” concrete to construct
buildings. Notably, cement production, which is a key component of concrete, results in about 7%
of the world’s carbon dioxide emissions.76 Using green concrete can significantly reduce a
building’s emissions and has been endorsed by the U.S. Conference of Mayors as a tool in the fight
against climate change.77
Finally, Riverview could analyze the feasibility of onsite, renewable energy generation to
decrease the emissions from electricity use for Grace Dairy. The barns have long, open roofs that
are potential sites for installing solar panels, which can generate electricity to power Grace Dairy
without creating carbon dioxide or other heat-trapping gases that contribute to climate change.78
Overall, placing solar panels on the feedlot’s structures would reduce demand for fossil fuels,
which in turn would limit Grace Dairy’s total GHG emissions. The EAW could also study solar
hot water and geothermal energy production to determine feasibility.
These are just some of the potential mitigation measures that could be used at Grace Dairy.
Without an examination of these and similar mitigation measures, MPCA lacks the necessary
factual record needed to determine whether Grace Dairy has the potential for significant
environmental effects, or if mitigation measures could cancel out some of the effects. Accordingly,
MPCA also must revise the EAW to include an analysis of mitigation measures that could reduce
the effects of Grace Dairy’s GHG emissions.
76 Cailin Crow, How “green” concrete can help cities fight climate change, SMART CITIES DIVE (Aug. 15, 2019), https://www.smartcitiesdive.com/news/us-conference-of-mayors-urges-cities-to-use-green-concrete-material-carbon-/560977/. 77 Id. 78 Union of Concerned Scientists, Rooftop Solar Panels: Benefits, Costs, and Smart Policies (2015), https://www.ucsusa.org/resources/rooftop-solar-panels-benefits-costs-and-smart-policies.

21
D. MPCA Must Order An EIS Because Grace Dairy’s GHG Emissions Have The Potential To Cause Significant Environmental Effects.
Considering the scale of Grace Dairy and its GHG emissions—those acknowledged in the
EAW and those left out—Grace Dairy clearly has the potential for significant environmental
effects. MPCA asserted that it cannot determine specific effects from Grace Dairy’s emissions, but
by any legitimate measure, considering Grace Dairy’s size and the scope of its emissions, the
cumulative effects of GHG emissions in the state, and the failure of the animal agriculture sector
to meet GHG reduction goals, this Project has the potential to affect the environment in a
significant way. Accordingly, MPCA must order an EIS.
In other decisions on the need for an EIS based on GHG emissions, MPCA has pointed to
the Minnesota Rules requirement that an EIS must be ordered for stationary source facilities that
generate 100,000 tons of CO2-e emissions each year,79 and suggested that only CAFOs generating
that level of emissions require an EIS. While MCEA disagrees with that standard, it likely is met
here if MPCA performs a full inventory of Grace Dairy’s GHG emissions. The EAW shows that
Grace Dairy will produce 76,106 tons of CO2-e GHGs from only three categories: manure storage,
enteric fermentation, and manure land application.80 As even MPCA recognizes, this is not a
complete inventory of emissions.81 It may not even be half of Grace Dairy’s emissions, considering
that GHGs from just one category excluded from MPCA’s inventory—feed production and
processing—may account for up to 45% of Grace Dairy’s total emissions.82 If all the emissions
generated by Grace Dairy—from construction, land-use change, onsite fuel combustion, electricity
generation, farm vehicles and transportation, refrigeration and air conditioning, and feed
79 Minn. R. 4410.4300, subp. 15(B). 80 EAW at 22. 81 Id. 82 ICF Int’l, supra note 22.

22
production and processing—were counted, the number almost certainly would be over 100,000
tons. In that case, MPCA should unquestionably order an EIS.
But even considering only the incomplete 76,106 tons listed by MPCA, Grace Dairy clearly
still has the potential for significant environmental effects based on its size and the scale of its
emissions. Grace Dairy will be tied for the fourth largest CAFO in Minnesota—with its number
of animal units exceeded only by three other Riverview dairy farms.83 It will be about 45 times the
size of the average Minnesota dairy farm.84 And its GHG emissions reflect the scale of Grace
Dairy. Once it is operating, Grace Dairy will be tied for the 59th largest emitter of GHGs in the
state,85 with emissions equivalent to adding 16,442 passenger vehicles to the state’s roads.86 It will
produce more emissions than some power plants, including the Cannon Falls Energy Center, a 357
MW gas plant in Cannon Falls; the Blue Lake Power Plant, a 545 MW gas and oil plant in
Shakopee; and the Key City/Wilmarth Plant, a natural gas and refuse-derived fuel plant in
Mankato.87 It will emit more GHGs than the entire Mayo Medical Center in Rochester, and
approximately the same amount as two ethanol plants, (Bushmills Ethanol, Inc. in Atwater, Minn.
and Highwater Ethanol, LLC in Lamberton, Minn.).88 With this scale of emissions, it simply
cannot be true that there is no potential for the environment to be significantly affected by Grace
Dairy.
83MPCA & Minnesota Geospatial Commons, Feedlots in Minnesota, https://gisdata.mn.gov/dataset/env-feedlots. 84 Id. A calculation from this data shows that the average number of animal units of cows on a Minnesota farm is 229. This makes Riverview 45 times the size of the average dairy farm. 85EPA, 2018 Greenhouse Gas Emissions from Large Facilities, https://ghgdata.epa.gov/ghgp/main.do?site_preference=normal# [hereinafter, “Minnesota GHG Emitters”]. 86 EPA, Greenhouse Gas Equivalencies Calculator (March 2020), https://www.epa.gov/energy/greenhouse-gas-equivalencies-calculator. 87 Minnesota GHG Emitters, supra note 85; Wikipedia, List of Power Stations in Minnesota (Sept. 2020), https://en.wikipedia.org/wiki/List_of_power_stations_in_Minnesota. 88 Id.
23
This is particularly clear when looking at Grace Dairy’s emissions in relation to the state’s
NGEA goals, which call for a 30% reduction in emissions from 2005 levels by 2025.89 In 2005,
emissions from animal agriculture totaled 9.8 million tons.90 To meet the 2025 goal, emissions
from this sector would need to fall 30% to 6.8 million tons. As of 2018, however, emissions from
animal agriculture had actually increased by about 12%, to more than 11 million tons.91 Clearly,
steep reductions are needed in emissions from animal agriculture to reach the NGEA goal. But
Grace Dairy by itself actually increases emissions by nearly a whole percentage point above 2005
levels. Moreover, no measures are identified in the EAW that indicate Riverview intends to reduce
emissions from the project over time. Certainly, the addition of 76,106 tons of emissions per year
to this sector is significant. Over the next five years, when animal agriculture needs to reduce
emissions by 4.2 million tons to meet the state’s GHG reduction goals, this project will actually
add (even with MPCA’s drastic undercounting) 380,530 tons. MPCA fails to explain how this
increase in the face of an urgent need to decrease emissions does not have the potential for
significant environmental effects.
In sum, if Grace Dairy, as the fourth largest CAFO in the state, is not considered significant,
it is unlikely any dairy farm could ever reach that standard—despite the clear effects large farms
have on Minnesota’s environment. A project of this size, emitting so many GHGs, undoubtedly
has the potential to affect the environment by contributing to climate change, which means more
dangerously hot days, intense storms, flooding, and the loss of native plant, animal, and aquatic
species.92 So that the full effects of Grace Dairy on the environment can be determined, MPCA
89 Minn. Stat. § 216H.02. 90 MPCA, Greenhouse gas emissions data, https://www.pca.state.mn.us/air/greenhouse-gas-emissions-data. 91 Id. 92 Climate Change in Minn., supra note 59.

24
must order an EIS unless Riverview adopts sufficient mitigation measures to considerably reduce
its GHG emissions.
II. MPCA MUST SUPPLEMENT THE EAW OR ORDER AN EIS TO ANALYZE THE CUMULATIVE EFFECTS OF GRACE DAIRY’S MANURE ON WATER QUALITY
The EAW is also incomplete because, in violation of the Minnesota Rules, it fails to
analyze Grace Dairy’s cumulative potential effects on water quality from manure application.
Specifically, the EAW avoids any true analysis of the effect of applying manure from 10,500 dairy
cows in Chippewa County, a region that already has numerous feedlots and contaminated waters.
To comply with MEPA, MPCA cannot simply proclaim that Grace Dairy will have no cumulative
effects on water quality—it must take a hard look at the potential for significant environmental
effects. Thus far, it has not done so.
A. The EAW Shows Grace Dairy Will Add 86 Million Gallons Of Manure To A Watershed Already Containing Impaired Waters.
Riverview expects its 10,500 dairy cows to produce a truly extraordinary amount of
manure—86 million gallons annually,93 which is comparable to the amount of waste produced by
all of the people in Minneapolis and Bloomington combined. 94 Riverview will sell the manure to
farmers to use as fertilizer at 82 manure application sites in Swift, Chippewa, and Yellow Medicine
counties.95 Because Riverview will sell the manure, Riverview will not directly control manure
application.
93 EAW at 14. 94 See Ron Fleming & Marcy Ford, Human Versus Animals-Comparison of Waste Properties (2001), https://www.ridgetownc.com/research/documents/fleming_huvsanim0107.PDF (finding 20 dairy cows produce approximately the same waste as 1,000 humans); Minnesota State Demographic Center, Our Estimates, https://mn.gov/admin/demography/data-by-topic/population-data/our-estimates/ (listing the 2019 population of Minneapolis as 435,885 residents and Bloomington as 90,271 residents). 95 EAW at 7.
25
This 86 million gallons of manure will be added to an area where surface waters are already
contaminated with the kinds of pollutants contained in manure runoff. The manure application
sites are within the Chippewa and Minnesota River Watersheds,96 and these rivers and a number
of tributaries in their watershed are already impaired by a number of pollutants—including nitrates,
turbidity, fecal coliform, and E. Coli, all of which can be caused or worsened by manure runoff.97
As explained by MPCA in its assessment of the Chippewa River Watershed, many water bodies
in the watershed “struggle to attain water quality standards,” and additional efforts are needed to
make measureable improvements in water quality.98 Agricultural pollution is a particular problem
in the watershed: MPCA has concluded that agriculture is the source of most of the high
phosphorus, fecal coliform and E. Coli levels in the watershed, in large part because of application
of manure to fields.99 In addition, cultivated land in the Shakopee Creek and Dry Weather Creek
subwatersheds “is the source for the vast majority of the nitrogen load in the Chippewa River
Watershed.”100 As noted in the EAW, Shakopee Creek and Dry Weather Creek, which would be
near Grace Dairy’s manure application sites, already are impaired for aquatic life and recreation
because of poor fish bioassessments, turbidity, fecal coliform, and E.coli.101
B. The EAW Is Incomplete Without A Full Analysis Of The Cumulative Effects Of The Manure From All Feedlots In The Region.
96 Id. at 25. 97 Clean Lake Alliance, E. Coli and Beach Pathogens, https://www.cleanlakesalliance.org/e-coli/#:~:text=coli%20levels%20can%20occur%20for,our%20beaches%20via%20urban%20areas; Iowa State University, Soil erosion and water quality, https://crops.extension.iastate.edu/encyclopedia/soil-erosion-and-water-quality. 98 MPCA, Summary, Monitoring and Assessment, Chippewa River Watershed 1 (March 2015), https://www.pca.state.mn.us/sites/default/files/wq-ws3-07020005c.pdf. 99 MPCA, Summary, Chippewa River Watershed Restoration and Protection Strategies (WRAPS) Report Summary 3-4 (Aug. 2016). 100 Id. at 3. 101 EAW at 27.

26
Despite these facts, MPCA’s EAW fails to consider the cumulative effects of adding 86
million gallons of manure to fields in the Chippewa River watershed, particularly because other
feedlots already exist in the county. Minnesota Rules require that an agency consider “cumulative
potential effects” in determining whether a project has the potential for significant environmental
effects.102 This means the agency must analyze “the effect on the environment that results from
the incremental effects of a project in addition to other projects in the environmentally relevant
area that might reasonably be expected to affect the same environmental resources, including
future projects.”103 As the Rules note, even projects that are individually minor can create
significant cumulative effects over time.104 To comply with the Rules, the Alternative EAW Form
for Animal Feedlots calls for an analysis of “any cumulative impacts caused by the project in
combination with other existing, proposed, and reasonably foreseeable future projects that may
interact with the project . . . in such a way as to cause cumulative impacts.”105 Surface water quality
is explicitly listed in the form as an example of a cumulative effect.106
The EAW, however, contains only a superficial and incomplete cumulative effects analysis
regarding manure application in an already impaired watershed. The EAW asserts—in an entirely
conclusory manner—that Grace Dairy will not have any effects on surface waters because
Riverview will design the facility not to leach manure and the farmers applying the manure will
use best management practices (“BMPs”) and apply manure at agronomic rates.107 In fact, the
102 Minn. R. 4410.1700, subp. 1. 103 Minn. R. 4410.0200, subd. 11a. 104 Id. 105 EAW at 26. 106 Id. 107 Id. at 28.

27
EAW asserts, the acres where Riverview manure is spread will now have more oversight of its
fertilizer application than before.108
This is an entirely insufficient analysis. It does not examine the incremental effects Grace
Dairy will have on already-impaired surface waters in combination with the other feedlots in the
area. First, the analysis does not seriously consider that the region’s waters are already impaired,
and that runoff from the 86 million gallons of manure is almost certain to worsen the impairments
already present in the watershed, while adding other hazardous pollutants. Merely asserting that
there will be no effects from such a massive injection of manure into the county does not qualify
as a legitimate analysis. Manure runoff is well known to contaminate surface waters with nitrate,
phosphorus, ammonia, and fecal coliform bacteria (like E.coli), which can make water
undrinkable, harm fish, cause algal blooms, and destroy aquatic habitats.109 More than half of all
Minnesota’s surface waterbodies do not meet basic water quality standards, and non-point source
pollution, like manure runoff from feedlots and fields, is responsible for about 85% of water
pollution.110 Following BMPs can reduce nutrient and sediment runoff, but scientific studies do
not show BMPs eliminate water pollution.111 And in this case, Riverview is selling the manure,
108 Id. 109 Mary Berg & Miranda Meehan, North Dakota State University, Environmental Implications of Excess Fertilizer and Manure on Water Quality (Oct. 2017), https://www.ag.ndsu.edu/publications/environment-natural-resources/environmental-implications-of-excess-fertilizer-and-manure-on-water-quality#:~:text=Nutrients%20from%20manure%20and%20fertilizers,through%20runoff%20and%20soil%20erosion.&text=Runoff%20water%20from%20fields%20with,contaminating%20streams%2C%20wetlands%20and%20lakes. 110 Sarah Graddy, Environmental Working Group, EWG Investigation: Manure Overload Threatens Water in Minnesota’s Farm Country (May 28, 2020), https://www.ewg.org/release/ewg-investigation-manure-overload-threatens-water-minn-farm-country. 111 See Minn. Dept. of Agriculture, Manure Conservation Practices, https://www.mda.state.mn.us/protecting/cleanwaterfund/toolstechnology/runoffrisk/aboutrraf/manureconsprac (explaining that the environmental benefits of best management practices include “reducing nutrient and sediment runoff”).

28
not applying the manure itself. Therefore, Riverview cannot guarantee that farmers will follow
BMPs. In addition, while MPCA may hope that Riverview will in fact be a zero-discharge facility,
this hope cannot guarantee that no discharges will occur, whether by accident, through negligence,
or because of unplanned for extreme weather events. Presumably, every CAFO is permitted with
the intent that farmers will minimize runoff from the facility and fields through the use of BMPs.
But the increasing pollution of Minnesota’s rivers and lakes with pollutants from fertilizer, such
as nitrates, particularly in areas of the state with more CAFOs, shows that despite these permits,
these facilities continue to contaminate Minnesota’s waters.112 Yet, MPCA entirely fails to analyze
how Riverview’s massive manure production may incrementally affect the Chippewa River
watershed in the EAW.
Second, MPCA makes no attempt to examine how the combination of manure from all of
Chippewa County’s feedlots will cumulatively affect the already-impaired surface waters. The
EAW identifies that there are 136 feedlots with 37,456 animal units in the sub-watershed to the
north, and 15 feedlots with 5,347 animal units in the sub-watershed to the south.113 But it provides
no other information about other local feedlots—how much manure they produce, where farmers
apply that manure, whether there is overlap with the fields receiving Riverview manure, whether
farmers use BMPs, and whether manure from those feedlots contributes to the impairment of the
Chippewa River and Minnesota River watersheds. Because most manure cannot be transported
very far cost effectively,114 the manure from all of these feedlots is likely to be applied nearby. For
112 Sarah Porter, Environmental Working Group, Tap Water for 500,000 Minnesotans Contaminated with Elevated Levels of Nitrate (Jan. 14, 2020), https://www.ewg.org/interactive-maps/2020_nitrate_in_ minnesota_drinking_water_from_groundwater_sources/. 113 EAW at 26. 114 Daniel Anderson, Iowa State University Extension and Outreach, The Manure Scoop (Dec. 4, 2014), http://themanurescoop.blogspot.com/2014/12/how-far-can-i-afford-to-haul-my-manure.html.

29
a proper cumulative effects analysis, MPCA must examine “other projects in the environmentally
relevant area that might reasonably be expected to affect the same environmental resources,”115
and here that means other feedlots and how adding 86 million gallons of manure will impact a
county where, presumably, farmers already apply a large amount of manure to fields. But MPCA
failed to analyze any other feedlots in the EAW.
In sum, MPCA’s cumulative effects analysis is not an analysis—it consists of wishful
thinking regarding the incremental effects Grace Dairy’s manure will have on water quality, along
with willful blindness regarding the effects of the region’s feedlots in the aggregate. MPCA’s
analysis wholly fails to meet the standard in the Minnesota Rules, which require MPCA to
thoughtfully and thoroughly analyze the effects of manure from all the feedlots in the region will
have on the already impaired waters of the Chippewa and Minnesota River watersheds when
combined with 86 million gallons of additional manure. Because of this failure, the EAW is
inadequate, and to comply with the Minnesota Rules MPCA must either supplement the EAW to
add the missing information or order an EIS.116
CONCLUSION
Riverview’s proposed Grace Dairy is not simply another dairy farm. It is a giant CAFO
that has the potential to radically affect the air, water, and earth around it. Yet its EAW fails to
fully study those potential effects. To comply with Minnesota law, the EAW must be revised in
two ways: (1) to fully analyze the GHG emissions expected from Grace Dairy, their effects on
climate change, and potential mitigation measure that could be used to reduce those effects; and
(2) to perform a cumulative potential effects analysis of adding Grace Dairy’s manure to an already
impaired watershed. Because of all the information missing from the EAW, MPCA currently
115 Minn. R. 4410.0200, subd. 11a. 116 Minn. R. 4410.1700, subd. 2a.

30
cannot make an informed decision regarding Grace Dairy’s potential for significant environmental
effects. Accordingly, MCEA asks that MPCA order an EIS, or at a minimum, require the
supplementation of the EAW, so that the full effects of one of Minnesota’s largest CAFOs can be
fully studied.
Respectfully submitted, s/Joy R. Anderson Joy R. Anderson Senior Staff Attorney Minnesota Center for Environmental Advocacy [email protected]

ENVIRONMENTAL QUALITY BOARD
EQB-member Environmental Review Interagency Climate Technical Team
DECEMBER 2020
DRAFT Recommendations: Integrating Climate Information into MEPA Program Requirements DRAFT Recommendations for changes to Minnesota’s Environmental Review Program requirements to include information related to climate change.
Ex. 1 to MCEA Comments-Grace Dairy, Chippewa County

Authors Environmental Quality Board (EQB) Denise Wilson, Katie Pratt, Katrina Hapka, Kristin Mroz-Risse,
Erik Cedarleaf Dahl Agriculture (MDA) Steve Roos Commerce (COMM) Louise Miltich Health (MDH) David Bell Natural Resources (DNR) Kate Fairman, Cynthia Novak-Krebs and Jill Townley Pollution Control Agency (PCA) Melissa Kuskie, Peter Ciborowski, and Laura Millberg Transportation (DOT) Deb Moynihan, Peter Wasko, Jeff Meeks, and Katherine Lind Metropolitan Council (Met. Council) Eric Wojchik
Ex. 1 to MCEA Comments-Grace Dairy, Chippewa County

i
Contents
Introduction ....................................................................................................... 1 Minnesota’s Environmental Review Program ........................................................................................................ 1
Project purpose and guiding principles .................................................................................................................. 2
ER Climate Technical Team, EQB Members and ER Program Participant Roles ..................................................... 3
Table of DRAFT recommendations ......................................................................................................................... 4
Proposed Engagement Plan ............................................................................... 5 Purpose of engagement for this project................................................................................................................. 5
Proposed engagement framework ......................................................................................................................... 5
ER Program Participants and Relevant Questions .................................................................................................. 6
Proposed engagement timeline ............................................................................................................................. 7
(Depending on the volume of responses, the timeline may be extended) ............................................................ 7
Draft Recommendations
Approved strategies, DRAFT recommendations, and justifications ................................... 8 1. Identification of climate change information and assessment requirements ............................................. 8
ERIS approved strategies: identification of climate change information and assessment requirements ....... 8
Recommendations: GHG quantification and assessment requirements ........................................................ 9
2. Decision criteria for assessing potential climate effects ............................................................................ 10
ERIS approved strategies: decision criteria for assessing potential climate effects ...................................... 10
Recommendation: Decision criteria for assessing potential climate effects ................................................ 10
Existing decision criteria: MR 4410.1700 decision on need for EIS ............................................................... 11
Decision criteria: 1982 SONAR ...................................................................................................................... 11
3. Mandatory review ...................................................................................................................................... 11
ERIS approved strategies for assessing when review is mandatory .............................................................. 11
Recommendations: Mandatory review ......................................................................................................... 11
Proposed new mandatory EIS category ........................................................................................................ 13
Appendices
Appendix A ....................................................................................................... 14 Environmental Assessment Worksheet ................................................................................................................ 14
Appendix B1 ..................................................................................................... 24 Guidance: Developing a carbon footprint ............................................................................................................ 24
What is a carbon footprint? ................................................................................................................................. 25
How to report GHG emissions .............................................................................................................................. 27
How to quantify GHGs emitted ............................................................................................................................ 30
Ex. 1 to MCEA Comments-Grace Dairy, Chippewa County

Integrating Climate Information Into • December 2020 Environmental Quality Board MEPA Program Requirements
ii
How to identify and assess alternative mitigation ............................................................................................... 32
How to identify and quantify renewable energy credits purchased .................................................................... 33
How to identify contributions from other GHG emission sources ....................................................................... 33
Attachment 1. Emissions factors and simplified calculative equations by source ............... 34 Attachment 2. Models for sources not amenable to simplified calculation using emission factors ............................................................................................................... 44
Attachment 3. Default fuel heat content and stationary source emission factors .............. 45
Attachment 4. Protocols and methods for calculating GHG emissions ............................ 47
Appendix B2 ..................................................................................................... 48 Guidance: Climate adaptation and resilience ...................................................................................... 48
Appendix C. Mandatory category effectiveness for requiring review of project types with GHG emissions ................................................................................ 61
Appendix D: Glossary of terms ......................................................................... 71
Ex. 1 to MCEA Comments-Grace Dairy, Chippewa County

Integrating Climate Information Into • December 2020 Environmental Quality Board MEPA Program Requirements
1
Introduction
Minnesota’s Environmental Review Program The Minnesota Environmental Policy Act (MEPA) of 1973 established the Environmental Quality Board (EQB or Board). Minnesota Statutes, section 116C.04 gives the Board the responsibility to function as the coordinating body for Minnesota’s Environmental Review (ER) Program.
The Board is granted authority to promulgate rules relating to the ER Program under Minn. Stat. § 116D.04 subd. 5 (a) and Minn. Stat. § 116D.045; and used those authorities to create Minnesota Rules chapter (MR) 4410. These ER Program rules implement the formal process for investigating public and private projects that have the potential to significantly affect the environment. Projects required to undergo review must complete these regulatory requirements, before any governmental units make decisions to issue permits or approvals.
The ER Program is designed to provide usable information to the project proposer, governmental decision makers and the public concerning the primary environmental effects of a proposed project (MR 4410.0300, subp. 4). ER Program rules identify the types of projects that require mandatory review (MR 4410.4300 and MR 4410.4400); the content requirements for the types of review (MR 4410.1200 and MR 4410.2300, and the criteria used for making the decision on the need for an Environmental Assessment Worksheet (EAW) and the need for an Environmental Impact Statement (EIS) (MR4410.1700).
Board authorities for implementing ER Program change Board authorities to make changes to the ER program requirements include (Table 1) commencing formal rulemaking procedures, changing the content requirements on the EAW Form, and developing guidance that provides assistance with interpreting and implementing ER Program requirements.
Table 1: Board Authorities for Implementing Change
Rulemaking EAW forms Guidance MS 116D.04, subd. 2a(a) and 5a;
116.045 MS 116D.04, subd. 14 and MR 4410.1300 Board and staff
directed Used to create regulations for Environmental Review Program requirements and procedures
Standard EAW Form that includes required information for all project types.
Custom form for a specific category of projects to focus on applicable issues related to that project type.
Written explanations of a rule or a requirement. Guidance is neither enforceable nor intended to replace rules.
Example: 2019 Rulemaking: https://www.eqb.state.mn.us/content/eqb-mandatory-categories-rulemaking
Example: Standard EAW form used for EAWs and scoping an EIS: https://www.eqb.state.mn.us/sites/default/files/documents/Finalized%20EAW%20Form%20July2013.pdf
Example: EAW form for Animal Feedlots: https://www.eqb.state.mn.us/sites/default/files/documents/alt_eaw_form_0.pdf
Example: 2010 Guide to the ER Rules https://www.eqb.state.mn.us/sites/default/files/documents/Guide%20to%20MN%20ER%20Rules-May%202010.pdf
Ex. 1 to MCEA Comments-Grace Dairy, Chippewa County
Integrating Climate Information Into • December 2020 Environmental Quality Board MEPA Program Requirements
2
Project purpose and guiding principles As directed by EQB’s 2020-2021 Workplan, and in response to Executive Order 19-37on climate change, the Environmental Review Implementation Subcommittee (ERIS) of the EQB convened an Interagency ER Climate Technical Team to advise them on changes to the ER Program for assessing potential climate effects. Climate change is an important environmental impact currently not consistently considered in environmental documents. Quantifying a proposed project's Greenhouse Gas (GHG) emissions and identifying important interactions between changing climate and environmental impacts can help decision makers identify opportunities to:
Reduce GHG emissions Improve environmental outcomes Make more informed decisions about climate adaptations
Making decisions on the potential for significant climate effects from an individual proposed project is challenging. An assessment of climate impacts is more complex than an assessment of other environmental effects, given the global nature of GHG emissions as well as the complicated interrelationships among emissions sources and impacts. In addition, Minnesota regulators have limited direct oversight of GHG emissions.
In 2017-2018, EQB convened an Environmental Review Advisory Panel (ERAP) to examine opportunities for ER Program improvement. In their 2018 recommendations to the Board, they identified the need for developing a consistent approach for assessing potential climate impacts, but were unable to find consensus among the diverse stakeholders on recommendations for specific ER Program changes related to climate change. Instead, ERAP members offered the following:
To support Responsible Governmental Units (RGU) in the quantification of their GHG emissions in tons of carbon dioxide equivalent for all mandatory categories, the EQB should develop and disseminate guidance and tools, including a consistent and simple calculation method.
All EAWs should provide a narrative discussion of the project's climate adaptation and emission mitigation opportunities.
Additional stakeholder engagement should take place before any recommendations are implemented.
The ER Climate Technical Team considered these directives in developing the framework used to ensure robust consideration of all elements of the ER Program. In addition to a proposed engagement plan (page 6 of this report), the draft recommendations in this Report include ER Program changes for:
Climate change information and assessment requirements Decision-making requirements Mandatory review requirements
In addition, the ER Climate Technical Team considered the following guiding principles as they developed their DRAFT recommendations:
The level of effort should be proportional to the proposed project's potential level of impact to/from climate change.
Government agencies, members of the public and project proposers have access to trusted sources of climate change-related data and information.
Environmental documents should include appropriate analyses for: Greenhouse gas (GHG) emissions quantification. A discussion of mitigation and adaptation. The required information supports technically and legally defensible decisions.
Ex. 1 to MCEA Comments-Grace Dairy, Chippewa County

Integrating Climate Information Into • December 2020 Environmental Quality Board MEPA Program Requirements
3
Roles: ER Climate Technical Team, EQB Members and ER Program Participants ER Climate Technical Team: The ER Climate Technical Team collaborated on the development of the DRAFT recommendations found in this Report. Before presenting final recommendations, Team members are requesting input from all Minnesotans. During the engagement process for this project, the ER Climate Technical Team will:
Attend listening sessions and attend ERIS and Board meetings to receive feedback on draft recommendations
Consider all input received Respond to questions about the recommendations Revise recommendations based on input Present final recommendations for ER Program changes Assist with implementation of approved ER Program changes
EQB staff (Denise Wilson, Katie Pratt, Katrina Hapka, Kristin Mroz-Risse, and Erik Cedarleaf Dahl): Develop a detailed workplan for implementing the Engagement Plan Coordinate and implement
all engagement activities Attend meetings hosted by ER Program Participants, when requested, to present draft
recommendations and respond to questions Compile, summarize and make publically available all of the input received Present final recommendation along with input received during the engagement process to ERIS
and Board members ERIS and Board members (https://www.eqb.state.mn.us/): The Board established a subcommittee (ERIS) of their membership for the purpose of providing a forum for transparent deliberation and public input on important issues related to the ER Program; as well as considering recommendations for improving the ER Program requirements. ERIS and Board members will:
Attend listening sessions as schedules allow Consider feedback from the engagement process and consider input received at ERIS and Board
meetings during their deliberations ERIS members will consider draft recommendations and bring to EQB members EQB members will make all final approval decisions Provide resources necessary for implementing Engagement Plan and ER Program changes
ER Program Participants: The ER Program broadly serves Minnesotans by providing information about the potential environmental effects of projects. People who participate directly in the program include, but are not limited to, project proposers, Responsible Governmental Units, consultants and technical experts, government decision makers, tribal governments and staff, advocacy groups, environmental justice experts, and interested members of the public. An effective engagement process allows ER Program participants to influence decisions that affect their lives. ER Program Participants are asked to:
Participate in scheduled meetings Provide written comments during the public comment period Identify potential barriers and opportunities for draft recommendations Submit proposed changes to the draft recommendations along with any helpful information to
support those changes
Ex. 1 to MCEA Comments-Grace Dairy, Chippewa County
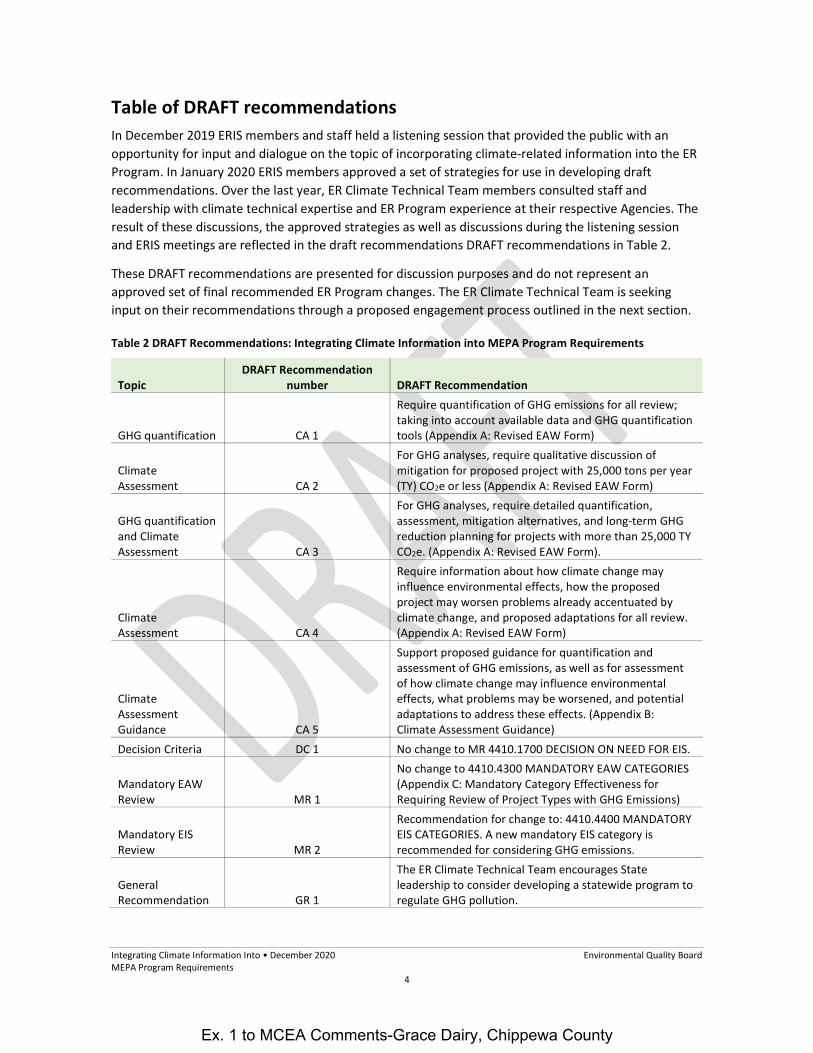
Integrating Climate Information Into • December 2020 Environmental Quality Board MEPA Program Requirements
4
Table of DRAFT recommendations In December 2019 ERIS members and staff held a listening session that provided the public with an opportunity for input and dialogue on the topic of incorporating climate-related information into the ER Program. In January 2020 ERIS members approved a set of strategies for use in developing draft recommendations. Over the last year, ER Climate Technical Team members consulted staff and leadership with climate technical expertise and ER Program experience at their respective Agencies. The result of these discussions, the approved strategies as well as discussions during the listening session and ERIS meetings are reflected in the draft recommendations DRAFT recommendations in Table 2.
These DRAFT recommendations are presented for discussion purposes and do not represent an approved set of final recommended ER Program changes. The ER Climate Technical Team is seeking input on their recommendations through a proposed engagement process outlined in the next section.
Table 2 DRAFT Recommendations: Integrating Climate Information into MEPA Program Requirements
Topic DRAFT Recommendation
number DRAFT Recommendation
GHG quantification CA 1
Require quantification of GHG emissions for all review; taking into account available data and GHG quantification tools (Appendix A: Revised EAW Form)
Climate Assessment CA 2
For GHG analyses, require qualitative discussion of mitigation for proposed project with 25,000 tons per year (TY) CO2e or less (Appendix A: Revised EAW Form)
GHG quantification and Climate Assessment CA 3
For GHG analyses, require detailed quantification, assessment, mitigation alternatives, and long-term GHG reduction planning for projects with more than 25,000 TY CO2e. (Appendix A: Revised EAW Form).
Climate Assessment CA 4
Require information about how climate change may influence environmental effects, how the proposed project may worsen problems already accentuated by climate change, and proposed adaptations for all review. (Appendix A: Revised EAW Form)
Climate Assessment Guidance CA 5
Support proposed guidance for quantification and assessment of GHG emissions, as well as for assessment of how climate change may influence environmental effects, what problems may be worsened, and potential adaptations to address these effects. (Appendix B: Climate Assessment Guidance)
Decision Criteria DC 1 No change to MR 4410.1700 DECISION ON NEED FOR EIS.
Mandatory EAW Review MR 1
No change to 4410.4300 MANDATORY EAW CATEGORIES (Appendix C: Mandatory Category Effectiveness for Requiring Review of Project Types with GHG Emissions)
Mandatory EIS Review MR 2
Recommendation for change to: 4410.4400 MANDATORY EIS CATEGORIES. A new mandatory EIS category is recommended for considering GHG emissions.
General Recommendation GR 1
The ER Climate Technical Team encourages State leadership to consider developing a statewide program to regulate GHG pollution.
Ex. 1 to MCEA Comments-Grace Dairy, Chippewa County

Integrating Climate Information Into • December 2020 Environmental Quality Board MEPA Program Requirements
5
Proposed Engagement Plan
Purpose of engagement for this project The recommendations in this Report will begin discussions about what ER Program changes are needed to ensure effective consideration of potential climate effects. The ER Climate Technical Team will engage and work collaboratively with other ER Program Participants during the engagement process to bring forward meaningful and feasible ER Program changes related to climate change.
There have been many efforts over the past ~30-years to identify needed improvements to the ER Program that included stakeholder participation. However, because of the complexity of environmental issues and perspectives on the ER Program purpose and process, there have been few significant changes since the ER Program revisions in 1982. (Previous state studies and reports with recommendations for ER Program improvement can be found on the EQB web page using this link: https://www.eqb.state.mn.us/content/eris-reports#overlay-context=). While there is broad consensus on the need for change, there are opposing visions of what changes are necessary.
Lessons from past initiatives informed the development of this engagement process. Effective engagement will be accomplished through a targeted series of opportunities with multiple avenues for participation and direct access to decision-makers. This Proposed Engagement Framework will make all input publically available in order for all ER Program Participants to consider perspectives from each other. Meaningful engagement happens when all participants have the chance to feel heard and understand the basis for decisions, even if they would prefer a different outcome. This Proposed Engagement Plan is designed to:
Provide a transparent process that continuously makes information about the project readily available
Provide opportunities for all who are interested to submit information to the ER Climate Technical Team about potential impacts of the draft recommendations
Consult with other ER Program Participants, before ERIS members and Board members make decisions on the recommendations for ER Program changes
Provide opportunities for ER Program participants to hear from one another and gain an understanding of diverse concerns and needs
Provide time for direct access to ERIS members and Board members during scheduled meetings
Proposed engagement framework The proposed engagement framework below outlines key engagement activities to be carried out in roughly the first quarter of 2021. Because engagement is a learning process, the schedule of activities may shift based on what staff learn and hear from participants. In light of the COVID-19 pandemic, all activities will take place virtually. Engagement activities will be announced on the EQB website, in the EQB Monitor, and on EQB social media accounts. EQB staff will:
Select a representative sample of ER Program Participants and conduct one-on-one interviews to get feedback on proposed recommendations
Select a representative sample of ER Program Participants and send an electronic survey to get feedback on proposed recommendations
Provide opportunities for submitting input through a 30-day public comment period Target invitations and provide a notice in the EQB Monitor to at least one listening sessions open to
everyone
Ex. 1 to MCEA Comments-Grace Dairy, Chippewa County

Integrating Climate Information Into • December 2020 Environmental Quality Board MEPA Program Requirements
6
Input received during the engagement process will be compiled, summarized and posted on the EQB web page (https://www.eqb.state.mn.us/). The ER Climate Technical Team will review and consider all input received when drafting final recommendations. Comment summaries will also be provided to ERIS and Board members to consider before final ER Program change recommendations are considered.
Targeted Groups and Relevant Questions
Participants Questions All Minnesotans with an interest in participating
1. Do you support the draft recommendations? 2. Do the proposed revisions to the draft EAW form provide usable
climate information? 3. What additional climate informational would you like to see included
on the draft, revised EAW Form? 4. How will you use that information?
Project Proposers 1. What are the potential challenges and opportunities for providing the climate information described in the draft, revised EAW form?
2. What additional resources are needed to support providing the requested climate information included on the draft, revised EAW form?
Responsible Governmental Unit (RGU)
1. What are the potential challenges and opportunities for providing the climate information in described in the draft, revised EAW form?
2. What additional ER Program changes are necessary for effective climate assessment?
3. Are there additional resources are needed to support this work? 4. Are there other project types not currently included in the
mandatory EAW and EIS categories that may have/have the potential for significant climate effects?
Consultants and Technical Experts
1. What are the potential challenges and opportunities for providing the climate information in described in the draft, revised EAW form?
2. What additional ER Program changes are necessary for effective climate assessment?
3. Are there additional resources needed to support this work? 4. Are there other project types not currently included in the
mandatory EAW and EIS categories that may have/have the potential for significant climate effects?
Government Decision-makers
1. What additional information about potential climate effects from a proposed project is needed to inform your approval decisions?
Tribal Environmental experts
1. What additional information about potential climate effects from a proposed project is needed for Tribal communities?
Environmental Justice experts
1. What additional information about potential climate effects from a proposed project should be included for environmental justice communities?
Ex. 1 to MCEA Comments-Grace Dairy, Chippewa County

Integrating Climate Information Into • December 2020 Environmental Quality Board MEPA Program Requirements
7
Proposed engagement timeline (Depending on the volume of responses, the timeline may be extended)
Dec. 2020 Jan. 2021 Feb. 2021 March 2021
ERIS input on:
Draft Recommendations
Proposed Engagement Plan
Develop engagement implementation workplan
Schedule events Develop survey
Schedule and conduct interviews Attend meetings Send out survey
Public comment period begins
Public comment period ends Host listening session(s) Send out survey Compile survey
responses Schedule and conduct
interviews
April 2021 May 2021 June 2021 July 2021
Compile and summarize input Post input on the EQB web page
Revise recommendations based on input received
Present final recommendations and summary of input to ERIS
Present final recommendations and summary of input to Board
Ex. 1 to MCEA Comments-Grace Dairy, Chippewa County

Integrating Climate Information Into • December 2020 Environmental Quality Board MEPA Program Requirements
8
Approved strategies, DRAFT recommendations, and justifications During their January 2020 meeting, ERIS members approved strategies that guided the development of the recommendations included in this report. The approved strategies, along with ER Climate Technical Team DRAFT recommendations and justifications are included in this section of the report.
1. Identification of climate change information and assessment requirements
ERIS approved strategies: identification of climate change information and assessment requirements Include an inventory of project GHG emission sources and define when it is appropriate to include this
information.
A. Require a GHG emissions quantification and define when it is appropriate to include this information
B. Define the timeframe for calculating GHG emissions (e.g. annual emissions, lifetime emissions).
C. Define the scope of GHG emissions to include (e.g. direct, indirect emissions, life cycle)
D. Require a discussion and quantification of GHG emissions reductions from any proposed mitigation, and define when it is appropriate to include this information
E. Create a de Minimis GHG emission threshold, below which no GHG emissions quantification would be required
F. Require a discussion of how climate change impacts to a proposed project may create environmental impacts
G. Require a discussion of how the proposed project may worsen problems already accentuated by climate change (e.g. with the addition of impervious surface)
H. Require a discussion of how the proposed project will be modified to address the above considerations
Ex. 1 to MCEA Comments-Grace Dairy, Chippewa County

Integrating Climate Information Into • December 2020 Environmental Quality Board MEPA Program Requirements
9
Recommendations: GHG quantification and assessment requirements CA 1: Require quantification of GHG emissions for all review, taking into account available data and GHG
quantification tools (Appendix A: Revised EAW Form) CA 2: For GHG analyses, require qualitative discussion of mitigation for proposed project with 25,000
tons per year (TY) CO2e or less (Appendix A: Revised EAW Form) CA 3: For GHG analyses, require detailed quantification, assessment, mitigation alternatives, and long-
term GHG reduction planning for projects with more than 25,000 TY CO2e (Appendix A: Revised EAW Form)
CA 4: Require information about how climate change may influence environmental effects, how the proposed project may worsen problems already accentuated by climate change, and proposed adaptations for all review. (Appendix A: Revised EAW Form)
CA 5: Support the proposed guidance for quantification and assessment of GHG emissions, as well as for assessment of how climate change may influence environmental effects, what problems may be worsened, and potential adaptations to address those effects. (Appendix B1 and B2: Climate Assessment Guidance)
Justification Understanding GHG emissions and sources, as well as identifying ways for mitigating, or reducing, those emissions is important information for making project design and approval decisions. All elements of the approved strategies, except strategy E, are incorporated into the requirements on the revised, draft EAW Form (Appendix A). For strategy E, rather than creating a de Minimis GHG emission threshold, below which no quantification is required, the ER Climate Technical Team reached consensus that all proposed projects will benefit from quantification of potential GHG emissions.
A threshold of 25,000 carbon dioxide equivalent (CO2e) TY was selected as a de Minimis level for the types of information required. All proposed projects are required to provide their GHG emissions, identify sources of those emissions, and provide a discussion of about mitigation planning. This threshold aligns with state statutory reporting requirements for GHG emissions. Minnesota Statute 216H.021 subd. 2 requires reporting of CO2e emissions that exceed a threshold between 10,000 TY and 25,000 TY. Assessment of GHG emissions at 25,000 TY CO2e aligns with the federal mandatory GHG reporting threshold.
Proposed projects with annual average GHG emissions at or below 25,000 TY CO2e, are required to provide a qualitative description of any planned mitigation to reduce those emissions. Projects that exceed this threshold are also required to discuss:
Average annual GHG emissions from operations of the existing facility Alternative mitigation measures considered Selected mitigation method(s) Any offsets from renewable energy credits The net lifetime GHG emissions from the proposed project How those projected emissions may affect achievement of the Minnesota Next Generation
Energy Act goals and/or other more stringent state or local GHG reduction goals
Ex. 1 to MCEA Comments-Grace Dairy, Chippewa County

Integrating Climate Information Into • December 2020 Environmental Quality Board MEPA Program Requirements
10
2. Decision criteria for assessing potential climate effects
ERIS approved strategies: decision criteria for assessing potential climate effects A. Create guidance for applying existing criteria to assessing the potential for significant
climate change effects
B. Create guidance for how mitigation practices may be considered for assessing the potential for significant climate change effects
C. Define the scale for assessing the potential for significant climate change effects (e.g. local, national or global)
D. Create alternative or additional criteria that could be used for assessing the potential for significant climate change effect.
Recommendation: Decision criteria for assessing potential climate effects DC1: No change to MR 4410.1700 DECISION ON NEED FOR EIS.
Justification Most GHG emissions are not reversible; and all GHG emissions contribute to cumulative climate change impacts on a global scale. GHGs are regulated as mobile source pollutants under the Clean Air Act and, in addition, new electric power sources are regulated under the Obama New Source Performance Standard for power generation.
The unique nature of GHG emissions were not considered when existing decision criteria were developed for potential environmental effects. An RGU may use their experience and expertise to consider the potential significance of a project’s climate effects in their decision-making. Rather than creating new decisions criteria for potential climate effects at this time, the ER Climate Technical Team supports RGU discretion on a case-by-case basis, until a more robust regulatory framework is promulgated for GHG pollution across all relevant GHG emissions sources.
Until a regulatory program for climate effects is developed to support the decision on the potential significance, an RGU should consider climate information in a similar manner to other types of potential effects that are minimally regulated. Issues like effects to human health, noise impacts, impacts to wildlife habitat, and impacts to cultural resources are not consistently considered in permit decisions but are frequently considered in Environmental Review. When making the decision on the need for an EAW or the need for an EIS related to climate effects, an RGU should consider the following, in addition to relevant existing decision criteria in rule:
The reductions in GHG emissions from proposed mitigation(s) Whether a GHG reduction or offset plan has been developed to demonstrate alignment with
Next Generation Energy Act reduction goals and/or other GHG reduction goals over the life of the project, either on a project- or emissions sector-level
The need for additional information not otherwise available This approach aligns with the purpose of the following existing decision criteria found in rule and the supporting information provided in the Statement of Need and Reasonableness (SONAR) used as justification when those criteria were approved.
Ex. 1 to MCEA Comments-Grace Dairy, Chippewa County

Integrating Climate Information Into • December 2020 Environmental Quality Board MEPA Program Requirements
11
Existing decision criteria: MR 4410.1700 decision on need for EIS A. Type, extent, and reversibility of environmental effects; B. Cumulative potential effects. The RGU shall consider the following factors: whether the cumulative
potential effect is significant; whether the contribution from the project is significant when viewed in connection with other contributions to the cumulative potential effect; the degree to which the project complies with approved mitigation measures specifically designed to address the cumulative potential effect; and the efforts of the proposer to minimize the contributions from the project;
C. The extent to which the environmental effects are subject to mitigation by ongoing public regulatory authority. The RGU may rely only on mitigation measures that are specific and that can be reasonably expected to effectively mitigate the identified environmental impacts of the project; and
D. The extent to which environmental effects can be anticipated and controlled as a result of other available environmental studies undertaken by public agencies or the project proposer, including other EISs.
Decision criteria: 1982 SONAR A. Subparagraph one requires an RGU to consider specific types of environmental effects likely to result
from a proposed activity. This consideration should be by impact type and intensity, as well as the ability to mitigate that type of effect and the ability of the ecosystem to rehabilitate itself.
B. In addition to the environmental impacts expected to result directly from a proposed activity in subparagraph two, the RGU is required to make an assessment of how it relates to other activities. Certain types of environmental impacts may be properly assessed only when viewed in conjunction with the impacts of other proximate or related activities.
C. Subparagraph three takes into consideration additional regulatory activities by other governmental units. Mitigation measures ordered pursuant to other methods of regulation should be considered when determining the potential significance of environmental effects.
D. Subparagraph four relates back to the original purpose of environmental review. The purpose of environmental review is to provide adequate environmental information so the RGU can make informed decisions on ·the approval of proposed activities. If the information has already been gathered in some other form such that the information is available to the RGU without the preparation of an EIS there is no need to compile the information into an additional EIS form.
3. Mandatory review
ERIS approved strategies for assessing when review is mandatory A. Review existing mandatory EAW and EIS categories to identify if all emission sources that are
included in the Minnesota Pollution Control Agency greenhouse gas emissions inventory reporting are also included in existing mandatory categories
B. Evaluate existing EAW and EIS mandatory categories to determine if they should be modified or unchanged
C. Evaluate existing EAW and EIS mandatory categories to determine if new categories of project types and thresholds for review are needed
Recommendations: Mandatory review MR1: No change to 4410.4300 MANDATORY EAW CATEGORIES (Assessment included in Appendix C) MR2: Recommend change to: 4410.4400 MANDATORY EIS CATEGORIES. A new mandatory EIS category
recommended for addressing GHG emissions
Ex. 1 to MCEA Comments-Grace Dairy, Chippewa County

Integrating Climate Information Into • December 2020 Environmental Quality Board MEPA Program Requirements
12
Justification In 1974, ER Program rules required a public agency to prepare an EAW or EIS when a major action may have the potential for significant environmental effects. The ER Program changed in 1982 to include 11 mandatory category areas that established greater predictability to the process. The category areas were selected based on types of projects most likely subjected to environmental review or were the most controversial. The process of developing mandatory category thresholds was extremely controversial. Thresholds were developed through an extensive public comment process in which interested parties provided arguments relating to the potential importance of the impacts of these types of activities and the potential fiscal impact in reviewing these categories, four major questions were considered:
1. Is there a need for a mandatory category relating to that type of project or that impact?
2. What is the proper qualitative measure of that type of project or that impact (for example., should size of industrial facilities be measured in sq. ft. of ground area or occupied sq. ft. of floor space, cost of the facility, type of end product, type. of waste products, number of employees, etc.)?
3. What is the proper quantitative measure of that type of project or that impact, i.e. how many units of whatever was selected as the basis of measurement in 2 above?
4. Is the threshold administratively manageable?
Over time, new mandatory categories were added, and existing mandatory categories have been updated. Currently, MR 4410.4300 (EAW) and 4400 (EIS) identify 36 mandatory EAW categories and 27 mandatory EIS categories; representing 29 different project types. In 2010, MR 4410 were amended to adopt a mandatory EAW threshold for GHG emissions for stationary sources. The change was in response the U.S. Environmental Protection Agency’s (EPA) “tailoring rule” that set 100,000 TY (tons per year) GHG emissions threshold for Prevention of Significant Deterioration permitting under the Clean Air Act. The U.S. Supreme Court subsequently vacated the tailoring rule, but the mandatory EAW category adopted in state rule remains in effect.
Under current permitting requirements, if a proposed project trips the Best Available Control Technology requirement at the 75,000 TY CO2e ton threshold, and emits other criteria pollutants at rates greater than 250 TY, it inherits regulatory obligations as a stationary source. In Minnesota, 12 facilities have annual stationary combustion emissions greater than 75,000 TY but less than 100,000 TY CO2e. All of these facilities, if proposed as "new projects" would require a mandatory EAW, whether or not the air pollution mandatory category were lowered from 100,000 TY to 75,000 tons CO2e, because they also have criteria emissions that exceed existing air pollution thresholds.
Even if considering a stationary source emissions threshold of 25,000 TY CO2e, the facilities (between 25,000 TY and 100,000 TY CO2e) that would be subject would also require mandatory EAW due to the mandatory category trigger for criteria air emissions or another mandatory category trigger (e.g., landfills). In essence, lowering the existing threshold would not meaningfully change the facilities requiring mandatory EAWs. Therefore, based on the cost and time to revise the existing GHG emissions threshold it is not prudent to change the existing GHG threshold until a more robust regulatory framework for GHG pollution is established.
An assessment of existing mandatory EAW and mandatory EIS categories can be found in Appendix C of this report. In summary, all existing mandatory project types align with statutory GHG reporting sectors; and individual GHG emission sources within mandatory categories are not potentially significant enough to warrant a threshold change at this time. However, there may be projects that have the potential for significant climate effects that would not otherwise exceed a mandatory category threshold.
When considering cumulative GHG emissions from a proposed project, combined with GHG emissions from the existing facility, projects such as fuel conversion, residential developments or industrial,
Ex. 1 to MCEA Comments-Grace Dairy, Chippewa County

Integrating Climate Information Into • December 2020 Environmental Quality Board MEPA Program Requirements
13
commercial, and institutional facilities may contribute to potentially significant climate effects, but not require review. By creating a new mandatory EIS category for GHG pollution, information about those potential effects, as well as a discussion of project alternatives will be required before project approvals are granted.
Proposed new mandatory EIS category MR 4410.4400 subp. XX. Greenhouse Gas Pollution (GHG). A proposed project that results in cumulative GHG emissions for existing and future operations that exceeds an interim value of 100,000* tons per year CO2e unless the proposed project:
1. Is subject to a Best Achievable Control Technology analysis through federal air permitting requirements;
2. Has a GHG reduction plan that is publically available and demonstrates the proposed project’s GHG emissions will not significantly detract from the ability to meet state and/or local GHG reduction goals; or
3. Is subject to other federal, state or local permitting or environmental review that includes an assessment of the project’s GHG emissions.
*This number is proposed as an interim value using currently available information to support its use as an indicator for proposed projects that have the potential for significant environmental effects.
Justification The purpose of an EIS is to provide information about proposed projects with the potential for significant environmental effects, to consider alternatives to the proposed projects, and to explore methods for reducing adverse environmental effects (MR 4410.2000).
Minn. R. 4410.4300, subp 15 Part B, establishes a mandatory EAW category for stationary source facilities generating 100,000 tons per year TY of GHGs. The threshold of 100,000 TY is established in rule as a trigger to prepare an EAW to aid in the determination of whether an EIS is needed for a proposed project. A reasonable conclusion is that GHG emissions above this threshold that are regulated under federal air permitting requirements may have the potential for significance.
Depending on the scale (whether local, regional, national or global) and the cumulative nature of GHG emissions, the potential environmental effects of all proposed projects may be considered potentially significant. The new mandatory EIS category is needed for proposed projects that do not require review for other reasons and are not anticipated through the existing mandatory category project types.
The types of projects that will be subject to review under the proposed new mandatory EIS category include:
Proposed projects with non-stationary sources of GHG emissions, that fall below other mandatory EAW and EIS category triggers and thresholds, but have cumulative GHG emissions greater than 100,000 TY; when existing federal or state permitting requirements do not consider those emissions, or no GHG reduction plan has been developed
Proposed project types with non-stationary sources of GHG emissions not currently identified under other mandatory EAW and EIS categories, with cumulative GHG emissions greater than 100,000 TY; when existing federal or state requirements do not consider those emissions, or no GHG reduction plan has been developed
Ex. 1 to MCEA Comments-Grace Dairy, Chippewa County

Integrating Climate Information Into • December 2020 Environmental Quality Board MEPA Program Requirements
14
Appendix A XXXX Version
Environmental Assessment Worksheet This Environmental Assessment Worksheet (EAW) form and EAW Guidelines are available at the Environmental Quality Board’s website at: http://www.eqb.state.mn.us/EnvRevGuidanceDocuments.htm. The EAW form provides information about a project that may have the potential for significant environmental effects. The EAW Guidelines provide additional detail and resources for completing the EAW form.
Cumulative potential effects can either be addressed under each applicable EAW Item, or can be addresses collectively under EAW Item 19.
Note to reviewers: Comments must be submitted to the RGU during the 30-day comment period following notice of the EAW in the EQB Monitor. Comments should address the accuracy and completeness of information, potential impacts that warrant further investigation and the need for an EIS.
1. Project title:
2. Proposer: 3. RGU Contact person: Contact person: Title: Title: Address: Address: City, State, ZIP: City, State, ZIP: Phone: Phone: Fax: Fax: Email: Email:
4. Reason for EAW Preparation: (check one) Required: Discretionary: � EIS Scoping � Citizen petition � Mandatory EAW � RGU discretion
� Proposer initiated If EAW or EIS is mandatory give EQB rule category subpart number(s) and name(s):
5. Project Location: County: City/Township: PLS Location (¼, ¼, Section, Township, Range):
Watershed (81 major watershed scale): GPS Coordinates: Tax Parcel Number:
General climate trends in the location of the project:
Ex. 1 to MCEA Comments-Grace Dairy, Chippewa County

Integrating Climate Information Into • December 2020 Environmental Quality Board MEPA Program Requirements
15
At a minimum attach each of the following to the EAW: County map showing the general location of the project; U.S. Geological Survey 7.5 minute, 1:24,000 scale map indicating project boundaries (photocopy
acceptable); and Site plans showing all significant project and natural features. Pre-construction site plan and
post-construction site plan. List of data sources, models, and other resources (from the Item-by-Item Guidance or other)
used for information about current Minnesota climate trends and how climate change is anticipated to affect the general location of the project during the life of the project.
6. Project Description: a. Provide the brief project summary to be published in the EQB Monitor, (approximately 50
words).
b. Give a complete description of the proposed project and related new construction, including infrastructure needs. If the project is an expansion include a description of the existing facility. Emphasize: 1) construction, operation methods and features that will cause physical manipulation of the environment or will produce wastes, 2) modifications to existing equipment or industrial processes, 3) significant demolition, removal or remodeling of existing structures, and 4) timing and duration of construction activities, including how these may be affected by current Minnesota climate trends in the general location of the project, and 5) aspects or features of the project including its design that may worsen problems already accentuated by climate change (discuss conditions happening such as flooding, wash outs, urban heat island) if not addressed by the project, and any climate risk mitigation measures that have been incorporated.
b.c. Project magnitude:
Total Project Acreage Linear project length Number and type of residential units Residential building area (in square feet) Commercial building area (in square feet) Industrial building area (in square feet) Institutional building area (in square feet) Other uses – specify (in square feet) Structure height(s)
d. Explain the project purpose; if the project will be carried out by a governmental unit, explain the need for the project and identify its beneficiaries.
e. Are future stages of this development including development on any other property planned or likely to happen? � Yes � No
If yes, briefly describe future stages, relationship to present project, timeline and plans for environmental review.
f. Is this project a subsequent stage of an earlier project? � Yes � No If yes, briefly describe the past development, timeline and any past environmental review.
Ex. 1 to MCEA Comments-Grace Dairy, Chippewa County

Integrating Climate Information Into • December 2020 Environmental Quality Board MEPA Program Requirements
16
7. Cover types: Estimate the acreage of the site with each of the following cover types before and after development:
Cover Types Before (Acres)
After (Acres)
Cover Types Before (Acres)
After (Acres)
Wetlands and shallow lakes (<2 meters deep)
Lawn/landscaping
Deep lakes (>2 meters deep) water/streams
Green infrastructure (from table below*)
Rivers and streams Stormwater (wet) Pond Wooded/forest Impervious surface Brush/Grassland Other (describe) Cropland TOTAL
Green infrastructure Before (acreage) After (acreage) Raingarden Tree trenches and tree boxes Bioswales Constructed wetlands Constructed wetlands Green roofs Permeable pavements TOTAL (insert in table above*) Trees Percent Number Percent tree canopy removed or number of mature trees removed during development
Number of new trees planted
8. Permits and approvals required: List all known local, state and federal permits, approvals, certifications and financial assistance for the project. Include modifications of any existing permits, governmental review of plans and all direct and indirect forms of public financial assistance including bond guarantees, Tax Increment Financing and infrastructure. All of these final decisions are prohibited until all appropriate environmental review has been completed. See Minnesota Rules, Chapter 4410.3100.
Unit of government Type of application Status
Cumulative potential effects may be considered and addressed in response to individual EAW Item Nos. 9-18, or the RGU can address all cumulative potential effects in response to EAW Item No. 19. If addressing cumulative effect under individual items, make sure to include information requested in EAW Item No. 19
9. Land use: a. Describe:
i. Existing land use of the site as well as areas adjacent to and near the site, including parks and open space, cemeteries, trails, prime or unique farmlands.
Ex. 1 to MCEA Comments-Grace Dairy, Chippewa County

Integrating Climate Information Into • December 2020 Environmental Quality Board MEPA Program Requirements
17
ii. Plans. Describe planned land use as identified in comprehensive plan (if available) and any other applicable plan for land use, water, or resources management by a local, regional, state, or federal agency.
iii. Zoning, including special districts or overlays such as shoreland, floodplain, wild and scenic rivers, critical area, agricultural preserves, etc.
iv. If any critical facilities (i.e. facilities necessary for public health and safety, those storing hazardous materials, or those with housing occupants who may be insufficiently mobile) are proposed in floodplain areas and other areas identified as at risk for localized flooding, describe the risk potential considering changing precipitation and event intensity.
b. Discuss the project’s compatibility with nearby land uses, zoning, and plans listed in Item 9a above, concentrating on implications for environmental effects.
c. Identify measures incorporated into the proposed project to mitigate any potential incompatibility as discussed in Item 9b and any risk potential.
10. Geology, soils and topography/land forms: a. Geology - Describe the geology underlying the project area and identify and map any
susceptible geologic features such as sinkholes, shallow limestone formations, unconfined/shallow aquifers, or karst conditions. Discuss any limitations of these features for the project and any effects the project could have on these features. Identify any project designs or mitigation measures to address effects to geologic features.
b. Soils and topography - Describe the soils on the site, giving NRCS (SCS) classifications and descriptions, including limitations of soils. Describe topography, any special site conditions relating to erosion potential, soil stability or other soils limitations, such as steep slopes, highly permeable soils. Provide estimated volume and acreage of soil excavation and/or grading. Discuss impacts from project activities (distinguish between construction and operational activities) related to soils and topography. Identify measures during and after project construction to address soil limitations including stabilization, soil corrections or other measures. Erosion/sedimentation control related to stormwater runoff should be addressed in response to Item 11.b.ii.
NOTE: For silica sand projects, the EAW must include a hydrogeologic investigation assessing the potential groundwater and surface water effects and geologic conditions that could create an increased risk of potentially significant effects on groundwater and surface water. Descriptions of water resources and potential effects from the project in EAW Item 11 must be consistent with the geology, soils and topography/land forms and potential effects described in EAW Item 10.
11. Water resources: a. Describe surface water and groundwater features on or near the site in a.i. and a.ii. below.
i. Surface water - lakes, streams, wetlands, intermittent channels, and county/judicial ditches. Include any special designations such as public waters, shoreland classification and floodway/flood fringe location, trout stream/lake, wildlife lakes, migratory waterfowl feeding/resting lake, and outstanding resource value water. Include the presence of aquatic invasive species and the water quality impairments or special designations listed
Ex. 1 to MCEA Comments-Grace Dairy, Chippewa County

Integrating Climate Information Into • December 2020 Environmental Quality Board MEPA Program Requirements
18
on the current MPCA 303d Impaired Waters List that are within 1 mile of the project. Include DNR Public Waters Inventory number(s), if any.
ii. Groundwater – aquifers, springs, seeps. Include: 1) depth to groundwater; 2) if project is within a MDH wellhead protection area; 3) identification of any onsite and/or nearby wells, including unique numbers and well logs if available. If there are no wells known on site or nearby, explain the methodology used to determine this.
b. In Item b.i. through b.iv. below, Ddescribe effects from project activities on water resources, including how current Minnesota climate trends and anticipated climate change in the general location of the project may influence the effects. Describe and measures to minimize or mitigate the effects in Item b.i. through Item b.iv. below. i. Wastewater - For each of the following, describe the sources, quantities and
composition of all sanitary, municipal/domestic and industrial wastewater produced or treated at the site. 1) If the wastewater discharge is to a publicly owned treatment facility, identify any
pretreatment measures and the ability of the facility to handle the added water and waste loadings, including any effects on, or required expansion of, municipal wastewater infrastructure.
2) If the wastewater discharge is to a subsurface sewage treatment systems (SSTS), describe the system used, the design flow, and suitability of site conditions for such a system. If septic systems are part of the project, describe the availability of septage disposal options within the region to handle the ongoing amounts generated as a result of the project.
3) If the wastewater discharge is to surface water, identify the wastewater treatment methods and identify discharge points and proposed effluent limitations to mitigate impacts. Discuss any effects to surface or groundwater from wastewater discharges.
ii. Stormwater - Describe changes in hydrology resulting from change of land cover. Describe the quantity and quality of stormwater runoff at the site prior to and post construction. Include the routes and receiving water bodies for runoff from the site (major downstream water bodies as well as the immediate receiving waters). Discuss any environmental effects from stormwater discharges on receiving waters post construction including how the project will affect runoff volume, discharge rate and change in pollutants. Consider the effects of current MN climate trends and anticipated changes in rainfall frequency, intensity and amount with this discussion. For projects requiring NPDES Construction Stormwater permit coverage, state the total number of acres that will be disturbed by the project and Ddescribe the stormwater pollution prevention plans (SWPPP), including specific best management practices temporary and permanent runoff controls and potential (BMPs) to address soil site locations to manage or treat stormwater runoff. Identify specific erosion and control, sedimentation control or stabilization measures to address soil limitations during and after project construction. Discuss permanent stormwater management plans, including methods of achieving volume reduction to restore or maintain the natural hydrology of the site using green infrastructure practices or other stormwater management practices. Identify any receiving waters that have construction-related water impairments or are classified as special as defined in the Construction Stormwater permit. Describe additional requirements for special and impaired waters.
Ex. 1 to MCEA Comments-Grace Dairy, Chippewa County

Integrating Climate Information Into • December 2020 Environmental Quality Board MEPA Program Requirements
19
iii. Water appropriation - Describe if the project proposes to appropriate surface or groundwater (including dewatering). Describe the source, quantity, duration, use and purpose of the water use and if a DNR water appropriation permit is required. Describe any well abandonment. If connecting to an existing municipal water supply, identify the wells to be used as a water source and any effects on, or required expansion of, municipal water infrastructure. Discuss environmental effects from water appropriation, including an assessment of the water resources available for appropriation. Identify any measures to avoid, minimize, or mitigate environmental effects from the water appropriation. 1) Discuss how the proposed water use is resilient in the event of changes in total
precipitation, drought, increased temperatures, variable surface water flows and elevations, and longer growing seasons.
2) Describe contingency plans should the water supply for the project diminish in quantity or quality, such as reuse of water, connections with another water source, or an emergency connection.
iv. Surface Waters a) Wetlands - Describe any anticipated physical effects or alterations to wetland
features such as draining, filling, permanent inundation, dredging and vegetative removal. Discuss direct and indirect environmental effects from physical modification of wetlands, including the anticipated effects that any proposed wetland alterations may have to the host watershed. Identify measures to avoid (e.g., available alternatives that were considered), minimize, or mitigate environmental effects to wetlands. Discuss whether any required compensatory wetland mitigation for unavoidable wetland impacts will occur in the same minor or major watershed, and identify those probable locations.
b) Other surface waters- Describe any anticipated physical effects or alterations to surface water features (lakes, streams, ponds, intermittent channels, county/judicial ditches) such as draining, filling, permanent inundation, dredging, diking, stream diversion, impoundment, aquatic plant removal and riparian alteration. Discuss direct and indirect environmental effects from physical modification of water features. Identify measures to avoid, minimize, or mitigate environmental effects to surface water features, including in-water Best Management Practices that are proposed to avoid or minimize turbidity/sedimentation while physically altering the water features. Discuss how the project will change the number or type of watercraft on any water body, including current and projected watercraft usage.
12. Contamination/Hazardous Materials/Wastes: a. Pre-project site conditions - Describe existing contamination or potential environmental
hazards on or in close proximity to the project site such as soil or ground water contamination, abandoned dumps, closed landfills, existing or abandoned storage tanks, and hazardous liquid or gas pipelines. Discuss any potential environmental effects from pre-project site conditions that would be caused or exacerbated by project construction and operation. Identify measures to avoid, minimize or mitigate adverse effects from existing contamination or potential environmental hazards. Include development of a Contingency Plan or Response Action Plan.
Ex. 1 to MCEA Comments-Grace Dairy, Chippewa County

Integrating Climate Information Into • December 2020 Environmental Quality Board MEPA Program Requirements
20
b. Project related generation/storage of solid wastes - Describe solid wastes generated/stored during construction and/or operation of the project. Indicate method of disposal. Discuss potential environmental effects from solid waste handling, storage and disposal, including how current Minnesota climate trends and anticipated climate change in the general location of the project may influence the effects. Identify measures to avoid, minimize or mitigate adverse effects from the generation/storage of solid waste including source reduction and recycling.
c. Project related use/storage of hazardous materials - Describe chemicals/hazardous materials used/stored during construction and/or operation of the project including method of storage. Indicate the number, location and size of any new above or below ground tanks to store petroleum or other materials. Indicate the number, location, size and age of existing tanks on the property that will be utilized in the project. Discuss how current Minnesota climate trends and anticipated climate change in the general location of the project may influence thepotential environmental effects from accidental spill or release of hazardous materials. Identify measures to avoid, minimize or mitigate adverse effects from the use/storage of chemicals/hazardous materials including source reduction and recycling. Include development of a spill prevention plan.
d. Project related generation/storage of hazardous wastes - Describe hazardous wastes generated/stored during construction and/or operation of the project. Indicate method of disposal. Discuss potential environmental effects from hazardous waste handling, storage, and disposal, including how current Minnesota climate trends and anticipated climate change in the general location of the project may influence the effects. Identify measures to avoid, minimize or mitigate adverse effects from the generation/storage of hazardous waste including source reduction and recycling.
13. Fish, wildlife, plant communities, and sensitive ecological resources (rare features): a. Describe fish and wildlife resources as well as habitats and vegetation on or in near the site.
b. Describe rare features such as state-listed (endangered, threatened or special concern) species, native plant communities, Minnesota County Biological Survey Sites of Biodiversity Significance, and other sensitive ecological resources on or within close proximity to the site. Provide the license agreement number (LA-____) and/or correspondence number (ERDB _____________) from which the data were obtained and attach the Natural Heritage letter from the DNR. Indicate if any additional habitat or species survey work has been conducted within the site and describe the results.
c. Discuss how the identified fish, wildlife, plant communities, rare features and ecosystems may be affected by the project including how current Minnesota climate trends and anticipated climate change in the general location of the project may influence the effects. Include a discussion on introduction and spread of invasive species from the project construction and operation. Separately discuss effects to known threatened and endangered species.
d. Identify measures that will be taken to avoid, minimize, or mitigate the adverse effects to fish, wildlife, plant communities, ecosystems, and sensitive ecological resources discussed in c. above.
Ex. 1 to MCEA Comments-Grace Dairy, Chippewa County

Integrating Climate Information Into • December 2020 Environmental Quality Board MEPA Program Requirements
21
14. Historic properties: a. Describe any historic structures, archeological sites, and/or traditional cultural properties on
or in close proximity to the site. Include: 1) historic designations, 2) known artifact areas, and 3) architectural features. Attach letter received from the State Historic Preservation Office (SHPO). Discuss any anticipated effects to historic properties during project construction and operation. Identify measures that will be taken to avoid, minimize, or mitigate adverse effects to historic properties.
b. Discuss any environmental effects from stormwater discharges on the identified historic/cultural resources during project construction and operation, including how current MN climate trends and anticipated changes in rainfall frequency, intensity, and amount will influence those effects related to stormwater volume, discharge rate, and change in pollutants in runoff.
15. Visual: Describe any scenic views or vistas on or near the project site. Describe any project related visual effects such as vapor plumes or glare from intense lights. Discuss the potential visual effects from the project. Identify any measures to avoid, minimize, or mitigate visual effects.
16. Air: a. Stationary source emissions - Describe the type, sources, quantities and compositions of any
emissions from stationary sources such as boilers or exhaust stacks. Include any hazardous air pollutants, criteria pollutants, and any greenhouse gases. Discuss effects to air quality including any sensitive receptors, human health or applicable regulatory criteria. Include a discussion of any methods used assess the project’s effect on air quality and the results of that assessment. Identify pollution control equipment and other measures that will be taken to avoid, minimize, or mitigate adverse effects from stationary source emissions.
b. Vehicle emissions - Describe the effect of the project’s traffic generation on air emissions. Discuss the project’s vehicle-related emissions effect on air quality. Identify measures (e.g. traffic operational improvements, diesel idling minimization plan) that will be taken to minimize or mitigate vehicle-related emissions.
c. Dust and odors - Describe sources, characteristics, duration, quantities, and intensity of dust and odors generated during project construction and operation. (Fugitive dust may be discussed under item 16a). Discuss the effect of dust and odors in the vicinity of the project including nearby sensitive receptors and quality of life. Identify measures that will be taken to minimize or mitigate the effects of dust and odors.
17. Air Emissions: greenhouse gas (GHG) pollutants - Carbon Footprint. a. For all proposed projects provide a quantification and discussion of:
1. All GHG emission sources from the proposed project, including: a) energy use (on-site combustion/purchased from an offsite source); b) off-road and on-road mobile emissions sources, c) agricultural and land use practices d) non-combustion industrial process emissions e) waste management
Ex. 1 to MCEA Comments-Grace Dairy, Chippewa County

Integrating Climate Information Into • December 2020 Environmental Quality Board MEPA Program Requirements
22
2. Total anthropogenic and biogenic GHG emissions from these emission sources during construction.
3. Average annual total anthropogenic and biogenic GHG emissions from operation from these emission sources.
4. A description of methods* used to quantify emissions. (*If calculation methods are not readily available to quantify GHG emissions for a source, describe the process used to come to that conclusion and any GHG emission sources not included in the total calculation.)
b. For proposed projects with total from GHG emissions from construction and operation less than or equal to 25,000 tons per year (TY) CO2e, (combined result from A2 and A3 above), describe planned mitigation for the proposed project’s GHG emissions.
c. For proposed projects with total GHG emissions from construction and operation greater than 25,000 TY CO2e (combined result from A2 and A3 above), quantify and discuss:
1. projected annual GHG emissions by emission source; 2. if the proposed project is an expansion of an existing facility, GHG sources and
average annual GHG emissions from operations of the existing facility; 3. alternative mitigation measures considered to minimize or eliminate adverse effects
from the proposed project’s GHG emissions, and any mitigation measures considered to address the cumulative potential effects of GHG emissions;
4. selected mitigation method(s), including quantification of the anticipated reductions; by GHG and by emissions source;
5. if purchased, quantify offsets from renewable energy credits; 6. quantify the proposed projects predicted net lifetime GHG emissions and how those
predicted emissions may affect achievement of the Minnesota Next Generation Energy Act goals and/or other more stringent state or local GHG reduction goals.
18. Noise Describe sources, characteristics, duration, quantities, and intensity of noise generated during project construction and operation. Discuss the effect of noise in the vicinity of the project including 1) existing noise levels/sources in the area, 2) nearby sensitive receptors, 3) conformance to state noise standards, and 4) quality of life. Identify measures that will be taken to minimize or mitigate the effects of noise.
19. Transportation a. Describe traffic-related aspects of project construction and operation. Include: 1) existing and
proposed additional parking spaces, 2) estimated total average daily traffic generated, 3) estimated maximum peak hour traffic generated and time of occurrence, 4) indicate source of trip generation rates used in the estimates, 5) availability of transit and/or other alternative transportation modes and 6) emergency management and evacuation routes.
b. Discuss the effect on traffic congestion on affected roads and describe any traffic improvements necessary. The analysis must discuss the project’s impact on the regional transportation system. If the peak hour traffic generated exceeds 250 vehicles or the total daily trips exceeds 2,500, a traffic impact study must be prepared as part of the EAW. Use the format and procedures described in the Minnesota Department of Transportation’s Access Management Manual, Chapter 5 (available at: http://www.dot.state.mn.us/accessmanagement/resources.html) or a similar local guidance.
Ex. 1 to MCEA Comments-Grace Dairy, Chippewa County

Integrating Climate Information Into • December 2020 Environmental Quality Board MEPA Program Requirements
23
c. Identify measures that will be taken to minimize or mitigate project related transportation effects.
20. Cumulative potential effects: (Preparers can leave this item blank if cumulative potential effects are addressed under the applicable EAW Items) a. Describe the geographic scales and timeframes of the project related environmental effects
that could combine with other environmental effects resulting in cumulative potential effects.
b. Describe any reasonably foreseeable future projects (for which a basis of expectation has been laid) or climate change considerations that may interact with environmental effects of the proposed project within the geographic scales and timeframes identified above.
c. Discuss the nature of the cumulative potential effects including current Minnesota climate trends and anticpated climate change in the general location of the project and summarize any other available information relevant to determining whether there is potential for significant environmental effects due to these cumulative effects.
21. Other potential environmental effects: If the project may cause any additional environmental effects not addressed by items 1 to 19, describe the effects here, discuss the how the environment will be affected, and identify measures that will be taken to minimize and mitigate these effects.
RGU CERTIFICATION. (The Environmental Quality Board will only accept SIGNED Environmental Assessment Worksheets for public notice in the EQB Monitor.)
I hereby certify that:
The information contained in this document is accurate and complete to the best of my knowledge.
The EAW describes the complete project; there are no other projects, stages or components other than those described in this document, which are related to the project as connected actions or phased actions, as defined at Minnesota Rules, parts 4410.0200, subparts 9c and 60, respectively.
Copies of this EAW are being sent to the entire EQB distribution list.
Signature ________________________________ Date _______________________________
Title ________________________________
Ex. 1 to MCEA Comments-Grace Dairy, Chippewa County

Integrating Climate Information Into • December 2020 Environmental Quality Board MEPA Program Requirements
24
Appendix B1
Guidance: Developing a carbon footprint
Introduction In 2007, the Minnesota Legislature passed into law the Next Generation Energy Act (Minn. Stat. § 216H) that requires the tracking of specific greenhouse gas emissions (GHG). The statute also includes Statewide GHG emission reduction goals, from a 2005 baseline.
In order to support Minnesotans in their efforts to mitigate the impacts of climate change, and to adapt to changes already occurring, it is important that environmental documents required by the Minnesota Environmental Policy Act (MEPA) include usable information about potential effects of a proposed project on climate change.
Estimation of GHG emissions is useful to the public and decision makers to understand whether proposed projects are contributing to, or detracting from, achieving progress in meeting state and local GHG reduction goals as well as providing important information needed to effectively mitigate climate change.
The purpose of this guidance is to help project proposers and responsible governmental units (RGU) develop a carbon footprint in response to item 17 of the revised Environmental Assessment Worksheet (EAW) Form. This guidance supports an RGU as they develop the required climate-related information on the EAW, but does not limit the use of other reliable and relevant guidance for quantifying and assessing GHG emissions.
Topics covered in this guidance include:
What is a carbon footprint How to identify and describe types of GHGs emitted How to identify and describe sources of GHG emissions How to report GHGs emitted How to quantify GHGs emitted How to identify and assess alternative mitigation How to identify and quantify renewable energy credits purchased How to identify and quantify contributions from other GHG emission
sources
GHG: Greenhouse gases are gases that, upon emission to the atmosphere, warm the atmosphere and surface of the planet, and alter the climate.
RGU: Responsible governmental unit means the governmental unit that is responsible for preparation and review of environmental documents.
Carbon Footprint: the total amount of greenhouse gases that are emitted into the atmosphere each year by a person, family, building, organization, or company (USEPA).
Mitigation: projects or programs intended to offset or reduce known environmental impacts.
Renewable energy credit: represent the purchase of credits from energy generated by renewable energy sources, such as solar or wind power facilities.
GGLOSSARY OF TERMS
Ex. 1 to MCEA Comments-Grace Dairy, Chippewa County

Integrating Climate Information Into • December 2020 Environmental Quality Board MEPA Program Requirements
25
Attachment 1. Emissions Factors and Simplified Calculative Equations by Source Attachment 2. Models for Sources Not Amenable to Simplified Calculation Using Emission Factors Attachment 3. Default Fuel Heat Content and Stationary Source Emission Factors Attachment 4. Protocols and Methods for Calculating GHG Emissions
What is a carbon footprint? A carbon footprint includes greenhouse gas emissions from fuel directly, such as by providing heat to a building or fuel in a car. It also includes greenhouse gases that come from producing the goods or services, including emissions from power plants that make electricity, factories that make products, and landfills. An RGU has discretion for identifying what information is needed and how much information is required to respond to item 17 on the EAW Form; based on the nature and location of the project. At a minimum, a proposed project’s carbon footprint includes, but is not limited to, identification and assessment of:
Types of GHGs emitted Sources of GHG emissions associated with the proposed project Amount of GHG emissions from those sources Reduction of GHG emissions from planned mitigation
How to identify and describe types of GHGs emitted The GHGs most commonly included in project GHG reporting are carbon dioxide (CO2), nitrous oxide (N2O), methane (CH4), sulfur hexafluoride (SF6) and two families of gases known as hydrofluorocarbons (HFCs) and perfluorocarbons (PFCs). In response to item 17 of the EAW Form for a project’s carbon footprint, we recommend that typical reporting be limited to emission of these gases. State-level reporting of GHG emissions to the Minnesota Legislature under the Next Generation Energy Act is limited to this set of gases. Other GHGs and their precursors, not commonly reported in GHG inventories, but may be relevant to consider, include chlorofluorocarbons (CFCs), hydrchlorofluorocarbons (HCFCs), hydrofluoroethers (HFEs), sulfuryl fluoride (SO2F2), ozone, and various idiocarbons and chlorocarbons. For more information on these GHG gases, see Section 2: Sources and Sinks of Greenhouse Gases of the Report: https://www.pca.state.mn.us/sites/default/files/p-gen4-05.pdf
How to identify and describe sources of GHG emissions The USEPA annually prepares a detailed analysis of GHG emissions by source type. A list of these sources is shown in Table 1 (next page), by greenhouse gas emitted. GHG sources that are known in Minnesota are assessed biennially by the Minnesota Pollution Control Agency (MPCA). Sources that depend on specific mineral deposits not found in Minnesota have been excluded from the list. Environmental Review documents should identify and describe any of the GHG sources shown in Table 1 that are potentially associated with, and may result in, GHG emissions from the proposed project.
In the carbon footprint, GHG emission sources include all project sources of GHGs found within the property line of the project proposer or offsite from sources under contract or the control of the project proposer, plus offsite emissions associated with the generation of purchased electricity or solid waste disposal services. Project emissions include all emissions that are likely to occur in the operating phase of the project, as well as its construction phase.
Ex. 1 to MCEA Comments-Grace Dairy, Chippewa County
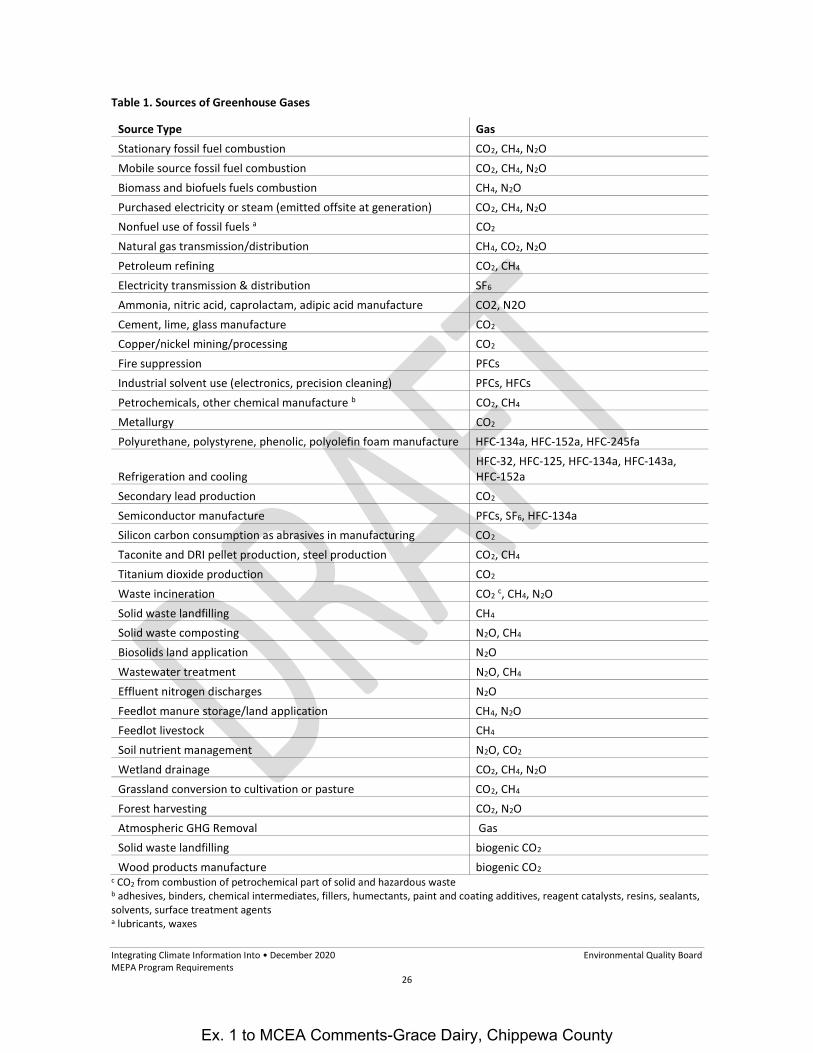
Integrating Climate Information Into • December 2020 Environmental Quality Board MEPA Program Requirements
26
Table 1. Sources of Greenhouse Gases
Source Type Gas Stationary fossil fuel combustion CO2, CH4, N2O Mobile source fossil fuel combustion CO2, CH4, N2O Biomass and biofuels fuels combustion CH4, N2O Purchased electricity or steam (emitted offsite at generation) CO2, CH4, N2O Nonfuel use of fossil fuels a CO2
Natural gas transmission/distribution CH4, CO2, N2O Petroleum refining CO2, CH4 Electricity transmission & distribution SF6 Ammonia, nitric acid, caprolactam, adipic acid manufacture CO2, N2O Cement, lime, glass manufacture CO2 Copper/nickel mining/processing CO2 Fire suppression PFCs Industrial solvent use (electronics, precision cleaning) PFCs, HFCs Petrochemicals, other chemical manufacture b CO2, CH4 Metallurgy CO2 Polyurethane, polystyrene, phenolic, polyolefin foam manufacture HFC-134a, HFC-152a, HFC-245fa
Refrigeration and cooling HFC-32, HFC-125, HFC-134a, HFC-143a, HFC-152a
Secondary lead production CO2 Semiconductor manufacture PFCs, SF6, HFC-134a Silicon carbon consumption as abrasives in manufacturing CO2 Taconite and DRI pellet production, steel production CO2, CH4 Titanium dioxide production CO2 Waste incineration CO2 c, CH4, N2O Solid waste landfilling CH4
Solid waste composting N2O, CH4 Biosolids land application N2O Wastewater treatment N2O, CH4 Effluent nitrogen discharges N2O Feedlot manure storage/land application CH4, N2O Feedlot livestock CH4 Soil nutrient management N2O, CO2 Wetland drainage CO2, CH4, N2O Grassland conversion to cultivation or pasture CO2, CH4 Forest harvesting CO2, N2O Atmospheric GHG Removal Gas Solid waste landfilling biogenic CO2 Wood products manufacture biogenic CO2
c CO2 from combustion of petrochemical part of solid and hazardous waste b adhesives, binders, chemical intermediates, fillers, humectants, paint and coating additives, reagent catalysts, resins, sealants, solvents, surface treatment agents a lubricants, waxes
Ex. 1 to MCEA Comments-Grace Dairy, Chippewa County

Integrating Climate Information Into • December 2020 Environmental Quality Board MEPA Program Requirements
27
How to report GHG emissions GHG emissions should be reported in CO2-equivalent short tons (English units). For any one GHG, emissions are converted to CO2-equivalent units by multiplying nominal estimated emissions, in short tons, by what is known as its global warming potential (GWP). It is conventional in emissions reporting, whether at the national, state or facility level, to use the 2007 version of the GWPs developed by the Intergovernmental Panel on Climate Change. These are shown in Table 2 by gas. A GWP is a factor that converts emissions of any one GHG to its equivalent in tons of emitted CO2.
Table 2. Greenhouse Gas Global Warming Potentials
Greenhouse Gas Chemical Formula Global Warming Potential Carbon dioxide CO2 1 Methane CH4 25 Nitrous oxide N2O 298 Sulfur hexafluoride SF6 22,800 Nitrogen trifluoride NF3 17,200 Hydrofluorocarbons HFC-23 CHF3 14,800 HFC-32 CH2F2 675 HFC-125 C2HF5 3,500 HFC-134a CH2FCF3 1,430 HFC-143a C2H3F3 4,470 HFC-152a CH3CHF2 124 HFC-227ea C3HF7 3,220 HFC-236fa C3H2F6 9,810 HFC-245fa C3H3F5 1,030 HFC-365mfc C4H5F5 794 HFC-4310mee CF3CFHCFHCF2CF3 1,640 Perfluorocarbons PFC-14 (Perfluoromethane) CF4 7,390 PFC-116 (Perfluoroethane) C2F6 12,200 PFC-218 (Perfluoropropane) C3F8 8,830 PFC-31-10 (Perfluorobutane) C4F10 8,860 PFC-51-14 (Perfluorohexane, FC-72) C6F14 9,300
Source: EPA, Inventory of US Sources and Sinks of Greenhouse Gases, EPA-430-R-19-001, Table ES-1, Federal Register, CFR part 98, Mandatory Greenhouse Gas Reporting, Table A-1, with additions
Projected GHG emissions should be developed on an average annual basis, and include the proposer’s best estimate of average annual emissions over the proposed life / design service life of the project. As noted above, the estimates should include emissions from the operating phase of the project plus emissions from project construction. To include construction emissions in the footprint, emissions should be annualized by dividing total construction GHG releases to the atmosphere by project life.
In the project GHG accounting, the project proposer should report GHG emissions by source type and project phase, and also bring emissions to a project total. We recommend that emissions be reported using the reporting framework and categories shown in Table 3 (next page), which additionally breaks out emissions from type and subtype of emission and gas. Direct emissions are emissions released
Ex. 1 to MCEA Comments-Grace Dairy, Chippewa County
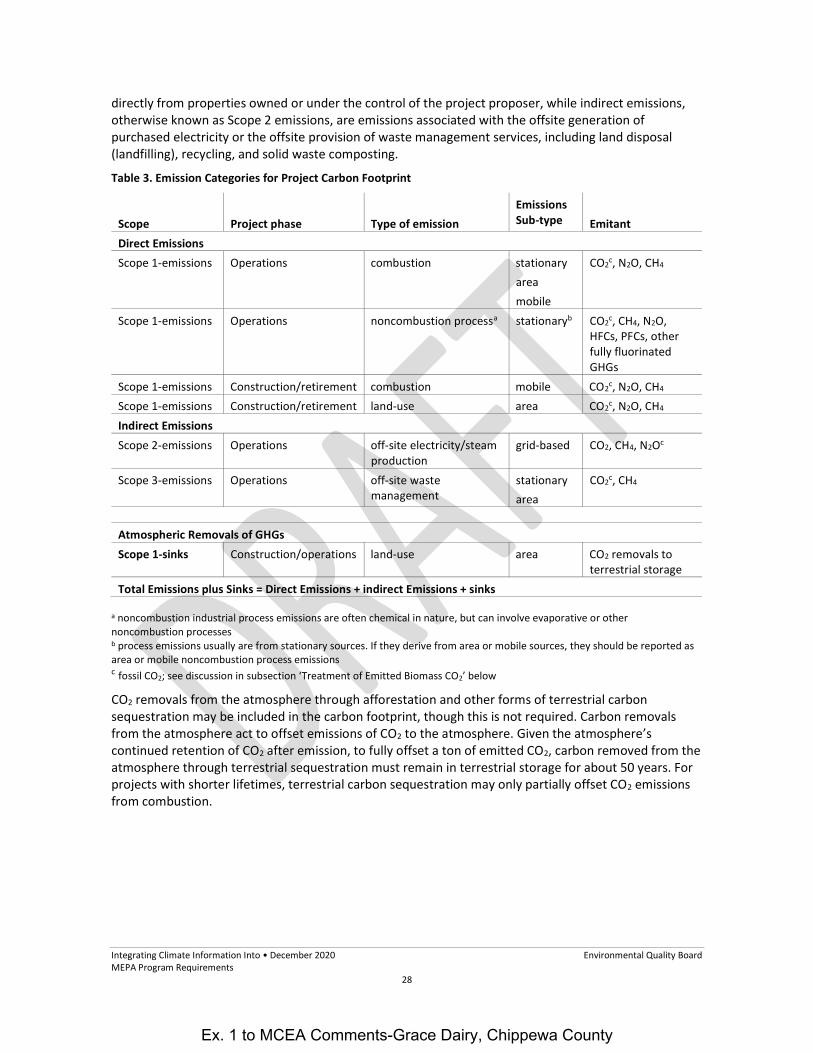
Integrating Climate Information Into • December 2020 Environmental Quality Board MEPA Program Requirements
28
directly from properties owned or under the control of the project proposer, while indirect emissions, otherwise known as Scope 2 emissions, are emissions associated with the offsite generation of purchased electricity or the offsite provision of waste management services, including land disposal (landfilling), recycling, and solid waste composting.
Table 3. Emission Categories for Project Carbon Footprint
Scope
Project phase
Type of emission
Emissions Sub-type
Emitant
Direct Emissions Scope 1-emissions Operations combustion stationary
area mobile
CO2c, N2O, CH4
Scope 1-emissions Operations noncombustion processa stationaryb CO2c, CH4, N2O, HFCs, PFCs, other fully fluorinated GHGs
Scope 1-emissions Construction/retirement combustion mobile CO2c, N2O, CH4 Scope 1-emissions Construction/retirement land-use area CO2c, N2O, CH4 Indirect Emissions Scope 2-emissions Operations off-site electricity/steam
production grid-based CO2, CH4, N2Oc
Scope 3-emissions Operations off-site waste management
stationary area
CO2c, CH4
Atmospheric Removals of GHGs Scope 1-sinks Construction/operations land-use area CO2 removals to
terrestrial storage Total Emissions plus Sinks = Direct Emissions + indirect Emissions + sinks
a noncombustion industrial process emissions are often chemical in nature, but can involve evaporative or other noncombustion processes b process emissions usually are from stationary sources. If they derive from area or mobile sources, they should be reported as area or mobile noncombustion process emissions c fossil CO2; see discussion in subsection ‘Treatment of Emitted Biomass CO2’ below
CO2 removals from the atmosphere through afforestation and other forms of terrestrial carbon sequestration may be included in the carbon footprint, though this is not required. Carbon removals from the atmosphere act to offset emissions of CO2 to the atmosphere. Given the atmosphere’s continued retention of CO2 after emission, to fully offset a ton of emitted CO2, carbon removed from the atmosphere through terrestrial sequestration must remain in terrestrial storage for about 50 years. For projects with shorter lifetimes, terrestrial carbon sequestration may only partially offset CO2 emissions from combustion.
Ex. 1 to MCEA Comments-Grace Dairy, Chippewa County

Integrating Climate Information Into • December 2020 Environmental Quality Board MEPA Program Requirements
29
In including terrestrial carbon sequestration (TCS) in project accounting we recommend that the offsets value of TCS for projects with lifetimes of 50 years or more be assessed at full value, while projects with lifetimes of 20 years and 25 to 49 years be assessed at 40% and 75% offsets value1, respectively. In practice, offsets value may be calculated by multiplying total tons of CO2 removed from the atmosphere by 1, 0.75 or 0.4, depending on project lifetime.
Treatment of Emitted Biomass CO2
If resulting from permanent land-use change, biogenic CO2 emissions should be included in the proposed facility’s carbon footprint. Permanent land-use changes may include: forestland converted to cropland, pastureland or urban uses; grassland converted to cropland, pastureland or urban uses; and all wetlands conversions.
Beyond emissions from permanent land use change, other emissions of CO2 from biomass sources or ecosystem or animal respiration generally are not included in project accounting. We recommend that this convention be followed. Unless released to the atmosphere as a result of permanent land use change, CO2 emitted to the atmosphere from biomass combustion or ecosystem or animal respiration, is often rapidly removed from the atmosphere through subsequent photosynthesis and returned to storage in living biomass and soils. Table 4 includes a list of common biogenic sources of CO2 for which carbon neutrality should be assumed in carbon footprint development.
Table 4. Common Biomass CO2 Sources a
Common Biomass Fuels Solid fuels: sawdust, hogged bark, wastewood, other papermill and sawmill residuals, biogenic part of mixed municipal solid waste (MMSW) or refuse-derived fuel (RDF),b paper mill sludge, wastewater treatment sludge, urban tree removal wastes, residential firewood, dedicated whole tree or perennial grasses for bioenergy Liquid fuels: ethanol, biodiesel Gaseous fuels: landfill gas (LFG), digester gas, biomethane for pipeline uses
Other Common Biogenic Sources of CO2 Emissions MMSW composting, garden/yard waste composting, municipal wastewater and industrial treatment, biosolids land application, industrial grain fermentation, manure storage, grain storage, prescribed burning of grassland/brushland, residential recreational burning, cropland cultivation, forest harvest residuals (slash)
a This listing should not be considered to be exhaustive, but rather broadly indicative of biomass fuels and biogenic CO2 sources that, in carbon footprint development, should be treated as carbon neutral b As noted in Table 1, emissions of fossil CO2 from the combustion of the fossil fuel (petrochemical) part of MMSW and RDF should be included as an integral part of the carbon footprint. Emissions of CH4 and N2O from waste combustion also should be included.
Table 5 summarizes the recommended reporting requirements under this guidance. They do not include requirements related to documentation of data sources, assumptions made or methods used. At its discretion, the RGU may wish to establish requirements for documentation of information sources that are used in carbon footprint development.
1 40% offsets valuation is the valuation at 20-years of continuous storage, while 75% is the valuation at 40 years of continuous storage. For the schedule of atmospheric CO2 retention upon emission of CO2 from combustion, see: F. Joos, et al., "Carbon Dioxide and climate Impulse Response Functions for the Computation of Greenhouse Gas Metrics: A Multi-Model Analysis," Atmospheric Chemistry and Physics 13 (2013): 2,793-2,825. At 100-years, the usual integration period for analysis, for a one-ton emission of CO2, the atmosphere retains roughly 50 ton-years of emissions. For comparison, one ton of CO2 continuously stored in soils and biomass for 50 years would result in similar degree of offsetting storage, about 50 ton-years of storage. At 20 and 40 years, CO2 storage in soils and biomass resulting from one ton stored, assuming no leakage, would be would be 38 and 76 ton-years, respectively. Offsets value is derived by dividing, for one ton of CO2 storage, total tons-years of terrestrial storage by total 100-year ton-years of atmospheric retention resulting from a 1 ton emission of CO2.
Ex. 1 to MCEA Comments-Grace Dairy, Chippewa County
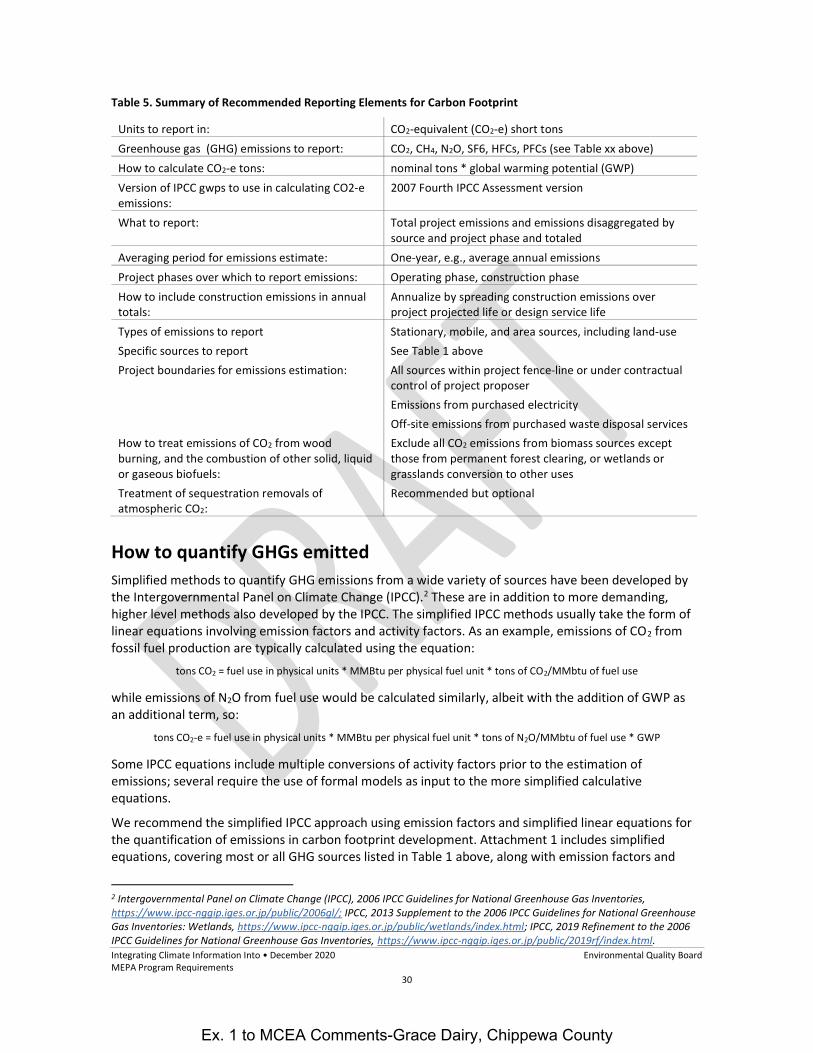
Integrating Climate Information Into • December 2020 Environmental Quality Board MEPA Program Requirements
30
Table 5. Summary of Recommended Reporting Elements for Carbon Footprint
Units to report in: CO2-equivalent (CO2-e) short tons Greenhouse gas (GHG) emissions to report: CO2, CH4, N2O, SF6, HFCs, PFCs (see Table xx above) How to calculate CO2-e tons: nominal tons * global warming potential (GWP) Version of IPCC gwps to use in calculating CO2-e emissions:
2007 Fourth IPCC Assessment version
What to report: Total project emissions and emissions disaggregated by source and project phase and totaled
Averaging period for emissions estimate: One-year, e.g., average annual emissions Project phases over which to report emissions: Operating phase, construction phase How to include construction emissions in annual totals:
Annualize by spreading construction emissions over project projected life or design service life
Types of emissions to report Stationary, mobile, and area sources, including land-use Specific sources to report See Table 1 above Project boundaries for emissions estimation: All sources within project fence-line or under contractual
control of project proposer Emissions from purchased electricity Off-site emissions from purchased waste disposal services
How to treat emissions of CO2 from wood burning, and the combustion of other solid, liquid or gaseous biofuels:
Exclude all CO2 emissions from biomass sources except those from permanent forest clearing, or wetlands or grasslands conversion to other uses
Treatment of sequestration removals of atmospheric CO2:
Recommended but optional
How to quantify GHGs emitted Simplified methods to quantify GHG emissions from a wide variety of sources have been developed by the Intergovernmental Panel on Climate Change (IPCC).2 These are in addition to more demanding, higher level methods also developed by the IPCC. The simplified IPCC methods usually take the form of linear equations involving emission factors and activity factors. As an example, emissions of CO2 from fossil fuel production are typically calculated using the equation:
tons CO2 = fuel use in physical units * MMBtu per physical fuel unit * tons of CO2/MMbtu of fuel use
while emissions of N2O from fuel use would be calculated similarly, albeit with the addition of GWP as an additional term, so:
tons CO2-e = fuel use in physical units * MMBtu per physical fuel unit * tons of N2O/MMbtu of fuel use * GWP
Some IPCC equations include multiple conversions of activity factors prior to the estimation of emissions; several require the use of formal models as input to the more simplified calculative equations.
We recommend the simplified IPCC approach using emission factors and simplified linear equations for the quantification of emissions in carbon footprint development. Attachment 1 includes simplified equations, covering most or all GHG sources listed in Table 1 above, along with emission factors and
2 Intergovernmental Panel on Climate Change (IPCC), 2006 IPCC Guidelines for National Greenhouse Gas Inventories, https://www.ipcc-nggip.iges.or.jp/public/2006gl/; IPCC, 2013 Supplement to the 2006 IPCC Guidelines for National Greenhouse Gas Inventories: Wetlands, https://www.ipcc-nggip.iges.or.jp/public/wetlands/index.html; IPCC, 2019 Refinement to the 2006 IPCC Guidelines for National Greenhouse Gas Inventories, https://www.ipcc-nggip.iges.or.jp/public/2019rf/index.html.
Ex. 1 to MCEA Comments-Grace Dairy, Chippewa County
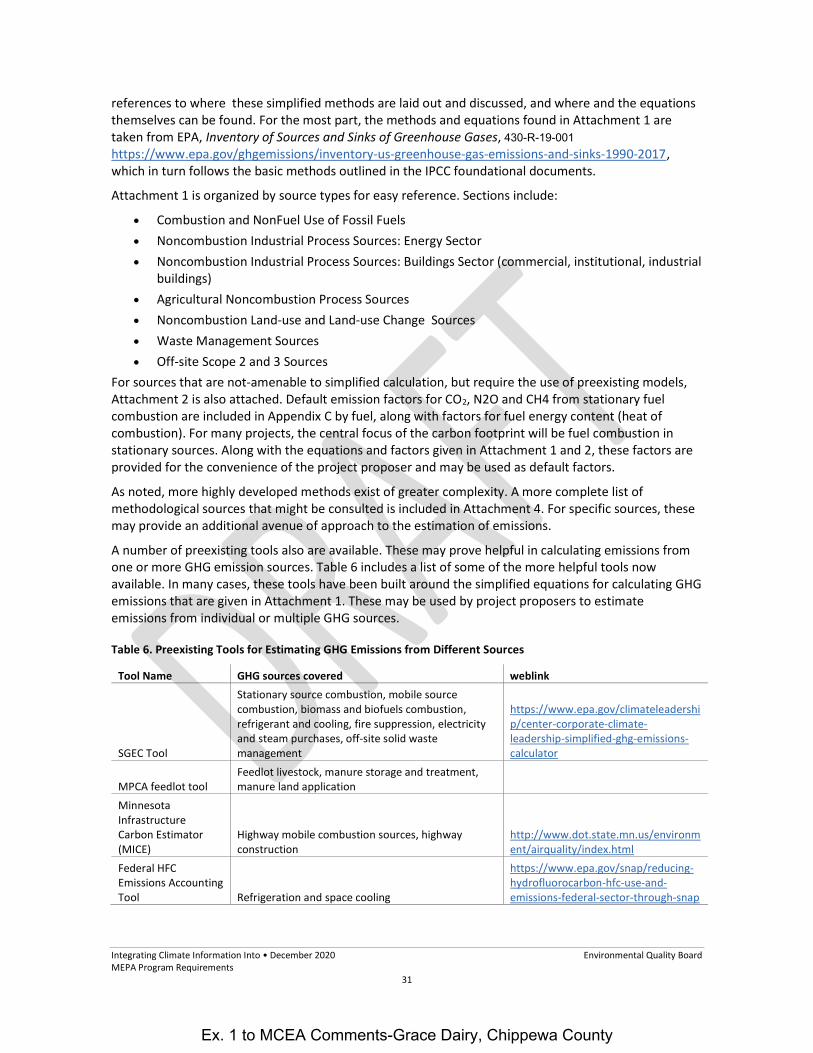
Integrating Climate Information Into • December 2020 Environmental Quality Board MEPA Program Requirements
31
references to where these simplified methods are laid out and discussed, and where and the equations themselves can be found. For the most part, the methods and equations found in Attachment 1 are taken from EPA, Inventory of Sources and Sinks of Greenhouse Gases, 430-R-19-001 https://www.epa.gov/ghgemissions/inventory-us-greenhouse-gas-emissions-and-sinks-1990-2017, which in turn follows the basic methods outlined in the IPCC foundational documents.
Attachment 1 is organized by source types for easy reference. Sections include:
Combustion and NonFuel Use of Fossil Fuels Noncombustion Industrial Process Sources: Energy Sector Noncombustion Industrial Process Sources: Buildings Sector (commercial, institutional, industrial
buildings) Agricultural Noncombustion Process Sources Noncombustion Land-use and Land-use Change Sources Waste Management Sources Off-site Scope 2 and 3 Sources
For sources that are not-amenable to simplified calculation, but require the use of preexisting models, Attachment 2 is also attached. Default emission factors for CO2, N2O and CH4 from stationary fuel combustion are included in Appendix C by fuel, along with factors for fuel energy content (heat of combustion). For many projects, the central focus of the carbon footprint will be fuel combustion in stationary sources. Along with the equations and factors given in Attachment 1 and 2, these factors are provided for the convenience of the project proposer and may be used as default factors.
As noted, more highly developed methods exist of greater complexity. A more complete list of methodological sources that might be consulted is included in Attachment 4. For specific sources, these may provide an additional avenue of approach to the estimation of emissions.
A number of preexisting tools also are available. These may prove helpful in calculating emissions from one or more GHG emission sources. Table 6 includes a list of some of the more helpful tools now available. In many cases, these tools have been built around the simplified equations for calculating GHG emissions that are given in Attachment 1. These may be used by project proposers to estimate emissions from individual or multiple GHG sources.
Table 6. Preexisting Tools for Estimating GHG Emissions from Different Sources
Tool Name GHG sources covered weblink
SGEC Tool
Stationary source combustion, mobile source combustion, biomass and biofuels combustion, refrigerant and cooling, fire suppression, electricity and steam purchases, off-site solid waste management
https://www.epa.gov/climateleadership/center-corporate-climate-leadership-simplified-ghg-emissions-calculator
MPCA feedlot tool Feedlot livestock, manure storage and treatment, manure land application
Minnesota Infrastructure Carbon Estimator (MICE)
Highway mobile combustion sources, highway construction
http://www.dot.state.mn.us/environment/airquality/index.html
Federal HFC Emissions Accounting Tool Refrigeration and space cooling
https://www.epa.gov/snap/reducing-hydrofluorocarbon-hfc-use-and-emissions-federal-sector-through-snap
Ex. 1 to MCEA Comments-Grace Dairy, Chippewa County
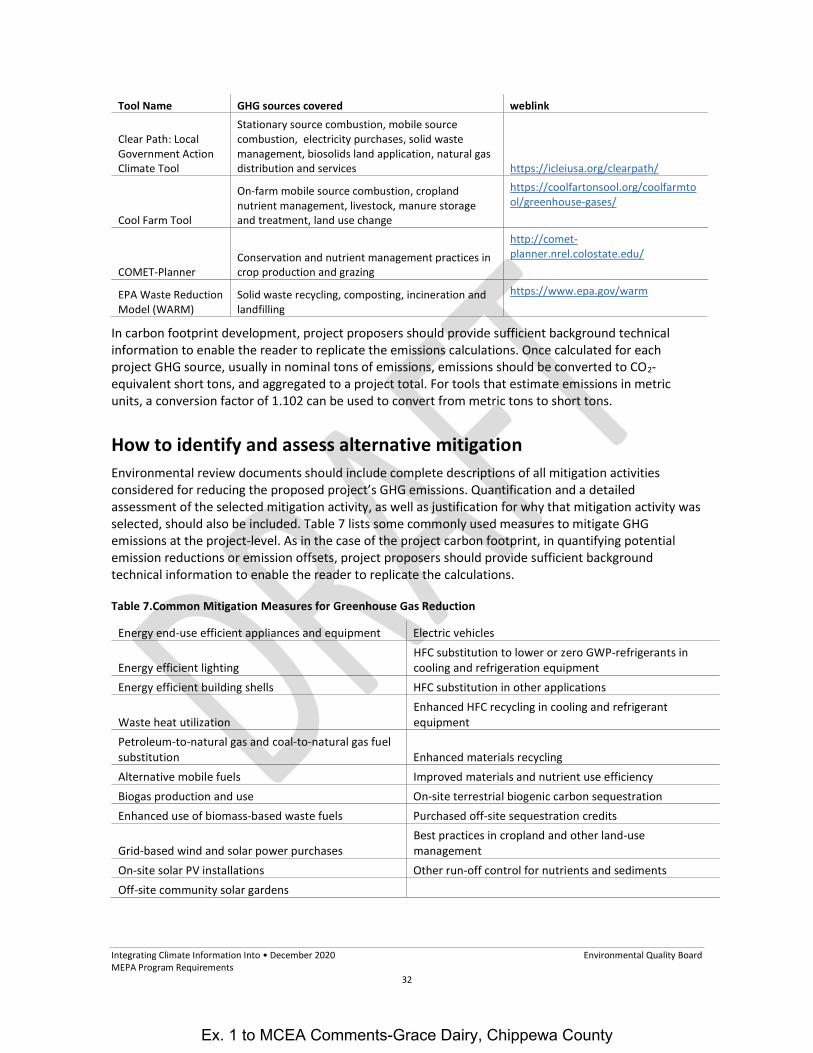
Integrating Climate Information Into • December 2020 Environmental Quality Board MEPA Program Requirements
32
Tool Name GHG sources covered weblink
Clear Path: Local Government Action Climate Tool
Stationary source combustion, mobile source combustion, electricity purchases, solid waste management, biosolids land application, natural gas distribution and services https://icleiusa.org/clearpath/
Cool Farm Tool
On-farm mobile source combustion, cropland nutrient management, livestock, manure storage and treatment, land use change
https://coolfartonsool.org/coolfarmtool/greenhouse-gases/
COMET-Planner Conservation and nutrient management practices in crop production and grazing
http://comet-planner.nrel.colostate.edu/
EPA Waste Reduction Model (WARM)
Solid waste recycling, composting, incineration and landfilling
https://www.epa.gov/warm
In carbon footprint development, project proposers should provide sufficient background technical information to enable the reader to replicate the emissions calculations. Once calculated for each project GHG source, usually in nominal tons of emissions, emissions should be converted to CO2-equivalent short tons, and aggregated to a project total. For tools that estimate emissions in metric units, a conversion factor of 1.102 can be used to convert from metric tons to short tons.
How to identify and assess alternative mitigation Environmental review documents should include complete descriptions of all mitigation activities considered for reducing the proposed project’s GHG emissions. Quantification and a detailed assessment of the selected mitigation activity, as well as justification for why that mitigation activity was selected, should also be included. Table 7 lists some commonly used measures to mitigate GHG emissions at the project-level. As in the case of the project carbon footprint, in quantifying potential emission reductions or emission offsets, project proposers should provide sufficient background technical information to enable the reader to replicate the calculations.
Table 7.Common Mitigation Measures for Greenhouse Gas Reduction
Energy end-use efficient appliances and equipment Electric vehicles
Energy efficient lighting HFC substitution to lower or zero GWP-refrigerants in cooling and refrigeration equipment
Energy efficient building shells HFC substitution in other applications
Waste heat utilization Enhanced HFC recycling in cooling and refrigerant equipment
Petroleum-to-natural gas and coal-to-natural gas fuel substitution Enhanced materials recycling Alternative mobile fuels Improved materials and nutrient use efficiency Biogas production and use On-site terrestrial biogenic carbon sequestration Enhanced use of biomass-based waste fuels Purchased off-site sequestration credits
Grid-based wind and solar power purchases Best practices in cropland and other land-use management
On-site solar PV installations Other run-off control for nutrients and sediments Off-site community solar gardens
Ex. 1 to MCEA Comments-Grace Dairy, Chippewa County

Integrating Climate Information Into • December 2020 Environmental Quality Board MEPA Program Requirements
33
How to identify and quantify renewable energy credits purchased Renewable Energy Credits (RECs) represent the energy generated by renewable energy sources, such as solar or wind power facilities and represent the clean energy attributes of these renewable energy sources. Minnesota’s ER Program does not require the purchase of RECs. However, item 17 of the EAW form includes space for disclosure of any GHG emission reductions that can be attributed to the proposed project, should a project proposer decide to offset their GHG emissions by purchasing RECs.
In Minnesota, RECs can be purchased through an electrical utility, or from outside suppliers such as Green-e; an organization that certifies REC providers (https://www.green-e.org/). For most programs, a project proposer may choose how much to energy to purchase up to 100% of the proposer’s energy usage. The GHG reductions associated with the generation and purchase of RECS may be included in the project carbon footprint as an offsetting emission reduction. Emissions-avoided through the purchase of RECs may be calculated using the most recent emission rates for CO2, N2O and CO2 for the MROW North American Electric Reliability Corporation (NERC) planning zones, reported in EPA E-Grid database (https://www.epa.gov/egrid)
Using either the project lifetime emissions estimate or the annual estimate developed above, the project proposer should explain how the proposed project will contribute to the state’s achievement of its GHG reduction goals under the Next Generation Energy Act. If local jurisdictions have GHG reduction goals, the project proposer likewise should explain how its project contributes to the achievement of those goals.
How to identify contributions from other GHG emission sources Attributing climate change to a single project is challenging given its global nature. However, climate change can be attributed to the interrelationships among multiple project that contribute GHG emissions locally, regionally and globally. All GHG emissions contribute to cumulative climate change impacts. For that reason, it is not reasonable to expect that a decision on the need for an EAW, or the need for an EIS would be required based solely on the potential for significant cumulative GHG emissions.
However, government decision makers and the public will benefit from understanding how the proposed project may contribute GHG emissions along with other GHG emission sources in the environmentally relevant area. When responding to this item an RGU should consider if other existing, or planned future sources of GHG emissions are identified within the jurisdiction of the RGU. The RGU should identify any GHG emissions sources associated with:
Pending applications for permits have that been filed and include sources of GHG emissions Any detailed plans and specifications that include sources of GHG emissions that have been
submitted for approval by the RGU Any future development that is indicated by adopted comprehensive plans or zoning or other
ordinances that may also include sources of GHG emissions Any future development that is indicated by historic or forecasted trends Any other factors determined to be relevant by the RGU
Ex. 1 to MCEA Comments-Grace Dairy, Chippewa County
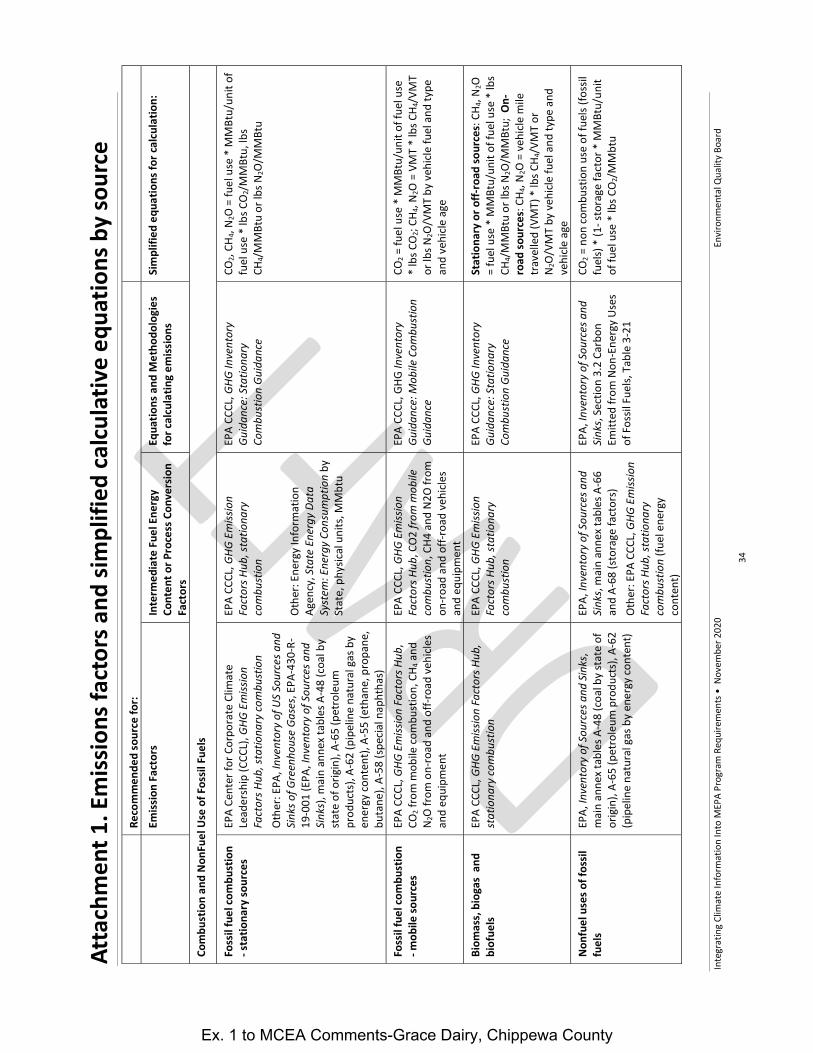
Inte
grat
ing
Clim
ate
Info
rmat
ion
Into
MEP
A Pr
ogra
m R
equi
rem
ents
• N
ovem
ber 2
020
Envi
ronm
enta
l Qua
lity
Boar
d
34
Atta
chm
ent 1
. Em
issio
ns fa
ctor
s and
sim
plifi
ed ca
lcula
tive
equa
tions
by
sour
ce
Re
com
men
ded
sour
ce fo
r:
Emiss
ion
Fact
ors
Inte
rmed
iate
Fue
l Ene
rgy
Cont
ent o
r Pro
cess
Con
vers
ion
Fact
ors
Equa
tions
and
Met
hodo
logi
es
for c
alcu
latin
g em
issio
ns
Sim
plifi
ed e
quat
ions
for c
alcu
latio
n:
Com
bust
ion
and
Non
Fuel
Use
of F
ossil
Fue
ls
Foss
il fu
el co
mbu
stio
n - s
tatio
nary
sour
ces
EPA
Cent
er fo
r Cor
pora
te C
limat
e Le
ader
ship
(CCC
L), G
HG E
miss
ion
Fact
ors H
ub, s
tatio
nary
com
bust
ion
Oth
er: E
PA, I
nven
tory
of U
S So
urce
s and
Si
nks o
f Gre
enho
use
Gase
s, EP
A-43
0-R-
19-0
01 (E
PA, I
nven
tory
of S
ourc
es a
nd
Sink
s), m
ain
anne
x ta
bles
A-4
8 (c
oal b
y st
ate
of o
rigin
), A-
65 (p
etro
leum
pr
oduc
ts),
A-62
(pip
elin
e na
tura
l gas
by
ener
gy co
nten
t), A
-55
(eth
ane,
pro
pane
, bu
tane
), A-
58 (s
pecia
l nap
htha
s)
EPA
CCCL
, GHG
Em
issio
n Fa
ctor
s Hub
, sta
tiona
ry
com
bust
ion
Oth
er: E
nerg
y In
form
atio
n Ag
ency
, Sta
te E
nerg
y Da
ta
Syst
em: E
nerg
y Co
nsum
ptio
n by
St
ate,
phy
sical
uni
ts, M
Mbt
u
EPA
CCCL
, GHG
Inve
ntor
y Gu
idan
ce: S
tatio
nary
Co
mbu
stio
n Gu
idan
ce
CO2,
CH4,
N 2O
= fu
el u
se *
MM
Btu/
unit
of
fuel
use
* lb
s CO
2/M
MBt
u, lb
s CH
4/M
MBt
u or
lbs N
2O/M
MBt
u
Foss
il fu
el co
mbu
stio
n - m
obile
sour
ces
EPA
CCCL
, GHG
Em
issio
n Fa
ctor
s Hub
, CO
2 fro
m m
obile
com
bust
ion,
CH 4
and
N 2
O fr
om o
n-ro
ad a
nd o
ff-ro
ad v
ehicl
es
and
equi
pmen
t
EPA
CCCL
, GHG
Em
issio
n Fa
ctor
s Hub
, CO2
from
mob
ile
com
bust
ion,
CH4
and
N2O
from
on
-roa
d an
d of
f-roa
d ve
hicle
s an
d eq
uipm
ent
EPA
CCCL
, GHG
Inve
ntor
y Gu
idan
ce: M
obile
Com
bust
ion
Guid
ance
CO2 =
fuel
use
* M
MBt
u/un
it of
fuel
use
*
lbs C
O2;
CH4,
N 2O
= V
MT
* lb
s CH 4
/VM
T or
lbs N
2O/V
MT
by v
ehicl
e fu
el a
nd ty
pe
and
vehi
cle a
ge
Biom
ass,
bio
gas
and
biof
uels
EPA
CCCL
, GHG
Em
issio
n Fa
ctor
s Hub
, st
atio
nary
com
bust
ion
EPA
CCCL
, GHG
Em
issio
n Fa
ctor
s Hub
, sta
tiona
ry
com
bust
ion
EPA
CCCL
, GHG
Inve
ntor
y Gu
idan
ce: S
tatio
nary
Co
mbu
stio
n Gu
idan
ce
Stat
iona
ry o
r off-
road
sour
ces:
CH 4
, N2O
=
fuel
use
* M
MBt
u/un
it of
fuel
use
* lb
s CH
4/M
MBt
u or
lbs N
2O/M
MBt
u; O
n-ro
ad so
urce
s: C
H 4, N
2O =
veh
icle
mile
tr
avel
led
(VM
T) *
lbs C
H 4/V
MT
or
N 2O
/VM
T by
veh
icle
fuel
and
type
and
ve
hicle
age
No
nfue
l use
s of f
ossil
fu
els
EPA,
Inve
ntor
y of
Sou
rces
and
Sink
s, m
ain
anne
x ta
bles
A-4
8 (c
oal b
y st
ate
of
orig
in),
A-65
(pet
role
um p
rodu
cts)
, A-6
2 (p
ipel
ine
natu
ral g
as b
y en
ergy
cont
ent)
EPA,
Inve
ntor
y of
Sou
rces
and
Sink
s, m
ain
anne
x ta
bles
A-6
6 an
d A-
68 (s
tora
ge fa
ctor
s)
Oth
er: E
PA C
CCL,
GHG
Em
issio
n Fa
ctor
s Hub
, sta
tiona
ry
com
bust
ion
(fuel
ene
rgy
cont
ent)
EPA,
Inve
ntor
y of
Sou
rces
and
Si
nks,
Sect
ion
3.2
Carb
on
Emitt
ed fr
om N
on-E
nerg
y Us
es
of F
ossil
Fue
ls, T
able
3-2
1
CO2 =
non
com
bust
ion
use
of fu
els (
foss
il fu
els)
* (1
- sto
rage
fact
or *
MM
Btu/
unit
of fu
el u
se *
lbs C
O2/
MM
btu
Ex. 1 to MCEA Comments-Grace Dairy, Chippewa County

Inte
grat
ing
Clim
ate
Info
rmat
ion
Into
MEP
A Pr
ogra
m R
equi
rem
ents
• N
ovem
ber 2
020
Envi
ronm
enta
l Qua
lity
Boar
d
35
Nonc
ombu
stio
n In
dust
rial P
roce
ss S
ourc
es
Ener
gy S
ecto
r Pe
trol
eum
refin
ing
and
stor
age
refin
ery-
spec
ific
emiss
ion
rate
s per
hy
drog
en p
rodu
ctio
n, ca
taly
tic c
rack
ing
and
refo
rmin
g, a
nd fl
ares
not r
elev
ant (
NR)
refin
ery-
spec
ific
calcu
latio
ns fo
r hy
drog
en p
rodu
ctio
n, ca
taly
tic
crac
king
and
refo
rmin
g, a
nd
flare
s EPA
, Gre
enho
use
Gas
Repo
rtin
g Pr
ogra
m (G
HGRP
), Fl
ight
Too
l, 20
10-2
019
not a
vaila
ble
(NA)
Natu
ral g
as
tran
smiss
ion
and
dist
ribut
ion
EPA,
Nat
ural
Gas
and
Pet
role
um
Syst
ems i
n th
e GH
G In
vent
ory:
Ad
ditio
nal I
nfor
mat
ion
on th
e 19
90-
2018
GHG
Inve
ntor
y, A
nnex
3.6
, Tab
les
3.6-
2, 3
.6-1
2, 3
.6-1
5
NR
EPA,
Nat
ural
Gas
and
Pe
trol
eum
Sys
tem
s in
the
GHG
Inve
ntor
y: A
dditi
onal
In
form
atio
n on
the
1990
-201
8 GH
G In
vent
ory,
Ann
ex 3
.6,
Tabl
es 3
.6-6
, 3.6
-13,
3.6
-16
CH4,
CO2,
N2O
= a
ctiv
ity fa
ctor
s (m
ultip
le
emiss
ion
poin
ts) *
lbs C
H 4/a
ctiv
ity fa
ctor
, lb
s CO 2
/act
ivity
fact
or o
r lbs
N2O
/ act
ivity
fa
ctor
; CH 4
, CO
2, an
d N 2
O e
miss
ions
fa
ctor
s uni
que
to e
ach
activ
ity fa
ctor
Coal
stor
age
EPA,
Inve
ntor
y of
Sou
rces
and
Sink
s, an
nexe
s, Ta
ble
A-12
9 NR
EP
A, In
vent
ory
of S
ourc
es a
nd
Sink
s, an
nexe
s, Se
ctio
n 3.
4.
Met
hodo
logy
for E
stim
atin
g CH
4 Em
issio
ns fr
om C
oal M
inin
g
CH4 =
tons
of c
oal
stor
ed *
0.2
75 lb
s CH 4
pe
r ton
stor
ed (M
onta
na/W
yom
ing
surf
ace
min
e so
urce
)
Flue
-gas
De
sulfu
rizat
ion
(FGD
) EP
A, In
vent
ory
of S
ourc
es a
nd Si
nks,
Sect
ion
4.4
Oth
er P
roce
ss U
ses o
f Ca
rbon
ates
NR
EPA,
Inve
ntor
y of
US
Sour
ces
and
Sink
s, Se
ctio
n 4.
4 O
ther
Pr
oces
s Use
s of C
arbo
nate
s
CO2 =
lim
esto
ne u
se *
0.4
39 to
ns C
O 2/t
on
of li
mes
tone
inpu
t, 0.
477
tons
CO 2
/ton
of
dolo
mite
inpu
t Hy
droe
lect
ric
rese
rvoi
rs
Inte
rgov
ernm
enta
l Pan
el o
n Cl
imat
e Ch
ange
(IPC
C), 2
019
Refin
emen
t to
the
2006
IPCC
Gui
delin
es fo
r Nat
iona
l Gr
eenh
ouse
Gas
Inve
ntor
ies V
olum
e 4
Agric
ultu
re, F
ores
try
and
Oth
er La
nd
Use,
Tab
les 7
.9 a
nd 7
.13
NR
IPCC
, 201
9 Re
finem
ent t
o th
e
2006
IPCC
Gui
delin
es fo
r Na
tiona
l Gre
enho
use
Gas
Inve
ntor
ies V
olum
e 4
Agric
ultu
re, F
ores
try
and
Oth
er
Land
Use
CH4 =
rese
rvoi
r sur
face
are
a *
71.6
lbs
CH4/
acre
/yea
r; CO
2 = re
serv
oir s
urfa
ce
area
* 2
.39
tons
CO 2
/acr
e/ye
ar
Elec
tric
ity
tran
smiss
ion
and
dist
ribut
ion
EPA,
Inve
ntor
y of
Sou
rces
and
Sink
s, m
ain
anne
x ta
ble
4-10
7 NR
M
PCA,
Gre
enho
use
Gas
Emiss
ions
in M
inne
sota
:197
0 –
2008
, p-g
en4-
08
SF6 =
mile
s of t
rans
miss
ion
lines
* 0
.49
lbs S
F 6/m
ile o
f tra
nsm
issio
n lin
es
Man
ufac
turin
g an
d M
inin
g Se
ctor
Ac
id w
ater
trea
tmen
t, ac
id n
eutr
aliza
tion
EPA,
Inve
ntor
y of
Sou
rces
and
Sink
s, ch
apte
r 4.4
Oth
er P
roce
ss U
ses o
f Ca
rbon
ates
NR
EPA,
Inve
ntor
y of
Sou
rces
and
Si
nks,
Sect
ion
4.4
Oth
er P
roce
ss
Uses
of C
arbo
nate
s
GHGs
= li
mes
tone
inpu
t * 0
.439
tons
CO
2/to
n of
lim
esto
ne in
put,
0.47
73 to
ns
CO2/
ton
dolo
mite
inpu
t Ac
rylo
nitr
ile
prod
uctio
n EP
A, In
vent
ory
of S
ourc
es a
nd Si
nks,
Sect
ion
4.13
Pet
roch
emica
l Pro
duct
ion
NR
EPA,
Inve
ntor
y of
Sou
rces
and
Si
nks,
Sect
ion
4.13
Pe
troc
hem
ical
Pro
duct
ion
CO2 =
acr
ylon
itrile
(CH 2
CHCN
) pro
duce
d *
1 to
n CO
2/to
n of
CH 2
CHCN
pro
duce
d; C
H 4
= ac
rylo
nitr
ile p
rodu
ced
* 0.
36 lb
s CH
4/to
n CH
2CHC
N of
pro
duce
d
Ex. 1 to MCEA Comments-Grace Dairy, Chippewa County
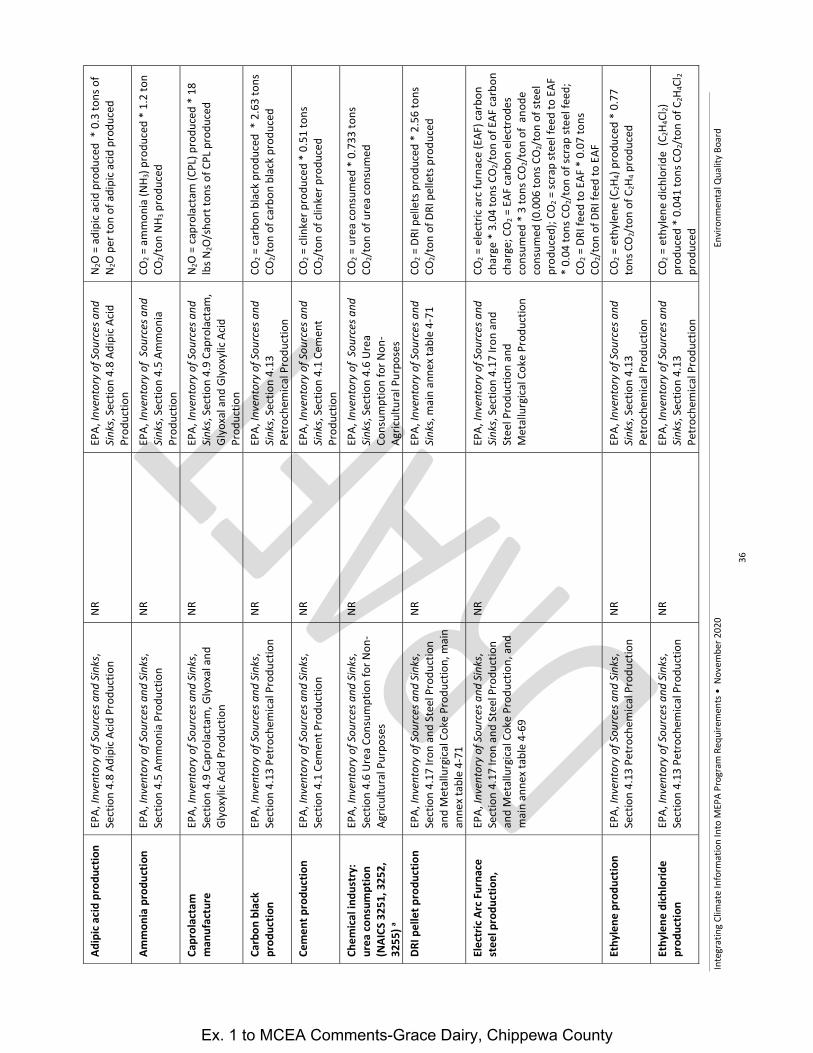
Inte
grat
ing
Clim
ate
Info
rmat
ion
Into
MEP
A Pr
ogra
m R
equi
rem
ents
• N
ovem
ber 2
020
Envi
ronm
enta
l Qua
lity
Boar
d
36
Adip
ic ac
id p
rodu
ctio
n EP
A, In
vent
ory
of S
ourc
es a
nd Si
nks,
Sect
ion
4.8
Adip
ic Ac
id P
rodu
ctio
n NR
EP
A, In
vent
ory
of S
ourc
es a
nd
Sink
s, Se
ctio
n 4.
8 Ad
ipic
Acid
Pr
oduc
tion
N 2O
= a
dipi
c aci
d pr
oduc
ed *
0.3
tons
of
N 2O
per
ton
of a
dipi
c acid
pro
duce
d
Amm
onia
pro
duct
ion
EPA,
Inve
ntor
y of
Sou
rces
and
Sink
s, Se
ctio
n 4.
5 Am
mon
ia P
rodu
ctio
n NR
EP
A, In
vent
ory
of S
ourc
es a
nd
Sink
s, Se
ctio
n 4.
5 Am
mon
ia
Prod
uctio
n
CO2 =
am
mon
ia (N
H 3) p
rodu
ced
* 1.
2 to
n CO
2/to
n NH
3 pro
duce
d
Capr
olac
tam
m
anuf
actu
re
EPA,
Inve
ntor
y of
Sou
rces
and
Sink
s, Se
ctio
n 4.
9 Ca
prol
acta
m, G
lyox
al a
nd
Glyo
xylic
Acid
Pro
duct
ion
NR
EPA,
Inve
ntor
y of
Sou
rces
and
Si
nks,
Sect
ion
4.9
Capr
olac
tam
, Gl
yoxa
l and
Gly
oxyl
ic Ac
id
Prod
uctio
n
N 2O
= c
apro
lact
am (C
PL) p
rodu
ced
* 18
lb
s N2O
/sho
rt to
ns o
f CPL
pro
duce
d
Carb
on b
lack
pr
oduc
tion
EPA,
Inve
ntor
y of
Sou
rces
and
Sink
s, Se
ctio
n 4.
13 P
etro
chem
ical P
rodu
ctio
n NR
EP
A, In
vent
ory
of S
ourc
es a
nd
Sink
s, Se
ctio
n 4.
13
Petr
oche
mic
al P
rodu
ctio
n
CO2 =
car
bon
blac
k pr
oduc
ed *
2.6
3 to
ns
CO2/
ton
of ca
rbon
bla
ck p
rodu
ced
Cem
ent p
rodu
ctio
n EP
A, In
vent
ory
of S
ourc
es a
nd Si
nks,
Sect
ion
4.1
Cem
ent P
rodu
ctio
n NR
EP
A, In
vent
ory
of S
ourc
es a
nd
Sink
s, Se
ctio
n 4.
1 Ce
men
t Pr
oduc
tion
CO2 =
clin
ker p
rodu
ced
* 0.
51 to
ns
CO2/
ton
of cl
inke
r pro
duce
d
Chem
ical i
ndus
try:
ur
ea co
nsum
ptio
n (N
AICS
325
1, 3
252,
32
55) a
EPA,
Inve
ntor
y of
Sou
rces
and
Sink
s, Se
ctio
n 4.
6 Ur
ea C
onsu
mpt
ion
for N
on-
Agric
ultu
ral P
urpo
ses
NR
EPA,
Inve
ntor
y of
Sou
rces
and
Si
nks,
Sect
ion
4.6
Urea
Co
nsum
ptio
n fo
r Non
-Ag
ricul
tura
l Pur
pose
s
CO2 =
ure
a co
nsum
ed *
0.7
33 to
ns
CO2/
ton
of u
rea
cons
umed
DRI p
elle
t pro
duct
ion
EPA,
Inve
ntor
y of
Sou
rces
and
Sink
s, Se
ctio
n 4.
17 Ir
on a
nd S
teel
Pro
duct
ion
and
Met
allu
rgica
l Cok
e Pr
oduc
tion,
mai
n an
nex t
able
4-7
1
NR
EPA,
Inve
ntor
y of
Sou
rces
and
Si
nks,
mai
n an
nex t
able
4-7
1 CO
2 = D
RI p
elle
ts p
rodu
ced
* 2.
56 to
ns
CO2/
ton
of D
RI p
elle
ts p
rodu
ced
Elec
tric
Arc F
urna
ce
stee
l pro
duct
ion,
EP
A, In
vent
ory
of S
ourc
es a
nd Si
nks,
Sect
ion
4.17
Iron
and
Ste
el P
rodu
ctio
n an
d M
etal
lurg
ical C
oke
Prod
uctio
n, a
nd
mai
n an
nex
tabl
e 4-
69
NR
EPA,
Inve
ntor
y of
Sou
rces
and
Si
nks,
Sect
ion
4.17
Iron
and
St
eel P
rodu
ctio
n an
d M
etal
lurg
ical C
oke
Prod
uctio
n
CO2 =
ele
ctric
arc
furn
ace
(EAF
) car
bon
char
ge *
3.0
4 to
ns C
O 2/t
on o
f EAF
carb
on
char
ge; C
O 2 =
EAF
carb
on e
lect
rode
s co
nsum
ed *
3 to
ns C
O 2/t
on o
f an
ode
cons
umed
(0.0
06 to
ns C
O 2/t
on o
f ste
el
prod
uced
); CO
2 = sc
rap
stee
l fee
d to
EAF
*
0.04
tons
CO 2
/ton
of s
crap
stee
l fee
d;
CO2 =
DRI
feed
to E
AF *
0.0
7 to
ns
CO2/
ton
of D
RI fe
ed to
EAF
Et
hyle
ne p
rodu
ctio
n EP
A, In
vent
ory
of S
ourc
es a
nd Si
nks,
Sect
ion
4.13
Pet
roch
emica
l Pro
duct
ion
NR
EPA,
Inve
ntor
y of
Sou
rces
and
Si
nks,
Sect
ion
4.13
Pe
troc
hem
ical
Pro
duct
ion
CO2 =
eth
ylen
e (C
2H4)
prod
uced
* 0
.77
tons
CO 2
/ton
of C
2H4 p
rodu
ced
Ethy
lene
dich
lorid
e pr
oduc
tion
EPA,
Inve
ntor
y of
Sou
rces
and
Sink
s, Se
ctio
n 4.
13 P
etro
chem
ical P
rodu
ctio
n NR
EP
A, In
vent
ory
of S
ourc
es a
nd
Sink
s, Se
ctio
n 4.
13
Petr
oche
mic
al P
rodu
ctio
n
CO2 =
eth
ylen
e di
chlo
ride
(C2H
4Cl 2)
pr
oduc
ed *
0.0
41 to
ns C
O 2/t
on o
f C2H
4Cl 2
prod
uced
Ex. 1 to MCEA Comments-Grace Dairy, Chippewa County

Inte
grat
ing
Clim
ate
Info
rmat
ion
Into
MEP
A Pr
ogra
m R
equi
rem
ents
• N
ovem
ber 2
020
Envi
ronm
enta
l Qua
lity
Boar
d
37
Ethy
lene
oxi
de
prod
uctio
n EP
A, In
vent
ory
of S
ourc
es a
nd Si
nks,
Sect
ion
4.13
Pet
roch
emica
l Pro
duct
ion
NR
EPA,
Inve
ntor
y of
Sou
rces
and
Si
nks,
Sect
ion
4.13
Pe
troc
hem
ical
Pro
duct
ion
CO2 =
eth
ylen
e ox
ide
(EtO
) pro
duce
d *
0.
46 to
ns C
O 2/t
on o
f EtO
pro
duce
d
Flux
Sto
ne u
se in
m
etal
lurg
ical
furn
aces
EP
A, In
vent
ory
of S
ourc
es a
nd Si
nks,
Sect
ion
4.4
Oth
er P
roce
ss U
ses o
f Ca
rbon
ates
NR
EPA,
Inve
ntor
y of
Sou
rces
and
Si
nks,
Sect
ion
4.4
Oth
er P
roce
ss
Uses
of C
arbo
nate
s
CO2 =
lim
esto
ne in
put *
0.4
39 to
ns
CO2/
ton
of li
mes
tone
inpu
t, do
lom
ite
inpu
t * 0
.477
tons
CO 2
/ton
dol
omite
in
put
Glas
s pro
duct
ion
EPA,
Inve
ntor
y of
Sou
rces
and
Sink
s, Se
ctio
n 4.
3 Gl
ass P
rodu
ctio
n NR
EP
A, In
vent
ory
of S
ourc
es a
nd
Sink
s, Se
ctio
n 4.
3 Gl
ass
Prod
uctio
n
CO2 =
lim
esto
ne in
put *
0.4
39 to
ns
CO2/
ton
of li
mes
tone
inpu
t, 0.
477
tons
CO
2/to
n of
dol
omite
inpu
t, 0.
415
tons
CO
2/to
n of
soda
ash
inpu
t In
dust
rial s
olve
nt u
se
(ele
ctro
nics
, pre
cisio
n cle
anin
g)
EPA,
Inve
ntor
y of
Sou
rces
and
Sink
s, m
ain
anne
x, S
ectio
n 3.
9. M
etho
dolo
gy
for E
stim
atin
g HF
C an
d PF
C Em
issio
ns
from
Sub
stitu
tion
of O
zone
Dep
letin
g Su
bsta
nces
- So
lven
ts
NR
EPA,
Inve
ntor
y of
Sou
rces
and
Si
nks,
mai
n an
nex,
Sec
tion
3.9.
M
etho
dolo
gy fo
r Est
imat
ing
HFC
and
PFC
Emiss
ions
from
Su
bstit
utio
n of
Ozo
ne D
eple
ting
Subs
tanc
es -
Solv
ents
HFCs
= a
nnua
l pur
chas
es o
f HFC
s as
solv
ent *
90%
ann
ual l
eak
rate
Lime
prod
uctio
n EP
A, In
vent
ory
of S
ourc
es a
nd Si
nks,
Sect
ion
4.2
Lime
Prod
uctio
n NR
EP
A, In
vent
ory
of S
ourc
es a
nd
Sink
s, Se
ctio
n 4.
2 Lim
e Pr
oduc
tion
CO2 =
lim
e (C
aO) p
rodu
ced
* 0.
746
tons
CO
2/to
n of
CaO
pro
duce
d (li
mes
tone
), lim
e pr
oduc
ed 0
.868
tons
/ton
of C
aO
prod
uced
(dol
omite
) M
agne
sium
cast
ing
EPA,
Inve
ntor
y of
Sou
rces
and
Sink
s, m
ain
anne
x ta
ble
4-86
NR
EP
A, In
vent
ory
of S
ourc
es a
nd
Sink
s, Se
ctio
n 4.
20 M
agne
sium
Pr
oduc
tion
and
Proc
essin
g
SF6 =
mag
nesiu
m (M
g) ca
st *
2.1
4 lb
s SF
6/to
n of
Mg
cast
(die
cast
ing)
; m
agne
sium
cast
* 4
lbs S
F 6/t
on o
f Mg;
SF
6 = 2
lbs S
F 6/t
on o
f mag
nesiu
m
(per
man
ent m
old
cast
ing)
; SF 6
=
mag
nesiu
m ca
st *
1 lb
s SF 6
/ ton
of M
g ca
st (a
node
cast
ing)
M
etha
nol p
rodu
ctio
n EP
A, In
vent
ory
of S
ourc
es a
nd Si
nks,
Sect
ion
4.13
Pet
roch
emica
l Pro
duct
ion
NR
EPA,
Inve
ntor
y of
Sou
rces
and
Si
nks,
Sect
ion
4.13
Pe
troc
hem
ical
Pro
duct
ion
CO2 =
met
hano
l pro
duce
d (C
H 3O
H) *
0.6
7 to
ns C
O 2/t
on o
f CH 3
OH
prod
uced
; CO 2
=
met
hano
l pro
duce
d *
4.6
lbs C
H 4/t
on o
f CH
3OH
prod
uced
Ni
tric
acid
pro
duct
ion
EPA,
Inve
ntor
y of
Sou
rces
and
Sink
s, Se
ctio
n 4.
7 Ni
tric
acid
pro
duct
ion
NR
EPA,
Inve
ntor
y of
Sou
rces
and
Si
nks,
Sect
ion
4.7
Nitr
ic a
cid
prod
uctio
n
N 2O
= n
itric
acid
(HNO
3) pr
oduc
ed *
10
.92
lbs N
2O/t
on o
f HNO
3 pro
duce
d
Ex. 1 to MCEA Comments-Grace Dairy, Chippewa County

Inte
grat
ing
Clim
ate
Info
rmat
ion
Into
MEP
A Pr
ogra
m R
equi
rem
ents
• N
ovem
ber 2
020
Envi
ronm
enta
l Qua
lity
Boar
d
38
Peat
min
ing
IPCC
, 201
3 Su
pple
men
t to
the
2006
IPCC
Gu
idel
ines
for N
atio
nal G
reen
hous
e Ga
s In
vent
orie
s: W
etla
nds,
chap
ter 2
, Dr
aine
d In
land
Org
anic
Soils
, Tab
les 2
.1,
2.3.
2.4
and
2.5
EPA,
Inve
ntor
y of
Sou
rces
and
Si
nks,
Sect
ion
6.8
Wet
land
s Re
mai
ning
Wet
land
s
IPCC
, 201
3 Su
pple
men
t to
the
2006
IPCC
Gui
delin
es fo
r Na
tiona
l Gre
enho
use
Gas
Inve
ntor
ies:
Wet
land
s, ch
apte
r 2
CO2 =
pea
t pro
duct
ion
÷ 44
.6 to
ns o
f pea
t pr
oduc
ed a
cre
* 5.
08 to
ns C
O 2/a
cre/
year
CH
4 = a
cres
min
ed *
5.4
4 lb
s CH
4/ac
re/y
ear +
acr
es m
ined
* 5
%
(dra
inag
e di
tche
s as %
of a
rea
min
ed) *
48
3.56
lbs C
H 4/a
cre/
year
N 2
O =
acr
es m
ined
* 0
.42
lbs
N 2O
/acr
e/ye
ar
Poly
uret
hane
, po
lyst
yren
e, p
heno
lic,
poly
olef
in fo
am
man
ufac
ture
EPA,
Inve
ntor
y of
Sou
rces
and
Sink
s, m
ain
anne
x Ta
bles
A-1
52 a
nd A
-153
NR
EP
A, In
vent
ory
of S
ourc
es a
nd
Sink
s, m
ain
anne
x,
Met
hodo
logy
for E
stim
atin
g HF
C an
d PF
C Em
issio
ns fr
om
Subs
titut
ion
of O
zone
Dep
letin
g Su
bsta
nces
– F
oam
Blo
win
g
HFC-
134a
, HFC
-152
a, H
FC-2
45fa
= H
FC
inpu
t to
foam
man
ufac
ture
by
HFC
spec
ies *
% le
akag
e at
man
ufac
ture
Seco
ndar
y le
ad
prod
uctio
n EP
A, In
vent
ory
of S
ourc
es a
nd Si
nks,
Sect
ion
4.21
Lead
Pro
duct
ion
NR
EPA,
Inve
ntor
y of
Sou
rces
and
Si
nks,
Sect
ion
4.21
Lead
Pr
oduc
tion
CO2 =
seco
ndar
y le
ad p
rodu
ced
* 0.
45
tons
CO 2
/ton
s of l
ead
prod
uced
thro
ugh
recy
cled
sour
ces
Sem
icond
ucto
r m
anuf
actu
re
not a
vaila
ble
NR
no si
mpl
ified
met
hodo
logy
is
avai
labl
e; fo
r det
aile
d es
timat
ion
met
hodo
logy
and
de
faul
t fac
tors
, see
40
CFR
part
98
subp
art I
. Ele
ctro
nics
M
anuf
actu
re
not a
vaila
ble
Silic
on C
arbi
de
Cons
umpt
ion
b EP
A, In
vent
ory
of S
ourc
es a
nd Si
nks,
Sect
ion
4.10
Sili
con
Carb
ide
Prod
uctio
n an
d Co
nsum
ptio
n
NR
EPA,
Inve
ntor
y of
Sou
rces
and
Si
nks,
Sect
ion
4.10
Sili
con
Carb
ide
Prod
uctio
n an
d Co
nsum
ptio
n
CO2 =
silic
on ca
rbid
e (S
iC) c
onsu
med
*
1.16
ton
CO2/
ton
of S
iC co
nsum
ed
Silic
on C
arbi
de
Prod
uctio
n EP
A, In
vent
ory
of S
ourc
es a
nd Si
nks,
Sect
ion
4.10
Sili
con
Carb
ide
Prod
uctio
n an
d Co
nsum
ptio
n
NR
EPA,
Inve
ntor
y of
Sou
rces
and
Si
nks,
Sect
ion
4.10
Sili
con
Carb
ide
Prod
uctio
n an
d Co
nsum
ptio
n
CO2 =
silic
on ca
rbid
e (S
iC) p
rodu
ced
* 2.
62 to
n CO
2/to
n of
SiC
pro
duce
d; C
H 4 =
sil
icon
carb
ide
prod
uced
* 2
3.2
lbs
CH4/
ton
of S
iC p
rodu
ced
Ta
coni
te p
elle
t pr
oduc
tion
EPA,
Inve
ntor
y of
Sou
rces
and
Sink
s, Se
ctio
n 4.
17 Ir
on a
nd S
teel
Pro
duct
ion
and
Met
allu
rgica
l Cok
e Pr
oduc
tion,
mai
n an
nex t
able
4-7
1
NR
EPA,
Inve
ntor
y of
Sou
rces
and
Si
nks,
mai
n an
nex
tabl
e 4-
71
CO2 =
taco
nite
pel
lets
pro
duce
d *
0.1
1 to
ns C
O 2/t
on o
f tac
onite
pel
lets
pr
oduc
ed
Tita
nium
dio
xide
pr
oduc
tion
EPA,
Inve
ntor
y of
Sou
rces
and
Sink
s, Se
ctio
n 4.
11 T
itani
um D
ioxi
de
Prod
uctio
n
NR
EPA,
Inve
ntor
y of
Sou
rces
and
Si
nks,
sect
ion
4.11
Tita
nium
Di
oxid
e Pr
oduc
tion
CO2 =
tita
nium
dio
xide
(TiO
2) pr
oduc
ed *
1.
34 to
ns C
O 2/ t
on o
f TiO
2 pr
oduc
ed
Ex. 1 to MCEA Comments-Grace Dairy, Chippewa County

Inte
grat
ing
Clim
ate
Info
rmat
ion
Into
MEP
A Pr
ogra
m R
equi
rem
ents
• N
ovem
ber 2
020
Envi
ronm
enta
l Qua
lity
Boar
d
39
Build
ings
Sec
tor (
com
mer
cial,
inst
itutio
nal,
indu
stria
l bui
ldin
gs)
Fire
supp
ress
ion
EPA,
Inve
ntor
y of
Sou
rces
and
Sink
s, m
ain
anne
x, M
etho
dolo
gy fo
r Es
timat
ing
HFC
and
PFC
Emiss
ions
from
Su
bstit
utio
n of
Ozo
ne D
eple
ting
Subs
tanc
es –
Fire
ext
ingu
ishin
g
NR
EPA,
Inve
ntor
y of
Sou
rces
and
Si
nks,
mai
n an
nex,
M
etho
dolo
gy fo
r Est
imat
ing
HFC
and
PFC
Emiss
ions
from
Su
bstit
utio
n of
Ozo
ne D
eple
ting
Subs
tanc
es –
Fire
ext
ingu
ishin
g
HFC-
23, H
FC-1
25, H
FC-2
27ea
= st
ock
of
chem
ical f
ire e
xtin
guish
ant (
flood
ing
syst
ems)
by
HFC
spec
ies *
2.5
% a
nnua
l le
ak ra
te
Refr
iger
atio
n an
d sp
ace
cool
ing
EPA,
Inve
ntor
y of
Sou
rces
and
Sink
s, m
ain
anne
x Ta
bles
A-1
47 a
nd A
-148
EP
A, A
ccou
ntin
g To
ol to
Su
ppor
t Fed
eral
Rep
ortin
g of
Hy
drof
luor
ocar
bon
Emiss
ions
: Su
ppor
ting
Docu
men
tatio
n,
Oct
ober
201
6, T
able
s 3-6
(re
frige
rant
char
ge) a
nd T
able
3-
10 (r
efrig
eran
t cha
rge
per
squa
re fo
ot o
f flo
or sp
ace)
EPA,
Inve
ntor
y of
Sou
rces
and
Si
nks,
mai
n an
nex,
Sec
tion
3.9.
M
etho
dolo
gy fo
r Est
imat
ing
HFC
and
PFC
Emiss
ions
from
Su
bstit
utio
n of
Ozo
ne D
eple
ting
Subs
tanc
es –
Ref
riger
atio
n an
d Ai
r Con
ditio
ning
HFC-
32, H
FC-1
25, H
FC-1
34a,
HFC
-143
a,
or H
FC-1
52a
= (in
itial
refri
gera
nt ch
arge
pe
r coo
ling
or re
frige
ratio
n un
it by
type
*
annu
al le
akag
e ra
te p
er u
nit a
cros
s all
equi
pmen
t yea
rs b
y ty
pe)/
equi
pmen
t lif
etim
e *
HFC
com
pone
nts o
f ref
riger
ant
by H
FC sp
ecie
s by
wei
ght
Agric
ultu
ral N
onco
mbu
stio
n Pr
oces
s Sou
rces
Liv
esto
ck (e
nter
ic fe
rmen
tatio
n)
EPA,
Inve
ntor
y of
US
Sour
ces a
nd S
inks
of
Gre
enho
use
Gase
s, m
ain
anne
x Ta
bles
A-1
76 (E
miss
ion
Fact
ors f
or
Cattl
e by
Ani
mal
Typ
e an
d St
ate)
and
A-
179
NR
EPA,
Inve
ntor
y of
US
Sour
ces
and
Sink
s of G
reen
hous
e Ga
ses,
mai
n an
nex
tabl
e 5-
9
CH4 =
hea
d of
live
stoc
k on
feed
lot *
lbs
CH4 e
miss
ions
/yea
r by
lives
tock
type
and
siz
e
Man
ure
stor
age
EP
A, In
vent
ory
of U
S So
urce
s and
Sin
ks
of G
reen
hous
e Ga
ses,
mai
n an
nex
Tabl
es A
-185
(max
imum
CH 4
gen
erat
ion
pote
ntia
l) A-
191
(Met
hane
Con
vers
ion
Fact
ors [
MCF
s]) A
-192
(MCF
s, liq
uid
syst
ems b
y st
ate)
, A-1
93, a
nd A
-194
EPA,
Inve
ntor
y of
US
Sour
ces
and
Sink
s of G
reen
hous
e Ga
ses,
mai
n an
nex
Tabl
es A
-185
Was
te
Char
acte
ristic
s Dat
a , A
-186
, A-
187,
and
A-1
94
EPA,
Inve
ntor
y of
US
Sour
ces
and
Sink
s of G
reen
hous
e Ga
ses,
mai
n an
nex
Sect
ion
3.11
. M
etho
dolo
gy fo
r Est
imat
ing
CH4 a
nd N
2O E
miss
ions
from
M
anur
e M
anag
emen
t
CH4 =
hea
d of
live
stoc
k *
anim
al
livew
eigh
t by
lives
tock
type
* lb
s VS
excr
eted
per
lbs o
f liv
ewei
ght b
y liv
esto
ck ty
pe *
ft3 C
H 4 p
er lb
s VS
excr
eted
* m
etha
ne co
nver
sion
fact
or b
y m
anur
e st
orag
e ty
pe;
N
2O =
(hea
d of
live
stoc
k *
anim
al li
vew
eigh
t by
lives
tock
type
* lb
s nitr
ogen
[N] e
xcre
ted
per l
bs o
f liv
ewei
ght b
y liv
esto
ck ty
pe *
(N
2O-N
dire
ct e
miss
ion
fact
or b
y m
anur
e st
orag
e ty
pe +
(% N
H 3-N
vol
atili
zed
* 0.
01 lb
s N2O
-N/lb
N v
olat
ilize
d +
% N
O 3-N
le
ache
d *
0.00
75 lb
s N2O
-N/lb
N le
ache
d)
* 1.
5711
lbs N
2O p
er lb
s N
Ex. 1 to MCEA Comments-Grace Dairy, Chippewa County
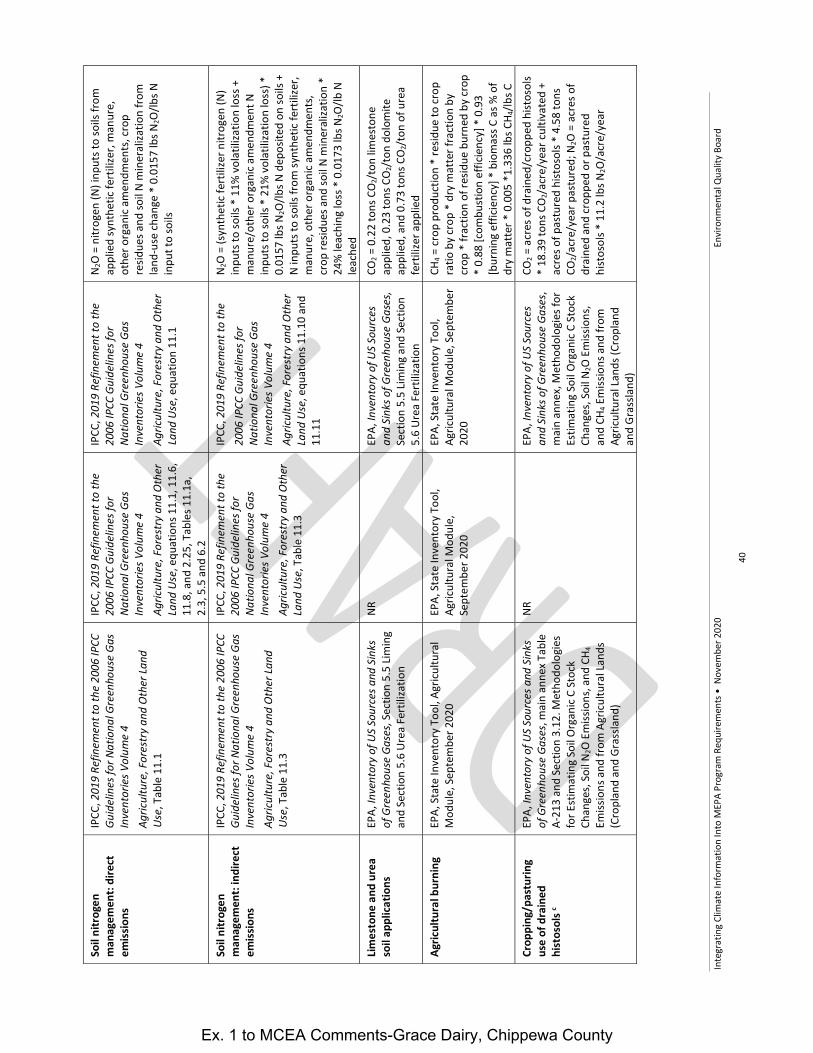
Inte
grat
ing
Clim
ate
Info
rmat
ion
Into
MEP
A Pr
ogra
m R
equi
rem
ents
• N
ovem
ber 2
020
Envi
ronm
enta
l Qua
lity
Boar
d
40
Soil
nitr
ogen
m
anag
emen
t: di
rect
em
issio
ns
IPCC
, 201
9 Re
finem
ent t
o th
e 20
06 IP
CC
Guid
elin
es fo
r Nat
iona
l Gre
enho
use
Gas
Inve
ntor
ies V
olum
e 4
Agric
ultu
re, F
ores
try
and
Oth
er La
nd
Use,
Tab
le 1
1.1
IPCC
, 201
9 Re
finem
ent t
o th
e 20
06 IP
CC G
uide
lines
for
Natio
nal G
reen
hous
e Ga
s In
vent
orie
s Vol
ume
4 Ag
ricul
ture
, For
estr
y an
d O
ther
La
nd U
se, e
quat
ions
11.
1, 1
1.6,
11
.8, a
nd 2
.25,
Tab
les 1
1.1a
, 2.
3, 5
.5 a
nd 6
.2
IPCC
, 201
9 Re
finem
ent t
o th
e 20
06 IP
CC G
uide
lines
for
Natio
nal G
reen
hous
e Ga
s In
vent
orie
s Vol
ume
4 Ag
ricul
ture
, For
estr
y an
d O
ther
La
nd U
se, e
quat
ion
11.1
N 2O
= n
itrog
en (N
) inp
uts t
o so
ils fr
om
appl
ied
synt
hetic
fert
ilize
r, m
anur
e,
othe
r org
anic
amen
dmen
ts, c
rop
resid
ues a
nd so
il N
min
eral
izatio
n fro
m
land
-use
chan
ge *
0.0
157
lbs N
2O/lb
s N
inpu
t to
soils
Soil
nitr
ogen
m
anag
emen
t: in
dire
ct
emiss
ions
IPCC
, 201
9 Re
finem
ent t
o th
e 20
06 IP
CC
Guid
elin
es fo
r Nat
iona
l Gre
enho
use
Gas
Inve
ntor
ies V
olum
e 4
Agric
ultu
re, F
ores
try
and
Oth
er La
nd
Use,
Tab
le 1
1.3
IPCC
, 201
9 Re
finem
ent t
o th
e 20
06 IP
CC G
uide
lines
for
Natio
nal G
reen
hous
e Ga
s In
vent
orie
s Vol
ume
4 Ag
ricul
ture
, For
estr
y an
d O
ther
La
nd U
se, T
able
11.
3
IPCC
, 201
9 Re
finem
ent t
o th
e
2006
IPCC
Gui
delin
es fo
r Na
tiona
l Gre
enho
use
Gas
Inve
ntor
ies V
olum
e 4
Agric
ultu
re, F
ores
try
and
Oth
er
Land
Use
, equ
atio
ns 1
1.10
and
11
.11
N 2O
= (s
ynth
etic
fert
ilize
r nitr
ogen
(N)
inpu
ts to
soils
* 1
1% v
olat
iliza
tion
loss
+
man
ure/
othe
r org
anic
amen
dmen
t N
inpu
ts to
soils
* 2
1% v
olat
iliza
tion
loss
) *
0.01
57 lb
s N2O
/lbs N
dep
osite
d on
soils
+
N in
puts
to so
ils fr
om sy
nthe
tic fe
rtili
zer,
man
ure,
oth
er o
rgan
ic am
endm
ents
, cr
op re
sidue
s and
soil
N m
iner
aliza
tion
* 24
% le
achi
ng lo
ss *
0.0
173
lbs N
2O/lb
N
leac
hed
Limes
tone
and
ure
a so
il ap
plic
atio
ns
EPA,
Inve
ntor
y of
US
Sour
ces a
nd S
inks
of
Gre
enho
use
Gase
s, Se
ctio
n 5.
5 Lim
ing
and
Sect
ion
5.6
Urea
Fer
tiliza
tion
NR
EPA,
Inve
ntor
y of
US
Sour
ces
and
Sink
s of G
reen
hous
e Ga
ses,
Sect
ion
5.5
Limin
g an
d Se
ctio
n 5.
6 Ur
ea F
ertil
izatio
n
CO2 =
0.2
2 to
ns C
O 2/t
on li
mes
tone
ap
plie
d, 0
.23
tons
CO 2
/ton
dol
omite
ap
plie
d, a
nd 0
.73
tons
CO 2
/ton
of u
rea
fert
ilize
r app
lied
Agric
ultu
ral b
urni
ng
EPA,
Sta
te In
vent
ory
Tool
, Agr
icultu
ral
Mod
ule,
Sep
tem
ber 2
020
EPA,
Sta
te In
vent
ory
Tool
, Ag
ricul
tura
l Mod
ule,
Se
ptem
ber 2
020
EPA,
Sta
te In
vent
ory
Tool
, Ag
ricul
tura
l Mod
ule,
Sep
tem
ber
2020
CH4 =
cro
p pr
oduc
tion
* re
sidue
to cr
op
ratio
by
crop
* d
ry m
atte
r fra
ctio
n by
cr
op *
frac
tion
of re
sidue
bur
ned
by cr
op
* 0.
88 [c
ombu
stio
n ef
ficie
ncy]
* 0
.93
[bur
ning
effi
cien
cy] *
bio
mas
s C a
s % o
f dr
y m
atte
r * 0
.005
*1.
336
lbs C
H 4/lb
s C
Crop
ping
/pas
turin
g us
e of
dra
ined
hi
stos
ols c
EPA,
Inve
ntor
y of
US
Sour
ces a
nd S
inks
of
Gre
enho
use
Gase
s, m
ain
anne
x Tab
le
A-21
3 an
d Se
ctio
n 3.
12. M
etho
dolo
gies
fo
r Est
imat
ing
Soil
Org
anic
C St
ock
Chan
ges,
Soil
N 2O
Em
issio
ns, a
nd C
H 4
Emiss
ions
and
from
Agr
icultu
ral L
ands
(C
ropl
and
and
Gras
sland
)
NR
EPA,
Inve
ntor
y of
US
Sour
ces
and
Sink
s of G
reen
hous
e Ga
ses,
mai
n an
nex,
Met
hodo
logi
es fo
r Es
timat
ing
Soil
Org
anic
C St
ock
Chan
ges,
Soil
N 2O
Em
issio
ns,
and
CH4 E
miss
ions
and
from
Ag
ricul
tura
l Lan
ds (C
ropl
and
and
Gras
sland
)
CO2 =
acr
es o
f dra
ined
/cro
pped
hist
osol
s *
18.3
9 to
ns C
O 2/a
cre/
year
culti
vate
d +
acre
s of p
astu
red
hist
osol
s * 4
.58
tons
CO
2/ac
re/y
ear p
astu
red;
N2O
= a
cres
of
drai
ned
and
crop
ped
or p
astu
red
hist
osol
s * 1
1.2
lbs N
2O/a
cre/
year
Ex. 1 to MCEA Comments-Grace Dairy, Chippewa County
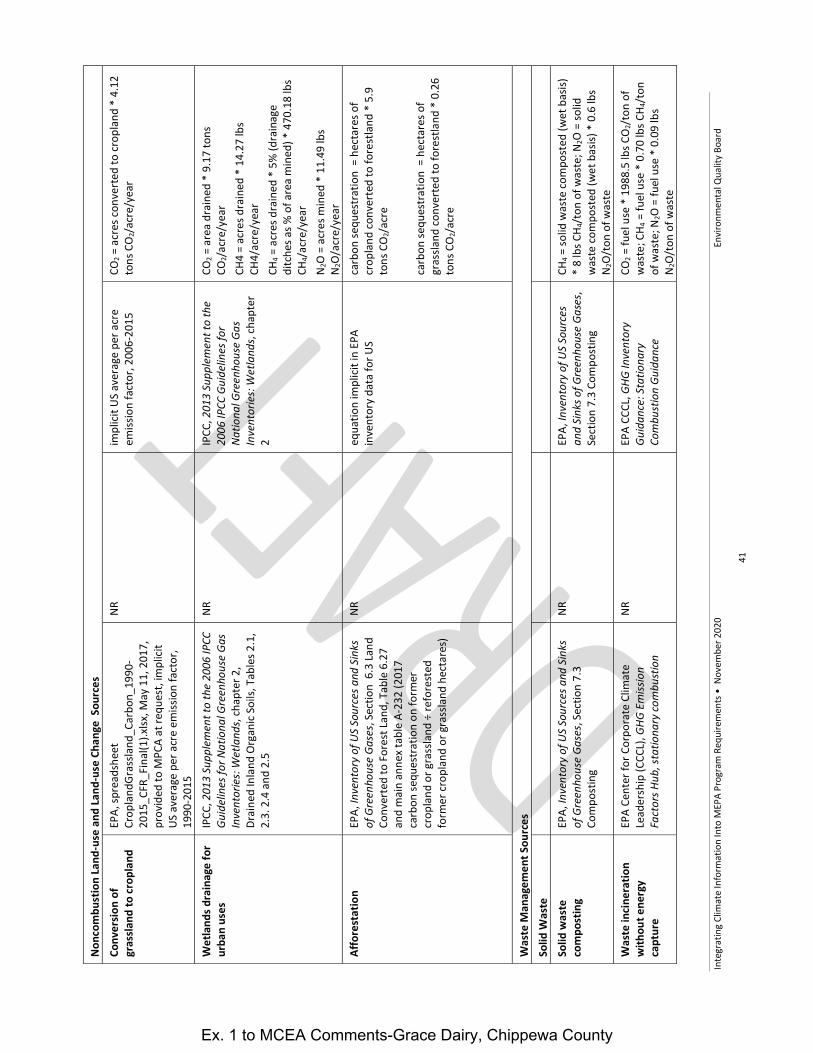
Inte
grat
ing
Clim
ate
Info
rmat
ion
Into
MEP
A Pr
ogra
m R
equi
rem
ents
• N
ovem
ber 2
020
Envi
ronm
enta
l Qua
lity
Boar
d
41
Nonc
ombu
stio
n La
nd-u
se a
nd L
and-
use
Chan
ge S
ourc
es
Conv
ersio
n of
gr
assla
nd to
crop
land
EP
A, sp
read
shee
t Cr
opla
ndGr
assla
nd_C
arbo
n_19
90-
2015
_CFR
_Fin
al(1
).xlsx
, May
11,
201
7,
prov
ided
to M
PCA
at re
ques
t, im
plici
t US
ave
rage
per
acr
e em
issio
n fa
ctor
, 19
90-2
015
NR
impl
icit U
S av
erag
e pe
r acr
e em
issio
n fa
ctor
, 200
6-20
15
CO2 =
acr
es co
nver
ted
to cr
opla
nd *
4.1
2 to
ns C
O 2/a
cre/
year
Wet
land
s dra
inag
e fo
r ur
ban
uses
IP
CC, 2
013
Supp
lem
ent t
o th
e 20
06 IP
CC
Guid
elin
es fo
r Nat
iona
l Gre
enho
use
Gas
Inve
ntor
ies:
Wet
land
s, ch
apte
r 2,
Drai
ned
Inla
nd O
rgan
ic So
ils, T
able
s 2.1
, 2.
3. 2
.4 a
nd 2
.5
NR
IPCC
, 201
3 Su
pple
men
t to
the
2006
IPCC
Gui
delin
es fo
r Na
tiona
l Gre
enho
use
Gas
Inve
ntor
ies:
Wet
land
s, ch
apte
r 2
CO2 =
are
a dr
aine
d *
9.17
tons
CO
2/ac
re/y
ear
CH4
= ac
res d
rain
ed *
14.
27 lb
s CH
4/ac
re/y
ear
CH4 =
acr
es d
rain
ed *
5%
(dra
inag
e di
tche
s as %
of a
rea
min
ed) *
470
.18
lbs
CH4/
acre
/yea
r N 2
O =
acr
es m
ined
* 1
1.49
lbs
N 2O
/acr
e/ye
ar
Affo
rest
atio
n EP
A, In
vent
ory
of U
S So
urce
s and
Sin
ks
of G
reen
hous
e Ga
ses,
Sect
ion
6.3
Land
Co
nver
ted
to F
ores
t Lan
d, T
able
6.2
7 an
d m
ain
anne
x tab
le A
-232
(201
7 ca
rbon
sequ
estr
atio
n on
form
er
crop
land
or g
rass
land
÷ re
fore
sted
fo
rmer
crop
land
or g
rass
land
hec
tare
s)
NR
equa
tion
impl
icit i
n EP
A in
vent
ory
data
for U
S ca
rbon
sequ
estr
atio
n =
hec
tare
s of
crop
land
conv
erte
d to
fore
stla
nd *
5.9
to
ns C
O 2/a
cre
carb
on se
ques
trat
ion
= h
ecta
res o
f gr
assla
nd co
nver
ted
to fo
rest
land
* 0
.26
tons
CO 2
/acr
e
Was
te M
anag
emen
t Sou
rces
So
lid W
aste
So
lid w
aste
co
mpo
stin
g EP
A, In
vent
ory
of U
S So
urce
s and
Sin
ks
of G
reen
hous
e Ga
ses,
Sect
ion
7.3
Com
post
ing
NR
EPA,
Inve
ntor
y of
US
Sour
ces
and
Sink
s of G
reen
hous
e Ga
ses,
Sect
ion
7.3
Com
post
ing
CH4 =
solid
was
te co
mpo
sted
(wet
bas
is)
* 8
lbs C
H 4/t
on o
f was
te; N
2O =
solid
w
aste
com
post
ed (w
et b
asis)
* 0
.6 lb
s N 2
O/t
on o
f was
te
Was
te in
cine
ratio
n w
ithou
t ene
rgy
capt
ure
EPA
Cent
er fo
r Cor
pora
te C
limat
e Le
ader
ship
(CCC
L), G
HG E
miss
ion
Fact
ors H
ub, s
tatio
nary
com
bust
ion
NR
EPA
CCCL
, GHG
Inve
ntor
y Gu
idan
ce: S
tatio
nary
Co
mbu
stio
n Gu
idan
ce
CO2 =
fuel
use
* 1
988.
5 lb
s CO
2/to
n of
w
aste
; CH 4
= fu
el u
se *
0.7
0 lb
s CH 4
/ton
of
was
te; N
2O =
fuel
use
* 0
.09
lbs
N 2O
/ton
of w
aste
Ex. 1 to MCEA Comments-Grace Dairy, Chippewa County

Inte
grat
ing
Clim
ate
Info
rmat
ion
Into
MEP
A Pr
ogra
m R
equi
rem
ents
• N
ovem
ber 2
020
Envi
ronm
enta
l Qua
lity
Boar
d
42
Oth
er
Cent
ral d
omes
tic
was
tew
ater
trea
tmen
t (a
naer
obic
)
EPA,
Inve
ntor
y of
US
Sour
ces a
nd S
inks
of
Gre
enho
use
Gase
s, Se
ctio
n 7.
2 W
aste
wat
er T
reat
men
t
EPA,
Inve
ntor
y of
US
Sour
ces
and
Sink
s of G
reen
hous
e Ga
ses,
EPA-
430-
R-19
-001
, Sec
tion
7.2
Was
tew
ater
Tre
atm
ent
EPA,
Inve
ntor
y of
US
Sour
ces
and
Sink
s of G
reen
hous
e Ga
ses,
EPA-
430-
R-19
-001
, Sec
tion
7.2
Was
tew
ater
Tre
atm
ent
CH4 =
pop
ulat
ion
serv
ed *
lbs
BOD/
capi
ta/y
ear *
% o
f was
tew
ater
to
anae
robi
c tre
atm
ent *
(% w
ithou
t pr
imar
y tr
eatm
ent +
[% w
ith p
rimar
y tr
eatm
ent *
{1 –
BOD
rem
oved
in
prim
ary
trea
tmen
t}]) *
0.6
lbs C
H 4/lb
s BO
D *
0.8
[MCF
] + g
allo
ns o
f was
tew
ater
flo
w to
ana
erob
ic di
gest
ers *
ft3 C
H 4/g
al
of w
aste
wat
er fl
ow *
(1 –
0.9
9 [fl
are
dest
ruct
ion
effic
ienc
y])
N 2O
= 0
.019
lbs N
2O/c
apita
/yea
r *
pers
ons s
erve
d by
WW
TPs w
ith
inte
ntio
nal n
itrifi
catio
n/de
nitr
ifica
tion
[N/D
]; 0.
009
lbs N
2O/c
apita
/yea
r, pe
rson
s ser
ved
by W
WTP
s with
out
inte
ntio
nal N
/D
Indu
stria
l was
tew
ater
tr
eatm
ent
EPA,
Inve
ntor
y of
US
Sour
ces a
nd S
inks
of
Gre
enho
use
Gase
s, Se
ctio
n 7.
2 W
aste
wat
er T
reat
men
t
EPA,
Inve
ntor
y of
US
Sour
ces
and
Sink
s of G
reen
hous
e Ga
ses,
Se
ctio
n 7.
2 W
aste
wat
er
Trea
tmen
t
EPA,
Inve
ntor
y of
US
Sour
ces
and
Sink
s of G
reen
hous
e Ga
ses,
Sect
ion
7.2
Was
tew
ater
CH4 =
was
tew
ater
* C
OD [l
b or
gani
c lo
adin
g/ft3 o
f was
tew
ater
by
indu
stry
ty
pe *
% o
f was
tew
ater
man
aged
an
aero
bica
lly *
0.2
5 lb
s CH 4
/lbs C
OD
* 0.
8 (c
orre
ctio
n fa
ctor
) Se
ptic
syst
ems
EPA,
Inve
ntor
y of
US
Sour
ces a
nd S
inks
of
Gre
enho
use
Gase
s, EP
A-43
0-R-
19-
001,
Sec
tion
7.2
Was
tew
ater
Tre
atm
ent
NR
EPA,
Inve
ntor
y of
US
Sour
ces
and
Sink
s of G
reen
hous
e Ga
ses,
Sect
ion
7.2
Was
tew
ater
Tr
eatm
ent
CH4 =
pop
ulat
ion
serv
ed b
y se
ptic
syst
ems *
3.9
kg
CH4/
capi
ta/y
ear
WW
TP d
ischa
rges
EP
A, In
vent
ory
of U
S So
urce
s and
Sin
ks
of G
reen
hous
e Ga
ses,
Sect
ion
7.2
Was
tew
ater
Tre
atm
ent
EPA,
Inve
ntor
y of
US
Sour
ces
and
Sink
s of G
reen
hous
e Ga
ses,
Sect
ion
7.2
Was
tew
ater
Tr
eatm
ent
EPA,
Inve
ntor
y of
US
Sour
ces
and
Sink
s of G
reen
hous
e Ga
ses,
Sect
ion
7.2
Was
tew
ater
Tr
eatm
ent
(pop
ulat
ion
serv
ed *
75.
2 lb
s of p
rote
in
cons
umed
/cap
ita/y
ear *
0.1
6 lb
s ni
trog
en [N
]/lb
s pro
tein
* 1
.2 [p
rote
in
nonc
onsu
med
fact
or] *
1.2
5 [c
omm
ercia
l/ in
dust
rial c
o-di
scha
rge
fact
or] –
lbs s
ludg
e N
– W
WTP
N2O
-N
emiss
ions
) * 0
.008
lbs N
2O/lb
s N in
se
wag
e Bi
osol
ids l
and
appl
icatio
n se
e: so
il ni
trog
en m
anag
emen
t: di
rect
an
d in
dire
ct e
miss
ions
abo
ve
see:
soil
nitr
ogen
man
agem
ent:
dire
ct a
nd in
dire
ct e
miss
ions
ab
ove
see:
soil
nitr
ogen
man
agem
ent:
dire
ct a
nd in
dire
ct e
miss
ions
ab
ove
see:
soil
nitr
ogen
man
agem
ent:
dire
ct
and
indi
rect
em
issio
ns a
bove
Ex. 1 to MCEA Comments-Grace Dairy, Chippewa County

Inte
grat
ing
Clim
ate
Info
rmat
ion
Into
MEP
A Pr
ogra
m R
equi
rem
ents
• N
ovem
ber 2
020
Envi
ronm
enta
l Qua
lity
Boar
d
43
Off-
site
Scop
e 2
and
3 So
urce
s El
ectr
icity
pur
chas
es
from
off-
site
sour
ces
EPA
Cent
er fo
r Cor
pora
te C
limat
e Le
ader
ship
(CCC
L), G
HG E
miss
ion
Fact
ors H
ub, e
lect
ricity
, MRO
W N
ERC
regi
on
NR
EPA
CCCL
, GHG
Inve
ntor
y Gu
idan
ce: S
tatio
nary
Co
mbu
stio
n Gu
idan
ce
CO2,
CH4,
N 2O
= m
egaw
att-h
rs o
f ele
ctric
pu
rcha
ses (
MW
H) *
lbs C
O 2/M
WH,
lbs
CH4/
MW
H or
lbs N
2O/M
WH
Purc
hase
d of
f-site
so
lid w
aste
disp
osal
se
rvice
s
EPA
Cent
er fo
r Cor
pora
te C
limat
e Le
ader
ship
(CCC
L), S
impl
ified
GHG
Em
issio
ns C
alcu
lato
r sge
t_to
ol, w
aste
se
rvice
s
NR
EPA
Cent
er fo
r Cor
pora
te
Clim
ate
Lead
ersh
ip (C
CCL)
, Si
mpl
ified
GHG
Em
issio
ns
Calcu
lato
r sge
t_to
ol, w
aste
se
rvice
s
NR
Not t
reat
ed: p
rimar
y al
umin
um p
rodu
ctio
n, p
rimar
y m
agne
sium
pro
duct
ion,
CO 2
pro
duct
ion
from
oil
and
gas w
ells,
ferr
oallo
y pr
oduc
tion,
bas
ic ox
ygen
stee
l fur
nace
and
pi
g iro
n pr
oduc
tion,
met
allu
rgica
l cok
ing,
soda
ash
pro
duct
ion,
pho
spho
ric a
cid p
rodu
ctio
n, H
CFC-
22 p
rodu
ctio
n, p
rimar
y le
ad p
rodu
ctio
n, zi
nc p
rodu
ctio
n, N
2O d
entis
try
use,
HFC
ozo
ne d
eple
ting
subs
titut
e (O
DS)
– ae
roso
ls an
d re
siden
tial r
efrig
erat
ion
and
cool
ing
a NAI
CS 3
255
- pai
nt, c
oatin
gs, a
dhes
ives
man
ufac
turin
g; N
AICS
325
1 - B
asic
chem
ical m
anuf
actu
ring;
NAI
CS 5
352
- Re
sin, S
ynth
etic
Rubb
er, a
nd A
rtifi
cial a
nd S
ynth
etic
Fibe
rs a
nd F
ilam
ents
Man
ufac
turin
g
b iron
and
stee
l man
ufac
turin
g, ca
r man
ufac
turin
g, a
eros
pace
, fur
nitu
re m
anuf
actu
re
c soils
with
hig
h or
gani
c car
bon
grea
ter t
han
9%
Ex. 1 to MCEA Comments-Grace Dairy, Chippewa County

Inte
grat
ing
Clim
ate
Info
rmat
ion
Into
MEP
A Pr
ogra
m R
equi
rem
ents
• N
ovem
ber 2
020
Envi
ronm
enta
l Qua
lity
Boar
d
44
Atta
chm
ent 2
. Mod
els f
or so
urce
s not
am
enab
le to
sim
plifi
ed ca
lcula
tion
usin
g em
issio
n fa
ctor
s Re
com
men
ded
sour
ce fo
r:
M
odel
M
odel
Par
amet
ers
Equa
tions
and
Met
hodo
logi
es
for c
alcu
latin
g em
issio
ns
Sim
plifi
ed e
quat
ions
for
calcu
latio
n:
MM
SW
Land
fills
IPCC
, 201
9 Re
finem
ent t
o th
e 20
06 IP
CC
Guid
elin
es fo
r Nat
iona
l Gre
enho
use
Gas
Inve
ntor
ies V
olum
e 5
Was
te, A
nnex
3A1
.4: F
OD
Mod
el
EPA,
Inve
ntor
y of
US
Sour
ces a
nd S
inks
of
Gree
nhou
se G
ases
, EPA
-430
-R-1
9-00
1, S
ectio
n7.1
La
ndfil
ls
IPCC
, 201
9 Re
finem
ent t
o th
e 20
06 IP
CC G
uide
lines
for
Natio
nal G
reen
hous
e Ga
s In
vent
orie
s Vol
ume
5 W
aste
EPA,
Inve
ntor
y of
US
Sour
ces a
nd
Sink
s of G
reen
hous
e Ga
ses,
Sect
ion
7.1
Land
fills
Calif
orni
a Ai
r Res
ourc
es B
oard
, et
al.,
Loca
l Gov
ernm
ent
Ope
ratio
ns P
roto
col,
vers
ion
1.1,
M
ay 2
010
Land
fill [
LF] C
H 4 g
ener
atio
n FO
D m
odel
outp
ut *
(1 –
75%
colle
ctio
n ef
ficie
ncy
of a
ctiv
e ga
s cap
ture
[C
E])*
(1 –
19.
5% C
H 4 LF
cove
r ox
idat
ion
rate
) + C
H 4 g
ener
atio
n FO
D m
odel
out
put *
CE
* (1
– 9
9%
land
fill f
lare
des
truc
tion
effic
ienc
y)
Indu
stria
l La
ndfil
ls IP
CC, 2
019
Refin
emen
t to
the
2006
IPCC
Gu
idel
ines
for N
atio
nal G
reen
hous
e Ga
s In
vent
orie
s Vol
ume
5 W
aste
, Ann
ex 3
A1.4
: FO
D M
odel
EPA,
Inve
ntor
y of
US
Sour
ces a
nd S
inks
of
Gree
nhou
se G
ases
, Sec
tion
7.1
Land
fills
IPCC
, 201
9 Re
finem
ent t
o th
e 20
06 IP
CC G
uide
lines
for
Natio
nal G
reen
hous
e Ga
s In
vent
orie
s Vol
ume
5 W
aste
EPA,
Inve
ntor
y of
US
Sour
ces a
nd
Sink
s of G
reen
hous
e Ga
ses,
Se
ctio
n 7.
1 La
ndfil
ls
Land
fill [
LF] C
H 4 g
ener
atio
n FO
D m
odel
outp
ut *
(1
– 19
.5%
CH 4
LF co
ver
oxid
atio
n ra
te)
Land
fill
carb
on
sequ
estr
atio
n
IPCC
, 201
9 Re
finem
ent t
o th
e 20
06 IP
CC
Guid
elin
es fo
r Nat
iona
l Gre
enho
use
Gas
Inve
ntor
ies V
olum
e 5
Was
te, A
nnex
3A1
.4: F
OD
Mod
el
IPCC
, 201
9 Re
finem
ent t
o th
e 20
06 IP
CC G
uide
lines
for
Natio
nal G
reen
hous
e Ga
s In
vent
orie
s Vol
ume
5 W
aste
NR (m
odel
calc
ulat
ed)
NR (m
odel
calcu
late
d)
Ex. 1 to MCEA Comments-Grace Dairy, Chippewa County

Integrating Climate Information Into • December 2020 Environmental Quality Board MEPA Program Requirements
45
Attachment 3. Default fuel heat content and stationary source emission factors
Heat Content CO2 Factor CH4 Factor N2O Factor MMBtu per short ton lb CO2/MMBtu lb CH4/MMBtu lb N2O/MMBtu Solid fossil fuels, mixed fuels, and peat
Anthracite coal 25.09 228.59 0.0243 0.0035 Bituminous coal 24.93 205.65 0.0243 0.0035 Subbituminous coal 17.25 214.22 0.0243 0.0035 Lignite 14.21 215.43 0.0243 0.0035 Coal coke 24.80 250.60 0.0243 0.0035 Municipal solid waste 9.95 199.96 0.0705 0.0093 Petroleum coke 30.00 225.77 0.0705 0.0093 Plastics 38.00 165.35 0.0705 0.0093 Tire-derived fuel 28.00 189.53 0.0705 0.0093 Peat 8.00 246.56 0.0705 0.0093 MMBtu/MMcf lb CO2/MMBtu lb CH4/MMBtu lb N2O/MMBtu Gaseous fossil fuels Natural gas 1,026 116.98 0.0022 0.0002 Refinery gas 1,388 130.07 0.0066 0.0013 Coke oven gas 599 103.29 0.0011 0.0002 Blast furnace gas 92 604.77 0.0000 0.0002 MMBtu/gallon lb CO2/MMBtu lb CH4/MMBtu lb N2O/MMBtu Fossil fuel Liquid fuels: crude oil and refined petroleum products
Crude oil 0.138 164.33 0.0066 0.0013 Asphalt and road oil 0.158 166.14 0.0066 0.0013 Aviation gasoline 0.120 152.67 0.0066 0.0013 Butane 0.103 142.79 0.0066 0.0013 Distillate fuel oil #1 0.139 161.49 0.0066 0.0013 Distillate fuel oil #2 0.138 163.05 0.0066 0.0013 Distillate fuel oil #4 0.146 165.43 0.0066 0.0013 Ethane 0.068 131.84 0.0066 0.0013 Heavy gas oils 0.148 165.17 0.0066 0.0013 Isobutane 0.990 143.17 0.0066 0.0013 Jet fuel – kerosene type 0.135 159.22 0.0066 0.0013 Kerosene 0.135 165.79 0.0066 0.0013 Liquified petroleum gases (LPG)
0.092 136.05 0.0066 0.0013
Lubricants 0.144 163.74 0.0066 0.0013 Motor gasoline 0.125 174.65 0.0066 0.0013 Naphtha <401 deg F) 0.125 149.96 0.0066 0.0013
Ex. 1 to MCEA Comments-Grace Dairy, Chippewa County

Integrating Climate Information Into • December 2020 Environmental Quality Board MEPA Program Requirements
46
Natural gasoline 0.110 151.85 0.0066 0.0013 Oil oil >4091 deg F 0.139 168.03 0.0066 0.0013 Pentanes plus 0.110 154.37 0.0066 0.0013 Petrochemical feedstocks 0.125 156.57 0.0066 0.0013 Petroleum coke 0.143 225.77 0.0066 0.0013 Propane 0.091 138.60 0.0066 0.0013 Residual fuel oil #5 0.140 160.78 0.0066 0.0013 Residual fuel oil #6 0.150 165.57 0.0066 0.0013 Special naphtha 0.125 159.48 0.0066 0.0013 Unfinished oil 0.139 164.33 0.0066 0.0013 E10 a 0.126 138.57 0.0066 0.0013 B10 a 0.137 147.91 0.0066 0.0013 MMBtu per short ton lb CO2/MMBtu lb CH4/MMBtu lb N2O/MMBtu Solid biomass fuels Agricultural byproducts 8.25 Not relevant 0.0705 0.0093 Black liquor 11.76 b Not relevant 0.0042 0.0009 Manufacturing residues 10.39 Not relevant 0.0705 0.0093 Wood and wood waste 8.6 to 17.2 (depending
on moisture content) c Not relevant 0.0159 0.0079
MMBtu/MMcf lb CO2/MMBtu lb CH4/MMBtu lb N2O/MMBtu Biogas fuels Landfill gas 485 Not relevant 0.0071 0.0014 Other biogases 655 Not relevant 0.0071 0.0014
Source: EPA Center for Corporate Climate Leadership (CCCL), GHG Emission Factors Hub, stationary combustion (2020), all factors except those listed in notes a-c a calculated from fuel heat content and fuel fossil carbon content by volume for motor gasoline, diesel fuel oil, ethanol and biodiesel given in EPA Center for Corporate Climate Leadership (2020) and EIA State Energy Data System (2020) b EIA, Renewable Energy Annual (2009) c USFS Forest Products laboratory, Fuel Value Calculator, http://www.fpl.fs.fed.us/documnts/techline/fuel-value-calculator.pdf
Ex. 1 to MCEA Comments-Grace Dairy, Chippewa County

Integrating Climate Information Into • December 2020 Environmental Quality Board MEPA Program Requirements
47
Attachment 4. Protocols and methods for calculating GHG emissions
American Petroleum Council, Compendium of Greenhouse Gas Emissions Methodologies for the Oil and Gas Industry (2009)
https://www.api.org/~/media/files/ehs/climate-change/2009_ghg_compendium.ashx
American Public Transportation Association, Quantifying Greenhouse Gas Emissions from Transit, APTA SUDS CC-RP-001-09, Rev. 1, 2018
https://www.apta.com/wp-content/uploads/Standards_Documents/APTA-SUDS-CC-RP-001-09_Rev-1.pdf
California Air Resources Board, et al., Local Government Operations Protocol, version 1.1, May 2010
https://s3.amazonaws.com/icleiusaresources/lgo_protocol_v1_1_2010-05-03.pdf
Environmental Protection Agency (EPA), Inventory of US Sources and Sinks of Greenhouse Gases 1990-2017, EPA-430-R-19-001 (2019)
https://www.epa.gov/ghgemissions/inventory-us-greenhouse-gas-emissions-and-sinks-1990-2017
EPA, 40 CFR Part 98—Mandatory Greenhouse Gas Reporting (2009) https://www.ecfr.gov/cgi-bin/text-idx?SID=ae265d7d6f98ec86fcd8640b9793a3f6 &mc=true&node=pt40.23.98&rgn=div5#ap40.23.98_19.1
EPA Center for Corporate Climate Leadership (CCCL), GHG Inventory Guidance: Stationary Combustion Guidance (2016)
https://www.epa.gov/climateleadership/center-corporate-climate-leadership-direct-emissions-stationary-combustion-sources
EPA CCCL, GHG Inventory Guidance: Mobile Combustion Guidance (2016) https://www.epa.gov/climateleadership/center-corporate-climate-leadership-direct-emissions-mobile-combustion-sources
ICLEI, U.S. Community Protocol for Accounting and Reporting of Greenhouse Gas Emissions, version 1.2, 2019
https://icleiusa.org/ghg-protocols/
Intergovernmental Panel on Climate Change (IPCC), 2006 IPCC Guidelines for National Greenhouse Gas Inventories, vol. 1-5 (2006)
https://www.ipcc-nggip.iges.or.jp/public/2006gl/index.html
IPCC, 2013 Supplement to the 2006 IPCC Guidelines for National Greenhouse Gas Inventories: Wetlands (2013)
https://www.ipcc-nggip.iges.or.jp/public/wetlands/index.html
IPCC, 2019 Refinement to the 2006 IPCC Guidelines for National Greenhouse Gas Inventories, vol 1-5 (2019)
https://www.ipcc-nggip.iges.or.jp/public/2019rf/index.html
IPCC, Good Practice Guidance for Land Use,Land-Use Change and Forestry (2003)
https://www.ipcc-nggip.iges.or.jp/public/gpglulucf/gpglulucf.html
National Council for Air and Stream Improvement, Inc. (NCASI), Calculation Tools for Estimating Greenhouse Gas Emissions from Pulp and Paper Mills V.1.1, 2005
https://ghgprotocol.org/sites/default/files/Pulp_and_Paper_Guidance.pdf
The Climate Registry, General Reporting Protocol, V 3.0 (2019) https://www.theclimateregistry.org/tools-resources/reporting-protocols/general-reporting-protocol/
J. Smith, et al., Methods for calculating forest ecosystem and harvested carbon with standard estimates for forest types of the United States, Gen. Tech. Rep. NE-343. USFS, 2006
https://www.nrs.fs.fed.us/pubs/8192
The Climate Registry, Electric Sector Protocol: Annex to the General Reporting Protocol, V. 1.0. (2009)
https://www.theclimateregistry.org/tools-resources/reporting-protocols/electric-power-sector-protocol/
USDA, Office of the Chief Economist, Quantifying Greenhouse Gas Fluxes in Agriculture and Forestry: Methods for Entity-Scale Inventory, Technical Bulletin 1939, 2014
https://www.usda.gov/sites/default/files/documents/USDATB1939_07072014.pdf
USDA, Office of the Chief Economist, US Agriculture and Forest Greenhouse Gas Inventory 1990-2013 Technical Bulletin 1943, 2016
https://www.usda.gov/sites/default/files/documents/USDA_GHG_Inventory_1990-2013_9_19_16_reduced.pdf
World Business Council for Sustainable Development, and World Resources Institute, The GHG Protocol: A corporate reporting and accounting standard (revised edition) (2020)
https://www.wbcsd.org/Programs/Climate-and-Energy/Climate/Resources/A-corporate-reporting-and-accounting-standard-revised-edition
World Business Council for Sustainable Development, and World Resources Institute, Calculating Greenhouse Gas Emissions from Iron and Steel Production: A component tool of the Greenhouse Gas Protocol Initiative (2009)
https://ghgprotocol.org/calculation-tools#sector_specific_tools_id
Ex. 1 to MCEA Comments-Grace Dairy, Chippewa County

Integrating Climate Information Into • December 2020 Environmental Quality Board MEPA Program Requirements
48
Appendix B2
Guidance: Climate adaptation and resilience
Introduction The purpose of this guidance is to help project proposers and responsible governmental units (RGU) respond to the climate-related questions of the EAW Form. This guidance supports the development of climate-related information, but does not limit the use of other reliable and relevant guidance for discussing how current Minnesota climate trends and anticipated climate change may interact with a project and its development. This document provides item-by-item guidance for responding to proposed questions on the EAW form related to how climate change may influence environmental effects, how the proposed project may worsen problems already accentuated by climate changes, and proposed adaptations to reduce risk and increase resilience.
5. Project location Establish a snapshot of climate change in the general location/region of the project for which there is readily available information. This description of current Minnesota climate trends and how climate change is anticipated to effect the general location of the project during the life of the project is important and will be used in answering subsequent climate-related questions in the EAW. Provide references to resources you used to establish this description and include any data or information gaps that you discovered. The extent and scale of readily available information may vary depending on, when the EAW is completed, and the nature and location of the project. Data sources, models, and other resources for adapting to Minnesota’s changing climate will provide information not just about building resilience to future climate conditions, but also about addressing how under-resilient we are now to current conditions.
For the purposes of reporting, any of the resources provided below may be used to identify climate projections. Additional or alternative resources also may be identified and referenced
Resources that identify current trends in Minnesota include:
Minnesota Climate Trends website at https://www.dnr.state.mn.us/climate/climate_change_info/climate-trends.html
Climate Trends map at https://arcgis.dnr.state.mn.us/ewr/climatetrends/. Use this map tool to identify current Minnesota climate trends (historical up to the present) in the general location of the project. First select the major watershed or county where the project is located, then, under “Data Options” select relevant climate variables and time frames using 1895 as the data start year, and the most recent year as the data end year. Be sure to click the box in “Additional Options” for “Show trend for these years” and pick whatever Start and End dates are desired for the trend line within the 1895 to current year timeframe. Look at annual data, and also look at individual months relevant to the project (for example, construction schedules, operational issues, waste disposal needs, etc.).
Flood Factor at www.floodfactor.com identify flood potential by entering the project location (street address, street name, or city), then click on Flood Risk Explorer (left menu bar) and select flooding likelihood of 0.2% and 1% for current risk (2020). View “View “The First National Flood Risk Assessment” report, especially page 78-80 for Minnesota-specific information on flood risk potential.
“Climate Vulnerability Assessment: Regional Risks and Opportunities” for the Twin Cities Region includes tools, resources and mitigation actions for regional climate hazards including Extreme
Ex. 1 to MCEA Comments-Grace Dairy, Chippewa County

Integrating Climate Information Into • December 2020 Environmental Quality Board MEPA Program Requirements
49
Heat (Story Map and Extreme Heat Map Tool) and Localized Flooding (Story Map and Localized Flood Map Screening Tool). This data is a more localized comprehensive resource for the seven-county region (Anoka, Carver, Dakota, Hennepin, Ramsey, Scott, and Washington counties) governed under the Metropolitan Council.
Resources that identify how climate change is anticipated (anticipated climate change) to effect the location of the proposed project during the life of the project:
Most recent National Climate Assessment (NCA4 or more recent), especially the Midwest Report at https://nca2014.globalchange.gov/report/regions/midwest or more current version if available.
Flood Factor at www.floodfactor.com use this map tool to identify flood potential by entering the project location (street address, street name, or city), then click on Flood Risk Explorer (left menu bar) and select flooding likelihood of 0.2% and 1% for future risk (2035 and 2050).
It is important to note that readily available data may or may not (depending on project location) include projections for future years showing the type of intense precipitation events we are currently experiencing, and which are anticipated to increase. This kind of information, as it is available, is encouraged to be incorporated into the project EAW. In Minnesota we have seen an increase in heavy precipitation which is not reflected in the modeling yet. In responding to this item, the following are helpful explanations of terms:
General location of the project: the specific project location plus its environs, including the nearby and encompassing local governmental jurisdictions, and the major watershed it affects.
Life of the project: (options relevant to different project types) Proposed life: the period of time the project is proposed to last, such as for mining projects. Design service life: the period of use as intended by the designer after which it may need to
be replaced, but before this period has elapsed should remain fit for purpose, such as for projects that are primarily buildings and structures.
Default: the anticipated impact of climate change on the proposed project over the next 30 years, such as for conservation or restoration projects that may continue indefinitely into the future if properly maintained.
6. Project description Using the description of the climate trends in the project vicinity, to the best extent practicable; describe how the project’s proposed activities will interact with those climate trends. For example, current climate trends to consider which may affect timing and duration of construction activities include, but are not limited to:
Increased rainfall during certain months Likelihood of more intense precipitation storm events that may necessitate extra time spent to
secure construction site/materials from damage due to infiltration and localized flooding potential
Increased frequency of freeze/thaw cycles during certain months Warmer low temperatures and less extreme cold, which could extend the construction season Increased extreme heat events which could affect health/safety of construction crews and
require cessation of certain activities during that time period To identify monthly climate trends for the general location of the project, use the DNR Minnesota Climate Trends map tool at https://arcgis.dnr.state.mn.us/ewr/climatetrends/. Select the relevant watershed or county, and under “Data Options” pick the relevant climate variable and time scale of 1-month to look at each month (month ending) over the historical record of 1895 to the current year. To
Ex. 1 to MCEA Comments-Grace Dairy, Chippewa County

Integrating Climate Information Into • December 2020 Environmental Quality Board MEPA Program Requirements
50
see the climate change trend for that month, be sure to use the “Additional Options” feature by checking the boxes for Compare to these years (Start: 1895 and End: 1979) and Show the trend for these years (Start: 1980 and End: [most current year]).
For general sense of Minnesota precipitation trends see: https://images.dnr.state.mn.us/natural_resources/climate/historical/annual/prcp_annual.gif
For general sense of Minnesota winter warming trends see: https://images.dnr.state.mn.us/natural_resources/climate/historical/annual/tmin_winter.gif
Aspects or features to consider that may amplify or interact with how climate change is anticipated to affect the general location of the project include:
Impervious surfaces: During intense rainfall events, increases in the amount of impervious surface on a site (from
table in Q7) may result in more localized flooding in the immediate area of the project, in addition to other stormwater effects.
Dark roofing materials absorb heat during the day and radiate it at night, which increases the urban heat island (UHI) effect and amplifies the warming temperatures of climate change
Impermeable pavement (concrete or asphalt) without the benefit of vegetative cover absorbs heat during the day and radiates it at night, increasing surface temperatures and UHI effect in the area. Information about the UHI effect including definitions, risks and strategies is available at https://www.epa.gov/heatislands. In-depth information about mitigation strategies using green infrastructure practices is available at https://www.epa.gov/heatislands/heat-island-compendium. Specifically for the Twin Cities metropolitan area, see Keeping Our Cool: Extreme Heat in the Twin Cities Region, including an Extreme Heat Map Tool, available at https://metrocouncil.maps.arcgis.com/apps/MapJournal/index.html?appid=7d9cdd3929e9439bb5b25aa1186d5783
Reduction in mature tree canopy: Tree loss eliminates many climate resilience benefits, leading to more intense stormwater
runoff, increased UHI effect and loss of shade for protection during extreme heat, potential reduction in air quality, and more. Information about benefit-cost considerations of tree canopy in the urban landscape is available at https://www.epa.gov/sites/production/files/2017-05/documents/reducing_urban_heat_islands_ch_2.pdf
Reduction in water storage areas: The removal of wetlands and other low-lying areas eliminates the ability for the land to
retain and absorb stormwater, leading to more intense stormwater runoff, nutrient loading, and more effects. See stormwater guidance below for related information.
Regarding the project magnitude for “residential building area”, provide a total of the gross floor space. Count all floors of all enclosed structures on the site, including any parking structures (excluding surface lots and approach areas) in the gross floor space calculations. It may be useful to specify the floor space by use type, especially for mixed use projects.
Ex. 1 to MCEA Comments-Grace Dairy, Chippewa County

Integrating Climate Information Into • December 2020 Environmental Quality Board MEPA Program Requirements
51
7. Cover types For interactive mapping of the cover types defined below, see https://www.epa.gov/enviroatlas/enviroatlas-interactive-map
Wetlands and shallow lakes support similar habit and are less than two meters deep. Any wetland meeting the one of the classification types under the USFW service under Circular 39 (also described in MS 103G.005 subd. 17b). A deep lake is any water basin that is more than two meters deep, on average, and is NOT classified as a wetland/shallow lake.
A river or stream (also defined as a water course) is any channel having definable beds and banks capable of conducting generally confined runoff from adjacent lands. During floods water may leave the confining beds and banks but under low and normal flows water is confined within the channel. A watercourse may be perennial or intermittent. Watercourse definition is in MR 6115.0170 Subp. 41.
The “lawn/landscaping” category is the appropriate classification for developments constructed in wooded areas, even if many of the trees are maintained. The “wooded/forest” category should be applied only to relatively undisturbed wooded areas. Similarly, the “brush/grassland” category applies to areas that are undisturbed or infrequently maintained. If an area is to be regularly mowed or maintained, even if in a rural setting, list it under “lawn/landscaping.” Exclude from the “lawn/landscaping” category all acreage included in the “green infrastructure” and “stormwater (wet) ponds” categories as defined below.
Minnesota is facing wetter weather conditions, more intense precipitation events, and an increase in average temperatures due to climate change. The result will be an increase in stormwater runoff from impervious surfaces like parking lots, roofs, and sidewalks. One adaptation tool is green infrastructure. Green infrastructure is an approach to manage wet weather impacts in a way that mimics, restores and maintains natural hydrology. The fundamental concept behind green infrastructure is to retain precipitation where it falls. Green infrastructure includes a wide array of practices that manage stormwater and reduce stormwater runoff, but also provide other benefits including carbon sequestration, wildlife habitat, reduction of energy consumption, recreation, and increased property values. Green infrastructure practices have the ability to mitigate impacts of climate change when designed, constructed and maintained properly.
The practices included in the “green infrastructure” category are described below:
Raingarden (bioretention) – Raingardens use soil (typically engineered media or mixed soil) and native vegetation (including those that attract pollinators) to capture runoff and remove pollutants. Both the media and underlying soil typically have high infiltration rates that allow captured water to infiltrate. More at: https://stormwater.pca.state.mn.us/index.php?title=Green_Infrastructure_benefits_of_bioretention
Tree trenches and tree boxes – Tree trenches and tree boxes are engineered structural practices that behave similar to a raingarden. Water is captured and delivered to a storage area (engineered media), where the water can infiltrate and be taken up by trees. More at: https://stormwater.pca.state.mn.us/index.php?title=Green_Infrastructure_benefits_of_tree_trenches_and_tree_boxes
Bioswales – Bioswales are vegetated channels used primarily to transport runoff and filter sediment from the runoff. Although their primary effect is on removing pollutants associated with sediment, they can be designed to infiltrate water. More at: https://stormwater.pca.state.mn.us/index.php?title=Overview_for_filtration or at future link: https://stormwater.pca.state.mn.us/index.php?title=Green_Infrastructure_benefits_of_vegetated_swales
Ex. 1 to MCEA Comments-Grace Dairy, Chippewa County

Integrating Climate Information Into • December 2020 Environmental Quality Board MEPA Program Requirements
52
Constructed wetlands - Stormwater wetlands differ from stormwater (wet) ponds by their variety of water depths and associated vegetative complex. Stormwater wetlands are constructed stormwater management practices, not natural wetlands. More at: https://stormwater.pca.state.mn.us/index.php?title=Green_Infrastructure_benefits_of_constructed_wetlands
Green roofs – Green roofs consist of a series of layers that create an environment suitable for plant growth without damaging the underlying roof system. Green roofs provide both volume and rate control, thus decreasing the stormwater volume being delivered to downstream Best Management Practices (BMPs). Green roofs also provide filtering of suspended solids and pollutants associated with those solids. More at: https://stormwater.pca.state.mn.us/index.php?title=Green_roofs or at future link: https://stormwater.pca.state.mn.us/index.php?title=Green_Infrastructure_benefits_of_green_roofs
Permeable pavements – Permeable pavements allow stormwater runoff to filter through surface voids into an underlying stone reservoir for temporary storage and/or infiltration. The most commonly used permeable pavement surfaces are pervious concrete, porous asphalt, and permeable interlocking concrete pavers (PICP). More at: https://stormwater.pca.state.mn.us/index.php?title=Permeable_pavement or at future link: https://stormwater.pca.state.mn.us/index.php?title=Green_Infrastructure_benefits_of_permeable_pavement
To determine the acreage for the “green infrastructure” category, calculate the acreage of each green infrastructure practice to be installed for the project, based on the surface area (length multiplied by width) of the footprint for that practice (not the area that drains into the practice). Then take the total of the acreages of all the individual practices and enter that amount in the cover types table for “green infrastructure”. Make sure not to double count any of the green infrastructure acreage in the “lawn/landscaping” category, nor in the “stormwater (wet) pond” category, nor in the “impervious surface” category (for green roofs).
The “stormwater (wet) pond” category includes only human-constructed retention ponds that are permanent pools of standing water specifically designed to continually hold a certain volume of stormwater runoff.
The “impervious surface” of the site is the sum total of all hard surfaces including rooftops, parking lots, streets, sidewalks, driveways, and surfaces that are impermeable to infiltration of rainfall into underlying soils/groundwater. Exclude from the “impervious surface” category all acreage for green roofs and permeable pavements included in the “green infrastructure” category as defined above. Impervious surface has the environmental effects described in the paragraphs below, and which will be amplified by the increasing temperatures and growing intensity of precipitation events characterizing current Minnesota climate trends and anticipated climate change.
Impervious surface prevents rainwater from entering the soil and forces it to flow on the surface of the land until it finds a place to drain. Allowing rain to penetrate the earth recharges groundwater sources, regulates the volume of water in streams and rivers, and filters pollutants. As impervious surface increases, rainwater runoff increases in quantity, speed, temperature, and pollutant load. This runoff can increase the potential for flooding and the transportation of sediment, nutrients, and pollutants. It can also raise the temperature of the receiving waterbody.
These factors can significantly reduce water quality downstream, affecting neighboring towns and communities, as well as aquatic wildlife that depend on upstream water sources. Reduced water quality creates public health concerns and can generate additional water treatment expenses for the community. Poor water quality can also affect biodiversity, recreational opportunities, and potential development of certain industries that depend on water quality, such as agriculture, tourism, or fishing.
Ex. 1 to MCEA Comments-Grace Dairy, Chippewa County

Integrating Climate Information Into • December 2020 Environmental Quality Board MEPA Program Requirements
53
Impervious surfaces affect the quantity, as well as the quality, of water supply resources. Rainwater entering the soil recharges groundwater aquifers. Water also percolates more slowly through the soil to enter streams and rivers, contributing to base flows and regulating the stream flow precipitation events. Impervious surfaces do not allow this recharge, thus contributing to potential insufficiencies in water supply for both ground and surface water resources.
In addition to the impacts on water quality, impervious surfaces have been associated with increases in ambient temperatures. Referred to as the urban heat island effect, research has found that impervious surface materials store heat during the day and slowly release it at night, preventing the area and its residents from cooling down after a hot day. This effect is amplified in urban areas where impervious surfaces cover a greater percentage of land than in rural communities. Elevated daytime and especially nighttime temperatures can amplify the effects of heat waves and increase the incidence of heat stroke and other heat-related health effects. Higher ambient temperatures also contribute to the chemical reactions that produce ground-level ozone and smog that threaten public health. Children, the elderly, and people with certain pre-existing health conditions are particularly vulnerable to the impacts related to impervious surface.
Percent tree canopy (cover) for a given area can be estimated utilizing GIS or, if that is not available, another tool option is i-Tree Canopy, which also provides an estimate of the benefits of those existing trees.Tree size and maturity will vary based on species, but research cited by EPA in Reducing Urban Heat Islands: Compendium of Strategies Trees and Vegetation (46McPherson, E.G. 2002. Green Plants or Power Plants? Center for Urban Forest Research. Davis, CA) has found that after 15 years, an average tree usually has matured enough to provide the full range of benefits. Cities and counties often have tree inventories which estimate the age of trees and can be a useful resource. In general, a mature tree is one that can take care of itself without aid (e.g., stakes, water). They typically have a well-developed tree canopy, are even-aged stands capable of sexual reproduction (i.e., fruits, flowers, nuts, cones) and have attained most of their potential height growth. For tree and forestry definitions, please refer to: https://www.nrs.fs.fed.us/fmg/nfmg/glos.html
Land use Open space is any natural space, public or private, that is used primarily for passive recreation (active recreation facilities are parks and recreational facilities), animal habitat and/or for maintaining ecological services and/or rural character. Open space may or may not be protected. Examples could include woodlands, prairie, groundwater recharge areas, greenways.
Discuss the compatibility with land use, planning, and zoning as it relates primarily to development and the projected climate changes for the project location.
Critical facilities are facilities necessary to a community’s public health and safety, those that store or produce highly volatile, toxic or water-reactive materials, and those that house occupants that may be insufficiently mobile to avoid loss of life or injury. Examples of critical facilities include hospitals, correctional facilities, schools, daycare facilities, nursing homes, fire and police stations, wastewater treatment facilities, public electric utilities, water plants, fuel storage facilities, and waste handling and storage facilities.
11. Water resources Shoreland classifications are defined in MR 6120.3000. Shoreland classifications for basins and watercourses are identified in the Public Waters (PW) Basin and Watercourse Delineations spatial data.
Aquatic invasive Species. Per MS 84D.01 subd. 9a, invasive species are species that are not native to Minnesota and cause economic or environmental harm or harm to human health, or threatens or may threaten natural resources of the use of natural resources in the state. Aquatic invasive species are invasive species located in or adjacent to waterbodies and watercourses. Lists and locations of aquatic invasive species are available from the DNR.
Ex. 1 to MCEA Comments-Grace Dairy, Chippewa County

Integrating Climate Information Into • December 2020 Environmental Quality Board MEPA Program Requirements
54
Check the infested waters list directly at this link https://www.dnr.state.mn.us/invasives/ais/infested.html
Also, there is a GIS layer with invasive species information available to DNR staff on the intranet at this link http://intranet.dnr.state.mn.us/eco/invasive_species/op_order_113-identify.html#location. And they are also available to the public through the geospatial commons https://gisdata.mn.gov/
In addition, the public can use the advanced query tools of EDDMaps to search for all the invasive species within a county. They can then use the map function to zoom into the area they are interested in at this link https://www.eddmaps.org/midwest/tools/query/ This section asks for a qualitative overview of how effects from project activities on water resources may be worsened by, unaffected by, or mitigated due to current climate trends and anticipated climate change, including the following as relevant to the specific environmental effects and the general location of the project: rainfall frequency, intensity and amount; higher daytime and winter low temperatures affecting surface and waterbody temperatures; increases in extreme heat affecting surface and waterbody temperatures; increases in extended drought; increases in the frequency of freeze-thaw cycles; later ice in and earlier ice out; longer growing season.
One way that climate change may influence the environmental effects is by amplifying their effect, for example when discharges of warm water are added to surface water already warmer than historical norms due to higher nighttime lows and more daytime heat and humidity, which makes the water even less hospitable for native aquatic species such that the likelihood of successful adaptation is further diminished. Similarly with additional runoff that adds contaminants to surface waters already more polluted by increased extreme precipitation and flooding from climate change.
Because climate change is anticipated to worsen water quality, the influence on environmental effects from projects refers to how projects may add contaminants to water resources that are becoming increasingly fragile and unhealthy due to climate change. Environmental effects in the future may be expected to result in worse public health outcomes and more lasting environmental damage than if they occurred without climate change.
Wastewater Availability of septage disposal options for projects with septic systems:
Regarding suitability of site conditions in Minnesota’s changing climate, identify flood potential by using Flood Factor at https://www.floodfactor.com to enter the project location (street address, street name, or city), then click on Flood Risk Explorer (left menu bar) and select flooding likelihood of 0.2% and 1% for both current and future risk. Also consult the First Street Foundation 2020 National Flood Risk Assessment Report and especially the State Overview Minnesota on p.78 at https://assets.firststreet.org/uploads/2020/06/first_street_foundation__first_national_flood_risk_assessment.pdf, in addition to relying on the SSTS design and installation rules pertaining to flood plains, drainageways, and swales. Another useful resource, which gives suitability limitations for drainfield types is the web soil survey at https://websoilsurvey.sc.egov.usda.gov/App/WebSoilSurvey.aspx.
Identify potential septage disposal options within a reasonable distance for travel by the maintainer to where the project is located by using the online search tool at https://webapp.pca.state.mn.us/ssts/business-search. Determine whether a nearby wastewater treatment plant accepts septage hauled by maintainers by contacting the local city treatment plant and/or checking the list on the MPCA website (which is updated only as MPCA becomes aware of changes) at https://www.pca.state.mn.us/sites/default/files/wq-wwists4-83.pdf. For a project with more than a few septic systems, consider contacting the identified maintainer(s) to verify willingness and ability to handle the amount of septage that will be generated ongoing as a result of the project.
Ex. 1 to MCEA Comments-Grace Dairy, Chippewa County
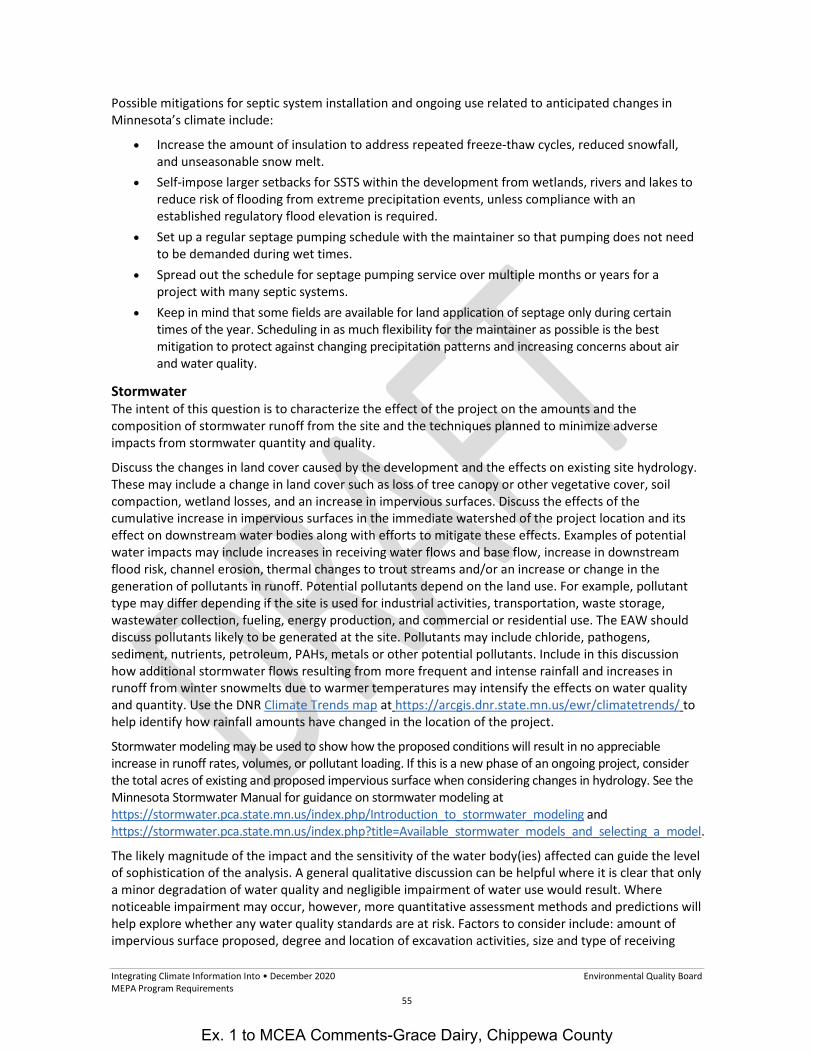
Integrating Climate Information Into • December 2020 Environmental Quality Board MEPA Program Requirements
55
Possible mitigations for septic system installation and ongoing use related to anticipated changes in Minnesota’s climate include:
Increase the amount of insulation to address repeated freeze-thaw cycles, reduced snowfall, and unseasonable snow melt.
Self-impose larger setbacks for SSTS within the development from wetlands, rivers and lakes to reduce risk of flooding from extreme precipitation events, unless compliance with an established regulatory flood elevation is required.
Set up a regular septage pumping schedule with the maintainer so that pumping does not need to be demanded during wet times.
Spread out the schedule for septage pumping service over multiple months or years for a project with many septic systems.
Keep in mind that some fields are available for land application of septage only during certain times of the year. Scheduling in as much flexibility for the maintainer as possible is the best mitigation to protect against changing precipitation patterns and increasing concerns about air and water quality.
Stormwater The intent of this question is to characterize the effect of the project on the amounts and the composition of stormwater runoff from the site and the techniques planned to minimize adverse impacts from stormwater quantity and quality.
Discuss the changes in land cover caused by the development and the effects on existing site hydrology. These may include a change in land cover such as loss of tree canopy or other vegetative cover, soil compaction, wetland losses, and an increase in impervious surfaces. Discuss the effects of the cumulative increase in impervious surfaces in the immediate watershed of the project location and its effect on downstream water bodies along with efforts to mitigate these effects. Examples of potential water impacts may include increases in receiving water flows and base flow, increase in downstream flood risk, channel erosion, thermal changes to trout streams and/or an increase or change in the generation of pollutants in runoff. Potential pollutants depend on the land use. For example, pollutant type may differ depending if the site is used for industrial activities, transportation, waste storage, wastewater collection, fueling, energy production, and commercial or residential use. The EAW should discuss pollutants likely to be generated at the site. Pollutants may include chloride, pathogens, sediment, nutrients, petroleum, PAHs, metals or other potential pollutants. Include in this discussion how additional stormwater flows resulting from more frequent and intense rainfall and increases in runoff from winter snowmelts due to warmer temperatures may intensify the effects on water quality and quantity. Use the DNR Climate Trends map at https://arcgis.dnr.state.mn.us/ewr/climatetrends/ to help identify how rainfall amounts have changed in the location of the project.
Stormwater modeling may be used to show how the proposed conditions will result in no appreciable increase in runoff rates, volumes, or pollutant loading. If this is a new phase of an ongoing project, consider the total acres of existing and proposed impervious surface when considering changes in hydrology. See the Minnesota Stormwater Manual for guidance on stormwater modeling at https://stormwater.pca.state.mn.us/index.php/Introduction_to_stormwater_modeling and https://stormwater.pca.state.mn.us/index.php?title=Available_stormwater_models_and_selecting_a_model.
The likely magnitude of the impact and the sensitivity of the water body(ies) affected can guide the level of sophistication of the analysis. A general qualitative discussion can be helpful where it is clear that only a minor degradation of water quality and negligible impairment of water use would result. Where noticeable impairment may occur, however, more quantitative assessment methods and predictions will help explore whether any water quality standards are at risk. Factors to consider include: amount of impervious surface proposed, degree and location of excavation activities, size and type of receiving
Ex. 1 to MCEA Comments-Grace Dairy, Chippewa County

Integrating Climate Information Into • December 2020 Environmental Quality Board MEPA Program Requirements
56
waters, proposed activities that could result in exposure of contaminants to stormwater, water quality impairments—especially impairments for turbidity, nutrients, and aquatic life, and potential for thermal impacts to trout streams.
The amount of detail provided about management or treatment methods relates to the significance of the quantities and quality of the runoff. For example, if the receiving water is a small wetland with no surface outlet, some adverse impacts such as inundation may be possible due to a large development. Another example might be the cumulative effects of adding additional development to the same immediate stream watershed. For situations such as this, consider cumulative impacts from previous developments. A stormwater discharge that may affect a lake is an example of a situation for the RGU to exercise judgment about the extent of analysis needed. Generally regarded as sensitive and valued resources, the lake may require a numerical nutrient budget analysis to adequately characterize the extent of the potential impact. The greater likelihood of the impact, the greater the need for a more sophisticated model. If insufficient data is available to allow the use of any numerical model, an option is to gather the minimally needed data or establish through other analysis that there is no reason to expect noticeable degradation. If the matter is left in doubt in the EAW, it may result in requests for an EIS for the project and, associated with that, a more in-depth analysis.
Projects that disturb one acre or more will be subject to the MPCA National Pollutant Discharge Elimination System/State Disposal System (NPDES/SDS) General Construction Stormwater Permit. This includes all phases of projects that are part of a Common Plan of Development where the cumulative disturbed area is equal to or over an acre. Projects that disturb fifty or more acres with a discharge point within a mile of a special or impaired waters (as defined in the permit) will have to undergo an MPCA Stormwater Pollution Prevention Plan (SWPPP) review prior to permit issuance. The total number of disturbed acres includes changes in the topography, existing soil cover, both vegetative and non-vegetative, or the existing soil topography that may result in accelerated stormwater runoff. Some site features such as highly erodible soils (identified in Item 10), steep slopes, and sensitive receiving waters need special attention to avoid adverse environmental effects. Projects with a discharge point within one mile of designated Special or Impaired Waters may want to check for construction-related impairments. If applicable to the project, identify and discuss these requirements. The NPDES general construction stormwater permit is a useful resource because it defines special and impaired waters, construction-related impairments, and requirements for each situation. Special and impaired waters within a mile of a project discharge point can be located using the MPCA Special and Impaired Waters Search tool at: https://www.pca.state.mn.us/water/stormwater-special-and-impaired-waters-search or the Special Waters List and the Known Calcareous Fens List on the webpage for the particular waterbody located near the project.
Describe specific erosion and sedimentation control Best Management Practices (BMPs) for both during and after construction, including additional BMPs needed to protect surface waters. For projects resulting in one (1) or more acres of new impervious surfaces and some areas that involve redevelopment of existing impervious areas, identify methods of permanent stormwater management, including a volume reduction practice (which will be required by the MPCA stormwater permit). Volume reduction includes infiltration, harvest and reuse or other green infrastructure practices (see Green Infrastructure Practices Guidance for #7.) designed to restore or maintain the natural hydrology of the site, promote groundwater recharge and decrease discharges and potential impacts to area waters. These measures also help to address and adapt to more frequent and increased precipitation and runoff resulting from climate change.
Explain if volume reduction cannot be utilized due to site conditions and therefore a filtration system, wet sediment pond or regional pond must be resorted to instead. Situations that may prevent use of infiltration may include high water tables, type D soils, highly permeable soils, and shallow bedrock or karst conditions. Infiltration may also be prohibited within a Drinking Water Supply Management Area classified as having a high or very high vulnerability defined by the Department of Health or in areas
Ex. 1 to MCEA Comments-Grace Dairy, Chippewa County

Integrating Climate Information Into • December 2020 Environmental Quality Board MEPA Program Requirements
57
receiving runoff from certain industrial facilities, fueling sites, disposal sites or other facilities that may generate contaminated or hazardous runoff. A soil boring, test pit or infiltrometer test in the location of the stormwater treatment area can help determine whether soil conditions prohibit use of infiltration. If infiltration is prohibited, consider other methods of volume reduction to retain stormwater on the site for at least part or all of the water quality volume.
Discuss the conformance of the proposed system with any applicable requirements of the local unit of government and any watershed district with jurisdiction over the area. If the proposer has not prepared definite plans for these measures, the requirements of the local governmental unit and the MPCA should be described and how those requirements mitigate the impacts.
Water appropriation 1. How proposed water use is resilient: This has to do with how the water use demand can met with a
diversified sources of water to reduce short-term and long-terms risks. Has the demand for water use been reduced through conservation and efficiency? Can some supply be met through water recycling and reuse and/or rainwater and stormwater harvesting?
2. Contingency plans for diminished water supply: A DNR permit for water appropriations requires a contingency plan that describes feasible alternatives the applicant will use if appropriations are restricted. Responses that describe at least one alternative, including the option of ceasing water appropriations, are acceptable.
12. Contamination/hazardous materials/wastes Wetter weather with more frequent extreme rainfall events and localized flooding make operational issues which may result in environmental effects more likely and may increase the severity of environmental effects. Examples include:
More leaching from disposed wastes of contaminants into the groundwater. More erosion of exposed soil and other earthen materials. Increase in contact water volumes that may require collection and treatment. More erosion on the working face of waste storage or containment.
More moisture added to the waste material or debris which will in turn increase methane gas production and add to greenhouse gasses.
Lack of capacity for holding and managing the leachate, stormwater, and wastewater volume generated due to the systems design having been based on smaller precipitation events.
Increased stormwater sediments or solids that need proper disposal. Leachate and contact water require treatment, so increases in leachate provide additional
potential for environmental effects on water quality; options for treatment may be affected by additional limitations on land application due to changing precipitation and temperature patterns, and on limitations at WWTPs due to treatment systems strained by heavy rain events.
More extreme heat and humidity makes environmental effects such as odors more likely and may increase their severity.
Increased freeze/thaw cycles and more “unseasonal” weather makes operational issues which may result in environmental effects – such as frost heave of cover materials – more likely and may increase the severity of the environmental effects.
Mitigations include identifying the current and anticipated future flood risk in order to all solid waste is stored, collected, transferred, transported, used, processed, disposed of, or reclaimed in locations adequately protected from the type of extreme events anticipated from climate change. Ensure that operations and maintenance plans address responses to these conditions, as relevant.
Ex. 1 to MCEA Comments-Grace Dairy, Chippewa County

Integrating Climate Information Into • December 2020 Environmental Quality Board MEPA Program Requirements
58
Provide the number of existing underground storage tanks and aboveground storage tanks that will remain on the property and be utilized in the project, and the age of each. Older tanks are more likely to experience increased water intrusion/ingress, corrosion, floating, etc. as a result of intense rainfall, flooding, and higher groundwater levels becoming more common in Minnesota’s changing climate, with the potential for environmental effects. Mitigations include replacing older tanks.
Changes in Minnesota’s climate including rainfall events of greater intensity and more localized flooding, more frequent freeze/thaw cycles, lack of snow cover, extreme heat, etc. may damage infrastructure and create situations that result in accidental spills and releases.
Changes in Minnesota’s climate may increase the severity and reach of the environmental effects. Stronger stormwater runoff can sweep more pollutants from spills and releases farther and faster into water bodies, while localized flooding may contaminate larger areas with a toxic stew of chemicals, and create more hazardous wastes. Increased days of extreme heat and humidity could make cleanup of accidental spills and releases more difficult with greater health impacts for emergency responders and communities.
Because climate change is anticipated to worsen both water quality and air quality, the influence on environmental effects also refers to how spills and releases add pollutants to air and water resources that are becoming increasingly fragile and unhealthy due to climate change. Spills and releases in the future may be expected to result in worse public health outcomes and more lasting environmental damage than if they occurred without climate change.
Include in the spill prevention plan contingency plans for extreme rainfall events and localized flooding, excessive heat, repeated freeze/thaw, and other anticipated consequences of climate change as relevant.
Increased precipitation, more frequent extreme rainfall events and localized flooding make environmental effects more likely and may increase the severity of environmental effects, for example:
Potential damage to storage areas may result from localized flooding during intense rainfall More infiltration into aquifers from increased precipitation mobilizing pollutants causing
increased costs for sites More extreme heat and humidity may affect handling and storage, for example:
Increased temperatures, especially longer warm seasons, will cause site owners to have to alter storage practices and identify new methods and processes of disposal, likely increasing costs
Increases in temperatures will affect some chemicals at permitted sites causing expansion and changes in chemicals, possibly resulting in leaks, explosion and other reactions such as off-gassing
Changing winter conditions (warmer lows and more freeze-thaw) are likely to have negative impacts on infrastructure and may necessitate repair or replacement. Mitigations include identifying flood risk, and handling and storing hazardous wastes in locations adequately protected from the type of extreme events anticipated from climate change.
13. Fish, wildlife, plant communities, and sensitive ecological resources The 2015-2025 Minnesota Wildlife Action Plan (MNWAP) took a habitat and landscape approach to address climate change. Chapter 1 describes the landscape approach via the Wildlife Action Network (WAN), and Chapter 3 identifies target habitat/ecosystems most sensitive to climate change.
The WAN includes concepts such as, providing movement corridors along climate gradients and building-out protected habitat to provide ecotonal shifts. See also scientific references in the WAN (p. 36). In addition to the MNWAP, there are several sources of information on climate change, summarized briefly below:
Ex. 1 to MCEA Comments-Grace Dairy, Chippewa County

Integrating Climate Information Into • December 2020 Environmental Quality Board MEPA Program Requirements
59
Historical data: Climate factors have already changed considerably from historical averages throughout Minnesota. Although not necessarily predictive of the future, historical changes are inarguable and may help to envision trends. These trends must be referenced to particular geographies. To learn more about potential climate changes within your particular area, one can access several DNR websites.
Watershed climate summaries depict the past 30 years of climate in comparison to historic conditions (123 years) for fine scale watersheds throughout Minnesota. Data presented include temperature (minimum, mean, and maximum) and mean precipitation in various formats: mapped within the watershed and graphed by month in relation to historical averages.
Minnesota climate summaries use the same data as above, within an interactive interface. A use specifies one or multiple watersheds, years of interest, and other factors, then sees customized graphs.
Past climate data gives a number of visualization options for mapped statewide data. One example is a set of ‘animated’ .pdf’s showing moving averages through the past 123 years of data on a ‘heat-map’ style map of the state for metrics such as wintertime minimum temperature. Other resources include ice-in and out times, snowfall, flooding histories, etc.
Species vulnerability assessments: Species vulnerability is the result of the following factors, each of which is influenced by climate change: Shifts in geographical range of the species Shifts in the range of species’ food sources
Changes in timing of mating, reproduction of species and their food source Natureserve: https://www.usgs.gov/ecosystems/climate-adaptation-science-centers Audubon’s 2019 MN Climate Change report: “Survival by Degrees: 389 bird species on the
brink”. The following webpage shows Audubon’s report for Minnesota species: https://www.audubon.org/climate/survivalbydegrees/state/us/mn. It breaks Minnesota bird species into high, moderate, low vulnerability, and stable species. You can then click on an individual species and get more details – it also allows you to adjust the warming scenario and chose a season (summer or winter) to see how those conditions are expected to impact that species.
Climate change and Minnesota has materials helpful in depicting a broader context around climate change. Materials explain the importance of including adaptation to climate change in management, including anecdotal accounts from hunting and fishing perspectives.
Midwest climate is an external website with societal contextual information and materials. Climate Change Resources links to a vast array of printed and digital climate change resources. USGS climate adaptation centers develop data and tools to address the informational needs of
natural and cultural resource managers. Topics include the impacts of climate change on fish, wildlife, and ecosystems (see list of projects).
Climate change resources includes external links to forward-looking continental climate projection models. These are more speculative than the past data resources, because many assumptions go into the models, and they are done at larger spatial scales.
North American Regional Climate Change Assessment Program provides six regional climate models run by four atmosphere-ocean general circulation modelsyou can explore results from different models.
18. Transportation Facilities may be built with good protections for the immediate building and site but in a location subject to flash or extended flooding (pluvial and fluvial) from extreme precipitation. Occupants could be
Ex. 1 to MCEA Comments-Grace Dairy, Chippewa County

Integrating Climate Information Into • December 2020 Environmental Quality Board MEPA Program Requirements
60
endangered or the facility could be rendered inaccessible for periods of time as climate change worsens, with life-threatening consequences if the power and/or water supply is damaged by flooding. The intent is for climate change effects to be considered as part of transportation planning and traffic-related aspects.
Ex. 1 to MCEA Comments-Grace Dairy, Chippewa County

Integrating Climate Information Into • December 2020 Environmental Quality Board MEPA Program Requirements
61
Appendix C Mandatory category effectiveness for requiring review of project types with GHG emissions Minnesota statute § 216H.07, subd. 3 requires the Minnesota Pollution Control Agency (MPCA) to report on statewide progress toward the greenhouse gas (GHG) reduction goals identified in the Next Generation Energy Act (Minn. Stat. § 216H.02). The MPCA tracks GHG emissions by gas, economic sector and emission source type. Emissions are grouped in the agricultural, commercial, electric generation, industrial, residential, transportation, and waste sectors; and into major activity groups by energy use and fuel production, agricultural process, industrial process, and waste management emissions.
The following assessment uses 2016 GHG emissions reporting information as well as 2016-2019 Environmental Review Program information to determine if the existing mandatory EAW categories (MR 4410.4300) and existing mandatory EIS categories (MR 4410.4400) include most GHG emissions sectors and sources tracked through statutory requirements. Total GHG emissions from all emissions sources reported by the MPCA in 2016 was 166,765,571.2 TY CO2e tons. In order to streamline the data, this assessment evaluated only emissions sources that produced approximately 91.1-percent of the total 2016 GHG emissions, by reporting sector. This limit ensures sufficient information for drawing conclusions. ER Program effectiveness is determined by whether most, or all, of potential GHG emissions sources would be assessedunder existing mandatory EAW and EIS categories.
The Summary (Table 1) and GHG reporting sector tables (Tables 2-9; beginning next page) also include ER Program data from a 4-year time period, to reduce the effect of fluctuations among mandatory EAW and EIS category project types from year-to-year.
Table 1C: Mandatory EAW and EIS Categories and GHG Reporting Sector Summary Table
Data Year
2016 2017 2018 2019 4-year Total
Total ER Projects
Reviewed 65 77 84 53 282 2016 GHG Emissions Reported
166,765,571.2 tons CO2e
GHG Reporting Sector % of Total 2016 GHG Emissions
% of Total ER Projects
Agriculture 25.0% 13.1% Commercial 3.2% 8.5% Electric Generation 23.5% 1.1% Forestry, Land Use 0.0% 22.3% Industrial 11.9% 23.8% Residential 5.3% 11.7% Transportation 21.2% 15.6% Waste Management 1.0% 3.9%
91.1% 100%
Ex. 1 to MCEA Comments-Grace Dairy, Chippewa County
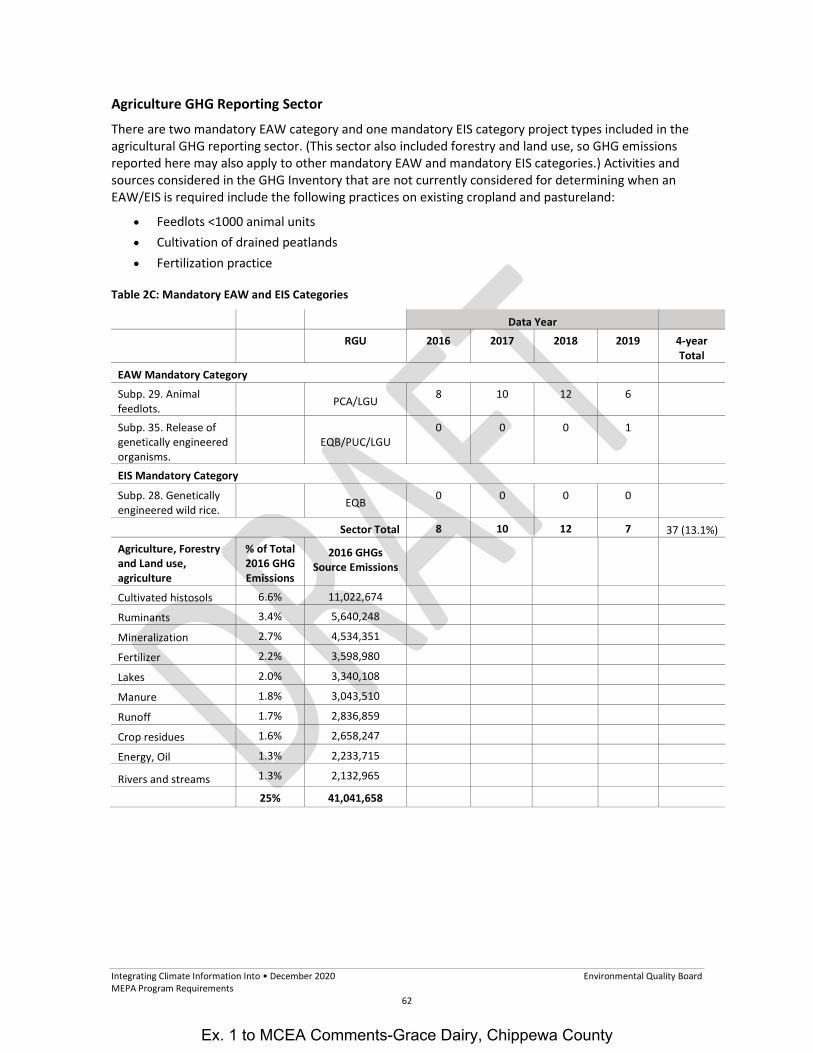
Integrating Climate Information Into • December 2020 Environmental Quality Board MEPA Program Requirements
62
Agriculture GHG Reporting Sector There are two mandatory EAW category and one mandatory EIS category project types included in the agricultural GHG reporting sector. (This sector also included forestry and land use, so GHG emissions reported here may also apply to other mandatory EAW and mandatory EIS categories.) Activities and sources considered in the GHG Inventory that are not currently considered for determining when an EAW/EIS is required include the following practices on existing cropland and pastureland:
Feedlots <1000 animal units Cultivation of drained peatlands Fertilization practice
Table 2C: Mandatory EAW and EIS Categories
Data Year RGU 2016 2017 2018 2019 4-year
Total EAW Mandatory Category Subp. 29. Animal feedlots. PCA/LGU 8 10 12 6
Subp. 35. Release of genetically engineered organisms.
EQB/PUC/LGU 0 0 0 1
EIS Mandatory Category Subp. 28. Genetically engineered wild rice. EQB 0 0 0 0
Sector Total 8 10 12 7 37 (13.1%)
Agriculture, Forestry and Land use, agriculture
% of Total 2016 GHG Emissions
2016 GHGs Source Emissions
Cultivated histosols 6.6% 11,022,674
Ruminants 3.4% 5,640,248
Mineralization 2.7% 4,534,351
Fertilizer 2.2% 3,598,980
Lakes 2.0% 3,340,108
Manure 1.8% 3,043,510
Runoff 1.7% 2,836,859
Crop residues 1.6% 2,658,247
Energy, Oil 1.3% 2,233,715
Rivers and streams 1.3% 2,132,965
25% 41,041,658
Ex. 1 to MCEA Comments-Grace Dairy, Chippewa County
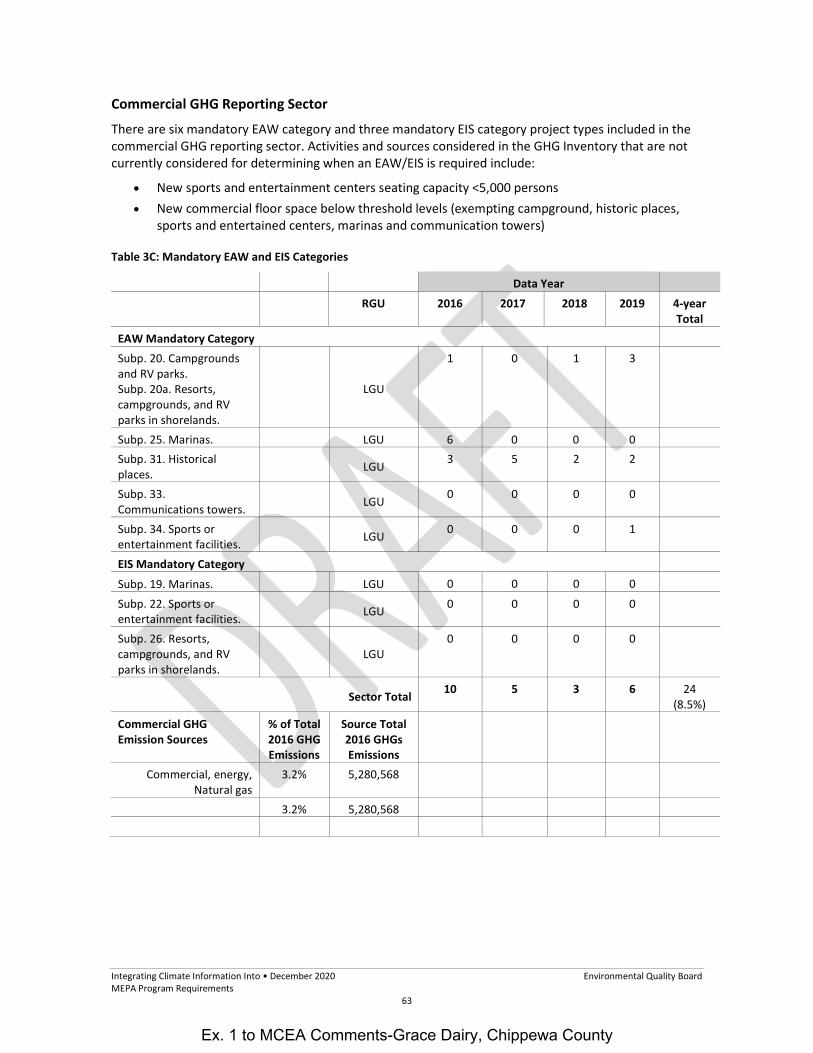
Integrating Climate Information Into • December 2020 Environmental Quality Board MEPA Program Requirements
63
Commercial GHG Reporting Sector There are six mandatory EAW category and three mandatory EIS category project types included in the commercial GHG reporting sector. Activities and sources considered in the GHG Inventory that are not currently considered for determining when an EAW/EIS is required include:
New sports and entertainment centers seating capacity <5,000 persons New commercial floor space below threshold levels (exempting campground, historic places,
sports and entertained centers, marinas and communication towers)
Table 3C: Mandatory EAW and EIS Categories
Data Year
RGU 2016 2017 2018 2019 4-year
Total EAW Mandatory Category Subp. 20. Campgrounds and RV parks. Subp. 20a. Resorts, campgrounds, and RV parks in shorelands.
LGU
1 0 1 3
Subp. 25. Marinas. LGU 6 0 0 0
Subp. 31. Historical places. LGU 3 5 2 2
Subp. 33. Communications towers. LGU 0 0 0 0
Subp. 34. Sports or entertainment facilities. LGU 0 0 0 1
EIS Mandatory Category Subp. 19. Marinas. LGU 0 0 0 0 Subp. 22. Sports or entertainment facilities. LGU 0 0 0 0
Subp. 26. Resorts, campgrounds, and RV parks in shorelands.
LGU 0 0 0 0
Sector Total 10 5 3 6 24 (8.5%)
Commercial GHG Emission Sources
% of Total 2016 GHG Emissions
Source Total 2016 GHGs Emissions
Commercial, energy, Natural gas
3.2% 5,280,568
3.2% 5,280,568
Ex. 1 to MCEA Comments-Grace Dairy, Chippewa County

Integrating Climate Information Into • December 2020 Environmental Quality Board MEPA Program Requirements
64
Electric Generation GHG Reporting Sector There are three mandatory EAW category and three mandatory EIS category project types included in the electric generation GHG reporting sector. Activities and sources considered in the GHG Inventory that are not currently considered for determining when an EAW/EIS is required include:
Electric power imports Distributed combustion-based generation Transmission lines < 70 kV
Table 4C: Mandatory EAW and EIS Categories
Data Year
RGU 2016 2017 2018 2019 4-year
Total EAW Mandatory Category Subp. 2. Nuclear fuels and nuclear waste. EQB/MDH 0 0 0 0
Subp. 3. Electric-generating facilities. EQB 0 1 0 1
Subp. 6. Transmission lines. EQB 0 0 0 1
EIS Mandatory Category
Subp. 2. Nuclear fuels and nuclear waste. PCA/EQB/COMM/
PUC/MDH 0 0 0 0
Subp. 3. Electric-generating facilities. PUC 0 0 0 0
Subp. 6. Transmission lines. PUC 0 0 0 0
Sector Total 0 1 0 2 3 (1.1%)
Electric Generation GHG Emission Sources
% of Total 2016 GHG Emissions
Source Total 2016 GHGs Emissions
Electricity generation, energy, Coal,
16.4% 27,305,799 Electricity generation, energy, Imported electricity,
4.5% 7,421,558
Electricity generation, energy, Natural gas
2.7% 4,490,429 23.5% 39,217,786
Ex. 1 to MCEA Comments-Grace Dairy, Chippewa County

Integrating Climate Information Into • December 2020 Environmental Quality Board MEPA Program Requirements
65
Forestry and Land Use GHG Reporting Sector There are eight mandatory EAW category and four mandatory EIS category project types included in the forestry and land used GHG reporting sector. Activities and sources considered in the GHG Inventory that are not currently considered for determining when an EAW/EIS is required include:
Upland commercial forest harvest in non-protected areas Water impoundments <160 acres surface area
Table 5C: Mandatory EAW and EIS Categories
Data Year
RGU 2016 2017 2018 2019 4-year
Total EAW Mandatory Category Subp 24. Water appropriation and impoundments.
DNR 0 0 0 0
Subp. 26. Stream diversion. DNR/LGU 3 3 5 3
Subp. 27. Wetlands and public waters. DNR/LGU 8 6 11 5
Subp. 28. Forestry DNR 0 0 0 0 Subp. 30. Natural areas. DNR/LGU 0 1 0 0
Subp. 36. Land use conversion, including golf courses.
LGU/Met Council 0 4 1 1
Subp. 36a. Land conversions in shoreland.
LGU 0 0 0 1
Subp. 37. Recreational trails. DNR/LGU 1 1 4 4
EIS Mandatory Category Subp. 18. Water appropriation and impoundments
DNR 1 0 0 0
Subp. 20. Public waters and public water wetlands.
DNR 0 0 0 0
Subp. 23. Water diversion. DNR 0 0 0 0
Subp. 27. Land use conversion in shorelands.
LGU 0 0 0 0
Sector Total 13 15 21 14 63 (22.3%)
Forestry, Land Use GHG Emission Sources
No GHG emissions sources reported from these project types.
Ex. 1 to MCEA Comments-Grace Dairy, Chippewa County
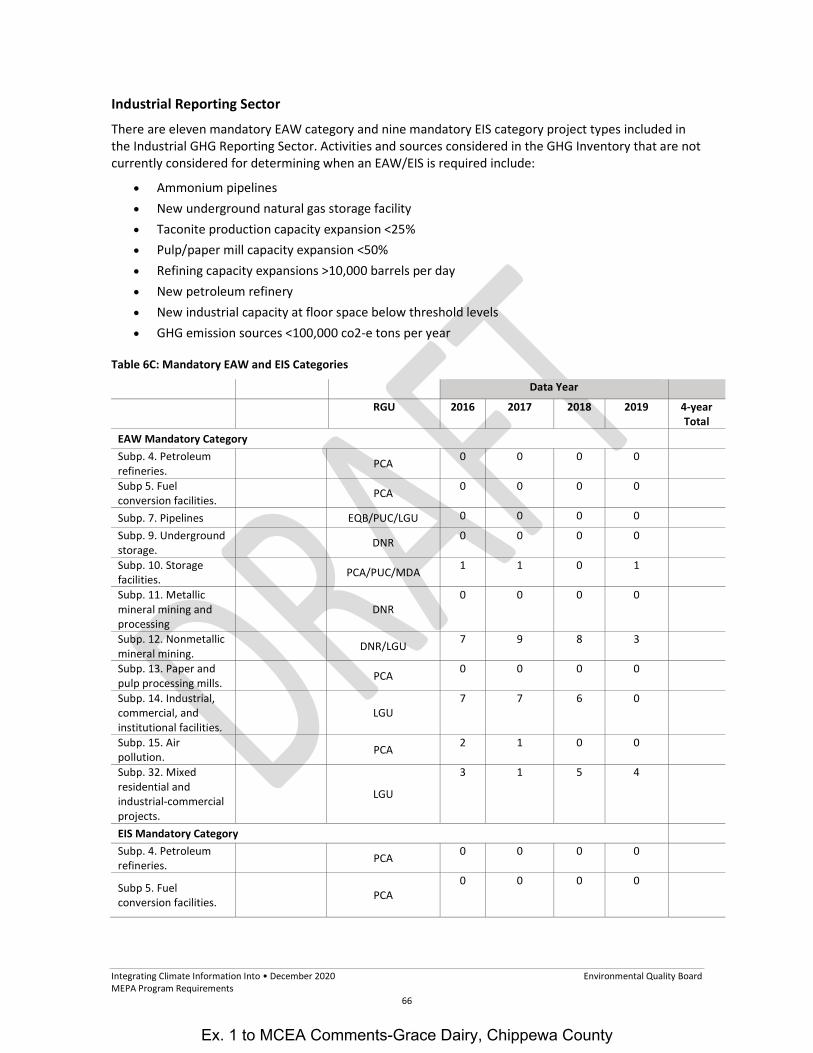
Integrating Climate Information Into • December 2020 Environmental Quality Board MEPA Program Requirements
66
Industrial Reporting Sector There are eleven mandatory EAW category and nine mandatory EIS category project types included in the Industrial GHG Reporting Sector. Activities and sources considered in the GHG Inventory that are not currently considered for determining when an EAW/EIS is required include:
Ammonium pipelines New underground natural gas storage facility Taconite production capacity expansion <25% Pulp/paper mill capacity expansion <50% Refining capacity expansions >10,000 barrels per day New petroleum refinery New industrial capacity at floor space below threshold levels GHG emission sources <100,000 co2-e tons per year
Table 6C: Mandatory EAW and EIS Categories
Data Year
RGU 2016 2017 2018 2019 4-year
Total EAW Mandatory Category Subp. 4. Petroleum refineries. PCA 0 0 0 0
Subp 5. Fuel conversion facilities. PCA 0 0 0 0
Subp. 7. Pipelines EQB/PUC/LGU 0 0 0 0 Subp. 9. Underground storage. DNR 0 0 0 0
Subp. 10. Storage facilities. PCA/PUC/MDA 1 1 0 1
Subp. 11. Metallic mineral mining and processing
DNR 0 0 0 0
Subp. 12. Nonmetallic mineral mining. DNR/LGU 7 9 8 3
Subp. 13. Paper and pulp processing mills. PCA 0 0 0 0
Subp. 14. Industrial, commercial, and institutional facilities.
LGU 7 7 6 0
Subp. 15. Air pollution. PCA 2 1 0 0
Subp. 32. Mixed residential and industrial-commercial projects.
LGU
3 1 5 4
EIS Mandatory Category Subp. 4. Petroleum refineries. PCA 0 0 0 0
Subp 5. Fuel conversion facilities. PCA
0 0 0 0
Ex. 1 to MCEA Comments-Grace Dairy, Chippewa County
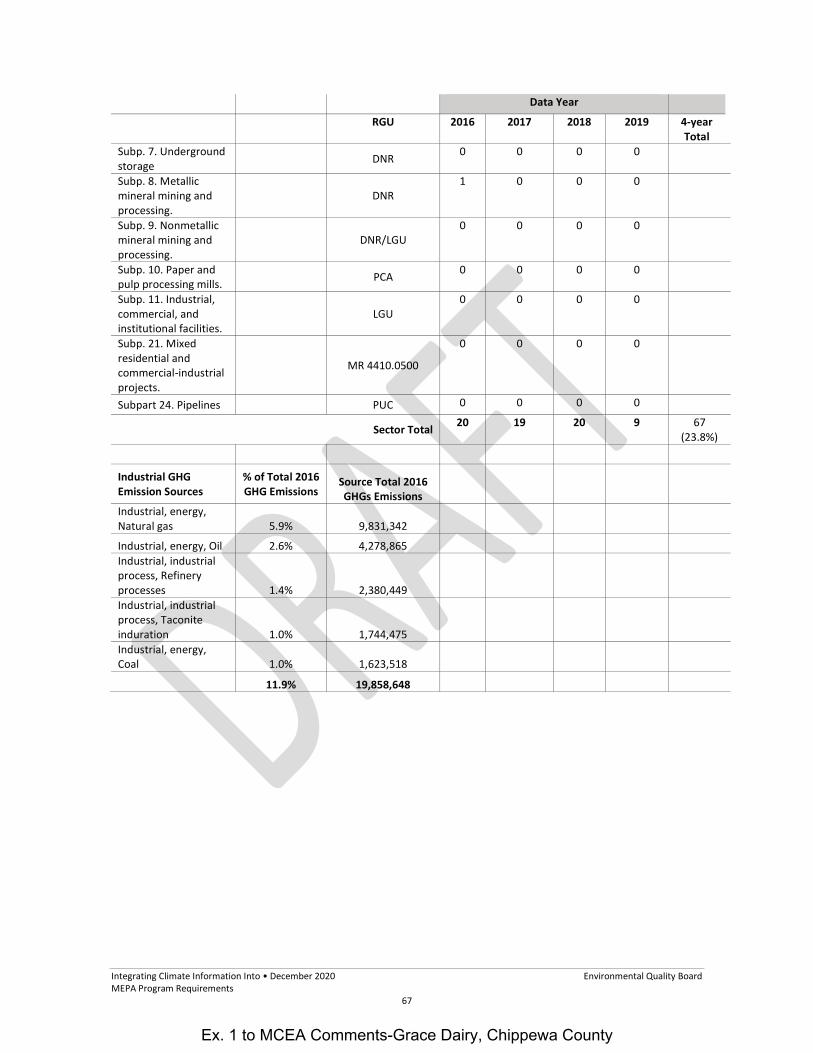
Integrating Climate Information Into • December 2020 Environmental Quality Board MEPA Program Requirements
67
Data Year
RGU 2016 2017 2018 2019 4-year Total
Subp. 7. Underground storage DNR 0 0 0 0
Subp. 8. Metallic mineral mining and processing.
DNR 1 0 0 0
Subp. 9. Nonmetallic mineral mining and processing.
DNR/LGU 0 0 0 0
Subp. 10. Paper and pulp processing mills. PCA 0 0 0 0
Subp. 11. Industrial, commercial, and institutional facilities.
LGU 0 0 0 0
Subp. 21. Mixed residential and commercial-industrial projects.
MR 4410.0500
0 0 0 0
Subpart 24. Pipelines PUC 0 0 0 0
Sector Total 20 19 20 9 67 (23.8%)
Industrial GHG Emission Sources
% of Total 2016 GHG Emissions
Source Total 2016 GHGs Emissions
Industrial, energy, Natural gas 5.9% 9,831,342
Industrial, energy, Oil 2.6% 4,278,865 Industrial, industrial process, Refinery processes 1.4% 2,380,449
Industrial, industrial process, Taconite induration 1.0% 1,744,475
Industrial, energy, Coal 1.0% 1,623,518
11.9% 19,858,648
Ex. 1 to MCEA Comments-Grace Dairy, Chippewa County

Integrating Climate Information Into • December 2020 Environmental Quality Board MEPA Program Requirements
68
Residential Reporting Sector There are two mandatory EAW category and two mandatory EIS category project types included in the Residential GHG Reporting Sector. Activities and sources considered in the GHG Inventory that are not currently considered for determining when an EAW/EIS is required include:
New residential developments below unit thresholds
Table 7C: Mandatory EAW and EIS Categories
Data Year
RGU 2016 2017 2018 2019 4-year
Total EAW Mandatory Category Subp. 19. Residential development. Subp. 19a. Residential development in shoreland outside of the seven-county Twin Cities metropolitan area.
LGU
1 12 16 4
EIS Mandatory Category Subp. 14. Residential development. Subp. 14a. Residential development in shoreland outside of the seven-county Twin Cities Metropolitan Area.
LGU
0 0 0 0
Sector Total 1 12 16 4 33 (11.7%)
Residential GHG Emission Sources (GHG Reporting Inventory)
% of Total 2016 GHG Emissions
Source Total 2016 GHGs Emissions
Residential, energy, Natural gas
4.3% 7,115,135 Residential, energy, Oil
1.0% 1,735,493 5.3% 8,850,628
Ex. 1 to MCEA Comments-Grace Dairy, Chippewa County

Integrating Climate Information Into • December 2020 Environmental Quality Board MEPA Program Requirements
69
Transportation Reporting Sector There are four mandatory EAW category and three mandatory EIS category project types included in the transportation GHG Reporting Sector. Activities and sources considered in the GHG Inventory that are not currently considered for determining when an EAW/EIS is required include:
New local roads Airport terminal capacity Passenger air travel and air freight Lock and dam operation River and harbor dredging Lake shipping and shipping terminals Rail freight Passenger rail Natural gas services Light-duty truck emissions associated with activities not covered by the mandatory categories,
like personal transportation associated with smaller construction projects
Table 8C: Mandatory EAW and EIS Categories
Data Year
RGU 2016 2017 2018 2019 4-year
Total EAW Mandatory Category Subp. 8. Transfer facilities. PCA 0 0 0 0
Subp. 21. Airport projects. DOT/LGU/MAC 0 1 1 1
Subp. 22. Highway projects. DOT/LGU 10 12 10 8
Subp. 23. Barge fleeting. DOT 0 0 0 0
EIS Mandatory Category Subp. 15. Airport runway projects. DOT/LGU 1 0 0 0
Subp. 16. Highway projects. DOT/LGU 0 0 0 0
Subp. 17. Barge fleeting. DOT/Port Authority
0 0 0 0
Sector Total 11 13 11 9 44 (15.6%)
Transportation GHG Emission Sources (GHG Reporting Inventory)
% of Total 2016 GHG Emissions Source Total 2016
GHGs Emissions
Transportation, energy, Light-duty trucks
9.1% 15,246,425 Transportation, energy, Passenger cars
4.8% 8,030,306 Transportation, energy, Heavy-duty trucks
3.7% 6,250,832 Transportation, energy, Aviation
2.4% 4,007,481 Transportation, energy, Natural gas transmission
1.1% 1,773,720
21.2% 35,308,764
Ex. 1 to MCEA Comments-Grace Dairy, Chippewa County

Integrating Climate Information Into • December 2020 Environmental Quality Board MEPA Program Requirements
70
Waste Management Reporting Sector There are three mandatory EAW category and three mandatory EIS category project types included in the waste management GHG Reporting Sector. Activities and sources considered in the GHG Inventory that are not currently considered for determining when an EAW/EIS is required include:
Increase in domestic wastewater treatment facility capacity less than 50% On-site septic systems
Table 9C: Mandatory EAW and EIS Categories
Data Year
RGU 2016 2017 2018 2019 4-year
Total EAW Mandatory Category Subp. 16. Hazardous waste. PCA 0 0 0 0
Subp. 17. Solid Waste PCA 1 1 2 2 Subp. 18. Wastewater systems. PCA 3 1 0 1
EIS Mandatory Category Subp. 12. Hazardous waste. PCA 0 0 0 0
Subp. 13. Solid Waste PCA 0 0 0 0
Subp. 25. Incinerating wastes containing PCBs.
PCA 0 0 0 0
Sector Total 4 2 2 3 11 (3.9%) Waste Management GHG Emission Sources
% of Total 2016 GHG Emissions
Source Total 2016 GHGs Emissions
Waste, Landfills 1.0% 1,733,305 1.0% 1,733,305
Ex. 1 to MCEA Comments-Grace Dairy, Chippewa County

Integrating Climate Information Into • December 2020 Environmental Quality Board MEPA Program Requirements
71
Appendix D: Glossary of terms Because the State ER Program is implemented through a regulatory process, some terms have meaning defined by rule (MR 4410.0200); other terms reflect common usage.
Project: a governmental action, the results of which would cause physical manipulation of the environment, directly or indirectly. The determination of whether a project requires environmental documents shall be made by reference to the physical activity to be undertaken and not to the governmental process of approving the project.
Proposer: the person or governmental unit that proposes to undertake or to direct others to undertake a project.
Governmental unit: any state agency and any general or special purpose unit of government in the state, including watershed districts organized under Minnesota Statutes, chapter 103D, counties, towns, cities, port authorities, housing authorities, and the Metropolitan Council, but not including courts, school districts, the Iron Range Resources and Rehabilitation Board, and regional development commissions
Environment: physical conditions existing in the area that may be affected by a proposed project. It includes land, air, water, minerals, flora, fauna, ambient noise, energy resources, and artifacts or natural features of historic, geologic, or aesthetic significance.
Environmental effects: “Environmental Effects means an appreciable and significant impact, whether immediate or delayed on any component of the environment.” 1974 Statement of Need and Reasonableness for Minnesota Rules Chapter 4410.
Significant: (this definition is no longer included in MR 4410, but is now reflected in the criteria described in Minnesota Rules chapter 4410.1700) "Significant" means a substantial impact. Significance shall be determined according to the magnitude of an effect and its probability of occurring. Small effects may have a cumulative effect that is significant. Irreversibility, effect on man, degree of change, duration of impact, and scope and stability of affected ecosystems are factors that are relevant in determining significance.” 1974 Statement of Need and reasonableness for Minnesota Rules Chapter 4410.
Minnesota Pollution Control Agency greenhouse gas emissions inventory reporting “Under Minnesota statute (Minn. Stat. § 216H.07, subd. 3), the Minnesota Pollution Control Agency (MPCA) is obligated to report on statewide progress toward the greenhouse gas (GHG) reduction goals enumerated in the Next Generation Energy Act (Minn. Stat. § 216H.02).” https://www.pca.state.mn.us/sites/default/files/p-gen4-08.pdf
Ex. 1 to MCEA Comments-Grace Dairy, Chippewa County
-----Original Message----- From: Kirby Hettver <[email protected]> Sent: Thursday, April 29, 2021 1:33 PM To: Ness, Jenna (MPCA) <[email protected]> Cc: Kirby Hettver <[email protected]> Subject: Grace Dairy Comment
This message may be from an external email source. Do not select links or open attachments unless verified. Report all suspicious emails to Minnesota IT Services Security Operations Center.
________________________________
My name is Kirby Hettver, a 5th generation farmer residing in Chippewa County. I write today in support of permitting for Grace Dairy. My family and I live within two miles of where Grace will be located.
There are many reasons I support the permitting and development of this site, but today I will focus on just one that directly addresses the addition of GHG emissions on the EAW. One of the benefits that often gets overlooked is the addition of perennial forage crop production, specifically alfalfa, in the community. As a farmer, the addition of alfalfa into our rotation has been a benefit. We establish a stand that ideally lasts four to five years which also enhances soil health. Successful completion of Grace will require the addition of alfalfa acres into the community, definitely an advantage we can all support!
Sincerely
Kirby Hettver
Sent from my iPhone
16

Division of Ecological & Water Resources Region 4 (Southern Region) 21371 Highway 15 South New Ulm, MN 56073
April 19, 2020
Jenna Ness, MPCA Environmental Review 520 Lafayette Road N. St. Paul, MN 55155 [email protected]
Re: Grace Dairy, Chippewa County Environmental Assessment Worksheet
Dear Jenna,
Thank you for the opportunity to review the proposed Grace Dairy facility. We appreciate your work to better incorporate concerns related the DNR’s managed Grace Marshes Wildlife Management Are (WMA) in to the EAW. We also appreciate the work you have done to relay the DNR’s concerns to the project proposer. We contend that the inherent development of a dairy and associated traffic, facilities, and housing to support over 10,000 cows in such close proximity to Grace WMA will negatively impact the WMA and natural resources in several ways.
Grace WMA is our highest quality prairie WMA in the local area. This relatively small acreage contains some of the only remnant prairie in the area. In addition to providing wildlife and natural recreational opportunities, the WMA hosts rare and special concern species, species that are completely dependent on the prairie that has been nearly wiped out from this landscape. From a human and wildlife perspective, this WMA is a secluded, quiet, and peaceful space and is an important natural resource in a highly developed and manipulated landscape.
We believe this facility and its use will inevitably change the nature of this WMA in several ways. For this reason, we again implore the project proposers to consider re-locating this mega-dairy to a less environmentally vulnerable location. We note that the planned well development is several miles south; could there be a more ideal location for the dairy that does not compromise this WMA and saves the proposer costs of piping water for miles? If the proposer will not re-locate the facility, we offer the following persisting concerns and opportunities for mitigation:
• Traffic, noise, and dust: This facility is estimated to increase traffic by 38 vehicles as noted in the EAW.Presumably most of these are large trucks. Highway 40 already experiences many vehicles (mostly cars) asnoted in the EAW. We are concerned about increased traffic and associated noise, emissions, and visualimpacts on the local road including 30th Avenue and 50th Street NE. We believe the increased vehicles willdisrupt the human and wildlife users of this property. We suggest that the project proposer pave roads
17

DNR comments on Grace Dairy EAW Page 2
adjacent the facility and WMA to reduce road dust. We also suggest that truck routes be planned to minimize travel past the WMA.
• Manure application: As noted in the EAW, manure (which contains invasive weed seeds and nutrients) is planned to be applied directly adjacent the WMA. We have observed situations such as this effectively ruin a native plant community. Particularly with rare, native species in the WMA, we don’t believe manure application adjacent the WMA is prudent or an environmentally responsible decision. We would like to request a setback for manure application. At a minimum, we are requesting that the County ordinance on manure application be applied, which as noted in the EAW, requires 100 feet of separation from wetlands. As identified in the EAW and readily available, the WMAs are largely composed of wetlands. The NWI wetland data layer shows several wetlands near the WMA boundary. In accordance with the Chippewa County Ordinance, we expect that manure will not be placed within 100 feet of these wetlands, and we request a 100 foot buffer from all WMA boundaries.
• Crop changes and impact to grassland birds: Dairy operations often shift many local fields from corn/bean to alfalfa due to the dietary needs of the cows. While alfalfa is generally viewed as superior to a cultivated and heavily supplemented and sprayed field for water quality and other environmental purposes, alfalfa cuttings have deadly consequences to grass nesting birds when those cuttings occur prior to mid-July or August. Because there is already approximately 1200 acres of grasslands between the WMA and adjacent CREP, grassland birds are present and likely to move into alfalfa fields to nest, resulting in grassland bird and nest casualties. The end result of which is a net negative to grassland nesting bird populations (i.e. population sink) in the immediate vicinity. We suggest that alfalfa cuttings near the WMA be planned to avoid bird ground nesting season or that cuttings are done with very high frequency to limit the available habitat.
• WMA management and use factors: The WMA uses fire to manage vegetation. While burning conditions
are carefully selected to reduce smoke, substantial smoke may cross the dairy footprint during prescribed burns, particularly because the proposers are planning the facility to be directly to the East of the WMA and CREP i.e., downwind of prevailing wind direction. A second factor of the WMA that may affect the dairy: the WMA is used by white-tailed deer as a wintering area. Deer will gravitate to food that is easy to access. Any stored forage that is not inside an exclusion fence is susceptible to deer depredation. Deer on the dairy grounds or sharing cattle feed introduces the risk for deer to bovine and bovine to deer disease and parasite transmission, including bovine tuberculosis and liver flukes. The best prevention of deer problems is a combination of siting and site planning. We suggest that deer fencing be installed by the project proposer if the facility will not be re-located. The DNR would not favor deer shooting permits if deer become problematic and instead suggest thoughtful attention to these issue in the planning phases of the project.
• Overall environmental impact: This project will have a substantial environmental impact based on the factors above in addition to considerations of other resource use including methane gas production, climate change and groundwater. We suggest that the project proposers include mitigation to offset the overall environmental impact. We might suggest the restoration of the 40-acre department of waters wetland number 12004500, which was drained when a culvert was installed. This wetland would help store carbon,

DNR comments on Grace Dairy EAW Page 3
contribute to groundwater, and provide habitat. This would require design and coordination with the township.
Again, thank for the opportunity to comment and the work you have done on this project already. If the project proposer would consider alternate locations, DNR staff would be happy to assist by providing comments or recommendations.
Sincerely,
Joanne Boettcher. Regional Environmental Assessment Ecologist
Cc:
Cory Netland, Area Wildlife Manager Ethan Jenzen, Area Hydrologist Dave Trauba, Wildlife Regional Manager Tim Gieseke, EWR Assistant Regional Manager Robert Collet, EWR Regional Manager Scott Roemhildt, Regional Manager
-----Original Message----- From: Y Agent <[email protected]> Sent: Tuesday, April 27, 2021 2:10 PM To: Leibfried, Dana (MPCA) <[email protected]> Subject: MPCA Comments
This message may be from an external email source. Do not select links or open attachments unless verified. Report all suspicious emails to Minnesota IT Services Security Operations Center.
________________________________
Dear Ms. Leibfried, We are writing a comment for environmental Review on the building of the 10,500 cow dairy by Riverview Dairy, section 22, in Grace Township of Chippewa County. We are very concerned about the amount of water to be used at Grace Dairy that will be coming from the well in Section 15 Havelock Township. We know that approximately 120 million gallons per year of water could be coming from this well to be piped to the dairy in Grace Township.
We are not in favor of granting an easement to pipe this water across our land to the dairy 5.5 miles to the north of the well, because of the affect it will have on the water supply for our farm and the neighbors near the well. We, as well as several neighbors near that well could see significant affects from the amount of water that would be removed from this aquafer.
It would also seem to us that if the water supply isn't sufficient for this dairy nearer to where it is being built, that we shouldn't allow water to be piped from our area where it could be detrimental to us and our neighbors to supply the needs of the dairy. Our neighbors may need more water for their operations in the future and would not want a diminished supply if they chose to add or expand their operations. It is our understanding that their are already several high population confinement operations along the highway 40 corridor and we suspect that not enough water is available for this dairy because of the use of water by these other facilities already in use. With these reasons in mind we don't intend to participate in any project that would draw the large amount of water that this project proposes to use and possibly jeopardize the use of water by those living nearest the well.
Jerlyn and Dean Nordaune
18