Damage Onset and Growth in Carbon-Carbon Composite ... · damage onset and growth in carbon-carbon...
12
J. Acoustic Emission, 27 (2009) 77 © 2009 Acoustic Emission Group DAMAGE ONSET AND GROWTH IN CARBON-CARBON COMPOSITE MONITORED BY ACOUSTIC EMISSION TECHNIQUE ARIE BUSSIBA 1 , ROMANA PIAT 2 , MOSHE KUPIEC 1 , RAMI CARMI 1 , IGAL ALON 1 and THOMAS BÖHLKE 2 1) Nuclear Research Centre Negev, P.O. Box 9001, Beer-Sheva, Israel; 2) Institute of Engineering Mechanics, University of Karlsruhe, Postfach 6980 76128 Karlsruhe, Germany Abstract Carbon-carbon (C/C) composites with different densities (1.8, 1.35, 0.8 g/cm 3 ), produced by chemical vapor infiltration (CVI) were tested mechanically under quasi-static loading in bending mode of uniform and notched beams. Acoustic emission (AE) technique was used to track the mechanical threshold parameters as well as to characterize the damage build-up profile to frac- ture. In both states of stress (uniform and tri-axial), threshold values detected by AE activity in- dicated the damage onset. The sensitivity of the AE method to the density changes was apparent by variations of the threshold values. Decreasing the density from 1.8 to 0.8 g/cm 3 decreases the thresholds values (σ th , K Ith ) from 25 to 2 MPa and from 0.8 to 0.1 MPa·m 1/2 , respectively. Three stages in damage evolution to fracture were observed: Stage I, with no AE activity, Stage II, gradual/linear growth in AE counts up to an abrupt jump and Stage III with exponential increase in AE counts. Similarity in profile and threshold value were found between the cumulative AE counts vs. strain data and the crack density vs. strain predicted by micro mechanical model, indi- cating the importance of using AE in monitoring the damage evolution in composites with regard to structural integrity aspect. Wave analysis using fast Fourier transform (FFT) and short-time fast Fourier transform (ST-FFT) points out four possible failure micro-mechanisms: multilayer cracking, breaking of fiber bundles, interfacial matrix de-bonding and micro-crack growth. Breaking of fiber bundles was found to be the major damage mechanism for the low density C/C composite. Keywords: C/C composites, Threshold parameters, Damage accumulation, Structural integrity, FFT. Introduction Carbon-fiber reinforced carbon-matrix composites, known also as carbon-carbon (C/C) compos- ites, have densities in the range of 1.6-2.0 g/cm 3 . Their unique physical properties, such as low coef- ficient of thermal expansion, high thermal conductivity and high thermal shock resistance, combined with high strength at high temperatures (3000°C) and of increasing strength with temperature, make them good candidates as structural materials for aerospace and defense applications [1]. Enhancing and integrating such composites in load-bearing engineering components require special attention in the assessment of structural integrity and life prediction procedures [2]. The complexity of the frac- ture process of both initiation and evolution stages of multiple flaws in different modes (matrix cracking, interfacial de-bonding, fiber fracture, delamination and more) makes this task of reliable failure prediction more difficult than for metallic materials. For metals under quasi-static and cyclic loading, threshold parameters, such as threshold stress intensity factor in fatigue and in stress cor- rosion cracking, ΔK th and K ISCC , respectively, are crucial in order to increase the performance
Transcript of Damage Onset and Growth in Carbon-Carbon Composite ... · damage onset and growth in carbon-carbon...

J. Acoustic Emission, 27 (2009) 77 © 2009 Acoustic Emission Group
DAMAGE ONSET AND GROWTH IN CARBON-CARBON COMPOSITE MONITORED BY ACOUSTIC EMISSION TECHNIQUE
ARIE BUSSIBA1, ROMANA PIAT2, MOSHE KUPIEC1, RAMI CARMI1, IGAL ALON1
and THOMAS BÖHLKE2 1) Nuclear Research Centre Negev, P.O. Box 9001, Beer-Sheva, Israel;
2) Institute of Engineering Mechanics, University of Karlsruhe, Postfach 6980 76128 Karlsruhe, Germany
Abstract
Carbon-carbon (C/C) composites with different densities (1.8, 1.35, 0.8 g/cm3), produced by
chemical vapor infiltration (CVI) were tested mechanically under quasi-static loading in bending mode of uniform and notched beams. Acoustic emission (AE) technique was used to track the mechanical threshold parameters as well as to characterize the damage build-up profile to frac-ture. In both states of stress (uniform and tri-axial), threshold values detected by AE activity in-dicated the damage onset. The sensitivity of the AE method to the density changes was apparent by variations of the threshold values. Decreasing the density from 1.8 to 0.8 g/cm3 decreases the thresholds values (σth, KIth) from 25 to 2 MPa and from 0.8 to 0.1 MPa·m1/2, respectively. Three stages in damage evolution to fracture were observed: Stage I, with no AE activity, Stage II, gradual/linear growth in AE counts up to an abrupt jump and Stage III with exponential increase in AE counts. Similarity in profile and threshold value were found between the cumulative AE counts vs. strain data and the crack density vs. strain predicted by micro mechanical model, indi-cating the importance of using AE in monitoring the damage evolution in composites with regard to structural integrity aspect. Wave analysis using fast Fourier transform (FFT) and short-time fast Fourier transform (ST-FFT) points out four possible failure micro-mechanisms: multilayer cracking, breaking of fiber bundles, interfacial matrix de-bonding and micro-crack growth. Breaking of fiber bundles was found to be the major damage mechanism for the low density C/C composite. Keywords: C/C composites, Threshold parameters, Damage accumulation, Structural integrity, FFT. Introduction Carbon-fiber reinforced carbon-matrix composites, known also as carbon-carbon (C/C) compos-ites, have densities in the range of 1.6-2.0 g/cm3. Their unique physical properties, such as low coef-ficient of thermal expansion, high thermal conductivity and high thermal shock resistance, combined with high strength at high temperatures (3000°C) and of increasing strength with temperature, make them good candidates as structural materials for aerospace and defense applications [1]. Enhancing and integrating such composites in load-bearing engineering components require special attention in the assessment of structural integrity and life prediction procedures [2]. The complexity of the frac-ture process of both initiation and evolution stages of multiple flaws in different modes (matrix cracking, interfacial de-bonding, fiber fracture, delamination and more) makes this task of reliable failure prediction more difficult than for metallic materials. For metals under quasi-static and cyclic loading, threshold parameters, such as threshold stress intensity factor in fatigue and in stress cor-rosion cracking, ΔKth and KISCC, respectively, are crucial in order to increase the performance
78
reliability of structure in service. These factors are well defined and the experimental procedures in acquiring them are documented and given in various standards. In contrast, it is very difficult to define such parameters in composites due to the complicated structure and the variation in the lay-ups of composite materials and the inherent defects due to the fabrication process. The current study adopted the AE technique to evaluate threshold parameters during loading of C/C composites under various states of stress (uniform and multi-axial in the presence of notch) [3]. In order to examine the sensitivity of the AE method to define useful and reliable me-chanical properties, three C/C composites with different densities were designed (symbolized range of porosity from high to low) and the mechanical response was monitored simultaneously by AE. In addition, AE data was used to characterize the damage accumulation profile to fracture and to specify the possible active micro-failure modes by using waveform-processing analyses, FFT and ST-FFT [4]. Finally, an attempt to compare between a micro-mechanical model devel-oped for some composites with AE experimental data is suggested and discussed. Materials Production and Experimental Procedures
In general C/C composites are produced by isothermal, isobaric CVI. This process consists of infiltrating carbon from hydrocarbon gas and depositing on carbon fibers in a hermetically closed high temperature reactor. In the current work the CVI process was performed at 1095°C with to-tal pressure of 30 kPa. The carbon was deposited in the form of a pyrolytic carbon matrix around the fibers resulting in a layered morphology [5, 6]. For the infiltration, carbon fiber felts made of randomly oriented chopped carbon fibers were used as performs. The fiber volume content was about 12% (of the total volume) and the diameter of the fiber was of the order of 10 µm. The felts were infiltrated over different times to obtain matrices with different densities; 120 h re-sulted in high density (HD) of 1.8 g/cm3, 45 h with medium density (MD) of 1.35 g/cm3 and 24 h with low density (LD) of 0.85 g/cm3. The infiltration was carried out in a vertical gap reactor us-ing pure methane as precursor gas. More details of the infiltration procedure are given elsewhere [7, 8]. Typical microstructure of the HD composite is shown in Fig. 1(a-b). The layered structure around the fibers was revealed after fracture (Fig. 1c) using scanning electron microscopy. More about material characterization including uses of selected area electron diffraction technique to obtain orientation angle as a function of the distance to the fiber surface are reported elsewhere [9].
Flexural tests were conducted on bars with dimensions of 5 x 7 x 55 mm using three-point
bending (3PB) and four point bending (4PB-inner span of 20 mm) set-ups, with outer span of 40 mm. The deflection at the outer surface of the specimen was measured by a sensitive extensome-ter (0.05 mm/mm full scale). Quasi-static loading with velocity of 0.5 mm/min was carried out using a computerized machine with a load cell of 10 kN. The flexural properties, modulus, stress and strain at fracture were calculated according to the standard expressions for bending beam [10].
Fracture toughness (KIC) was determined by loading of notched bar in 3PB set-up, at test ve-locity of 1 mm/min. Specimen dimensions were 4 x 5 x 55 mm and notch depth was 2 mm. The V-notch with radius of 30 µm has been treated as a sharp crack. Clip-on gauge was attached at the front of the notch measuring the crack opening displacement (COD). KIC was calculated ac-cording to the standard expression for stress intensity factor [10].

79
Fig. 1. (a-b) Polarized light microscopy micrographs showing microstructure of the HD C/C compos-ite, (c) the layered morphology around the fibers as revealed after fracture.
AE technique was used to detect the very early damage during loading in 3PB of the notched
and un-notched specimens of the three composites of different density. The damage initiation monitored by AE, was quantified by means of mechanical properties obtained at various tests that were noted as threshold parameters. AE activity was tracked continuously to characterize the damage accumulation profile up to fracture. The AE data, such as counts, amplitude, duration, peak frequency and more, was analyzed in order to detect possible sequence of fracture events. This was also based on waveforms analyses by applying FFT, ST-FFT and Wavelet functions in order to elucidate possible active failure mechanisms (fibers fracture, matrix and interface crack-ing, micro-crack growth). More details on the AE set-up, sensors, amplification and threshold value are given elsewhere [11].
The fracture modes classification using scanning electron microscopy for the HD and MD
were already reported at previous works [11, 12] and here attention is given to the LD composite. Experimental Results
Mechanical properties Figure 2 depicts the dependency of the flexural properties on the composite density. As shown, almost linear behavior was observed with sharp influence of the modulus and fracture
Fig. 2. Flexural modulus, fracture stress and strain vs. density.
(a) (b) (c)
50µm 10µm

80
Fig. 3. Fracture toughness and elastic stress intensity factor vs. density.
stress and moderate one of the strain as the density decreases. Figure 3 shows the effect of the density on the fracture resistance properties. As for the uniform properties, the fracture toughness (KIC) drops off significantly as the density decreases. The same trend was noticed for the linear elastic stress intensity factor (KIlin.), which indicates on macroscopic deviation from linearity in the K–COD curve. This deviation indicates an intensification of the AE count rates resulting from a transition in damage accumulation mechanism as will be discussed later. Figures 4(a) and 4(b) illustrate the AE activity with flexural stress in terms of AE count rates as a function of the flexural strain for the high and low density composites, respectively. Although the mechanical response is almost linear, the AE count rates intensified as the stress increases to fracture. The threshold strain (eth) and the corresponding stress (σth) are noted in each composite and represent the early damage progress monitored by AE. As expected, the threshold values decrease as the com-posite density decreases. Actually, for the LD composite, nearly no threshold is observed, namely AE occurred from the start of loading. Figure 4(c) shows a significant change in both values with moder-ate change in the composite density. This trend points out that minor variation in the composite den-sity, as a result from manufacturing process, will alter considerably the threshold values detected by AE.
Fig. 4. Flexural stress and AE counts rates vs. flexural strain in different composite densities: (a) HD (left). (b) LD (right).

81
Fig. 4(c). The dependency of the threshold stress and strain vs. C/C composite density. AE response in tri-axial stress mode
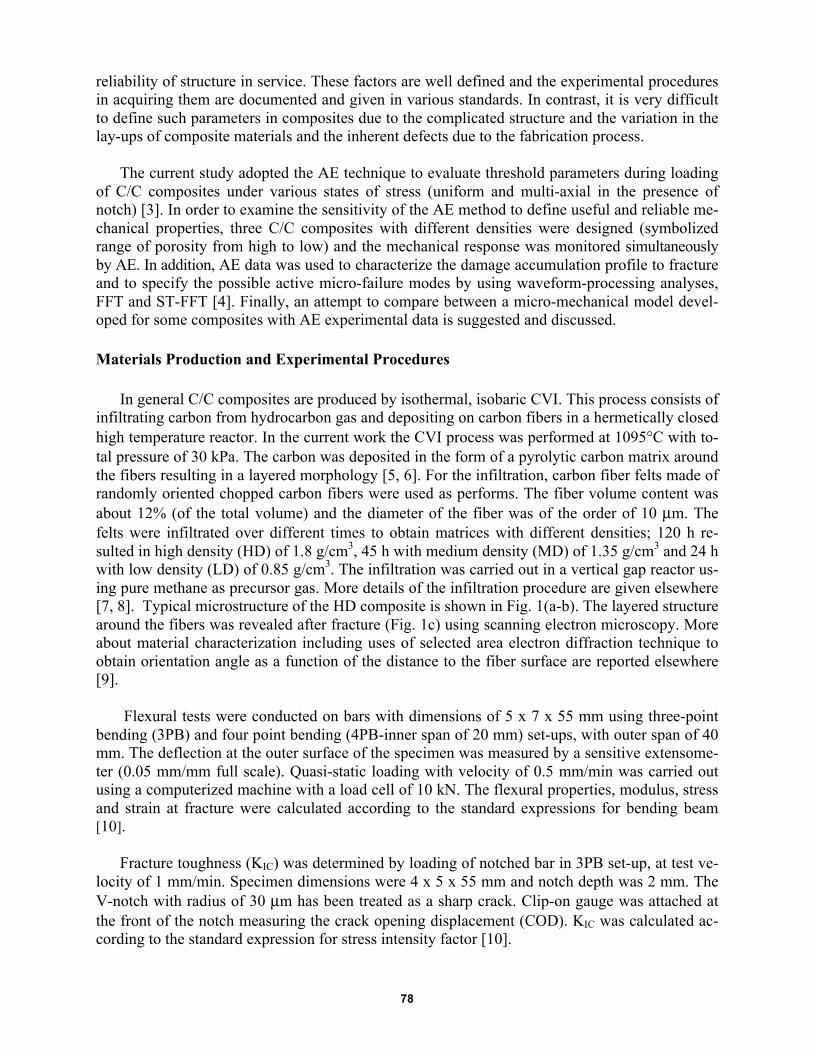
Figure 5(a) and 5(b) display the AE activity with the stress intensity factor in terms of counts rate as a function of the COD with the composite density. In contrast to the gradual increase in the AE counts rate in the former case, here the rate is almost constant at the linear portion of the curve and being intensified as slow crack growth occurs. The irregularities at this stage as manifested by crack extension, arrest and re-occurrence in alternately form are being reflected by peaks in AE counts (dashed arrows in Fig. 5a). This type of AE profile pointes out on the damage accumulation mecha-nism up to the localized crack growth. Again, the onset of the damage in the presence of notch is marked by the threshold COD (CODth) and the related stress intensity factor (KIth). Fig. 5c empha-sizes the great influence of the density on the threshold values.
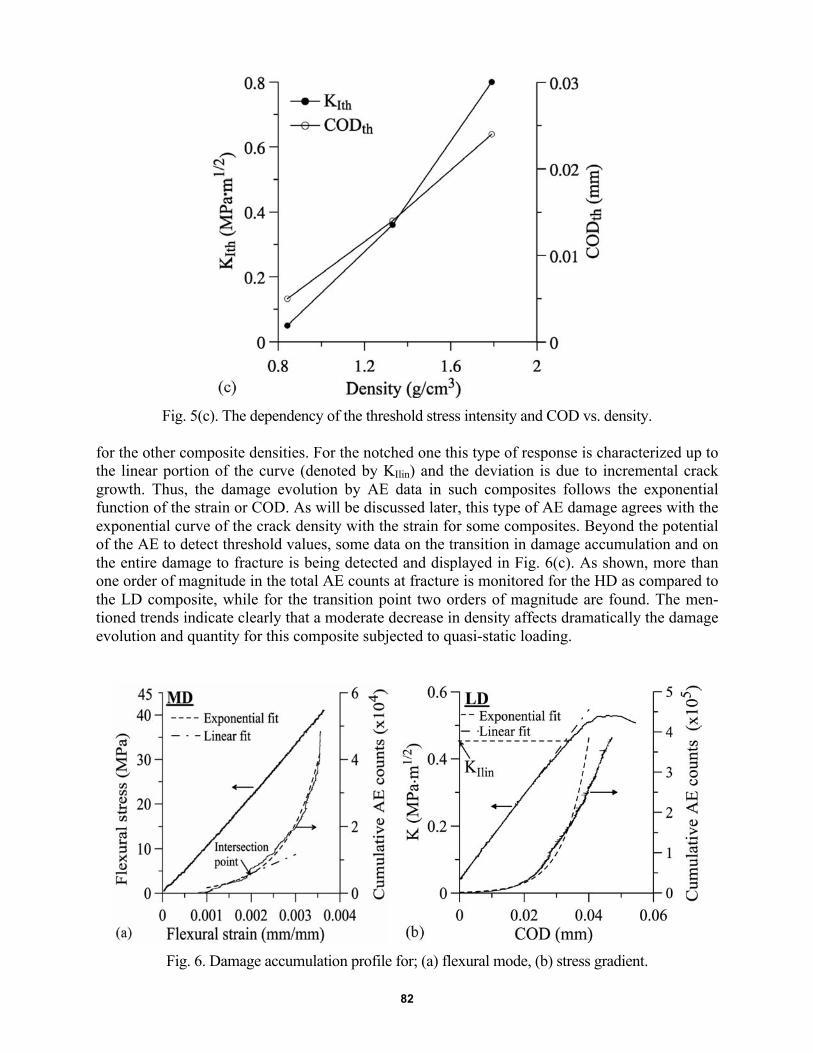
Fig. 5. Stress intensity factor and AE counts rate vs. COD in different composite densities: (a) MD, (b) LD. Damage accumulation profile The damage accumulation profile in terms of AE is demonstrated in Fig. 6(a-b) in the form of cumulative AE counts for the uniform and notched specimens, respectively. While almost lin-ear mechanical response is well depicted in case of flexural mode, an exponential type of contour is obtained for the AE response. Actually, there is an intersection point where the damage behav-ior is being changed from linear to exponential shape. This type of behavior was also observed
82
Fig. 5(c). The dependency of the threshold stress intensity and COD vs. density.
for the other composite densities. For the notched one this type of response is characterized up to the linear portion of the curve (denoted by KIlin) and the deviation is due to incremental crack growth. Thus, the damage evolution by AE data in such composites follows the exponential function of the strain or COD. As will be discussed later, this type of AE damage agrees with the exponential curve of the crack density with the strain for some composites. Beyond the potential of the AE to detect threshold values, some data on the transition in damage accumulation and on the entire damage to fracture is being detected and displayed in Fig. 6(c). As shown, more than one order of magnitude in the total AE counts at fracture is monitored for the HD as compared to the LD composite, while for the transition point two orders of magnitude are found. The men-tioned trends indicate clearly that a moderate decrease in density affects dramatically the damage evolution and quantity for this composite subjected to quasi-static loading.
Fig. 6. Damage accumulation profile for; (a) flexural mode, (b) stress gradient.

83
Fig. 6 (c) cumulative AE counts at fracture and at intersection point vs. composite density.
Discussion The AE findings in both stress modes (uniform and localized) indicate clearly the existence of threshold values, below which no damage is being initiated. Actually, three stages of damage evolution can be noticed from the AE extended curve profile shown in Fig. 7(a). The first stage ends at a threshold strain (or alternatively by the threshold COD in the case of a notched speci-men) as observed in other composite materials [13, 14]. Here, no AE activity is detected at this range of loading, characterized by a reversible mechanical behavior. The second stage is almost linear, ending by a significant jump in the cumulative AE counts. This phenomenon indicates damage intensification, followed by the third stage with exponential-type behavior up to final fracture. This sudden jump is the result of coalescence of micro-defects or cracks to form signifi-cant local damage. Similar type of damage accumulation behavior was reported for glass-fiber epoxy as shown in Fig. 7(b). As noticed, the threshold parameters for the C/C composites are not accompanied by a measurable change in the stiffness property, whereas in PVC/glass-fiber com-posite, the threshold is followed by a deviation from linearity reflected by stiffness decrease with further loading; cf. Fig. 7(c). In case of an agreement in threshold behavior in both mechanical and AE responses, as shown in Fig. 7(c), the AE is a supporting tool. In the current tested C/C composites where no mechanical changes are noticeable especially for the HD and MD compos-ites, the AE is the only means of tracking threshold mechanical value, which characterizes dam-age onset as well as damage evolution profile. This behavior is also emphasized in flexural test of Si3N4+SiC [15], where the onset of damage monitored via AE activity is denoted by σAE (Fig. 7(d)), a stress which is well below the elastic limit, σe. Moreover, it mentioned that the allowable calculated stresses σmax in all the components made by this ceramic should not exceed 60 MPa, a value which is close to the σAE as shown in Fig. 7(d). Hence, use of threshold stress defined by AE in structural integrity consideration is being used more practically. The current research shows clearly the sensitivity of the AE technique in determining the threshold values with the variation of the C/C composite densities. Here, the change of the density was considerable from one to another and the AE response was changed accordingly. However, more refined work by English [13] shows that modified polyester by adding 6-phr elastomer in the system of PVC/glass-fiber composite, nearly doubled the threshold strain for the onset of matrix cracking, from 0.5 to 0.9%. However, this change in the AE response is not accompanied by a

84
significant variation of the standards mechanical properties namely, stress and strain at fracture. This knowledge is important in composite structures where no damage is allowed, especially in ones where no mechanical behavior is being altered. Therefore, by getting curves with different proc-essing parameters as shown here (Figs. 4(c), 5(c), 6(c)) for different time of infiltration and with varying stress modes and loadings (quasi-static, cyclic, constant), will gain more reliable per-formance and more insight on the characteristics of structural integrity of composites being used in critical load bearing components.
Fig. 7. The three stages in damage accumulation for; (a) C/C MD composite, (b) Glass fiber com-posite, (c) threshold strain and deviation from linearity in stress-strain curve for PVC/glass-fiber composite, (d) the onset of acoustic emission activity denoted by σAE in flexural test of Si3N4+SiC.
The validity of the non-destructive evaluation techniques in assessing microstructures, mechani-cal properties, deformation, damage initiation and growth is not doubtful. However, tremendous ef-forts are being devoted in developing damage models for composite materials under quasi-static [16-18] and fatigue [19-21] loading, usually based on micro-mechanics. Such models predict changes in the stiffness of composite materials due to cracking [22] and others evaluate damage evolution due to changes in the initial material symmetry caused by damage. For example, Talreja [16] suggested a micro-mechanical model for inter-laminar cracking in composite laminates, and determined the dam-age parameter for a bilinear stress–strain curve in terms of crack density in an exponential behavior
(a)
(c)
(b)
Si3N4+SiC (d)

85
as shown schematically in Fig. 8(a). This prediction was found experimentally [23] (Fig. 8(b)) as well as in the current study for the LD composite (Fig. 8(c)) with almost bi-linear curve. As shown, the micro-mechanical model predict also a threshold strain ( ) as also detected in the experimental works.
Fig. 8. Comparison between the predicted damage profile and threshold parameter to the experi-mental ones for various composite materials; (a) Talreja micro-mechanical model [16], (b) Kistner work [23], (c) current work.
Fig. 9. (a) Stress and peak frequency density vs. flexural strain, (b) Amplitude, duration and stress intensity factor vs. crack opening displacement.
Finally, some insight views on the active micro-mechanisms failure are presented in Fig. 9(a-b)
resulted from AE wave analysis. The peak frequencies (PFs) density and the stress versus flexural strain are shown in Fig. 9(a). Four main PFs are observed up to fracture with different level of den-sity. The dominant one appears at 330 kHz and its density increases as the strain increases, the sec-ond one appears at 130 kHz and its density increases moderately as approaching to the final fracture, the third one appears at 190 kHz where it is almost unchanged in the density up to fracture and the final one begins to be dominant at 550 kHz at the later stage of loading. In case of notched specimen, amplitude, duration and K are displayed versus COD (Fig. 9(b)). Following Siron et al. [24] ap-proach based on AE waveform parameter analysis and microscopic observations, the early stage of loading is characterized by low duration values associated with low/medium amplitudes. Further on, as approaching to the K transition from elastic to inelastic mechanical behavior (see dashed arrow), medium duration values and amplitudes are observed. The inelastic region without microscopic crack growth is depicted by medium duration and high amplitude. Finally, macroscopic crack growth is accompanied by high values of duration and amplitude. Applying FFT analysis of an AE wave taken
(a) (b) (c)

86
close to fracture (not shown), shows the PFs in the frequency domain (Fig. 10(a) and in time domain using ST-FFT function (Fig. 10(b)) and in three-dimensional display using wavelet function. From the above results one can assume that four dominant micro-mechanisms controlled/involved the fracture process of LD composite with correlation also to Siron [24] approach. At the early stage of loading, low and medium frequencies are dominant and maybe related to cracking of the mul-ti-layered matrix and interface matrix de-bonding, respectively (Figs. 11(a,b)). With further loading, the dominant frequency is related to fiber failure (Fig. 11(c)) and the high frequency maybe is associated with propagation of micro-cracks. The occurrence sequence of the men-tioned micro-failure mechanisms is shown in Figs. 9(b-c) whereas the multilayered cracking is the first to be active, followed by matrix debonding, micro-cracks and finally bundle fibers fail-ure. Ni et al. [4] presented a similar investigation on carbon-fiber-reinforced carbon composites. However, additional data using artificial intelligence techniques such as partitional clustering analysis or unsupervised pattern recognition for classification of AE events may discriminate be-tween various failure micro-mechanisms [25], and give more comprehensive view on the se-quence of events during facture process of C/C composites.
Fig. 10. AE waves analyses in LD composite: (a), (b) FFT with frequency domain.
Fig. 10(c). ST-FFT with frequency and time domains data; 3-D display of wavelet analysis.
(b) (a)

87
Fig. 11. Micro-failures mechanisms; (a) multilayered cracking, (b) interfacial matrix de-bonding, (c) bundles fiber failure , (d) micro-crack growth.
In summary, the current research emphasizes the power of AE method in detecting the very early damage in C/C composite materials, which can be quantified by means of threshold value both in uniform and in intensified stress field. This finding is important from structural integrity viewpoint where conventional methods failed to detect and evaluate damage initiation. In addition, the AE data characterizes the damage accumulation profile up to fracture and points out the transition in damage progress. Finally, by using enhanced AE wave analyses as shown briefly here, we can evaluate the sequence of events during fracture process up to the final fracture of such C/C composites. Acknowledgements
The authors thank S. Lichtenberg, O. Deutschmann for the sample synthesis and R. Piat
gratefully acknowledges the financial support of the German Research Foundation (DFG, Center of Excellence 551 in Research on "Carbon from the gas phase: elementary reactions, structures and materials") and to B. Rezink of using Fig. 2a.
References
1) L. M. Manocha: Sadhana, 28 (1–2) (2003), 349–58. 2) S. Huguet, N. Godin, R. Gaertner, L. Salomon and V. Villard: ECF13, San Sebastian,
6-9 Sep. (2000). 3) M. Huang, L. Jiang, P. K. Liaw, C. R. Brooks, Seeley R and D. L. Klarstrom: J. Miner.
Met. Mater. Soc., 50 (11) (1998), 66. 4) Q. Q. Ni, K. Kurashiki and M. Iwamoto: Mater. Sci. Res. Int., 7 (1) (2001), 67. 5) B. Reznik and K. J. Hüttinger: Carbon, 40 (4) (2002), 621-624. 6) B. Reznik, D. Gerthsen and K. J. Hüttinger: Carbon, 39 (2) (2001), 215-229.
(a) (b)
(c) (d)
200µm

88
7) W. Benzinger and K. J. Hüttinger: Carbon, 37 (6) (1999), 941-946. 8) W. Benzinger and K. J. Hüttinger: Carbon, 37 (6) (1999), 1311-1322. 9) R. Piat, T. Böhlke, I. Tsukrov, B. Reznik, O. Deutschmann and A. Bussiba, The An-
nual World Conference on Carbon, Biarritz, France, 14-19 June (2009). 9) ASTM Standard D790-95a: (1996), 155. 10) ASTM E399-90 (Re-approved): (2005), 462. 11) A. Bussiba, M. Kupiec, S. Ifergane, R. Piat and T. Bohlke: Comp. Sci. and Tech., 68
(2008), 1144. 12) A. Bussiba, M. Kupiec, R. Piat, T. Bohlke: Carbon, 46 (2008), 618-630. 13) L. K. English: Materials Engineering, TR 103-75-6 (1987). 14) M. Bourchak, I. R. Farrow, I. P. Bond, C. W. Rowlandand and F. Menan: International
Journal Fatigue, 29 (3) (2007), 457–470. 15) G.A. Gogotsi: Ceramics International, 35, (2009), 1109-1114. 16) R. Talreja: Proc. of the 7th Int. Conf. on Fracture, Houston, TX (1989), pp. 2191–2199. 17) Z. Hashin: J. Appl. Mech., 54 (4) (1985), 121. 18) K. H. Leong and J. E. King: Joint FEFG/ICF Int. Conf. of Fracture Eng. Mat. and Struc-
tures, Singapore, (1991), 251-256 19) N. V. Akshantala and R. A. Talreja: Mater. Sci. Eng., A 285 (2000), 303. 20) N. V. Akshantala and R. A. Talreja: Mech. Mater., 29(7) (1998), 123. 21) F. Aymerich, F. Ginesu, P. Priolo and S. W. Ming: Joint FEFG/ICF Int. Conf. of Frac-
ture Eng. Mat. and Structures, Singapore, (1991), pp. 209-216. 22) M. Bouazza, A. Tounsi, A. Benzair and E. A. Adda-Bedia: Mater. Design, 28(4)
(2007), 1116. 23) M. D. Kistner, J. M. Whitney and C. E. Browning: Recent advances in composites in
the Unites States and Japan, ASTM STP 864, (1981), 44–61. 24) O. Siron, G. Chollon, H. Tsuda, H. Yamauchi, K. Maeda and K. Kosaka: Carbon, 38
(2000), 1369-1389. 25) A. A. Anastassopoulos, T.P. Philippidis and S.A. Paipetis: V. Hempelrijck and A. A.
Anastassopoulos, eds. Non destructive testing, Rotterdam, (1996), pp. 143–149.