Damage detection in fly-ash based geopolymer concrete ... · geopolymer concrete, a real-time...
7
International Research Journal of Engineering and Technology (IRJET) e-ISSN: 2395-0056 Volume: 05 Issue: 04 | Apr-2018 www.irjet.net p-ISSN: 2395-0072 © 2018, IRJET | Impact Factor value: 6.171 | ISO 9001:2008 Certified Journal | Page 4290 Damage detection in fly-ash based geopolymer concrete using surface bonded Piezoelectric sensors K. Niroshkumar 1 , M.C. Sundarraja 2 , L.R. Karl Marx 3 1 PG Student, Dept. of Civil Engineering, Thiagarajar College of Engineering, Tamilnadu, India 2 Assistant Professor, Dept. of Civil Engineering, Thiagarajar College of Engineering, Tamilnadu, India 3 Associate Professor, Dept. of Mechatronics Engineering, Thiagarajar College of Engineering, Tamilnadu, India ---------------------------------------------------------------------***--------------------------------------------------------------------- Abstract - Structural health monitoring demands its significance over recent decades. Most of the important structures like dams, monuments, tunnels, mines, pipelines, storage structures and inaccessible locations require strain monitoring throughout its lifespan to avoid catastrophic collapse of structure. The real bottleneck in observing is that Concrete, being a heterogeneous material and requires persistent checking of strain over a vast territory, which prompts workforce consumption and cost over usage of the innovation. Levels of carbon emission in the atmosphere due to cement manufacturing has been reduced by usage of geopolymer concrete. It has found to possess various applications in the construction sector. Thus its reliability has to be ensured through proper destructive and non-destructive tests. As a part aforementioned statement, the present investigation carried out using surface bonded piezoelectric sensors over a small prism of dimensions 500 x 100 x 100 mm. Artificial damages of various sizes were created and the conductance and susceptance signatures are analyzed and scalar damage metric used to study about various crack depth from the signatures acquired from the piezoelectric patches. Key Words: Damage detection, Structural health monitoring, Surface bonded piezoelectric sensors, etc. 1.INTRODUCTION Presently, the construction industry is being dominated by the use of eco-friendly building construction materials, which have the main objective of reducing the carbon emission in the atmosphere. On following the above statement, the reduction in carbon dioxide emission due to cement production being overwhelmed by usage of geopolymer concrete in the construction industry. The geopolymer concrete has its main constituent as fly-ash. It is an industrial waste product obtained after burning of coal from thermal power plants. Another industrial waste based product, ground granulated blast furnace slag cement (GGBS) also used as an additive with the geopolymer concrete in order to increase the strength. Using the geopolymer concrete, a real-time structure built at Queensland, Australia. Industrial demands for this geopolymer concrete increasing at higher levels. To increase the application of those type of concrete, the quality has to be ensured through proper channel of research. The destructive and non-destructive tests are mandatory for any type of material to ensure the proper design strength and its durability. Electromechanical Impedance (EMI) technique has been invented by Liang et.al. (1) in 1994. They derived the base equation for EMI technique. Sun.et.al (2) did the first structural health monitoring experiment for monitoring the truss structure integrity. Ayres.et.al (3) used the same experiment for large-scale structures. As a proof of concept for this EMI technique, Park.et.al (4-6) extended the research on this technique over monitoring of composite reinforced masonry walls, steel bridge and pipe joints, high- temperature steam pipes. Later he used the same technique for post-earthquake analysis of pipe joints. Soh.et.al. (7) monitored the performance of surface bonded Lead- Zirconate-Titanate (PZT) sensors under destructive testing of reinforced cement concrete bridge. Giurgiutiu et.al. (8) combined the EMI technique with the wave propagation technique and used to monitor ageing aircraft components. Abe et.al. (9) combined EMI technique with wave propagation technique and used to monitor stress in thin structural members. Naidu et.al. (10) successfully demonstrated the EMI technique in damage detection using piezoelectric sensors. Bhalla et.al. (11-13) studied the effect of moisture and adhesive on signature acquisition using piezoelectric sensors. He modified the basic EMI equation derived by Liang.et.al. Then he reviewed the available sensor technologies for structural health monitoring. Park et.al. (14) demonstrated the two-point loading experiment in a concrete beam with surface mounted piezoelectric sensors for multiple crack detection. Yang et.al (15) worked on surface bonded piezoelectric patches in order to incorporate the effect of bond thickness and temperature. Tawei et.al. (16) utilized the EMI technique for monitoring the early strength and hydration in concrete. Xu et.al (17) made artificial cracks on the concrete specimen and measured the resonant frequency peak shift at various crack depth. Talakokula et.al. (18-19) utilized the EMI technique for corrosion measurement in the reinforced concrete specimen. She contributed the technique for non-destructive strength evaluation in fly-ash based geopolymer concrete. The various researchers utilized the EMI technique for incipient damage detection and structural health monitoring. In this study, the piezoelectric sensors were surface mounted over the fly-ash based geopolymer concrete prism specimen. Artificial cracks of various depth were created and then the real and imaginary part of admittance signature i.e. conductance and susceptance were measured from the attached sensors under various damage conditions in order
Transcript of Damage detection in fly-ash based geopolymer concrete ... · geopolymer concrete, a real-time...
International Research Journal of Engineering and Technology (IRJET) e-ISSN: 2395-0056
Volume: 05 Issue: 04 | Apr-2018 www.irjet.net p-ISSN: 2395-0072
© 2018, IRJET | Impact Factor value: 6.171 | ISO 9001:2008 Certified Journal | Page 4290
Damage detection in fly-ash based geopolymer concrete using surface bonded Piezoelectric sensors
K. Niroshkumar1, M.C. Sundarraja2, L.R. Karl Marx3
1PG Student, Dept. of Civil Engineering, Thiagarajar College of Engineering, Tamilnadu, India 2Assistant Professor, Dept. of Civil Engineering, Thiagarajar College of Engineering, Tamilnadu, India
3 Associate Professor, Dept. of Mechatronics Engineering, Thiagarajar College of Engineering, Tamilnadu, India ---------------------------------------------------------------------***---------------------------------------------------------------------
Abstract - Structural health monitoring demands its significance over recent decades. Most of the important structures like dams, monuments, tunnels, mines, pipelines, storage structures and inaccessible locations require strain monitoring throughout its lifespan to avoid catastrophic collapse of structure. The real bottleneck in observing is that Concrete, being a heterogeneous material and requires persistent checking of strain over a vast territory, which prompts workforce consumption and cost over usage of the innovation. Levels of carbon emission in the atmosphere due to cement manufacturing has been reduced by usage of geopolymer concrete. It has found to possess various applications in the construction sector. Thus its reliability has to be ensured through proper destructive and non-destructive tests. As a part aforementioned statement, the present investigation carried out using surface bonded piezoelectric sensors over a small prism of dimensions 500 x 100 x 100 mm. Artificial damages of various sizes were created and the conductance and susceptance signatures are analyzed and scalar damage metric used to study about various crack depth from the signatures acquired from the piezoelectric patches.
Key Words: Damage detection, Structural health monitoring, Surface bonded piezoelectric sensors, etc.
1.INTRODUCTION Presently, the construction industry is being dominated by the use of eco-friendly building construction materials, which have the main objective of reducing the carbon emission in the atmosphere. On following the above statement, the reduction in carbon dioxide emission due to cement production being overwhelmed by usage of geopolymer concrete in the construction industry. The geopolymer concrete has its main constituent as fly-ash. It is an industrial waste product obtained after burning of coal from thermal power plants. Another industrial waste based product, ground granulated blast furnace slag cement (GGBS) also used as an additive with the geopolymer concrete in order to increase the strength. Using the geopolymer concrete, a real-time structure built at Queensland, Australia. Industrial demands for this geopolymer concrete increasing at higher levels. To increase the application of those type of concrete, the quality has to be ensured through proper channel of research. The destructive and non-destructive tests are mandatory for any type of material to ensure the proper design strength and its
durability. Electromechanical Impedance (EMI) technique has been invented by Liang et.al. (1) in 1994. They derived the base equation for EMI technique. Sun.et.al (2) did the first structural health monitoring experiment for monitoring the truss structure integrity. Ayres.et.al (3) used the same experiment for large-scale structures. As a proof of concept for this EMI technique, Park.et.al (4-6) extended the research on this technique over monitoring of composite reinforced masonry walls, steel bridge and pipe joints, high-temperature steam pipes. Later he used the same technique for post-earthquake analysis of pipe joints. Soh.et.al. (7) monitored the performance of surface bonded Lead-Zirconate-Titanate (PZT) sensors under destructive testing of reinforced cement concrete bridge. Giurgiutiu et.al. (8) combined the EMI technique with the wave propagation technique and used to monitor ageing aircraft components. Abe et.al. (9) combined EMI technique with wave propagation technique and used to monitor stress in thin structural members. Naidu et.al. (10) successfully demonstrated the EMI technique in damage detection using piezoelectric sensors. Bhalla et.al. (11-13) studied the effect of moisture and adhesive on signature acquisition using piezoelectric sensors. He modified the basic EMI equation derived by Liang.et.al. Then he reviewed the available sensor technologies for structural health monitoring. Park et.al. (14) demonstrated the two-point loading experiment in a concrete beam with surface mounted piezoelectric sensors for multiple crack detection. Yang et.al (15) worked on surface bonded piezoelectric patches in order to incorporate the effect of bond thickness and temperature. Tawei et.al. (16) utilized the EMI technique for monitoring the early strength and hydration in concrete. Xu et.al (17) made artificial cracks on the concrete specimen and measured the resonant frequency peak shift at various crack depth. Talakokula et.al. (18-19) utilized the EMI technique for corrosion measurement in the reinforced concrete specimen. She contributed the technique for non-destructive strength evaluation in fly-ash based geopolymer concrete. The various researchers utilized the EMI technique for incipient damage detection and structural health monitoring.
In this study, the piezoelectric sensors were surface mounted over the fly-ash based geopolymer concrete prism specimen. Artificial cracks of various depth were created and then the real and imaginary part of admittance signature i.e. conductance and susceptance were measured from the attached sensors under various damage conditions in order

International Research Journal of Engineering and Technology (IRJET) e-ISSN: 2395-0056
Volume: 05 Issue: 04 | Apr-2018 www.irjet.net p-ISSN: 2395-0072
© 2018, IRJET | Impact Factor value: 6.171 | ISO 9001:2008 Certified Journal | Page 4291
to evaluate the damage detection capability of surface bonded piezoelectric sensors in fly-ash based geopolymer concrete.
2. EXPERIMENTS 2.1. Raw materials Fly-ash based geopolymer concrete prism specimen (500 mm x 100 mm x 100 mm) were prepared using Class-F dry fly ash confirming to IS 3812-2003 obtained from Tuticorin thermal power plant. In order to increase the strength, the GGBS of 20% with respect to the weight of fly-ash added as an ingredient. The commercial river sand was used which confirms to Zone- II as per Indian standards IS 383-1970. The coarse aggregate with a maximum size of 20 mm was used which should not be flaky and elongated. The alkali activator was prepared using sodium hydroxide (NaOH) and sodium silicate (Na2SiO3). 14M of NaOH was prepared with the Na2SiO3/ NaOH ratio of 2.5 and alkaline liquid to fly-ash ratio of 0.5. The NaOH and Na2SiO3 of the commercial grade were used which are purchased from local chemical merchants. From previous work of Rangan (20), the water to geopolymer solids ratio adopted as 0.23 in order to have the good workability and strength. The superplasticizer of 1% with respect to the weight of fly-ash added while preparing concrete in order to have good workability. The Naphtha-based superplasticizer Sikament 610-UTS (dark brown solution) was used. The design mix was adopted in order to achieve the characteristic compressive strength of M30. The concrete is compacted using table vibrator and kept under ambient curing condition. The properties of materials used were given in Table1.
Table 1: Properties of Materials used in concrete
Specific Gravity of fly-ash 2.63
Specific Gravity of GGBS 2.72
Specific gravity of Fine Aggregate 2.48
Specific gravity of coarse aggregate 2.85
The details of mix proportion of the geopolymer concrete are given in Table 2. Table 2: Details of Mix-proportion of geopolymer concrete
Particulars Quantity (in Kg/m3)
Mass of fly-ash 368
Mass of fine aggregate 1293.6
Mass of coarse aggregate 554.4
Mass of NaOH solution 52.57
Mass of Na2SiO3 Solution 131.43
Mass of superplasticizer 3.68
Extra water added Nil
2.2. Piezoelectric sensor details
The piezoelectric sensors of dimensions 10 mm x 10 mm x 0.2 mm, manufactured by Central Electronics India limited and their product designation is PZT-5H (refer manufacturers catalogue) were used. The sensors were soldered with the co-axial or shielded wire in order to minimize losses and noise. While soldering the wire with the piezoelectric patch, the thickness of lead used for soldering should be very small. In order to do so, the point soldering equipment was used. After soldering, the sensors were checked for voltage generation under small excitation. i.e. the piezoelectric effect of the sensor checked before application. The sensors were connected with Agilent DSO-X-2002A- Oscilloscope in single trigger mode and the peak-to-peak voltage is measured and the response was recorded. After ensuring the proper working of the piezoelectric patches, they have to be attached to the test specimen in which the experiment has to be performed. The effect of adhesive should be included when its thickness is greater than one-third of the thickness of piezoelectric sensor (Bhalla (12)). In order to ignore variation in signatures due to bond layer, very small amount of adhesive has to be used. The Araldite standard epoxy adhesive with the curing time of 24 hours was used. The standard epoxy adhesive contains resin and hardener. Equal amounts of resin and hardener are squeezed on the glass plate and stirred uniformly for fifteen minutes in order to get a brown texture. The improper mixing can lead to the improper bonding of sensor. The thin layer of adhesive applied on the prism specimen and the piezoelectric sensor attached and the setup has been kept undisturbed for 24 hours, which helps in curing of adhesive. The sensor has to remain intact with the host structure in such a way that, any changes in mechanical impedance of the structure relatively varies the electrical impedance of the piezoelectric sensor. The geometry of the piezoelectric patch attached to the host structure is shown in Figure 1.
Fig 1. A piezoelectric sensor attached to the geopolymer concrete prism specimen

International Research Journal of Engineering and Technology (IRJET) e-ISSN: 2395-0056
Volume: 05 Issue: 04 | Apr-2018 www.irjet.net p-ISSN: 2395-0072
© 2018, IRJET | Impact Factor value: 6.171 | ISO 9001:2008 Certified Journal | Page 4292
2.3 Variation of EMI signature accordance with changes in the host structure The base equation for the EMI technique was derived by
Liang et.al. (1). The Electromechanical admittance ( Y ), which is the inverse of Electromechanical impedance, is given by the equation,
2ωj h
wl[( 33
T– d312 E) + (
a
a
ZZ
Z
) d31
2 E ( kl
kltan)]
Where d31 is the piezoelectric strain coefficient, EY is the complex Young's modulus of the PZT patch at the constant
electric field. 33T is the complex electric permittivity of the
PZT material at constant stress. Z is the mechanical impedance of the structural system which depends on the mass, stiffness, and damping of the structural system. Za is the short-circuited mechanical impedance of the PZT patch. ω denotes the angular frequency. k denotes the wave number. w, l, and h are width, length, the thickness of PZT patch respectively. The constant value 2 is due to integrating the full length of the specimen from –l to +l. Any change in the value of Z alters the value of Za. It denotes that the changes associated with the host structure alter the value of Z, which is difficult to measure directly. In converse, the alteration of the Z value changes Za of the sensor, which can be directly measured using the LCR meter. The given equation is decomposed into two parts. The one part is a real part, which is called as conductance (G) which is measured in Siemens (S). Another part is the imaginary part known as Susceptance (B) which is measured in Siemens (S). The plot of conductance signature versus frequency is known as conductance-plot and the plot of susceptance signature versus frequency is known as Susceptance-plot. The equation
was later modified by Zhou et.al.(21) and Bhalla et.al. (12).
2.4 Artificial damage creation and signature acquisition procedure The artificial damage has to be created in the geopolymer concrete prism specimen in order to perform the damage detection experiment. For the creation of artificial damage, the concrete diamond-cutting blade of thickness 0.3 mm was used. The depth of the crack was fixed using the adjusting knob present in the cutting machine. The position of damage created is shown in Figure 2.
Fig 2. The position of artificial damage The sensors were excited with 1 V rm alternating current using Agilent E4980-A precision LCR meter. The frequency of 30-300 kHz was chosen and readings were taken at every 100 Hertz frequency using the manual trigger mode. The response of the sensors after each trigger was recorded. The positive and negative terminals of the shielded wire connected to the LCR meter using the Kelvin-leads. Before creating the damage, the measurements were taken from the specimen, which gives the baseline signature. The baseline signature acts as a benchmark for the undamaged specimen. Three cracks were created subsequently after each signature measurements. The depth of the cracks created is 5 mm, 10 mm and 15 mm respectively. Each crack depth represents the various damage state of a specimen such as D1, D2, and D3. Figure 3 illustrates the test setup of signature acquisition.
2.5 Damage Quantification with damage index The effect of structural damage in the specimen has its reflection over the conductance and susceptance signature plots through the variation of peaks, lateral shifting and vertical shifting of those peaks. The aforementioned process helps us to find the damage occurred inside the specimen. Sun et.al. (2) were the first one to use the Root mean square deviation (RMSD) or Relative deviation as damage detection tool from the measured signature. They are used to quantify the deviated values of signature from the baseline signature. Giurgiutiu et.al. (8) defined the RMSD as,
Fig. 3 Experimental setup of signature acquisition.

International Research Journal of Engineering and Technology (IRJET) e-ISSN: 2395-0056
Volume: 05 Issue: 04 | Apr-2018 www.irjet.net p-ISSN: 2395-0072
© 2018, IRJET | Impact Factor value: 6.171 | ISO 9001:2008 Certified Journal | Page 4293
X100
)(G
)G(G
RMSD2O
i
N
1 i
20
ii1
1
N
i
Where i1G is the post-conductance value of the PZT patch at
any stage during the test and GiO baseline value (in pristine
condition), i representing frequency which is taken into consideration for calculating RMSD (30 to 300 kHz)
4. RESULTS AND DISCUSSION The conductance and susceptance signatures obtained from the piezoelectric patches were exported to MATLAB software in order to obtain the conductance plot and susceptance plot. The testing frequency was chosen as 30-300 kHz and the plot is zoomed over two regions in order to view the variation in the conductance signature. Figure 4 represents the conductance plot over different crack depths.
Fig 4. Conductance plot for various damage states
Fig 4a. Conductance plot for frequency range 175-185 kHz
Fig 4b. Conductance plot for frequency range 235-245 kHz The damage state D1, D2, D3 denotes the artificial crack depth of 5 mm, 10 mm, 15 mm respectively. It can be observed from figure 4a that the conductance plot shows rise in their peaks from the observed baseline signature. From the response spectra of the piezoelectric patches over the frequency range 175-185 kHz, the vertical and lateral shifting of the peak occurs. The lateral shifting of peaks increases in the order of decreasing frequency with respect to the increase in crack depth. The increase of conductance signature was also observed with the corresponding frequency range. From figure 4b, it was observed that the lateral shifting of peaks occurs with respect to damage state. The lateral shifting of conductance signature occurs over 235-245 kHz in the order of decreasing frequency with respect to increasing crack depth. The accurate response of the conductance signature over the two frequency ranges is due to the resonant frequency match. At these ranges of frequency, the conductance signature is more responsible even for the incipient damage. Thus the both frequency range are responsible for incipient damage and crack detection. In order to quantify the damage, the RMSD values for the frequency range is plotted and shown in figure 5.
Fig 5. RMSD plot for various crack depth The RMSD plot for the conductance signature denotes the damage metric for the damaged concrete specimen. As observed from the plot, the values of RMSD hikes gradually
International Research Journal of Engineering and Technology (IRJET) e-ISSN: 2395-0056
Volume: 05 Issue: 04 | Apr-2018 www.irjet.net p-ISSN: 2395-0072
© 2018, IRJET | Impact Factor value: 6.171 | ISO 9001:2008 Certified Journal | Page 4294
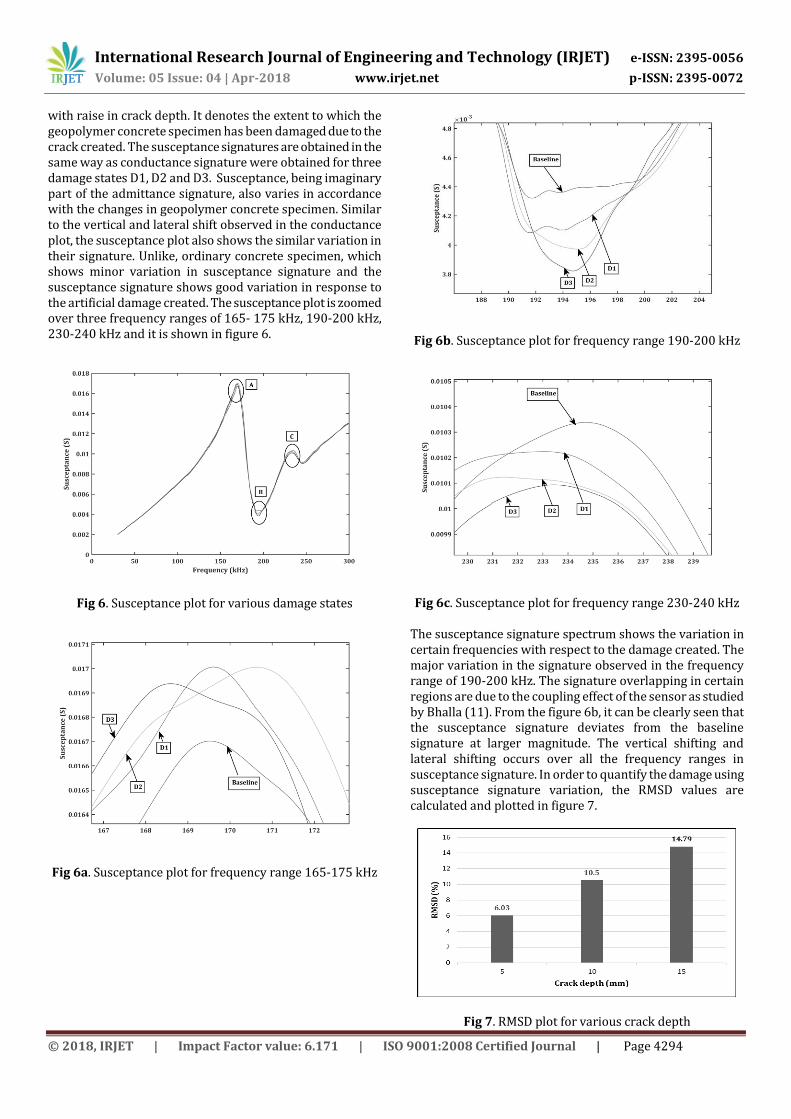
with raise in crack depth. It denotes the extent to which the geopolymer concrete specimen has been damaged due to the crack created. The susceptance signatures are obtained in the same way as conductance signature were obtained for three damage states D1, D2 and D3. Susceptance, being imaginary part of the admittance signature, also varies in accordance with the changes in geopolymer concrete specimen. Similar to the vertical and lateral shift observed in the conductance plot, the susceptance plot also shows the similar variation in their signature. Unlike, ordinary concrete specimen, which shows minor variation in susceptance signature and the susceptance signature shows good variation in response to the artificial damage created. The susceptance plot is zoomed over three frequency ranges of 165- 175 kHz, 190-200 kHz, 230-240 kHz and it is shown in figure 6.
Fig 6. Susceptance plot for various damage states
Fig 6a. Susceptance plot for frequency range 165-175 kHz
Fig 6b. Susceptance plot for frequency range 190-200 kHz
Fig 6c. Susceptance plot for frequency range 230-240 kHz The susceptance signature spectrum shows the variation in certain frequencies with respect to the damage created. The major variation in the signature observed in the frequency range of 190-200 kHz. The signature overlapping in certain regions are due to the coupling effect of the sensor as studied by Bhalla (11). From the figure 6b, it can be clearly seen that the susceptance signature deviates from the baseline signature at larger magnitude. The vertical shifting and lateral shifting occurs over all the frequency ranges in susceptance signature. In order to quantify the damage using susceptance signature variation, the RMSD values are calculated and plotted in figure 7.
Fig 7. RMSD plot for various crack depth

International Research Journal of Engineering and Technology (IRJET) e-ISSN: 2395-0056
Volume: 05 Issue: 04 | Apr-2018 www.irjet.net p-ISSN: 2395-0072
© 2018, IRJET | Impact Factor value: 6.171 | ISO 9001:2008 Certified Journal | Page 4295
From the RMSD plot, it was observed that the susceptance signature variation increases in the order of increasing crack depth for the various damage state. It follows the same fashion of RMSD plot of conductance. In both cases of conductance and susceptance plot, the damage detection capability of the piezoelectric sensor is greatly influenced by the selection of frequency range. The damage detection in the specimen is characterized by the shifting of peaks over the conductance and susceptance plot. The damage measuring tool holds good with various damage states created artificially. Thus it can be concluded that the EMI technique adopted using surface bonded piezoelectric sensor can be an incipient damage detection tool for fly-ash based geopolymer concrete.
5. CONCLUSIONS The artificial crack made on the surface of the fly-ash based geopolymer concrete specimen can be identified through the application of the EMI technique. The damage incurred can be quantified through the RMSD index, which measures variation of the conductance and susceptance signature from the baseline signature of both the values. Conductance signature shows the variation in the response spectra with response to increase in the crack depth. The damage identification is highly affected by the frequency range selection. Under resonant frequency ranges, the response obtained from the piezoelectric patches is found more accurate and the damages incurred are inevitable at those frequency ranges. At the peak values obtained over the frequency range of 30-300 kHz, two ranges have been zoomed over in order to characterize through vertical and lateral shifting of the peaks. In the remaining frequency range, conductance signature is more likely to coincide due to the coupling effect of the sensors. The RMSD index has increasing trend with respect to the three damage states. At the peak values, the conductance signature responds more to the incipient damage and ensures damage detection. The Susceptance plot also follows the similar fashion of conductance plot. The variation of the susceptance signature observed over three frequency ranges. Being imaginary part of the admittance signature, the susceptance spectra are more responsive to the incipient damage. The RMSD index for susceptance signature is more similar to the conductance signature. Thus for the fly-ash based geopolymer concrete, the EMI technique using surface bonded piezoelectric sensors can be used as an effective tool for damage detection. Although, the artificial damages have been created and the level of damage has been identified through this technique. In order to increase the application of this technique, the fly-ash based geopolymer concrete has to be tested for natural cracks under static and dynamic loading conditions. The appropriate relationship between the EMI signature and the structural damage quantification has to be improved through further research.
Acknowledgement The authors kindly thank Dr. S. Kanthamani, Associate professor and incharge of MEMS Design Centre, supported by NPMASS, Thiagarajar College of Engineering for her help in performing the experiment. The hardware equipment for performing experiments was issued by MEMS Design Centre, Electronics and Communication Engineering Department, Thiagarajar College of Engineering. The Equipment used for measurement was sponsored by Department of Science and Technology (DST) Fund under DST-FastTrack scheme.
REFERENCES [1] Liang, C., Sun, F., and Rogers, C. A. (1994), ‘‘Coupled
electromechanical analysis of adaptive material systems—Determination of actuator power consumption and system energy transfer.’’ Journal of Intelligent Material System and Structures, Vol-5, pp. 12–20.
[2] Sun, F. P., Chaudhry, Z., Rogers, C. A., Majmundar, M. and Liang, C. (1995) “Automated Real-Time Structure Health Monitoring via Signature Pattern Recognition”, edited by I. Chopra, Proceedings of SPIE Conference on Smart Structures and Materials, San Diego, California, Feb.27-Mar1, SPIE vol. 2443, pp. 236-247.
[3] Ayres, J. W., Lalande, F., Chaudhry, Z. and Rogers, C. A. (1998), “Qualitative Impedance-Based Health Monitoring of Civil Infrastructures”, Smart Materials and Structures, Vol. 7, No. 5, pp. 599-605.
[4] Park, G., Cudney, H. H. and Inman, D. J. (2000), “Impedance-Based Health Monitoring of Civil Structural Components”, Journal of Infrastructure Systems, ASCE, Vol. 6, No. 4, pp. 153-160.
[5] Park, G., Cudney, H. H. and Inman, D. J. (2001), “Feasibility of using impedance-based damage assessment for pipeline structures”, Earthquake Engineering and Structural Dynamics, Vol. 30, No. 10, pp. 1463-1474.
[6] Park, G., Sohn, H., Farrar, C. R. and Inman, D. J. (2003),
“Overview of piezoelectric impedance-based health
monitoring and path forward”, The Shock and Vibration
Digest, Vol. 35, No. 5, pp. 451-463.
[7] Soh, C. K., Tseng, H., Bhalla, S., and Gupta, A. (2000). “Performance of smart piezoelectric patch in health monitoring of a bridge.” Smart Materials and Structures, Vol no.9(4), pp:533–542.
[8] Giurgiutiu, V., Redmond, J., Roach, D. and Rackow, K. (2000), “Active Sensors for Health Monitoring of Ageing Aerospace Structures”, Proceedings of the SPIE Conference on Smart Structures and Integrated Systems, edited by N. M. Wereley, SPIE Vol. 3985, pp. 294-305.

International Research Journal of Engineering and Technology (IRJET) e-ISSN: 2395-0056
Volume: 05 Issue: 04 | Apr-2018 www.irjet.net p-ISSN: 2395-0072
© 2018, IRJET | Impact Factor value: 6.171 | ISO 9001:2008 Certified Journal | Page 4296
[9] Abe, M., Park, G. and Inman, D. J. (2002), “Impedance-Based Monitoring of Stress in Thin Structural Members”, Proceeding of 11th Int. Conference on Adaptive Structures and Technologies, October 23-26, Nagoya, Japan, pp. 285-292.
[10] ASK Naidu and C K Soh (2004), “Damage severity and propagation characterization with admittance signatures of piezo transducers”, Smart Materials and Structures, 13 393–403.
[11] Suresh Bhalla. V (2003) research report on “A mechanical impedance approach for structural identification, health monitoring and non-destructive evaluation using piezo-impedance transducers”, Nanyang technological university, Singapore.
[12] Soh C. K and Bhalla S. (2005), “Calibration of Piezo-Impedance Transducers for Strength Prediction and Damage Assessment of Concrete”, Smart Materials and Structures, Vol.14 (4), pp: 671-684.
[13] Bhalla, S., Yang, Y. W., Zhao, J. and Soh, C. K. (2005), “Structural Health Monitoring of Underground Facilities-Technological Issues and Challenges”, Tunneling and Underground Space Technology, Vol. 20 (5), pp: 487-500.
[14] S. Park, S. Ahmad, C.-B. Yun and Y. Roh (2006), “Multiple Crack Detection of Concrete Structures Using Impedance-based Structural Health Monitoring Techniques”, Experimental Mechanics, Vol. 46, pp: 609–618.
[15] Yang, Y., Lim, Y. Y. and Soh, C. K. (2008), “Practical Issue Related to the Application of the Electro-Mechanical Impedance Technique in Structural Civil Health Monitoring of the Structures: I. Experiment”, Smart Material and Structures, Vol.17(3), pp:1-12.
[16] Tawie, R., and Lee, H. K. (2010). “Monitoring the strength development in concrete by EMI sensing technique.” Construction and Building Materials, Vol. 24(9), pp: 1746–1753.
[17] Xu Dongyu, Cheng Xin, Huang Shifeng, Jiang Minhua (2010), “Identifying technology for structural damage based on the impedance analysis of piezoelectric sensor”, Construction and Building Materials Vol. 24, pp:2522–2527.
[18] Talakokula, V., Bhalla, S., Gupta A. and Bhattacharjee, B. (2015), “Non-Destructive Assessment of Rebar Corrosion Using Piezo-Transducers Via Equivalent Structural Parameters”, Current Science, 108 (10), pp1890-1900.
[19] Talakokula. V, Vaibhav and Bhalla. S (2016) “Non-Destructive Strength Evaluation of Fly-ash Based Geopolymer Concrete Using Piezo Sensors”
International Conference on Sustainable Design, Engineering and Construction Procedia Engineering, 145, pp:1029 – 1035.
[20] B.V. Rangan (2008), Research report on “Fly ash based geopolymer concrete” Curtin University, Perth, Australia.
[21] Zhou, S. W., Liang, C. and Rogers C. A. (1996), “An Impedance-Based System Modeling Approach for Induced Strain Actuator-Driven Structures”, Journal of Vibrations and Acoustics, ASME, Vol. 118, No. 3, pp. 323-331.
BIOGRAPHIES:
K. Niroshkumar is a post-graduate student pursuing structural engineering at Thiagarajar College of Engineering, Madurai. His research area of interest is piezoelectric sensor based structural health monitoring techniques. Dr. M.C. Sundarraja is presently working as Assistant Professor in Structural Engineering Division of Thiagarajar College of Engineering, Madurai and intensively carrying out research on strengthening of concrete and steel structures.
Dr.L.R. Karl Marx is an Associate professor in Department of Mechatronics Engineering at Thiagarajar College of Engineering, Madurai. His research areas includes embedded system, smart structure control and IoT.