DAMAGE COEFFICIENTS IN LOW RESISTIVITY … cr-13476 8 nrtc 75-23r damage coefficients in low...
100
NASA CR-13476 8 NRTC 75-23R DAMAGE COEFFICIENTS IN LOW RESISTIVITY SILICON by J. R. Srour, S. Othmer, K. Y. Chiu, and O. L. Curtis, Jr. NORTHROP RESEARCH AND TECHNOLOGY CENTER prepared for NATIONAL AERONAUTICS AND SPACE ADMINISTRATION NASA Lewis Research Center Contract NAS 3-17849 https://ntrs.nasa.gov/search.jsp?R=19750016785 2018-05-29T11:58:20+00:00Z
-
Upload
nguyendiep -
Category
Documents
-
view
217 -
download
2
Transcript of DAMAGE COEFFICIENTS IN LOW RESISTIVITY … cr-13476 8 nrtc 75-23r damage coefficients in low...

NASA CR-13476 8NRTC 75-23R
DAMAGE COEFFICIENTS IN LOWRESISTIVITY SILICON
by J. R. Srour, S. Othmer, K. Y. Chiu, and O. L. Curtis, Jr.
NORTHROP RESEARCH AND TECHNOLOGY CENTER
prepared for
NATIONAL AERONAUTICS AND SPACE ADMINISTRATION
NASA Lewis Research Center
Contract NAS 3-17849
https://ntrs.nasa.gov/search.jsp?R=19750016785 2018-05-29T11:58:20+00:00Z

1. Report No.
NASACR-1347682. Government Accession No. 3. Recipient's Catalog No.
4. Title and Subtitle
DAMAGE COEFFICIENTS IN'LOW RESISTIVITY SILICON5. Report Date
May 1975
6. Performing Organization Code
7. Author(s)
J. R. Srour, S. Othmer, K. Y. Chiu, and O. L. Curtis, Jr.
8. Performing Organization Report No.
NRTC 75-23R
10. Work Unit No.9. Performing Organization Name and Address
Northrop Research and Technology Center3401 W. Broadway
• Hawthorne, California 90250
11. Contract or Grant No.
NAS 3-17849
12. Sponsoring Agency Name and Address
National Aeronautics and Space AdministrationWashington, D. C. 20546
13. Type of Report and Period CoweredFinal ReportJuly 1973 to November 1974
14. Sponsoring Agency Code
15. Supplementary Notes
Project Monitor: C. R. Baraona, NASA Lewis Research Center, Cleveland, Ohio 44135
16. Abstract
Electron and proton damage coefficients have been determined for low resistivity silicon based onminority-carrier lifetime measurements on bulk material and diffusion length measurements onsolar cells. Irradiations were performed on bulk samples and cells fabricated from four types ofboron -doped 0. 1 ohm-cm silicon ingots, including the four possible combinations of high and lowoxygen content and high and low dislocation density. Measurements were also made on higherresistivity boron-doped bulk samples and solar cells. Major observations made and conclusionsreached in the investigation are the following. 1) Diffusion-length damage coefficients (K. Jin-crease with decreasing resistivity (p) for boron-doped silicon. For low-resistivity solar cells,this decrease in radiation tolerance must be weighed against potential advantages when consideringsuch devices for utilization in a space radiation environment. 2) For 0. 5-, 1. 0-, and 2. 5-MeVelectron bombardment, empirical fits to experimental data can be approximately expressed as
~^' for 0. 1 ^ p < 20 ohm-cm. For 10-MeV proton bombardment, an empirical fit of thep ' was found to describe the data reasonably well. 3) The dependence of damage
coefficient on resistivity can be qualitatively accounted for quite well using a two-level Hall-Shockley-Read model. 4) Damage coefficients for solar cells were observed to be larger than theirbulk-material counterparts. 5) Bulk samples and solar cells prepared from float-zone materialwere generally observed to be more radiation tolerant than their Czochralski counterparts at allresistivities examined. 6) No dependence of damage coefficient on dislocation density was apparentfor 0. 1 ohm-cm bulk samples and solar cells.
yform K
17. Key Words (Suggested by Author(s))
silicon, solar cells, electron damage, protondamage, minority-carrier lifetime, damagecoefficient
18. Distribution Statement
Unclassified-unlimited
19. Security Classif. (of this report)
Unclassified
20. Security Classif. (of this page) 21. No. of Pages
95
22. Price"
* For sale by the National Technical Information Service, Springfield, Virginia 22151

FOREWORD
A number of individuals contributed to this program in various ways and theauthors wish to express their gratitude by mentioning the major contributors.The cooperation of Bruce Anspaugh during electron irradiations at the JPLDynamitron was appreciated. Peter lies provided timely delivery of solarcells and bulk silicon specimens and also made the Centralab solar simu-lator available to us. Proton irradiations at the Cal Tech Tandem Van deGraaff facility were performed with the cooperation of Frederick Mann andProf. Tombrello. Low resistivity silicon ingots of high quality were sup-plied by Dow Corning. Surface photovoltage measurements were made atJPL through the cooperation of Richard Stirn. Expert technical assistanceduring the entire investigation was provided by Joe Woods and GeraldHurwitz. Helpful discussions were held with Cosmo Baraona and HenryBrandhorst of NASA-Lewis Research Center and their continued encourage-ment and interest in this program has been appreciated.

TABLE OF CONTENTS
Section Title Page
1.0 INTRODUCTION 1
2.0 EXPERIMENTAL TECHNIQUES 2
2. 1 Measurement Techniques 2
2.2 Sample Preparation Procedures 6
2. 3 Radiation Facilities and Irradiation Procedures ... 8
2. 4 Sample Designation System 10
3.0 PRELIMINARY EXPERIMENTS AND ANALYSES 11
3. 1 Analysis of Surface Recombination Effects 11
3.2 Procedure for Determining Diffusivity and Mobility . 14
3. 3 Resistivity Considerations 17
3.4 Dislocation Density Determinations 17
3. 5 Vacuum Grease Experiments 19
3.6 Generation Rate Calibration for the SSPC Apparatus. 19
3. 7 Trapping Effects 22
3.8 Surface Recombination--Experimental Considera-tion s 27
3. 8. 1 Simulation of Zero and Infinite Surface Re-combination Velocity with a Diffused Sample . 27
3. 8.2 Measurement of the Thickness Dependenceof Lifetime for a Sandblasted Bulk Sample . . 29
3. 8. 3 Surface Recombination Velocity for BulkSpecimens 32
3. 9 Determination of Oxygen Concentration 33
3. 10 Pre-irradiation Properties of Bulk Samples andSolar Cells 34
4.0 RESULTS 39
4. 1 Results of Electron Irradiations 39
4.1.1 0. 5-MeV Electrons 39
4.1.2 1. 0-MeV Electrons 45
111

Section Title Page
4.1.3 2. 5-MeV Electrons 47
4. 1.4 Electron Energy Dependence of DamageCoefficient 50
4.2 Results of 10-MeV Proton Irradiation 50
4. 3 Discussion of Saturation Effects 58
4.4 Comparison of Steady-State Photoconductivity andSteady-State Surface Photovoltage Measurements . . 58
4. 5 Annealing Study for Low-Resistivity Samples . . . . 62
4. 6 Solar Simulator Results for Irradiated Cells . . . . . 66
5.0 DISCUSSION AND CONCLUSIONS 78
APPENDIX 82
REFERENCES 88

SECTION 1.0
INTRODUC TION
The output power from silicon solar cells employed in space applicationsdegrades with time due to electron and proton bombardment. These chargedparticles displace silicon atoms from their normal lattice sites, resultingin the creation of recombination centers which reduce the minority-carrierlifetime, and hence the'diffusion length. This diffusion-length degradationprocess is commonly characterized by a damage coefficient Kj^, definedthrough the relationship
I/' - LQ-2 = . K L * . (1)
In this expression LQ and L are pre- and post-irradiation diffusion length,respectively, and 0 is the fluence of the irradiating particles (either elec-trons or protons) of energy E. Thus, a relatively large K^-value is indi-cative of vulnerability to radiation damage.
Recent analyses performed by Brandhorst indicate that the use of low-resistivity (« 1 ohm-cm) bulk silicon for fabricating solar cells shouldresult in devices with a considerably larger conversion efficiency thanthat typical of conventional units. Increased open-circuit voltage is theprimary reason for such expectations. In predicting the radiation responseof a solar cell fabricated from low-resistivity silicon, the problem arisesthat electron and proton damage coefficients are not known for such materialand thus experimental determinations of these quantities are required.
In this report, we present the results of an experimental program aimedat determining electron and proton damage coefficients in low-resistivityboron-doped silicon. Minority-carrier lifetimes were measured beforeand after irradiation for bulk silicon samples using a steady-state photo-conductivity technique. In addition to measurements on 0. 1 ohm-cmmaterial, comparison data were obtained for higher resistivity samples,thus permitting determination of the dependence of damage coefficient onresistivity. Pre- and post-irradiation measurements of two types werealso made for n-on-p solar cells of various base resistivities, including0. 1 ohm-cm: 1) diffusion length measurements using penetrating radiation(Co-60 source); 2) determination of current-voltage characteristics duringillumination of cells with a solar simulator. For low-resistivity bulksilicon, the possible dependence of Kj on growth technique (oxygen con-centration) and dislocation density was examined. Electron irradiationswere performed at three energies (0. 5, 1.0, and 2. 5 MeV) to permitexamination of the energy dependence of Kj. Following irradiation,isothermal annealing studies were conducted at room temperature and60°C for selected bulk samples. In addition to experimental findings,analytical results pertaining to certain aspects of the investigation arealso presented.
1

SECTION 2. 0
EXPERIMENTAL TECHNIQUES
In this section, experimental techniques employed and additional relatedinformation are presented. Included are descriptions of: a) measurementtechniques; b) sample preparation procedures; c) radiation facilities andirradiation procedures.
2. 1 Measurement Techniques
The ASTM standard method for measuring minority-carrier lifetime inbulk silicon is the photoconductivity decay technique. However, imple-mentation of this technique becomes increasingly difficult as resistivityis decreased. Furthermore, data interpretation can be a problem whentrapping effects are significant. In an attempt to overcome such problems,we have devised a steady-state method of lifetime measurement for low-resistivity material. As shown in Figure 1, a bulk silicon specimen withohmic contacts attached is situated in an enclosed chamber and is illumi-nated by penetrating light from a steady-state source (projection lamp--GE DCA). Non-penetrating wavelengths are eliminated by a silicon filterconsiderably thicker than the test sample, and therefore a condition ofuniform carrier excitation is obtained. A Corning 7-57 filter was em-ployed to reduce heating of the Si filter. A variable-frequency light chopper
. (0-300 Hz) is employed between the specimen and the projection lamp. Achopping frequency of 277 Hz was utilized for all lifetime measurementsin this program. The purpose of chopping the light is to permit the use ofphase-sensitive detection - a convenient approach to enhancing the signal-to-noise ratio. The light chopper also provides the reference signal insuch a detection scheme. Also shown in Figure 1 is a silicon photodiode•which provides a signal proportional to light intensity. Background lamps(unchopped) were employed to fill traps, and this aspect of the experimentis discussed in Section 3. 7. In order to avoid generation of a contactphotovoltage, sample contacts were shielded from the chopped light, asshown in the figure. Approximately the central third of a sample wasilluminated.
Figure 2 shows a schematic of the electrical system employed. The sample-under-test is connected in a constant-current circuit (R »R ), and the steady -state photoconductivity (SSPC) signal, AV, due to chopped-light illuminationis monitored. Voltage gain is provided by a low-noise transformer (TriadGeoformer G-10) and an operational amplifier (Analog Devices 118A). Thesignal is phase-sensitively detected by means of an Ithaco Model 353. Usingappropriate circuit considerations, the measured signal was related to thesignal of interest, AV.

to.
3nJ
u .5& Xw "
ts133
O "3o -^o c
^J 0)
HCO r-,
nJd>
I!>>
S
to wfl) <uh Sa g<U ^fn O
a0>
s(U
O
OCO
W)•H

l O Q Q O O O O r
IQ00001
CO
A ••y co
g.s£ oo 0)c a3 to
o ou o
sto>>
CU F-id ^S «»0) u
td -r;(D ^d °S a1
«O h•^ 53-sD OCO +JD
•H O,
Mo to
co co
CO
a;
COCL

For a constant current circuit, excess minority-carrier density An (assuming p-type material) is given by the relation
AV P0M-h AV
where po is equilibrium majority carrier density, p is resistivity, V is thedc voltage drop across the illuminated portion of the sample, e is the elec-tronic charge, and )j,v and (j, are hole and electron drift mobilities, respec-tively. (Equation 2 assumes that AV « VQ, a condition that held true forthe present study. ) Measured excess carrier density from an SSPC experi-ment is related to minority-carrier lifetime T by
An = gT, (3)
where g is carrier generation rate. The generation rate for the SSPC ap-paratus was determined using a calibration procedure described in Section3.6. We measured An and g was known, thus yielding T. To obtain diffusion'length L, the expression
L = (DT) 1 / 2 (4)
•was employed. The procedure used to determine diffusivity D is dis-cussed in Section 3. 2. All lifetime measurements using the SSPC apparatuswere made at room temperature (25 ±5°C).
Measurements of lifetime for several unirradiated specimens were also madeusing transient photoconductivity decay techniques. A flash x-ray sourcewas used for carrier excitation; the experimental apparatus employed hasbeen described previously.
Measurements of diffusion length were made for n-on-p Si solar cells usingthe Co-60 gamma-ray source at Northrop Research and Technology Center.This measurement method has been described by Gremmelmaier, ^ Rosen-zweig, -* and, more recently, by Reynolds and Meulenberg. ° Measurementsof short-circuit current I were made and then diffusion lengths were de-termined using the expression"
_ A _ , fcosh(w/L) - l " |sc ~ ^~S Y I sinh(w/L) J ' v
where A is cell area, w is cell width, and g., is the carrier generation ratefor the Co-60 source. This rate was determined from a series of totaldose measurements using CaF thermoluminescent dosimeters. Measured

dose rate in rads(Si)/sec was converted to g^ using the conversion factor4. 2 x 10¹³ pairs/cm3 rad. The result obtained was g = 6. 55 x 1014 pairs/
sec.
Equation (5) only holds for the case of an infinite surface recombinationvelocity (s) at the back surface of a solar cell. We assumed infinite shere. Using a more general expression" to calculate L for various valuesof s reveals that the difference between results for s = 10^ cm/sec ands = <» is very small. **" The assumption of infinite s at an ohmic contactseems quite reasonable. We finally note that employment of Equation 5to determine L based on measured I requires an iterative procedure,
S Cand this was accomplished using a programmable desk-top calculator.
Current- voltage characteristics for solar cells were obtained before andafter irradiation using the solar simulator at Centralab Semiconductor.Measurements were made under AMO conditions at room temperature(25 to 30°C).
An alternative measurement technique that was considered for employmenthere is the steady-state surface photovoltage (SPV) method. '~ 1 0 Thisapproach to measuring diffusion length was developed quite a few yearsago, but only recently has it begun to receive attention by various researchgroups. In the present investigation, a comparison was made for severalsamples of diffusion lengths determined using the SSPC method and theSPV method. **
2. 2 Sample Preparation Procedures
Low- resistivity ("^0. 1 ohm-cm) boron-doped silicon ingots for use in this pro-gram were obtained from Dow Corning. Four ingots were obtained, corres-ponding to the four possible combinations of high and low oxygen concentrationand high and low dislocation density. Two ingots were grown by the float- zonemethod and were expected to have a relatively low oxygen content. The othertwo ingots were grown by the Czochralski method (relatively high oxygen con-tent). One float-zone crystal and one Czochralski crystal were grown to be
*For the interested reader, we note that the general expression referred
to here (Equation A9 in Reference 6) appears to have a few typographicalerrors. It should read (using the present notation):
I qAg L fDe:x:P(-w/L) + s L jexp(-w/L) - l[ + sc Y L s L sinh(w/L) - D cosh(w/L) ]
SPV measurements were made at the Jet Propulsion Laboratory throughthe cooperation of R. J. Stirn.

dislocation free, and the other two ingots had a high dislocation density.(Measurements of dislocation density are described in Section 3. 4). Studieswere also made on higher resistivity material, also grown by Dow Corning.This material was already on hand at Northrop Research and TechnologyCenter at the start of this program.
An important factor in deciding on bulk-silicon test-specimen dimensions•was the bombarding particle energies to be employed. Table I shows theenergies used and the corresponding particle ranges in silicon. ** It isdesirable to avoid a condition of inhomogeneous damage for the purposeof aiding data interpretation. We selected a sample thickness of 0. 3 cm,which is comparable to that employed in conventional solar cells. Thisthickness is considerably less than the particle ranges under consideration,and thus reasonably uniform damage profiles should result for 1. 0- and 2. 5-MeV electrons and for 10-MeV protons. For 0. 5-MeV electrons, althoughthe range is three times larger than the sample thickness, inhomogeneitiesare expected to occur because the variation of damage coefficient with particleenergy is quite strong near 0. 5 MeV. Upon penetrating half the thickness ofa 0. 3 mm sample, a 0. 5-MeV electron loses ~0. 057 MeV. The 0. 5-MeV-to-0.443-MeV damage coefficient ratio for silicon-^ is ~ 1. 45, and thus theamount of damage expected at the center of the sample is ^70% of that atthe bombarded surface. (A similar calculation for incident 1. 0-MeV elec-trons yields ~90% at the sample center. )
TABLE I
Electron Electron Proton ProtonEnergy Range Energy Range
(MeV) (mm) (MeV) (mm)
0.5 0.94 10 0.71
1.0 2.3
2.5 6 .2
Electron and proton ranges in silicon for thebombardment energies employed in this study.
Bulk silicon samples measuring approximately 1 cm x 2 cm x 0. 03 cmwere fabricated at Centralab from several Northrop-supplied siliconingots. Centralab also prepared samples for our use from 6 ohm-cmCzochralski material (B-doped) that is conventionally employed in thefabrication of solar cells. Additionally, n-on-p solar cells were fabricated

at Centralab using the same Northrop-supplied ingots employed in the pre-paration of bulk samples, thus permitting a meaningful device-bulk com-parison. Conventional production-line n-on-p cells (Czochralski) werealso obtained from Centralab for the purpose of providing a "standard-cell" comparison during the radiation testing.
All bulk-samples were sandblasted at Centralab for the purpose of achievinga high surface recombination velocity. (Surface recombination considerationsare discussed in subsequent sections of this report. ) Ohmic contacts wereprepared at Northrop using ultrasonic soldering techniques. Contacts {twoper sample) were narrow (^0. 1 cm) stripes prepared on a. major face atthe ends along the 1-cm dimension. Contacts were checked by makingforward and reverse resistance measurements at room temperature. Re-sistivity was measured for each specimen using conventional four-point-probe techniques.
2. 3 Radiation Facilities and Irradiation Procedures
Electron irradiations were performed at 0. 5'-, 1. 0-, and 2. 5-MeV usingthe Dynamitron at the Jet Propulsion Laboratory (JPL), Pasadena, Calif.All bulk specimens and solar cells were illuminated during irradiation atan intensity of 140 mW/cm using the solar simulator at the Dynamitronfacility. Test specimens were bombarded •while in vacuum at a pressureof 'MO mm Hg. Samples were attached to an Al plate using Apiezon Hvacuum grease to provide a good thermal contact (see grease discussionin Section 3. 5). The temperature of the plate was controlled at 25°C. Tominimize room-temperature annealing, all irradiated bulk samples andsolar cells were stored at dry ice temperature following irradiation, withstorage beginning approximately one-half hour after bombardment. Spec-imens were removed from dry ice for about an additional one-half hourto permit a measurement, then were returned to dry ice until time for thenext irradiation. Current-voltage characteristics for solar cells and life-time measurements for bulk samples were obtained after a total of ~ 1 hourat room temperature. Diffusion length measurements on selected solarcells using a Co-60 source were made after ~2 hours at room temperature.
At the Dynamitron, a Faraday cup was employed to determine the fluence.The following fluences were utilized at all three electron energies: 3 x 10* ,1014, 3 x 10¹⁴, 1015, and 3 x 10¹⁵ electrons/cm2. For the first threefluences, the flux was 5 x 10^0 electrons/cm2 sec. At 10^ electrons/cm2, the flux was 1011 electrons/cm2 sec; and at 3 x 10¹⁵ electrons/cm2,it was 2 x I Q l l electrons/cm2 sec. The flux was increased with increasingfluence in order to obtain reasonable exposure times. (The last exposureat a given energy required 2. 8 h. )

The 13-MeV Tandem Van de Graaff at the California Institute of Technology,Pasadena, California, was employed for 10-MeV proton irradiations. Bulksamples and solar cells were illuminated during irradiation at an intensityof 140 mW/cm2 using a Varian VIX-150 Xenon Short-Arc Illuminator. ACoherent Radiation Model 201 Broad Band Power Meter was employed tocalibrate the xenon illuminator and map the light-beam profile. At theproton source, because of beam uniformity and beam size considerationsonly one sample could be irradiated at a time. The xenon lamp could beemployed to illuminate a single sample to an intensity of 140 mW/cm towithin about ±5% over the specimen surface. Samples were irradiated invacuum at a pressure of ~10~^ mm Hg. The light source was external tothe vacuum chamber and illumination was accomplished through a fusedquartz window (Type 125) in the chamber wall. This window has a trans -mittance of nearly 100% over the wavelength range from 0. 27 to 2. 7 p,m.Samples -were mounted with Apiezon H vacuum grease on a massive, moveableblock of Al in the chamber and externally moved into the beam one at a time.Irradiation times were ^30 seconds per sample for all fluences. The tem-perature rise of the aluminum block was determined to be less than 1°Cduring the irradiation of each lot of about 15 samples. Furthermore, thetemperature rise of the sample relative to the sample mount was determinedto be about 1°C when subjected to the light. In the absence of temperaturecontrol mechanisms, the sample holder was, therefore, brought to an initialtemperature of 23°C prior to evacuation, giving sample temperatures rangingfrom 24 to 25°C during irradiation. Fluences employed were the following:~3 x 10¹⁰, -MO11, ^3 x 10¹¹, and 1.2 x 10¹² p/cm2.
Fluences were controlled by means of a current integrator which monitoredthe charge impinging on the sample mount through an aperture of known area.The sample holder was maintained at positive bias to collect secondary elec-trons. Integrator offset current and leakage current due to finite resistancefrom sample to ground were balanced out, and the beam currents employedwere chosen to be large compared to residual drift in these quantities. Athin wire was scanned past the aperture to measure beam current as a functionof position and verify beam uniformity over the aperture. This method ofregulating fluence was deemed to be preferable to the use of a Faraday cupsince the area of beam uniformity was not much larger than the sample size.A Faraday cup would have had to be removed from the area of interest, andwould have had a very small beam aperture, necessitating the measurementof much smaller currents. The fluxes for proton irradiations were as follows:The fluence of 3 x 10^0 p/cm was obtained at a flux of about 6 x 10° p/cmsec; the fluence of 10U at 6-9 x 10⁹; of 3 x 10¹¹ at 2 x 10¹⁰; and the fluenceof 1. 2 x 10¹² p/cm2 at a rate of 3. 6 x 10¹⁰ p/cm2 sec. The fluxes werechosen so as to keep total time at room temperature within acceptable limitsof about 1 h for each group of samples which were mounted in vacuum simul-taneously. Dry ice storage was utilized in the same manner as describedabove for electron irradiations.

2. 4 Sample Designation System
As discussed above, a set of bulk samples and solar cells were fabricatedfrom the same silicon ingot to permit a meaningful comparison betweendevice and bulk behavior. This same procedure was followed for a varietyof silicon ingots. The sample designation system employed in this report,both in the text and on all figures, provides information concerning growthtechnique, resistivity, dislocation density, and whether a specimen is abulk sample or a solar cell. For float-zone material, the abbreviation FZis employed, and for Czochralski material CZ is used. We employ theshorthand designations HD for samples prepared from material with a highdislocation density and LD for low-dislocation-density units. . (These des-ignations only appear for low-resistivity specimens because no dislocation-density determinations were made for higher-resistivity material. ) Nom-inal resistivities are given in ohm-cm and also a number is assigned toeach bulk sample and device.
A few examples will serve to illustrate the designation system: a) FZLD0. 1/4: this notation is for a bulk silicon sample (number 4) fabricated from0. 1 ohm-cm (nominal) low-dislocation-density float-zone material; b)CZHD 0. 1/SC2; this designation is for a solar cell (SC), device number 2,fabricated from 0. 1 ohm-cm high-dislocation-density Czochralski material;c) FZ 13/4: a bulk sample (number 4) fabricated from 13 ohm-cm float-zone material. Bulk samples designated CZ 6/x were fabricated frommaterial typically employed at Centralab for the fabrication of solar cells.Solar cells designated CZ 9/SCx are typical production line cells obtainedfrom Centralab.
Data points on all figures are identified in two ways. Some symbols areassociated with measurements on a particular bulk sample or solar cell,and in these cases the sample (or device) number is listed on the figurein a legend. Other symbols represent an average of data obtained for twoor more bulk specimens of the same type, and in these cases the legendidentifying this type of data point will list the ingot designation only, withno specimen number appearing. For example, a data point identified asCZLD 0. 1 represents an average value for identically treated bulk samplesfrom ingot CZLD 0.1.
10

SECTION 3. 0
PRELIMINARY EXPERIMENTS AND ANALYSES
In the course of preparing for irradiations and subsequent determination ofdamage coefficients, several preliminary experiments were performed. Ad-ditionally, analyses were made of certain features of the experiment, includ-ing surface recombination effects and other phenomena of interest. Thissection discusses the various preliminary considerations that were made.
3. 1 Analysis of Surface Recombination Effects
The employment in this investigation of thin bulk silicon samples with sand-blasted surfaces necessitates accounting for surface recombination effects.(Justification for choosing sandblasted surfaces, along with a. descriptionof associated experimental results, is given in Section 3. 8. ) In general,one measures an effective lifetime i"e££ which may or may not be equal tothe bulk lifetime T depending on the degree of surface recombination occur-ring. An analysis of such effects was performed for the sample geometryused in this study. The sample can be approximated by a thin slab havingone finite and two infinite dimensions. The problem is to determine theratio of T rr to T for a given value of bulk diffusion length L and a givensurface recombination velocity s.
For a thin slab of thickness 2T under conditions of uniform carrier excitation,the following expression holds :
eff/T =
(sL/DT) sinh (T/L) .\ I(1/L) sinh (T/L) + (s/D) cosh (T/L)
Calculations appropriate for 0. 1 ohm-cm p-type silicon^were made usingEquation 6 by assuming a diffusivity D of 11. 7 cm /sec and a sample half-thickness of 165 |J.m. Computational results are presented in Figure 3,where T
e f f /T is plotted versus bulk diffusion length with surface recombina-tion velocity as a parameter. Assuming that the pre-irradiation value of.L is 100 um, for the largest values of s measured lifetime will differ fromthe actual value by as much as a factor of about two. On the other hand,if s is ^ 100 then the error will be no larger than about 5% before irradiation.Another noteworthy feature of the calculations is that the difference betweenresults for s = 10** cm/sec and s = °° is very small. Thus, as long as thecondition s s 10 cm/sec holds for specimen samples, differences in sfrom sample to sample with otherwise identical properties will be only ofsecond-order importance in terms of measured lifetime (T ).
eli
value of D is employed only to illustrate the calculational procedure.As noted in Section 3, 2, a slightly smaller electron diffusivity was utilizedin this investigation for all calculations relating to experimental findings.
11

12

Since the variation of Teff/T is approximately independent of surface recom-
bination velocity for s ^ 10 , analysis is simplified for samples with such sur-face properties. Two examples will illustrate this point. First, we notethat for T > L, sinh (T/L) ?« cosh (T/L). If it is further assumed that sL» D, Eq. (6) reduces to
This expression was used to obtain one of the dashed curves in Figure 3,assuming T = 165 M-m, and agreement with the s = °° curve is seen to beexcellent for L ^ 100 Hm. The deviation for larger L is due to the deviationof sinh (T/L) from cosh (T/L). It is thus seen that for the case of large sthe analytical dependence of T
ef£/T on diffusion length assumes a very simpleform.
From the standpoint of correcting for surface recombination effects, it isdesirable to express T as
' = 4 + 4- . (8)T T Teff s
where T is "surface" lifetime. Such an expression implicitly assumes aconstant value for T It turns out that this approach is strictly true onlyfor the case of T « L. For this situation, Eq. (6) yields T = T/s. For
Sour case the inequality T «L will certainly not hold. However, Eq. (8)constitutes a very good approximation for the present situation, as seenby the following example.
Consider a sandblasted 0. 1 ohm-cm p-type sample with a half-thickness Tof 165 um, a pre-irradiation diffusion length of 100 (im, and a surface re-combination velocity of 10 cm/sec. Assuming a diffusivity D of 11. 7 cm /sec, we obtain a pre-irradiation value for T of 8. 5 p,sec. From Figure 3,T £,./T = 0. 49 for L = 100 M/m, and therefore Te££ = 4. 2 p,sec. Equation (8)yields Tg = 8.2 usec. We next assume that Tg remains constant as T de-grades due to irradiation. The second dashed curve in Figure 3 showsthe results of calculating T
eff/T for various L values (^ 100 M-m, normalizedto solid s = 10 curve at 100 um) by employing Eq. (8) and assuming T =8. 2 p,sec. It is seen that the largest deviation of the dashed (approximate)curve from the actual (exact) curve is only on the order of 5%. Therefore,one could accurately employ Eq. (8) to interpret steady-state photoconductivitymeasurements. The same surface correction that is applied prior to ir-radiation can be applied following bombardment.
13

Under the assumption of a constant surface lifetime, T it is readily shownthat if effective values of diffusion length are employed to determine damagecoefficients, then Equation 1 takes the form
2 „ KL * . (9)
If we denote a damage coefficient determined with Equation 9 as KT , thenbased on the above discussion one would expect K-r to be in good agree-ment with a damage coefficient determined using actual bulk diffusion lengths(KL). This was found to be the case experimentally. Values for K^ were,on the average, ^6% larger than those for K-^ (based on data obtained follow-ing 1-MeV electron irradiation).
Although we could have employed the above-described effective-diffusion-length approach to determining K^ in the present investigation, the moreinformative approach of obtaining actual pre- and post-irradiation diffusionlengths was followed. This required that each measured (effective) lifetimebe converted to actual bulk diffusion length by properly correcting for theeffects of surface recombination. For this purpose, Equation 6 was em-ployed in a slightly different form:
2T
Leff ~ D
, ( sL/DT)sinh(T/L)( l /L) s inh(T /L) + (s/D) cosh (T/L) ( '
Appropriate values of s and D (both discussed below) were employed and thatvalue of L required to satisfy Equation 10 was then determined by using aniterative procedure on a programmable desk-top calculator.
3. 2 Procedure for Determining Diffusivity and Mobility
Determination of diffusion-length damage coefficients was a primary goalof the present study. Because minority-carrier lifetime is the measuredquantity, utilization of Equation 4 is required to determine diffusion length,which requires knowledge of diffusivity D. Additionally, determination oflifetime with the SSPC method requires knowledge of drift mobilities. (Ofcourse, a and D are related through the Einstein relation. ) Since lifetimemeasurements were made as a function of resistivity, and thus D varied,it became necessary to assume reasonable values for diffusivity in a con-sistent manner (i. e. , consistent with measured resistivities). The follow-ing approach was employed. Irvin's data "* was used to determine acceptorconcentration Na from measured resistivity. Next, hole drift mobility u,was calculated using the expression
(11)
14

which assumes N = p . Next, Irvin's data was again employed to determine3. O
the resistivity of n-type Si with the same impurity concentration as determinedabove for p-type material. Equation 11 then yields u for the new value of p
C(with donor concentration Nj substituted for Na). This approach cannot bedirectly employed for 0. 1 ohm- cm material because all impurity atoms arenot ionized. We determined the number of ionized impurities, based on the .value of N determined from Irvin, in the following manner.
For 0. 1 ohm-cm boron-doped silicon, the equilibrium Fermi level E£ is suf-ficiently close to the acceptor level Ea so that a significant fraction of theacceptor atoms are not ionized at room temperature. The ratio of ionizedacceptor concentration N to the total acceptor concentration N is given
N" i1 (12)N
a1 + 3 exp [ (E - E ) /kT]
cL I
where $ is the impurity level spin degeneracy ( 8 = 4 for acceptor levels ).For 0. 1 ohm-cm material, N& is about 4. 8 x 10*' cm (from Irvin* ).Additionally, E is located 0. 045 eV above the valence band. By consider-ing the variation of Er with carrier concentration simultaneously with Equa-tion 12, the following results were obtained: E£ is located approximately0. 092 eV above the valence band and about 60% of the acceptor atoms areionized.
Once the ionized acceptor density is determined by this method, then Equa-tion 11 yields u, (substitute N" for N0). Following this approach yields^ n a ap., = 2 1 0 cm /V-sec for 0. 1 ohm-cm material. Determination of M>e forlow-resistivity silicon using the above approach presents somewhat of aproblem. One would like to determine the electron mobility in p-typematerial with N acceptor atoms, N" of which are ionized. Irvin's plot
cl • 3,of p vs N for n- and p-type Si has built into it certain assumptions regard-ing impurity ionization for low-resistivity material (spin degeneracy, im-purity level locations, etc. ) Without knowledge of these precise assump-tions, one hesitates to attempt a detailed calculation for physically equi-valent n-type material (equivalent in terms of scattering effectiveness)which would yield, in conjunction with Irvin's graphs, a value for u, in0. 1 ohm-cm material. Instead, we have employed the approach of aver-aging literature values for this quantity. Sze and Irvin*" give a value of~435 cm2 /V-sec and Wolfstirn's value17 is ~405 cm2/V-sec. The av-erage of these two quantities is numerically equal to that given in Neu-berger1 , ~420 cm /V-sec, and hence we employ here this value for p,e
in 0. 1 ohm-cm p-type Si. The corresponding electron diffusivity is10. 9 cm2/sec at 300°K.
15

It may not be clear yet to the reader why we employed the approach describedabove for obtaining mobility values in silicon of various resistivities. Todetermine An using Equation 2 mobility values must be assumed. Commonlyemployed references, such as Sze and Irvin , give graphs of mobility vsimpurity concentration N. Thus, to use such graphs one must determine N.A common approach is to measure resistivity and then use Irvin1 s graph^to determine N, followed by the obtaining of mobility values from Sze andIrvin. However, built into Irvin1 s graph are assumed mobility values whichare not completely consistent with the mobility graphs of Sze and Irvin. (Infact, there is an apparent plotting error in Sze and Irvin1 s u,^ curve in thatat low impurity concentrations a limiting value of ~600 cm /V-sec is ap-proached, as opposed to the accepted value of ~500 cm^/V-sec. ) Hence,for purposes of consistency we decided to employ Irvin's graph alone todetermine mobility, as described above, with the exception of the ue valuefor 0. 1 ohm-cm material. (This approach removed a considerable amountof scatter initially observed in a comparison of SSPC lifetimes and photo-conductivity decay (PCD) lifetimes performed during the generation ratecalibration (described below) for the SSPC apparatus. )
As an experimental check on the hole mobility assumed for 0. 1 ohm-cm ma-terial, Hallmobility measurements were made at room temperature usingconventional techniques for one sample from each of the four low-resistivityingots being studied in this program. Results are shown in Table II, alongwith calculated drift mobilities. (A Hall-to-drift mobility ratio 0. 92 wasassumed. *°) Agreement among the four ingots is good. It is satisfying tonote that the average hole drift mobility in Table II (223 cm /V sec) is ingood agreement (~6% higher) with the value of 210 cm /V sec determinedabove.
TABLE II
Hall DriftMobility Mobility
2 2Ingot (cm /V sec) (cm /V sec)
FZLD 0. 1 208 . 226
FZHD 0. 1 194 211
CZLD 0. 1 212 230
CZHD 0. 1 208 226
Measured Hall mobilities for low-resistivity p-typesilicon specimens. Drift mobilities were obtainedassuming a Hall-to-drift mobility ratio of 0. 92(Reference 18).
16

3. 3 Resistivity Considerations
During the preliminary stages of this investigation, an apparent discrepancywas observed in some cases between four-point-probe resistivity measure-ments and resistivity determinations based on potential profiles. In partic-ular, differences between measurements on thick and thin samples werenoted. In an attempt to resolve this discrepancy, careful four-point-probeand potential-profile measurements were made on four low-resistivity sam-ples, two of which were relatively thick (0. 32 cm) and the other two wererelatively thin (~0. 03 cm). Results are shown in Table III and it is seenthat the two methods yield resistivities that are in excellent agreement forthin specimens. For the thicker samples, four-point-probe values are afactor of 1. 07 larger than their potential-profile counterparts. Upon com-paring four-point-probe readings for thick and thin samples prepared fromthe same ingot, values for FZLD 0. 1 agree exactly. For CZHD 0. 1, thethin-sample value is a factor of 1. 07 larger than that for the thick specimen.In view of the fact that the discrepancies noted are rather small and thatthe two measurement techniques agree for thin samples, we decided toemploy resistivities measured using a four-point probe for all of the thinbulk silicon samples under study. The source of observed differences isunknown at present, but determination of this source was considered un-important for the present investigation.
TABLE III
ResistivityFour-Point Potential
SampleDesignation
CZHD 0. 1/689
CZHD 0. 1/2
FZLD 0. 1/686
FZLD 0. 1/10
Dimensions• cm
0. 60 x 1. 53 x 0. 32
0. 99 x 1. 99 x 0. 030
0. 61 x 1. 54 x 0. 32
1. 0 x 2. 0 x 0. 031
ProbeQ-cm
0. 106
0. 113
0. 108
0. 108
Profilen-cm
0. 099
0. 113"
0. 101
0. Ill
Ratio ofTwo Methods
1. 07
1. 0
1. 07
• 0. 97
3.4
Comparison of resistivity measurements made by four-point-probe and potential-profile methods for thick (0. 32 cm) and thin(~ 0. 03 cm) low-resistivity bulk silicon specimens.
Dislocation Density Determinations
Dislocation densities were determined for the four low resistivity siliconingots using the Sirtl etch method (ASTM Designation F-47-70). A chromicacid etch was employed and two slices from each ingot, designated A and B,
17

were examined. For a given ingot, the positions of slices A and B werechosen such that all other material to be studied (i. e. , material for prep-aration of bulk samples, solar cells, and slices for determination ofoxygen concentration) was situated between them. This approach wasemployed to obtain an indication of variations in dislocation density overthe region under investigation for a particular ingot. Results obtainedare shown in Table IV. Measurements made by Dow Corning are shownfor comparison.
TABLE IV
Dislocation Densities for Four Low Resistivity Silicon Ingots
Dow -,Ingot Corning Dislocation Density (cm )Designation Ingot No. Slice A Slice B Dow Corning
FZHD 0. 1 S73-5277 2. 5 x 1Q4 2. 8 x 1Q4 1. 5 to 3 x 1Q4
FZLD 0. 1 S71-1305 0* (T 0
CZHD 0. 1 S73-5278 3. 9 x 1Q3 2. 9 x 1Q3 3 to 6 x 10³
CZLD 0. 1 S73-5276 0 . 0 0
For FZLD 0. 1, a swirl pattern of etch pits was observed which apparentlyis not associated with the presence of dislocations. See text for discussion.
Ingot FZLD was grown by Dow Corning to be dislocation free. However, weobserved a swirl pattern of etch pits for slices A and B. These swirls cov-ered about 30% of the slice surface, with the remainder of the surface beingfree of etch pits. The local etch pit density in a swirl was ~1. 3 x 10 cm" ,and the average density (entire area) for both slices was ~4 x 10^ cm" .Etch pit patterns such as those noted here have been observed in dislocation-free float-zone silicon by de Kock '' and Ciszek and have been attributedto vacancy clustering at a vacancy-oxygen complex. Thus, the presenceof etch pits does not necessarily indicate the presence of dislocations. Basedon the dislocation density given by Dow Corning for this ingot (Table IV) andon the close correspondence of our observations of etch pits with those ofothers 19-21 on dislocation-free-material, we conclude that ingot FZLDmost likely is free of dislocations.

3. 5 Vacuum Grease Experiments
For the irradiations performed in this study, it was necessary to insure thatbulk samples and solar cells were in good thermal contact with a hekt sinkto prevent unwanted temperature rises during bombardment. As mentionedabove, specimens were attached to a heat sink by using a small amount ofApiezon H vacuum grease. (This approach had previously been employedwith success at JPL for solar cell irradiations). However, the questionarose as to whether the grease could be completely, and readily, removedfrom a sandblasted surface. Additionally, -we wished to determine whetherthis grease would affect the measured steady-state photoconductivity signalby changing the surface electrical and/or optical properties. We performedexperiments which addressed these two questions. The following procedurewas found to quickly, and apparently completely, remove Apiezon H: a samplewith grease on it was dipped for a few seconds in a beaker of trichloroethylenecontained in an ultrasonic cleaner; this treatment was followed by a few sec-onds in acetone, then methyl alcohol, and finally deionized water, all threeof which \vere also in the ultrasonic cleaner. Examination under a micro-scope revealed no grease on the sample surface. To examine the effect ofApiezon H on photoconductivity signal, three 0, 3 mm thick samples weremeasured in the SSPC apparatus both before application of grease and afterapplication of grease and subsequent cleaning of the surface using the aboveprocedure. The average post-cleaning photoconductivity signal was foundto be within a few per cent of the corresponding pre-grease measurement,and we concluded that Apiezon H can be employed to attach specimens to aheat sink without having a detrimental effect on subsequent lifetime measure-ments.
3. 6 Generation Rate Calibration for the SSPC Apparatus
Measurement of steady-state photoconductivity signal AV for a given spec-imen yields excess carrier density An through Equation 2. Lifetime isthen obtained through Equation 3 assuming knowledge of the carrier gen-eration rate g. Absolute determination of diffusion lengths, and thusdamage coefficients, depends on the accuracy to which g is knownfor the SSPC apparatus. A careful series of experiments were performedfor this purpose, and the procedure followed and results obtained arebriefly described in this section.
Thirteen bulk silicon samples, listed in Table V, were employed in thecalibration, all of which were prepared in the usual manner (see Section2 .2 ) . As a first step, photoconductivity decay techniques were used todetermine low-level carrier lifetimes (designated T , in Table V). In-jection ratios at which PCD measurements were made ranged from ~10for low-resistivity samples to ^5 x 10"^ for higher resistivity specimens.In most cases, particularly for CZ 2. 5 samples and FZLD 0. 1 samples,
19

SAMPLEDESIGNATION
CZ 2 .5 /9
CZ 2. 5/10
FZ 2. 5/1
FZ 13/5
FZ 13/6
CZ 2. 5/1
CZ 2. 5/2
FZ 13/3
FZ 13/4
FZLD 0. 1/2
FZLD 0. 1/3
FZHD 0. 1 /2
FZHD 0. 1/3
SSISTIVITYohm-cm
2. 58
2. 54
2. 51
14. 9
12.4
2. 52
2.54
12.8
13.2
00 106
0. 104
0.099
0.099
TSS
jjtsec
3. 59
3. 64
3. 82
3.44
3. 77
3. 71
3. 90
3. 30
3. 34
6. 85
7. 36
5. 44
5.72
pcdp-sec
3.59
3. 58
3.60
3. 75
3.75
3.67
3.66
3. 64
3. 54
6.83
7. 16
5.67.
5.95
ss
pcd
= 1.0
1. 02
1. 06
0. 92
1. 01
1. 01
1. 07
0.91
0.94
1.00
1.03
0.96
0.96
TABLE V
Measured resistivities and effective minority carrier lifetimes forbulk silicon specimens. Resistivity measurements were made usinga four-point probe and lifetimes were measured using both steady-state-photoconductivity (T ) and photoconductivity-decay (T ), , . ss peatechniques.
20

trapping effects were small. In a few cases (particularly for FZ 13), long-time-constant trapping effects -were noted. Because lifetimes were muchshorter than trapping times, a baseline shift occurred in the photoconductivitydecay; recombination time constants were readily extracted from observedsignals of this type.
PCD lifetime measurements for CZ 2. 5 were judged to be the most accurateand we thus employed one of these samples (CZ 2. 5/9) as a standard fordetermining g. Steady- state measurements were then made in the SSPCapparatus at a constant chopped light intensity under a traps -filled condition(achieved with the aid of background lamps-- see Section 3. 7). A measure-ment of An was made for the standard sample, and generation rate wasdetermined through the relation
g = A n / T . (13)
The quantity An was also measured for the other samples using SSPC, andsteady-state lifetime, TS S , then determined using the value of g obtainedfrom the standard specimen. (Injection ratios due to chopped light in thesteady- state measurements ranged from 1 to 3 x 10 for low resistivity sam-ples and from 1 to 5 x 10" for higher resistivity specimens. ) The ratio of steady-state lifetime obtained in this fashion to T , is listed in Table V for eachsample and it is seen that all values lie close to the ideal ratio of unity.With the exception of samples FZ 13/3 and FZ 13/5, all ratios are within7% of 1.0. Note that the quantity T /Jr)Cd was determined for a resistivityrange covering more than two orders 01 magnitude. The favorable resultsobtained suggest that our measurements of AV, V and p are quite accurateover the range studied and also that the assumed mobility values are con-sistent with measured resistivities.
The steady- state lifetime measurements listed in Table V were made at ageneration rate (due to chopped light) of 1. 5 x 10^ pairs /cm -sec, aswere all other SSPC lifetime measurements in this investigation. With thepresent experimental set-up, the highest generation rate that can be achievedis a factor of 'V2. 5 larger than this quantity.
In calibrating the SSPC apparatus in terms of generation rate, it was neces-sary to exercise extreme care in the relative placement of all parts of thesystem (sample, filters, light source, etc. ). In particular, a considerableamount of time was spent in constructing a sample holder that would allowrepeatable and reliable placement of a specimen with respect to the filtersand the chopped light source. A slight rotational placement error, forexample, results in an appreciable change in generation rate. Additionally,calibration of the SSPC apparatus was periodically checked with a set ofunirradiated samples to ensure that g remained invariant during the courseof the investigation.
21

It was considered desirable to check the calibration of the SSPC apparatusagainst an independent measurement method. Diffusion-length determinationsby the steady-state surface photovoltage method were made on several sam-ples, and results of the SSPC--SPV comparison are discussed in Section 4.4.
3. 7 Trapping Effects
Measurements of relative lifetime versus injected-carrier density were madeon representative bulk silicon samples with sandblasted surfaces upon receiptfrom Centralab (prior to the generation-rate calibration) to determine whethersteady-state photoconductivity measurements were affected by minority-carriertrapping. The shape of lifetime-versus-excess-density curves at low injectionlevels reveals whether trapping is important. ' The SSPC apparatus wasemployed for these measurements in the following way. Excess density An,due to chopped-light illumination, was determined in the usual manner (Section2.1). We can express An as
An = gT = g ' l T , (14)
•where g is a generation constant and I is illumination intensity. A signalproportional to I was measured using a silicon photodiode (refer to Figure1), and relative lifetime then determined by dividing An by this signal.
Rather strong trapping effects were observed for all four low-resistivityingots. Trapping was also noted for 2. 5 and 13 ohm-cm samples.* Theseresults, particularly for 0. 1 ohm-cm material, were surprising to us andwere not expected based on our previous observations. We have generallyobserved in the past that trapping effects become less important as resis-tivity decreases. Additionally, relatively thick Northrop-fabricated 2. 5ohm-cm samples with sandblasted surfaces had been observed earlier toexhibit relatively slight trapping. This observation suggested that thenoted trapping effects were associated with surface properties.
A few experiments were performed for the purpose of attaining insight intothe nature of the observed trapping effects. Figure 4 shows measured rel-ative lifetime versus excess carrier density for sample FZHD 0. 1/1 underthree conditions: a) original (as received from Centralab); b) after etchingthe surfaces with CP-4; c) after sandblasting the etched surfaces. Dataare-normalized to unity relative lifetime at an injected-carrier density of3 x 10 cm" for convenience of comparison. It is seen that etching en-hanced trapping whereas a subsequent sandblasting diminished trappingeffects compared to the original sample. The same experiment was per-formed for a 2. 5 ohm-cm sample and a similar result was obtained. Thereare at least two relevant statements that can be made based on these findings:a) Observed trapping effects are surface related since changing surface prop-erties changes trapping behavior; b) Results obtained following sandblasting
*The observation of relatively strong trapping effects in SSPC measurementsas compared to PCD can be explained plausibly in terms of significantlyfewer filled traps in the transient measurement case.
22

O LU LU CO
<O D
O
O <
<
O <p
D
D
n
.'o
CO
I
CM
b
Eo
CO
00CO
X
CO CM
3WI13JH
Figure 4. Relative lifetime vs excess carrier density for a 0. 1 ohm-cm FZ Si sample after various surface treatments. (The"original" case refers to a Centralab-fabricated sample. )
23

(after etching) are consistent with findings on Northrop-fabricated sand-blasted samples in which trapping effects were observed to be considerablyless important than for Centralab samples. Regarding the latter statement,an experiment was performed on sample CZLD 0. 1/1 in which lifetimeversus excess density curves were obtained before and after a Northropsandblasting (no etching). Results are shown in Figure 5 and it is seenthat Northrop sandblasting did not alter the amount of trapping but merelydecreased the amount of light absorbed in this Centralab-fabricated sampleby about a factor of two due to reflectivity changes.
The experiments described above aimed at determining the nature and originof observed trapping effects are obviously incomplete. Further study wasbeyond the scope of the present work (particularly in view of the successfuluse of non-penetrating light to fill traps in Centralab-fabricated samplesas described below). One might argue that all samples could be etchedand then sandblasted to reduce trapping. However, it would be very dif-ficult to control such processing so that surface optical properties hadthe required sample-to-sample uniformity that is necessary in makingaccurate measurements of lifetime using the SSPC apparatus. It is quitelikely that Centralab-fabricated samples have the required uniformityalthough they also have the trapping problem. We decided to employ un-modified Centralab bulk Si samples (in conjunction with non-penetratinglight) to measure lifetimes and subsequently obtain damage coefficients.
A common approach to separating trapping and recombination is to employa background (unchopped) light to keep the traps filled which then permitsobservation of steady-state photoconductivity signals that are not influencedby trapping. As traps are filled by an increasingly intense backgroundlight, the observed signal will decrease until a saturation is reached whichcorresponds to the low-injection-level value of carrier lifetime. Furtherincreases of background lamp intensity beyond this saturation point willnot result in further changes in the photoconductivity signal. (Eventually,at excess densities higher than under consideration here, lifetime willbecome injection-level dependent and the above statement will no longerhold. ) Our first approach to filling traps was to employ penetrating back-ground illumination (i. e. , unchopped filtered light). However, it wasfound that at the highest available background lamp intensity all the trapswere not yet filled. With an increasingly intense lamp, there is the problemof heating the Si filter. Bandgap changes with temperature will alter thespectrum of transmitted light, which is an undesirable effect. . Assumingthat observed trapping was surface related, then the utilization of non-penetrating light to fill surface traps is appropriate. It was decided thathon-penetrating light was probably the best solution to the trapping problem,and to implement this approach several small lamps were installed nearthe sample holder in the SSPC apparatus (see Figure 1). Light fromthese lamps does not pass through the Si filter and is thus highly absorbed
24

CO
CO•— Q
LU
^ QCO 2|
COCOLUOXLU
Q O LU
M CC tO O <
< O
CO
1Eo
O IO ^ CO CN
3WI13JI1 3AliV13y
Figure 5. Relative lifetime vs. excess carrier density for a 0. 1 ohm-cm CZ Si sample before and after Northrop sandblasting.(The "original" case refers to a Centralab-fabricated sample. )
25

near the surface of a bulk Si sample. The placement of the backgroundlamps •was such that uniform illumination of the front and rear surfacesof a given sample resulted.
Steady-state photoconductivity measurements were then made for one un-irradiated sample of each type to determine whether the background lampscould fill traps completely. For all samples examined, a saturation con-dition was reached in which further increases in background (unchopped)lamp intensity did not cause a change in the chopped-light signal. Thisexperiment demonstrated that nonpenetrating light can be used to separatetrapping and recombination, thus permitting measurement of pre-irradiationlifetime for all specimens.
In the course of examining background light effects, it was observed thatthe lamp intensities required to completely fill traps resulted in sampleheating. Heating occurred rather slowly (~1° per min for the first fewminutes), and we therefore adopted the approach of performing photo-conductivity measurements in a time ^ 1 min after the background lampswere turned on. Taking data in this manner presented no problem andallowed the undesirable effects of a sample temperature rise to be avoided.
Upon discovering the unexpectedly strong trapping effects for bulk samples,it became apparent to us that even if trapping and recombination could beseparated before irradiation using an appropriate background lamp, thiswould possibly be difficult to accomplish after irradiation. This situationwould not arise, however, if the following reasoning holds. If it is as-sumed that the traps in question are located at the surface, that the sur-face recombination velocity is infinite, and that any increase in surfacetrap concentration due to irradiation is negligible compared to that alreadypresent, then the lamp intensity required to fill surface traps will be in-variant with irradiation. This will be true since the lifetime at the surfaceis assumed to be zero and thus that portion of the excess carrier densityat the surface that is available for filling traps will not be affected by ir-radiation (surface lifetime cannot experience a further decrease). If theabove model is not an accurate description of the physical situation forthe samples in question, then it is possible that an increasingly intensebackground lamp -would be required following irradiation to fill traps.This situation would occur if the fraction of injected carriers availablefor trapping at a given lamp intensity decreases as bulk lifetime decreasesdue to irradiation. In this case, one quickly reaches experimentallimitations imposed by the choice of an appropriate background lamp.
To assess our ability following irradiation to separate recombination andtrapping using background lamps, a trial 1. 0-MeV electron irradiationwas performed to a fluence of 3 x 10^ electrons/cm . A.careful post-irradiation examination of bulk silicon specimens revealed that with the
26 .

background-lamp set-up described above all traps could be filled, eventhough lifetimes were significantly degraded, thus permitting measure-ment of post-irradiation lifetime. Somewhat more intense illuminationwas required to fill traps compared to the pre-irradiation situation. Itnow appeared that we could separate trapping and recombination and ac-curately measure lifetimes in irradiated bulk samples. (As discussed inSection 4. 0, for certain cases in subsequent irradiations measured diffusionlengths appeared to saturate at high fluences, and this behavior is attributedto radiation-induced trapping effects. )
3. 8 Surface Recombination--Experimental Considerations
The employment of a high surface recombination velocity as a boundarycondition for bulk silicon specimens was selected on the basis of repro-ducibility and stability of surface properties. Although techniques forproducing low-s surfaces exist, it -was felt that a considerable technicaleffort would have been necessary to ensure that a.selected technique wouldrepeatably produce surfaces with a very low surface recombination velocitythat did not vary with time. On the other hand, sandblasting is known toproduce high-s surfaces and, as shown in Section 3. 1, s can vary from~10 cm/sec to infinity without significantly affecting measured photocon-ductivity signal. In this section, we describe a few preliminary experi-
.ments relating to surface recombination effects and also discuss consid-erations regarding the s-value employed for Centralab-fabricated bulksamples.
3. 8. 1 Simulation of Zero and Infinite Surface Recombination Velocitywith a Diffused Sample
During the course of deciding on an appropriate boundary condition for bulksamples, an approach was suggested by NASA-Lewis personnel which, inprinciple, would allow one to achieve a condition of either s = 0 or s = <*>on the same sample. Figure 6 shows a schematic representation of such aspecimen. The diffused region between the ohmic contacts wraps aroundto the other side of the specimen and covers most of the non-contactedsurface area. The sample is assumed to be prepared from p-type startingmaterial with an n+ diffusion. With lead A grounded, minority carrierscreated in the p-type material by illumination will be collected at the n+-pjunction if they are -within a diffusion length of it. Since the junction actsas a minority-carrier sink, a condition of s = °° is simulated. With leadA open-circuited, a condition of s = 0 is simulated.
The above approach was experimentally examined using the SSPC apparatus.Centralab fabricated five n-on-p samples for us with the geometry shownin Figure 6. They utilized 10 ohm-cm p-type material for these specimens.Measurement of the steady-state photoconductivity signal was made with
27

2 cm
2 cm
OHM 1C CONTACT
DIFFUSEDREGION
OHMIC CONTACT
+vo
CONTACT TODIFFUSED REGIONoA
Figure 6. Schematic representation of a diffused sample usedto simulate conditions of s = 0 and s = ».
28
the diffused region open-circuited and with this region grounded for allfive units. The following open-circuit-to-grounded photoconductivity-signal ratios were obtained for samples 1 through 5 respectively: 5. 4,3. 0, 1. 1, 3. 1, and 2. 1.' The larger open-circuit signal observed is con-sistent with the expectation of a low surface recombination velocity forsuch a configuration.
Considering the result for sample #1, Figure 3 reveals that a value forT
e f f /T of 0. 19 ( = 1/5. 4) occurs for a bulk diffusion length of ~190 p,m(using the s = 0 and s = <=° curves). For 10 ohm-cm p-type material, apre-irradiation diffusion length of 190 (j,m is reasonable for a solar cell,which suggests that the sample structure employed can be effectivelyutilized to simulate conditions of s = 0 and s = », However, it is obviousthat additional study, both experimental and analytical, would be neces-sary before one could have confidence in such an approach to steady-statelifetime measurements on thin samples. In particular, a detailed analysisof the open-circuit condition is needed to demonstrate how closely a .zerosurface recombination velocity is approximated. We conclude that thediffused-sample approach to simulating conditions of s = 0 and s = °° ap-pears promising, but additional work would be required to raise our levelof understanding of this method to the point where it could be confidentlyemployed in steady-state lifetime measurements.
3. 8. 2 Measurement of the Thickness Dependence of Lifetime for aSandblasted Bulk Sample
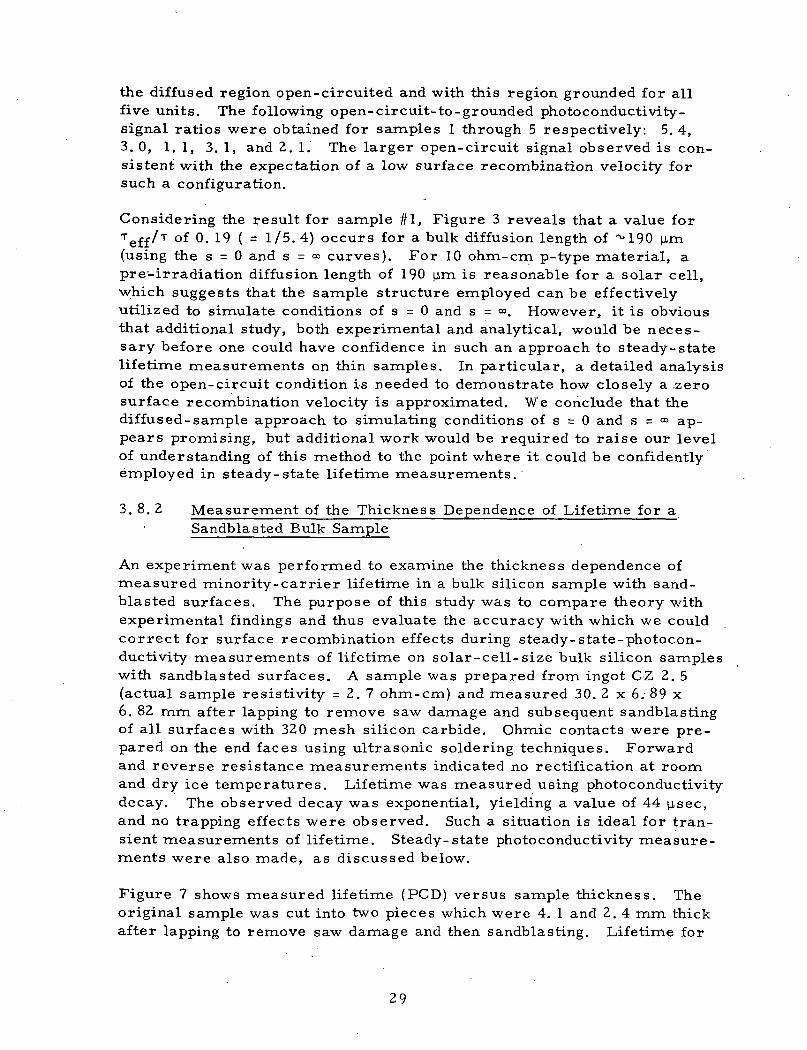
An experiment was performed to examine the thickness dependence ofmeasured minority-carrier lifetime in a bulk silicon sample with sand-blasted surfaces. The purpose of this study was to compare theory withexperimental findings and thus evaluate the accuracy with which we couldcorrect for surface recombination effects during steady-state-photocon-ductivity measurements of lifetime on solar-cell-size bulk silicon sampleswith sandblasted surfaces. A sample was prepared from ingot CZ 2. 5(actual sample resistivity - 2 . 7 ohm-cm) and measured 30. 2 x 6. 89 x6. 82 mm after lapping to remove saw damage and subsequent sandblastingof all surfaces with 320 mesh silicon carbide. Ohmic contacts were pre-pared on the end faces using ultrasonic soldering techniques. Forwardand reverse resistance measurements indicated no rectification at roomand dry ice temperatures. Lifetime was measured using photoconductivitydecay. The observed decay was exponential, yielding a value of 44 |j,sec,and no trapping effects were observed. Such a situation is ideal for tran-sient measurements of lifetime. Steady-state photoconductivity measure-ments were also made, as discussed below.
Figure 7 shows measured lifetime (PCD) versus sample thickness. Theoriginal sample was cut into two pieces which were 4. 1 and 2. 4 mm thickafter lapping to remove saw damage and then sandblasting. Lifetime for
29

1 1 1
EE'
i ^- vi oo" . o*Nl xO fV
00
o -oX
CM•
oCO
— 1LU <
CL rr^5E __
co O
- P O C
0 \ \<*> \ \CO \ »
§ 0 \ \ 'coco ^ \ /S— O Q v^ \ \CO r- 5 CNX \ \
" i I' " w \ \H ^ uo ° co X v__ oo -3- ^ ^\2 i i y _ \< o ^r \
- ! , CM^
1 1 II II1 1 0 K
1 i 1
D 0 0 0O »O ^ CO
1 1
—
CS OQuju. -
0 d« Oo -
—
—
XX.
-
X^
^""-- ^<L"~^"~-^ O
1 I *^*- —
0 O CCN —
O
00
O
10
EE
ooCO
CO «J-»
CN
<CO
pasrl) 3WI13JHFigure 7. Measured lifetime (PCD) versus sample thickness for a 2.1
ohm-cm boron-doped silicon sample. Shown for comparisonare analytical results for two values of surface recombinationvelocity using a one-dimensional model.
30

sample A (4. 1 mm) was measured on two consecutive days to check re-peatability. A slight difference was observed (^6%) which probably re-flects experimental error or possibly a small temperature difference.To obtain samples C and D, sample B was cut into two equal-thicknesspieces. As shown in Figure 7, measured lifetimes for these samplesare in reasonable agreement. To obtain sample E, sample C was lappeddown to half its original thickness and then sandblasted. Sample F wasobtained by lapping sample E. Following lapping and a light sandblastingof the surfaces, the sample thickness was 0. 31 mm, which is nearly thesame as the thickness of bulk samples prepared by Centralab and utilizedhere for damage coefficient determinations. To examine for possiblechanges in effective lifetime due to changes in surface properties withtime, lifetime measurements were repeated five weeks later for severalsamples (A, D, and E). Within a few per cent, lifetime was found to beinvariant over this time period.
For purposes of analysis, Equation 6 was employed. Because this ex-pression is one-dimensional (i. e. , assumes two of the sample dimensionsare large compared to the third), it does not apply for large sample thick-nesses, and this point should be kept in mind when comparing experimentaland,analytical results (Figure 7). A value for electron mobility of 1150cm /V-sec was assumed, yielding a D value of 29. 8 cm /sec. For bulklifetime T, the value measured for the original sample (44 (j,sec) was em-ployed, resulting in a bulk diffusion length of 362 |im. Effective lifetimewas calculated as a function of sample thickness for two values of surfacerecombination velocity, and results are shown in Figure 7. For s = °° ,agreement with experiment is good for 0. 31, 0. 5, 1, and 2. 4 mm specimens.For the thicker samples, Equation 6 is not applicable. Note that the mea-sured lifetime at 0. 31 mm is only 6% of that for the original sample, andfor s = <= the theory predicts a value for effective lifetime that is in ex-cellent agreement. For s = 10 cm/sec, however, the predicted value at0. 31 mm is a factor of "°5 too large. The assumed bulk value of 44 |j,seccould possibly be too small due to surface effects even on the largestsample. However, a larger value of T would result in an even greaterdiscrepancy between theory and experiment for s = 10 cm/sec. Con-sideration of experimental results and analysis leads us to conclude thatthe surface recombination velocity for a sandblasted surface is indeedlarge, as expected, and that measurements agree closely enough withtheory to allow a reasonably accurate correction for surface recombinationeffects in the present investigation.
Steady-state photoconductivity measurements were also made versussample thickness using the SSPC apparatus. For these measurements,the thickness of the Si filter was 2. 5 mm. Since this filter thickness is< the sample thickness for the original sample and for samples A and B,a nonuniform excess carrier density results in these samples, which
31

complicates data interpretation. Therefore, measurements on relativelythin samples (C through F) are more readily interpretable. Upon compar-ing [relative T(! mm)/relative T (0. 5 mm)] for steady-state measurementswith the corresponding absolute quantity for transient data (Figure 7), rea-sonable agreement (within ~15%) was found. Once again, the indication isthat the experimental situation is understood well enough to be able to applythe theory directly in accounting for the effects of surface recombination.
3. 8. 3 Surface Recombination Velocity for Bulk Specimens
As discussed in Section 3. 1, Equation 10 was employed to correct measuredeffective lifetimes for the effects of surface recombination. An iterativeprocedure was utilized with this equation to obtain actual bulk diffusionlength. As a starting point, we assumed s = °° and then substituted variousvalues of L into Equation 10. This procedure did not work for any of theCentralab-fabricated bulk samples; no finite value of L would yield a valuefor T ,, as large as those measured, assuming infinite s. This result sug-gested that s was actually less than infinite for Centralab-fabricated sam-ples. As discussed above, measurements of lifetime versus sample thick-ness for a CZ 2. 5 specimen with Northrop-sandblasted surfaces were made,and excellent agreement was found between analysis and experiment wheninfinite s was assumed. This finding strongly indicated that the Northropsurface treatment results in an infinite surface recombination velocity.Centralab also sandblasted sample surfaces after preparation, but subse-quently it became apparent that there were differences between the surfaceoptical properties of Northrop-sandblasted samples and Centralab samples.At a given light intensity, measured excess carrier density was significantlylarger in the Centralab case, indicating more energy absorption in the sam-ple bulk. This observation is also consistent with less recombination ofexcess carriers at the surface for Centralab samples (fewer surface re-combination centers) and thus a smaller s. More concrete evidence for asmaller s was sought, along with an appropriate method for determining sfor Centralab samples. The procedure followed is now described.
Samples from three higher-resistivity Northrop-supplied ingots were alsofabricated by Centralab (FZ 2. 5, CZ 2. 5, and FZ 13). For these ingots,we had on hand accurate (negligible trapping effects) PCD lifetime mea-surements for large bulk samples where surface effects can be neglected.For FZ 2. 5 and FZ 13, we had fabricated a large number of bulk sampleson another program three years ago and then measured pre-irradiationvalues of T. These existing data were used to obtain an average bulk life-time for each of the two ingots under consideration. Next, all measuredpre-irradiation values of T ,.,. for each of these ingots were averaged, aswere sample thicknesses, resistivities, and assumed mobilities. Thisprocedure thus yielded.average values for the following quantities for eachof two ingots based on a rather large number of samples: T , T (and
32

hence L), T, and D. Next, these average values were employed in Equation10 and the value of s that would then satisfy the equation was then determined.For FZ 2. 5 and FZ 13, we obtained s = 8. 3 x 103 cm/s.ec and s = 8. 0 x 103
cm/sec, respectively. The same procedure was followed for ingot CZ 2. 5except that only one bulk lifetime value was available ( T = 44 p,sec). Usingaverage values for T ,.,., T, and D along with this value of T, a value ofs = 8. 5 x 10 cm/sec resulted. The evidence thus strongly indicated thatthe surface recombination velocity for Centralab-fabricated samples isslightly less than 104 cm/sec. Referring to Figure 3, it is seen that thedifference between analytical results for s = 10 and s = °° is relativelysmall. However, in attempting to correct values of T ., for the effects ofsurface recombination in the present investigation, one cannot employs = 0° for Centralab samples. Based on the above results, a value of s =8. 3 x 10 cm/sec was assumed for all bulk silicon samples under study,and T was determined using Equation 10 in the manner described above.As discussed above, in terms of obtaining K,. it is not necessary to per-form a correction for surface effects. This correction is obviously neces-sary, however, if one wishes to determine actual pre-irradiation lifetimesand diffusion lengths.
3. 9 Determination of Oxygen Concentration
An attempt was made to determine oxygen concentration in the four 0. 1ohm-cm silicon ingots employed in this investigation by using the infraredabsorption method (ASTM Designation F-121-70 T). To perform this mea-surement for FZ material, a specimen with negligible oxygen concentrationis required as a reference. A piece of oxygen-free material was suppliedto us by Dow Corning and this piece, along with four low-resistivity slices(one per ingot) were mechanically polished according to specified ASTMprocedures. For comparison, a slice from ingot CZ 2. 5 was also pre-pared for determination of oxygen content. Initial measurements weremade using Beckman IR-4 and IR-20A spectrophotometers. Subsequently,a Beckman Model 4250 IR spectrophotometer was employed.
Measurements at room temperature on CZ 2. 5 revealed the expected ab-sorption peak at 9 |J.m due to oxygen. However, in room temperature mea-surements on all four low-resistivity slices no transmission was observablefor wavelengths ^5 um, thus preventing the observation of 9-|Ji.m absorption.Comparison of these negative results with the findings for CZ 2. 5 suggeststhat the problem with measurements on 0. 1 ohm-cm material is lack oftransmission due to free carrier absorption. According to ASTM Desig-nation F-121-70 T, free carrier absorption should not be a problem forresistivities greater than 0. 01 ohm-cm in the method being employed.We also made measurements on low-resistivity Czochralski material atliquid nitrogen temperature for the purpose of freezing out majority car-riers and thus decreasing free carrier absorption. Per cent transmission
33

increased at wavelengths considerably less than 9 M-m> but once again notransmission was observed at 9 |j,m. Other workers have also been unableto observe transmission through 0. 1 ohm-cm silicon slices and were thusunsuccessful in determining oxygen content. ^
It was subsequently learned that the ASTM statement regarding applica-bility of the method for resistivities sQ. 01 ohm-cm is in error and shouldactually be SO. 1 ohm-cm. Measurements on 0. 1 ohm-cm Czochralskimaterial are quite difficult and apparently are not possible on float-zonematerial of that resistivity. To make measurements on Czochralski ma-terial, one apparently must violate ASTM procedures and make the testspecimen thin enough (^0. 5 mm) to permit transmission. Additionally,the slit on the spectrophotometer should be opened as wide as permissible,given the 32 cm"* room temperature line width, scale expansion should beemployed, and a. slow scan should be performed.
The above approach was employed to measure the oxygen concentration ina thin (0. 35 mm) polished CZHD 0. 1 slice using a Beckman Model 4250dual-beam spectrophotometer. Transmission was observed at 9 nm» 3-ndthe oxygen absorption was a small perturbation on the free carrier absorptionof about 50 cm~l. The observed absorption coefficient of 0. 9 cm , cor-rected for lattice band absorption, corresponds to an oxygen concentrationof about 4 x 10^7 cm" . The observed linewidth exceeded the expected32 cm by 40%, however, so that the observed peak absorption is an under-estimate in view of the excessive slitwidth having been employed.
3. 10 Pre -irradiation Properties of Bulk Samples and Solar Cells
Table VI lists bulk silicon samples employed in the present investigation.Shown are resistivities and pre-irradiation values for effective lifetime,actual lifetime, and actual diffusion length. Also listed are irradiatingparticle energies for each sample and additional information regardingspecial conditions for certain specimens. As indicated, post-irradiationannealing studies were performed for selected samples at either roomtemperature (RT) or 60°C. Additionally, two samples were irradiatedin the dark with 10-MeV protons to examine the effect of illumination on
Table VII lists pre-irradiation properties of solar cells obtained using asolar simulator. Cells with the designation "dose monitor" were irradiatedfor the purpose of obtaining a rough check on fluences received by comparingcell degradation with that expected based on previous findings (such as Ref-erence 11). For the cells listed in Table VII, solar- simulator current-voltage characteristics were obtained following each bombardment, anddata are presented in Section 4. 0. Also in that section are results ofdiffusion length measurements (using a Co-60 source) for these cells andother units.
34

Pre-Irradiation
SampleDesignation
FZLD 0. 1/14568
10111213141516171819202122
FZHD 0. 1/45678
111213141516171819202122232425
Resistivityohm-crn
0. 1060. 1100. 1050. 1050. 1080. 1080. 1090. 1080. 1050. 1070. 1090. 1050. 1050. 1070. 1100. 1050. 1070. 105
0. 1000. 0950. 0970.0960. 0990. 0990. 0960. 0930. 0960. 0970. 0990. 0960. 0950.0960. 0940. 0950. 0950. 0940. 0940. 097
TeffM,sec
7.217. 097.557. 547. 227.087.267.497.607.436.717.257. 127. 386. 907. 306. 967.56
5.696. 035.975. 935.875.995. 936. 376. 145. 735.925. 855. 996.246. 026. 036. 176. 106. 085. 73
•T
(j,sec
37. 125. 546. 537. 127.034.227. 534.252.936.222. 740.630. 541. 524. 042.433. 554. 3
15. 319. 120. 020.418. 720. 720.425. 921.917. 719.618. 521. 023. 021.420. 722.222. 321.218. 3
TABLE VI
IrradiatingParticle
Energy, MeV
0. 5II
11
1. 0
2. 5
nn
10nnnn
100. 5
1. 0n
101. 0
11
2. 5
10
Comments /SpecialCondition
RT anneal
RT anneal60°C anneal
RT anneal
RT anneal60°C anneal
2011672252011721931731-93240199157210182213162215191243
129146148149143149149168155139146142151158153150156156152141
Pre-irradiation lifetimes and diffusion lengths for bulk silicon specimens ofvarious resistivities.
RT anneal
RT anneal60°C annealunilluminated
RT anneal
RT anneal60°C anneal
35

SampleDesignation
Resistivityohm-cm
CZLD 0. 1/35678910111213141516171819222324
CZHD 0. 1/156789101112131415161718192021
117112111113110112111114116114110113115115114112113112
0. Ill
112108111109108105109103108109109112112111112109108
0. 112
Pre- Irradiation
T
effusec
1.451.621.461.522. 001.66I.. 741. 761. 601. 781. 861.651.681. 821. 831.661. 731.681. 51
2. 382. 332. 202. 042.452. 752. 182.492. 742. 382.012. 042. 082. 002.042.452. 482. 02
'T
|j,sec
1. 842. 151. 891. 982. 762. 162. 302. 342. 102. 362. 542. 172. 192.422.482. 212. 302.211.96
3. 533. 593.252. 983. 854. 743.264. 004. 633. 632. 902.933. 002. 882. 903. 744. 062. 90
L
jj,m
44. 748.445.446.554.848. 550.050. 547.850. 752.648.648.851.352.049.050.049.046.2
62.062. 559.557.064.871.859.666.071.062.856.256. 557.256. 056.263.866. 556.3
IrradiatingParticle
Energy, MeV
0. 5-
it
101. 0
n
2. 5nnn
10
0. 5nnn
1. 0
n
2. 5nnn
10nn
Comments /SpecialCondition
RT anneal
RT anneal60°C anneal
RT anneal
RT anneal60°C anneal
RT anneal
RT anneal60°C anneal
RT anneal
RT anneal60°C anneal
TABLE VI (continued)
36

Pre-Irradiation
SampleDesignation
FZ 2
CZ 2
CZ
FZ
.5/2456789
1011
.5 /34578
1112131516
6/123456
13/2789
101113141518
Resistivityohm -cm
2. 572. 562.432.342.472. 502. 602.432.46
2. 572. 542. 572. 602. 532.392. 382.412.452. 53
6.495.575. 905.936.635.93
13.515.413.712.612.513.613.412.612.712. 3
Teff
usec
3.633. 703. 954. 163. 773. 973.823. 554. 01
3. 773.913. 783. 953.764. 304. 554. 164. 004. 04
3. 984. 304. 353.293.694.46
3.653.923.473.763. 553. 643.693.783.763. 82
T
u,sec
25. 142.673.2140 .38.272. 146. 148.687. 7
24.630.426.337. 124. 540.463. 111686. 199.6
11.414.415. 57.279.32
16.9
48.611729.556.848.687.313112655.5 .119
L
Um
288375485670353485390407535
285315295350283360450610530570
198226234157177239
411638320440407551675655435630
IrradiatingParticle
Energy, MeV
0. 5n
1. 0n
2. 5"
10nn
0. 5n
1. 0n
2. 510"
2. 510n
0. 51. 02. 510""
0. 5"
1. 0"
10I I
2. 5"
10n
Comments/SpecialCondition
_
----_
---
__
'-- •---
-
_
---
unilluminate d-
_
---------
TABLE VI (continued)
37

Pre-Irradiation
Solar CellDesignation
FZLD 0.
FZHD 0.
CZLD 0.
CZHD 0.
CZ 2.
CZ
CZ 2.
1/SC2
4
I/SCI
2
1/SC2
3
1/SC2
3
5/SC2
3
9/SC2
3
4
5/SC4
Isc
mA
65. 0
64. 5
61.2
62. 5 "
53. 7
54.2
58. 5
58.2
65.4
66. 5
144
145
145
67.2
Voc
mV
617
615
612
613
605
600
605
605
578
578
548
550
550
578
PmaxmW
28.8
28. 0
. 2 7 . 5
28.4
23. 3
22. 0
24. 9
25. 5
27.6
28. 1
57.2
57. 5
57.2
28. 5
IrradiatingParticle
Energy, MeV
1.0
10
1.0 4
10
1. 0
10
1.0 :
10 ',
1. 0 '<
10
0. 5
1. 0
2. 5
10
Comments
1 cmx 2 cm
i t
i i
i i
i i
i i
i i
1 1
i i
i i
2 cmx 2 cm(dose monitor)
M
I I
1 cmx2 cm)
TABLE VII
(dose monitor)
Pre-irradiation electrical properties of n-on-p silicon solar cells of variousbase resistivities (AMO, 140 mW/cm2, ~27°C).
38

SECTION 4.0
RESULTS
In this section, experimental results of this investigation are presented.Included are data showing the degradation of diffusion length for electron-and proton-irradiated bulk samples and solar cells of various resistivities.Damage coefficients are determined as a function of resistivity and deviceand bulk behavior are compared. Results of annealing studies on irradiatedbulk specimens are given. Degradation with irradiation of solar cell param-eters obtained using a solar simulator is presented. A comparison is madeof data obtained using both steady-state photoconductivity and steady-statesurface photovoltage methods.
4. 1 Results of Electron Irradiations
Tables VIII through X list diffusion length as a function of fluence for bulksilicon samples irradiated with 0. 5-, 1. 0-, and 2. 5-MeV electrons, re-spectively. For the purpose of determining damage coefficients the quantityCL - L ~ ) was plotted versus fluence, and a unity slope fit to data on alog-log plot yields a value for K., (refer to Equation 1).
4. 1. 1 0. 5-MeV Electrons
Figure 8 presents data for 0. 5-MeV electron-irradiated specimens of variousresistivities. With the exception of data for CZ 6/1 and CZ 9/SC2, all datapoints shown are averages for samples of a given type (refer to Table^VIII).Unity-slope lines fit most of the data, with a few exceptions. Data forCZLD 0. 1 and CZHD 0. 1 at the lowest fluence appear to be inaccurate, whichis probably attributable to experimental error since only a very slight de-gradation in L occurred at this fluence. At the highest fluences, a saturationis beginning to occur for CZLD 0. 1 and CZHD 0. 1. (This effect was moremarkedly observed at higher energies, and these findings are discussedbelow. ) Data for FZ 13 cannot be fit with a line of unity slope. The reasonfor this is unknown, but is possibly attributable to experimental errors as-sociated with the relatively small amount of damage introduced or to an errorin measured L_. To obtain KT for FZ 13 samples, values of (L~^ - LQ"^)at the highest fluence were employed since these values are the least affectedby errors in L-. For other resistivities, KT corresponds to the dashed-line fits in Figure 8.
Figure 9 presents K-r vs resistivity for 0. 5-MeV electron-irradiated speci-mens. It is seen that the bulk data fall into two groups and both can be fitwith a line of slope equal to -0. 67. The fit for CZLD 0. 1, CZHD 0. 1, andCZ 6 yields values of K-r that are larger by a factor of ~ 3 than those obtainedfrom the fit for FZLD 0. 1, FZHD 0. 1, FZ 2. 5, CZ 2. 5, and FZ 13 if com-
39

int-Ho»-H
XCO
mt-H
Oi-H
i-H
O
XCO
<*i"
o
xi— i
oo
(J
cuCOi-H
oi-H
XCO
a0
•<-<
rt•i-iT)at
•H
CU
ft
CU
"a*finito
6-^NOi -HOO OOO'Nl* O C O O ON
r i . . . i . . . i .
o o o o o o o o o o o o o o o o o o oo
gzi
co o •NP •— i o -Nf [N- oo oo oooI I I
CO N£> NO CO t~- NO 00 00 r- OOO^^^ ^ ^ ^ o o o o o o o o c o
gL O v O O O (M 00 O CO 0s i— i CO ^
1 1
vD ^^ £**"" O** CO LO C^J vO ^J^ vO CO 0s*t— t- Is- Is- r- r*- r«- c o c o c o coco
|^^ Ufl ^^ vO tO
fV^ l_f^ -ylj vO vO ^S.1 f~5 (Y)
•— i i— i oo oo o « - H i — i o ' oo >-H •— i ooo
8w^ oo ^H oo oo m oo
rO /vl LO vl x.O t * i *vi
\o ^o r*- vO cvi co co co fvj 0s "^f ^^ ^o i-n
sr^ ^^ ^^ in co m
co NO oo co ^^ ^* f t* ^^ oo m NO oo ooPsj i~H OO OO i-H I~H i"H i-H f* ~ f * " NO NO
I-H "^ m NO m NO Is* oo co in NO Is* ' t— ' m**. " N^ " . * «^
i-H i-H i-H i-H
o' o' o' o'P P P PJ ffi J ffiN N N N[=4 k U U
o
oo
NO
oooo
i-H
00CO
in
oo
0
oo
m
om-
NO
ON>
^foo
oON
00
mIN.CO
o
Is-
NO
oo
ot -.m
t^-
ON o oo oo Is- in >— i. * . • • » •
CO in i-H ON t\l ON i-H
oo oo Is- Is- NO oo mi-H i-H
CONO t^ OO OO • ' — ' ON(NJ CO I-H po CO NO 00i-H i-H i— 1 i— 1 ON i-H i-H
ON OJ CO NO ^ NO ON00 CO 00 ON CO i-H Tf•— i r>o t-H •-< F-H ro oo
^ oo r — oo oo o mNO ON ^ 00 CN- NO CD
CO CO OO O CO ON O
ON NO OO i-H ON C^ CO
co m m in oo •— ' oooo r- oo •— i o I-H coOO CO OO CO i-H -Nf NO
(NJ ^ CO •%}* i-H OO Is"* * ""-" *"*••-m m NO co
•— iN °° tsl N
S N ° ^h U
CU
g•HOCUPiCO
0U
'i— 1"rl\co
^
CU
"rt•I-I13rtJ-i
•rt1
ao
oCU
I— 1CU
CU
r-l ,
H mo'
W ^J t2w3 ^^ oH C
aSH0
fiO
• H-j *
O
rtCOni
boa'(U
fioCO
«2mP
40

inF"H
o*~~l
1J
CO
m
oi-H
i-H
O
XCO
*Nf
Oi-H
X
00 aU
oTCO1 — 1o
ro
O• 1-4
"rt• H
ri* .
f^•H
<DFH
I-H
P(
1w
^
|
O ^ CO ON OO ON ^ CO CO1 1 . . . 1 1 . . . 1 1 . . .
o o r o c o o o c o o o O t— i I-Ho o o o o o o o c o o o o o o o o o
aO Tf ON CO O"~ r— ON OO OO
r o c o c o C O . — ' r o I-HI-HOco oo oo oo oo oo oo oo-oo
ar**" vD ^^ "™^ ^ ^ * r*"*" o** co LO uo
Is*- r*- oo CT^ o oo oo oo ^ co ^"co <\] M M co CM co ro co co co
a3vO ^O CO LO CO O C O O l T i i T ) t^ O <—<
\] ' ^ ^^ CT^ tSi" r*" vO LO co co ^^ (^ co
ad-
o o ^ o ^ o •— i in oo CTN m o o o o ^ o o m
N^ ^^ oo co oo oo ^* NO co r— t \o r*- r * NO ONt ^ - o o o o o o o o r ~ - r ~ - r - t ^ - r - c o r o c o c o r o
am o m oo t^-
t^" ^^ r*— ON J^ ^^ ^^ \f) ff) ^4 00 ^^ r~) t^- f^I-H I-H i— i i— i fxj i— i >— i I-H i— i i— i T ^ i n m T ^ i n
O O O - — i (M fO . f-i f\j ^< ' m vO O N N D ' - H O O r O
r— 1 - t— (
o o o
P Q PJ ffi JN N tslk h U
o f N - v o Nor- NO •— ' oo oorN-i i . . . . . . . . . .
o o o o o o IN-ON o^o ^ oo^oo oo oo oooo ooro oo mm
T t < t N - r - r - H o o NOOO oooo in co-sfc o c o o o ' N f o o coin c o c o oo ooo^o o o o o o o o o o ^"^ ^t*"^1 co c — CN*
•^ oo co oo •— ' ooo coin oin [••• in \o in cot^- •— ' oo NO i— < ooo o o o o o o o o o t*- Is- [N-r~- NO •— !•— i
OO NO ^ J* NO
00 00 O Tf ^f O 00• N t c o c o r o c o coco o o o o o r-oo
r>- o o ro inr * •— * in NO oo i— * in r - 0s in oo o"^ t H i nT t H ' ^ H ' ^ CO1™* ' — '•— i r~ < oo ro
oo oo NO o oin o o o NO o o
x}4 i— * ON NO "~* oo r — ON in oo oo ^\o t - m NO t ™ ' T^ NO oo ro oo co ^
oo ON o «— < oo in so in fN- f\j oo 0s
•— i in in NO coi-H
O 00 00
g N N U gN ^ UU
C
a•HO9)p^en
COU
*|HI-H• IH
Jd
T)0)
Oj
•Vrtf-tf-iia04j
Ujj
"a;
X '|_] o
w -I« S<j •«-<LH mL 1 w
US(U
C*oao
•H
Ua£rtCO
n)
^5bfifi
r-H
a0
CO
£P
41

ini — iot-H
"CO
m
oi — i
<*i-H
Q
XCO
I-H
O1 — 1
XI-H
CM aoD
COt-H
Of_H
CO
CO
•43(6
•|H
Ct)
?H
'V<a
£
0)r-H
CM
an)
a:i
C M O O c o c o c o 0s so co in i— ii. i . . i • . . i . •
C M C M C M C O C O C O i-HQi-i C M C MC M C M C M C M C M C M C M C O C M C M C M
Cj
§
co i -H^ f oo o xo xo o co r^- I-H oo
CM CO CO OO Tf CO i— I i-H I-H C M C O C OC M C M C M C M C M C M C M C O C M C M C M C M
a3-so r*- xQ f cr* ox 0s co EX- I-H i - [x- CD
oo oo ^p ^ ^ m Tf CM i— 'CM c o c o c o,' .. CM CM CM CM C M C M C M C M C O C M CM 'CO CM
ar * co i ^^ o^* Is™ ^*^ ^^ ^^ io oj - ^"^ o^*
\~Q LO r^™ xQ vO ^*o r**" oo ^^ ^^ ^J^ ^^ ^^ coC M C M C M C M C M C M C M C M C O C O C O C M C M C M
g
-J
m o ^ c o o o L O O C O C O o r ^ - « - ) c o r ^ o r o
O^ 0s* i"H (7s 0s 0s fvj »~~< P~< O^ O CT*1 f\I f\3 ^Dc o c O T f r o r o r O T ^ - ^ c O f S j c o c M r o m m
asO ^o CO oo 00 <M' iO
O ID •— i CO ^ L O l D l T j (\J CO 00 >— i ( V j v D - ^ Or- IP— l f \ J r — 1 i— » i-H r— ( r-H l O ^ ^ l O \Q 1C l-O
^^ LO v^ r*" r " co o** ^^ ^^ LO vO r*™ co ^^ LO
^^ ^ ^^ ^i-H r-H i-H i—l
• • • • •O O O 0
P P P PJ ffi J • ffiN N N NPH fe U U
o i-Hco mso •— i oo o
CM oo o •— i r - c>oCM C M C M C M C M ^ H C M C O
^^ CO ^^ i-O t ~ ^^ tO vO
co -^in -^m - < ^ < M C MCM CMCM C M C M C M - ^ ^
r^ r*- r^~ N^ 0s c^ co j
CM o^ 0s r ~ CD o^ co i—*co coco co - ^ c o r ^ r ^
QS ^ (^ QV f-_ ^
CO i-H •— 1 O O C O CO i-l i— lCM ^o ^o m so ^o i-"1 ("~|
CMCO CO "^ CO ' — ' ^ CO
I-H CD CD O^ CD CD OO 0s
CO i — 1 i — I i — I i — I i — 1 i — 1
CMco in co o "^ m in
r— moo oo i— • coi^inin co-^f c o ^ o c o s O v o
vO CO CO Tf
^^ ~* ~»^in ir> xD co
. • i-H
^ N' N N
rN N U h
Li)
^ U
COd0)
_H
'oQ)
aCO
a0CJ
•Hi-H•H
tn
1t!CD
a)'OR)
•|H
G0
4JU<U
0
0
x i1
H inJpq ^*** 0E"1 MH
cuua
,— i
ofi •o
•Hj *
uC
ntCOrt
^3ooa0)
i-H
ao•H
CO
<4Hm• |H
P
42

.
-
-
-VN3
1 1 1 1 1 1 1 1 1 1 1 1 1 1 1 1 1 1 1 1 1 1 1 1 1 1
CN•"ir:1":1-: ooooo<— 1010 y^QQQO^CN CN>£2aI> I
M M M M M M M N N
^v \ . \ \^ x
v \\ .\\ \ \\V \ \\
\v \ V\
rxx \co "\ \ N< x a -: \\ \ \ Nsx :
Xx\ X \ Xxv\\ V \ \\
00 \^yV \, \ NX«
—
—™
-
••
u
g UV <SJJx ^\ *~*iU
<* \\ \ \N\\I— \ \ V v x \o V\ \ \ \ \IAJ \ \ V v \ \
LU ^ Vv S N N
^^ \. \ ^v X ^^. x. -•
^ ^ \ \v1 ^ V Xv
10 \\ V
° D Nx\
N<1 OO **
\ 1., ... i , i li i i
•
o
^^r—
«o
^^Eo\O)
LU
LU• ID
,— U_O
CO
'o""o ^o "o No^
_
-2 -2Figure 8. The quantity (L - L ) vs fluence for 0. 5-MeV electron-
irradiated bulk silicon specimens. A data point obtainedfrom an irradiated solar cell is also shown.
43

CM
_ O D
O u-o O u-
o O Q O O
//
90O /
A<>6iLUQ_O
oo:o
LU
co o>
i«o
1., I I I
( L _ s u o j p 9 | a ) "bi
_o
E
o
LU
CNi
CS
Figure 9. Daraage coefficient vs. resistivity for 0. 5-MeV electron-irradiated specimens.
44

parison is made at a given resistivity. Except for the CZ 2. 5 result, thesefindings are consistent with observations of others2"'2' that FZ solar cellsare more tolerant of electron irradiation than are CZ units. (This observa-tion and others presented below for different energies lead us to suspect thatingot CZ 2.5 was actually FZ material. However, infrared absorption measurements on a sample from this ingot revealed an absorption peak at 9 M-m» whichis characteristic of a large oxygen content. Thus, ingot CZ 2.5 appears tobe CZ material. It is not clear at present why damage coefficients forspecimens from this ingot exhibited behavior consistent with that for FZmaterial. ) A larger K-^ for CZ material indicates that the presence of oxygenenhances production of those defects primarily responsible for diffusion- lengthdegradation.
Figure 9 reveals that K^-va^1163 f°r FZLD 0. 1 and FZHD 0. 1 are nearlyidentical. Damage coefficient values for CZLD 0. 1 and CZHD 0. l.are alsoin good agreement with each other. This observation indicates that there isno significant dependence of KL on dislocation density for 0. 1 ohm-cmmaterial bombarded with 0. 5-MeV electrons. (Additional discussion relatingto this point is given in the Appendix. )
One solar cell data point is shown in Figure 9. It is seen that the K-^ valuefor CZ 9/SC2 is a factor of ~ 4 larger than that expected on the basis offindings for CZ bulk samples. Further comparisons of solar-cell and bulkfindings are discussed below.
As discussed in Section 2. 2, an incident 0. 5-MeV electron degrades in energyto ~ 0. 44 MeV by the time it reaches the center of a bulk sample with a thick-ness of 0. 3 mm. Thus, the bulk damage effects presented above are moreappropriately associated with an average electron energy of ~ 0. 44 MeVrather than the incident particle energy. (This consideration can account for aportion of the difference between solar cell and bulk material damage coeffi-cients (at 0. 5 MeV) because the SSPC measurement technique samples damagethroughout the entire test specimen whereas solar cell measurements arepresumably only affected by damage within a diffusion length of the n~^p junction).
4.1.2 1. 0-MeV Electrons
Figure 10 presents data for 1.0-MeV electron-irradiated bulk samples and solarcells. Low-resistivity specimens exhibit linear degradation with fluence at lowfluences, but exhibit saturation at high fluences (i. e. , an apparent sharplydecreased defect introduction rate). We defer additional discussion of ob-"served saturation effects to Section 4. 3. Higher resistivity samples alsoindicate a deviation from linearity at high fluences. (At the highest fluence,the onset of carrier removal was noted for the higher resistivity specimens.The resistivity increase in FZ 13 samples was ~ 7% and was ~ 3% for FZ 2.5and CZ 2. 5. ) Data for several solar cells (FZLD 0. I/SCI and SC2, CZLD0. I/SCI and SC2) were obtained at two fluences and the observed degradationwith fluence is close to linear for these two cell types. However, the two
45

610
510
«N
'eo
"-?1 4
7_,10
io3
210
I i i i i i 1 1 1 i i i i i i 1 1 | i i x-i i i i i
: X'XX /
1.0-MeV ELECTRONS x /* s
Bx // x -
xx x »x
' V ^ x^z~ >^ //''E x / ^ /
I / f V /'Xty X
xx ya x^x /xU / / // / to/ ,7 . X X
0 / t^ X/ x/ /W XX A/ /V^ / d
CT //^ x- /' /
xx/x /x SOLAR CELLS
- &?' £ c FZLD 0.1 /SCIx^ /x • " /SC2
//' / AFZHDO.lXSCl0 /'/ / D CZLD O.lXSCl</// - P • " /SC2
^xJJ^ / • CZHD0.1/SC2</ / * FZ 2.5/SC26
_ x / V CZ 2.5/SC1r ^x T /SC2~ /1 X • CZ 9XSC3^- * FZ 13XSC33
i i i i i 1 1 1 1 i i i i t 1 1 1 1 i i i i 1 1 1
io13 io14 io15
FLUENCE (e/cm2)
-2 -2Figure 10. The quantity (L - LQ ) vs. fluence for
1 1 i i i i
BULK SAMPLES
0 FZLD 0.1
AFZHDO.lD CZLD 0.1
0 CZHD 0.1o FZ 2.5L CZ 2.5
0 CZ 6/2
^FZ 13
> l i i , , ,
io16
i i 1
_
~=
-•" '
~
—--
-_
-
—
-_•™
-
—2
—
-
-
, , ,
id
1. O-MeV electron-irradiated bulk silicon specimens and silicon solar cells.

solar-cell data points for ingot CZ 2. 5 (SCI and SC2) cannot be fit •with a unity-slope line. The degradation irate is apparently lower at the higher fluenceexamined. This result is qualitatively consistent with the observations ofMeulenberg and Treble^® who noted a fluence dependence of K-^ for 1. 0-MeVelectron-irradiated solar cells (~ 9 ohm-cm).
Data corresponding to linear degradation regions (i. e. , good fits to unity-slope lines in Figure 10) were used to determine damage coefficients for bulksamples and Figure 11 presents the results along with comparison data (forsolar cells) obtained by other workers. 28-30 For the present solar-cellfindings, data in Figure 11 represent K, -values obtained at a single fluence.A line with a slope of -0. 63 fits several groups of data points well.. Findingsfor FZ bulk samples, and also CZ 2. 5, are fit well by such a line. Bulkdata for CZLD 0. 1, CZHD 0. 1, and CZ 6 are fit well by a parallel line.FZ material is again observed to be more radiation resistant than CZ, withthe bulk CZ-to-FZ KL ratio being ~ 1. 9, as compared to ~ 3 for 0. 5-MeVelectron irradiation.
Two data points taken from solar cell findings of Meulenberg and Treble^^are shown in Figure 11. They observed a fluence-dependent K-, value, andboth high- and low-fluence values are given in the figure. It is seen that thisrange of values overlaps the present solar cell data and bulk sample data.We further note that the fluence dependence of KT presently observed forCZ 2, 5 cells (SCI and SC2) encompasses a variation of K-^ by a factor of~ 1. 7, whereas the variation of K, for data of Meulenberg and Treble is afactor of ~ 3. This difference is presumably attributable to the fact that theirobservations were made over a wider fluence range than that examined here.
Also shown in Figure 11 are four data points obtained from the work ofDowning et al. ' The dashed-line fit shown through their data also fits anumber of the solar cell data points obtained in the present investigation.Data of Faith30 are also presented, and the resistivity dependence of K-^ isseen to be about the same as for other data in Figure 11, although his K -
\_f
values are somewhat larger.
Low-resistivity solar cell data in Figure 11 are observed to be consistent withtheir bulk-sample counterparts in that values of K for CZ cells are a factorof ~ 1.9 larger than those for FZ units. Additionally, as was the case for0. 5-MeV electron-irradiated specimens, there appears to be no significantdependence of K, on dislocation density for low-resistivity bulk samplesor solar cells. We further note that KT -values for low-resistivity solar cellsare a factor of ~ 1.8 larger than their bulk-material counterparts. For thehigher-resistivity cases, solar-cell-to-bulk-mate rial KT ratios range from~ 2 to ~ 3. 2.
4. 1. 3 2. 5-MeV Electrons
Data for 2. 5-MeV electron-irradiated specimens are shown in Figure 12,and saturation effects are observed at all resistivities. This phenomenon isparticularly strong for low-resistivity specimens, and to determine KT for
*? *? "such samples we employed the values of (L - L ) obtained at the lowest
47

1 1 1
ooo:
OOcNr-CN
/u_u_oou_oo
- LU>7 /•/' / o' /
/ /•-/./* /
/ / /
/
/ / /
Q_o—Ioo
o
>o>
Io
1 1 i i i i i I..
/
i i i i i i i i i
<N
o
00
oo
CN
'o
5rt
Ico
uOJ
o u
M ^4H CO
>> C*" O•^ u
COC
C .S
'o «. exvJ OT
(1) *—I
o o° o
00
I- ')!
48

IU
510
CN1
O
7 o1
11
CN 4
'_j!0^ •4 1 \J
in3
- 1 1 1 1 1 1 1 1 1 1 I I 1 1 1 1 1 1 1 III- 1 1 ^
: 2.5 -MeV ELECTRONS
~ y^ O
A //'& &g ® if
=~ rf': i //*> /' o
>/x /x Q
~ A x
/x* /< ° FZLD OJ
/^/ / D A FZHD 0.1/?' / O CZLD 0.1
= M' Qx D CZHD 0.1
- */ / 0 FZ 2.5_ ' / b CZ 2.5
/ o CZ 6/3P Q FZ 13
/x A CZ 9/SC4
i i i i i 1 1 il i i i i i 1 1 1 1 i iii
MI'.
-
-
~-
•~—
-
—• •
-—"—
i 1 1 1
10.13
1014 10FLUENCE (e/cm2)
1510
16
Figure 12. The quantity (L~ - L Q ~ 2 ) vs. fluence for 2. 5-MeV electron-irradiatedbulk silicon specimens. A data point obtained from an irradiated solarcell is also shown.
49

13 2fluence ( 3 x 1 0 e/cm ). Damage coefficients obtained in this manner canbe considered lower limits to actual values. As was the case for 1.0-MeVelectron irradiation, carrier removal was observed here also. At the highestfluence, resistivity increases of ~'25% for FZ 13 and ~ 6% for FZ 2.5 andCZ 2. 5 were noted.
Figure 13 presents damage coefficient vs resistivity and it is seen that mostof the data are fit well by a line with a slope of -0. 67. Based on the CZ 6/3data point, a CZ-to-FZ Kj^ ratio of ~ 1.6 is obtained. Low-resistivity samplesdo not exhibit such a ratio, but those data are most likely influenced somewhatby the saturation effect. As observed in Figures 8 and 10, differences betweenFZ and CZ material diminish as saturation is approached. We further note thatthe one solar cell data point in Figure 13 (CZ 9/SC4) would yield a solar-cell-to-bulk-material K-r ratio of ~ 1.4 if one were to extrapolate a line of -0. 67slop through the CZ 6/3 data point to 9 ohm-cm. (It is probably inappro-priate to compare Kj__ for the CZ cell with the straight-line fit for higher -resistivity FZ material. )
4. 1.4 Electron Energy Dependence of Damage Coefficient
Average damage coefficients for three resistivities are shown in Figure 14for the three electron energies utilized in this study. (Data labeled FZ 0. 1represent an average for both FZLD 0. 1 and FZHD 0. 1 samples. ) Forcomparison, findings of Downing et al. ^ ' for 3. 3 ohm-cm solar cells arealso presented. Upon comparing their data with the present FZ 2. 5 findings,it is seen that the solar-cell-to-bulk-material K., ratio tends to decreasewith increasing .electron energy. We also note that K-r falls off more sharplywith decreasing energy for the present data than for that of Downing, .and thusour findings deviate more strongly than his from theoretical predictions " ofthe energy dependence of K .
X-i ;
4. 2 Results of 10-MeV Proton Irradiations
Data for 10-MeV proton-irradiated bulk samples and solar cells are listedin Table XI and shown in Figures 15 and 16. In Figure 15, saturation effectsare again evident, particularly for low-resistivity samples (discussed inSection 4. 3). Additionally, a fluence dependence of the degradation rate isevident for solar cells. Also shown are data obtained at 9 x 10^ p/cm fortwo unilluminated bulk specimens. These data indicate slightly lower KT
values for unilluminated samples, but more data are required before amore definitive statement can be made.
11 ?The first 10-MeV proton irradiation was performed at a fluence of ~ 10 p/cm ,followed by ~ 3 x 10 (cumulative) and 1.2 x 10 p/cm . Carrier removaleffects were negligible at this fluence for all resistivities examined. At thispoint, saturation effects were quite evident and thus it did not appear tobe informative to irradiate the original group of bulk samples to an evenhigher fluence. However, it was obvious that data for fluences lower than10*1 p/cm2 would be beneficial for the purpose of obtaining damage co-efficients, particularly for low resistivity specimens. A subsequent
50

1 1 1 |MI
^
_
~
- Jjj™ _
- O1
~ IILU
O1
CO\
r \
: ^: Vy•
'
' 2
/ °
- / ^J• i_t 1
bXJ
>— QJ
«E1"
w>CN
II 1 ll 1 1
O^1
0
1 1 1 1 i 1 1 1 1 i i i i i
//&
/ —^i / i
0 / =/ ~
//
/ -/
/
/ —/
"
_
-
-._.-.-; 22% _
• • \ C^O CO ^"^ —f~\ t~\ /*^ t~\ C*>4 (^4 "O ^~ r~ O*
-j n: — i ^u u u _ O O u _ O O L J _ u _ O ~
^—
^) ^3 "^ n ^^ 0 ^^ fi L^ 41\*s ^\| \^ LiJ ^^^ v \s ^J i ^ ^w
—
1 1 1 1 1 1 1 1 1 1 1 1 1 1
TDIU
"rt•n
~o .5^^ ic0JH
U
i — i0)
>. . 0!
E 5
r -o E ^O o o
t>sJ->
te. •!-(
^ £4J
~" to" 01
<u
CO~~ COCO >LU 4J
- « S
'o 1*" "cu
0 Mu c0) JJCuO HnS -!H
6 «n3 p(
M co
.CO
CN _!
/~N CO
0 - ^± % ..- ^ "^ 31 1 5J3O O £
/ C 1 Irt 1 13 1 3\ ' \1
51

10-9
oL^•+*U
"o>
10-11
10-12
I r
0.1
BORON-DOPED SILICONn FZ 0.1 -A FZ 2.5 :O FZ 13
EMPIRICAL FIT 'AFTER DOWNING"
(3.3 Q-cm SOLAR CELL)'
1.0ELECTRON ENERGY (MeV)
10
n)• H•o
i
o
»Ho
c(U
coh
-4->
o0)
10
o ^ml w
« "S8 8,o
0) T3bo irt C
aOfi
52

ro£oo
• — ••e
©,_^
1.2.^^ _ ^
ro
up^
^©
S^"
3:
A
ro~
0
*—^
©
8i
-1roa
CJ
©0*o' - 1— I
8 2— t i"H
^ Xt-
ro"
ao£at•HT3(4
^-H
&
0)r-l
80rt*cuW
ro ro ro
O O Oi-H i-H i-H
X _ X _ XCD "~ 0"* "~ COro •— < ro. . .
r-H r-H r-H
t— (7s CO U1 O
ro •— ' co ^ roro ro ro ro ro
^H ^H r—i ^H
o o o or ^H ^H ^H
X X X _ XvD in ro mO's ^N ^^ ^^
ro ro* ro* ro
•-H ro r- oo co
co ro ro ro coco ro ro ro ro
O r-l O O r-H
o o o o o
X X X X Xo ro r-i I-H ror CD o^ 0s CD
O^ i-H 0s CT^ r-H
0s I-H CO O "
r-H r-H O O CO
co co co ro ro
1 1 1 1 1
dd.
co ro m r-n coi — 1 \O i-H O^ ^
ro I-H ro " ro
oo o o r-H ro•-i --I ro ro roi — i
o*Q
Nfa
ro ro ro ro co
•-H O O O O OO i-H I— 1 i-H i-H r-H
" * X X X X X1 M 1 1 I I I ~ ~
O O O O OO ro ^H ro ro ^
• . . 0 . .
O^ F— 1 i-H I— 1 i-H i-H
cj\ j* oo oo •-H r^ ^4^ oo
' • ^ * ' ' - ^ C O C O ' ' ' I-H- rH pO r- l
r o r o r o r o c o r o r o r o
. 1 F r-4 r-< . 1 i— 1
O O O O O O O
i , X X X X X , , , X ; • = _ Xm ro m ro m m ro0 0 0 0 0 0 0
ro ro ro ro ro ro ro
r o c o i n r o r " o o c o r o r o1 ' • ^ • ^ • ^ • ^ c o ' ' ' i - n r o r o r o
r o r o r o r o c o r o c o c o r o
I — 1 O *— 1 O i-H O O r - H O
O O O O O O O O O
I | X X X X X 1 X X X - . - Xro ^ ro •— i ro • ^ ' - t r o •-»CD C7^ CD CT^ CD r— i CT^ CD CT^
i-H 0s r-H O i — 1 00 O i-H O
oo vo r— i CD r^* so ro ^o t^ r^- ^*
' ' oo cr^ CD 0s oo ' r^- ^o ^-o m ^o oor o c o c o r o r o r o r o r o r o r o r o
aiiO CO^Q" 1 1 1 1 1 1 l^ 1 1 1 1 1 1
CO CO
00 O O O O CO O
ro o m in in m ^ ^ co o o o \o \o
• ^ c O r - i r o c o - ^ i n o o o o o r o ro, TJ< r-• - i r o r o c o . r o r o ^ H ^ H r o r o r O ' - i
r-H i-H I — 1
o' o° o*Q Q QK HH ffi
N N COfa U U
co
oi— iXoro.i-H
r-l CO
ro rooa ro
o""" *
_ Xm0
ro
TT* ^H
r-H rO
ro ro
r-H
O
_ Xroo
i— i
o invO t^-co ro
i i
ro oo
vD ro\f\ . (->U J SiJ
OO O1^1— ( -(
m
CO
$a
•HO
<DP-<CD
riwQO
1— 1•rH
CO
_y
^T3cy"rt•HT)nJh
•tH
1
rto
•4-*
orH
r-l $>
X <u
W ^J 0PQ r-H
H o<+H
C^uflCDrj
^
cb
u
<6aCOrtr|j \
bC
i— i
fiO•iH
CO
£J• i-H
Q
53

OJ
g.£•©-
©'H'
§
A
^_^oo s
op.
N— '
•e
©
1
^
00ao^
£•e
©'H
i
^oo
o
P.© 0
i-H
TT oc •— '.3. x>-5 r-
OJ
fl0
"rt
'OretJ-trH
•1-1
cu'csrt
- 2° 0^ rH
^^ O^ "*OO rH
i-H i-H
CO r-H r-
co oo oooo oo •-!
r-H i-Hr-H r-H
O O' r— 1 I-H
X X -m ooO^ O^
0 •
oo oo
oo m oo
CO CO Ooo oo co
r-H Or-H i-H
0 0i-H i-H
<NJ ^^3 Q**
"-H 0s
o^ <\j r\3• 0 •
Is* xO 00oo oo m
i i r
r-
in co. o
\ V.Q ONvO LO CO
O ^H ON
r-< ma •
O 00
Q Nffi tiNU
00 00 00 00 00 00"
O O O I-H O O Oi-H i— I r— I O i— 1 r-H i-H
X XX "" X ( f X X' o ' ' r ^ o ' • " o o ' ' o o
oo •— ' oo o I-H oo i— ', . 0 . • • •
r-t r- 1 i-H O i— 1 i— 1 r-H
oo ^^ ^^ ^^ ^^ oo *^• • • « * ( l • •
' oo o 0s i— ' r*" ^ ^*i— i oo •— i oo •— i oo oo
r-H r-H r-H •— 1 i-H i-Hr-l r-H r-H rH i— 1 r-H
O O O O O Or-H r-H r-H i— 1 r-H r-H
., * , , * * , , * • • * *in . co in m in oo(7^ t - ON f ' ON ON
0 " " * • » " « 0
00 00 00 00 OO 00
i-H CO ^ in ON r-H
* * * i i " 1 1 « •' (NJ ' O ^ O •— < rH
CO CO CO CO ^* 'f
r-l O rH O rH Oi-H rH rH rH i— 1 r-H
O O O O O OF-H i-H r-H i-H' ^H r-H
l x l l x x l l x l ) x xoo ^ oo NO oo i ~O O O rH O OO
rH 00 rH OO •— 1 ON
CO oO ^^ ^^ ""H ^
1 ^ 1 ' N O N O ' ' O O 1 " i n r - H
NO ^* NO m oo r -
o^ ^ ~ ON1 1 O rH 1 1 ,_, 1 1 If) vO 1 1
rH rH QQ r-H ^
-HIN- m o o o o CN- t — ON t** I-H in oO c O N o m c o t N - m t ^ - c o o m c o c o• ^ i n c O T f m i n r H i — l o o ^ m ^ N O
O r-H r-H 00 ^~> ~^> -^1 \f) ^) C) ""* mOO
- NO ^
m roN rH
oo r->
N hu •
fiOU
XHJCQ<H
CQfl0)
o<uD4
CO
floo•HI—I•H
CO
f I3
IOi-H
(1)O
§0d
flO
COn)
oo
ao
54

Ill 1 1 1 1 1 1 1 1 1 IJJ. 1 1 1 1 1 1 1 1 1 1 1 1 1 1 11 1 •*-* '
to o .H1
LJ_| t"~ ••"
— s! "^£2 \ ° c• < o' °'d do d iou io •\*\)
V/l Q OO OO Q CNCNCN -OO ,—
</) 5^ M MM MM M MMM MM = Mz — i u_ u_u_ OO O U-LL.O OO u- .
^ OQ <] O ^ ^ o« O <«3O DO BOO
.> ^SSS SSSSg 252 «
~ ' ^"^ ^^^ * * COO t^3= I 0 = g = C N C N = = ,_
«_l t A ., fN f^ | i ^) | t
-\
.jut. ^ X^1* X
f \ X° *\- \: \ vx >x
H\\\ XXN
V \X XX\ N
\\. \
: \ N\\Vx \X \\ X X
X \x \ ^\ \x X
N
II 1 1 1 1 1 1 1 1 1 1 1 1 1 1 1 1 1 1 1 1 M 1 1 1 1 1 1
-
—
-
----
-
-
-
-
-
"o.
CO
"o
—°e, 0.
CN
2 ozuura
"o
o"o
0 2 2>^ °1 - 1z- z-
Figure 15. The quantity (L - LO ) vs. fluence for 10-MeV proton-irradiatedbulk silicon specimens and silicon solar cells.

.'1 1
—
-
—
-
—
- '
1 1 1
D
1 1 1 1 1 1 1 1 1 1 1 l 1 1 1 1 1 1 1 1 1 1 1 II 1 I '-J
o £2 :
0^ — LU
f "\ f *\ t *\ f ** f ^ f X f % "* tf\ | ^ OJ ^^^
^^^ t^^ t/) L^^ t^^ ^^1 L^^ t^^^^*^ v^ "^1 ^^^ *^\ ^"^ ^^ ^^ ^^ ^^
^O OO O J^^ NC^K ceo: —Q = OO = Q z^vjfvj = = ^2|jjLU LULU -
*C IVI MM M M^ M1-1-1-1- LULL.—ILL. u-O O LL.O LI_« « '
CO • O • ••^B Q fl 41 • ^ ^t
COLU••J ^^r oo *^^— ^V^ ^v^ 1 • I
^CDC^OO ocS^-jco <^\ <i 1 1 tf] /
gCCCSBSCSSC' / /0 / '/ ':coonH^^oOaoo^i / , i , -
/ / / /40 oi aO /
o i 1 i i
LU ' 7 ' ~~-
i ^x'7/ / :§ y / /Q- . ' / '
> I I I
k i ! 1 :
i i i i i in 1 1 1 i i i In 1 1 i i i i 1 1 1 1 1ir> -O ^•O 'O '0
no
CNO
"o _
o
Eo
10°
RE
SIS
TIV
IT
7o
cs'o
I-'
Figure 16. Damage coefficient vs. resistivity for 10-MeV proton-irradiatedbulk silicon specimens and silicon solar cells.
56

irradiation was performed at ~3 x 10 p/cm . As seen in Table XI, thenumber of bulk samples irradiated at this fluence was small. Additionalirradiations at relatively low proton fluences on a larger group of low-resistivity bulk samples would clearly have been useful in subsequent Kdeterminations.
In Figure 16, KT is shown vs. resistivity. Values shown for low-resistivitybulk samples are for the two lowest fluences, and the effects of the onset ofsaturation are evident (lower KT for the higher fluence). A line with a slopeof -0.44 provides a reasonable fit to several groups of data points. ' Shown
2 8 ^ 1 3 ^for comparison are data obtained by other workers. ' ~ The 11-MeVdata of Anspaugh and Carter are somewhat lower than all other KT values.(The bars shown correspond to the range of values given in Reference 31. )However, their measurements of diffusion length •were made at a high in-jection level, and thus one expects a larger L, and hence a smaller K-r ,due to the injection-level dependence of diffusion length. Data of Meulenbergand Treble2" are also shown, and the bar shown corresponds to the fluencedependence of KT that they observed. Data obtained by Rosenzweig agreewell with the straight-line fit through several of the present solar-cell datapoints and also data of Meulenberg and Treble. Findings of Denny andDowning are also presented in Figure 16.
Because of observed saturation effects for bulk samples and fluence-depen-dent KT -values for solar cells, one must exercise caution when comparingdevice and bulk damage coefficients in Figure 16. At the lowest fluence,the solar-cell-to-bulk-material K^ ratio for CZ 0. 1 is ~3, and this ratiofor FZ 0. 1 is ~ 1. 7. Upon comparing solar-cell KT -values obtained at thelowest fluence with bulk material damage coefficients obtained from unity -
• slope fits to the data (Figure 15), the following ratios result: for FZ 2. 5,~ 4. 1; for CZ 2. 5, ~ 3.4; for FZ 13, ~ 7. 5. The latter value is anomalouslyhigh. As seen in Figure 16, Kj^ for FZ 13/SC35 does not agree with othersolar cell data presented; the reason for this discrepancy is unknown atpresent.
Because of the paucity of low-resistivity data for bulk samples at the lowestfluence and because of saturation effects observed at higher fluences, noconclusion can be reached regarding the effect of dislocation density on KT
for proton-irradiated bulk specimens. However, for low-resistivity solarcells, data for CZLD 0. 1 units and CZHD 0. 1 devices are in good agree-ment (Figure 15), which suggests that dislocation density is an unimportantfactor for 10-MeV proton damage. (A similar statement can be made forFZLD 0. 1/SC4 and FZHD 0. 1/SC2. ) Regarding differences between FZand CZ material, Figures 15 and 16 reveal once again that FZ solar cellsare more radiation tolerant than their CZ counterparts. For example,the CZ-to-FZ KL ratio for 0. 1 ohm-cm cells at 1.2 x 10¹² p/cm2 is -M. 5.For bulk material, upon comparing the KT value for CZ 6 in Figure 16with a straight-line fit to data for FZ 2. 5 and FZ 13, a ratio of ~ 1. 7 isobtained.
57

4. 3 Discussion of Saturation Effects
Saturation effects were observed for irradiated bulk silicon samples in whicha departure from linearity was noted in plots of the quantity (Li - LJ«~ )versus fluence. Examination of Tables VIII through XI and Figures 8, 10, 12,and 15 reveals that the onset of saturation begins in all cases when L is de-graded to a value on the order of 30 |j,m. Continued irradiation reduces theapparent diffusion length somewhat to a lower limit of ~ 20 p,m, and no furtherdegradation is noted. Although such saturation behavior has been previouslyobserved, ' this effect is clearly not a manifestation of a saturation inthe production of recombination centers because solar cells continued todegrade at high fluences while bulk samples saturated.
We have had experimental indications that saturation is attributableto the effects of radiation-induced trapping centers. For heavily degradedsamples, it was difficult to achieve a traps-filled condition using backgroundlamps. That is, a slight decrease in observed SSPC signal was noted asthe background lamp intensity was increased from about one-half of themaximum value up to the maximum. This was not the case for samples inthe linear degradation region. Additionally, photoconductivity-decay life-time measurements were made for two CZ 2. 5 samples: one that had ex-hibited saturation and another that had not. Distinct differences in behaviorwere noted for the two samples. The saturation sample exhibited strongtrapping behavior consistent with the presence of several types of centers.These centers possessed a range of trapping time constants, including timescomparable to and also considerably longer than the lifetime. For thissample, because of trapping effects we were unable to extract a meaningfullifetime value from the observed decay even when a background lamp wasemployed. On the other hand, for the nonsaturation sample only slighttrapping effects were noted. An exponential decay was readily extracted fromthe observed signal, and the lifetime thus obtained was in good agreementwith that determined using the SSPC apparatus.
The above observations suggest that in a heavily irradiated bulk specimen,i. e. , one in which L, has degraded to ~ 30 |j,m, traps introduced by radiationbegin to have an effect on the SSPC signal. If trapping time constants arecomparable to the lifetime, and the number of traps present is appreciable,then the SSPC method will not yield an accurate lifetime value. It will beerroneously high due to trapping, and background illumination does notprovide a practical solution to this problem. For the present experiments, inmost cases a region of linear degradation of L was observed at lower fluences,which enabled the determination of damage coefficients. Additional studywould be necessary to gain a more detailed understanding of observedsaturation effects. However, such an understanding is not required to achievethe technical goals of the present investigation.
4. 4 Comparison of Steady-State Photoconductivity and Steady-StateSurface Phbtovoltage Measurements
A comparison was made of diffusion lengths measured by two techniques:
58

steady-state photoconductivity and steady-state surface photovoltage.Four irradiated bulk samples were examined. Following SSPC measure-ments, sample surfaces were prepared for the SPY technique in thefollowing manner. Surfaces were lapped (6 M/m) then polished with Lustrox1000. After this, surfaces were etched with CP4A followed by HF-H2O(1:4). Photon intensity vs. reciprocal wavelength is presented in Figure17 for the four bulk specimens. Extrapolated least-squares fits to thedata intercept the abscissa at points numerically equal to bulk diffusionlengths. Table XII compares SSPC and SPV measurements for thesespecimens.
TABLE XII
Predicted SSPC L-valuesbased on an extrapolated
Sample SPV SSPC unity-slope fit
FZLD 0.1/1 97. 4 <im 76. 5 ,um (not applicable)
CZ 2. 5/3 76.4 71.2
FZ 13/18 14.4 24.7 20. 8 M-m
CZHD 0. 1/8 6. 2 23. 4 12. 0
Comparison of diffusion lengths measured by SSPC and SPV techniques.
It is seen that agreement between the two methods is reasonably good forlong diffusion lengths but is rather poor at short diffusion lengths. How-ever, the two SSPC short diffusion-length values were measured on samplesthat were heavily irradiated and exhibited saturation in plots of the quantity(L - L0~ ) vs. fluence. As discussed above, such behavior is most likelydue to trapping effects. In an attempt to make a more appropriate SSPC-to-SPV comparison, linear-degradation behavior observed at low fluenceswas extrapolated to the fluence of interest and an expected value of L (i. e. ,in the absence of saturation) then calculated. These predicted L-valuesare also listed in Table XII. Agreement between SSPC and SPV valuesimproves using this procedure, but significant differences still occur,particularly for CZHD 0. 1/8.
In Sections 4. 1 and 4. 2, differences between damage coefficients for solarcells and bulk samples were noted. A comparison is made here of SPVand SSPC findings for the purpose of attempting to account for these Kydifferences. Figure 18 compares SSPC and SPV data for FZLD 0. 1/1 ina plot of the quantity (L - LQ ) vs fluence. Also shown is a similarcomparison for CZ 2. 5/13. It is seen that SSPC and SPV data agree quitewell for CZ 2. 5/13. The solar cell data point for CZ 9/SC4 in Figure18 indicates the rather large device-vs-bulk discrepancy that needs tobe accounted for. For sample FZLD 0. 1/1, the SPV data point yields
59

ooCO
1 I K 1 J
x N— N >N
x
-n x<
^^^DX»
^x^X,
_
—
1 1 1 1 1
> > o o o ^in & "~ "~ "~ O
-1—D_Lul — ^ xt ^ (NO fz • • . .oc. ^ Ix -o -^ o1 - — - CX fx ^_z~~ . _ QO
^S-^ 00 O i^ \ O
Q (N — 0_J ITM M M Mu_ O u_ O
O < D O
1 1 I I 1
O Oo oCO O
0 0O 0 _CN ^ 0Q
,1 1 1 \l 1 1 1 1 1 1 1
t o\ ~\
Ox<N X0 |
x\ \«> O\ \ \<\ x. O O\ N \
X Xx V
°x, <v OX^>X*x N x;^ x w
•^ \ N\<H^ O iNO
x< vdo f XO\ X^x. X.
\ V "x. ^1 1 1 1 • 1 1 1 1 > 1 ^
\ \ ^^^~\ N
\ \\ \
s \\ .\.
\\\ -\ \\ \ ~\ N\ N.-\ N\\ ^
\\\
1 1 1 1 1 1 1 1 1 1 1 v
v_^
0w>
0
o1
oe~\
o o o T0 0•xt CN
Figure 17. Photon intensity (arbitrary units) vs. reciprocal absorption coefficient forirradiated bulk silicon specimens. Data shown were obtained by the steady-state surface photovoltage method for determining diffusion length. Dashedlines are least-squares fits, and the intercepts yield diffusion lengths.
60

- M M I |
_
^™
,
-
—
-~
-
•>
—
— •*•-_
——
—
—
"™
*•
••*
•"•
•" *
«•
MMI 1
D
I I 1 1 1 I i I I i i 1 1 i i i i i 1 i
_
—
^™
Oo o o
^ Q_ > Q- > ii CO Q- CO Q- 0
^ CO CO CO CO O
CZ.K— _O P -
- > e 2 :^ 0 u^ to ~
\ > Q ~ CN ~ O^' • -<)^ ^ M M M
\ in "- ° °\ . ~\v o n y o ^ ^
\<>v -N
\ I
\"^ \' \
D B <>\ >•
\\ \\ \
Xx v\- -\ -\ \
\ Nn -\
"
II
1 M 1 1 1 1 1 1 M M 1 1 1 1
v-»
1c0
(1)
^J>
^•o ^^o 0-
f^~" 5r^ • «'-' u
— fl
03 «~y d
C• J-,0
CJ u|2 z ^
^^ L^J ^p^ — j
ill "
^
T3
C
'rt4_)
O
4->n)
T3
*0
isw
CO
•£&gu<;
>S
1o '.f 2Q^ M
• i1 5 MLU '
III i.
'J-1 t
^° 1i— ludO^
0)
^
od1 '0)
dbo
CO -H
•<t CO CN *~"
0 0 0
(z:uiDi o.i -z.i
p.
tnJ-.
8^
CO
'O(1)
4->
• UTO1
>H
«
J X
oa0)<•>
en
>,
S
rtCO
4-1
C
fi
^1d
SS
'>
1'du.20
Q,
cu"rtto
>>T3rt0)
CO
r^
CO*
C3<U
^"
CO
sID60
iO
61

a KL value even smaller than that for SSPC, and such behavior is in a direc-tion opposite to that required to account for differences between solar cellsand bulk material.
Figure 19 presents a similar comparison for the two short-diffusion-lengthsamples of Table XII. For FZ 13/18, the SPY data point lies between theextrapolated SSPC value and that expected for a solar cell. To make thiscomparison, it is necessary to extrapolate linearly the behavior for FZ 13/SC35to a fluence of 1. 2 x 10^ p/cm . (A fluence-dependent damage coefficientwould invalidate this comparison, however. ) For sample CZHD 0. 1/8, itis seen that the SPY result will give a 1C value considerably larger thanthat expected for CZ 0. 1 solar cells at the fluence in question.
It is encouraging that SSPC and SPY L- values are in reasonable agreementfor the two longer-diffusion-length cases examined. However, the dis-agreement noted for the two shorter-L samples indicates that additionalcomparisons of the two techniques in question, along with comparisonsamong other measurement approaches, will be required before observed 'differences between solar-cell and bulk-material damage coefficients canbe resolved.
4. 5 Annealing Study for Low-Resistivity Samples .
An annealing study was performed for selected bulk silicon samples thathad been irradiated at different energies to different fluences. One groupof samples was annealed at room temperature following irradiation, anda second group was annealed at 60°C. Determinations of diffusion lengthusing SSPC measurements were made for each sample at various timesduring the annealing period. Data were analyzed in terms of an unannealedfraction, defined through the relation
Unannealed Fraction = - - - - — • (15)(1/L ) - (1/LJ
post 0
In this expression, L^ is pre-irradiation diffusion length, L . is post-irradiation diffusion length measured after ^ 1 h at room temperature,and !_,£ is post-irradiation diffusion length measured at room temperatureafter a time t at the annealing temperature. Thus, a value of unity for theunannealed fraction occurs by definition at 1 h after irradiation.
Room-temperature annealing data for twelve -samples are shown in- Figures-20 and 21. Very little annealing occurred during 500 h at room temperaturefor most of the samples. Sample FZHD 0. 1/5, however, exhibited a sig-nificant amount of recovery. This sample was irradiated with 0. 5-MeVelectrons to a fluence of 1 x 10 e/cm . It is interesting to note that
62

•*r
—
t*>
"o
CM
E
ck:—r
CM
S "oLi 1
ZD— lu_
2O1—OQ£Q_ _
2
0
O"
.1
-™
-
-
-
-_
-
—"
-
—
_
-
—
-
-
1
O
I I I I I I 1 1 II 1 1 1 1 1 1 1 1 1 1 1 1 1 1 1
o^ o
O 0CO Q_ > O~2L CO QL.0 00 CO _ fs,
^ o o oI — 00 = CO CO CO
<-> \ \\ \UJ -> I-
1" r-i P -
1 • • • •uJ 0 0 0 O
Q = Q o Q\ \ «> M M N M
0 _ \ S O O O O
S 0 0 • 4 •\ \\ \ \
^ N \\ \ \
^ ^ Xs\ N N
v
* X- o X<,„ o *\ \ ° <Jo ° N N N\
•y Q- > \ \O <^* °- ir) \ ^
0^2 x ° <a: oo = o N
°- \ \ x^\ _JSi v
f^\ OO
o ~ ^g N N \i ^B L/
2 < ^
1 1 1 1 1 1 i 1 1 1 1 1 i i i i 1 1 1 1 1 i i i i*o «o0 0
iv
-~-
—
—
-_
-
—«>
-
~"
V _——
—^\ _
v_^
•o
~0
<N~~
Eu
a>
UJO
»o ^y
"o S1 I
1EC
TRO
N 1
LJJ
•^••
O
n"e-*\
O
Figure 19.- 2 -2- -
The quantity (L - L^ ) vs. fluence for 10-MeV proton- and 1.0-MeVelectron-irradiated bulk silicon specimens and silicon solar cells. Acomparison is made of SSPC, SPV, and Co-60 data.
63

CN
CN CN
E
g £CN £— x 'O"i x^ - CN ^
Z 0> rr = = =< SLU i/> l ) Q if)
'°* • O • . ^rZD CN — O — CN
o:LUD_
r- CN . - .CO >^
OO
ISIO
O D 0 < O
CO
o
CN
O
oO
OO -O "o d c>
NOIlOVdd Q31V3NNVNn
CM•o
Figure 20. Unannealed fraction vs. time at room temperature for irradiated bulksilicon specimens.
64

o = = = o -
O D 0 < O > _
CO
o
CN
O
oo
CN 00 -O "d d o
NOIlOVdd Q31V3NNVNn
CNC)
Figure 21. Unannealed fraction vs. time at room temperature for irradiated bulksilicon specimens.
65

the three other FZHD 0. 1 specimens studied exhibited more recovery at500 h than the other material types. Very little reverse annealing wasobserved.
Figure 22 presents data for samples annealed at 60 C. After 500 h, sixout of the seven samples have recovered somewhat, with an FZHD 0. 1sample once again exhibiting the most annealing. Reverse annealing wasevident for one specimen (CZLD 0. 1/10).
It should be noted that data in Figures 20 through 22 are for samples withdiffering irradiation histories. For certain samples, a plot of the quantity(L~ - LQ ) versus fluence would reveal that irradiations for these speci-mens were discontinued at a fluence in a region of linear degradation. Forother samples, irradiation was discontinued in a saturation region andmeasured diffusion length was most likely influenced by trapping (see Section4. 3). In spite of these sample differences, with only one exception strongvariations in annealing behavior among the eighteen samples of Figures20 through 22 are not apparent.
4. 6 Solar Simulator Results for Irradiated Cells
Figure 23 presents data showing the degradation with fluence of short-circuit current (Isc), open-circuit voltage (VQC), and maximum poweroutput (Pmax) for a 0. 5-MeV electron-irradiated 9 ohm-cm CZ solarcell. Data were obtained using a solar simulator, as discussed in Section2. 1, and are normalized to pre-irradiation values (I__, , , V , and ?__._„._)
SCO **•* v U • Jllct-?COof the cell parameters obtained from current-voltage characteristics. Pre- -irradiation cell properties are given in Table VII. The cell thickness for CZ 9/SC2was 0. 0285 cm. Downing's data " indicate that a }-MeV electron is~3. 7 times as effective in degrading an n-on-p solar cell as a 0. 5-MeVelectron. Upon referring to the Solar Cell Radiation Handbook, H it isseen that for a 7-13 ohm-cm cell of the thickness employed here, Idegrades to ^86% of its pre-irradiation value at a fluence of 8. 1 x 10 ^1-MeV electrons /cm (refer to Figure 3. 11 of Reference 11). At a fluenceof 3 x 10 0. 5-MeV electrons/cm , which is 3. 7 times the 1-MeV fluencejust given, Figure 23 reveals that Isc has degraded to 85% of its initialvalue. This agreement between data given in Reference 11 and the presentfindings suggests that the fluence measurements for 0. 5-MeV electron ir-radiations were accurate in the current investigation. (Good agreementis also found when the above calculation is performed for V and P . )
oc max
Figure 24 presents data exhibiting the degradation of short-circuit currentwith fluence for 1-MeV electron-irradiated solar cells of several resis-tivities. Corresponding plots for open-circuit voltage and maximum poweroutput are shown in Figures 25 and 26, respectively. The thickness of
66

1.2
1.0
0.8
o<CeL
OLU
0.6
0.4
0.2
0
TTTf \ \
60 C ANNEALING
O FZLD 0.1/10 1.0 MeVD ii /| 9 10 ii
OFZHD 0.1/12 i.o "V ii /22 10 ii0 CZLD 0.1/10 1.0 "0 » /19 10 iiA CZHD 0.1/9 1.0 "
3xl014e/cm2
1.19xl012p/cm2
Ixl014e/cm2
2.92xlOnp/cm2
3xl013e/cm2
9.91xl010p/cm2
1 x 10¹⁵e/cm2
J I
101 1/%2
TIME (hours)10
Figure 22. Unannealed fraction vs. time at 60 C for irradiated bulk silicon specimens.
67

1 I I I -
— -
< n o
r < D o -- —
i
- <G 0
oXra
o o E<&O CN o b? °- —I > o > — \ -
o> co v. s — x -
^ ^ o £ E
6 0 < D O
DO
I I I lD ^ °0 fx «O ^• • -» • •o o o o c
o"b~~ c
o•4^
o
1in
o
«O
'o ^o
-^ (!) .CN 3
0
"\- ra
, w. h
+j
s *** z 2"g w . a« » i-H
— ' T31 1 y
rt '8'o 3
w T)
> "rt
J5 «J
« .S
o 5-• (1)
^ sSN313WVyVd 1133 dVlOS 3AllV13d ^
68

o>
<DCX1
o> OKD<
CN _ CM CNO O O OCO CO CO CO
>O>
-oexo
_
M M M M Nl N" u_ u- 0 0 0 0
S O D O < > O
1 1
ao so
•0
'b
CM
I
CO^"
O
c5 oODSj /OS |
Figure 24. The quantity !/!,,„ vs. fluence for 1. 0-MeV electron-irradiated siliconsolar cells. SC SC°
69

0o
:-
~^*
—
_
^
-
-
—
CsQ 4
-
1 I I 1 1 I I 1 1 -
~
<oo &
fll O ^> ~
•
'
<OO 0 > -
-
CN _ CM CMO O O O CNCO CO 00 CO 0 _
<D O -'iO*\\\o ~dddou^ I
> o o o ° CN O^0> _l DI — I Z^ M M M M M M*=• u_ u_ o O O O
<**» 2 0 nO< >0-
I I 1 1 1 1 I I I
•" -u1 — rt)• r-l
73nJ?Ht .H
• H
1fHP
0h
4-> •o •<u1>>a)
«n 5' r$
'O ci
i— (
t-t •O
<N ^
g «•
\ so> S.~ CUU co
z•* °Z i-tJ oO ZD >
^ i "g>tx
.•S M-t-" —i
§1tf h
0) <tf
^ "0H w
n . .'—^ ID,O CM
D O ' . ' CO """ . £d d g,
o
ODOA/DOA
70

OO-OO
Oa< o
O
O <DO
CN ,_ CM CMO 0 0 0 CM
0>
006
M M M M M Mu- LL. O O O O
o no < >o
1
o"o
«o
CN
E<_>
O
CO
'o00o d / c>
OXBLUj /XBUJj3
Figure 26. The quantity Pmax/PmaxQ vs . ' f luence for 1.0-MeV electron-irradiatedsilicon solar cells.
71

device CZ 9/SC3 is 0. 0307 cm, and by comparing the present findings withexpected behavior for cells irradiated with 1-MeV electrons, good agree-ment is found, which once again suggests that fluence measurements wereaccurate. Figure 24 reveals that I degraded to ~62% of its pre-irradiation
1 c ""? St.value at 3 x ID1-* e/cmr for 0. 1 ohm-cm cells, as compared to ^75% forhigher-resistivity units. For low-resistivity devices, no dependence ofI degradation on dislocation density is apparent,s c
Figure 25 shows that V degraded to ~ 88% of its initial value for CZ 2.5 andCZ 9 cells at 3 x 10*-* e/cm^, whereas the corresponding value for low-resis-tivity cells is ~ 91%. In Figure 26, it is seen that in terms of normalizedmaximum power output higher resistivity cells are superior. For such units,at 3 x 10-15 e/cm^ P,_.__ /P = 0. 65, whereas the low resistivity value is
iTlclX IJ-J.3.XQ~ 0. 53. (The one CZLD 0. 1 cell tested appears to be slightly superior to theother 0. 1 ohm-cm cells; however, in terms of absolute power output, this unitis actually inferior to the others.) Thus, solar simulator findings are con-,sistent with damage coefficient determinations reported above in that low- .resistivity solar cells are inferior to higher resistivity units in terms ofradiation tolerance.
Figure 27 presents degradation of solar cell parameters with fluence fora 2. 5-MeV electron-irradiated 9 ohm-cm device with a thickness of 0. 0302cm. Downing's data ' indicate that a 2. 5-MeV electron is ^4. 1 times aseffective in degrading an n-on-p cell as a 1. 0-MeV electron. Upon takingthis difference into account and then comparing the data of Figure 27 withthat in the Radiation Handbook in a manner similar to that employedabove for 0. 5-MeV electrons, good agreement is found. This agreementagain suggests accurate dosimetry for the present electron irradiations.
Figure 28 presents the degradation of short-circuit current with fluencefor 10-MeV proton-irradiated solar cells of two resistivities (0. 1 and2. 5 ohm-cm). Corresponding plots for open-circuit voltage and maximumpower output are shown in Figures 29 and 30; respectively. As a checkon fluence accuracy, consider data for 2. 5 ohm-cm cells. Data in theRadiation Handbook^ (see Figure 3. 6 of this reference) indicate that a10-MeV proton fluence of 3 x 10*1 p/cm will degrade Isc by the sameamount as a 1-MeV electron fluence of 2 x 10^ e/cm. . From Figure28, -we find that Isc for CZ 2. 5 cells degrades to '°0. 79 of its initialvalue at 3 x 10 p/cm . From Figure 24, interpolation yields ~0. 76for this same quantity at 2 x 10*^ e/cm for a 1. 0-MeV electron-irradi-ated CZ 2. 5 cell. This agreement suggests that fluence determinationsfor 10-MeV proton irradiations were accurate.
Figure 28 indicates that normalized I degrades more severely for 0. 1 ohm-cmcells than for higher-resistivity units. However, as shown in Figure 29,the opposite is true for V degradation. In Figure 30, it is seen that
72

o
o
< D O
CM o D O
I _L _L
CN
Eo
CO
"bCS 00o o o c5
nao avios«Oc5
Figure 27. Relative solar cell parameters vs. fluence for a. 2. 5-MeV electron-irradiated unit.
73

1.0
0.9
0.8
oo
0.6
0.5
0.4
07
10 MeVO FZLD 0.1/SC4n FZHD0.1/SC2O CZLD 0.1/SC3A CZHD 0.1/SC3V CZ 2.5/SC30 CZ 2.5/SC4
1011
FLUENCE (p/cm2)
0v
1012
Figure 28. The quantity I /I vs. fluence for 10-MeV proton-irradiated silicon. „ sc sco
solar cells.
74

1.0
oo
>°0.9
oo
0.8
10 MeVO FZLD 0.1/SC4° FZHD0.1/SC2O CZLD 0.1/SC3A CZHD O.J/SC3V CZ 2.5/SC30 CZ 2.5/SC4
1011
FLUENCE (p/cm2)
«T
0v
1012
Figure 29. The quantity V /V vs. fluence for 10-MeV proton-irradiated silicon, ,, oc ocosolar cells.
75

I.U
0.9
0.8
oX03
E0-0.7\
X03
EQ_
0.6
0.5
n A
i i i 1 i i i
10OD
I 1 1 1 1 1MeV
FZLD 0.1/SC4FZHD0.1/SC2
OCZLD0.1/SC3Av
CZHD 0.1/SC3CZ 2.5/SC3
& OCZ 2.5/SC4
iy
- vV
O
-
i 1 1 1 1 1 1 1
-
-0
o
1 1 . 1 1 1 1
1011 1012
FLUENCE (p /cm 2 )
Figure 30. The quantity P /P vs. fluence for 10-MeV proton-irradiatedmax maxo .
silicon solar cells.
76
for three out of the four low-resistivity cells examined. P /p was1 max' maxosomewhat less than for 2. 5 ohm-cm cells which is consistent with expecta-tions based on K,_ determinations. For CZLD 0. 1/SC3 this quantity wasidentical to that for CZ 2.5/SC3. However, in terms of absolute quantities(use Table VII in conjunction with Figure 30), the power output for CZLD0. 1/SC3 was the lowest of all six cells shown in Figure 30. (Caution must beexercised in interpreting the normalized data of Figures 23 through 30. )After 1.2 x 10^ protons/cm^, none of the four low resistivity cells had amaximum power output as large as that for the two CZ 2.5 devices.
77

SECTION 5.0
DISCUSSION AND CONCLUSIONS
One finding of practical importance in the present investigation is the observa-tion of damage coefficients that increase with decreasing resistivity (p) over abroad range of resistivities. The employment of low-resistivity solar cells ina space radiation environment therefore may not be advisable. However, whetherlow-resistivity cells may or may not be advantageously utilized in space applica-tions will depend on both the amount of radiation-induced degradation anticipatedand the pre- irradiation properties of such devices compared to those for higher-resistivity units. The obtaining of a basic mechanistic understanding of theresistivity dependence of Ky is an intriguing question that has been addressedby others. '' We have also attempted to understand such behavior, and ourpreliminary analysis is now given.
For all three electron energies examined, empirical fits to the data yield thefollowing approximate relation:
. KL« p-2/3 . (16)
Hole density po was determined for p-type material over the resistivity rangefrom 0. 1 to 10 ohm-crru Additionally, damage coefficient is proportional to(L - LQ ), which can be interpreted as the reciprocal of radiation -inducedcarrier lifetime T. Thus, KT « I/ T. Equation 16 was then employed toobtain a plot of T vs p, which is shown as the solid curve in Figure 31. Thiscurve is thus representative of the experimental data obtained here for threeelectron energies. ~
We next attempted to fit the solid curve using the Hall-Shockley-Read (HSR)model. The HSR lifetime expression for a single recombination level in p-type material at low injection levels is
P o + P l n + n
T = c Np c Npn o p o
where all terms have their usual meaning. As po increases, lifetime decreasesdue to the increased recombination rate. For ease of analysis and for purposesof illustration, a recombination level in the lower half of the bandgap was as-sumed. For any reasonable capture -probality- ratio assumed, Equation 17 thensimplifies to
n
We attempted to fit Equation 18 to the solid curve in Figure 31 by treating themultiplicative term 1/c N as an adjustable scale factor. A reasonable fit was
78

10
o>>
(O
o>
= 10'
<o
\
1015
\
\
I I I I I I I I I 1 I I I I I
- EMPIRICAL FIT TO DATA(CORRESPONDS TO K LCX p~2/3 )
---- p^SxlO^cm"3, E r -E y = 0.08eV
16
\\ PI= 1x10'° ' =0.1 8 eV
T, AND T2 ARE ASSUMED TO
BE PROPORTIONAL TO 1 + "
I i i I i i i 11 i I i i i I i 11 I I16
10
HOLE DENSITY, p n ( c m
1017
Figure 31. Radiation-induced lifetime vs. hole density. It is demonstrated thatrecombination through two Hall-Shockley-Read levels can be employedto qualitatively explain the observed dependence of damage coefficienton resistivity for electron-irradiated boron-doped silicon. The re-combination levels given here are not unique to the experimental dataand are presented for purposes of illustration only.
79

obtained for a level at E - E — 0. 12 eV. However, an exact fit can be ob-tained by using a two-level HSR model, as shown in the figure. By assumingthat each level can be expressed in the form of Equation 18 and by adding thecontributions of each level reciprocally to obtain T, the solid curve represent-ing the experimental data can be fit exactly. As shown in Figure 31, the levelmore effective for higher resistivities is at Er - E — 0. 18 eV, whereas thelevel more effective at lower resistivities is at Er - E 2= 0. 08 eV. The ratioof the multiplicative scale factors for these two levels is ~ 22, with c N for the0. 18 eV level being larger.
No physical significance should be attached to the above recombination param-eters. Levels in the upper half of the bandgap could be effective and/or threeor more levels may be effective rather than only two. (It should be noted thatfor the two-level model employed here, a satisfactory fit to the data requiresa shallow level close to either the valence band or the conduction band. ) Ourpurpose here was only to illustrate that a two-level HSR model describes thepresent data quite well. In order to obtain meaningful parameters from such amodel, the temperature and injection-level dependences of radiation-inducedlifetime are required. ^°» ^ Wilsey^" has examined the temperature dependenceof Kj^ for electron-irradiated p-type silicon, and it is clear that a one-levelmodel cannot account for his data. This statement can also be made for findingsof Faith. ^O j^ terms of gaining increased understanding of the dependence ofKT on resistivity, it would be useful to measure the temperature and injection-level dependences of damage coefficient for samples of several resistivitiesand then attempt to fit the data with two (or more) HSR levels.
Several of the major observations made and conclusions reached in this in-vestigation are the following:
1. Diffusion-length damage coefficients increase with decreasingresistivity for boron-doped silicon. For low-resistivity solarcells, this decrease in radiation tolerance must be weighedagainst potential advantages when considering such devices forutilization in a space radiation environment.
2. For 0.5-, 1.0-, and 2. 5-MeV electron bombardment, empiricalfits to experimental data can be approximately expressed asKT ^ P ~ 2 / 3 for 0. 1^ p^ 20 ohm-cm. For 10-MeV protonbombardment, an empirical fit of the form KT oc p~ • -was
I i
found to describe the data reasonably well.
3. The dependence of damage coefficient on resistivity can bequalitatively accounted for quite well using a two-level Hall-Shockley-Read model.
4. Damage coefficients for solar cells were observed to be largerthan their bulk-material counterparts.
80

5. Bulk samples and solar cells prepared from float-zone materialwere generally observed to be more radiation tolerant than theirCzochralski counterparts at all resistivities examined.
6. No dependence of damage coefficient on dislocation density wasapparent for 0. 1 ohm-cm bulk samples and solar cells.
Regarding item 4, during the final stages of preparing this report a comparisonwas made of measured pre-irradiation diffusion lengths for bulk samples andsolar cells fabricated from the same ingot. Bulk values were found to be a factorof 1. 7 ± 0. 3 larger than their device counterparts. This value is an averageobtained by comparing 110 bulk samples and 33 solar cells fabricated from7 ingots. Referring to Equation (1), it is seen that if pre- and post-irradiationvalues of diffusion length for a given bulk sample were a factor of 1. 7 largerthan the corresponding solar-cell values, then the solar cell K-^ value wouldbe a factor of 2. 9 larger than the bulk damage coefficient (assuming equalfluences). This latter factor is comparable to solar-cell-to-bulk-materialdamage-coefficient ratios experimentally observed in this study, which suggeststhat a systematic error is responsible for the device-bulk differences noted.
Several items that should be considered when attempting to quantitativelyaccount for the observed discrepancy are: a) surface photovoltage diffusion-length measurements were found to be in reasonable agreement with SSPCmeasurements on two bulk samples with relatively long diffusion lengths (referto Section 4.4); b) the present 1.0-MeV solar-cell damage coefficients are inreasonable agreement with those obtained by other workers (refer to Figure 11);c) the fluence dependence of KT for solar cells noted here and also by otherworkers is in a direction to bring device and bulk damage coefficients intoagreement at high fluences; (this statement assumes that bulk K-^ values arenot fluence dependent); d) accurate determination of the generation rate in apenetrating-radiation diffusion-length measurement for solar cells is notstraightforward. We presently suspect that previous workers and ourselveshave not properly accounted for all of the important factors in penetratingradiation solar-cell measurements. Some of the difficulties associated withdetermining the generation rate for a gamma-irradiation diffusion-length measure-ment have been previously considered. ' It seems clear that additionalwork will be required to obtain a satisfactory explanation for observed device-bulk differences.
81

APPENDIX
STATISTICAL ANALYSIS OF DATA*
Electron Damage Coefficients
The present study has examined radiation effects on four types of 0. 1 ohm-cm boron-doped silicon ingots, including the four possible combinations ofhigh and low oxygen content and high and low dislocation density. Forelectron-irradiated specimens, Figures 9, 11, and 13 indicate that thereis no significant dependence of damage coefficient on dislocation density.However, a dependence of KT on growth method (i. e. , oxygen content) isevident. In this section, an attempt is made to quantitatively examine thestatistical significance of the dependence of electron damage coefficient onoxygen content (OC), dislocation density (DD), and electron energy (EE).Additionally, the dependence of pre-irradiation diffusion length on oxygencontent and dislocation density is examined.
Statistical analyses were performed by utilizing analysis of variance pro-cedures outlined by Hicks. 40 por each 0. 1 ohm-cm ingot type at a givenelectron energy, values of KL for three individual samples were employed.Table XIII lists damage coefficients used in the present analysis. Thistable is arranged in a matrix corresponding to the four possible materialcombinations. (We associate a low oxygen concentration with float-zonematerial and a high oxygen concentration with Czochralski material. ) Threevariables, or factors, are of interest here: oxygen content, dislocationdensity, and electron energy. The first two factors were examined experi-mentally at two levels and the last at three levels. This situation is termeda 2 x 2 x 3 factorial experiment with three replications per cell.
The damage coefficients in Table XIII are summarized in a format usuallyassociated with factorial designs. Because of the wide range of valuesobserved (almost two orders of magnitude) and observation of the fact thatthe standard deviation of the three numbers in each box is proportional tothe absolute value of the numbers, the logarithms of the damage coefficientswere calculated. These are also listed in Table XIII. A second reason forthis approach is that the analysis of variance statistical procedure requiresthat the error variance of each observation be equal. This is much moretrue of the logarithms than of the actual K^ values.
^Analysis presented in this Section was performed by S. M. Sidik andC. R. Baraona of NASA-Lewis Research Center.
82

0. 5 MeV
1. 0 MeV
2. 5 MeV
FZLD
4.44(0.65)
4.13(0.62)
4. 00(0.60)
42.8(1.63)
42.8(1.63)
42.8(1.63)
194(2.29)
173(2. 24)
176(2.46)
FZHD
4. 75(0.68)
4.20(0.62)
4.20(0.62)
45.6(1.66)
38.2(1.58)
38.2(1.58)
196(2.29)
188(2.27)
200(2 .30)
CZLD
14.0(1.15)
14. 0(1.15)
13. 3(1.12)
72. 0(1.86)
72. 0(1.86)
67. 0(1.83)
220(2. 34)
261(2.42)
241(2.38)
CZHD
11.9(1.08)
11.2(1.05)
10.2(1.01)
85. 0(1.93)
85. 0(1.93)
67. 0(1.83)
237(2.37)
228(2.36)
249(2. 40)
TABLE XIII
Damage coefficients obtained at three electron energies forsamples from four 0. 1 ohm-cm B-doped Si ingots. All damagecoefficients listed are in units of electrons" and should bemultiplied by 10 . Numbers shown in parentheses are thelogarithms of the listed damage coefficient values.
83

Table XIV presents results of the analysis of variance for the data (logarithms)of Table XIII. Listed are the sources of variability in the experiment, thedegrees of freedom, the observed mean squares, the expected mean squares,the calculated F ratio test statistic, the standard table value of the F statistic(95% confidence level), and the resulting significance of each source of variancein the experiment.
Table XIV is divided into three parts by horizontal lines. This emphasizesthe structure of the expected mean squares, because these structuresdetermine which F tests should be used. For instance, the expected meansquares for EE, OC x EE, DD x EE, and OC x DD x EE are all of the form<7g plus one other source of variability, where CT| is the error variance.Their significance may thus be tested by dividing those mean squares by theerror mean square. These F statistics indicate that EE and OC x EE arehighly significant (values far outside of most tables) and that DD x EE andOC x DD x EE are marginally significant at the 95% confidence level.
The part of the table corresponding to OC, DD, and OC x DD is somewhatdifferent. The expected mean squares are all of the form d^ + 9a? plusone other source of variability. The symbol a| denotes the variance ofdamage coefficients resulting merely from using different ingots. Thesemean squares should be tested by dividing by a mean square which has anexpected value of de + 9cr? , but there is no such estimator available in thepresent experiment. The only alternative available is to assume there isno interaction between DD and OC. In this event, OC and DD may be testedfor significance by dividing the mean squares by the mean square for theDD x OC interaction. This was done and shows that OC is highly significantand that DD is highly in significant. In Figure 32, average values of damagecoefficients in Table XIII are plotted versus electron energy, and the trendof the data graphically verifies the statistical results.
Pre-Irradiation Diffusion Length
For the same four ingots discussed above, p re-irradiation diffusion lengthsfor 18 samples of each were statistically examined in a 2 x 2 factorialexperiment. (See Table VI for numerical values of diffusion length.") Asin the damage coefficient analysis, because of the manner in which thedata were obtained there is no direct test for the effect of OC, DD, ortheir interaction. If the interaction is assumed not to exist, then DD andOC may be tested for significance by computing the ratio of their sumsof squares and the interaction sum of squares. This was done and it wasfound that neither DD nor OC have a significant effect. This result maybe due either to the fact that OC and DD do not, in fact, have any significanteffect, or to the possibility that there is indeed an interaction between the
84

mo
« oor-l , „
- oo
j
0
-4->n)i — i
U
U
Expecte
d
Mean
Ob
se
rve
dM
ean
'oto<u0)
tuO
Q
MH
O
CO0)a
1
CUo
fie a
n• H
bo• HCO
<Ut— 1
rt
0
iti
h
Sq
ua
res
Sq
ua
res
aot30)0)Mh
snS
•iH
rf
A 0)bo fl
Prt Ot-M ^j
r— 1 r— 4
vO vOr-H 1— 1
vO O
•^ V
oo <J oj PQ
oo ooi—4 I— 1
00-0 00 "3b b
oo w oo wb b
O .-4t^ ovO OxO O
0 0
t—l 1—t
• < B"^ G" c Q
0 oP4J _j k_
rl T^J *y *^
bo -S O co
^ 0 *2 S0 U P P
O"
-
1I
i
PQoo <;
D
4-
00 <•>D
mt — ioo
o
I— 1
«~QQXUO
,£bO
ffi
.CO
O•
ooovO
oo Uboo1—4
r o wb
00CO00m
SO
oo
_
~ W
fi v-'g >,£ be
iu «
W W
bo
s
,
CO
.i— io
O
V
oo wb
mmoo
o
00
O
*
WWXUO
"rt.sbO
rt
..
•<*0
CO
oor-
oo
Uoo PQ
bvO
oo wb
0.
00
25
59
oo
UPQ.
WHXQQ
"rt.sbO
n)
^^
.CO
oo
O
00 <JbCO
oo wb
0.
00
64
97
oo
UPQ
WW
QQXUo
CO4->fl0)
• HO
Ooo
113
I
o
o0)
i~4(1)
V4
oto1
•H
fl)bOo
1— 1
> v1— 1 lAx *•
w ^oo w i-1 ^
b pQ <u<tj o
E-< cd• H
ni>
CT^ *O
S MO .HO CO
0 rt!
1— 1nt
^ 't!00 X
ort»H
°xoo
00
OCO4Ji— 1
So «jhw
3
1H
T)(U
COS
85

Co
oo>0>
-910
O -100 10UJO
-1110
0
A FZLD 0.1
O —- FZHD 0.1O CZLD 0.1n CZHD 0.1
DATA POINTS AREAVERAGE VALUES
0.5 1.0 1.5 2.0ELECTRON ENERGY (MeV)
2.5
Figure 32. Average damage coefficient vs electron energy for four0. 1 ohm-cm B-doped Si ingots. Average values are basedon the data listed in Table XIII.
86

two factors. If the latter were the case, then these tests would not be assensitive as they should be. Therefore, no definite conclusion can be madeconcerning these factors.
One conclusion can be drawn, however. The ratios of the mean squaresdue to OC, DD, and OC x DD were calculated and all were found to behighly significant. This indicates that there are significant differencesamong the four ingots with regard to pre-irradiation diffusion length (whichis obvious from the data in Table VI). This occurs because the error meansquare estimates the variability of diffusion length among samples withinan ingot while the mean squares due to OC, DD, and OC x DD estimate thevariability among different ingots. It is not possible to state the cause ofthe difference on the basis of the present experiments.
Pre-irradiation data in Table VI suggest, on the surface, that oxygencontent has a strong effect on diffusion length. However, past experienceindicates that this is not necessarily the case. Lifetime (or diffusionlength) is determined by the number and type of recombination centerspresent. In order to test properly for the dependence of pre-irradiationlifetime on oxygen content and dislocation density, all other propertiesfor the ingots examined would have to be the same. Two factors that canaffect lifetime include the impurities present in a given ingot (other thandopant concentration) and heat treatment history. For the present four-ingot comparison, one would have to characterize each in considerabledetail and determine what properties are different other than dislocationdensity and oxygen content. Additionally, in an ideal experiment one wouldhave to study a large number of ingots. In the absence of a detailed ingotcharacterization and because of the limited number of ingots employed,one cannot make a definite conclusion regarding the effect of oxygen ordislocation density on pre-irradiation diffusion length based on the presentstudy.
87

REFERENCES
1. H. W. Brandhorst, Jr. , in "Conference Record of the Ninth IEEEPhotovoltaic Specialists Conference, " (held in Silver Spring, Md. ,May 2-4, 1972) Catalog No. 72 CHO 613-0-ED, p. 37.
2. Annual Book of ASTM Standards, Part 8, F-28-66, pp. 515-521 (1970).
3. O. L. Curtis, Jr . , and R. C. Wickenhiser, Proc. IEEE 53^, 1224(1965).
4. R. Gremmelmaier, Proc. IRE 46_, 1045 (1958).
5. W. Rosenzweig, Bell Sys. Tech. J. 41, 1573 (1962).
6. J. H. Reynolds and A. Meulenberg, Jr. , J. Appl. Phys. 45, 2582(1974).
7. A. M. Goodman, J. Appl. Phys. 32_, 2550 (1961).
8. S. C. Choo and A. C. Sanderson, Solid-State Electronics 13, 609 (1970).
9. W. E. Phillips, Solid-State Electronics J_5, 1097 (1972).
10. W. R. Thurber and W. M. Bullis, AFCRL-72-0076, Jan. 31, 1972.
11. J. R. Carter, Jr., and H. Y. Tada, "Solar Cell Radiation Handbook, "JPL Contract No. 953362, 28 June 1973.
12. F. Larin, Radiation Effects in Semiconductor Devices (Wiley and Sons,Inc. , New York, 1968).
13. A. Many, Y. Goldstein, and N. B. Grover, Semiconductor Surfaces(North-Holland Publishing Co. , Amsterdam, 1965), p. 259.
14. J. C. Irvin, Bell System Tech. J. 4^, 387(1962).
15. J. S. Blakemore, Semiconductor Statistics (Pergamon Press, Oxford,1962).
16. S. M. Sze and J. C. Irvin, Solid-State Electronics J_l_, 599(1968).
17. K. B. Wolfstirn, J. Phys. Chem. Solids j^, 279 (I960).
18. M. Neuberger and S. J. Welles, "Silicon", EPIC Report DS-162,Oct. 1969 (Air Force Materials Laboratory Contract No. F33615-68-C-1225).
19. A. J. R. de Kock, Appl. Phys. Lett. JjS, 100 (1970).
20. A. J. R. de Kock, J. Electrochem. Soc. 118, 1851 (1971).
21. T. F. Ciszek, in Semiconductor Silicon, H. R. Huff and R. R. Burgess,Eds. (The Electrochemical Society, Princeton, 1973) pp. 150-160.
88

REFERENCES (cont. )
22. O. L. Curtis, Jr . , Phys. Rev. 172, 773 (1968).
23. O. L. Curtis, Jr., and J. R. Srour, J. Appl. Phys. 45, 792 (1974).
24. J. A. Baker, Final Report on NASA-Lewis Contract NAS3-17356,Nov. 1973.
25. J. A. Baker, private communication.
26. R. L. Statler, Proc. 1968 Intersociety Energy Conversion EngineeringConference, Boulder, Colo., p. 122.
27. D. J. Curtin and A. Meulenberg, in "Conference Record of the EighthIEEE Photovoltaic Specialists Conference, " (held in Seattle, Wash. ,Aug. 4-6, 1970) Catalog No. 70C 32 ED, p. 193.
28. A. Meulenberg, Jr. , and F. C. Treble, in "Conference Record of theTenth IEEE Photovoltaic Specialists Conference, " (held in Palo Alto,Calif., Nov. 13-15, 1973) Catalog No. 73CH0801-ED, p. 359.
29. R. G. Downing, J. R. Carter, Jr. , and J. M. Denney, in "Proceedingsof the Fourth Photovoltaic Specialists Conference, " Vol. I, A-5-1,1964.
30. T. J. Faith, IEEE Trans. Nucl. Sci. 20, 238 (Dec. 1973).
31. B. E. Anspaugh and J. R. Carter, in "Conference Record of the TenthIEEE Photovoltaic Specialists Conference, " (held in Palo Alto, Calif. ,Nov. 13-15, 1973) Catalog No. 73CH0801-ED, p. 359.
32. "J. M. Denney and R. G. Downing, TRW Systems Report 8653-6026-KU-000, July 1963.
33. W. Rosenzweig, F. M. Smits, and W. L. Brown, J. Appl. Phys. 35,2707 (1964).
34. T. Nakano and Y. Lnuishi, J. Phys. Soc. Jap. 1_9, 851 (1964).
35. T. Nakano, K0 Nakasima, and Y. Inuishi, J. Phys. Soc. Jap. 20,2140 (1965).
36. N. D. Wilsey, in "Conference Record of the Ninth IEEE PhotovoltaicSpecialists Conference, " (held in Silver Spring, Md. , May 2-4, 1972)Catalog No. 72 CHO 613-0-ED, p. 338.
37. J. R. Srour and O. L. Curtis, Jr., J.Appl. Phys. 4.3, 1779 (1972).
38. O. L. Curtis, Jr., J. R. Srour, and R. B. Rauch, J. Appl. Phys. 43,4638 (1972).
39. A. R. Frederickson and E. A. Burke, IEEE Trans. Nucl. Sci. 18,162 (Dec. 1971).
40. C. R. Hicks, Fundamental Concepts in the Design of Experiments,(Holt, Rinehart, and Winston, New York, 1964).
89

DISTRIBUTION LIST
NASA
NASA, Scientific and TechnicalInformation Facility
P.O. Box 8757Baltimore-Washington International
AirportBaltimore, Maryland 21240
(40 copies & 1 reproducible)
Mr. Ernst M. Cohn, Code RPPNational Aeronautics and Space
Admini st rationWashington, D. C. 20546
Mr. Simon Manson, Code NTNational Aeronautics and Space
AdministrationWashington, B.C. 20546
Mr. Norman J. Mayer, Code RWSNational Aeronautics and Space
' AdministrationWashington, D. C. 20546
Mr. William R. Limberis, Code KGNational Aeronautics and Space
AdministrationWashington, D. C. 20546
Mr. R. D. Ginter, Code NENational Aeronautics and Space
Admini s t r ationWashington, D. C. 20546
Office of Technology UtilizationCode KT
National Aeronautics and SpaceAdministration
Washington, D. C. 20546
AMES
Dr. Robert J. DebsCode PDS N-244-14Ames Research CenterNational Aeronautics and Space
AdministrationMoffett Field, CA 94035
GODDARD
Mr. Edward M. Gaddy, Code 711Goddard Space Flight CenterNational Aeronautics and Space
Admini str ationGreenbelt, MD 20771
Mr. Charles MacKenzie, Code 711Goddard Space Flight CenterNational Aeronautics and Space
Admini strationGreenbelt, MD 20771
Mr. Luther W. Slifer, Jr., Code 711Goddard Space Flight CenterNational Aeronautics and Space
AdministrationGreenbelt, MD 20771
LEWIS RESEARCH CENTER
Mr. Clifford K. Swartz, MS 302-1NASA, Lewis Research Center21000 Brookpark RoadCleveland, OH 44135
M. T. Musial, MS 500-113NASA, Lewis Research Center21000 Brookpark RoadCleveland, OH 44135
Carl E. Goodwin, MS 500-206NASA, Lewis Research Center21000 Brookpark RoadCleveland, OH 44135
NASA, Lewis Research Center21000 Brookpark RoadCleveland, OH 44135Attn: Library (2 copies)
90

LEWIS RESEARCH CENTER (cont. )
Mr. Cosmo R. Baraona,MS 302-1 (10 copies)
Lewis Research CenterNational Aeronautics and Spacse
Admini stration21000 Brookpark RoadCleveland, OH 44135
Dr. Henry W. Brandhorst, Jr.MS 302-1
Lewis Research CenterNational Aeronautics and Space
Admini stration21000 Brookpark RoadCleveland, OH 44135
Mr. Larry R. Scudder, MS 302-1Lewis Research CenterNational Aeronautics and Space
Admini stration2100Q Brookpark RoadCleveland, OH 44135
Dr. Louis Rosenblum, MS 302-1Lewis Research CenterNational Aeronautics and Space
Aclmini stration21000 Brookpark RoadCleveland, OH 44135
Mr. Victor G. Weizer, MS 302-1Lewis Research CenterNational Aeronautics and Space
Administration21000 Brookpark RoadCleveland, OH 44135
LANGLEY
Mr. Walter E. Ellis, MS 448Langley Research CenterNational Aeronautics and Space
AdministrationHampton, VA 23665
Mr. Gilbert A. Haynes, MS 488Langley Research CenterNational Aeronautics and Space
AdministrationHampton, VA 23665
Mr. Jack F. Zanks, MS 488Langley Research CenterNational Aeronautics and Space
AdministrationHampton, VA 23665
JOHNSON
Mr. James L. Cioni, Code EPSJohnson Spacecraft CenterNational Aeronautics and Space
AdministrationHouston, TX 77058
MARSHALL
Mr. J= L. Miller, Code EC-12NASA/Marshall Space Flight
CenterHuntsville, AL 35812
JPL
Dr. Bruce AnspaughMail Stop 198-220Jet Propulsion Laboratory4800 Oak Grove DrivePasadena, CA 91103
Mr. Paul BermanMail Stop 198-220Jet Propulsion Laboratory4800 Oak Grove DrivePasadena, CA 91103
Mr. John V. GoldsmithMail Stop 198-220Jet Propulsion Laboratory4800 Oak Grove DrivePasadena, CA 91103
91

JPL (cont. )
Mr. Walter A. HasbachMail Stop 198-220Jet Propulsion Laboratory4800 Oak Grove DrivePasadena, CA 91103
Mr. Lloyd D. RunkleMail Stop 198-220Jet Propulsion Laboratory4800 Oak Grove DrivePasadena, CA 91103
Dr. Richard StirnMail Stop 198-220Jet Propulsion Laboratory4800 Oak Grove DrivePasadena, CA 91103
Mr. R. Gilbert DowningMail Stop 198-220Jet Propulsion Laboratory4800 Oak Grove DrivePasadena, CA 91103
AIR FORCE
AFAPL/POE-2/L. D. MassieWPAFB, OH 45433
SAMSO SAFSP-8P.O. Box 92960Worldway Postal CenterLos Angeles, CA 90009
AFAPL/POW-2/J. F. WiseWPAFB, OH 45433
ARMY
NAVY
Mr. E. L. Brancato, Code 4101Naval Research Laboratory4555 Overlook Avenue, S. W.Washington, D. C. 20375
Mr. Richard L. StatlerNaval Research LaboratoryCode 6603FWashington, D. C. 20375
OTHER GOVERNMENTORGANIZATIONS
Dr. Emil KittlUSAECOMAttn: AMSEL-TL-PEFort Monmouth, NJ 07703
Mr. William R. CherrySolar Research DivisionEnergy Research Development
Administration1800 G Street, NWWashington, D. C. 20545
Dr. Lloyd HerwigSolar Research DivisionEnergy Research Development
Administration1800 G Street, NWWashington, D. C. 20545
Dr. Leonard M. MagidSolar Research DivisionEnergy Research Development
Admini str ation1800 G Street, NWWashington, D. C. 20545
PRIVATE ORGANIZATIONS
Mr. E. R. BerryAerospace CorporationP.O. "Box 92957Los Angeles, CA 90009
92

PRIVATE ORGANIZATIONS (cont. )
Dr. Leon D. GrossmanDow Corning Corporation12334 Goddes RoadHemock, MI 48626
Mr. Larry GibsonAerospace CorporationBox 92957Los Angeles, CA 90009
Mr. H. J. KillianAerospace CorporationBox 92957Los Angeles, CA 90009
Mr. J. A. AlbeckMarketing ManagerAerospace GroupSpectrolab, Division of Textron, Inc.12500 Gladstone AvenueSylmar, CA 91342
Professor Joseph J. LoferskiDivision of EngineeringBrown UniversityProvidence, RI 02912
Dr. James A. NaberIntelcom Rad. Tech.7650 Convoy CourtP.O. Box 80817San Diego, CA 92138
Mr. W. J. BillerbackCOMSAT LabsP.O. Box 115Clarksburg, MD 20734
Mr. Denis Cur tinCOMSAT LabsP.O. Box 115Clarksburg, MD 20734
Dr. Andrew MeulenbergCOMSAT LabsP.O. Box 115Clarksburg, MD 20734
Mr. R. C. LyleExotech Systems,' Inc.1200 Quince Orchard BoulevardGaithersburg, MD 20760
Dr. James McCormickDow Corning Corporation12334 Geddes RoadHemlock, MI 48626
Mr. Kenneth HansonGeneral Electric CompanyValley Forge Space Technology
CenterP.O. Box 8555Philadelphia, PA 19101
Dr. G. H. SchwuttkeIBM, Dept. 267, Bldg. 300-90East Fishkill FacilityHopewell JunctionNew .York, NY 12533
Mr. Robert C. HamiltonInstitute for Defense Analyses400 Army-Navy DriveArlington, VA 22202
Mr. A. D. TonelliDepartment A3-253-MS 13-3.McDonnell Douglas Astronautics Co.Huntington Beach, CA 92647
Mr. A. A. Nussberger, D/191-200, SK09
North American Rockwell Corp.Space Division12214 Lakewood BoulevardDowney, CA 90241
93

PRIVATE ORGANIZATIONS (cont.)
Mr. Isadore M. SachsOptical Coating Laboratory, Inc.P. O. Box 1599Santa Rosa, CA 95403
Mr. Donald C. BriggsWDL Division MS G80Philco-Ford Corporation3939 Fabian WayPalo Alto, CA 94303
Mr. Richard GrantWDL Division MS-Z-31Philco-Ford Corporation3939 Fabian WayPalo Alto, CA 94303
Power Information CenterUniversity City Science Center3401 Market Street, Room 2210Philadelphia, PA 19014
Mr. Paul RappaportRCA CorporationDavid Sarnoff Research CenterPrinceton, NJ 08450
Mr. Henry OmanThe Boeing CompanyResearch and Engineering
DivisionP.O. Box 3999Seattle, WA 98124
Solarex Corporation1335 Piccard DriveRockville, MD 20850
Dr. Gerald L. PearsonStanford UniversityStanford Electronics Labs.Stanford, CA 94305
Mr. Arvin H. SmithThermo Electron Corporation101 First AvenueWaltham, MA 02154
Mr. Hans Rauschenbach, Ml-1406TRW SystemsOne Space ParkRedondo Beach, CA 90278
Mr. Werner LuftTRW Systems Group-MS-Ml/1208One Space ParkRedondo Beach, CA 90278
John D. Me akinAssociate DirectorInstitute of Energy ConversionUniversity of DelawareNewark, DL 19711
Dr. Frederick MorseDepart, of Mechanical EngineeringUniversity of MarylandCollege Park, MD 20742
Professor Martin WolfUniversity of Pennsylvania260 Towne Building - D3Philadelphia, PA 19174
Mr. Peter A. liesCENTRALAB4501 N. Arden DriveEl Monte, CA 91734
Mr. Aaron KirpichElectrical SystemsGeneral Electric CompanySpace SystemsP.O. Box 8555Philadelphia, PA 19101
94

PRIVATE ORGANIZATIONS (cont. )
Mr. Eugene L. RalphHeliotek, Division of Textron12500 Gladstone AvenueSylmar, CA 91342
Mr. J. R. DavisWestinghouse R&DBeulah Road, Churchill BoroPittsburgh, PA 15235
Professor J. R. HauserNorth Carolina State UniversityElectrical Engineering Dept.Box 5275Raleigh, NC 27607
Professor C. T. SahUniversity of-IllinoisUrbana-Champaign CampusDept. of Electrical EngineeringUrbana, IL 61801
Professor S. S. LiUniversity of FloridaCollege of EngineeringDept. of Electrical EngineeringGainesville, FL 32611
Professor F. A. LindholmUniversity of FloridaCollege of EngineeringDept. of Electrical EngineeringGainesville, FL 32611
95