Damage Assessment of a Sixteen Story Building Following ...
8
University of Nebraska - Lincoln DigitalCommons@University of Nebraska - Lincoln Civil Engineering Faculty Publications Civil Engineering 2019 Damage Assessment of a Sixteen Story Building Following the 2017 Central Mexico Earthquake Yijun Liao University of Nebraska - Lincoln Richard L. Wood University of Nebraska-Lincoln, [email protected] M Ebrahim Mohammadi University of Nebraska-Lincoln, [email protected] Kanchan Devkota University of Nebraska-Lincoln Christine E. Wiich University of Nebraska - Lincoln, [email protected] Follow this and additional works at: hps://digitalcommons.unl.edu/civilengfacpub Part of the Structural Engineering Commons is Article is brought to you for free and open access by the Civil Engineering at DigitalCommons@University of Nebraska - Lincoln. It has been accepted for inclusion in Civil Engineering Faculty Publications by an authorized administrator of DigitalCommons@University of Nebraska - Lincoln. Liao, Yijun; Wood, Richard L.; Mohammadi, M Ebrahim; Devkota, Kanchan; and Wiich, Christine E., "Damage Assessment of a Sixteen Story Building Following the 2017 Central Mexico Earthquake" (2019). Civil Engineering Faculty Publications. 157. hps://digitalcommons.unl.edu/civilengfacpub/157
Transcript of Damage Assessment of a Sixteen Story Building Following ...

University of Nebraska - LincolnDigitalCommons@University of Nebraska - Lincoln
Civil Engineering Faculty Publications Civil Engineering
2019
Damage Assessment of a Sixteen Story BuildingFollowing the 2017 Central Mexico EarthquakeYijun LiaoUniversity of Nebraska - Lincoln
Richard L. WoodUniversity of Nebraska-Lincoln, [email protected]
M Ebrahim MohammadiUniversity of Nebraska-Lincoln, [email protected]
Kanchan DevkotaUniversity of Nebraska-Lincoln
Christine E. WittichUniversity of Nebraska - Lincoln, [email protected]
Follow this and additional works at: https://digitalcommons.unl.edu/civilengfacpub
Part of the Structural Engineering Commons
This Article is brought to you for free and open access by the Civil Engineering at DigitalCommons@University of Nebraska - Lincoln. It has beenaccepted for inclusion in Civil Engineering Faculty Publications by an authorized administrator of DigitalCommons@University of Nebraska - Lincoln.
Liao, Yijun; Wood, Richard L.; Mohammadi, M Ebrahim; Devkota, Kanchan; and Wittich, Christine E., "Damage Assessment of aSixteen Story Building Following the 2017 Central Mexico Earthquake" (2019). Civil Engineering Faculty Publications. 157.https://digitalcommons.unl.edu/civilengfacpub/157

1
Damage Assessment of a Sixteen Story Building Following the 2017 Central Mexico
Earthquake
Yijun Liao1, Richard L. Wood2, M. Ebrahim Mohammadi3, Kanchan Devkota4, Christine E. Wittich5
1 Ph.D. Student, Department of Civil Engineering, University of University - Lincoln, NE, USA. 2 Assistant Professor, Department of Civil Engineering, University of University - Lincoln, NE, USA. 3 Ph.D. Candidate,
University of University - Lincoln, NE, USA. 4 Graduate Student Researcher, University of University - Lincoln, NE, USA. 5 Assistant Professor, Department of Civil Engineering, University of University - Lincoln, NE, USA.
ABSTRACT
The 2017 M7.1 Central Mexico Earthquake caused significant infrastructural damage in the Mexico City area. The earthquake
contained a significant pulse in the long period, resulting in numerous buildings severely damaged or collapsed. This paper
discusses a reinforced concrete building which was still partially occupied post-earthquake. The building’s interior walls were
examined to have substantial damage, including some extensive cracking. In January 2018, the authors visited the structure and
collected detailed assessment data. The data collection included ground-based lidar scans and recorded ambient vibrations of
the damaged structure using accelerometers. Eleven scans were collected from the four exterior facades to create a three-
dimensional point cloud of the building. The collected point cloud data were used to measure and quantify the permanent
deformation of the structure at three corners as well as to generate depth maps of two parallel exterior walls. The measurements
based on the lidar point cloud data are accurate with an error of 2 mm at 10 meters, enabling high resolute and accurate
assessments. As for the accelerometers, one setup with sixty minutes of ambient vibrations data collection was performed.
Twenty unidirectional accelerometers were installed on the basement, ground, second, fourth, eighth, tenth and roof floors at
southwest and northeast corners to capture the torsional and translational acceleration structural response. The collected data
can be used to perform system identification throughout operational modal analysis to demonstrate the dynamic and modal
properties of the structures. Both of the lidar and system identification sensing techniques provide essential input to establish
and calibrate a detailed finite element model. The outputs are used to validate through the comparison of modal frequencies
obtained in operational modal analysis method. Besides, the finite element model also provides a detailed response and insight
to understand performance under future earthquakes.
Keywords: Lidar, Deformation quantification, System identification, 2017 Central Mexico Earthquake
INTRODUCTION
The 2017 Central Mexico (Puebla) earthquake occurred at 13:14 local time on September 19, 2017, with a moment magnitude
of 7.1. The focal depth is approximately 50 km and the resulting ground shaking could be felt over the Mexico City area.
Numerous aftershocks in the following days occurred with magnitudes in excess of 4.5. At least 40 structures collapsed during
the earthquake and its aftershock sequence [1]. One representative damaged structure was a residential condo building located
in the Hipódromo neighborhood. Prior to data collection by the authors, the structure was retrofitted for some exterior cracking
and damage. On January 30, 2018, the authors visited the site to characterize the damage by collecting ambient vibration data
and laser scanning using ground-based light detection and ranging (lidar). In this study, the combination of the collected data
through these two platforms allow to characterize the dynamic properties and quantify the structures residual deformation after
the earthquake sequence. Ambient vibrations collected by accelerometers at various levels of the structure were used to estimate
the structure’s vibration behaviors via operational modal analysis [2]. Lidar provides accurate geometry of the structure, which
used to quantify and estimate drift of the structure after the event [3].
FIELD DETAILS
The sixteen-story residence building as showing in Figure 1a is a concrete structure with moment frames in the direction
perpendicular to the roadway, and RC shear walls in the parallel direction to the roadway. The height of the structure is

12th Canadian Conference on Earthquake Engineering, Quebec City, June 17-20, 2019
2
approximately 42 meters, where typically two to four condos are located on each floor. As showing in Figure 1b, the structure
had a footprint of 18 meters by 19 meters. Two elevators and a staircase are embedded at the center of each floor, from the
basement to the top floor, which induces some potential torsional response in the structure. Exterior cracking was described by
the building owner prior to the repair, while interior masonry severe damage was also witnessed by the research team. The
basement columns were examined to have minor cracks, as well as on the ground floor.
(a) (b)
Figure 1. (a) Sixteen-story residence building (courtesy of Google Map) and (b) floor plan drawing.
DATA COLLECTION
Ambient vibration data collection
On January 30, 2018, the authors and research team members collected ambient vibration recordings. During afternoon and
evening hours, 20 accelerometers, operating at 2048 Hz, were installed on seven different floor levels for approximately 60
minutes. Pedestrian traffic and moderate wind velocities primarily cause the excitation for ambient vibrations. As for the setup,
four accelerometers were placed on the northwest and southeast corners at 2nd, 10th and top floors, two accelerometers installed
on the southeast corner of the basement, ground, 4th, and 8th floors. The structure is not absolutely aligned along the cardinal
north direction. Therefore, the accelerometer instruments were installed in the directions parallel (northeast) and perpendicular
(southeast) to the structure. Due to the existing residence occupation during the visit, the authors were not permitted to enter
all floors and access the corners.
Lidar point cloud data collection
Ground-based lidar has been used in structural engineering for various applications. Such applications include measurements,
damage characterization, and deformation quantification due to lidar point clouds high level of accuracy [4]. The output format
is three-dimensional point cloud data, which can be permanently preserved. The accuracy can reach a sub-centimeter level for
small sites or structures [5]. However, the accuracy varies, which is a function of lidar settings, scan distance, and surface
reflectivity. During the site visit and due to equipment availability, the lidar scan dataset was collected in the evening of
February 1, 2018. Thirteen scans were collected by a Faro Focus3D s150 lidar scanner from all sides of the structure considering
the accessibility in the built-up urban environment. For the lidar scanner settings, the vertical angular area is 90° to -60°,
horizontal angular area ranged from 50° to 180° due to the coverage, occlusion, and selected scan locations. The resolution and
quality settings were set as 1/4 and 4x. Since the data was collected in the late evening, no color information (RGB indices)
was collected. The scan locations are shown in Figure 2a. For the scan registration procedures, 4-6 correspondences between
each two closest scans were needed to be manually picked as an alignment reference. Objects such as points, slabs, spheres,
planes, etc. can be identified as targets for referencing the corresponding scans. After forcing the correspondences between
scans, target-based and cloud-to-cloud alignments were applied to tighten the registration. As a result, the registered point cloud
is displayed in Figure 2b, the overall mean registration error was at a sub-centimeter level of 6.5 mm.

12th Canadian Conference on Earthquake Engineering, Quebec City, June 17-20, 2019
3
(a) (b)
Figure 2. (a) Lidar scan locations, (b) Isometric view of registered point cloud colorized by intensity.
STRUCTURAL ASSESSMENT
Previous Work
One of the more popular nondetective techniques for structural health monitoring is the use of ambient vibrations to conduct a
system identification, an estimation of the modal properties [6][7]. While this is popular, it does not provide a full diagnosis of
the structure. The ability to collect various data typologies including point clouds and vibrations has shown to be an effective
technique for objective damage detection [8]. Specifically from the point clouds, the structural residual drift and surface defects
can be quantified and related to the estimated modal properties [12]. One example of this application is in Wood et al. [7]. In
this study, the authors performed system identification and a quantified damage assessment on a five-tiered pagoda style temple
in Nepal post-2015 Gorkha Earthquake using ambient vibrations, lidar, and a model-updated finite element model. In this study,
the authors computed the first three excited modes and noted a nearly 16.8% period elongation in the fundamental mode, in
comparison to pre-earthquake data. Complementary to the vibration, lidar point clouds were also collected for accurate
dimensions measurement due to the lack of structural plans, as well as damage characterization. The point cloud was analyzed
for global deformation via torsional drift estimates and local deformation via quantification of the spalling and cracks in the
first floor using a pattern recognition algorithm.
Identification of natural frequencies
Specific to this study, the entire 60 minutes of recording were used for the preliminary assessment to estimate the natural
frequencies and operational deflected shapes. Initially, the data was filtered and subdivided to minimize the uncertainties via
spectral averaging. For each channel, the acceleration time histories was first downsampled to 256 Hz and filtered in the
frequency range of 0.2 Hz to 4 Hz, matching the range of interest for this structure. The overall structural modal natural
frequencies were identified initially by peak picking method. The natural frequencies were able estimated as 0.458 Hz, 0.773
Hz, 1.079 Hz, 1.673 Hz, 2.983 Hz, and 3.416 Hz. Out of all of these modes, only mode three demonstrates a torsional response
while the other five modes are translational-dominated in nature.
Due to the complexity of loading conditions, ARTeMIS software is used to perform the system identification process.
ARTeMIS software is a commonly utilized software for system identification processing [13], which incorporates the stochastic
subspace identification (SSI) method. The first six modes are identified and shown in the stability diagram in Figure 3. Table
1 and Figure 4 summarize the identification process, including the operational deflected shapes which are commonly akin to
mode shapes. Note while the values are damping are reported in Table 1, these values may not represent the observed of
damping present during the moderate level accelerations. Comparing the deflected shapes in Figure 4, it can be summarized
that mode three and mode four have higher amounts of energy in the stabilization diagram.
12th Canadian Conference on Earthquake Engineering, Quebec City, June 17-20, 2019
4
Figure 3. Modal natural frequencies estimation.
Table 1. ARTeMIS identified modes.
Mode Frequency (Hz) Damping (%) Complexity (%) Motion
Mode 1 0.458 2.218 1.001 Translation parallel to roadway
Mode 2 0.773 2.389 1.648 Translation perpendicular to roadway
Mode 3 1.079 1.968 1.320 Torsional
Mode 4 1.673 3.075 1.184 Translation parallel to roadway
Mode 5 2.983 2.888 2.250 Translation parallel to roadway
Mode 6 3.416 1.529 1.529 Translation perpendicular to roadway
(a) (b) (c) (d)
Figure 4. Operational deflected shapes from ARTeMIS: (a) mode one, (b) mode two, (c) mode three, and (d) mode four.
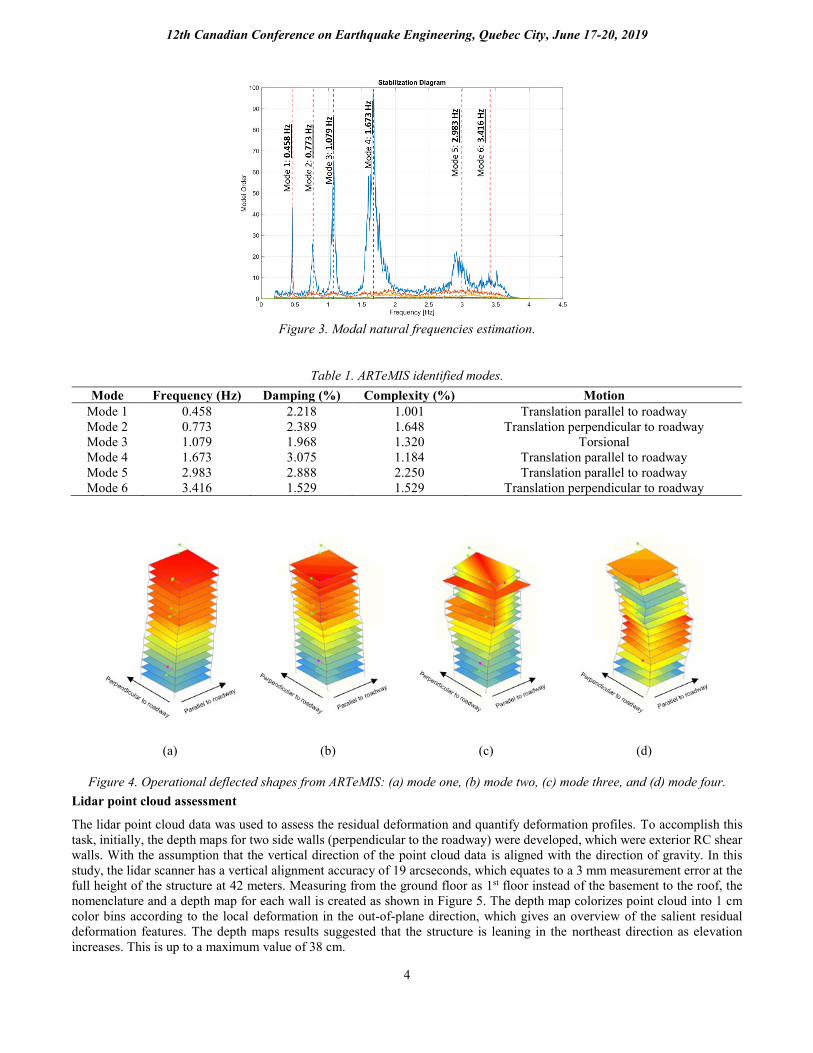
Lidar point cloud assessment
The lidar point cloud data was used to assess the residual deformation and quantify deformation profiles. To accomplish this
task, initially, the depth maps for two side walls (perpendicular to the roadway) were developed, which were exterior RC shear
walls. With the assumption that the vertical direction of the point cloud data is aligned with the direction of gravity. In this
study, the lidar scanner has a vertical alignment accuracy of 19 arcseconds, which equates to a 3 mm measurement error at the
full height of the structure at 42 meters. Measuring from the ground floor as 1st floor instead of the basement to the roof, the
nomenclature and a depth map for each wall is created as shown in Figure 5. The depth map colorizes point cloud into 1 cm
color bins according to the local deformation in the out-of-plane direction, which gives an overview of the salient residual
deformation features. The depth maps results suggested that the structure is leaning in the northeast direction as elevation
increases. This is up to a maximum value of 38 cm.
12th Canadian Conference on Earthquake Engineering, Quebec City, June 17-20, 2019
5
(a) (b) (c)
Figure 5. (a) Structure's top view and the nomenclatures with roof deformation values, (b) northeast wall depth-map in the
out-of-plane direction, and (c) southwest wall depth map in the out-of-plane direction (white spaces near the roof are due to
occlusion of windows).
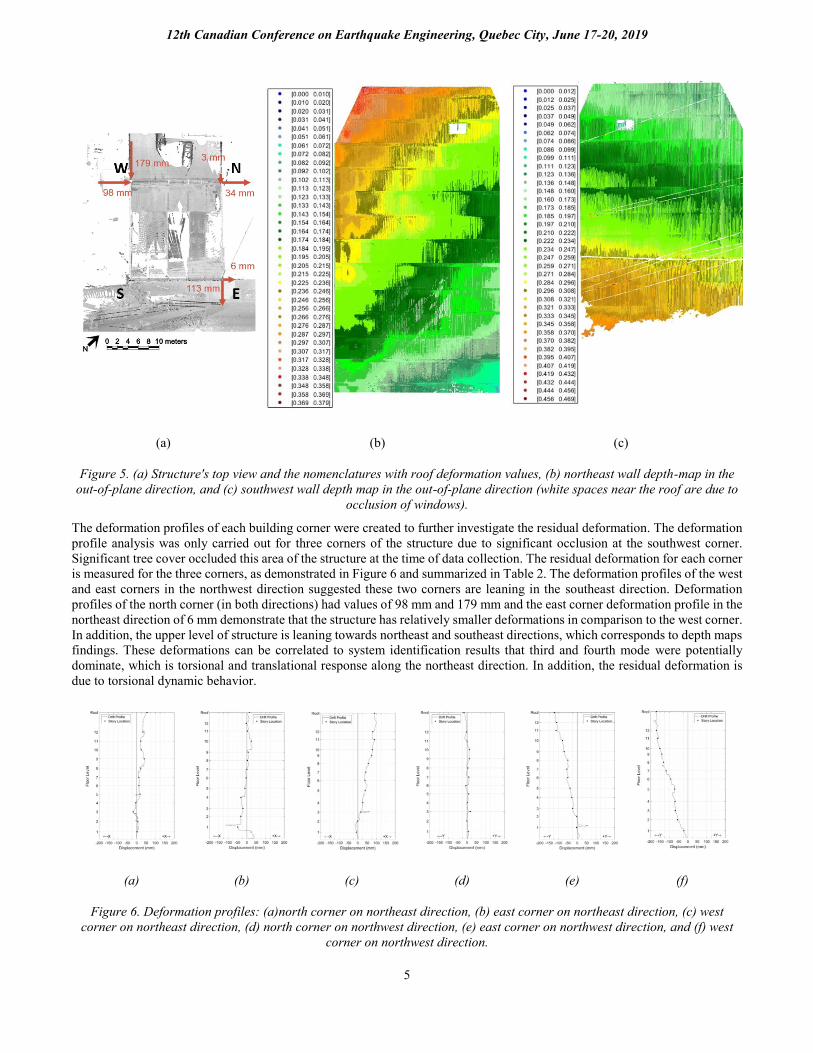
The deformation profiles of each building corner were created to further investigate the residual deformation. The deformation
profile analysis was only carried out for three corners of the structure due to significant occlusion at the southwest corner.
Significant tree cover occluded this area of the structure at the time of data collection. The residual deformation for each corner
is measured for the three corners, as demonstrated in Figure 6 and summarized in Table 2. The deformation profiles of the west
and east corners in the northwest direction suggested these two corners are leaning in the southeast direction. Deformation
profiles of the north corner (in both directions) had values of 98 mm and 179 mm and the east corner deformation profile in the
northeast direction of 6 mm demonstrate that the structure has relatively smaller deformations in comparison to the west corner.
In addition, the upper level of structure is leaning towards northeast and southeast directions, which corresponds to depth maps
findings. These deformations can be correlated to system identification results that third and fourth mode were potentially
dominate, which is torsional and translational response along the northeast direction. In addition, the residual deformation is
due to torsional dynamic behavior.
(a) (b) (c) (d) (e) (f)
Figure 6. Deformation profiles: (a)north corner on northeast direction, (b) east corner on northeast direction, (c) west
corner on northeast direction, (d) north corner on northwest direction, (e) east corner on northwest direction, and (f) west
corner on northwest direction.

12th Canadian Conference on Earthquake Engineering, Quebec City, June 17-20, 2019
6
Table 2. Comparison of corner deformations.
Story
Level
Northeast (mm) Northwest (mm)
N E W N E W
1 2 -7 -48 6 -22 -3
2 5 -2 -31 -1 -56 -2
3 -18 15 -20 17 -68 -23
4 -5 26 -31 1 -68 -29
5 17 38 -9 8 -70 -38
6 11 38 -4 -6 -92 -50
7 11 42 0 9 -116 -56
8 20 56 3 4 -130 -50
9 40 73 6 11 -139 -69
10 24 77 23 12 -150 -78
11 21 88 3 0 -162 -113
12 32 80 -3 -3 -168 -110
Roof 34 98 6 -3 -179 -113
CONCLUSIONS
This study focuses on the preliminary damage assessment of a sixteen-story reinforced concrete residence building following
the 2017 Central Mexico earthquake and its aftershock sequence. The assessment process was conducted through collecting
and analyzing point cloud and ambient vibration data to study the structure post-earthquake health state. A system identification
process using ambient vibrational data provided the dynamic and modal properties of the structure, while the lidar point cloud
was used to assess the structure’s residual deformation and tilt. Investigating the results from system identification and lidar
point cloud assessment, mode three (torsional) and mode four (translation parallel to the roadway) can be potentially categorized
as governing modes. Residual deformations are estimated to be from 3 mm to 179 mm at the roof level at its corners indicating
that the structure is leaning towards the northeast. This building is located in the Mexico City seismic zone IIIA, which was
classified as a soft soil due to the lake basin[14]. Natural frequencies of mode three and mode four are 1.079 Hz and 1.673 Hz,
which are near the dominate basin period of 1.25 Hz in zone III [15]. This geotechnical condition and the observed damage
pattern are in general agreement. Future work will be built on these findings, including the construction of a model-updated
finite element model to validate these findings as well as investigate the seismic vulnerability.
ACKNOWLEDGMENTS
Travel funding was primarily provided for the University of Nebraska, Lincoln (UNL) team by the Department of Civil
Engineering and the College of Engineering. Supplemental travel support was provided by National Science Foundation (NSF),
under award number 1811084. The authors would like to graciously acknowledge the team members for assisting the field data
collection at this structure including Prof. Andreas Stavridis and Mr. Supratik Bose from University at Buffalo, Ms. Lauren
Benstead from California Polytechnic State University, and Mr. William (Willy) Rosenblatt from Wiss, Janney, Elstner
Associates, Inc. Additional field support was provided by Prof. Santiago Pujol, Prof. Ayhan Irfanoglu, and Mr. Prateek Shah
of Purdue University and Prof. Gilberto Mosqueda and Mr. Patrick Hughes from the University of California, San Diego. The
authors also would also like to express their thanks for the support of FARO Technologies for the last minute equipment loaner,
particularly Mr. Alex Shiah, Mr. Leobardo Nunez, and Mr. Jacob Eveland. This paper does not constitute a standard,
specification, or regulation.
REFERENCES
[1] Semple K., Villegas P., and Malkin E., (2017). “Mexico Earthquake Kills Hundreds, Trapping Many Under Rubble.” The
New York Times. https://www.nytimes.com/2017/09/19/world/americas/mexico-earthquake.html
[2] Yousefianmoghadam S., Song M., Stavridis A., Moaveni. B. (2015) “System Identification of a Two-11 Story Infilled RC
Building in Different Damage States.” Proceedings of Improving the Seismic Performance of Existing Buildings and Other
Structures, San Francisco, CA, 2015 607-618.
[3] Wood R. L., and Mohammadi M. E. (2015). “LiDAR scanning with supplementary UAV captured images for structural
inspection.” International LiDAR Mapping Forum, Denver, CO, USA.
[4] Bose, S., Nozari, A., Mohammadi, M.E., Stavridis, A., Babak, M., Wood, R., Gillins, D. and Barbosa, A., (2016).
“Structural assessment of a school building in Sankhu, Nepal damaged due to torsional response during the 2015 Gorkha

12th Canadian Conference on Earthquake Engineering, Quebec City, June 17-20, 2019
7
earthquake.” Proceedings 34th IMAC, A Conference and Exposition on Structural Dynamics, SEM, Orlando, FL USA,
Springer, Volume 2, 31-41.
[5] Faro. (2016). Faro laser scanner Focus 3D: features, benefits & technical specifications. FARO Technologies, Lake Mary,
FL, USA. http://www.gb-geodezie.cz/wp-content/uploads/2016/01/FARO_-Focus_3D.pdf
[6] Doebling S.W., Farrar C. R., Prime M. B., and Shevitz D.W., (1996). Damage identification and health monitoring of
structural and mechanical systems from changes in their vibration characteristics: a literature review. No. LA--13070-
MS, Los Alamos National Lab, NM, USA.
[7] Wood R. L., Mohammadi M. E., Barbosa A. R., Kawan C. K., Shakya M., and Olsen M. J. (2017). “Structural damage
assessment of five tiered pagoda style temple.” Earthquake Spectra. 1(33), 10.1193/121516EQS235M.
[8] Wood R. L., (2014). “Methods of structural damage characterization for infrastructure.” 34th Annual Structural Congress,
Structural Engineering Association of Nebraska, Omaha, NE, USA, 12pp.
[9] Olsen M. J., Cheung K. F., YamazakI Y., Butcher S., Garlock M., Yim S., McGarity S., Robertson I., Burgos L., Young
Y. L. (2012) “Damage assessment of the 2010 Chile earthquake and tsunami using terrestrial laser scanning.” Earthquake
Spectra. 28 (1), 179-197, 10.1193/1.4000021.
[10] Olsen M.J., Kuester F., Chang B.J., and Hutchinson T.C. (2010). “Terrestrial Laser Scanning-Based Structural Damage
Assessment.” J. Comput. Civ. Eng., 2010.24:264-272, 10.1061/(ASCE)CP.1943-5487.0000028.
[11] Barbosa A.R., Fahnestock L.A., Fick D.R., Gautam D., Soti R., Wood R., Moaveni B., Stavridis A., Olsen M.J. and
Rodrigues H. (2017). “Performance of medium-to-high rise reinforced concrete frame buildings with masonry infill in the
2015 Gorkha, Nepal, Earthquake.” Earthquake Spectra, 33(S1), 197-218.
[12] Yu H., Mohammed M.A., Mohammadi M.E., Moaveni B., Barbosa A.R., Stavridis A. and Wood R.L. (2017). “Structural
identification of an 18-story RC building in Nepal using post-earthquake ambient vibration and lidar data.” Frontiers in
Built Environment 3, 10.338 9/fbuil.201700011.
[13] Calrec Audio Ltd. (2017). ARTEMIS installation & technical manual. England, UK. https://calrec.com/wp-
content/themes/calrec/pdf/Artemis%20Installation%20Manual%20(926-149%20Iss27%20Lo).pdf
[14] NTCS-04. (2004). Normas Técnicas Complementarias para diseño por sismo. Gaceta oficial del Distrito Federal, México.
[15] Chávez-García F.J., Cuenca J., Lermo J. and Mijares H. (1995). Seismic microzonation of the city of Puebla, Mexico.