Dallas 365 Inaugural Report - dallascityhall.comdallascityhall.com/government/Council Meeting...
56
-
Upload
phamkhuong -
Category
Documents
-
view
214 -
download
0
Transcript of Dallas 365 Inaugural Report - dallascityhall.comdallascityhall.com/government/Council Meeting...


Dallas 365 Inaugural ReportCity Council BriefingFebruary 7, 2018
Elizabeth Reich, Chief Financial Officer
Jack Ireland, DirectorOffice of Budget
LaToya Jackson, Assistant Director Office of Budget
City of Dallas

Presentation Outline• Today’s briefing will:
• Provide an overview of the Dallas 365 initiative
• Introduce the Dallas 365 dashboard
• Provide a copy of the Dallas 365 report
• Review the FY 2017-18 first quarter results
2Government Performance & Financial Management

Overview• We are committed to Service First, 365 days each year• Dallas 365 provides City Council and citizens
information about how the City is performing on 35 metrics that align to our 6 strategic priorities
• Dallas 365 is about transparency and accountability
3Government Performance & Financial Management

Dallas 365 Reporting• Dashboard – each month, we will update the Dallas
365 dashboard with actual year-to-date (YTD) data compared to year-to-date (YTD) targets
• http://dallas365.dallascityhall.com
• Quarterly report – each quarter, we will provide a written report to City Council and will brief the Government Performance and Financial Management (GPFM) committee
• See attached report
4Government Performance & Financial Management

Strategic Priorities –Status of Target vs Actual Data
5
Public Safety - Enhance the welfare and general protection of residents, visitors, and businesses in Dallas
Mobility Solutions, Infrastructure, & Sustainability - Design, build, and maintain the underlying structures necessary to support Dallas’ citizens
Economic & Neighborhood Vitality -Strengthen and grow the business community while planning and strengthening the long-term vitality of Dallas neighborhoods
Human & Social Needs - Provide services and programs to meet basic human needs by focusing on prevention or resolution of systemic problems
Quality of Life - Provide opportunities that enhance the standard of health, comfort, and happiness of Dallas residents
Government Performance & Financial Management - Ensure that internal operations are conducted in a manner that promote core values of excellence, empathy, equity, and ethics
Status LegendOn Target: Caution: ! Needs Improvement: X
Government Performance & Financial Management

6
Public Safety – Enhance the welfare and general protection of residents, visitors, and businesses in Dallas
Number Department Measure 1st Quarter Target 1st Quarter Actual Status
1 Fire-Rescue Average response time 1st paramedic (in minutes) 5:00 5:15
2 Fire-RescuePercent 1st company responding to structure fires within 5:20 of dispatch 90% 85.5%
3 Police Homicide clearance rate 56% 92.3%
4 Police Response time for dispatched Priority 1 calls 8:00 9:00 !
5 Police Number of arrests by Field Patrol 13,000 11,448 !
6 Police Number of Arrests by Narcotics Division 201 179 !
7 Police Percent 911 calls answered within 10 seconds 90% 93.8%
8 Police Number of community events attended 450 198 X
First Quarter Results
Government Performance & Financial Management

7
Mobility Solutions, Infrastructure, and Sustainability – Design, build, and maintain the underlying structures necessary to support Dallas’ citizens
Number Department Measure 1st Quarter Target 1st Quarter Actual Status
9 Public Works Number of potholes repaired 8,525 9,200
10 Public WorksPercent of street segments completed within scheduled work days 91% 99.2%
11 Public Works Number of lane miles resurfaced 47 35.5 X
12Sanitation Services
Missed refuse and recycling collections per 10,000 collections pints/service opportunities 11.5 11.1
13Sanitation Services Tons of recyclables collected 14,404 13,649 !
14 Transportation Percent of street thoroughfare street lights working 96% 94.5%
15 Transportation Percent of streets with visible striping 50% 40.6% !
16 Water Utility Meter reading accuracy rate 99.95% 99.91%
First Quarter Results
Government Performance & Financial Management

8
Economic and Neighborhood Vitality – Strengthen and grow the business community while planning and strengthening the long-term vitality of Dallas neighborhoods by expanding housing options and creating job opportunities
Number Department Measure 1st Quarter Target 1st Quarter Actual Status
17Housing & Neighborhoods Average cost per home repair $75,000 $17,398 X
18Housing & Neighborhoods Number of housing units produced 76 158
19Economic Development Net new jobs created 1,969 4,032
20Economic Development Overall value of permits issued $1,000,000,000 $1,021,120,739
First Quarter Results
Government Performance & Financial Management

9
Human and Social Needs – Provide services and programs to meet basic human needs by focusing on prevention or resolution of systemic problems
Number Department Measure 1st Quarter Target 1st Quarter Actual Status
21Community Care Number of seniors served 483 387 !
22Community Care Cost per household assisted $720 $678.72 !
23Homeless Solutions
Number of days to close homeless encampment from report to clean-up, hardening, or reclamation 45 12.6
24Homeless Solutions
Number of unduplicated homeless persons placed in housing 59 100
25Welcoming Communities Number of community engagements undertaken 23 84
First Quarter Results
Government Performance & Financial Management

10
Quality of Life – Provide opportunities that enhance the standard of health, comfort, and happiness of Dallas residents
Number Department Measure 1st Quarter Target 1st Quarter Actual Status
26Code Compliance
Number of single family rental properties inspected (initial inspections and reinspections) 2,500 2,563
27Code Compliance Number of lots mowed and cleaned 9,000 5,363 X
28Code Compliance
Percent of 311 service requests responded to within stated estimated response time (ERT) 96% 95.3%
29Animal Services Live release rate 75% 81.0%
30Animal Services Percent increase in field impoundments 14% 35.7%
31 Library Library visits in person, online, and for programs 1,828,000 1,510,008 !
32 Cultural Affairs Attendance at OCA supported arts events 1,145,872 1,618,737
33Park & Recreation Percent of residents within ½ mile of a park 61% 58%
First Quarter Results
Government Performance & Financial Management

11
Government Performance and Financial Management – Ensure that internal operations are conducted in a manner that promote core values of excellence, empathy, equity, and ethics
Number Department Measure 1st Quarter Target 1st Quarter Actual Status
34 City Controller Percent of invoices paid within 30 days 93% 94.2%
35Business Diversity Percent of dollars spent with local businesses 50% 56.5%
First Quarter Results
Government Performance & Financial Management

Actions and Next Steps• Receive feedback from Council• Update dashboard monthly• Provide quarterly report to Council and
briefings to GPFM committee
12
Government Performance & Financial Management

Dallas 365 Inaugural ReportCity Council BriefingFebruary 7, 2018
Elizabeth Reich, Chief Financial Officer
Jack Ireland, DirectorOffice of Budget
LaToya Jackson, Assistant Director Office of Budget
City of Dallas

FY 2017-18DALLAS 365 REPORTInformation as of December 31, 2017
SERVICE FIRST

A Message from City Manager T.C. Broadnax
2
My Fellow Residents of Dallas:
I am honored to serve as city manager of Dallas. Ihave served in this capacity since February 1, 2017and have worked hard to increase our communityinvolvement and communication. I have said manytimes over the last year that we, as a City, offer oneproduct and that is service.
The City of Dallas is committed to “Service First” in everything we do. Our budgetfor FY 2017-18, of over $3 billion, is dedicated to delivering a wide range ofservices to meet the needs of residents 365 days a year.
Dallas 365 is about transparency and reinforces the City’s commitment to service.We are tracking tangible actions and policies that are directly tied to the prioritiesoutlined in the budget. You asked for it. We will measure it. And we will report ourprogress to you – the public – through accessible data.
This is the first Dallas 365 report. It breaks out city operations into six strategicpriorities:
Public Safety
Mobility Solutions, Infrastructure, and Sustainability
Economic and Neighborhood Vitality
Human and Social Needs
Quality of Life
Government Performance and Financial Management
Within the six strategic priorities, we are focused on 35 performance measures thatare most important to taxpayers and residents.
In this inaugural edition, readers will discover the 35 performance measures andhow well the City has performed during the first quarter of FY 2017-18. Please visithttp://dallas365.dallascityhall.com to stay up-to-date on our monthly progress.
In the Spirit of Excellence,
T.C. BroadnaxCity Manager

3
Dallas 365 Measures
Public Safety - Enhance the welfare and general protection of residents, visitors, and businesses in Dallas.
Mobility Solutions, Infrastructure, and Sustainability - Design, build, and maintain the underlying structures necessary to support Dallas’ citizens.
Economic & Neighborhood Vitality - Strengthen and grow the business community while planning and strengthening the long-term vitality of Dallas neighborhoods.
Human & Social Needs - Provide services and programs to meet basic human needs by focusing on prevention or resolution of systemic problems.
Quality of Life - Provide opportunities that enhance the standard of health, comfort, and happiness of Dallas residents.
Government Performance & Financial Management - Ensure that internal operations are conducted in a manner that promote core values of excellence, empathy, equity, and ethics.
Status LegendOn Target: Caution: ! Needs Improvement: X
Understanding the Report For each of the 6 strategic priorities, we have identified performance measures. Thefollowing pages provide detail for the 35 measures selected. For each measure, we set atarget. Each month, we compare our actual performance against the target. This reportprovides information for the first quarter of the fiscal year - October, November, andDecember, 2017. For some measures, a higher value is desired, while for other measures, alower value is desired. We must also factor in the seasonality of some work, whichaccelerates during warmer months.
The status “on-target” indicates that actual data is within 5% of the target, “caution” indicatesthat actual data is 6% to 20% of the target, and “needs improvement” indicates that actualdata is more than 20% away from the target. The report will explain efforts to improve ourperformance when the status is not “on-target.”
The City of Dallas’ Performance-At-a-Glance

Dallas 365 Measures
4
PUBLIC SAFETY
MOBILITY SOLUTIONS, INFRASTRUCTURE, AND SUSTAINABILITY
Enhance the welfare and general protection of residents, visitors, and businesses in Dallas.
Design, build, and maintain the underlying structures necessary to support Dallas’ citizens.
Department Measure1st Quarter
TargetYTD Actual Status
1 Fire-RescueAverage response time 1st paramedic (in minutes)
5:00 5:15
2 Fire-RescuePercent 1st company responding to structure fires within 5:20 of dispatch
90% 85.5%
3 Police Homicide clearance rate 56% 92.3%
4 PoliceResponse time for dispatched Priority 1 calls
8:00 9:00 !
5 Police Number of arrests by Field Patrol 13,000 11,448 !
6 Police Number of Arrests by Narcotics Division 201 179 !
7 PolicePercent 911 calls answered within 10 seconds
90% 93.8%
8 Police Number of community events attended 450 198 X
Department Measure1st Quarter
TargetYTD Actual Status
9 Public Works Number of potholes repaired 8,525 9,200
10 Public WorksPercent of street segments completed within scheduled work days
91% 99.2%
11 Public Works Number of lane miles resurfaced 47 35.5 X
12Sanitation Services
Missed refuse and recycling collections per 10,000 collections pints/service opportunities
11.5 11.1
13Sanitation Services
Tons of recyclables collected 14,404 13,649 !
14 TransportationPercent of street thoroughfare street lights working
96% 94.5%
15 Transportation Percent of streets with visible striping 50% 40.6% !
16 Water Utility Meter reading accuracy rate 99.95% 99.91%
Status LegendOn Target: Caution: ! Needs Improvement: X

Dallas 365 Measures
5
ECONOMIC AND NEIGHBORHOOD VITALITYStrengthen and grow the business community while planning and strengthening the long-term vitality of Dallas neighborhoods.
HUMAN AND SOCIAL NEEDSProvide services and programs to meet basic human needs by focusing on prevention orresolution of systemic problems.
Department Measure 1st Quarter Target YTD Actual Status
17Housing & Neighborhood Revitalization
Average cost per home repair $75,000 $17,398 X
18Housing & Neighborhood Revitalization
Number of housing units produced 76 158
19Economic Development
Net new jobs created 1,969 4,032
20Sustainable Development & Construction
Overall value of permits issued $1,000,000,000 $1,021,120,739
Department Measure1st Quarter
TargetYTD Actual Status
21Community Care
Number of seniors served 483 387 !
22Community Care
Cost per household assisted $720 $678.72 !
23Homeless Solutions
Number of days to close homeless encampment from report to clean-up, hardening, or reclamation
45 12.6
24Homeless Solutions
Number of unduplicated homeless persons placed in housing
59 100
25Welcoming Communities
Number of community engagements undertaken
23 84
Status LegendOn Target: Caution: ! Needs Improvement: X

Dallas 365 Measures
6
QUALITY OF LIFE
Provide opportunities that enhance the standard of health, comfort, and happiness of Dallasresidents.
GOVERNMENT PERFORMANCE AND FINANCIAL MANAGEMENT
Ensure that internal operations are conducted in a manner that promote core values ofexcellence, empathy, equity, and ethics.
Department Measure1st Quarter
TargetActual Status
26Code Compliance
Number of single family rental properties inspected (initial inspections and reinspections)
2,500 2,563
27Code Compliance
Number of lots mowed and cleaned 9,000 5,363 X
28Code Compliance
Percent of 311 service requests responded to within stated estimated response time (ERT)
96% 95.3%
29 Animal Services Live release rate 75% 81.0%
30 Animal Services Percent increase in field impoundments 14% 35.7%
31 LibraryLibrary visits in person, online, and for programs
1,828,000 1,510,008 !
32 Cultural Affairs Attendance at OCA supported arts events 1,145,872 1,618,737
33Park & Recreation
Percent of residents within ½ mile of a park
61% 58%
Department Measure1st Quarter
TargetActual Status
34 City Controller Percent of invoices paid within 30 days 93% 94.2%
35Business Diversity
Percent of dollars spent with local businesses
50% 56.5%
Status LegendOn Target: Caution: ! Needs Improvement: X

Key Strategic Priority – Public SafetyDallas Fire Rescue
7
We based our target on a national standard called the National Fire Protection Association Code 1710,which allows one minute to get out the door after a call comes in, and four minutes of travel time. TheCity of Dallas strives to respond in 5 minutes or less to 90% of emergency medical calls.
Factors that can interfere with reaching or exceeding our response goal include the growing demandfor service, apparatus being out of service due to heavy call volumes or for maintenance, inclementweather, and companies out of service for essential training.
DFR has undertaken initiatives such as implementation of tiered EMS dispatch software, MobileCommunity Health Paramedics, RightCare team launch (targeting mental health patients, etc.), andadding more ambulances and resources to help achieve the 5 minute performance goal.
1. Average Response Time (1st) Paramedic
This measure tracks the average time it takes the first paramedic to arrive on scene after dispatch and provide medical care (All DFR engines have paramedics on board).
Low values are good
Status LegendOn Target: Caution: ! Needs Improvement: X
On Target
Year-to-Date Average Actual:
5:15
Year-to-Date Target: 5:00
Annual Target: 5:00
5:15
5:11
5:19
4:48
4:55
5:02
5:09
5:16
5:24
Oct Nov Dec
Average response time 1st paramedic (in minutes) Target
Key Strategic Priority – Public SafetyDallas Fire Rescue
8
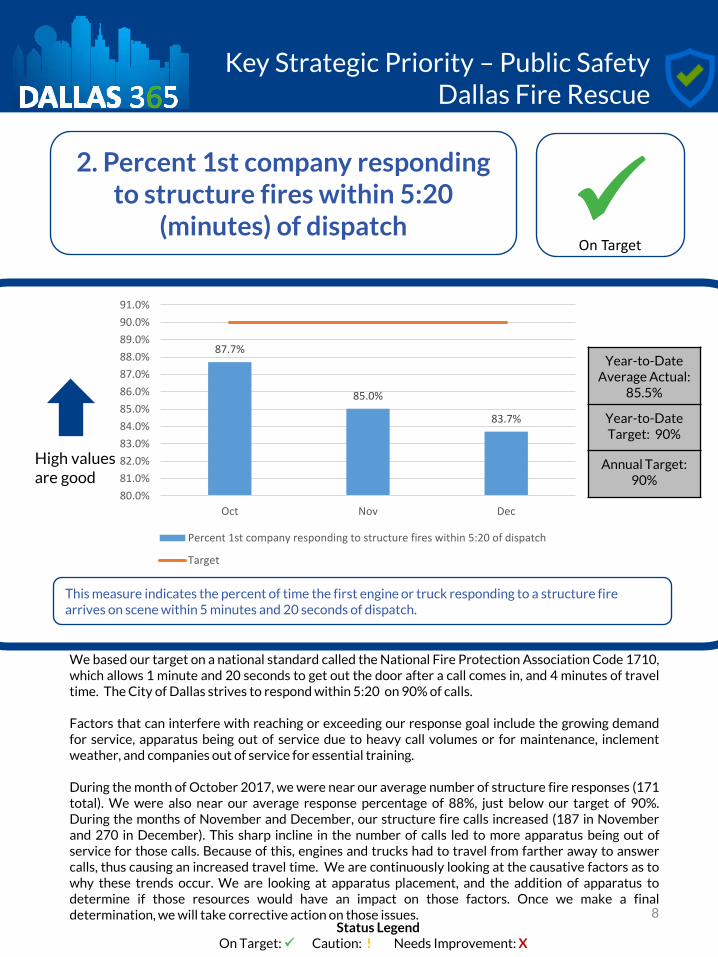
We based our target on a national standard called the National Fire Protection Association Code 1710,which allows 1 minute and 20 seconds to get out the door after a call comes in, and 4 minutes of traveltime. The City of Dallas strives to respond within 5:20 on 90% of calls.
Factors that can interfere with reaching or exceeding our response goal include the growing demandfor service, apparatus being out of service due to heavy call volumes or for maintenance, inclementweather, and companies out of service for essential training.
During the month of October 2017, we were near our average number of structure fire responses (171total). We were also near our average response percentage of 88%, just below our target of 90%.During the months of November and December, our structure fire calls increased (187 in Novemberand 270 in December). This sharp incline in the number of calls led to more apparatus being out ofservice for those calls. Because of this, engines and trucks had to travel from farther away to answercalls, thus causing an increased travel time. We are continuously looking at the causative factors as towhy these trends occur. We are looking at apparatus placement, and the addition of apparatus todetermine if those resources would have an impact on those factors. Once we make a finaldetermination, we will take corrective action on those issues.
2. Percent 1st company responding to structure fires within 5:20
(minutes) of dispatch
This measure indicates the percent of time the first engine or truck responding to a structure fire arrives on scene within 5 minutes and 20 seconds of dispatch.
High values are good
Status LegendOn Target: Caution: ! Needs Improvement: X
On Target
Year-to-Date Average Actual:
85.5%
Year-to-Date Target: 90%
Annual Target: 90%
87.7%
85.0%
83.7%
80.0%81.0%82.0%83.0%84.0%85.0%86.0%87.0%88.0%89.0%90.0%91.0%
Oct Nov Dec
Percent 1st company responding to structure fires within 5:20 of dispatch
Target

Key Strategic Priority – Public SafetyDallas Police Department
9
3. Homicide clearance rate
This measure indicates the percentage of homicides cleared by the Dallas Police Department. Theformula for this measure is calculated by the total number of cleared homicide offenses divided by thetotal number of homicide offenses in the month.
During November 2017, leadership from the Southeastern Patrol Division substation worked withmembers from the Gang and Homicide Units to respond to a crime pattern. The crime pattern pointedout rival gang members operating in the Southeast Division. DPD hosted a gang summit, whereleadership from each of the gangs agreed to a truce. It is important to note the rivalry between thosetwo gangs was the reason there were so many homicides during 2017.
Further there is a seasonality trend aligned with reduced violence. Thus, the winter months allow us timeto focus on closing cases, since less violence occurs during these months.
High values are good
Status LegendOn Target: Caution: ! Needs Improvement: X
On Target
Year-to-Date Average Actual:
92.3%
Year-to-Date Target: 56%
Annual Target: 56%
78.1%
54.5%
144.4%
0.0%
20.0%
40.0%
60.0%
80.0%
100.0%
120.0%
140.0%
160.0%
Oct Nov Dec
Homicide clearance rate Target

Key Strategic Priority – Public SafetyDallas Police Department
10
DPD is not yet at the target response time of 8 minutes, but has made incremental improvements in thefirst quarter. DPD identifies which patrol divisions or shifts are experiencing above average responsetime and takes steps to improve.
In January 2018, DPD implemented a process geared towards reducing response times and improvingservice levels for 911 calls. In this process, Night Major Supervisors have been assigned to monitor 911calls for service, oversee officer activity, and ensure all levels of supervision and resources are beingproperly deployed.
We expect to see further improvement in this measure and will continue to monitor its performanceclosely.
4. Response time for dispatched Priority 1 calls
Low values are good
This measure indicates the average response time for Priority 1 calls. Priority 1 calls are defined as whenthe immediate presence of the police is essential to have life, prevent serious injury, or to arrest a violentfelon. The formula to calculate this measure is: Dispatch Time Priority 1 + Travel Time Priority 1.
!
Status LegendOn Target: Caution: ! Needs Improvement: X
Caution
Year-to-Date Average
Actual: 9:00
Year-to-Date Target: 8:00
Annual Target: 8:00
9:16 9:13
8:29
7:12
7:26
7:40
7:55
8:09
8:24
8:38
8:52
9:07
9:21
9:36
Oct Nov Dec
Response time for dispatched Priority 1 calls Target

Key Strategic Priority – Public SafetyDallas Police Department
11
To meet the target, DPD officers execute outstanding warrants and perform other arrests as authorizedby the Texas Code of Criminal Procedure. Arrests typically dip in the winter and accelerate inspring/summer.
Dallas is currently experiencing a 13.83% reduction in criminal offenses. We currently have 119 fewerviolent offenses and 520 fewer non-violent offenses compared to last year which could account for the10% reduction in arrests from the targeted goal.
5. Number of arrests by field patrol
High values are good
This measure indicates the number of arrests by Field Patrol Divisions. Police Field Patrol is theprimary responder for police service calls by citizens. The formula to calculate this measure is equal tothe total number of arrests based on the Hierarchy Rule according to the FBI-Uniform Crime Reportingprocedure.
Status LegendOn Target: Caution: ! Needs Improvement: X
!Caution
Year-to-Date Cumulative Total:
11,448
Year-to-Date Target: 13,000
Annual Target: 52,000
4,039
3,765
3,644
3,200
3,400
3,600
3,800
4,000
4,200
4,400
Oct Nov Dec
Number of arrests by Field Patrol Target

Key Strategic Priority – Public SafetyDallas Police Department
12
DPD’s Narcotics Division works street level complaints and develops street intelligence to lead to andeffect drug arrests throughout the city. The Narcotics Division also works with our federal partners toconduct long-term and high drug volume investigations to effect narcotics arrests of major suppliers ofdrugs. These drug arrests prevent the “trickle down” effect to the street level that often leads to violentcrime in our city. This multifaceted approach addresses the proliferation of drugs in our city as well asthe trafficking of narcotics to, from, and through Dallas.
To improve overall performance in this area, DPD will increase collaboration among intradepartmentaltask force teams, i.e. the Lab Squad, Asset Forfeiture, Knock & Talk, and theDiversionary/Intelligence/Case Filing teams and from federal partners to better improve informationsharing and increase access to resources.
6. Number of arrests by narcotics division
High values are good
This measure indicates the number arrest by the Narcotics Division. These police arrests involve theillegal selling, buying, and possession of dangerous drugs or narcotics. The formula for this measure iscalculated by the total counted number of arrests performed monthly by Narcotics detectives.
!
Status LegendOn Target: Caution: ! Needs Improvement: X
Caution
Year-to-Date Cumulative Total:
179
Year-to-Date Target: 201
Annual Target: 804
67 69
43
0
10
20
30
40
50
60
70
80
Oct Nov Dec
Total arrests by Narcotics Division Target

Key Strategic Priority – Public SafetyDallas Police Department
13
To meet this target, DPD engaged in aggressive hiring activities to increase staffing, and DPD workedaggressively to shorten the background process for applicants. Further, we implemented a continuousopen Civil Service list and a reduction of the re-application period.
Further, DPD implemented the Next Generation 911 technology which creates a faster, more flexible,and scalable system. These enhancements enable 911 to keep up with communication technologyused by the public.
These efforts, are improving the 911 call experience for our residents who contact eh City during theirtime of need.
7. Percent 911 calls answered within 10 seconds or less
High values are good
This measure indicates the percentage of 911 calls answered in 10 seconds or less by Dallas Policedispatch. The formula for this measure is equal to: Number of calls answered after 10 seconds / Totalnumber of calls answered x 100
Status LegendOn Target: Caution: ! Needs Improvement: X
On Target
Year-to-Date Average Actual:
93.8%
Year-to-Date Target: 90%
Annual Target: 90%
92.5%
93.6%
95.4%
87.0%
88.0%
89.0%
90.0%
91.0%
92.0%
93.0%
94.0%
95.0%
96.0%
Oct Nov Dec
Percent 911 calls answered within 10 seconds Target

Key Strategic Priority – Public SafetyDallas Police Department
14
DPD has experienced higher than normal attrition over the last 18 months. In addition to retirements,Dallas officers have been heavily recruited by surrounding police agencies. Adding to this alreadydifficult situation is a nationwide reduction in the number of police officer applicants. Therefore, thedepartment has placed a major emphasis on core services, which consist of patrol, investigative, and callresponse functions. Currently, DPD is assessing various ways to streamline processes, thus maximizingthe efficiency of patrol substations. Once implemented, substations will be able to manage morecommunity engagement efforts while maintaining resources for core functions.
If you would like to request DPD attend a community event in your area, please contact PoliceCommunity Affairs at 214.671.4045. For information on youth programs, please contact 214.671.4993.
8. Number of community engagement events attended
High values are good
This measure indicates the number of community engagement events attended annually by DPDofficers. The formula for this measure is equal to the total counted number of community eventsattended monthly.
X
Status LegendOn Target: Caution: ! Needs Improvement: X
Needs Improvement
Year-to-Date Cumulative Total:
198
Year-to-Date Target: 450
Annual Target: 1,800
8067
51
0
20
40
60
80
100
120
140
160
Oct Nov Dec
Number of community events attended Target
Key Strategic PriorityMobility Solutions, Infrastructure, and Sustainability
Public Works
15
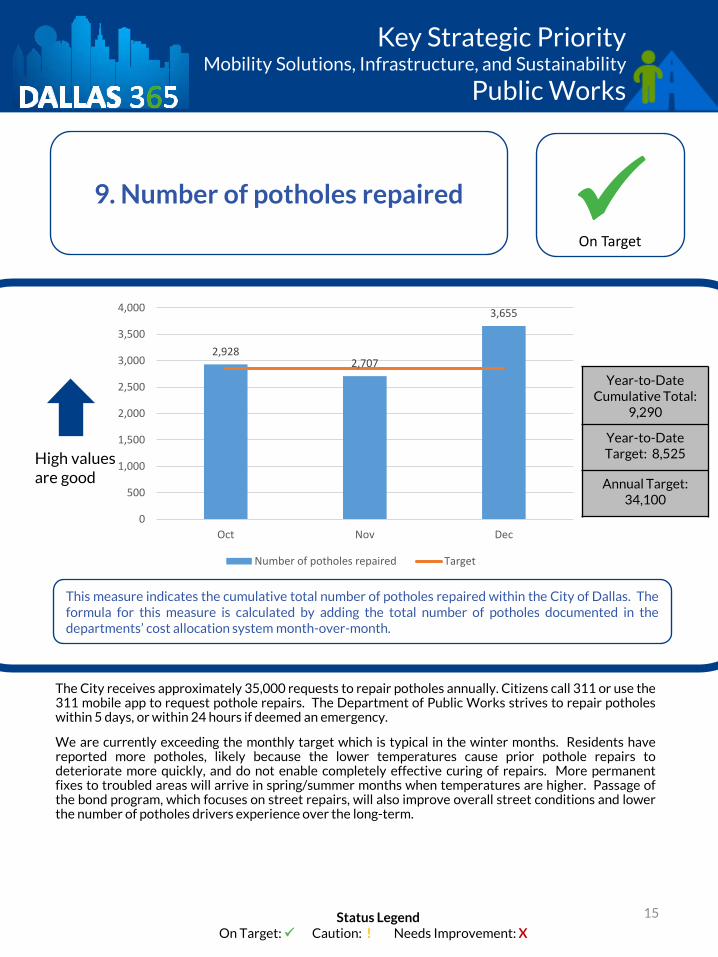
The City receives approximately 35,000 requests to repair potholes annually. Citizens call 311 or use the311 mobile app to request pothole repairs. The Department of Public Works strives to repair potholeswithin 5 days, or within 24 hours if deemed an emergency.
We are currently exceeding the monthly target which is typical in the winter months. Residents havereported more potholes, likely because the lower temperatures cause prior pothole repairs todeteriorate more quickly, and do not enable completely effective curing of repairs. More permanentfixes to troubled areas will arrive in spring/summer months when temperatures are higher. Passage ofthe bond program, which focuses on street repairs, will also improve overall street conditions and lowerthe number of potholes drivers experience over the long-term.
9. Number of potholes repaired
High values are good
This measure indicates the cumulative total number of potholes repaired within the City of Dallas. Theformula for this measure is calculated by adding the total number of potholes documented in thedepartments’ cost allocation system month-over-month.
Status LegendOn Target: Caution: ! Needs Improvement: X
On Target
Year-to-Date Cumulative Total:
9,290
Year-to-Date Target: 8,525
Annual Target: 34,100
2,9282,707
3,655
0
500
1,000
1,500
2,000
2,500
3,000
3,500
4,000
Oct Nov Dec
Number of potholes repaired Target

Key Strategic PriorityMobility Solutions, Infrastructure, and Sustainability
Public Works
16
Public Works receives requests to repair street segments through email, phone, or 311. City asphaltand/or concrete repair crews make the needed repairs within a scheduled amount of work days, usually90 days. We are exceeding the target of 91% thus far this fiscal year, and expect this performance tocontinue.
10. Percent of street segments completed within scheduled work
days
High values are good
This measure is the percentage of street segments completed within a scheduled time frame. Thevalue is calculated by dividing the number of Service Requests closed within the scheduled work daysby the total number of Service Requests received requesting street repair and then multiplying theresult by 100 to get a percentage value.
Status LegendOn Target: Caution: ! Needs Improvement: X
On Target
Year-to-Date Average Actual:
99.2%
Year-to-Date Target: 91%
Annual Target: 91%
100.0%
97.7%
100.0%
86.0%
88.0%
90.0%
92.0%
94.0%
96.0%
98.0%
100.0%
102.0%
Oct Nov Dec
Percent street segments completed withinscheduled work days
Target

Key Strategic PriorityMobility Solutions, Infrastructure, and Sustainability
Public Works
17
The City has a contract in place to complete resurfacing of 187 lane miles this fiscal year. We deem aresurfacing project to be complete only after an inspection. We schedule most work in the warmermonths (spring/summer). Therefore, as the weather warms up, we will meet or exceed the stated target.
11. Number of lane miles resurfaced
This measure indicates the number of lanes miles resurfaced within the fiscal year. This value iscalculated by taking the actual lane miles completed by the contractor per month (the constructioncycle of productivity is higher in the spring and summer months).
High values are good
X
Status LegendOn Target: Caution: ! Needs Improvement: X
Needs Improvement
Year-to-Date Cumulative Total:
35.5
Year-to-Date Target: 47
Annual Target: 187
11.7
19.8
4.0
0.0
5.0
10.0
15.0
20.0
25.0
Oct Nov Dec
Number of lane miles resurfaced Target

Key Strategic PriorityMobility Solutions, Infrastructure, and Sustainability
Sanitation Services
About This Measure
18
This measure tracks a key component of meeting the needs of our customers, both in terms ofconsistency of collection and keeping neighborhoods clean. Sanitation Services is addressing severalitems to positively affect and lower missed collection, such as: continuing an aggressive fleetreplacement program, performing route adjustments and enhancements, increasing truck driver andsupervisor accountability and training, and developing more granular tracking measures to pinpointisolated performance problems.
To report a missed collection, please call 311.
12. Missed refuse and recycling collections per 10,000 collection
points/service opportunities
This measure provides a ratio of the number of monthly missed garbage and recycling service requestssubmitted compared to the total number of monthly collection opportunities.
Low values are good
Status LegendOn Target: Caution: ! Needs Improvement: X
On Target
Year-to-Date Average Actual:
11.1
Year-to-Date Target: 11.5
Annual Target: 11.5
10.0 9.8
13.5
0.0
2.0
4.0
6.0
8.0
10.0
12.0
14.0
16.0
Oct Nov Dec
Missed refuse and recycling collections per 10,000 collection points/serviceopportunities
Target

Key Strategic PriorityEconomic & Community Vitality
Sanitation Services
19
Key Strategic PriorityMobility Solutions, Infrastructure, and Sustainability
Sanitation Services
13. Tons of recyclables collected
High values are good
This measure indicates the total amount of tons of recyclables collected through weekly collectionservice provided by the Department of Sanitation Services.
This measure tracks the City’s progress related to residential recycling efforts, and we need your help tomeet our target.
The City’s long-range Zero Waste Plan has short, intermediate, and long-term waste diversion goals.Residential recycling is a key component in increasing diversion and meeting those goals. SanitationServices engages in several outreach and education efforts targeting residential customers. Efforts suchas in-school recycling education, community outreach events, an extensive social media presence, andseveral other programs targeted to increase awareness of the City’s sustainability and waste diversioninitiatives positively impact the outcome for this measure.
You can learn more about recycling at:http://dallascityhall.com/departments/sanitation/DCH%20Documents/pdf/DallasRecyclingGuide.pdf.
!
Status LegendOn Target: Caution: ! Needs Improvement: X
Caution
Year-to-Date Cumulative Total:
13,649
Year-to-Date Target: 14,404
Annual Target: 57,615
4,578
4,247
4,824
3,900
4,000
4,100
4,200
4,300
4,400
4,500
4,600
4,700
4,800
4,900
Oct Nov Dec
Tons of residential recyclables collected Target

Key Strategic PriorityMobility Solutions, Infrastructure, and Sustainability
Transportation
20
Street lights have an average life of two years. Traffic Signal Maintenance Technicians perform surveysof street lights at night between traffic signal response calls. This method has provided good results,enabling us to notify ONCOR of the outages. ONCOR has an agreement with the City of Dallas torepair inoperable lights within 5 days.
Although we are below target for the first quarter, we are within 5%. We anticipate increasing oursurveys this spring.
14. Percent of surveyed thoroughfare street lights working
By the 10th of each month, the number of arterial street lights surveyed and the number of outages istotaled for the prior month. This data is used to calculate the percent of operational lights.
High values are good
Status LegendOn Target: Caution: ! Needs Improvement: X
On Target
Year-to-Date Average Actual:
94.5%
Year-to-Date Target: 96%
Annual Target: 96%
94.5%
95.3%
93.6%
92.0%
92.5%
93.0%
93.5%
94.0%
94.5%
95.0%
95.5%
96.0%
96.5%
Oct Nov Dec
Percent of streets thoroughfare street lights working Target

Key Strategic PriorityMobility Solutions, Infrastructure, and Sustainability
Transportation
21
At the beginning of the fiscal year, only 39% of streets in Dallas had visible lane markings, or striping. Ourgoal is to stripe 419 lane miles this fiscal year to achieve 50% visibility by end of fiscal year. As you can seein the bar chart, the percent of streets with visible striping is increasing every month. Typically, we installmore lane miles of striping in the summer months, since striping operations are weather dependent.Therefore, the percent of streets with visible striping is expected to rise as more striping is installed in thewarmer months. We are on track to meet the 50% visibility target by the end of the fiscal year.
15. Percent of streets with visible striping
An annual visual inspection of street striping is performed, and the miles of striping not visible isquantified. The percent of visible striping is calculated by dividing the number of miles of visiblestriping by the total number of miles of striping.
High values are good
!
Status LegendOn Target: Caution: ! Needs Improvement: X
Caution
Year-to-Date Average Actual:
40.6%
Year-to-Date Target: 50%
Annual Target: 50%
38.2%41.0% 42.5%
0.0%
10.0%
20.0%
30.0%
40.0%
50.0%
60.0%
Oct Nov Dec
Percent of streets with visible striping Target

Key Strategic PriorityMobility Solutions, Infrastructure, and Sustainability
Dallas Water Utilities
22
This measure indicates the accuracy rate of the water meter readings completed by Dallas WaterUtilities. The monthly meter reading accuracy is determined by dividing the number of meter readingerrors by the number of meter reads collected that month.
Parameters are set in meter readers’ handheld devices and in the billing system to alert staff of possiblemeter reading errors. If an alert occurs, we make corrections, as necessary, before generating a bill. Ifyou have any questions about your water bill, please contact Water Customer Service at 214.651.1441.
16. Meter reading accuracy rate
This measure indicates the accuracy rate of water meter readings completed by Dallas Water Utilities.The meter reading accuracy is determined by dividing the number of total read errors for the month bythe total number of meter reads uploaded into the billing system.
High values are good
Status LegendOn Target: Caution: ! Needs Improvement: X
On Target
Year-to-Date Average Actual:
99.91%
Year-to-Date Target: 99.95%
Annual Target: 99.95%
99.90%
99.91%
99.93%
99.87%
99.88%
99.89%
99.90%
99.91%
99.92%
99.93%
99.94%
99.95%
99.96%
Oct Nov Dec
Meter reading accuracy rate Target

Key Strategic PriorityEconomic and Neighborhood Vitality
Housing & Neighborhood Revitalization
23
The current Home Repair Program uses eligibility guidelines from 2015, which allow the City to provide amaximum of $20,000 in assistance for repairs of roofs, electrical, HVAC, and/or plumbing. Thus, anaverage $17,398 this quarter is reasonable.
However, with programmatic changes anticipated in April 2018, we will see the average cost per repairsignificantly increase. Once in place, the new program will allow eligible residents to receive repairs up to$75,000. Because the changes will only be in effect for half the year, we may not meet the target thisyear, but we will see a significant increase in the assistance we are able to provide neighborhoods andresidents beginning in April.
17. Average cost per home repair
This measure indicates the average cost of materials used to make repairs in each home assisted. Theaverage cost is calculated by total cost of all home repairs divided by the number of units repaired.
High values are good
X
Status LegendOn Target: Caution: ! Needs Improvement: X
Needs Improvement
Year-to-Date Average Actual:
$17,398
Year-to-Date Target:
$75,000
Annual Target: $75,000
$16,500 $16,500 $19,195
$0
$10,000
$20,000
$30,000
$40,000
$50,000
$60,000
$70,000
$80,000
Oct Nov Dec
Average cost per home repair Target
Key Strategic PriorityEconomic and Neighborhood Vitality
Housing & Neighborhood Revitalization
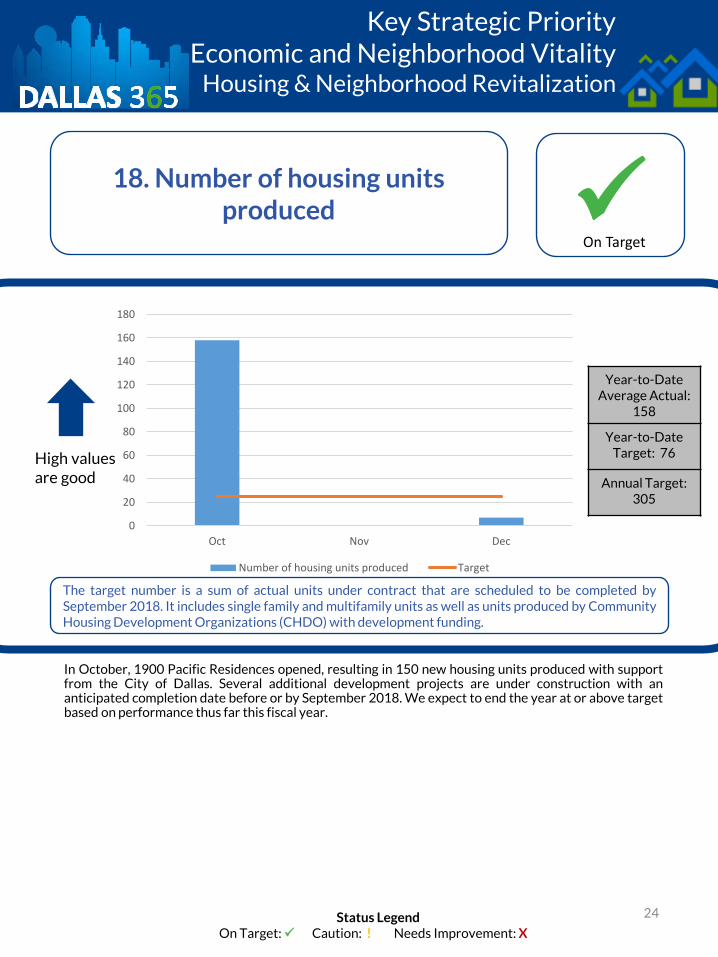
24
In October, 1900 Pacific Residences opened, resulting in 150 new housing units produced with supportfrom the City of Dallas. Several additional development projects are under construction with ananticipated completion date before or by September 2018. We expect to end the year at or above targetbased on performance thus far this fiscal year.
18. Number of housing units produced
The target number is a sum of actual units under contract that are scheduled to be completed bySeptember 2018. It includes single family and multifamily units as well as units produced by CommunityHousing Development Organizations (CHDO) with development funding.
High values are good
Status LegendOn Target: Caution: ! Needs Improvement: X
On Target
Year-to-Date Average Actual:
158
Year-to-Date Target: 76
Annual Target: 305
0
20
40
60
80
100
120
140
160
180
Oct Nov Dec
Number of housing units produced Target

Key Strategic PriorityEconomic and Neighborhood Vitality
Office of Economic Development
25
The net new jobs information is collected by the Labor Market Information Department of the TexasWorkforce Commission during the Current Population Survey (CPS), a household survey that is thesource of the national unemployment rate. The survey information is combined with other data from theCPS, the Current Employment Statistics survey, and state unemployment insurance systems to estimatelabor force figures. Each state’s information is reported in the U.S. Bureau of Labor Statistics Local AreaUnemployment Statistics (LAUS). For the first quarter of FY 2017-18, the total net jobs for Dallasresidents increased 4,032 and the number of unemployed Dallas residents decreased 1,409, resulting ina total labor force increase of 2,623 individuals. The total unemployment rate for Dallas residentsdecreased from 3.5% to 3.3%.
Historically the Office of Economic Development has not tracked quarterly net new jobs created byincentivized projects. Going forward, this jobs reporting requirement will be included in all incentiveagreements. In future quarters, net new jobs tied to City of Dallas incentives will be reported in thissection.
High values are good
This measure indicates the number of net new jobs held by Dallas residents, as estimated by the TexasWorkforce Commission.
19. Net new jobs created
Status LegendOn Target: Caution: ! Needs Improvement: X
On Target
(2,729)
6,490
271
(4,000)
(2,000)
0
2,000
4,000
6,000
8,000
Oct Nov Dec
Net new jobs created Target
Year-to-Date Average Actual:
4,032
Year-to-Date Target: 1,969
Annual Target: 7,876

Key Strategic PriorityEconomic and Neighborhood Vitality
Sustainable Development & Construction
26
The improvement value of construction activity directly impacts the tax base of the City. Building permitdata, including improvement value, is reported to the Dallas County Appraisal District and surroundingdistricts and is used to help estimate improvement values of property. These changes in tax valuationimpact the property taxes collected by the City to support city services.
The strength of the Dallas economy is evident by the recent growth in permit values - $4,321,710,295 inFY 2014-15, $4,600,136,444 in FY 2015-16 when we had a significant increase in Single Family & MultiFamily Dwelling permits, and $4,264,728,943 in FY 2016-17.
The City strives to make the development process as efficient as possible to encourage increaseddevelopment activity within the city to grow the tax base. To this end, the City will be acquiring andimplementing a new electronic plan review system, developing plans for a new development center andone stop shop for developers, continuing technology upgrades such as digitizing historic documents andrecords to assist with research necessary for new development, and striving for excellence in customerservice by enhancing training and documentation of policies and procedures.
High values are good
20. Overall value of permits issued
This measure indicates the overall value of all residential and commercial permits issued by theSustainable Development and Construction Department. The data is the sum of valuations provided byapplicants for building permits.
Status LegendOn Target: Caution: ! Needs Improvement: X
On Target
Year-to-Date Cumulative Total:
$1,021,120,739
Year-to-Date Target:
$1,000,000,000
Annual Target: $4,000,000,000
$506,107,115
$194,394,832
$320,618,792
$0
$100,000,000
$200,000,000
$300,000,000
$400,000,000
$500,000,000
$600,000,000
Oct Nov Dec
Overall value of permits issued Target

Key Strategic PriorityHuman and Social Needs
Community Care
27
The Office of Community Care, senior services division, provides caseworker services such as homevisits, coordination with and referral to community agencies, and follow up with clients to ensureservices were received. To better meet the target, staff will conduct outreach, listening sessions, andeducation activities to increase the number of seniors served, with an emphasis on vulnerablepopulations.
To request services for eligible residents through this program, please contact 311 or the Office ofCommunity Care Senior Services division at 214.670.5227.
21. Number of seniors served
High values are good
Count of unduplicated clients that receive direct service, referral, or support from caseworkers in thesenior services division. Eligible clients are adults aged 60 years and older who live in Dallas.
!
Status LegendOn Target: Caution: ! Needs Improvement: X
Caution
Year-to-Date Cumulative Total:
387
Year-to-Date Target: 483
Annual Target: 1,933
120
160
107
0
20
40
60
80
100
120
140
160
180
Oct Nov Dec
Number of seniors served Target

Key Strategic PriorityHuman and Social Needs
Community Care
28
The Office of Community Care provides rental assistance, case management, and supportive services tohomeless individuals and individuals at- risk of homelessness and their families. Ex-offenders areincluded in this group as housing is critical to reestablishing relationships and connections to thecommunity; housing also lowers the risk for reoffending. December and November are slightly belowexpectations, since the amount of rental assistance provided to clients, which is income based, wasoffset by clients’ temporary, seasonal employment.
For additional information on the program and services provided, please call the Office of CommunityCare at 214.670.7312.
Measuring
22. Cost per household assisted
Cost per household of support provided to individuals at-risk of homelessness through Office ofCommunity Care programming at community centers and through the Fresh Start program. Calculatedas total costs per month divided by clients served per month.
!
Status LegendOn Target: Caution: ! Needs Improvement: X
Caution
Year-to-Date Average Actual:
$678.72
Year-to-Date Target: $720
Annual Target: $720
$741.31 $682.07
$612.78
$0.00
$100.00
$200.00
$300.00
$400.00
$500.00
$600.00
$700.00
$800.00
Oct Nov Dec
Cost per household assisted Target

Key Strategic PriorityHuman and Social Needs
Homeless Solutions
29
Homeless encampments are makeshift temporary structures developed by unsheltered homelesspersons. Due to health hazards, encampments are deemed illegal and are required to be cleaned,reclaimed, and cleared from the public rights-of-way. The Office of Homeless Solutions implemented anew encampment clean up and reclamation process which strengthens coordination efforts betweenPolice, Fire, Code Compliance, 311-CRM, Dallas County, and service providers. As a result, the year-to-date average is 12.56 days, which is well below the target of 45 days.
23. Number of days to close homeless encampment from report
to clean-up, hardening, or reclamation
This measure indicates the number of days to close a homeless encampment, from the time of initialreporting, through clean-up, hardening, or reclamation efforts by City staff. This measure is theaverage number of days which encampments are reported as a 311 Service Request to the close outdate reported in Citizens Response Management System.
Low values are good
Status LegendOn Target: Caution: ! Needs Improvement: X
Year-to-Date Average Actual:
12.6
Year-to-Date Target: 45
Annual Target: 45
On Target
16.9 15.8
5
05
101520253035404550
Oct Nov Dec
Number of days to close homeless encampment from report to clean-up,hardening, or reclamation
Target

Key Strategic PriorityHuman and Social Needs
Homeless Solutions
30
The Office of Homeless Solutions is exceeding the monthly target as a result of a community partnershipapproach to provide housing-focused street outreach with a housing first concept; annual allocation offunding through the City’s Continuum of Care housing projects to increase participation; and the launchof new properties through the permanent supportive housing project, which was able to place newclients at the properties to fill vacancies. This is a positive sign for our city.
24. Number of unduplicated homeless persons placed in housing
This measure is the sum of the number of unduplicated homeless persons placed in housing throughContinuum of Care, Emergency Solutions Grant, Housing Opportunities for Persons With AIDS, andHealthy Community Collaborative projects.
High values are good
Status LegendOn Target: Caution: ! Needs Improvement: X
Year-to-Date Cumulative Total:
100
Year-to-Date Target: 59
Annual Target: 235
On Target
42
35
23
0
5
10
15
20
25
30
35
40
45
Oct Nov Dec
Number of unduplicated homeless persons placed in housing Target

Key Strategic PriorityHuman and Social Needs
Welcoming Communities & Immigrant Affairs
31
WCIA launched fiscal year FY 2017-18 with a robust level of community engagements. We exceededour targeted number of engagements in the first quarter. WCIA was fortunate to collaborate with theDallas Police Department’s Unidos and 311 Dallas City Hall On- the-Go programs to maximizeengagement outcomes.
As a new City of Dallas office, WCIA receives abundant invitations to speak at community events toimpart to the public the mission of the new office. These events connect WCIA staff with hundreds ofimmigrants, refugees, and community stakeholders, for whom WCIA strives to facilitate solutions toissues and problems raised. The community engagements enable WCIA to establish importantrelationships that are invaluable to its efforts to promote the civic, social, and economic engagement andinclusion of immigrants residing in Dallas. WCIA also integrates various media platforms to addressrelevant issues impacting the community.
For more information about WCIA community engagements, contact 214.631.5087.
25. Number of community engagements undertaken
Community engagements undertaken by the Office of Welcoming Communities & Immigrant Affairs(WCIA) are recorded as they are scheduled in a Community Engagement Workbook. Evaluation data iscaptured into the workbook following each engagement. The WCIA team reviews and analyzescommunity engagement data on a monthly basis to ensure quantitative and qualitative outcomes.
High values are good
Status LegendOn Target: Caution: ! Needs Improvement: X
Year-to-Date Cumulative Total:
84
Year-to-Date Target: 23
Annual Target: 92
On Target
22
28
34
0
5
10
15
20
25
30
35
40
Oct Nov Dec
Number of community engagements undertaken Target

Key Strategic PriorityQuality of Life
Code Compliance
32
In October 2016, the Dallas City Council amended the Dallas City Code to allow the City to inspect theinterior and exterior of single family homes identified as rental properties. This program went intoeffect in January 2017 and marked the first time these properties were proactively inspected on aregular basis to ensure compliance with minimum property standards.
In 2017, Code Compliance sent a mass mailing to owners of nearly 50,000 potential rental properties inDallas, informing them of the requirement to register their rental property. The goal is to register andinspect all of these properties within a five-year period. During fiscal year FY 2017-18, Notices ofViolation will be issued to property owners who fail to register their properties.
To obtain more information about this program view our FAQ or email us [email protected] or call 214.671.RENT (7368).
High values are good
26. Number of single family rental properties inspected
A report from the 311system counts the number of initial inspections and re-inspections (follow-up ifone or more violations are found during initial inspection) to obtain the total number of inspectionsconducted each month.
Status LegendOn Target: Caution: ! Needs Improvement: X
Year-to-Date Cumulative Total:
2,563
Year-to-Date Target: 2,500
Annual Target: 10,000
On Target
786
901
876
720740760780800820840860880900920
Oct Nov Dec
Number of single family rental properties inspected (initial inspections andreinspections)
Target

Key Strategic PriorityQuality of Life
Code Compliance
33
When a property owner fails to bring a high weeds, litter, obstruction, or other violation into compliance,the code inspector creates a request for the nuisance abatement division to bring the lot into complianceby mowing/cleaning it. This helps to combat blighted conditions in the city.
This measure is below target for the first quarter (during the winter months), but is anticipated to be ontrack once the peak mowing period arrives (April through October).
27. Number of lots mowed & cleaned
High values are good
A report from the 311 system counts the total number of closed Heavy Clean requests, Litter Removalrequests, Mow Clean City Property Maintenance requests, Mow Clean requests, and VegetationRemoval requests to determine the total number of lots complied by City resources. The total numberof lots mowed by the City’s mowing contractor is added to obtain the total.
X
Status LegendOn Target: Caution: ! Needs Improvement: X
Year-to-Date Cumulative Total:
5,363
Year-to-Date Target: 9,000
Annual Target: 36,000
Needs Improvement
2,850
2,236
277
0
500
1,000
1,500
2,000
2,500
3,000
3,500
Oct Nov Dec
Number of lots mowed & cleaned Target

Key Strategic PriorityQuality of Life
Code Compliance
34
Code Compliance strives to conduct an initial inspection of the service request within establishedtimeframes based on the type of service request. Performance was just slightly below the target for thisperiod. The department is in the process of hiring inspectors to fill approximately 15 vacancies at theend of February 2018.
28. Percent of 311 SRs responded to within estimated response time
High values are good
A report from the 311 system identifies service requests that are past due, i.e., the establishedEstimated Response Time (ERT) was not met for the particular service request type. The number ofcases past due are subtracted from the total number of service requests and that number is divided bythe total number of service requests to obtain the percentage responded to within the ERT.
Status LegendOn Target: Caution: ! Needs Improvement: X
Year-to-Date Average Actual:
95.3%
Year-to-Date Target: 96%
Annual Target: 96%
On Target
95% 95%
96%
94%
95%
95%
95%
95%
95%
96%
96%
96%
96%
Oct Nov Dec
Percent of 311 service requests responded to within stated estimated responsetime (ERT)
Target

Key Strategic PriorityQuality of Life
Dallas Animal Services
35
Dallas Animal Services’ mission is to help Dallas be a safe, compassionate, and healthy place for peopleand animals. We work to control the loose animal population as well as increase positive outcomes forhomeless animals in the city.
We have increased digital marketing, adoption specials, and offsite adoption events. Further, we haveimproved our relationships with rescue groups and our customer service, and streamlined the processfor getting animals on the adoption floor. With these changes, DAS has improved our live release rate inthe last year and expects that trend to continue through 2018.
29. Live release rate
High values are good
The number of adoptions, transfers, and reclaimed animals are summed and then divided by the totalintake number of the same time period.
Status LegendOn Target: Caution: ! Needs Improvement: X
Year-to-Date Average Actual:
81.0%
Year-to-Date Target: 75%
Annual Target: 75%
On Target
73.1%
83.9%86.1%
65.0%
70.0%
75.0%
80.0%
85.0%
90.0%
Oct Nov Dec
Live release rate Target

Key Strategic PriorityQuality of Life
Dallas Animal Services
36
30. Percent increase in field impoundments
High values are good
This measure is calculated by the overall percent increase in loose animals proactively captured by DASfield staff.
Dallas Animal Services’ mission is to help Dallas be a safe, compassionate, and healthy place for peopleand animals. We work to control the loose animal population as well as increase positive outcomes forhomeless animals in the city.
Dallas Animal Services (DAS) has encouraged staff to make bringing in loose dogs a primary goal. DAShas hired more animal officers, giving us additional teams working toward bringing in loose dogs.Additionally, we have added shifts, so we have teams on the streets more often throughout the day.These changes have resulted in a huge growth in the number of loose dogs being brought in.
Status LegendOn Target: Caution: ! Needs Improvement: X
Year-to-Date Average Actual:
35.7%
Year-to-Date Target: 14%
Annual Target: 14%
On Target
36.9% 38.2%
32.0%
0.0%
5.0%
10.0%
15.0%
20.0%
25.0%
30.0%
35.0%
40.0%
45.0%
Oct Nov Dec
Percent increase in field impoundments Target

Key Strategic PriorityQuality of Life
Dallas Public Libraries
37
The Dallas Public Library strengthens communities by connecting people, inspiring curiosity, andadvancing lives. The FY2017-18 annual target for library visits represents a 6% increase over FY 2016-17 actual visits. In the first quarter, we have not met our target for visitors, but we expect to meet thetarget by the end of the year through:
• Increased hours initiated in January 2018;• On-going training to maintain high customer service satisfaction;• Expanded outreach and participation in more neighborhood and community events to promote library
services and programs; and• Continued analysis of web and social media data to quantify virtual reach.
For hours and locations, please go to: http://dallaslibrary2.org/hours.php.
31. Library visits in person, online, and for programs
High values are good
This measure indicates the number of visits to the Dallas Public Libraries in person, online, and forprograms.
!
Status LegendOn Target: Caution: ! Needs Improvement: X
Year-to-Date Cumulative Total:
1,510,008
Year-to-Date Target: 1,828,000
Annual Target: 7,312,000
Caution
552,277498,693
459,038
0
100,000
200,000
300,000
400,000
500,000
600,000
700,000
Oct Nov Dec
Library visits in person, online, and for programs Target

Key Strategic PriorityQuality of Life
Office of Cultural Affairs
38
The 2018 Dallas Cultural Plan, currently underway, will identify strategies to continue to growaudiences that reflect the full diversity and vitality of Dallas' artistic ecosystem. Overall, arts eventsattract the heaviest attendance in the first quarter of the fiscal year (October – December) because themain season for groups runs with the school year. However, December is a “light month” in terms ofattendance, especially the latter part of the month as people travel with school aged children. At thistime, we anticipate meeting the target for attendance this fiscal year.
This figure includes attendance at 23 City-owned cultural facilities and the total number of audiences at more than 120 arts organizations that receive funding support through the OCA.
To learn about cultural events around the community, go to: www.artandseek.org
High values are good
32. Attendance at Office of Cultural Affair supported arts events
This measure indicates the attendance at events supported by the Office of Cultural Affairs as reportedand tallied in the organizations’ monthly report to OCA.
Status LegendOn Target: Caution: ! Needs Improvement: X
Year-to-Date Cumulative Total:
1,618,737
Year-to-Date Target: 1,145,872
Annual Target: 4,583,487
On Target
654,291
551,179
413,267
0
100,000
200,000
300,000
400,000
500,000
600,000
700,000
Oct Nov Dec
Attendance at OCA supported arts events Target

Key Strategic PriorityQuality of Life
Park and Recreation
39
The ½ mile/10 minute walk from a park or open space is a national standard for measuring parklandavailability and access for residents. It is also a key measure of Parkscore, a Trust for Public Land (TPL)annual assessment of park systems throughout the United States. The Park and Recreation Departmentis working with local school districts to provide access to school campuses and amenities during after-school hours and on weekends, resulting in increased park accessibility to residents. We expect to meetthe target by the end of September through use of these cooperative agreements.
High values are good
33. Percent of residents within ½ mile of a park
This measure tracks the percentage of residents within ½ mile (10 minute walk) of a park or open space.
Status LegendOn Target: Caution: ! Needs Improvement: X
Year-to-Date Average Actual:
58%
Year-to-Date Target: 61%
Annual Target: 61%
On Target
58% 58% 58%
57%
57%
58%
58%
59%
59%
60%
60%
61%
61%
62%
Oct Nov Dec
Percent of residents within ½ mile of a park Target

Key Strategic PriorityGovernment Performance and Financial Management
City Controller’s Office
40
Paying vendors on time is important to the City of Dallas. We value our relationships with businessesthat provide goods or services, or perform construction or other work, in turn enabling us to provideservices to our residents.
Although we have performed well in the past on this measure, we want to improve. We have begun aconsolidation of accounts payable activity within the City Controller’s Office, instituted new controls,and created a new problem resolution unit to monitor and research delinquent and problem invoices.
High values are good
34. Percent invoices paid within 30 days
This measure reflects the percent of vendor invoices paid within 30 days of the tracking date on thepayment document for the specified month.
Status LegendOn Target: Caution: ! Needs Improvement: X
Year-to-Date Average Actual:
94.2%
Year-to-Date Target: 93%
Annual Target: 93%
On Target
95.5%
94.3%
92.9%
91.5%
92.0%
92.5%
93.0%
93.5%
94.0%
94.5%
95.0%
95.5%
96.0%
Oct Nov Dec
Percent of invoices paid within 30 days Target

35. Percent dollars spent with local businesses
This measure indicates the percent of dollars spent by the City of Dallas with local businesses.
41
Key Strategic PriorityGovernment Performance and Financial Management
Office of Business Diversity
The Office of Business Diversity seeks to grow businesses. To achieve this goal, staff will:• identify historical industry specific spend;• target local businesses within those industries;• provide direct contact via email using OBD compliance system ; and• host outreach meetings to discuss 9- to 12-month forecast.
In June 2012, City Council passed a local preference ordinance which gives bidding preferences to businesses whose primary place of business is located in Dallas proper. Additionally, we make sure local businesses know how to do business with the City.
If you would like to do business with the City of Dallas, please register to be a vendor at: https://bids.dallascityhall.com/webapp/VSSPROD/AltSelfService.
High values are good
Status LegendOn Target: Caution: ! Needs Improvement: X
Year-to-Date Average Actual:
56.5%
Year-to-Date Target: 50%
Annual Target: 50%
On Target
61.3%58.3%
49.9%
0.0%
10.0%
20.0%
30.0%
40.0%
50.0%
60.0%
70.0%
Oct Nov Dec
Percent of dollars spent with local businesses Target

City of Dallas Contact Information
Financial [email protected]
Dallas City Hall1500 Marilla St.Room 4-F-North
Dallas, Texas 75201Phone: (214) 670-3659
Fax: (214) 670-7008