DAKOTA Reliability Methods applied to RAVEN/RELAP-7 Documents/Reports/DAKOTA_Reliability... ·...
28
SANDIA REPORT SAND2013-8439 Unlimited Release Printed Sept 2013 DAKOTA Reliability Methods applied to RAVEN/RELAP-7 Laura P. Swiler, Diego Mandelli, Cristian Rabiti, Andrea Alfonsi Prepared by Sandia National Laboratories Albuquerque, New Mexico 87185 and Livermore, California 94550 Sandia National Laboratories is a multi-program laboratory managed and operated by Sandia Corporation, a wholly owned subsidiary of Lockheed Martin Corporation, for the U.S. Department of Energy’s National Nuclear Security Administration under contract DE-AC04-94AL85000. Approved for public release; further dissemination unlimited.
Transcript of DAKOTA Reliability Methods applied to RAVEN/RELAP-7 Documents/Reports/DAKOTA_Reliability... ·...

SANDIA REPORTSAND2013-8439Unlimited ReleasePrinted Sept 2013
DAKOTA Reliability Methods applied toRAVEN/RELAP-7
Laura P. Swiler, Diego Mandelli, Cristian Rabiti, Andrea Alfonsi
Prepared bySandia National LaboratoriesAlbuquerque, New Mexico 87185 and Livermore, California 94550
Sandia National Laboratories is a multi-program laboratory managed and operated by Sandia Corporation,a wholly owned subsidiary of Lockheed Martin Corporation, for the U.S. Department of Energy’sNational Nuclear Security Administration under contract DE-AC04-94AL85000.
Approved for public release; further dissemination unlimited.
Issued by Sandia National Laboratories, operated for the United States Department of Energyby Sandia Corporation.
NOTICE: This report was prepared as an account of work sponsored by an agency of the UnitedStates Government. Neither the United States Government, nor any agency thereof, nor anyof their employees, nor any of their contractors, subcontractors, or their employees, make anywarranty, express or implied, or assume any legal liability or responsibility for the accuracy,completeness, or usefulness of any information, apparatus, product, or process disclosed, or rep-resent that its use would not infringe privately owned rights. Reference herein to any specificcommercial product, process, or service by trade name, trademark, manufacturer, or otherwise,does not necessarily constitute or imply its endorsement, recommendation, or favoring by theUnited States Government, any agency thereof, or any of their contractors or subcontractors.The views and opinions expressed herein do not necessarily state or reflect those of the UnitedStates Government, any agency thereof, or any of their contractors.
DE
PA
RT
MENT OF EN
ER
GY
• • UN
IT
ED
STATES OFA
M
ER
IC
A
2

SAND2013-8439Unlimited ReleasePrinted Sept 2013
DAKOTA Reliability Methods applied toRAVEN/RELAP-7
Laura P. SwilerOptimization and Uncertainty Quant.
Sandia National LaboratoriesP.O. Box 5800
Albuquerque, NM [email protected]
Diego MandelliIdaho National Laboratory
2525 Fremont AvenueIdaho Falls, ID 83415
Cristian RabitiIdaho National Laboratory
2525 Fremont AvenueIdaho Falls, ID 83415
Andrea AlfonsiIdaho National Laboratory
2525 Fremont AvenueIdaho Falls, ID 83415
Abstract
This report summarizes the result of a NEAMS project focused on the use of reliability methodswithin the RAVEN and RELAP-7 software framework for assessing failure probabilities as part ofprobabilistic risk assessment for nuclear power plants. RAVEN is a software tool under develop-ment at the Idaho National Laboratory that acts as the control logic driver and post-processing toolfor the newly developed Thermal-Hydraulic code RELAP-7. Dakota is a software tool developed atSandia National Laboratories containing optimization, sensitivity analysis, and uncertainty quan-tification algorithms. Reliability methods are algorithms which transform the uncertainty problemto an optimization problem to solve for the failure probability, given uncertainty on problem inputsand a failure threshold on an output response. The goal of this work is to demonstrate the use ofreliability methods in Dakota with RAVEN/RELAP-7. These capabilities are demonstrated on ademonstration of a Station Blackout analysis of a simplified Pressurized Water Reactor (PWR).
3

Acknowledgments
This work was funded by the Nuclear Energy Advanced Modeling and Simulation (NEAMS) Pro-gram under the Advanced Modeling and Simulation Office (AMSO) in the Nuclear Energy Officein the U.S. Department of Energy. The authors specifically acknowledge the Program Manager ofthe Reactors Product Line, Dr. David Pointer (ORNL), and Dr. Keith Bradley, National TechnicalDirector of NEAMS, for their support of this work. Finally, we thank the RAVEN, RELAP-7, andMOOSE development teams.
4

Contents
1 Introduction 7
2 Reliability Methods 9
2.1 Mean Value Methods . . . . . . . . . . . . . . . . . . . . . . . . . . . . . . . . . . . . . . . . . . . . . . . . . 9
2.2 MPP Search Methods . . . . . . . . . . . . . . . . . . . . . . . . . . . . . . . . . . . . . . . . . . . . . . . . . 10
2.3 Global Reliability Methods . . . . . . . . . . . . . . . . . . . . . . . . . . . . . . . . . . . . . . . . . . . . 13
3 Example Problem: Station Blackout 15
4 Software Framework 17
5 Results 21
References 23
5

List of Figures
2.1 Reliability Optimization Formulation in standard normal space with two normal-ized inputs, u1 and u2. The failure region where g(X) < 0 is shown with shading:various approximations are noted. The Most Probable Point of Failure (MPP) isshown as well as the reliability index β . . . . . . . . . . . . . . . . . . . . . . . . . . . . . . . . . . . 12
3.1 PWR model scheme. . . . . . . . . . . . . . . . . . . . . . . . . . . . . . . . . . . . . . . . . . . . . . . . . . 15
4.1 Schematic of RAVEN driving multiple RELAP-7 Runs for a Monte Carlo Sam-pling Study. . . . . . . . . . . . . . . . . . . . . . . . . . . . . . . . . . . . . . . . . . . . . . . . . . . . . . . . . 17
4.2 Generic Dakota Interface to Simulation . . . . . . . . . . . . . . . . . . . . . . . . . . . . . . . . . . . 18
4.3 Specific Dakota interface to RAVEN/RELAP-7 . . . . . . . . . . . . . . . . . . . . . . . . . . . . 19
5.1 Failure (red dots) and Success (blue dots) points in the input space for the SBOproblem . . . . . . . . . . . . . . . . . . . . . . . . . . . . . . . . . . . . . . . . . . . . . . . . . . . . . . . . . . . 22
6

Chapter 1
Introduction
This report summarizes the result of a NEAMS project focused on the use of reliability meth-ods within the RAVEN/RELAP-7 software framework for assessing failure probabilities as partof probabilistic risk assessment for nuclear power plants. RAVEN [1] is a software tool underdevelopment at the Idaho National Laboratory (INL) that acts as the control logic driver and post-processing tool for the newly developed Thermal-Hydraulic code RELAP-7. Dakota is a softwaretool developed at Sandia National Laboratories (SNL) containing optimization, sensitivity analysis,and uncertainty quantification algorithms. [2] Reliability methods are algorithms which transformthe uncertainty problem to an optimization problem to solve for the failure probability, given un-certainty on problem inputs and a failure threshold on an output response. The goal of this work isto demonstrate the use of reliability methods in Dakota with RAVEN/RELAP-7. These capabili-ties are demonstrated on a demonstration of a Station Blackout analysis of a simplified PressurizedWater Reactor (PWR).
RAVEN (Reactor Analysis and Virtual control ENvironment) is a software tool that provideson-line control and post-processing for the thermal-hydraulic RELAP-7 code (Reactor Excursionand Leak Analysis Program.) [1] [3] RAVEN is a multi-purpose Probabilistic Risk Assessment(PRA) software framework that is designed to derive and actuate the control logic required tosimulate the plant control system and operator actions (guided procedures). It also can performboth Monte-Carlo sampling of random distributed events and event tree based analysis. RAVENhas been developed in a modular way. The RAVEN control logic and calculation driver are inPython, and the RAVEN/RELAP-7 interface is in C++. Note that both RAVEN and RELAP-7 arebased on the MOOSE computational framework [4] which allows for rapid development of codesinvolving the solution of partial differential equations using the finite element method.
RAVEN has capabilities for performing uncertainty quantification (UQ), such as Monte Carlosampling and other sampling methods. The focus of this project is to demonstrate a complementaryclass of algorithms, reliability methods, available in Dakota. In some contexts, reliability methodscan be very efficient at determining probability of failure, requiring much fewer samples (e.g.RELAP-7 code runs) than sampling. We investigate the use of these methods on a problem ofinterest to RAVEN, Station Blackout for a PWR.
The outline of this report is as follows: Section 2 outlines reliability methods. Section 3 out-lines the Station Blackout problem. Section 4 discusses the software integration of Dakota withRAVEN/RELAP-7, and Section 5 presents results.
7

8
Chapter 2
Reliability Methods
Reliability methods are probabilistic algorithms for quantifying the effect of uncertainties on re-sponse metrics of interest. In particular, they perform uncertainty quantification (UQ) by comput-ing approximate response function distribution statistics based on specified probability distribu-tions for input random variables. These response statistics include mean, standard deviation, andcumulative or complementary cumulative distribution function (CDF/CCDF) response level, andprobability/reliability level pairings. These methods are often more efficient at computing statis-tics in the tails of the response distributions (events with low probability) than sampling-based ap-proaches because the number of samples required to resolve a low probability can be prohibitive.Thus, these methods, as their name implies, are often used in a reliability context for assessing theprobability of failure of a system when confronted with an uncertain environment.
Local reliability methods include the Mean Value method and the family of most probable point(MPP) search methods. Each of these methods is gradient-based, employing local approximationsand/or local optimization methods. Global reliability methods include EGRA, the Efficient GlobalReliability Analysis method. Local reliability methods, while computationally efficient, have well-known failure mechanisms. When confronted with a limit state function that is nonsmooth, localgradient-based optimizers may stall due to gradient inaccuracy and fail to converge to an MPP.Moreover, if the limit state is multimodal (multiple MPPs), then a gradient-based local methodcan, at best, locate only one local MPP solution. Finally, reliability methods may fail to adequatelycapture the contour of a highly nonlinear limit state. EGRA, which relies on a global Gaussianprocess surrogate model, is designed to overcome these limitations.
The following subsections explain the reliability methods in more detail. For a thorough expla-nation, the reader is encouraged to read Chapter 1 in the Dakota Theory Manual [5].
2.1 Mean Value Methods
The reliability method approximations are based on a Taylor Series expansion of the response. Theform of the expansions and of the degree of the approximating analytical expression has evolvedover time [6]. The Mean Value method (MV, also known as MVFOSM in [6]) is the simplest,least-expensive reliability method because it estimates the response means, response standard de-viations, and all CDF/CCDF response-probability-reliability levels from a single evaluation of
9

response functions and their gradients at the uncertain variable means. This approximation canhave acceptable accuracy when the response functions are nearly linear and their distributions areapproximately Gaussian, but can have poor accuracy in other situations. The expressions for ap-proximate response mean µg, approximate response variance σ2
g , response target to approximateprobability/reliability level mapping (z̄→ p,β ), and probability/reliability target to approximateresponse level mapping (p̄, β̄ → z) are
µg = g(µx) (2.1)
σ2g = ∑
i∑
jCov(i, j)
dgdxi
(µx)dgdx j
(µx) (2.2)
z̄→ β : βCDF =µg− z̄
σg, βCCDF =
z̄−µg
σg(2.3)
β̄ → z : z = µg−σgβ̄CDF, z = µg +σgβ̄CCDF (2.4)
respectively, where x are the uncertain values in the space of the original uncertain variables (“x-space”), g(x) is the limit state function (the response function for which probability-response levelpairs are needed), and βCDF and βCCDF are the CDF and CCDF reliability indices, respectively.
The first-order CDF probability p(g ≤ z), first-order CCDF probability p(g > z), βCDF, andβCCDF are related to one another through
p(g≤ z) = Φ(−βCDF) (2.5)p(g > z) = Φ(−βCCDF) (2.6)
βCDF = −Φ−1(p(g≤ z)) (2.7)
βCCDF = −Φ−1(p(g > z)) (2.8)
βCDF = −βCCDF (2.9)p(g≤ z) = 1− p(g > z) (2.10)
where Φ() is the standard normal cumulative distribution function. A common convention in theliterature is to define g in such a way that the CDF probability for a response level z of zero (i.e.,p(g ≤ 0)) is the response metric of interest. Second-order methods can also be used to calculcateCDF probability values. The second-order methods incorporate a curvature correction based onthe principle curvatures of the limit state function.
2.2 MPP Search Methods
All other local reliability methods calculate the probability of failure by changing the uncertaintyproblem to an optimization problem. The uncertainty problem we are trying to solve is to calculate
10

a failure probability which is defined by the multi-dimensional integral given below:
Pf ail =∫∫∫
g(x)<0
f (x1,x2, ...,xn)dx1 dx2 ..., dxn (2.11)
The MPP search methods involve the transformation of the user-specified uncertain variables, x,with a probability density function which can be non-normal and correlated, to a space of inde-pendent Gaussian random variables, u, possessing a mean value of zero and unit variance (i.e.,standard normal variables). In standard normal space, the probability contours are circular in na-ture. Also, the multi-dimensional integrals can be approximated by simple functions of a singleparameter, β , called the reliability index. β is the minimum Euclidean distance from the originin the transformed space to the response surface. This point is also known as the most probablepoint (MPP) of failure. The reliability methods use equality-constrained, nonlinear optimizationalgorithms to compute a most probable point (MPP) and then integrate about this point to computeprobabilities. The MPP search is performed in uncorrelated standard normal space (“u-space”)since it simplifies the probability integration: the distance of the MPP from the origin has themeaning of the number of input standard deviations separating the mean response from a partic-ular response threshold. The transformation from correlated non-normal distributions (x-space)to uncorrelated standard normal distributions (u-space) is denoted as u = T (x) with the reversetransformation denoted as x = T−1(u). These transformations are nonlinear in general, and pos-sible approaches include the Rosenblatt [7] and Nataf [8] transformations. A graphic depictingreliability formulation in standard normal space is shown in Figure 2.1.
The forward reliability analysis algorithm of computing CDF/CCDF probability/reliability lev-els for specified response levels is called the reliability index approach (RIA), and the inversereliability analysis algorithm of computing response levels for specified CDF/CCDF probabil-ity/reliability levels is called the performance measure approach (PMA) [9]. The differences be-tween the RIA and PMA formulations appear in the objective function and equality constraintformulations used in the MPP searches. For RIA, the MPP search for achieving the specified re-sponse level z̄ is formulated as computing the minimum distance in u-space from the origin to thez̄ contour of the limit state response function:
minimize uT usubject to G(u) = z̄ (2.12)
where u is a vector centered at the origin in u-space and g(x) ≡ G(u) by definition. For PMA,the MPP search for achieving the specified reliability level β̄ or first-order probability level p̄is formulated as computing the minimum/maximum response function value corresponding to aprescribed distance from the origin in u-space:
minimize ±G(u)subject to uT u = β̄ 2 (2.13)
where β̄ is computed from p̄ using Eq. 2.7 or 2.8.
11

Figure 2.1. Reliability Optimization Formulation in standardnormal space with two normalized inputs, u1 and u2. The failureregion where g(X) < 0 is shown with shading: various approxi-mations are noted. The Most Probable Point of Failure (MPP) isshown as well as the reliability index β .
12
In the RIA case, the optimal MPP solution u∗ defines the reliability index from β = ±‖u∗‖2,which in turn defines the CDF/CCDF probabilities (using Equations 2.5-2.6 in the case of first-order integration).
There are a variety of algorithmic variations that are available for use within RIA/PMA relia-bility analyses. First, one may select among several different limit state approximations that canbe used to reduce computational expense during the MPP searches. Local, multipoint, and globalapproximations of the limit state are possible. For example, a commonly used approximation isa single Taylor series per response/reliability/probability level in x-space centered at the uncer-tain variable means. The first-order approach is commonly known as the Advanced Mean Value(AMV) method:
g(x)∼= g(µx)+∇xg(µx)T (x−µx) (2.14)
and the second-order approach has been named AMV2:
g(x)∼= g(µx)+∇xg(µx)T (x−µx)+12(x−µx)T
∇2xg(µx)(x−µx) (2.15)
In addition, one can expand in u-space, one can use multi-point expansions, one can refine theestimate of the MPP iteratively, and one can perform the MPP search on the limit state directlywithout without the use of any approximations. Combining the last option with first-order andsecond-order integration approaches results in the methods called FORM (first-order reliabilitymethod) and SORM (second-order reliability method). Finally, there are variations on the way onecalculates the Hessian matrix, one can use warm-starts if a sequence of reliability optimizationsare performed, etc. These details are outlined in [5].
2.3 Global Reliability Methods
The global reliability method we use is called EGRA: Efficient Global Reliability Analysis. Itis described in [10]. The idea is to construct an initial Gaussian process model of the responsefunction and then update it strategically, by adding points that are likely to be near the region of thelimit state surface, to get a better approximation of the limit state surface. In brief, EGRA beginswith a Gaussian process model built from a very small number of samples, and then adaptivelychooses where to generate subsequent samples to ensure that the model is accurate in the vicinityof the limit state. The resulting Gaussian process model is then sampled using multimodal adaptiveimportance sampling to calculate the probability of exceeding (or failing to exceed) the responselevel of interest.
By locating multiple points on or near the limit state, more complex and nonlinear limit statescan be modeled, leading to more accurate probability integration. By concentrating the samples inthe area where accuracy is important (i.e. in the vicinity of the limit state), only a small number oftrue function evaluations are required to build a quality surrogate model. The resulting method iscomputationally efficient even for expensive response functions. Note that EGRA does have somelimitations: the response function needs to be well-approximated by a Gaussian process and the
13

Gaussian process construction is limited to at most dozens of random variables: Gaussian processmodels are usually built on ten variables or less. Thus, EGRA is not a method to use if one hashundreds or thousands of random inputs.
EGRA is described in [10] and in the DAKOTA Theory manual.
14

Chapter 3
Example Problem: Station Blackout
In order to show the capabilities of RAVEN coupled with RELAP-7/MOOSE, a simplified PWRPRA analysis has been employed.
Figure 3.1. PWR model scheme.
Figure 3.1 shows the scheme of the PWR model. The reactor vessel model consists of theDown-comers, the Lower Plenum, the Reactor Core Model and the Upper Plenum. Core channels(flow channels with heat structure attached to each of them) were used to describe the reactor core.The core model consists of three parallel core channels and one bypass flow channel. There are twoprimary loops, i.e., loop A and loop B. Each loop consists of the Hot Leg, a Heat Exchanger andits secondary side pipes, the Cold Leg and a primary Pump. A Pressurizer is attached to the LoopA piping system to control the system pressure. A Time Dependent Volume (pressure boundaryconditions) component is used to represent the Pressurizer. Since the RELAP-7 code does nothave the two-phase flow capability yet, single-phase counter-current heat exchanger models areimplemented to mimic the function of steam generators in order to transfer heat from the primaryto the secondary.
The PRA station blackout sequence of events involves the following (starting from a steady-state operational condition of a Nuclear Power Plant [11]):
• 100.0 seconds: transient begins
15
• 101.0 seconds: loss of power grid and immediate shutdown of the reactor(scram):
– Pump coast-down;
– Decay heat power;
– Diesel Generators and residual heat removal system (RHRS) not available.
• t1: recovery of the diesel generators
• t2: end of transient either for clad failure or 2500 seconds of simulation (PRA success)
A PRA analysis has been performed for a Station Black Out accident scenario by sampling theprobability thresholds (i.e. branching triggers) on the CDFs of the recovery time of the diesel gen-erators (DGs) t1 (Normal distribution, mu = 800 s, sigma = 200 s) and the clad failure temperatureTC f (Triangular distribution, xPeak = 1477.591 K, xMin = 1255.372 K, xMax = 1699.82 K [12]).
For this problem, we defined failure to occur if the actual clad temperature in one of three chan-nels tracked in the RAVEN/RELAP-7 simulation became greater than the clad failure temperaturethreshold. The implementation of the software and scripts necessary to assess the probability offailure is described in the next section.
1Typical PRA success criteria.210 CFR50.46 limit.
16

Chapter 4
Software Framework
The software framework is one of the significant accomplishments of this effort. The frameworkinvolves coupling Dakota, RAVEN, and RELAP-7. Typically, RAVEN drives multiple simulationsof RELAP-7 through its “Raven Runner” Python script. Figure 4.1 shows an example of howRAVEN drives multiple RELAP-7 runs to generate a Monte Carlo sample.
Figure 4.1. Schematic of RAVEN driving multiple RELAP-7Runs for a Monte Carlo Sampling Study.
Dakota has a similar role as RAVEN: it iterates over simulation codes, and generates multiplesimulation runs depending on the governing algorithms the user specifies (e.g. optimization, relia-
17
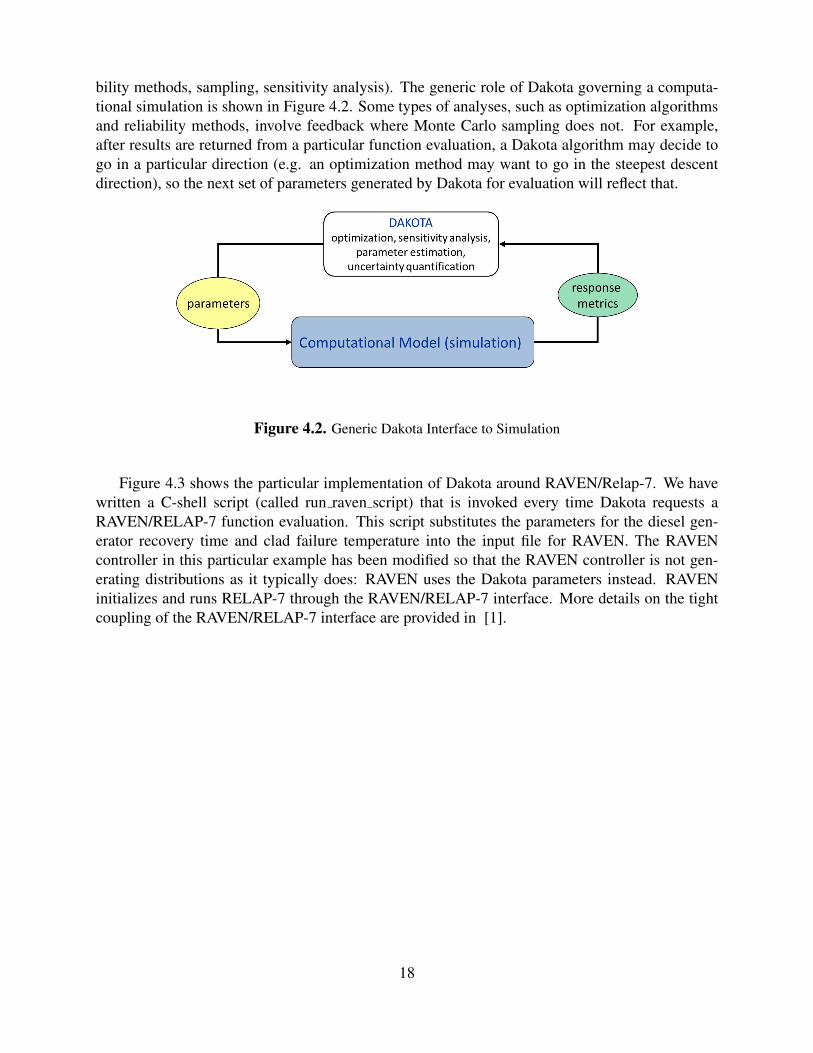
bility methods, sampling, sensitivity analysis). The generic role of Dakota governing a computa-tional simulation is shown in Figure 4.2. Some types of analyses, such as optimization algorithmsand reliability methods, involve feedback where Monte Carlo sampling does not. For example,after results are returned from a particular function evaluation, a Dakota algorithm may decide togo in a particular direction (e.g. an optimization method may want to go in the steepest descentdirection), so the next set of parameters generated by Dakota for evaluation will reflect that.
Figure 4.2. Generic Dakota Interface to Simulation
Figure 4.3 shows the particular implementation of Dakota around RAVEN/Relap-7. We havewritten a C-shell script (called run raven script) that is invoked every time Dakota requests aRAVEN/RELAP-7 function evaluation. This script substitutes the parameters for the diesel gen-erator recovery time and clad failure temperature into the input file for RAVEN. The RAVENcontroller in this particular example has been modified so that the RAVEN controller is not gen-erating distributions as it typically does: RAVEN uses the Dakota parameters instead. RAVENinitializes and runs RELAP-7 through the RAVEN/RELAP-7 interface. More details on the tightcoupling of the RAVEN/RELAP-7 interface are provided in [1].
18

Figure 4.3. Specific Dakota interface to RAVEN/RELAP-7
19

20

Chapter 5
Results
For this problem, we ran 500 Latin Hypercube samples to determine a “baseline” probability offailure, where failure is defined as the actual clad temperature in one of three channels becominggreater than the clad failure temperature level. In the LHS run, 65 samples had a clad temperaturegreater then the failure threshold, resulting in a 13% failure probability. We ran two versions oflocal methods: the mean value method and the advanced mean value method (AMV), each witha Taylor series expansion of the limit state around the mean. These methods performed very wellwith a small number of function evaluations, as shown in Table 5.1. The fact that the mean valuemethod did so well with only three function evaluations points to the fact that this is a fairly linearlimit state that works well in this situation. Note that the mean value method takes a functionevaluation at the mean of the input variables, and two more function evaluations (one in eachdirection of the two uncertain variables) to calculate the derivatives. We used a finite differencerelative step size of 1.e-4. Thus the mean value method involved the following three functionevaluations as shown in Table 5.2. The advanced mean value method performed the same threefunction evaluations, then created a Taylor series expansion which was used in an optimizationstep, with the fourth point being the optimal point from the optimization.
Figure 5.1 shows a graphical depiction of the limit state as a function of the two uncertaininput variables. Finally, EGRA (the global reliability method, gave a good result after 27 functionevaluations. EGRA first constructed six function evaluations (six is the number of points neededin two dimensions to create a second-order regression model). Then, EGRA consecutively addspoints to refine the limit state until the “expected improvement criterion” converges. The expectedimprovement incorporates the accuracy of the limit state with the probability there may be otherpoints which potentially could lie on the limit state.
In summary, this work shows the application of reliability methods to the SBO problem. It is
Table 5.1. Probability of Failure Estimates from Different Methods
Method Number of Function Evaluations Probability of Failure EstimateLatin Hypercube Sampling (LHS) 500 0.13
Local Reliability Mean Value Method 3 0.13006Local Reliability AMV 4 0.14023
Global Reliability (EGRA) 27 0.13211
21
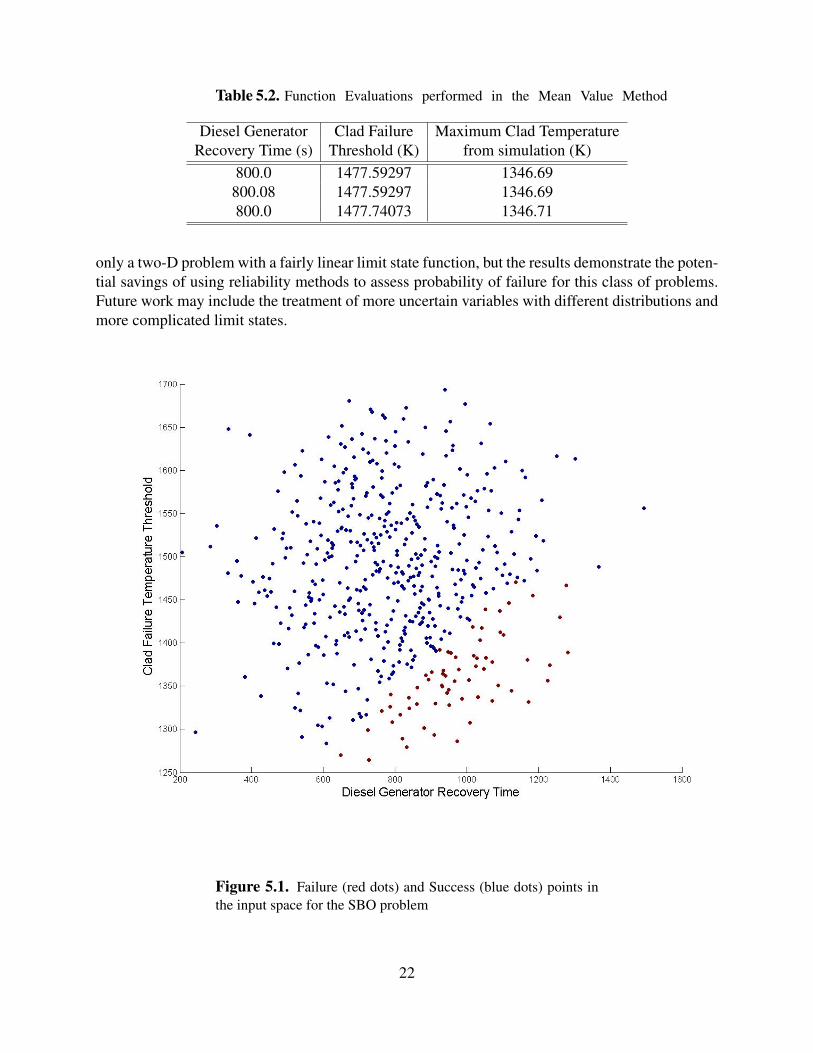
Table 5.2. Function Evaluations performed in the Mean Value Method
Diesel Generator Clad Failure Maximum Clad TemperatureRecovery Time (s) Threshold (K) from simulation (K)
800.0 1477.59297 1346.69800.08 1477.59297 1346.69800.0 1477.74073 1346.71
only a two-D problem with a fairly linear limit state function, but the results demonstrate the poten-tial savings of using reliability methods to assess probability of failure for this class of problems.Future work may include the treatment of more uncertain variables with different distributions andmore complicated limit states.
Figure 5.1. Failure (red dots) and Success (blue dots) points inthe input space for the SBO problem
22

References
A. Alfonsi, C. Rabiti, D. Mandelli, J. J. Cogliati, and R. A. Kinoshita. “RAVEN as a Tool for Dy-namic Probabilistic Risk Assessment: Software Overview.” International Conference on Math-ematics and Computational Methods Applied to Nuclear Science and Engineering, 2013.
B. M. Adams, W. J. Bohnhoff, K. R. Dalbey, J. P. Eddy, M. S. Eldred, P.D. Hough, S. Lefantzi, L.P. Swiler,and D. M. Vigil “DAKOTA: A Multilevel Parallel Object-Oriented Framework for De-sign Optimization, Parameter Estimation, Uncertainty Quantification, and Sensitivity Analysis.Version 5.2 Users Manual,” Sandia Technical Report SAND2010-2183, updated February 2013(Version 5.3).
C. Rabiti, D. Mandelli, A. Alfonsi, J. J. Cogliati, and R. A. Kinoshita. “Mathematical Frameworkfor the Analysis of Dynamic Stochastic Systems with the RAVEN code.” International Confer-ence on Mathematics and Computational Methods Applied to Nuclear Science and Engineering,2013.
D. Gaston, C. Newman, G. Hansen and D. Lebrun-Grandi, “MOOSE: A parallel computationalframework for coupled systems of nonlinear equations,” Nucl. Eng. Des., 239, pp. 1768-1778,(2009). Available at: http://dx.doi.org/10.1016/j.nucengdes.2009.05.021.
B. M. Adams, W. J. Bohnhoff, K. R. Dalbey, J. P. Eddy, M. S. Eldred, P.D. Hough, S. Lefantzi,L. P. Swiler,and D. M. Vigil. “DAKOTA, A Multilevel Parallel Object-Oriented Framework forDesign Optimization, Parameter Estimation, Uncertainty Quantification, and Sensitivity Analy-sis: Version 5.2 Theory Manual.” Sandia Technical Report SAND2011-9106. Updated February2013 (Version 5.3).
A. Haldar and S. Mahadevan. Probability, Reliability, and Statistical Methods in Engineering De-sign. Wiley, New York: 2000.
M. Rosenblatt. “Remarks on a Multivariate Transformation”, Annals of Mathematical Statistics,23, No. 3, pp. 470–472 (1952).
A. Der Kiureghian and P. L. Liu. “Structural Reliability Under Incomplete Information”, J. Eng.Mech., ASCE, 112, pp. 85–104 (1986).
J. Tu and K. K. Choi and Y. H. Park. “A New Study on Reliability-Based Design Optimization.” J.Mech. Design, 121, pp. 557–564 (1999).
B. J. Bichon, M. S. Eldred, L. P. Swiler, S. Mahadevan, and J. M. McFarland. “Efficient GlobalReliability Analysis for Nonlinear Implicit Performance Functions” AIAA Journal, textbf46, no.10, pp. 2459–2468 (2008).
23
D. Anders, R. Berry, D. Gaston, R. Martineau, J. Peterson, H. Zhang, H. Zhao, and L. Zou, “Relap-7 Level 2 milestone report: Demonstration of a steady state single phase pwr simulation withRelap-7,” Tech. Rep. INL/EXT-12-25924, Idaho National Laboratory (INL), 2012.
V. F. Urbanic and T. R. Heidrick. “High-temperature oxidation of Zircaloy-2 and Zircaloy-4 insteam.” Nuclear Materials, 251, No. 75. (1978)
J. C. Helton and F. J. Davis. “Latin Hypercube Sampling and the Propagation of Uncertainty inAnalyses of Complex Systems”, Reliability Engineering and System Safety, 81, no. 1, pp. 23–69(2003).
24

DISTRIBUTION:
1 Keith BradleyNational Technical Directory NEAMSArgonne National Laboratory9700 S. Cass AvenueArgonne, IL 60439
1 David PointerOak Ridge National LaboratoryReactor and Nuclear Systems DivisionP. O. Box 2008, Bldg. 5700, MS-6167Oak Ridge, TN 37831
1 Richard MartineauIdaho National Laboratory2525 Fremont AvenueIdaho Falls, ID 83415
1 Cristian RabitiIdaho National Laboratory2525 Fremont AvenueIdaho Falls, ID 83415
1 Diego MandelliIdaho National Laboratory2525 Fremont AvenueIdaho Falls, ID 83415
1 Andrea AlfonsiIdaho National Laboratory2525 Fremont AvenueIdaho Falls, ID 83415
1 MS 1318 J.R. Stewart, 014411 MS 1318 B.M. Adams, 014411 MS 1318 L.P. Swiler, 014411 MS 1318 V.G. Weirs, 014411 MS 1318 V.A. Mousseau, 014441 MS 1318 R.M. Summers, 014441 MS 0899 Technical Library, 9536 (electronic copy)
25

26

v1.38
27