Daisyworld & Diabetes Peter Saunders Department of Mathematics Kings College, London .
Upload
leo-atkinsCategory
view
218download
0
Daisyworld & Feedback EffectsKump Chapter 2Tark Hamilton


Average Climate Response of the 5 Largest Volcanic Eruptions (1883-1991)
Krakatau (1883), Santa Maria (1902), Agung (1963), El Chichón (1982), Pinatubo (1991)

Mt. Pinatubo Luzon, Philippines
June 12, 1991-3days VEI=6 Event
10 km3 of tephra 20 Mtons of SO2
-0.5°C coolingO3 depletion
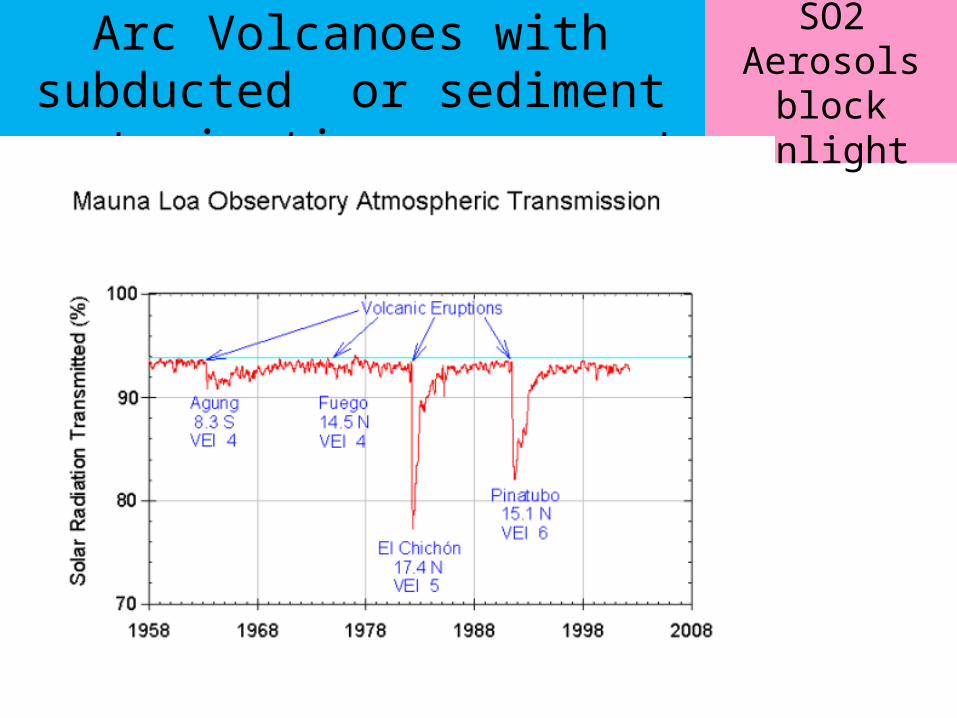
SO2 Aerosols block sunlight
Arc Volcanoes with subducted or sediment contamination are worst


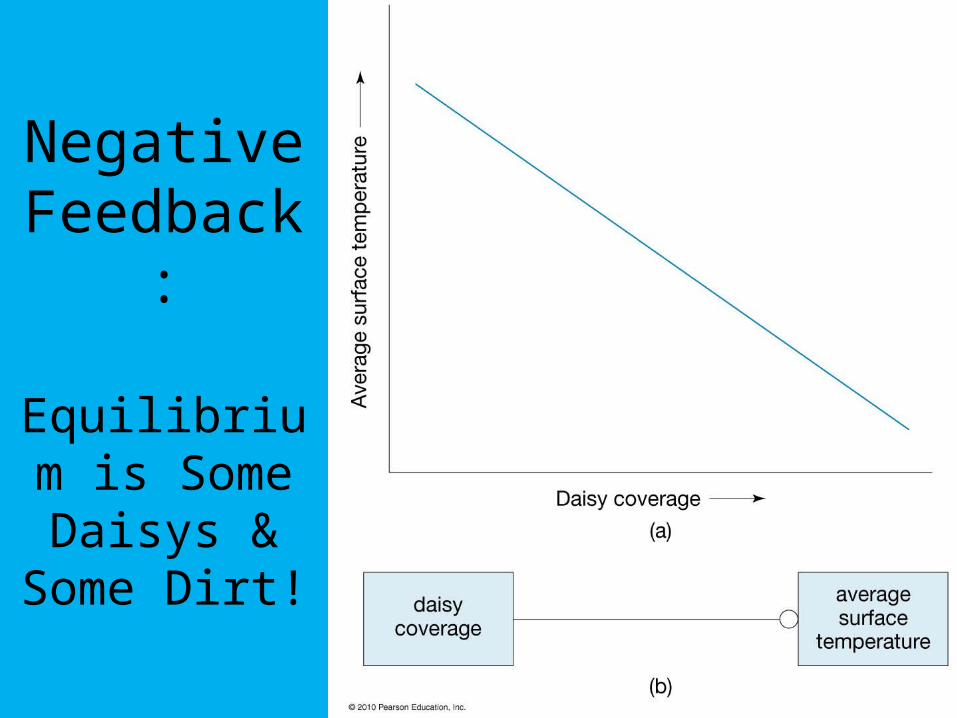
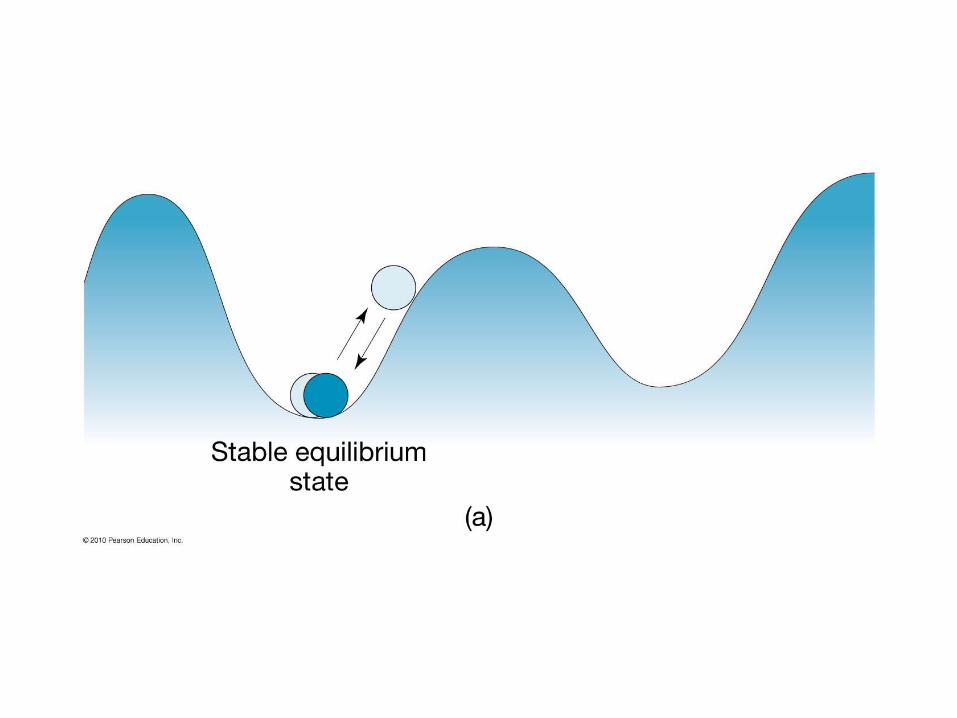
Negative Feedback:
Equilibrium is Some Daisys &
Some Dirt!


Designing Graphs: Data Display (measurements points, details) versus
Concepts (general trends)(both are auto-scaled to show the range of variation)
Daily Temperature Variation


Systems Diagram
Graphic for how Surface Temperature Affects Daisy
Coverage

Two Forcing Functions: Surface
Temperature on Daisies (Curve) vs Daisys on Surface Temperature
(line)
& Equilibrium Diagram: P1 stable versus P2 unstable


Negative Feedback is Stable Equilibrium
Positive Feedback is unstable, runaway heating

Increased Solar
Luminosity increases
heat at constant
Daisy Coverage

Increasing Solar Luminosity Shifts Equilibria, while White Daisys still
reflect heat the same way: i.e. Just different stable %
coverage

Response of Daisyworld to Luminosity
ΔTeq = ΔT0 + ΔTf
Where: ΔT0 w/o feedback
ΔTeq < ΔT0
and ΔTf < 0

P1 shifts because of negative feedback

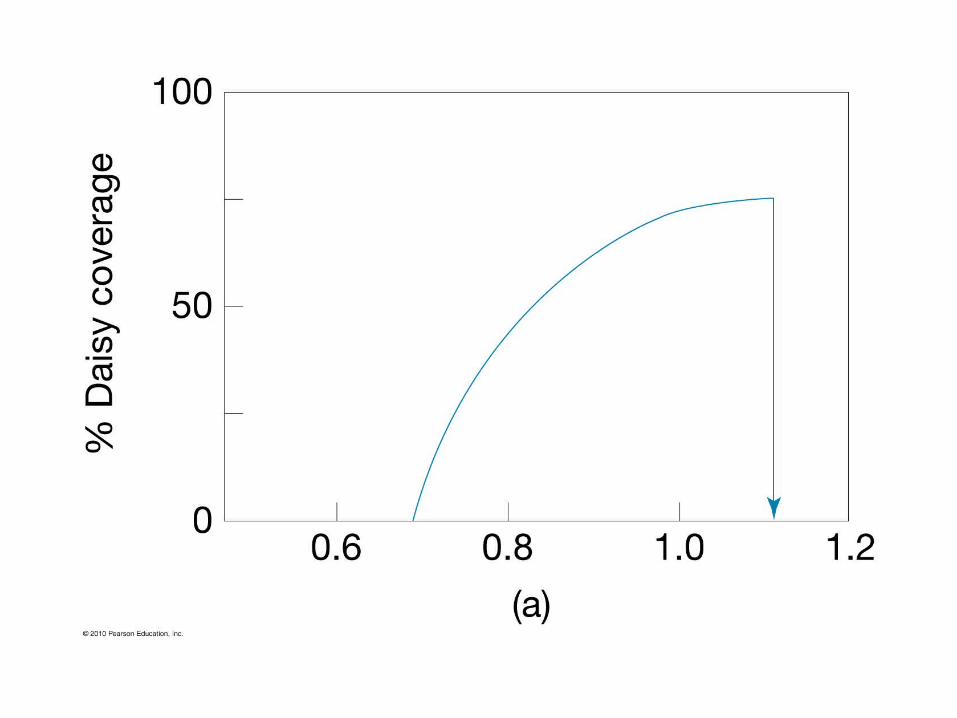
a) Daisyworld’s response to Increased
Luminosity (neg. feedback on T°C)
b) Lifeless Planet with fixed albedo

Captain Kirk
would never have
expected the blue curve!