DairyRoadmapDETAILS 2010-2016
20
THE DAIRY ROAD MAP 2010-2016 A Medium Term Dairy Development Plan National Dairy Authority PHILIPPINES 12 November 2010
-
Upload
junalee-cuansing-sabugal -
Category
Documents
-
view
222 -
download
0
Transcript of DairyRoadmapDETAILS 2010-2016

8/4/2019 DairyRoadmapDETAILS 2010-2016
http://slidepdf.com/reader/full/dairyroadmapdetails-2010-2016 1/20
THE
DAIRY
ROAD MAP 2010-2016
A Medium Term Dairy Development Plan
National Dairy Authority
PHILIPPINES
12 November 2010

8/4/2019 DairyRoadmapDETAILS 2010-2016
http://slidepdf.com/reader/full/dairyroadmapdetails-2010-2016 2/20
DAIRY ROADMAP 2010-2016A Medium Term Dairy Development Plan
National Dairy Authority
Planning & Management Services Department
The Philippines‟ Dairy Road Map 2010-2016 is designed to serve as the
blueprint of achieving the vision of a vibrant local dairy industry providingwholesome, affordable milk to delighted consumers, building a nation of
healthier children and wealthier farmers, while contributing to agribusinessexpansion and job generation in agriculture.
The existing stocks were not enough to produce the milk requirements thatwill create an impact in terms of achieving sufficiency in the liquid milk
market.
The present picture of the local dairy industry shows that local milk
production captures 26% of the liquid milk supply as the local milk production is pegged at an average of 11.67M liters.
YEARRTD
DEMANDSUPPLY LOCAL IMPORT GAP
1995 28.95 24.66 12.58 12.08 4.29
1996 32.13 29.88 11.50 18.38 2.25
1997 38.48 37.11 10.22 26.89 1.37
1998 41.02 31.32 9.24 22.08 9.70
1999 46.09 29.05 9.85 19.20 17.04
2000 48.63 33.02 10.21 22.81 15.61
2001 51.04 50.75 10.80 39.95 0.29
2002 53.45 54.10 11.00 43.10 (0.65)
2003 58.27 50.10 11.25 38.85 8.17
2004 60.48 55.81 11.61 44.20 4.672005 62.69 58.92 12.34 46.58 3.77
2006 67.11 51.61 12.87 38.74 15.50
2007 69.52 58.64 13.43 45.21 10.88
2008 71.93 51.34 13.81 37.53 20.59
2009 76.74 54.27 14.27 40.00 22.47
AVERAGEas of
1July2010
53.77 44.71 11.67 33.04 9.06
83% 26% 74% 17% of Demand of Supply of Supply of Demand

8/4/2019 DairyRoadmapDETAILS 2010-2016
http://slidepdf.com/reader/full/dairyroadmapdetails-2010-2016 3/20

8/4/2019 DairyRoadmapDETAILS 2010-2016
http://slidepdf.com/reader/full/dairyroadmapdetails-2010-2016 4/20
DAIRY ROADMAP 2010-2016A Medium Term Dairy Development Plan
National Dairy Authority
Planning & Management Services Department
will be pursued in collaboration with the Departments of Education, Social
Welfare and Development and Health, local government units and other political parties, foundations and welfare groups.
Dairy enterprise development programs will continue to be in place insupport to the above programs. These include, but not limited to, milk quality assurance, infrastructure development, continuous education andtraining, technical services and dairy systems development, cooperative
and enterprise development, research and development and public-private partnerships.
BJECTIVES
The main objective is to gain significant sufficiency level in the Ready toDrink (RTD) Milk Market from the present 19% to more than double (43%)by 2016.
PARAMETERSJuly
20102011 2012 2013 2014 2015 2016
TOTAL MILK DEMAND*(BLiters) 1.77 1.80 1.84 1.87 1.90 1.94 1.97
RTD SHARE (%) 4.5% 4.6% 4.8% 4.9% 5.1% 5.3% 5.6%
RTD DEMAND
(MLiters)79.14 82.44 87.38 92.57 98.02 103.73 109.68
RTD MILK SUPPLY(MLiters) 58.45 72.89 77.95 83.36 89.10 95.19 101.62
DEMAND-SUPPLY GAP
(MLiters) 20.69 9.55 9.43 9.22 8.93 8.54 8.07
GAP RATE (%) 26% 12% 11% 10% 9% 8% 7%
RTD Milk Imports(MLiters) 43.08 48.26 49.57 50.84 52.08 53.28 54.46
LOCAL MILK PRODUCTION
(MLiters) 15.37 24.63 28.38 32.51 37.02 41.90 47.16
LOCAL MILK SHARE(% of Supply)
26% 34% 36% 39% 42% 44% 46%
LOCAL MILK SUFFICIENCY
(% of Demand) 19% 30% 32% 35% 38% 40% 43%
*Projected Milk demand was derived on the latest milk caput per province as gathered
from the Family Income and Expenditures Survey 2006 (see Milk Caput Table)
O
8/4/2019 DairyRoadmapDETAILS 2010-2016
http://slidepdf.com/reader/full/dairyroadmapdetails-2010-2016 5/20
DAIRY ROADMAP 2010-2016A Medium Term Dairy Development Plan
National Dairy Authority
Planning & Management Services Department
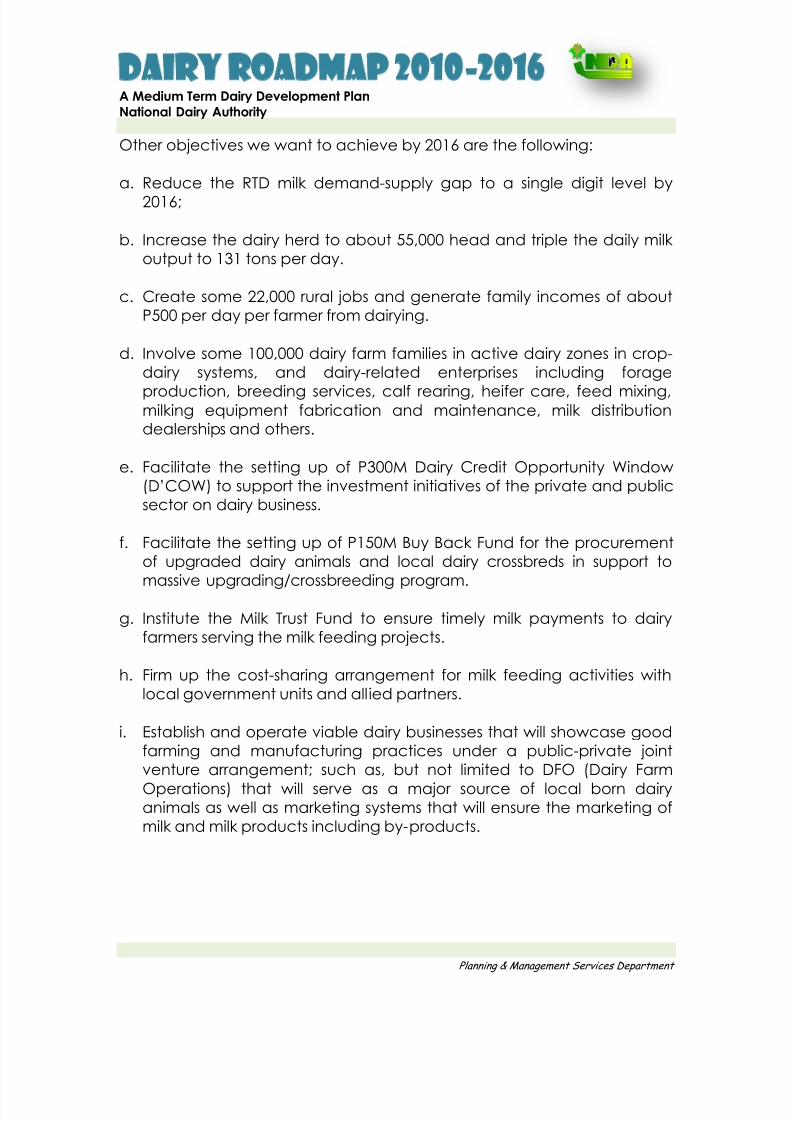
Other objectives we want to achieve by 2016 are the following:
a. Reduce the RTD milk demand-supply gap to a single digit level by
2016;
b. Increase the dairy herd to about 55,000 head and triple the daily milk output to 131 tons per day.
c. Create some 22,000 rural jobs and generate family incomes of aboutP500 per day per farmer from dairying.
d. Involve some 100,000 dairy farm families in active dairy zones in crop-dairy systems, and dairy-related enterprises including forage
production, breeding services, calf rearing, heifer care, feed mixing,milking equipment fabrication and maintenance, milk distributiondealerships and others.
e. Facilitate the setting up of P300M Dairy Credit Opportunity Window(D‟COW) to support the investment initiatives of the private and publicsector on dairy business.
f. Facilitate the setting up of P150M Buy Back Fund for the procurementof upgraded dairy animals and local dairy crossbreds in support tomassive upgrading/crossbreeding program.
g. Institute the Milk Trust Fund to ensure timely milk payments to dairyfarmers serving the milk feeding projects.
h. Firm up the cost-sharing arrangement for milk feeding activities withlocal government units and allied partners.
i. Establish and operate viable dairy businesses that will showcase goodfarming and manufacturing practices under a public-private jointventure arrangement; such as, but not limited to DFO (Dairy Farm
Operations) that will serve as a major source of local born dairyanimals as well as marketing systems that will ensure the marketing ofmilk and milk products including by-products.

8/4/2019 DairyRoadmapDETAILS 2010-2016
http://slidepdf.com/reader/full/dairyroadmapdetails-2010-2016 6/20
DAIRY ROADMAP 2010-2016A Medium Term Dairy Development Plan
National Dairy Authority
Planning & Management Services Department
Below are the annual targets of the dairy road map per major program:
PERFORMANCE
INDICATOR
2010 2011 2012 2013 2014 2015 2016
MILK
MARKET
DEVT
Market
Alliance
Firmed-up
1 3 5 7 10 12 15
Captive Local
Milk Share (%)26% 34% 36% 39% 42% 44% 46%
Captive
Premium Milk
Products
Share (%)
3% 3% 4% 4% 5% 5% 6%
MILK &
HERD
BUILD-UP
Growth Target 7.7% 60.2% 15.3% 14.6% 13.9% 13.2% 12.5%
Milk
Production
(M liters)15.37 24.63 28.38 32.51 37.02 41.90 47.16
Daily Milk
Yield (Tons)42.69 68.40 78.84 90.31 102.83 116.39 131.00
Milking Herd
(Head)16,933 21,892 22,844 23,710 24,478 25,142 25,701
Daily Milk
Yield Per Cow
(Liters/day)3.33 5.00 5.60 6.27 7.02 7.87 8.81
Infusion 500 4,000 1,100 1,100 1,100 1,100 1,100
Upgraded 5,000 10,000 10,000 10,000 10,000 5,000
Dairy Herd 36,255 46,897 48,956 50,836 52,513 53,974 55,218
DAIRY
ENTERPRISE
DEVT
Public-Private
Breeding
Farms
Operating
2 4 7 10 12 15 15
Dairy Zones
Operating20 25 40 60 80 100 100
NATIONAL
MILK
FEEDING
Children Milk
Fed
(M kids)0.775 0.800 0.850 0.900 0.950 1.000 1,000
Rehabilitation
Rate90% 90% 90% 90% 90% 90% 90%

8/4/2019 DairyRoadmapDETAILS 2010-2016
http://slidepdf.com/reader/full/dairyroadmapdetails-2010-2016 7/20
DAIRY ROADMAP 2010-2016A Medium Term Dairy Development Plan
National Dairy Authority
Planning & Management Services Department
TRATEGIES
To attain the above objectives and targets, we will apply the BUILD-UP* strategy:
uy more animals. We will need to infuse utmost 10,000 dairy animals within thenext 5 years to build the desired milking herd of about 55,000 head of cattle,
buffalo and goat producing 47 million liters of milk by 2016 capturing 43% of theliquid milk market. Also, we will maximize the potential dairy animals from our existing livestock population via the upgrading program.
pgrade local animals. These upgrading efforts will be in consonance with theDairy Cattle Genetic Program and will be done in collaboration with Local
Government Units and Contract Breeding Arrangements will be pursued with
beef cattle ranches and farms.
nvite Private-Public Partnership. The establishment of dairy breeding farms will
be a public- private endeavor whereby the land and the dairy animals will be
provided by the government while the private partner will provide for the
management and operating expenses. The government will also be networkingwith active private associations like the Philippine Chamber of Commerce &Industries in the establishment of processing facilities, marketing systems andoperation of viable dairy businesses.
Ighten the credit burden by crafting special credit window and augmenting
the Dairy Credit Fund. The existing Dairy Credit Facility which now stands atP50M will be augmented to about P300 Million for post harvest and marketfacilities as well as a buy back assurance of dairy animals from upgradingprogram and local breeding farms.
evelop more Dairy Zones for rural growth. The current 19 dairy zones all over the country will be expanded and more new dairy zones will be opened up
creating more rural employment and boosting economic growth.
nify efforts of government and non-government agencies. Government
agencies such as Livestock Development Council, Philippine CarabaoCenter, Bureau of Animal Industry and the National Dairy Authority will join
resources in developing the local dairy industry in collaboration with the DairyConfederation of the Philippines, Phil ippine Chamber of Commerce & Industries,Academic Institutions and social-civic groups.
romote the consumption of locally produced milk and premium milk products in order to encourage investment in production, processing, marketing and
distribution and thus help sustain the health and economic contribution of dairyto rural and national development
SB
U
I
L
D
U
P

8/4/2019 DairyRoadmapDETAILS 2010-2016
http://slidepdf.com/reader/full/dairyroadmapdetails-2010-2016 8/20
DAIRY ROADMAP 2010-2016A Medium Term Dairy Development Plan
National Dairy Authority
Planning & Management Services Department
RITERIA FOR MEASURING PROGRESS
Based on the identified objectives, the following criteria shall be used tomeasure the achievements of the Dairy Sector:
Enhanced Food Security. A dairy farmer and his family are assured ofmeeting the recommended daily allowance for calcium and proteinintake by providing them cheap access to milk which the farmer himselfharvests daily. On the other hand, the dairy farmers supply the milk
requirement for milk feeding activities.
At the end of the program, more than 1,000,000 children beneficiaries
nationwide will be served at a target improvement rate of not lower than90% is projected to be reached.
Improved Poverty Alleviation and Social Equity. The Dairy RoadMap willcreate 22,000 full-time rural jobs within the covered period. This provides
thousands of members of the rural population to improve their quality oflife by engaging in dairy-related activities. For the next six (6) years,
projected employment generated is as follows:
Employment GenerationDairy RoadMap 2010-2016
PARTICULARS 2010 2011 2012 2013 2014 2015 2016
ON FARM
JOBS4,269 6,840 7,884 9,031 10,283 11,639 13,100
EX-FARM JOBS 2,989 4,788 5,519 6,322 7,198 8,147 9,170
TOTAL DAIRY
JOBS7,258 11,629 13,402 15,353 17,481 19,787 22,270
Enhanced Income and Profitability. A dairy farmer with a 5-cow module
will generate for him a family income of about P500 (3 milking cows x 8liters/cow x P20/liter) per day from dairying. In a dairy zone complete withprocessing and marketing facilities, several employment opportunities are
made available in various forms which translate to income generated byour rural communities.
C

8/4/2019 DairyRoadmapDETAILS 2010-2016
http://slidepdf.com/reader/full/dairyroadmapdetails-2010-2016 9/20
DAIRY ROADMAP 2010-2016A Medium Term Dairy Development Plan
National Dairy Authority
Planning & Management Services Department
Enhanced Sustainability. The implementation of milk feeding activitiesensures that the program will be carried out continuously by instituting a
cost-sharing scheme with local government units and other sponsors. Thelimited budget for the MFP is augmented by funds coming fromsponsorships of LGUs and allies in the industry.
Within the development period, a Milk Trust Fund will have been
established intended to generate matching funds for milk feedingprograms. This will ensure that farmers who supply milk to the MFP willreceive timely payments for their milk produce. In so doing, it further
enhances the market for raw milk coming from dairy cooperatives as theysimultaneously develop commercial niches for Philippine-made dairy
products.
Below is the working logical framework for the Dairy Road Map 2010-2016:
MAJOR FINAL
OUTPUTS Objectively Verifiable Indicators Means of Verification
Enhanced Food
Security
Per capita Milk consumption in dairyzones as against Per capita RDA Dairy Project Area
ProfileIncreased Dairy Herd & Milk Production
Expanded Milk Feeding CoverageNutrition improvement rate MFP Terminal reports
Improved PovertyAlleviation and
Social Equity
Employment generated from dairying anddairy-related activities
NDA Annual ReportAccomplishment
Reports
EnhancedIncome andProfitability
Number of dairy enterprises and farmersengaged in dairying
Dairy Zone Profiles
Average family income earned by dairyfarmers
No. of dairy farmers with daily cash flow of
P500/day
Family Income &Expenditure Survey
Enhanced
Sustainability
Milk Trust Fund generatedMilk Fund Report &
Bank StatementsRegular Sponsorship in Milk Feeding
activitiesNDA Annual ReportMFP Terminal reports
Identified and Defined MarketChannels/Value Chains
Consultation/Dialogue& Alliance withStakeholders

8/4/2019 DairyRoadmapDETAILS 2010-2016
http://slidepdf.com/reader/full/dairyroadmapdetails-2010-2016 10/20
DAIRY ROADMAP 2010-2016A Medium Term Dairy Development Plan
National Dairy Authority
Planning & Management Services Department
ONTRIBUTION TO PHILIPPINE AGRICULTURE & ECONOMY
Investments on the development of the Philippine dairy industry usher inan increase in rural economic activities with the active trading of milk,animals and farm inputs as well as an increase in the demand for farm
labor, banking, transport, milk handling and other logistical services.
Improvement in the nutritional status and milk food supply of the dairycommunities is assured as farmers are encouraged to keep milk for home
consumption, encouraging members of their families to drink milk or use itfor day-to-day cooking. At the same time, neighbors are expected to
patronize local milk produce. The local governments units (LGUs) and
other entities would have likewise invested in the nutritional needs ofchildren constituents through milk feeding programs. In turn, these milk feeding programs develop a taste for milk and act as market propellers
for the milk produce.
Steadily, albeit modest, dairy has contributed 17% to livestock growth and
will significantly contribute more should appropriate funding be madeavailable.
On top of all these, about $1B dollars can be saved through the increase
in local milk production and reduction of milk importation and would thus
contribute to the creation of more stimuli for economic growth in thecountry.
Clearly, dairying contributes to increasing farm incomes thus reducingrural poverty incidence, nutritional upliftment, household food security,employment generation and instilling discipline among dairy farmers in
producing high quality milk on time and dollar savings. It is progressing as
far as its dairy animal resources can support and will continue to do so.
C
Livestock
Sector
Volume- „000 MT Value – million Pesos
2009 2010%
Growth 2009 2010%
Growth
Carabao 70.16 74.39 6.03% 4,489.54 5,182.75 15.44%
Cattle 117.79 122.84 4.29% 9.153.46 10,072.88 10.04%
Hog 900.44 914.88 1.60% 79,114.19 85,806.60 12.73%
Goat 38.78 39.10 0.83% 3,413.03 3,610.89 5.80%
Dairy 6.90 8.10 17.39% 205.34 241.14 17.43%

8/4/2019 DairyRoadmapDETAILS 2010-2016
http://slidepdf.com/reader/full/dairyroadmapdetails-2010-2016 11/20
DAIRY ROADMAP 2010-2016A Medium Term Dairy Development Plan
National Dairy Authority
Planning & Management Services Department
MPLEMENTABLE PROGRAMS
A Market Development Program (MDP) that will promote andinstitutionalize marketing partnerships among government, non-government organizations, milk/food companies and local dairycooperatives as a concrete mechanism to support the public-privatepartnership (PPP) thrust of the current administration.
A Herd Build-Up Program via the implementation of unique projects likeDagdag-Hayop (Animal Infusion), Sagip-Hayop (Save-the-Herd), and Palit-Hayop (Animal for Animal) that will accelerate animal trading amongdairy entrepreneurs. This will incorporate calf rearing/grow-out schemes,cow/heifer management and impregnation schemes; and, the
upgrading of local animals. To ensure the flow of transactions that will
direct the animals to those who find dairying more profitable, the NDA isworking out with financing institutions the appropriate guidelines that willmake financing accessible to these various schemes. A featureappreciated by participating dairy farmers is the repayment-in-kind that
allows them to pay for a dairy animal loan with another dairy animal.Hence, dairy genetics are preserved and the continuous local sourcing ofdairy animals is enhanced.
A Dairy Enterprise Development Program that will enhance farmers‟
income from rice, coconut and other crops through crop-dairy systems.This program focuses on farmer profitability that will promote earning daily
cash flows through direct milk sales at the farm level and generate the“weekly milk payroll” for dairy farmers at the enterprise level. On a higher
scale, a product development and marketing program will help launch
premium, high-end products for enhanced commercialization givenefficient design and utilization of dairy facilities and established milk
standards. Through this, a stronger leverage is gained in promoting theabsorption of local milk production by commercial processors andinstitutional milk markets.
A National Milk Feeding Program that promotes cost-sharing with localgovernment units to attain the twin objectives of addressing malnutrition
and at the same time, creating livelihood opportunities that build theasset base and increase farm incomes. For sustainability, the dairy
enterprise is assured of a stable market in its early stages of developmentthereby ensuring prompt payment for milk. Partner LGUs are invited toestablish a co-managed Milk Trust that will pay for local milk feedingprograms.
I

8/4/2019 DairyRoadmapDETAILS 2010-2016
http://slidepdf.com/reader/full/dairyroadmapdetails-2010-2016 12/20
DAIRY ROADMAP 2010-2016A Medium Term Dairy Development Plan
National Dairy Authority
Planning & Management Services Department
UDGET REQUIREMENTAnnual budget needed is approximately P2.41B as shown below:
Value in Million Pesos
PARTICULARS BASIS 2010 2011 2012 2013 2014 2015 2016 AVERAGE
SOCIAL MARKETING(Milk Feeding)
children beneficiaries
(M) 0.775 0.800 0.850 0.900 0.950 1.000 1.000 0.896
@P1,200.00/child 930.00 960.00 1,020.00 1,080.00 1,140.00 1,200.00 1,200.00 1,075.71
COMMERCIAL MARKETING(Fresh Milk & Premium Milk
Products)
Alliance Firmed up 1 3 5 7 10 12 15 8
@P30M/alliance 30.00 90.00 150.00 210.00 300.00 360.00 450.00 227.14
DAIRY ANIMAL INFUSIONImported Animals 500 4000 1100 1100 1100 1100 1100 1429
@P0.130M/head 65.00 520.00 143.00 143.00 143.00 143.00 143.00 185.71
LOCAL ANIMALS UPGRADINGAnimals Upgraded 5,000 10,000 10,000 10,000 10,000 5,000 8,333
@P5T/head 25.00 50.00 50.00 50.00 50.00 25.00 41.67
BUY-BACK FUND@20% harvest rate 1,000 2,000 2,000 2,000 2,000 1,000 1,667
@P75T/head 75.00 150.00 150.00 150.00 150.00 75.00 125.00
Private-Public Partnerships
Promotion & Mobilization
PPP set up/run 2 4 7 10 12 15 15 9
@P15M/PPP 30.00 60.00 105.00 150.00 180.00 225.00 225.00 139.29Credit Augmentation Fund P300M/year 50.00 300.00 300.00 300.00 300.00 300.00 300.00 264.29
SUB-TOTAL 1,105.00 2,030.00 1,918.00 2,083.00 2,263.00 2,428.00 2,418.00 2,058.81
Program Management Cost 10% Thereof 110.50 203.00 191.80 208.30 226.30 242.80 241.80 205.88
General Administration 7% Thereof 77.35 142.10 134.26 145.81 158.41 169.96 169.26 144.12
TOTAL 1,292.85 2,375.10 2,244.06 2,437.11 2,647.71 2,840.76 2,829.06 2,408.81
B

8/4/2019 DairyRoadmapDETAILS 2010-2016
http://slidepdf.com/reader/full/dairyroadmapdetails-2010-2016 13/20
DAIRY ROADMAP 2010-2016A Medium Term Dairy Development Plan
National Dairy Authority
Planning & Management Services Department
MPLEMENTING AGENCIES
LEAD AGENCY NATIONAL DAIRY AUTHORITY
COOPERATINGAGENCIES
LIVESTOCK DEVELOPMENT COUNCIL
PHILIPPINE CARABAO CENTERBUREAU OF ANIMAL INDUSTRY
DAIRY RESEARCH & TRAINING INSTITUTEDAIRY CONFEDERATION OF THE PHILIPPINESPHILIPPINE CHAMBER OF COMMERCE & INDUSTRY
PHILLIPINE ASSOCIATION OF FOOD MANUFACTURERS
I

8/4/2019 DairyRoadmapDETAILS 2010-2016
http://slidepdf.com/reader/full/dairyroadmapdetails-2010-2016 14/20
referencesDAIRY ROADMAP 2010-2016A Medium Term Dairy Development Plan
National Dairy Authority
Planning & Management Services Department
PHILS 20.37
REGION MILK CAPUT(LITERS/YR)
NCR 34.91
BATANGAS 24.60
CAVITE 24.60
LAGUNA 24.60
MARINDUQUE 24.60
OCC MINDORO 24.60
OR MINDORO 24.60
PALAWAN 24.60
QUEZON 24.60
RIZAL 24.60
ROMBLON 24.60
Compostela Valley 20.94DAVAO 20.94
Davao Del Sur 20.94
Davao Oriental 20.94
AURORA 19.94
BATAAN 19.94
BULACAN 19.94
NUEVA ECIJA 19.94
PAMPANGA 19.94
TARLAC 19.94
ZAMBALES 19.94
ABRA 17.94
APAYAO 17.94
BENGUET 17.94
IFUGAO 17.94
KALINGA 17.94
MT PROVINCE 17.94
ILOCOS NORTE 16.20
ILOCOS SUR 16.20
LA UNION 16.20
PANGASINAN 16.20
ALBAY 15.46
CAMARINES NORTE 15.46
CAMARINES SUR 15.46
CATANDUANES 15.46
MASBATE 15.46
SORSOGON 15.46
BATANES 15.27
CAGAYAN 15.27
ISABELA 15.27
NUEVA VIZCAYA 15.27
QUIRINO 15.27
AKLAN 14.89
ANTIQUE 14.89
CAPIZ 14.89
GUIMARAS 14.89
ILOILO 14.89
NEGROS OCC 14.89
BOHOL 14.29
CEBU 14.29
NEGROS OR 14.29
SIQUIJOR 14.29
ISABELA CITY 13.12
ZAMBOANGA DEL NORTE 13.12
ZAMBOANGA DEL SUR 13.12
ZAMBOANGA SIBUGAY 13.12
BUKIDNON 11.62
CAMIGUIN 11.62
LANAO DEL NORTE 11.62
MISAMIS OCC 11.62
MISAMIS OR 11.62
Agusan Del Norte 10.56
Agusan Del Sur 10.56
Surigao Del Norte 10.56
Surigao Del Sur 10.56
BILIRAN 10.30
EASTERN SAMAR 10.30
LEYTE 10.30
NORTHERN SAMAR 10.30
SAMAR 10.30
SOUTHERN LEYTE 10.30
Cotabato 9.86
Cotabato City 9.86
Saranggani 9.86
South Cotabato 9.86
Sultan Kudarat 9.86
BASILAN 8.74
Lanao Del Sur 8.74Maguindanao 8.74
Sulu 8.74
Tawi-Tawi 8.74
MILK CAPUT TABLE 2006
Source: Family Income & Expenditure Survey 2006

8/4/2019 DairyRoadmapDETAILS 2010-2016
http://slidepdf.com/reader/full/dairyroadmapdetails-2010-2016 15/20
referencesDAIRY ROADMAP 2010-2016A Medium Term Dairy Development Plan
National Dairy Authority
Planning & Management Services Department
y = 0.0773x2 + 1.8672x + 31.845
y = 0.1806x2 - 2.6464x + 17.69
y = 12.795x0.4686
-
20.00
40.00
60.00
80.00
100.00
120.00
140.00
19951996199719981999200020012002200320042005200620072008200920102011201220132014201520162017201820192020
Million Liters READY-TO-DRINK MILK TREND(WITH INTERVENTION)
SUPPLY LINE
IMPORT LINE
LOCAL LINE
DEMAND LINE

8/4/2019 DairyRoadmapDETAILS 2010-2016
http://slidepdf.com/reader/full/dairyroadmapdetails-2010-2016 16/20
referencesDAIRY ROADMAP 2010-2016A Medium Term Dairy Development Plan
National Dairy Authority
Planning & Management Services Department
DISTRIBUTION MAP 2010
DAIRY PRODUCING AREAS

8/4/2019 DairyRoadmapDETAILS 2010-2016
http://slidepdf.com/reader/full/dairyroadmapdetails-2010-2016 17/20
referencesDAIRY ROADMAP 2010-2016A Medium Term Dairy Development Plan
National Dairy Authority
Planning & Management Services Department
DISTRIBUTION MAP 2010DAIRY FARMERS

8/4/2019 DairyRoadmapDETAILS 2010-2016
http://slidepdf.com/reader/full/dairyroadmapdetails-2010-2016 18/20
referencesDAIRY ROADMAP 2010-2016A Medium Term Dairy Development Plan
National Dairy Authority
DAIRY PERFORMANCE INDICATORS
INDICATORS 2010 2011 2012 2013 2014 2015 2016
Planning & Management Services Department
POPULATION 93.90 95.61 97.35 99.12 100.93 102.77 104.45
Population Growth 1.95% 1.82% 1.82% 1.82% 1.82% 1.82% 1.64%
FRESH MILK CAPUT (kg/yr) 0.84 0.86 0.90 0.93 0.97 1.01 1.05
%RDA (1.36kg/yr) 62% 63% 66% 69% 71% 74% 77%
ESTIMATED TOTAL RTD MILK
DEMAND (MLITERS)79.14 82.44 87.38 92.57 98.02 103.73 109.68
DEMAND GROWTH 3% 4% 6% 6% 6% 6% 6%
ESTIMATED TOTAL RTD MILK
SUPPLY (MLITERS)58.45 72.89 77.95 83.36 89.10 95.19 101.62
SUPPLY GROWTH TARGET 8% 25% 7% 7% 7% 7% 7%
DEMAND-SUPPLY GAP 20.69 9.55 9.43 9.22 8.93 8.54 8.07
GAP RATE 26% 12% 11% 10% 9% 8% 7%
TOTAL RTD MILK SUPPLY
SUFFICIENCY74% 88% 89% 90% 91% 92% 93%
RTD IMPORTS 43.08 48.26 49.57 50.84 52.08 53.28 54.46
Import Growth Rate 7.7% 12.0% 2.7% 2.6% 2.4% 2.3% 2.2%
LOCAL MILK OUTPUT (MLITERS) 15.37 24.63 28.38 32.51 37.02 41.90 47.16
Cattle Share 71% 71% 71% 71% 71% 71% 71%CATTLE 10.87 17.48 20.15 23.08 26.28 29.75 33.48
CARABAO 4.28 6.78 7.82 8.96 10.20 11.54 12.99
GOAT 0.23 0.36 0.41 0.47 0.54 0.61 0.68
PRODUCTION GROWTH TARGET 7.7% 60.2% 15.3% 14.6% 13.9% 13.2% 12.5%
LOCAL MILK SUPPLY
SUFFICIENCY19% 30% 32% 35% 38% 40% 43%
LOCAL MILK SHARE 26% 34% 36% 39% 42% 44% 46%
LOCAL MILK VALUE (MPESOS) 503.01 636.38 690.64 838.99 1,112.30 1,325.55 1,567.65
CATTLE 217.40 264.50 318.77 385.72 479.00 584.09 703.09
CARABAO 280.01 364.58 364.58 444.39 620.88 726.92 847.61GOAT 5.60 7.29 7.29 8.89 12.42 14.54 16.95
RURAL FAMILIES BENEFITTED 36,290 58,144 67,012 76,766 87,406 98,933 111,346
TOTAL JOBS CREATED 7,258 11,629 13,402 15,353 17,481 19,787 22,269
ON-FARM JOBS 4,269 6,840 7,884 9,031 10,283 11,639 13,100
EX-FARM JOBS 2,989 4,788 5,519 6,322 7,198 8,147 9,170
LAND DEVELOPED 6,473.33 8,280.80 8,588.88 8,855.36 9,075.46 9,246.78 9,368.77

8/4/2019 DairyRoadmapDETAILS 2010-2016
http://slidepdf.com/reader/full/dairyroadmapdetails-2010-2016 19/20
referencesDAIRY ROADMAP 2010-2016A Medium Term Dairy Development Plan
National Dairy Authority
DAIRY PERFORMANCE INDICATORS
INDICATORS 2010 2011 2012 2013 2014 2015 2016
Planning & Management Services Department
DAILY MILK YIELD (TONS) 42.69 68.40 78.84 90.31 102.83 116.39 131.00
CATTLE 30.19 48.57 55.97 64.12 73.01 82.64 93.01
CARABAO 11.88 18.85 21.72 24.88 28.33 32.07 36.09
GOAT 0.63 0.99 1.14 1.31 1.49 1.69 1.90
BEGINNING MILKING ANIMALS 15,891 16,933 21,892 22,844 23,710 24,478 25,142
ANIMAL INFUSION 1,042 5,436 1,798 2,617 3,509 3,509 3,496
IMPORTS 500 4,000 1,100 1,100 1,100 1,100 1,100
HARVEST UPGRADES 1,000 2,000 2,000 2,000
NORMAL BUILD UP 542 1,436 698 517 409 409 396
DRY ANIMALS 477 847 1,751 2,741 2,845 2,937
ENDING MILKING ANIMALS 16,933 21,892 22,844 23,710 24,478 25,142 25,701

8/4/2019 DairyRoadmapDETAILS 2010-2016
http://slidepdf.com/reader/full/dairyroadmapdetails-2010-2016 20/20
referencesDAIRY ROADMAP 2010-2016A Medium Term Dairy Development Plan
National Dairy Authority


![[XLS] Details 2016-17... · Web view2/15/2016 2/27/2011 2/10/2016 7/5/2012 2/10/2016 1/3/2009 2/10/2016 4/8/2011 2/11/2016 8/23/2010 2/12/2016 5/17/2010 2/12/2016 6/10/2010 2/12/2016](https://static.fdocuments.us/doc/165x107/5af90f287f8b9a32348be95b/xls-details-2016-17web-view2152016-2272011-2102016-752012-2102016.jpg)


