Value Chain Financing: The Case of Selale area Dairy Value Chain
Upload
edriseminarsCategory
view
437download
0
Dairy Value Chain Analysis in and around Addis Ababa
Seminar at EDRI August 21/20151
Tsega G. Mezgebo and Ghidey G. Debessu
Outline
1. Introduction
2. Pro-poor dairy: case of India and Kenya
3. Ethiopian dairy: Review
4. Dairy in and around Addis Ababa
5. Critical bottlenecks
6. Recommendations
2

Background (1)
• Dairy is important to nutrition security and poverty reduction.
• Ethiopia has the highest livestock population in Africa and conducive agro-climatic conditions for livestock as well as dairy production.
• Commercial dairy started in Ethiopia in the 1950s by adopting high-yield cattle breed.– 11 million milk cows with less than 1% high-yield
breed (2012).
– Dominated with subsistent farming systems
3
Background (2)
• The dairy sub-sector has the lowest productivity and commercialization compared to the world and sub-Saharan Africa.– 1.5 liters per cow per lactation period– 19 liter per capita consumption (109 liters world and
40 liters African average)– About 95% of the produced milk is either consumed
or processed at home.
• The dairy industry is at its infant stage and dominated by traditional systems.
• Requires changes in production and marketing systems
4

Purpose and Methods
• Purpose of the study: to map the value chain in and around Addis Ababa to identify the major constraints and suggest the ways to mitigate.
• Methods:
– Mainly desk review (secondary data)
– Complemented with
• Key informant interviews
• Field observations (February and March, 2015)
• Semi-structured questionnaire interviews (processors, cooperatives, supermarkets)
5
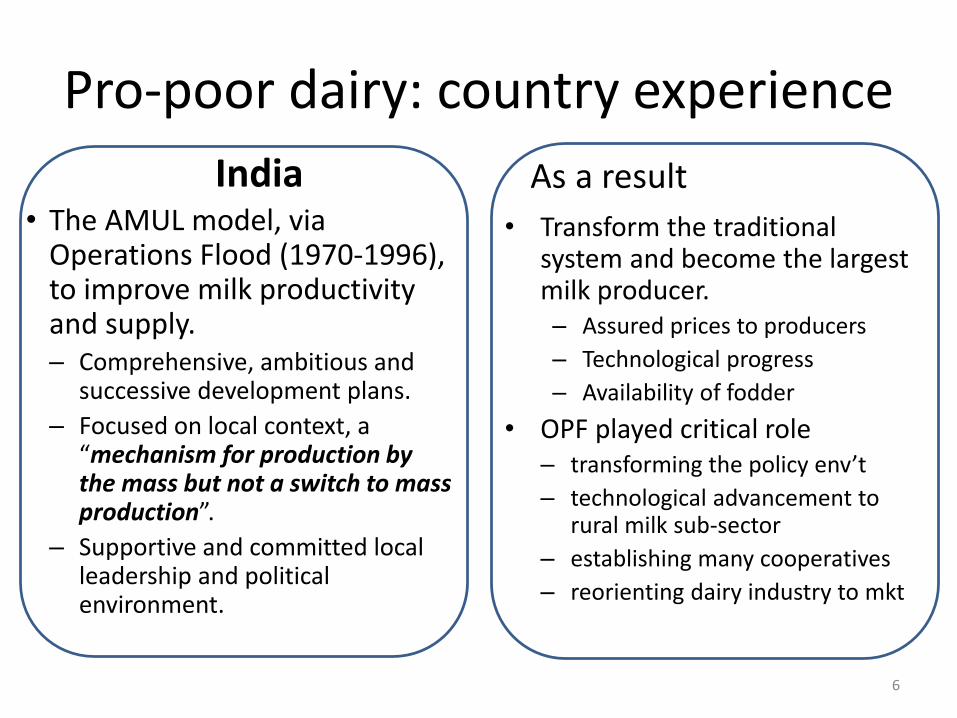
Pro-poor dairy: country experience
India• The AMUL model, via
Operations Flood (1970-1996), to improve milk productivity and supply.– Comprehensive, ambitious and
successive development plans.
– Focused on local context, a “mechanism for production by the mass but not a switch to mass production”.
– Supportive and committed local leadership and political environment.
As a result
• Transform the traditional system and become the largest milk producer. – Assured prices to producers
– Technological progress
– Availability of fodder
• OPF played critical role – transforming the policy env’t
– technological advancement to rural milk sub-sector
– establishing many cooperatives
– reorienting dairy industry to mkt
6

Pro-poor dairy…
Kenya• Switch from large scale to
smallholder farming followed by successive interventions.– Incorporating smallholder farmers
(1967-1978).
– Create producer cooperatives (1979-2002) but ineffective.
– Since, 2003: amending failures of the previous interventions.
– Then by 2007 , processing capacity of the formal channel increase by 300%.
• Milk self-sufficient since 2000s– 80-125kg per capita
consumption and local market is the engine
– About 50% is marketed of which about 75% via informal
– Contributes about 8% of GDP
• But not reached the stage of efficient production.
• Has challenges related to productivity, cost, marketing and infrastructure
7

Ethiopian Dairy: Review
i. Policy• Dairy passes through three different policies.• Imperial era: large-scale commercial dairy farms
around the big urban centers.– production increased but per capita production
decreased.
• Derg regime: attention shifted to rural producers but substantial resource was devoted to large-scale state dairy farms and input oriented.– Per capita production continued to decrease
• Post 1991: focuses on smallholder production.– dairy is addressed indirectly via livestock extension – Per capita production start s to increase
8
0
500
1000
1500
2000
2500
3000
3500
4000
4500
5000
Tho
usa
nd
to
nn
es
Milk Production
camel
cow
goat
sheep
Total
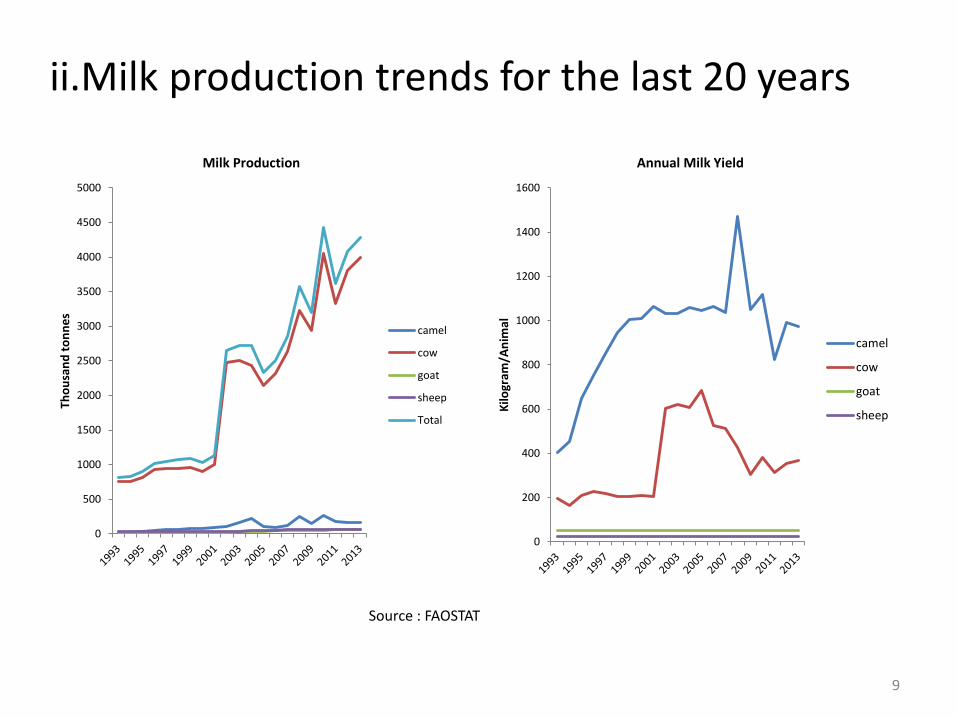
ii.Milk production trends for the last 20 years
0
200
400
600
800
1000
1200
1400
1600
Kilo
gram
/An
imal
Annual Milk Yield
camel
cow
goat
sheep
9
Source : FAOSTAT
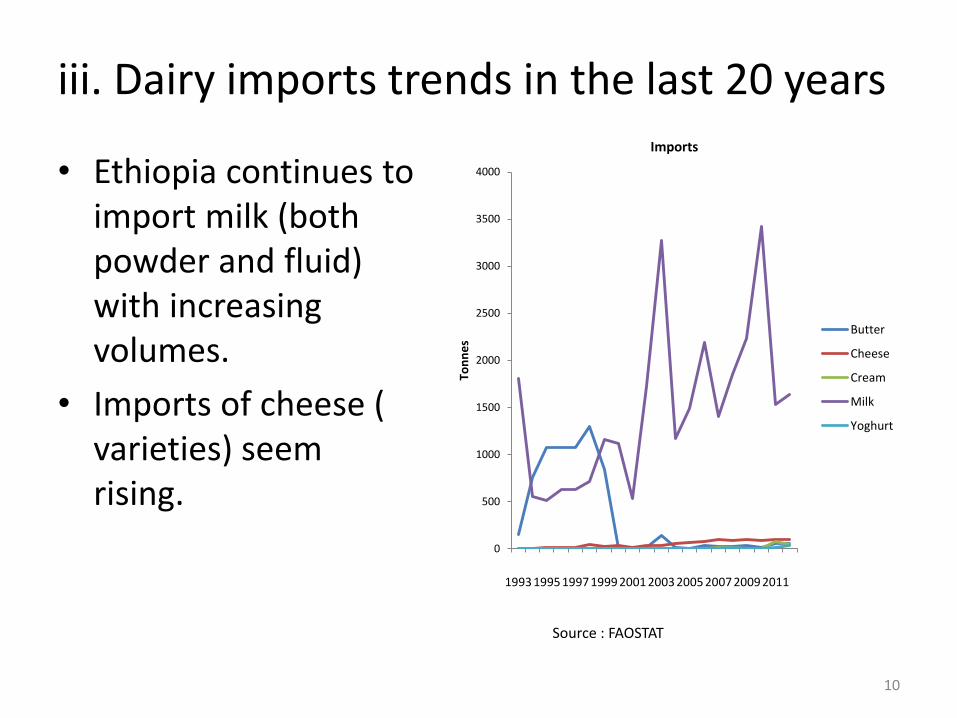
iii. Dairy imports trends in the last 20 years
• Ethiopia continues to import milk (both powder and fluid) with increasing volumes.
• Imports of cheese ( varieties) seem rising.
0
500
1000
1500
2000
2500
3000
3500
4000
1993 1995 1997 1999 2001 2003 2005 2007 2009 2011
Ton
ne
s
Imports
Butter
Cheese
Cream
Milk
Yoghurt
10
Source : FAOSTAT

iv. Main actors in the value chain (1)
• The value chain involves many actors with ambiguous roles.
• Formal and informal marketing channels are active but the informal channel entirely controls the market (95% ).
• Upstream actors are mainly subsistent smallholder farmers.
11
Adopted from Makonie et al (2013)
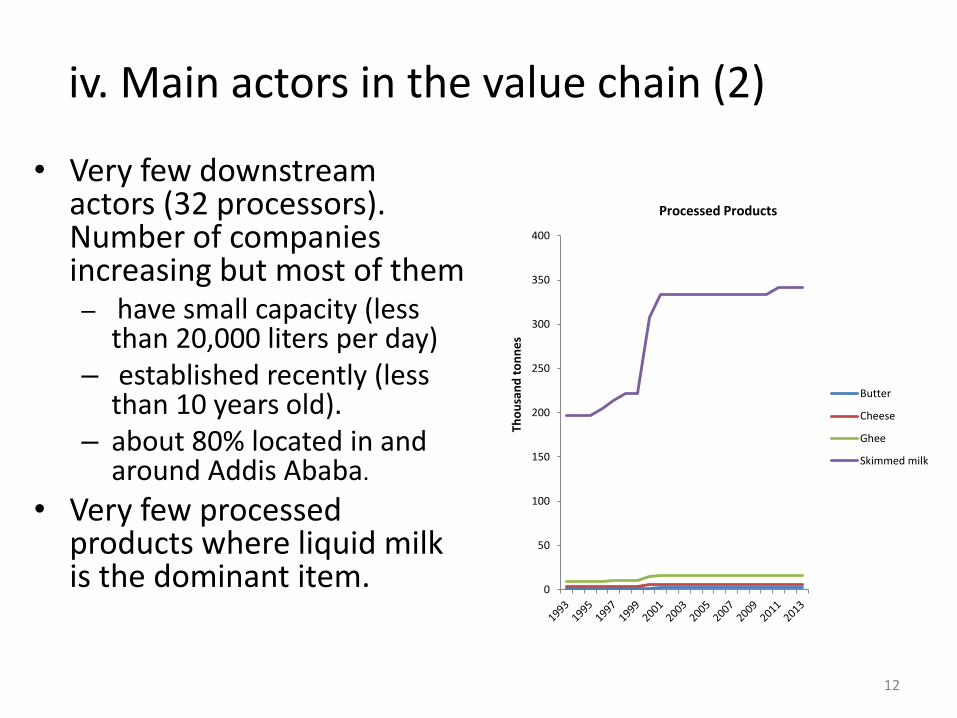
iv. Main actors in the value chain (2)
• Very few downstream actors (32 processors). Number of companies increasing but most of them– have small capacity (less
than 20,000 liters per day)– established recently (less
than 10 years old).– about 80% located in and
around Addis Ababa.
• Very few processed products where liquid milk is the dominant item.
12
0
50
100
150
200
250
300
350
400
Tho
usa
nd
to
nn
es
Processed Products
Butter
Cheese
Ghee
Skimmed milk

v. Input Suppliers and Development Partners
Inputs at the farm:– Inadequate feed, water,
improved breed– Weak vet and AI service– Poor knowledge and skills
Ministry of Agriculture:– Major provider of farm inputs– But deficient to address
needs of the different dairy systems and under-resourced to provide on-farm trainings and services.
13
Development partners:– Research institutions and
NGOs provide material and technical support.
– But mostly project based might not advance to the next level when the project stops.
Inputs beyond the farm:– Supply of equipments,
machinery and packaging is fragmented
– Fragmented and sub-standard logistic systems
– Lack of mid-level dairy technicians and dairy engineers.
Diary in and around Addis Ababa• Commercial dairy started in 1947 around AA.• About
– 70% of the high-yield cattle breed and 80% of the processing companies are located around AA.
• But, the industry – has critical shortage of inputs and – is dominated by informal channel and traditional systems– lacks milk grid systems, linkages among the actors and
monitoring quality and safety of products– produced few varieties and small in quantity.
• Most big hotels and supermarkets import dairy products including milk to run their daily activities.
• Then, the industry is at its infant stage .
14
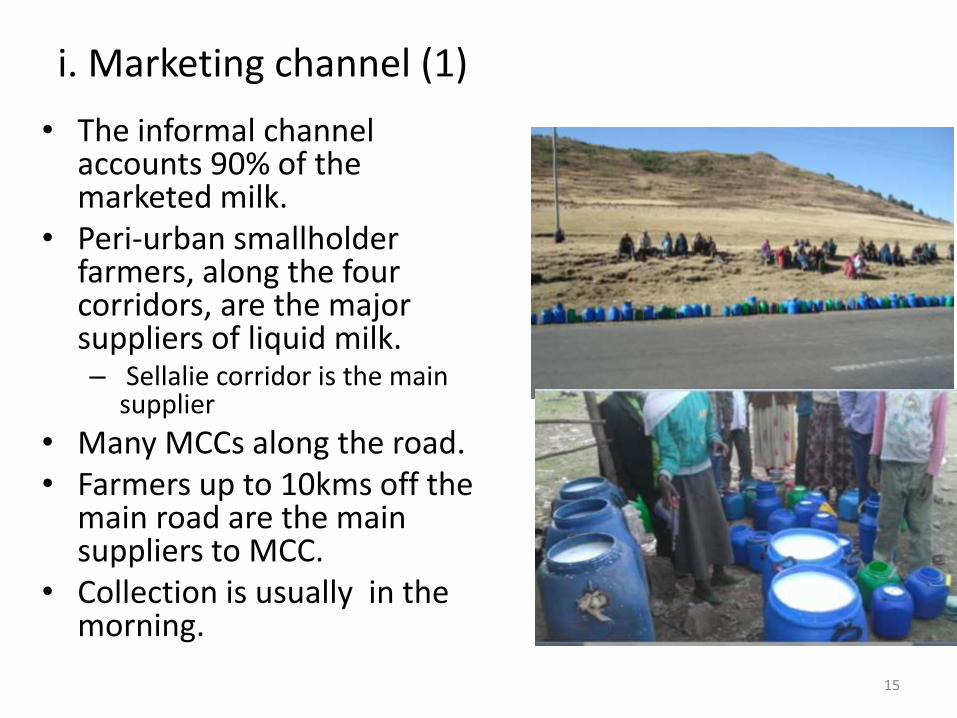
i. Marketing channel (1)
• The informal channel accounts 90% of the marketed milk.
• Peri-urban smallholder farmers, along the four corridors, are the major suppliers of liquid milk.– Sellalie corridor is the main
supplier
• Many MCCs along the road.• Farmers up to 10kms off the
main road are the main suppliers to MCC.
• Collection is usually in the morning.
15

Marketing channel (2)• Fragmented bulking and
transport practices dominated with sub-standard systems.
• Significant loss due spoilage and spillage.
• Milk quality and standard???– Up on delivery to MCC
– From MCC to …
– Adulteration
– Health risks ???
• The focus on food production is product safety and quality.
16

ii. The value chain• Many actors with many
intermediary parties– Local-low income chain (A-
system chains).
– Local middle to high income chains (B-system chains)
• A number of vertical networks but lack horizontal connections.
• The actors business relationsand bargaining position ???
• Product quality and standard???
17
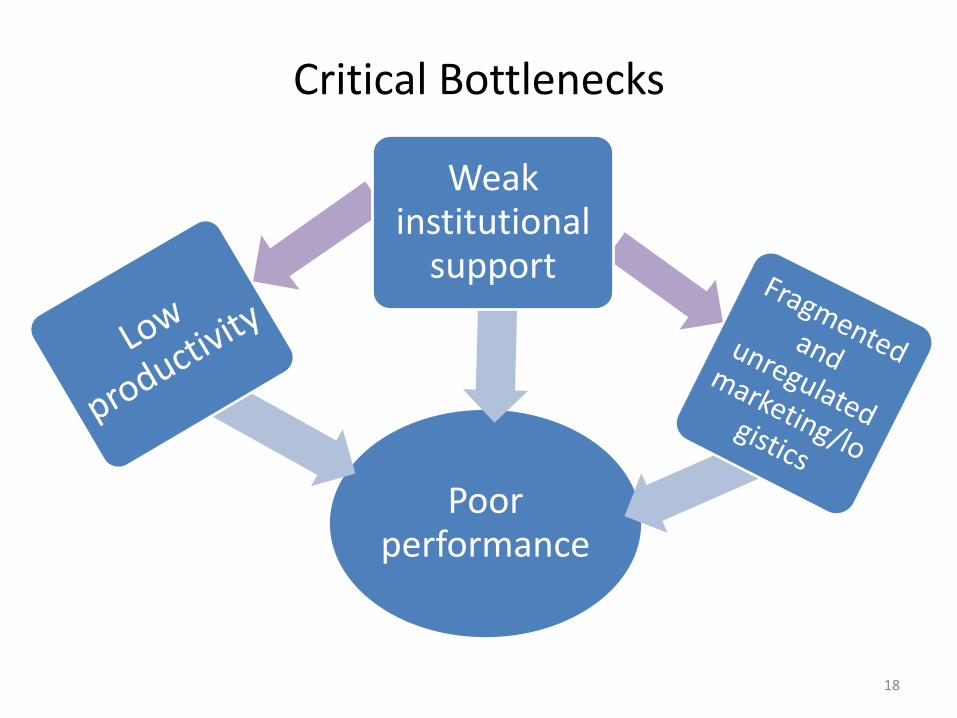
Poor performance
Weak institutional
support
Critical Bottlenecks
18
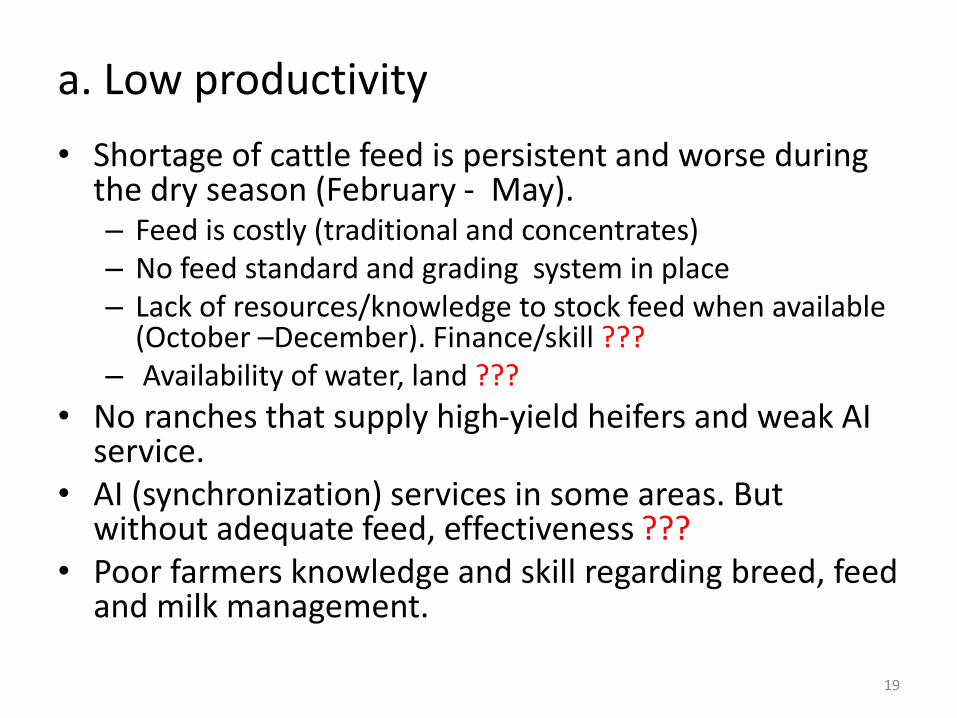
a. Low productivity
• Shortage of cattle feed is persistent and worse during the dry season (February - May).– Feed is costly (traditional and concentrates)– No feed standard and grading system in place– Lack of resources/knowledge to stock feed when available
(October –December). Finance/skill ??? – Availability of water, land ???
• No ranches that supply high-yield heifers and weak AI service.
• AI (synchronization) services in some areas. But without adequate feed, effectiveness ???
• Poor farmers knowledge and skill regarding breed, feed and milk management.
19
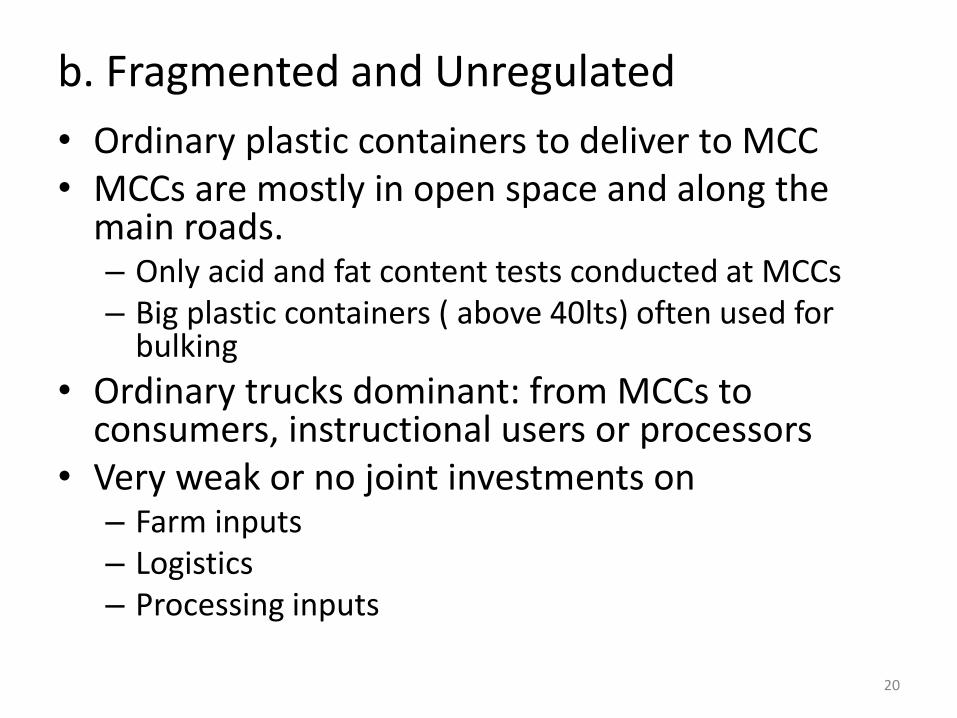
b. Fragmented and Unregulated
• Ordinary plastic containers to deliver to MCC• MCCs are mostly in open space and along the
main roads.– Only acid and fat content tests conducted at MCCs– Big plastic containers ( above 40lts) often used for
bulking
• Ordinary trucks dominant: from MCCs to consumers, instructional users or processors
• Very weak or no joint investments on – Farm inputs – Logistics– Processing inputs
20

c. Weak institutional support
• Ministry of Agriculture: the general approach is smallholder production but no separate plan and strategy for dairy.
• Cooperatives are under-resourced and lack the expertise.
• Supporting institutions and partners: lack coordination which potentially lead to repetition and ineffectiveness
• Lack of specialized skills, no dairy technicians and engineers, in the local market.
• National Dairy ???• Legislation, regulation and policies
21

Recommendations
• Interventions to improve– Productivity and supply
– Network-structure (both horizontal and vertical)
– Institutional environment
• The value chain can be upgraded through partnerships:– private – private: joint purchase of production inputs
and use of production facilities
– public – private: technological, organizational and educational support.
• Conducive and strong institutional support is imperative to guide the whole operation.
22
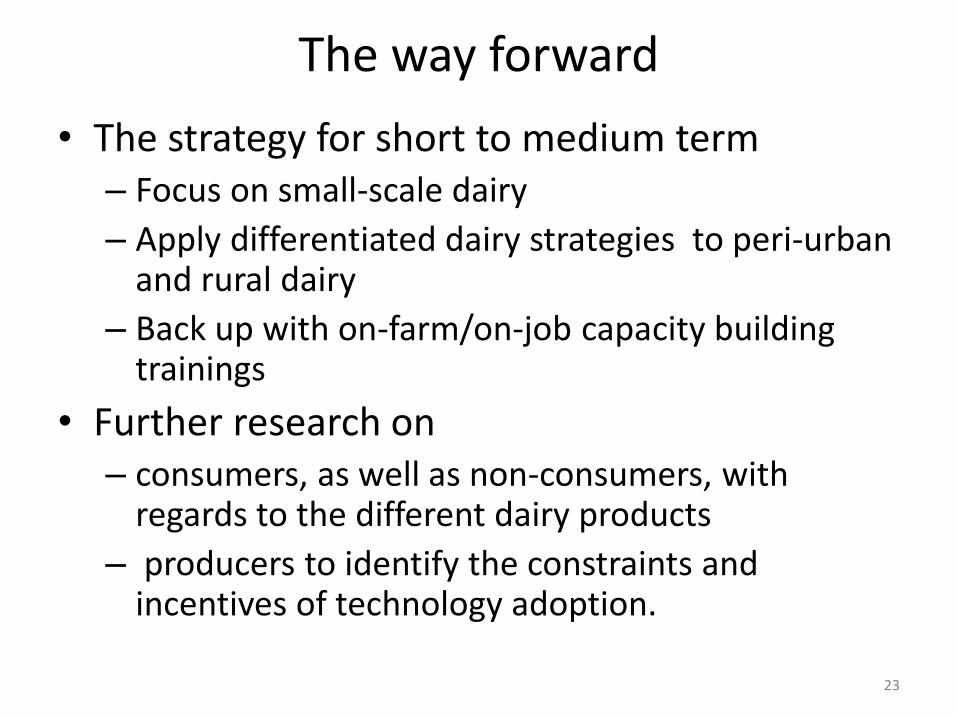
The way forward
• The strategy for short to medium term– Focus on small-scale dairy
– Apply differentiated dairy strategies to peri-urban and rural dairy
– Back up with on-farm/on-job capacity building trainings
• Further research on – consumers, as well as non-consumers, with
regards to the different dairy products
– producers to identify the constraints and incentives of technology adoption.
23