Arief,_Retno - Implementasi E-Gov Dalam Penyelenggaraan Pemerintahan
Arief Daryanto, PhD
Director, Graduate Program of Management and Business-IPB (MB-IPB)
Second Workshop on Capacity Building for Research:
Promoting Inclusive Development of Agricultural Value-Chains,
Collaboration between the University of Adelaide and
Graduate Program of Management and Business-IPB, Bogor, 27-31 October 2014.
Dairy Industry in West Java:
Challenges and Opportunities

Presentation Snapshot
Overview of the Indonesian and West Java Dairy Sector
Key Driving Forces in the Dairy Transformation
Opportunities and Challenges
Dairy Business Development Models
Overview of the Indonesian and
West Java Dairy Sector
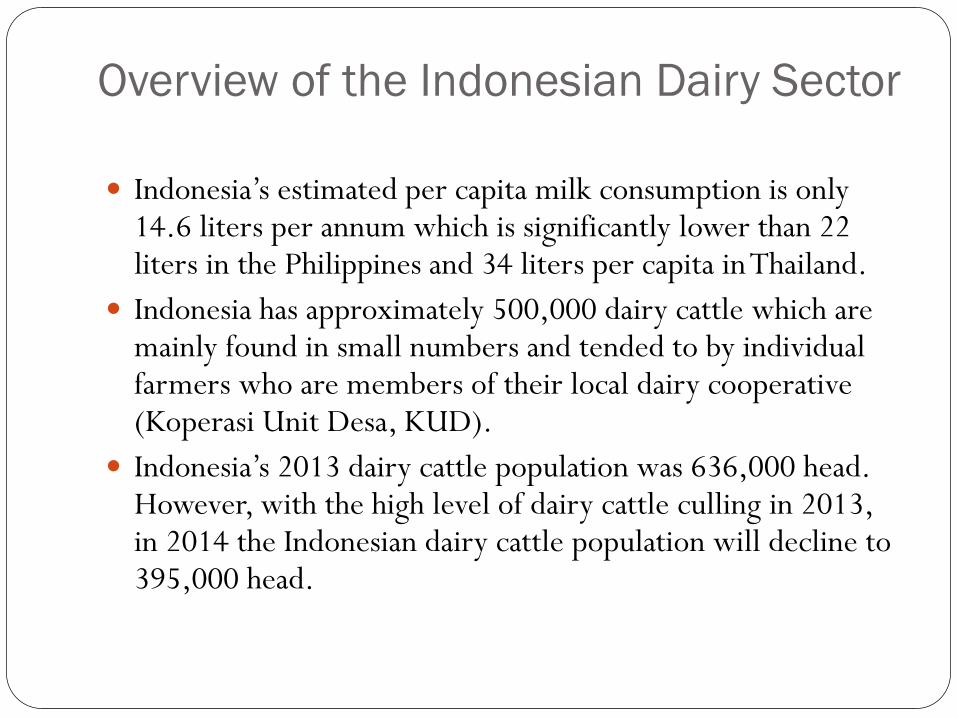
Indonesia’s estimated per capita milk consumption is only 14.6 liters per annum which is significantly lower than 22 liters in the Philippines and 34 liters per capita in Thailand.
Indonesia has approximately 500,000 dairy cattle which are mainly found in small numbers and tended to by individual farmers who are members of their local dairy cooperative (Koperasi Unit Desa, KUD).
Indonesia’s 2013 dairy cattle population was 636,000 head. However, with the high level of dairy cattle culling in 2013, in 2014 the Indonesian dairy cattle population will decline to 395,000 head.
Overview of the Indonesian Dairy Sector

Overview of the Indonesian Dairy Sector
Close to 90% of such farms are concentrated in West, Central and East Java with a small proportion of around 2% in Sumatra. East Java is Indonesia’s largest dairy production base accounting for 57.09% of all milk production. West Java is second largest dairy producer accounting for 29.86%.
The average productivity of cattle in Indonesia is nearly half of the international standard at 12-14 liters per day.
Only 25% of the raw materials for milk supply are produced locally with 75% coming from foreign imports
More than 90% of the dairy market is dominated by processed milk as opposed to fresh i.e. UHT milk and that in powdered or sterilized form.

There are 192,160 dairy farmers managing about 3 cows
each on average. Most of these producers average 10-11
liters per cow per day.
Small-holder farm yields remain limited as these farms do
not benefit from scaling technologies. The majority of
smallholder milk is marketed through local cooperatives.
Overview of the Indonesian Dairy Sector

Source : Tetra Pak Compass Product and Packages 2011
*DGLS, 2012
Figure 1. Indonesia’s Milk Consumption
Liter/Capita

Source: Livestock Statistics, 2013
Table 1. Dairy Cows Population and Milk Output by Main Provinces, 2013
Dairy Cows
Number
Dairy Cows
Percent
Milk Production
Tones
Milk Production
Percent
East Java 323.814 50,90 560.398 57,09
Central Java 154.398 24,27 107.982 11,00
West Java 143.382 22,54 293.107 29,86
Other 14.470 2.27 20.099 2,04
TOTAL 636.064 100 981.586 100
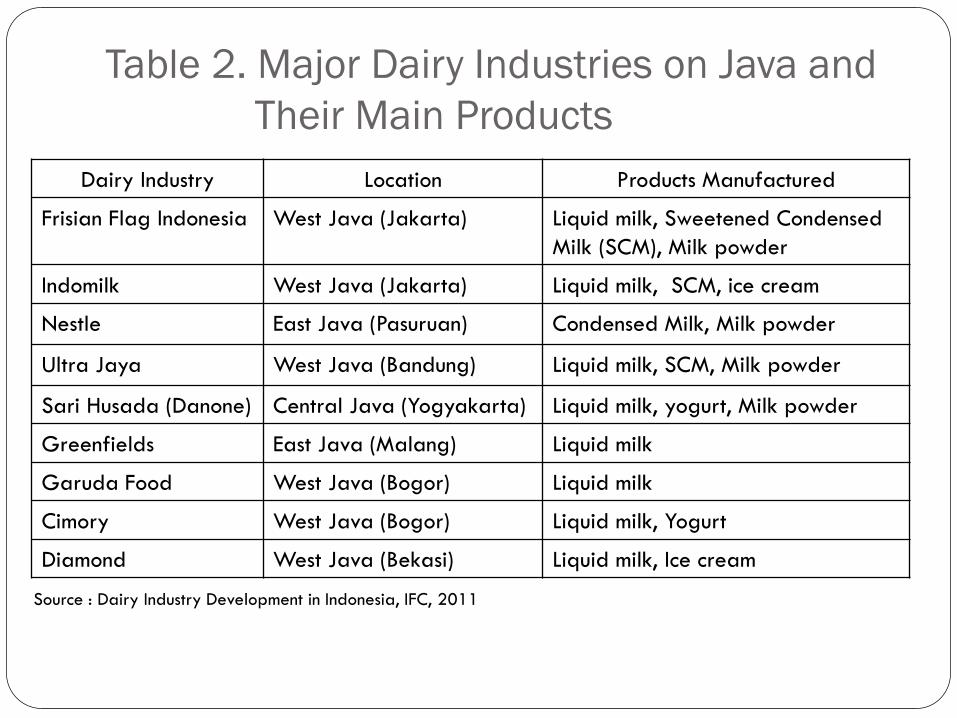
Table 2. Major Dairy Industries on Java and
Their Main Products
Dairy Industry Location Products Manufactured
Frisian Flag Indonesia West Java (Jakarta) Liquid milk, Sweetened Condensed
Milk (SCM), Milk powder
Indomilk West Java (Jakarta) Liquid milk, SCM, ice cream
Nestle East Java (Pasuruan) Condensed Milk, Milk powder
Ultra Jaya West Java (Bandung) Liquid milk, SCM, Milk powder
Sari Husada (Danone) Central Java (Yogyakarta) Liquid milk, yogurt, Milk powder
Greenfields East Java (Malang) Liquid milk
Garuda Food West Java (Bogor) Liquid milk
Cimory West Java (Bogor) Liquid milk, Yogurt
Diamond West Java (Bekasi) Liquid milk, Ice cream
Source : Dairy Industry Development in Indonesia, IFC, 2011

Source: Livestock Statistics, 2013
Figure 2. Milk Export and Import in Indonesia

Figure 3. Milk Importing and Exporting Countries
Source: Tetra Pak Dairy Index Issue 7, September (2014)

Key Driving Forces in the Dairy
Transformation

Increased demand for agricultural (food) products Population growth, income growth, increasing middle class, urbanization, longer life span and ageing population
Diversification toward higher valued food diet shift, changing consumer preferences (food quality, food safety and food attributes)
Food spending is shifting from grains and staples to vegetables, fruits, meat, dairy, fish and processed foods
Key Driving Forces in Dairy Transformation:
Demand Drivers (1)
Demand for ready-to-cook and ready-to-eat foods is also rising, particularly in urban areas.
More emphasis on food security and improved nutrition
Key Driving Forces in Dairy Transformation:
Demand Shifters(2)

Investment in agricultural research
Value chain development
Increase in scale of production and processing
More emphasis on food security and improved nutrition
Water and land scarcity
Climate change
Less market protection (WTO, FTAs)
Key Driving Forces in Dairy Transformation:
Supply Shifters

Challenges and Opportunities
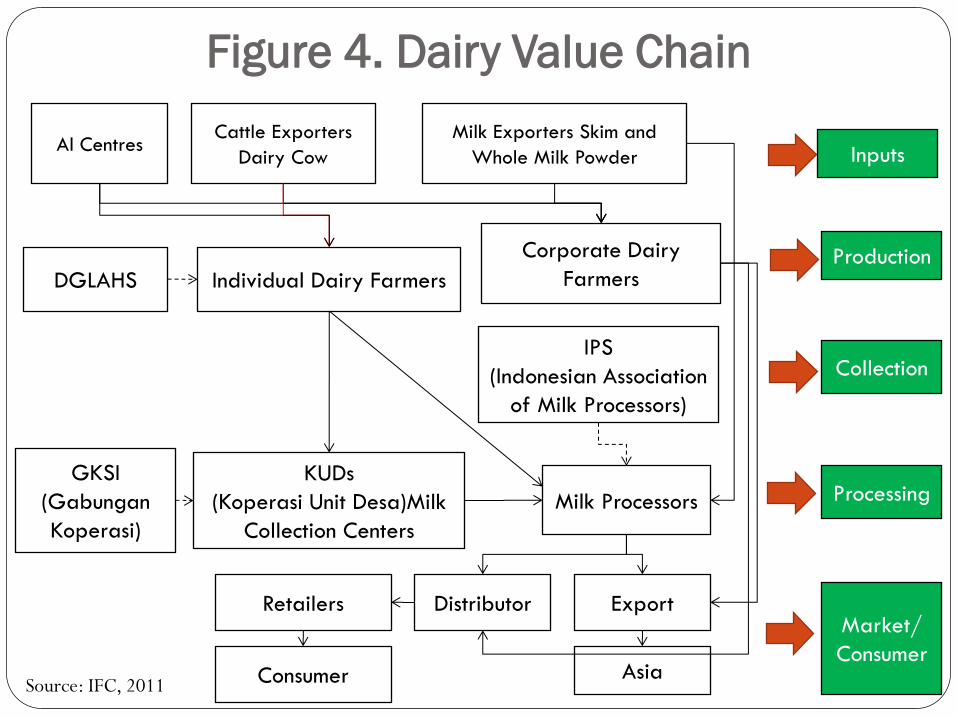
Figure 4. Dairy Value Chain
Al Centres Cattle Exporters
Dairy Cow
Milk Exporters Skim and
Whole Milk Powder Inputs
DGLAHS Individual Dairy Farmers
Corporate Dairy
Farmers
IPS
(Indonesian Association
of Milk Processors)
GKSI
(Gabungan
Koperasi)
KUDs
(Koperasi Unit Desa)Milk
Collection Centers
Milk Processors
Retailers
Consumer
Distributor Export
Asia
Production
Processing
Market/
Consumer
Collection
Source: IFC, 2011

Figure 5. Main Dairy Value Chain Types
Source: van der Lee, 2014

Figure 6. Key sector constraints across the value chain
Inputs
• Low breeding and genetics potential of animals
• Lack of land for growing forage
• More disease incidence
Production
• Low productivity
• Low adoption of technology (such as milking equipment)
• Poor animal health & sanitation
• Lack of financial access
Collection
• Lack of infrastructure
• Asymmetric information
• Manipulation of the quality of milk
• Absence of quality standard
Processing
• Seasonality of production and fluctuating supply
• Availability of homogenous quality milk/highly fragmented supply
• Lack of logistics infrastructure (cold storage, cold chain and transport facilities)
• Lack of trained and skilled workers
Market/ Consumer
• Market is still unorganized
• Heterogeneous consumer requirements
• Lack of robust food safety standards

Table 3. Common constraints and
opportunities in in dairy sector development
Source: van der Lee and Westenbrink, 2014

Dairy Industry Development
Models
1. Cimory Model
2. Nestle Model
3. PisAgro Model
4. Gapoknak Sugih Mukti Mandiri Model

Figure 7. Cimory Business Model
END USERS
Home
Delivery Giant Indomaret Alfamart
Agen
Cimory
Cimory
Restaurant
Yogurt Susu Segar
PT. Macrosentra
Niagaboga
Mayonaise Keju
Cream Cheese
Bread
Mozarella CIMORY
KUD Giri
Tani
KUD
Cipanas
KUD
Sukabumi
KUD Kiya
Citra PT. Enopec
PT. Piramid
Mulya Pac
PT. Christian
Hansens
Anggota
Koperasi
Anggota
Koperasi
Anggota
Koperasi
Supplier
Gula
Supplier
kemasan
Yogurt
Supplier
kemasan
Susu
Supplier
Bahan
Pewarna
Source: IFC, 2011
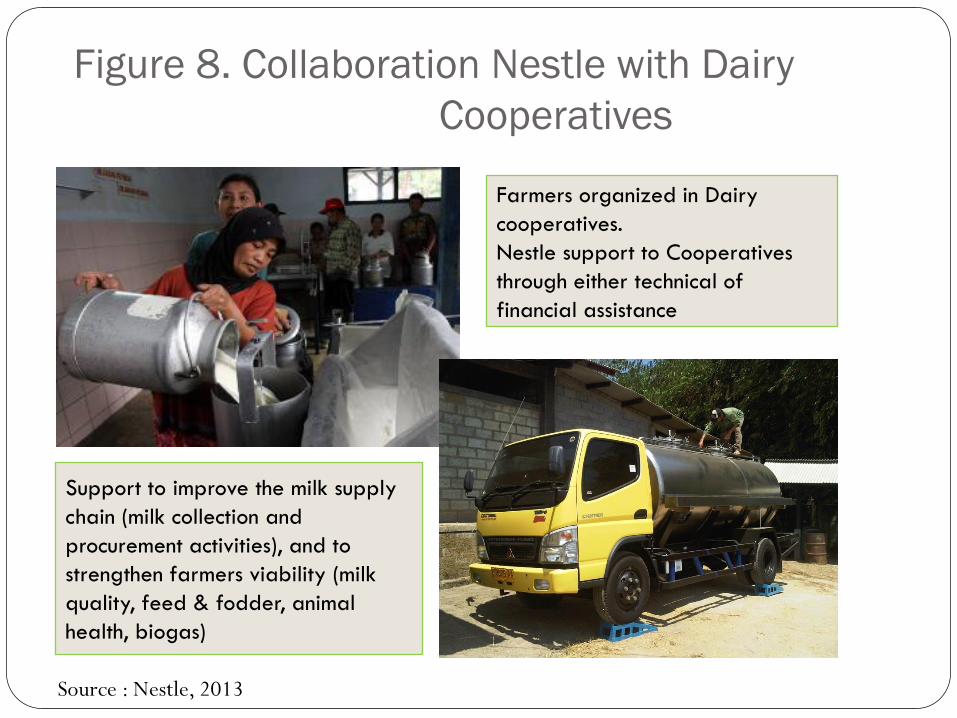
Source : Nestle, 2013
Figure 8. Collaboration Nestle with Dairy
Cooperatives
Farmers organized in Dairy
cooperatives.
Nestle support to Cooperatives
through either technical of
financial assistance
Support to improve the milk supply
chain (milk collection and
procurement activities), and to
strengthen farmers viability (milk
quality, feed & fodder, animal
health, biogas)

Figure 9. Nestlé Milk Sourcing
• Cooperatives with >35K
dairy farmers
• Commercial farms
• Cooperatives owned
• 20-300 km distance to factory
• 24 hours fresh milk reception
• >510 collection points
• >250 cooling centers
• >375 cooling units
• >85% direct cooling
• 2x collection/day
Dairy Farmers
Loans & Training
(Dairy Development)
Dairy Cooperatives
Loans & Training & Control
Payroll
(Milk Procurement)
Third Party fresh milk supply = Dairy farmers + Dairy cooperatives + Dairy factory
Source : Nestle, 2014

Figure 10. Nestlé Milk Sourcing
Milk Procurement & Dairy Development
Department with Dual Functions
Milk Procurement Section Dairy Development Section
SHORT TERM
• Volumes
• Quality control
• Suppliers (Coops) operational set
up
• Standards
• Commitments
LONG TERM
• Sustainable growth
• Dairy farmers
• Productivity improvement
• Development projects
• Sustainability of dairy farming
• Commitments
Develop trust of Nestlé FM suppliers for a
long-term sustainable business relationship
Source : Nestle, 2014

Figure 11. Nestlé Milk Sourcing: CSV in Indonesia
Technical support through a team of Field professionals with relevant operational background:
animal husbandry, veterinary sciences, agronomy
Variety of improvement programs aiming at increasing long-term sustainability performance of
dairy Cooperatives & dairy farmers
MILK PROCUREMENT
Focus: milk collection operational
set-up
Objective: fresh milk quality
• Improving operational standards
(Nestlé standards, SOPs)
• Quality based payment system (TPC
base)
• Investment programs (credits)
• Regular supplier operation audits
(compliance with Nestlé standards &
requirements)
• Facilitate import of critical equipment
(cooling tanks)
• Suppliers yearly competition
DAIRY DEVELOPMENT
Focus: sustainability of dairy
farming
Objective: cow productivity
• Feed & fodder: cultivation of improved
fodder; silage; cattle feed formulation
• Animal health: mastitis prevention;
deworming
• Herd management: recording (to keep
track of performance of dairy cattle
population); water availability
• Competitiveness: establish a network
of dairy farmers for monitoring of cost
of production (supporting pricing
decision making process)
ENVIRONMENT
Focus: water protection &
renewable energy
Objective: biogas
• Promotion of biogas
• Joint project with HIVOS, set-up of units
in large scale
• Improvement of cattle sheds
• Investment programs
3 major focus areas for long-term development
Source : Nestle, 2014

Figure 12. PisAgro Business Model
Source: WEF, 2014
Partners in Creating Shared Value
East Java Government
PT Nestlé Indonesia
Dairy Cooperatives & Dairy Farmers
Banking sector
Cattle Feed Industry ( Cargill Animal Nutrition Indonesia)
Fodder Industry ( DuPont Indonesia )
Hivos

Figure 13. Business Model Gapoknak Sugih Mukti Mandiri Subang
Winner of 2014 Competitive Product Award in Livestock Products,
Ministry of Agriculture 2014
Products : 1. Liquid Milk (Pasteurisasi)
2. Yogurt & Yogurt Sticks
3. Kerupuk Susu
4. Puding
Gapoknak is able to pay higher prices to dairy
farmers as its business model is based on the
production of higher value added dairy products