DAIRY CO-DIGESTION USING AN ANAEROBIC … Co-digestion Using an Anaerobic Digester Research Project...
54
Energy Research and Development Division FINAL PROJECT REPORT DAIRY CO-DIGESTION USING AN ANAEROBIC DIGESTER OCTOBER 2014 CEC-500-2016-020 Prepared for: California Energy Commission Prepared by: Organic Solution Management
Transcript of DAIRY CO-DIGESTION USING AN ANAEROBIC … Co-digestion Using an Anaerobic Digester Research Project...

E n e r g y R e s e a r c h a n d De v e l o p m e n t Di v i s i o n F I N A L P R O J E C T R E P O R T
DAIRY CO-DIGESTION USING AN ANAEROBIC DIGESTER
OCTOBER 2014 CEC-500 -2016-020
Prepared for: California Energy Commission Prepared by: Organic Solution Management

PREPARED BY:
Primary Authors: John Brenan Chris Pierce Dr. Robert Hickey Organic Solution Management 7915 S. Emerson Ave. Indianapolis Indiana, 46237 Phone: 765-427-5442 Contract Number: PIR-10-046 Prepared for: California Energy Commission Rajesh Kapoor Contract Manager
Virginia Lew Office Manager Energy Efficiency Research Office
Laurie ten Hope Deputy Director ENERGY RESEARCH AND DEVELOPMENT DIVISION
Robert P. Oglesby Executive Director
DISCLAIMER This report was prepared as the result of work sponsored by the California Energy Commission. It does not necessarily represent the views of the Energy Commission, its employees or the State of California. The Energy Commission, the State of California, its employees, contractors and subcontractors make no warranty, express or implied, and assume no legal liability for the information in this report; nor does any party represent that the uses of this information will not infringe upon privately owned rights. This report has not been approved or disapproved by the California Energy Commission nor has the California Energy Commission passed upon the accuracy or adequacy of the information in this report.

i
ACKNOWLEDGEMENTS
Organic Solution Management wishes to thank the following personnel and organizations for
their help and participation in this study and subsequent report:
• Fiscalini Farms
• John Fiscalini
• Brian Fiscalini
• Nettie Drake
• Denele Analytical
• Dr. Robert Hickey

ii
PREFACE
The California Energy Commission Energy Research and Development Division supports
public interest energy research and development that will help improve the quality of life in
California by bringing environmentally safe, affordable, and reliable energy services and
products to the marketplace.
The Energy Research and Development Division conducts public interest research,
development, and demonstration (RD&D) projects to benefit California.
The Energy Research and Development Division strives to conduct the most promising public
interest energy research by partnering with RD&D entities, including individuals, businesses,
utilities, and public or private research institutions.
Energy Research and Development Division funding efforts are focused on the following
RD&D program areas:
Buildings End-Use Energy Efficiency
Energy Innovations Small Grants
Energy-Related Environmental Research
Energy Systems Integration
Environmentally Preferred Advanced Generation
Industrial/Agricultural/Water End-Use Energy Efficiency
Renewable Energy Technologies
Transportation
Dairy Co-digestion Using an Anaerobic Digester Research Project is the final report for the Fiscalini
Farms Dairy Co-Digestion using an Anaerobic Digester Research project (contract number PIR-
10-046), Grant Number PON-08-007 conducted by Organic Solution Management. The
information from this project contributes to Energy Research and Development Division’s PIER-
Industrial, Agriculture and Water Energy Efficiency Program.
For more information about the Energy Research and Development Division, please visit the
Energy Commission’s website at www.energy.ca.gov/research/ or contact the Energy
Commission at 916-327-1551.

iii
ABSTRACT
This project identified, describes, and determined the most cost- and environmentally effective
co-digestate (material remaining after anaerobic digestion of a biodegradable feedstock)
available to increase biogas production and improve biogas quality (reduced hydrogen sulfide)
in a dairy-based anaerobic digestion system. Testing and understanding the effect that liquid,
solid, and biogas digester effluents, as well as off-site organic dairy substrates (mainly grease
trap and egg wastes) have on air and water quality is critical for developing sound public policy
on regulatory standards to control the release of these substances. Identifying the nutrient
makeup, biological oxygen demand, and total dissolved solids (salt) loading of the various
substrates has narrowed the list of substrates available for use in a digester to produce sufficient
biogas to operate a 710 kilowatt hour Guascor combined heat and power generation unit for
electrical output. One-liter samples of various were collected and sent to a local laboratory
familiar with the regulatory constraints. These substrates were tested for biological oxygen
demand, total suspended solids, total dissolved solids, nitrogen, phosphorus, and potassium.
The study concludes that offsite organic substrates provide the proper constituents to optimize
biogas production without having a negative impact on the quality of effluent and exhaust
emissions related to use of biogas as a fuel.
Keywords: Anaerobic digestion, substrates, hydrogen sulfide, grease trap waste, organic waste,
biological oxygen demand, electrical output, Guascor
Please use the following citation for this report:
Brenan, John, Chris Pierce, Dr. Robert Hickey. (Organic Solution Management). 2016. Dairy Co-
digestion Using an Anaerobic Disger Research Project. California Energy Commission.
Publication Number: CEC-500-2016-020.

iv
TABLE OF CONTENTS
Acknowledgements ................................................................................................................................... i
PREFACE ................................................................................................................................................... ii
ABSTRACT .............................................................................................................................................. iii
TABLE OF CONTENTS ......................................................................................................................... iv
LIST OF FIGURES .................................................................................................................................... v
LIST OF TABLES .................................................................................................................................... vi
EXECUTIVE SUMMARY ........................................................................................................................ 1
Introduction ........................................................................................................................................ 1
Project Process .................................................................................................................................... 1
Project Results ..................................................................................................................................... 2
Benefits to California ......................................................................................................................... 3
CHAPTER 1: Purpose and Scope of this Study ................................................................................... 6
1.1 Purpose ........................................................................................................................................ 6
CHAPTER 2: Fiscalini Farms Anaerobic Digester Physical Facilities ............................................ 7
2.1 Facility Overview ....................................................................................................................... 7
2.1.1 Facility Operations ........................................................................................................... 12
2.1.2 Substrate Identification and Contracting ...................................................................... 13
CHAPTER 3: Method ............................................................................................................................. 16
3.1 Substrate Characterization ...................................................................................................... 16
3.1.1 Background ....................................................................................................................... 16
3.2 Results of Characterization ..................................................................................................... 19
CHAPTER 4: Data Collection and Monitoring ................................................................................. 21
4.1 Data Collection and Monitoring Program ............................................................................ 21
4.1.1 Fiscalini Farm Production Report Discussion .............................................................. 22
CHAPTER 5: Sampling Method ........................................................................................................... 27
5.1 Sampling .................................................................................................................................... 27
5.2 Influent/Effluent ....................................................................................................................... 30

v
5.3 Summary of Total Dissolved Solids (TDS) ........................................................................... 32
5.4 Heavy Metals ............................................................................................................................ 32
5.5 Air Emissions ............................................................................................................................ 33
CHAPTER 6: Cost/Benefit Analysis .................................................................................................... 34
6.1 Financial Analysis .................................................................................................................... 34
6.1.1 Labor .................................................................................................................................. 34
6.1.2 Other Labor ....................................................................................................................... 34
6.1.3 Engine Capital Replacement Reserve ............................................................................ 34
6.1.4 Engine Routine Service .................................................................................................... 35
6.1.5 Digester and Engine Room Parasitic Load ................................................................... 35
6.1.6 Engine Room Phone Bill/Internet Connection ............................................................. 35
6.1.7 Miscellaneous Costs ......................................................................................................... 35
6.2 Debt Service .............................................................................................................................. 36
6.3 Revenue ..................................................................................................................................... 36
6.3.1 Electrical Revenue ............................................................................................................ 36
6.3.2 Tip Frees Revenue ............................................................................................................ 36
CHAPTER 7: Conclusions ..................................................................................................................... 37
GLOSSARY .............................................................................................................................................. 40
REFERENCES .......................................................................................................................................... 42
APPENDIX A: Profit and Loss Table ................................................................................................ A-1
LIST OF FIGURES
Figure 1: Sand Buildup in Digester Tank 2 ............................................................................................ 9
Figure 2: Revised Organic Vs. Inorganic Separation Pit ....................................................................... 9
Figure 3: Manure Separation Wall Completed and Operational ...................................................... 10
Figure 4: 14,000 Gallon Digestate Mixing Tanks Located Offsite ..................................................... 11
Figure 5: Map of Facilty Layout and Sample Locations ..................................................................... 28

vi
LIST OF TABLES
Table 1: Biogas Potential of Organic Feedstocks (Basisdaten Biogas Deuthchland, Marz, 2005) . 13
Table 2: Food Waste Characteristics; Solid Waste Profile (Cullar & Weber, July, 2010) ................ 14
Table 3: Top 10 Most Prevalent Items in California Waste Disposal Systems ................................ 14
Table 4:UseableWaste Generation by Individual Store (Darper/Lennon, 2002) ............................. 17
Table 5: Results of the North Carolina Study (Leven, 2012) .............................................................. 17
Table 6: Waste Generation per Type per Store (tons), Orange County. (Leven, 2012) .................. 18
Table 7: Number of Facilities by Industry with 70 Employees or More .......................................... 20
Table 8: Grease Trap Waste Within 60 miles of Modesto, California City Center .......................... 20
Table 9: Substrate Volumes by Supplier by Month ............................................................................. 21
Table 10: Calculated Power Versus Actual Production ...................................................................... 26
Table 11: Comparison of Midwest Scrap Dairy Versus California Flush Dairy Influent Nutrient
Waste Values............................................................................................................................................. 30
Table 12: Comparison of Midwest Scrap Dairy Versus California Flush Dairy Effluent Nutrient
Waste Values............................................................................................................................................. 31
Table 13: Comparison on a Mass Basis Removal of Nutrient Loading ............................................ 31
Table 14: Comparison of Average NOX ppm in CHP Exhaust Verses Average H2S ppm in the
Biogas ......................................................................................................................................................... 33
Table 15: Costs Associated With Continued Operation of the System ............................................. 34

1
EXECUTIVE SUMMARY
Introduction
This project analyzed the efficiency, effectiveness, and regulatory compliance of a renewable
energy power generation system using alternative, offsite organic feedstock in a dairy anaerobic
digestion power generation system at the Fiscalini Farms, L.P. dairy in California’s San Joaquin
Valley. This project addresses public interest energy research goals of agricultural end use
energy efficiency, energy-related environmental research, energy systems integration, and
renewable energy technologies.
Gathered data verified the combination of European technologies for anaerobic digestion and
power generation will operate effectively, efficiently, and economically using multiple
feedstocks and meet California’s strict environmental regulations. This project measured quality
and quantity of substrates in the form of captured gas produced by waste feedstocks that
included cow manure, energy crops, whey, cheese waste, and other organic material such as
grease trap wastes or eggs from offsite processes and completed a cost-benefit analysis of the
entire anaerobic digester power generation system. The project also quantified all
environmental attributes created by this system design and verified that the anaerobic power
generation system will meet or exceed all environmental regulatory requirements for California.
This project demonstrated that the anaerobic digestion system will produce higher amounts of
biogas using multiple feedstocks, increased power generated for an acceptable economic return
on the investment, and comply with environmental regulatory requirements. These results will
improve the ability to commercialize these technologies in California and the United States;
provide the necessary technical data to regulatory agencies to increase the predictability of
public policy; and facilitate the permitting process of anaerobic digesters. Improving this
process will encourage more dairy operations to consider installing this type of system.
Project Process
The anaerobic digestion power generation system used for this project consists of two above-
ground concrete tanks for anaerobic digestion and an internal combustion engine and generator
set designed to operate on biogas generated from dairy manure to generate electricity that
feeds into the Modesto Irrigation District’s electrical grid, and produce heat for use at the dairy.
When evaluating the various technologies that were available for anaerobic digestion and
power generation, the technologies selected for use in this project are a highly suitable
configuration for a dairy operation. The various alternative power generation systems
evaluated include diesel engines redesigned and rebuilt to operate on biogas, mictroturbines,
biogas to pipeline, and fuel cells. For each of these technologies, it was determined there were
too many unknowns as well as extraordinary costs to select them. Furthermore, in a commercial
dairy setting, these technologies either had not operated as expected and/or failed, are the first
projects of their type in a commercial dairy setting, have not gone online, or have historically
experienced excessive engine break downs due to the reconfigured old diesel engines not
initially designed for biogas. After extensive research of all of these technologies, it is clear that
none of them had a proven track record to meet California’s air and water regulations. Many
research studies investigating these technologies have determined the following:

2
Redesigned and rebuilt diesel engines will not meet the new air emission quality
standards passed in May 2007 because of emissions of oxides of sulfur (hydrogen
sulfide), oxides of nitrogen , particulate matter, and carbon monoxide.
Older diesel engines are getting harder to find and retrofit with the appropriate
technology to bring them into the new air quality standards.
Microturbine engines continue to have problems with the higher hydrogen sulfide levels
found in biogas, as well as low operating efficiencies and therefore do not operate long
enough to reach a positive return on investment.
Fuel cell technology has yet to be proven using exclusively dairy biogas, and the cost to
install and operate is prohibitive for a dairy operation to manage.
Biogas-to-pipeline design has not yet been proven to be a viable business model,
operates inconsistently for a 12-month period under field conditions, and requires a
main gas line from a utility within two miles of the biogas production and scrubbing
facility to be economically feasible. Evolving the power generation component of this
system to continuously meet the air emission regulations and have a positive economic
return on investment within seven years is critical to the commercialization of this
technology.
The anaerobic digester technology used in this project is also a new application in California;
the above-ground tank design is the first of its kind in a California dairy farm. Throughout the
past 35 years, the typical anaerobic digester design at California dairies has either been an in-
ground lagoon style system or a “plug flow” design, where the slurry inside the vessel moves
when a new batch of manure is introduced at the front end, displacing a similar volume that
moves out the back end. The existing in-ground lagoon-style anaerobic digester has had trouble
with key metrics: it has not consistently met California air and water environmental regulations,
it may not maintain a uniform production of gas year round, and it requires a larger overall
project footprint that takes valuable land out of production. Although there are more than a
dozen of these systems operating at California dairies, developing a system that allows for
improved management of the slurry, higher efficiency and effectiveness in biogas production,
and improved digestion of the nutrients will enable the system to achieve a greater economic
return in a shorter period. This project documented the environmental and economic viability
of this state-of-the-art system.
Project Results
The project’s measurable technical goals determined the quality of the power and heat, the
quantity of power and heat generated, and the optimum operating parameters to enhance the
system. The economic viability of this source of renewable energy has also been evaluated by a
cost/benefit economic analysis.
This research project gathered and analyzed data to evaluate further development of dairy
anaerobic digesters in California and improve energy efficiency for dairies using off-farm
organic feedstocks. Although anaerobic digesters historically have been used in California to

3
break down practically anything digestible, state regulations have prevented using more than
cattle manure as a feedstock in dairy digester systems. There is concern that if additional or
alternative feedstocks are added to the dairy digesters, the water and/or air quality emissions
will be negatively impacted. However, this project with the alternative anaerobic digestion
technology design and a Guascor internal combustion engine specifically designed to operate
on biogas from off-farm substrates, produced exhaust emissions and effluent water of sufficient
high quality to meet or exceed California’s strict air and water regulations. The cost/benefit
analysis task performed determined that this system can operate successfully with an
acceptable economic investment with the use of off-farm substrates. To achieve the identified
goals, system performance data were gathered to quantify actual energy production and
environmental quality. This project, using the anaerobic digestion technology, the lean–burn,
biogas-driven designed engine, and outside organic substrates has demonstrated the financial
and regulatory viability of the systems. Verification of the reliability and environmental benefits
of this system through extensive monitoring will ease permitting numerous additional systems
within California to benefit California residents in the form alternative energy production,
improved energy efficiency of the dairy industry, and high environmental standards.
A potential project outcome is an increased number of dairy-based renewable power generation
projects in California. The potential electrical power generation from dairies in California alone
was estimated by the California Energy Commission in a June 8, 2007 report, Estimation of Power
Production from RB5 Dairies to be about 1,530 gigawatt hours (GWh) per year.
The project findings show that using organic off-farm-generated wastes have a positive impact
on the financial viability of these types of anaerobic digestion and power generation facilities.
The off-site material allows the farm to generate revenues from fees that are charged providers
of wastes (“tip fees”) and from increased electrical sales revenues; without these additional
revenue streams, these types of systems are not financial viable. Furthermore this study has
demonstrated that using off-site substrates has very little impact on air and water emissions.
Benefits to California
This system has been successfully demonstrated in other states and in Europe, but has not been
tested in California in a working agricultural environment. To be commercially viable in
California this system must meet existing environmental regulations, primarily air and water.
Of particular importance for the project is the codigestion of whey (cheese waste) from an onsite
cheese production facility, manure waste, and off-site generated organic materials. This system
is one of the first anaerobic digester systems permitted by the Region 5 Water Quality Control
Board to codigest more than one feedstock. The ability to permit a dairy digestion system using
more than one feedstock is critical to the economic viability and commercialization of this
system.
It is critical to prove that using alternative feedstocks in a dairy anaerobic digester power
generating system will benefit the environment through improved management of waste
streams from food service companies, improved air and water quality, and improved nutrient
and waste management. It is also important to demonstrate that the recovery and/or sale of
electricity, heat, environmental attribute credits, and “tip fees” can be profitable to dairy

4
operations. All of these sources of revenue become very important when determining the
economic viability of the project and, thus, in further developing the commercialization of the
technology. The economic viability of this type of system is critical to deciding if an anaerobic
digester power generating system would be installed at a dairy. The additional potential
revenue stream is important in evening out the extremely volatile milk industry economics.
This project identified and determined the most cost- and environmentally effective co-digestate
(material remaining after anaerobic digestion of a biodegradable feedstock) available to increase
biogas production and improve biogas quality (reduced hydrogen sulfide) in a dairy-based
anaerobic digestion system. Testing and understanding the effect that liquid, solid, and biogas
digester effluents, as well as off-site organic dairy substrates (mainly grease trap and egg
wastes) have on air and water quality is critical for developing sound public policy on
regulatory standards to control the release of these substances. Identifying the nutrient makeup,
biological oxygen demand, and total dissolved solids (salt) loading of the various substrates has
narrowed the list of substrates available for use in a digester to produce sufficient biogas to
operate a 710 kilowatt hour Guascor combined heat and power generation unit for electrical
output. One-liter samples of various were collected and sent to a local laboratory familiar with
the regulatory constraints. These substrates were tested for biological oxygen demand, total
suspended solids, total dissolved solids, nitrogen, phosphorus, and potassium.
The offsite organic substrates provided the proper constituents to optimize biogas production
without having a negative impact on the quality of effluent and exhaust emissions related to use
of biogas as a fuel.

5
6
CHAPTER 1: Purpose and Scope of this Study
1.1 Purpose
This project addressed the technical, economic and regulatory feasibility of using various
organic feedstocks generated off-site to produce biogas in a dairy based anaerobic digestion
power generation system located at Fiscalini Farms, L.P. in the San Joaquin Valley of California.
The study involved identifying and contracting sources of off-site organic substrates, which
were then inputted into an agricultural based anaerobic digester system and co-digested with
on-site dairy manure. A number of parameters were measured as the substrates were
processed through the digester including:
• Volume of substrates received on a monthly basis
• Economic value of “tip fees” from outside substrates on a monthly basis
• Volume of biogas generated on a monthly basis
• Electrical production on a monthly basis
• Volume of manure processed on a monthly basis
• Electrical revenue on monthly basis
• Anaerobic digester facility costs on a monthly basis
• Analytical results from a number of sample locations
This data was used to generate a number of different analyses including:
• Air Emission Summaries
• Influent Characteristic Summaries
• Effluent Characteristic Summaries
• Substrate Characteristic Summaries
• Production Reports
• Financial Reports

7
CHAPTER 2: Fiscalini Farms Anaerobic Digester Physical Facilities
2.1 Facility Overview
The anaerobic digester located at the Fiscalini Farms dairy was installed in 2008. Its European-
based system was designed and built by Biogas Energy, Inc., a California company. The system
is comprised of two circular concrete above ground tanks, approximately 80 feet in diameter
and 23 feet deep. Allowing for approximately two feet of free board inside the tank, the
working hydraulic capacity is approximately 850,000 gallons per tank. The tanks are insulated
to minimize heat losses from the vessels and plastic piping, embedded in the concrete tank at
the time of construction, is used to provide the heat exchange capacity for the digester Hot
water generated from the combined heat and power (CHP) system is circulated through the
piping to maintain the temperature within the digester of approximately 100 degrees Fahrenheit
(°F). The 100°F operating temperature is the standard anaerobic digestion temperature for
mesophilic operation.
The digesters are setup to act as complete mix vessels operating in parallel to each other; a
common setup for the European digester designs. Each digester was initially configured with 4
Flygt submersible mixers. These mixers are suspended on a cable system allowing them to be
raised and lowered in the water column in the digester. The mixers are also configured with a
manual rack and pinion system allowing them to be rotated within the digester. This
configuration allows changes to be made to the mix systems while the digester is in operation.
Each digester tank has an inflatable top of a canvas type material. It is inflated using
continuously running ¼ horsepower air blowers. Each tank has a second membrane structure
under the inflatable roof. This membrane is of 60 millimeter (mm) polyethylene construction
and is designed to contain the methane gas generated from the digester operations as well as
preventing an infiltration of outside air into the digesters. The digesters are equipped with
several safety devices designed to prevent overpressurization of the tank. A small amount of air
is pumped into the headspace of the digesters to promote the growth of facultative bacteria,
which convert some of the hydrogen sulfide generated from the digestion process into insoluble
sulfur compounds. These compounds slough off and are removed via the digester liquid
effluent withdrawal.
Using the air injection system decreases the hydrogen sulfide (H2S) from approximately 2,000-
4,000 parts per million (PPM) to typically under 500 PPM. Due to the complex nature of the
biological process the H2S varies from a low of less than 20 PPM to a high of over 1,000 PPM
with an average of approximately 200 PPM during the test period.
The digesters are equipped with high-density polyethylene piping systems, which collect the
biogas generated from the digester tanks. The biogas is then pressurized via a centrifugal
blower and sent to a chiller system, which chills the gas to approximately 45 °F to remove the
moisture (water vapor) in the gas prior to combustion.

8
The conditioned biogas is then combusted in a Guascor 500 series engine, which is coupled to
an electricity producing generator. The Guascor engine is configured to burn biogas that is 60%
methane and 40% carbon dioxide, and has a name plated electric generation capacity of 710
kilowatts per hour (kWh). The engine is equipped with a Selective Catalytic Reduction (SCR)
unit, which removes the majority of the nitrogen oxide (NOx) and carbon monoxide (CO) from
the exhaust gases. A portion of the heat generated from the combustion process is captured in a
heat exchanger system, heating water as a means of moving the heat to the digester tanks and
other parts of the dairy. This hot water is circulated through the piping system described above
to maintain the digester at 100 °F. The Gausor generator set and the associated heat recovery
systems were designed and installed by Martin Machine. All of the electricity generated by the
CHP system is sold to the Modesto Irrigation District (the local electrical utility) under a 15-year
power purchase agreement (PPA).
The influent to the anaerobic digester system originates during the flushing of the lanes where
the diary cattle are maintained. The flush lanes are approximately 900 feet long and are flushed
6 times per day for 2-3 minutes at a flow rate of approximately 1,000 gallons per minute. There
are 4 barns with 2 lanes per barn and each barn houses approximately 450 dairy cows. Based on
many previous studies conducted by the dairy industry, the amount of manure generated per
lactating dairy cow is between 90-120 pounds (lb) per day. Each flush lane is collected into a
common concrete conduit and flows into an inlet structure at the digester.
The inlet structure for the flushed manure is divided into 4 separate concrete basins. Basin
number one is used to settle the heavy primarily non-organic particulates from the flow. This
includes sand, dirt, rocks, and other materials unsuitable for the anaerobic digester system.
From the initial inlet structure the manure slurry flows into the “East” pumping chamber where
the slurry is pumped across a “slope screen” seperator (a device which separates the large
solids from the slurry mixture) where the discharge gravity flows into the “settlement pit”. The
”settlement pit” basin was originally designed and built to feed the digester from the conical
bottom.
The use of the original flow scheme allowed a very high percentage of inorganic solids to pass
through the slope screen into the conical bottom basin. These inorganic solids, primarily sand,
were then pumped directly into the digester tanks. Due to the density of the inorganic
materials, 7 feet of sand settled out in the digestion vessels, causing serious erosion issues to the
mixers and pumps and ultimately led to the multiple failures of the mix system in digester tank
number 2. This tank was emptied and cleaned three times, the last time being in June 2013,
when the tank was pumped out and the inorganic buildup removed as shown in the photo in
Figure 1 below. The mixers were repaired and re-installed and tank 2 was returned to service
the end of July 2013, after being out of commission for 7 weeks. This build up of inorganic
materials was similar to the other two times the tank had to be emptied and cleaned. Note the
mixer blades and static mixing system added after the original design failure; the top funnel is 8
feet off the bottom of the tank

9
Figure 1: Sand Buildup in Digester Tank 2
In July 2013, the inlet structure for the digesters was modified to allow the sand to settle out in
the conical bottom basin. The organic materials now overflow into a pumping pit as shown in
Figures 2 and 3 below.
Figure 2: Revised Organic Vs. Inorganic Separation Pit

10
Figure 3: Manure Separation Wall Completed and Operational
To date this system has eliminated the vast majority of sand and inorganic material infiltration
into the digestion systems. An earlier study funded by the United States Department of Energy,
Fiscalini Farms Biomass Energy Project (Stringfellow, Camarillo, Hanlon, Jue, & Spier, 2011)
and conducted by the University of the Pacific, showed the influent feed to the digesters was as
much as 70% inorganic. As is seen from the data later in this report, the influent isnow in the
60% organic range, which is typical for dairy digesters.
The primary influent pump failed in July 2013 as a result of sand and debris ingested from the
original inlet structure configuration. The entire pump required a major rebuild and it was sent
to the European company, Volgalsang, repair facility in Ohio. The secondary influent pump
was also disassembled and inspected. The pump’s internal assembly was also found to be
seriously eroded and required replacement. After replacing the internals of the secondary
influent pump, the digester system was operated in manual mode. The secondary pump
system was reinstalled only to serve as a backup and therefore not coupled into the system’s
Supervisory Control and Data Acquisition (SCADA) control system. The daily operational
sequence was as follows:
• The effluent valves were opened and each digester was allowed to drain to a level of
approximately 19.5 feet
• The effluent valves were then closed to stop flow
• The influent valves were again opened and the digester was refilled to a level of
approximately 20 feet.
• The influent valves were then closed to complete the daily test cycle

11
This process occurred each day, 7 days per week until the main influent pump was returned to
service on September 27, 2013. Based on tank size and fill level, the total volume of influent
processed on a daily basis was approximately 30,000 gallons per digester per day. This gives a
hydraulic retention time (HRT) of about 28 days for the eastern most digester 2 (D2) and less
than 28 days for western most digester tank 1 (D1), as D1 was expected to have a loss of
capacity of 10-15% due to sludge buildup as was initially found in D2. The HRT is calculated
by dividing the total volume of the digester by the daily influent volume. Normal HRTs are in
the 20-30 days range. Anaerobic digester performance improves when the influent and effluent
rates are consistent, and typically anaerobic digesters are fed frequently on a 24-hour period.
The manual system used at the Fiscalini site processed less influent on a daily basis and resulted
in some loss of digestion efficiency.
Organic substrate reception facilities located offsite consist of two 14,000 gallon fiberglass
receiving tanks that are shown in Figure 4 below. These tanks are interconnected giving a total
receiving capacity of 28,000 gallons. The tanks are connected to the digestion system via two
Vaughan “chopper”pumps that circulate the contents of the reception tanks. The pumps reduce
the particle size of the organic materials thereby improving the digestion process. The outside
organic substrates are fed either manually or automatically into the digestion system. The tanks
are diked to prevent loss of material in the event of a tank failure. These tanks are pumped
empty every day.
Figure 4: 14,000 Gallon Digestate Mixing Tanks Located Offsite

12
2.1.1 Facility Operations
The digestion facility was started up in December 2008. This was the first agricultural based
complete mix system in the state of California. There were numerous startup issues that are
rooted mainly in these four areas: lack of on-farm knowledge, lack of technology provider
support, and engineering miss-calculations.
Anerobic digestion was, and still is a rather new technology addition to the dairy/farming
community. Although dairy/farming today is a relatively high technology industry, anaerobic
digesters are a significant departure from typical dairy/farming activities. The skill sets
required by operators of anaerobic digestion facilities are considerably different compared to
normal dairy/farming activities. Anaerobic digestion is a fairly complicated bio-chemical
process, which requires specialized mechanical systems that are unique to anaerobic digestion
facilities. Fiscalini Farms personnel initially struggled with the learning curve for both the bio-
chemical and mechanical components. There was a very steep learning curve with little outside
support from dairy/farming co-ops or other user groups with past experience. Therefore, the
digester suffered operationally related issues such as mechanical breakdown, improper feed
rates, and improper and/or ineffective responses to technical issues.
The agricultural industry digester (AID) business in the United States has been, and continues
to be a very small niche market. Unlike Europe, the agricultural market in the United States has
few anaerobic digester systems in place. It is a market that has few technology providers located
in the United States. The only two current manufacturers in the United States are DVO and
RCM. The other providers of anaerobic digester are all of European origin, and these
manufactures are represented in the United States only by small distribution companies.
Fiscalini Farms selected a digester of European design and origin because the lack of local
support would mean increased time and cost to resolve technical and mechanical issues. This
issue continues today as components fail, the vast majority of replacement parts typically are
only available in the European market place. Over time, some of the support equipment such
as chilling systems, pumps, valves, and electronics will be able to be replaced with components
manufactured in the United States.
On October 1, 2013, as part of this study, substrates were no longer introduced to tank D1. D1
was only operated on raw manure. Tank D 2 was operated on both manure and substrate.
Both digesters share a common gas collection system but the effluent in each digester tankwas
still sampled and analyzed for comparison purposes. These protocols remained through the
end of October when the last sets of effluent samples were taken and tested. This protocol
allowed for the direct comparison of the effluent and operational differences between the two
digester tanks fed different feedstocks through a complete HRT cycle. For the purpose of this
study and as is normally the case for most AID systems based in the United States, the HRT is
considered to be the same as the sludge retention time (SRT). This is due to the lack of any type
of “return activated sludge” (RAS) used as part of the process. There are some digester designs
that use some RAS, however this particularAID system does not.

13
2.1.2 Substrate Identification and Contracting
Animal manure is the most widely recognized feedstock for AID systems, however it is not the
most desireable feedstock because it provides a relatively small amount of biogas per pound of
material when compared with other potential feedstock. The reason is that the cows’ digestive
systems have removed much of the nutrient and energy value of the feed they consumed before
their manure waste reaches an anaerobic digester. Therefore, combining animal manure with
other organic substrates greatly increases biogas production and helps to make the use of
digesters significantly more economically feasible than using animal waste alone; this is called
co-digestion.
Co-digestion is a process in which additional organic waste materials such as carbohydrates
and energy rich fats, oils, and grease (FOG) and/or food wastes are added to the digester with
the dairy manure. An added bonus is the diversion of food scraps, FOG and other organic
wastes from landfills and sewer lines. These high-energy materials typically have at least three
times the methane production potential of manure. The biogas production potential correlates
to the amount of energy that the material produces when digested anaerobically. Table 1 shows
the biogas potential of numerous organic feedstocks.
Table 1: Biogas Potential of Organic Feedstocks (Basisdaten Biogas Deuthchland, Marz, 2005)
Substrate Biogas Yield (m
3 per metric ton)
Fats and Grease 961
Bakery Waste 714
Food Scraps 265
Corn Silage 190
Grass Silage 185
Green Clippings 175
Brewery Waste 120
Chicken Manure 80
Potato Waste 39
Pig Manure 30
Cow Manure 25
Food wastes are typically rich in organic matter and as a result are troubling in landfills, as it
decomposes it releases methane; a potent greenhouse gas. More than 36 million tons of food
waste was generated in 2011 and as much as 95% was thrown into a landfill (Challenge, 2013).
Energy generation, including AID, is an industrial use of food wastes. Several municipalities
across the United States offer either household or commercial collection of food wastes. In

14
addition, there are many private organic recycling companies across the United States collecting
and receiving organic waste streams.
Food wastes have high moisture content and are often the wettest component of household
garbage. This high-quality organic energy source can be mixed easily with other organic
materials. The energy content in the resource is a function of the type of food waste but usually
ranges between 1,500 and 3,000 British thermal units (Btu) per pound of waste. The energy
content determines how much energy can be produced from a feedstock. According to the
United States Environmental Protection Agency (EPA), food wastes comprise most of the
material sent to landfills, and only 2.5% is diverted annually. A University of Texas study
estimates U.S. food wastes could be diverted from landfills to produce 4,900 trillion Btu of
energy (Cullar & Weber, July, 2010).
Table 2 below lists some food waste characteristics.
Table 2: Food Waste Characteristics; Solid Waste Profile (Cullar & Weber, July, 2010)
Food Waste Characteristics
Moisture content 70%
Energy content 1,500 - 3,000 Btu/lb
Density 2,000 lb/cubic yard
Table 3: Top 10 Most Prevalent Items in California Waste Disposal Systems

15
Table 3 displays the top ten most prevalent material types in California’s waste dispoal system,
the top seven most desireable being highlighted. Many different facilities produce significant
food waste volumes attractive to use in an AID system. These facilities include food
manufacturers, restaurants, hospitals, universities, and supermarkets. Hospitals and
universities produce similar wastes streams comprised of typically 50% fruit/vegetables and
50% protein (meat, fish, and poultry) and baked goods. Restaurant food waste exhibits more
variability in composition. Restaurants preparing food as it is ordered are likely to generate
largely fruit and vegetable wastes with minimal amounts of bakery, sugar, starch, and dairy
products. Supermarket waste is mostly produce (90%) with small amounts of bakery, seafood,
and deli wastes. Supermarket meat wastes are generally collected by rendering facilities.
(Group, 2009)

16
CHAPTER 3: Method
3.1 Substrate Characterization
The substrate study evaluated food waste generators within a 60-mile radius of the study area
(approximately centered on Modesto, California). This included the counties of Stanislaus,
Merced, San Joaquin, Alameda, Santa Clara, Contra Costa, Mariposa, Tuolumne and a small
portion of Sacramento County.
3.1.1 Background
A previous study conducted in Massachusetts evaluated the amount of organic sources
available in the State of Massachusetts (Darper/Lennon, 2002). That study derived formulas to
theoretically quantify food waste generated by various industries. These formulas were utilized
in this study to quantify potential organic feedstock amounts from food manufacturers,
supermarkets and grocery stores, restaurants, universities and hospitals. This study uses the
same calculation for food manufacturers, grocery stores, and restaurants assuming 3,000
pounds of waste each year per employee. Food manufacturers included producers of animal
food, bakeries, dairy products, grain processing, oil processing, chocolate manufacturing,
vegetable and fruit processing, frozen foods, animal slaughtering, seafood processing and snack
food manufacturing.
Numerous studies were analyzed to determine an approximation of the amount of food waste
generated by grocery stores. The CASCADIA study (Group, 2009) is based on California stores;
the Massachusetts Department of Environmental Protection (“MDEP”) study (Darper/Lennon,
2002) is based on Massachusetts stores; and both the Jones (Timothy W. Jones, 2002) and Buzby
(Buzby, Wells, Axtman, & Mickey, 2009) studies are conducted by the United States Department
of Agriculture (USDA) over the United States as a whole, followed by a study based on North
Carolina stores.
The CASCADIA study found each supermarket produces approximately 64 tons of food waste
per year. Applying this number to each store, the Chicago Metropolitan Area’s tonnage would
be approximately 89,600 tons per year (tpy). According to the MDEP study, each supermarket
produces approximately 222 tpy and convenience stores produce approximately 43 tpy (note:
this study does not include stores with numbers of employees less than 10). On average, that
would mean each store produces 132.5 tpy. Applying these values to the Chicago Metropolitan
Area correlates into approximately 185,500 tpy from grocery stores. Based on the Jones study
produced by the USDA in 2002, supermarkets produced 22 tpy and convenience stores
produces 10 tpy of food waste, giving us an average of 16 tons per store per year. If applied to
the Chicago Metropolitan Area, that would result in approximately 22,400 tpy (Timothy W.
Jones, 2002). This study is believed to be consistent with supermarket tonnage in the Modesto
area.
17
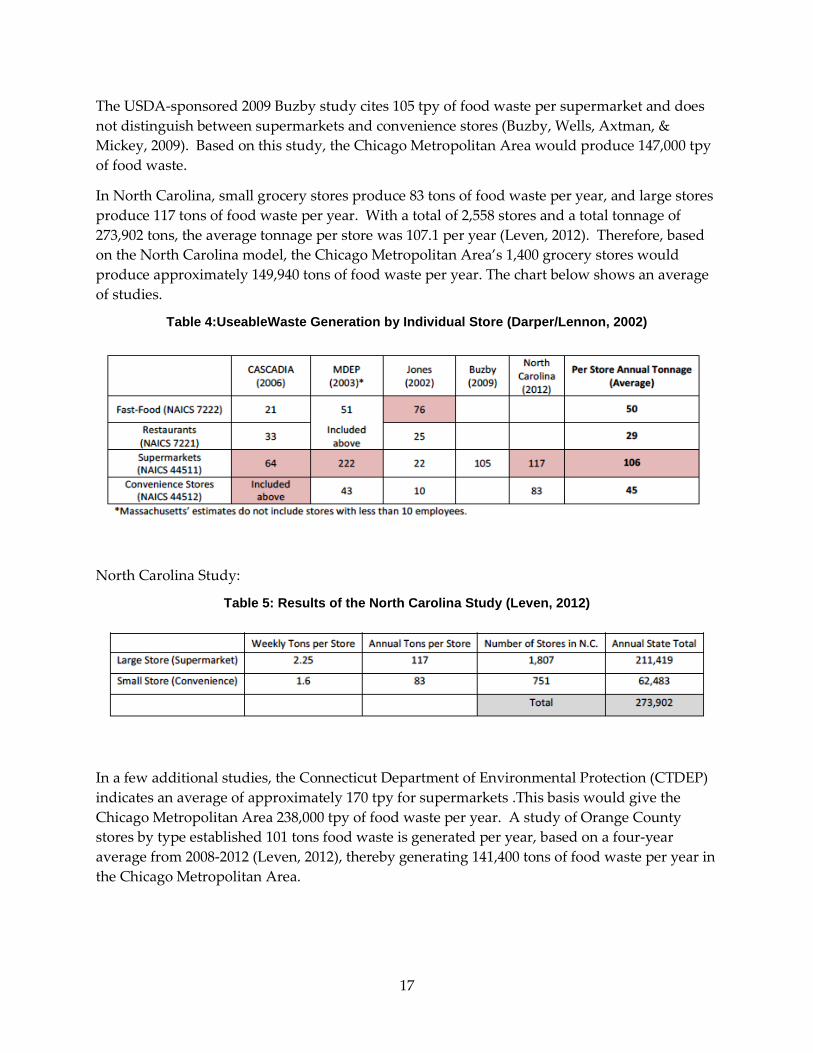
The USDA-sponsored 2009 Buzby study cites 105 tpy of food waste per supermarket and does
not distinguish between supermarkets and convenience stores (Buzby, Wells, Axtman, &
Mickey, 2009). Based on this study, the Chicago Metropolitan Area would produce 147,000 tpy
of food waste.
In North Carolina, small grocery stores produce 83 tons of food waste per year, and large stores
produce 117 tons of food waste per year. With a total of 2,558 stores and a total tonnage of
273,902 tons, the average tonnage per store was 107.1 per year (Leven, 2012). Therefore, based
on the North Carolina model, the Chicago Metropolitan Area’s 1,400 grocery stores would
produce approximately 149,940 tons of food waste per year. The chart below shows an average
of studies.
Table 4:UseableWaste Generation by Individual Store (Darper/Lennon, 2002)
North Carolina Study:
Table 5: Results of the North Carolina Study (Leven, 2012)
In a few additional studies, the Connecticut Department of Environmental Protection (CTDEP)
indicates an average of approximately 170 tpy for supermarkets .This basis would give the
Chicago Metropolitan Area 238,000 tpy of food waste per year. A study of Orange County
stores by type established 101 tons food waste is generated per year, based on a four-year
average from 2008-2012 (Leven, 2012), thereby generating 141,400 tons of food waste per year in
the Chicago Metropolitan Area.

18
Table 6: Waste Generation per Type per Store (tons), Orange County. (Leven, 2012)
According to the MDEP study, the average restaurant produces 51 tpy, yielding an estimated
257,000 tpy of food waste per restaurant. Different studies find different results as CASCADIA
estimates food waste production to be 33 tpy, the Jones study estimates the amount at 25 tpy
and the Orange County report estimates the amount at 32tpy.
For the “fast food” category, the CASCADIA, MDEP, and Jones studies report an average of
49.33 tpy per “fast food” restaurant.
For example, assuming half of all food Chicago restaurants are classified as “fast food” and the
other half are “restaurants”, food waste will total an estimated 172,667 tpy from “fast food”
establishments, and 123,375 tpy from “restaurants,” and a total food waste generation of 296,042
tpy.
Restaurants considered were full service restaurants. Universities considered were those with
enrollments of 4,000 or more. Food wastes from universities with dining halls were based on the
number of students and meals per year. Food wastes from hospitals were estimated using
number of beds. Only hospitals with inpatient services and with 25 beds or greater were
considered for the study. The formulas for the industries mentioned are as follows;
Food manufactures and grocery stores: Organic food wastes (lbs/year) = number of employees x
3,000(lbs/employee/year
Restaurants: Food waste (lbs/year) = Number of employees x 3,000 lbs/employee/yr
Hospitals: Food waste (lbs/year) = # of beds x 5.7 (meals/bed/day) x 0.6 lbs (food waste/meal)
x 365 (days/year)
University: Food waste (lbs/year) = # of students x 0.35 lbs (food waste/meal) x 405
(meals/student/year)

19
The Census Bureau identifies types of businesses using numerical codes known as the North
American Industry Classification System (NAICS). The Census Bureau contains a database
which quantifies and classifies industries by county based on the NAICS code and provides
information on the number of establishments by industries and range of number of employees.
The database is known as County Business Patterns (County Business Patterns, Zip Code
Business Patterns, 2013). This study evaluated business categories including food
manufacturing, supermarkets and grocery stores, restaurants, hospitals and universities. Only
facilities with 70 employees or more were included in the evaluation. Smaller facilities were
eliminated due to the expectation of low volumes and insufficient staff to separate wastes.
NAICS reports the number of facilities for a particular type of establishment for several
categories of employment size. Because exact number of employees per establishment is
unknown, the average number of employees per employment class size was used.
Grease Trap Waste (FOG)
Given that the number of restaurants and population is tightly correlated an MSA’s population
and its number of restaurants can be used as proxies for the pounds/year of brown grease
generated. For each Metro Area, the NREL (National Renewable Energy Laboratory) report
(Wiltsee & Appel Consultants, 1998) compared the number of restaurants to the population. The
number of restaurants per thousand people in each Metropolitan Area was relatively consistent,
between 1 and 2 for all 30 areas with a weighted average of 1.41. Restaurant generates
approximately 6,000 lbs. of brown grease per year.
Using this data Organic Solution Management (OSM) contracted with a number of haulers,
grease trap service companies, and brown grease processors to provide the necessary substrates
for the study at Fiscalini Farms. The specific volumes contracted are outlined in this report.
3.2 Results of Characterization
The results of the research to discover what off site organic resources were available in the
Modesto Ca region, using the calculation basis discussed above; the follow two charts are the
results of those efforts.

20
Table 7: Number of Facilities by Industry with 70 Employees or More
Substrate Generator Category
Number in Category
Number of Employees
Est. Annual Tons of Substrate
Substrate Potential
Bakery 4 691 1,037 Low
Diary 10 1,879 2,819 Very Good
Fruit and Veg 21 7,107 10,661 Good/Seasonal
Meat Packing 9 1,524 2,286 Low/Good
Snack Food 5 1,355 2,033 Good
Soft Drink 2 200 300 Good
Wine 9 4,973 7,460 Good/Seasonal
Breweries 1 100 150 Low
Candy Mft. 4 1,050 1,575 Low
Pharmaceutical 5 400 600 Good
Edible Oils 1 135 203 Low
Food Mft 4 905 1,358 Good
Spices 4 350 525 Low
Non Alcoholic Bev 3 575 863 Good
Poultry Production 1 400 600 Good
Breakfast Cereal 2 592 888 Low
Total 85 22,236 33,354
Table 8: Grease Trap Waste Within 60 miles of Modesto, California City Center
Counties Within 60 Miles Population # Restaurant Tons of Brown Grease/Yr.
Stanislaus County 511,263 583 1,748.5
Merced County 245,514 280 839.7
San Joaquin County 670,990 765 2,294.8
Alameda County 1,464,202 1,669 5,007.6
Santa Clara County 1,748,976 1,994 5,981.5
Contra Costa County 1,019,640 1,162 3,487.2
Mariposa County 18,036 21 61.7
Tuolumne County 55,806 64 190.9
Total 5,734,427 6,537 19,611.7

21
CHAPTER 4: Data Collection and Monitoring
4.1 Data Collection and Monitoring Program
The study collected data from a number of different sources.
A. Substrate volumes were collected from daily weight tickets from the transportation
companies that hauled the material to the site. This process involved the transporter
weighing their trucks on the truck scales at Fiscalini Farms. The trucks were weighed in
full and weighed out when empty giving a tare weight. This data was entered into an
Excel spread sheet and summarized on a monthly basis by supplier and total.
Table 9: Substrate Volumes by Supplier by Month
Tons
Customer Name July August Sept Oct Nov
Mountain Valley 37.10 24.42 0 22.05 13.37
EPS 164.33 380.40 163.22 44.38 155.71
Porter 125.08 51.44 48.13 112.49 48.71
Clark 336.41 259.46 203.98 308.74 485.16
HP 442.9 396.26 373.08 474.88 569.72
Miguel Plumb 7.73 20.61 0 3.48 0
CAB 97.39 125.83
Total Tons 1,113.55 1,132.59 788.41 1,063.41 1,398.50
B. The economic value of management costs from “Tip fees” collected from the outside
substrate suppliers were summarized monthly based on the tip fees and the monthly
tons delivered to the site. This data was entered into the monthly proforma summary as
“Tip Fee” Income.
C. The volume of biogas generated was recorded weekly and summarized on a monthly
basis in the monthly production reports. The data was generated from the sites gas
totalizer.
D. Electrical production was recorded on a monthly basis based on an electrical totalizer
located at the site and installed by Modesto Irrigation District, the local utility provider.
E. The volume of manure slurry processed was collected on a monthly basis and was either
recorded from the influent meter totalizer (mass flow meter) or from the changes in
liquid level within the digesters during manual operations

22
F. Electrical revenue generated from biogas was based on the monthly kilowatt hours
(kWh) produced multiplied by the sales rate of $ 0.109 per kWh
G. The costs to operate the anaerobic digester facility were recorded on a monthly basis and
are outlined later in this report.
H. Samples from a number of locations were collected and submitted to Denelee
Laboratories in Turlock, California for analysis. Sample locations included:
• Manure influent to the digester inlet structure
• Effluent from the combined digester as well each individual digester
• Composites from the substrate storage tanks
• Manure solids from the slope screen
• Manure solids from the on-site drying operations
Monthly Averages from daily readings of H2S and NOx levels from the onsite meters were
conducted.
4.1.1 Fiscalini Farm Production Report Discussion
As part of this study, a monthly digester “production” report was prepared. This report was
used to compare the month-to-month variations in the inputs and outputs of the digester
system. As outlined above the following information was collected from the various data
collection equipment on the site:
• Volume of substrates received on a monthly basis
• Volume of biogas Sent to the CHP
• Electrical production on a monthly basis
• Volume of influent processed on a monthly basis
• Hours of engine operation
• Number of engine starts
The collected raw data was utilized to develop the monthly production summary report for the
digester system. An explanation of how the numbers were developed is as follows:
Engine Hours:
The total hours the engine system ran were collected on the first of each month from the
totalizer on the engine control system. The CHP system has an hour meter that records total
hours the engine had run since it was installed. The summary of the total hours the CHP system
operated during the month was determined by subtracting the previous months totalizer hours
from the current months total. It was attempted to take the totalizer readings at 8:00 AM on the

23
beginning and end of each month to keep the data consistent. This data gave the total hours of
operations for the month.
Engine Up-Time:
The CHP system “Up-Time” was determined by taking the total hours available for that
particular month (number of days in the month times 24 hours per day) and dividing that into
the actual total hours the CHP operated. The CHP system at Fiscalini Farms operated nearly
continuously with only a few down time hours that were due to routine scheduled maintenance
(oil and plug changes, valve adjustments) and periods of time when there simply was a lack of
sufficient biogas to operate the system. There was also a problem at a point in the project when
the Modesto Irrigation District power distribution network required the system to be shut down
for 35 hours during the month of September. Based on the performance of the engine during the
study period and the scheduled down time for maintenance, the engine system could maintain
a 90% plus uptime if the biogas is available. This is consistent with other AID/CHP systems
OSM has reviewed including:
• Indiana Beef Cattle facility (Average 87% uptime)
• Indiana Poultry Facility (Average 91% uptime)
• Wisconsin Dairy Facilities (3) (Average 85% Uptime)
• Ohio Poultry Facility (Average 90+%) Uptime
Electrical Energy Produced:
The CHP system was monitored for the total electrical energy produced on a monthly basis.
The CHP system has an electrical totalizer that records the kWh produced since the system was
installed. The totalizer was read at the beginning and end of each month to determine the total
kWh produced for the month. The difference between the previous month and the current
month resulted in net kWh produced
Percent Capacity Produced:
The total kWh actually produced was compared with what could be produced if the engine ran
24/7 at maximum output. The CHP system is nameplate rated at 710 kilowatts (kW) according
to Fiscalini Farms. Load testing conducted by OSM determined that due to the configuration of
the cooling system, and biogas feed blower, the CHP system could only produce 600 kW at full
load. Attempting higher operating outputs caused the CHP system to fault out for a variety of
reasons including:
• High jacket water temperature (cooling system issue)
• High oil temperature (cooling system issue)
• Low fuel gas supply (biogas blower issue)
Therefore, for the purposes of the study the maximum continuous CHP output was assumed to
be 600 kW. It is important to note that the overall financial viability of the digester system is

24
closely related to operating the CHP at or near its maximum electrical output capacity to
maximize electrical revenue. Digester developers and technology providers often “sell” their
systems based on the maximum electrical output capability of their installed CHP capacity.
OSM’s experience has found that many digester systems DO NOT operate at their full rated
capacity but often at a lower capacity. As is seen from the Fiscalini Farms digester summary,
the CHP system operated at less than 30% of capacity the vast majority of time. The capacity
problem, assuming high CHP “up time”, is solely a function of lack of biogas to operate the
system at higher electrical loads. This was the case during the study period at Fiscalini Farms.
There was not enough biogas to operate the CHP at high load continuously.
Biogas Production:
The volume of gas was recorded from the gas flow meter totalizer at the beginning of each
month. The previous month was subtracted from the current month to determine the quantity
of the gas produced for that month. However, biogas was not flared during the study period.
Biogas is typically flared for two reasons:
1. Excess gas produced beyond that which can be consumed by the CHP system or
2. Excess gas caused by excessive down time of the CHP system
Flares are typically designed to operate when biogas pressure reaches a certain level forcing a
pressure control valve open. The biogas is then ignited to prevent the biogas from escaping to
the atmosphere.
Biogas production is primarily a function of the volume and type of organic materials inputted
into an anaerobic digester. The actual bio-chemical reaction to convert organic materials into
methane and carbon dioxide is well known. The basic process involves various facultative and
anaerobic microorganisms converting the feed organic materials to organic fatty acids and then
converting these fatty acids to methane and carbon dioxide. There are several variables
associated which effect the quantity of biogas generated from this biochemical process. These
can be broken down into:
• The quantity of volatile solids in a material added to the digester
• The conversion rate of these volatile solids to biogas
• The volume of biogas generated from the conversion of volatile solids
There have been numerous laboratory studies conducted on these various conversion rates and
generation rates. This study has attempted to capture actual biogas generation rates and
associated power outputs at an operating digestion facility. For the purposes of the study OSM
used several data assumptions to calculate theoretical biogas generation rates to compare to
actual generation rates. The following outlines those assumptions based on historic OSM
operational knowledge:
• Manure Volatile Solids Destruction (VSD) Rate = 40%
• Manure Biogas generation rate per lb. of VSD = 15 cubic feet (CF)

25
• Substrate VSD Rate = 90%
• Substrate Biogas generation rate per lb. of VSD = 20 cubic feet
Theoretical Gas Generation Analysis based on just the manure input would be as follows:
The average volatile manure solids input is equal to approximately 2,500 milligrams per liter
(mg/l) and the average HRT is 25 days. Using 25 days HRT gives an influent rate of 34,000
gallons per day per digester or 0.068 million gallons per day (MGD) total.
Using the following formula:
Lbs./Day = MGD * 8.34 (approximate liquid density)*mg/l gives the following results:
0.068 MGD * 8.34 * 2,500 (study average) = 1,418 lbs. per day of volatile solids
Using the assumptions above the formula would be:
1,418 lbs./day *0.40 (manure destruct rate) * 15 (cubic foot gas/lb. VSD) =
8,508 CFD (Cubic Feet of Gas per Day)
The utilization of biogas by a CHP varies with engine load, methane concentration, state of
tune, and other factors. The CHP industry will state various nameplate biogas utilization rates
per kilowatt of electrical power output. It has been OSM’s experience that an average gas
utilization rate per megawatt (MW) of electricity produced is approximately 300 standard cubic
feet per minute (scfm). Using this actual field performance data, the manure feed alone to the
digesters will generate approximately the following output:
8,508 CFD/1440 (minutes per day) = 5.9 scfm
Using 300 scfm per MW gives the following theoretical power output from the farms manure
only input to the digester.
5.9 scfm biogas * (1,000 kW/300 scfm) = 20 kW per hour.
Performing the same calculation on the incoming substrates using an average of 1,000 tons per
month gives the following numbers. For the purposes of this theoretical calculation 240 gallons
per ton was used for the substrate density. Specific gravity of the substrates was not evaluated
but based on historic analysis of grease trap type wastes by OSM suggests that it is close to that
of water.
Using 1,000 tons per month, a 30-day month, and 240 gallons per ton gives the following
The average total volatile solids (TVS) in the substrate reception tank was 2.6% or 26,000 mg/l.
Using 1,000 tons per month and a 30-day month gives 33.3 tons per day (TPD).
Based on the above assumptions the biogas generation rate is:
33.3 TPD * 2.6 % VS * 90% VSD * 2000 Lb./Ton * 20 CF per VSD = 32,000 CFD

26
Using 300 sfcm per 1,000 kW gives the following:
32,000 CFD/1,440 minutes per day * 1,000 kW/300 scfm = 75 kW per hour
This would give a combined total average electrical output of
A. Power from Manure = 20 kW
B. Power from Substrates = 75 kW
Total Average Power Projected: 95 kW per hour
As can be seen in the chart below the actual versus projected the theoretical output was
consistently less than the actual during the study as the digesters came to steady state. As the
gas volume increased the engine ran more efficiently and therefore used less gas per kW
produced. This can be seen in the monthly production report. The kW produced per cubic foot
of gas increased. During the study, methane concentrations varied between 50% and 70%.
Higher methane concentrations tracked higher gas production rates. The gas production rates
were proportional to increased substrate input into the digester. It is therefore reasonable to
assume that the increased substrates improved the methane concentration in the biogas.
Improved efficiency was also a function of the engine operating at a higher loading rate.
Table 10: Calculated Power Versus Actual Production
Calculated Power vs. Actual
Month Substrate kW
Manure kW
Projected Ave kWh
Actual Ave kWh
May 2013 43 38 81 80
June 2013 66 16 82 101
July 2013 78 16 94 136
August 2013 79 16 95 181
September 2013 57 31 88 133
October 2013 74 31 106 162
November 2013 101 36 137 284

27
CHAPTER 5: Sampling Method
5.1 Sampling
Samples were taken from several locations at the digester during this study. The purpose of the
samples were to profile the inputs and outputs of the digester system to determine energy
production potential as well as identification partitioning of the various components. Figure 5
below identifies the sample site locations relative to the system layout:
Manure influent to the digester inlet structure
o Grab samples were taken as the flush water flowed into the digester feed “pit”
shown at location point 1.
Effluent from the combined digester as well each individual digester
o Grab samples were taken from each digester tank when the drain valve was open
and discharging effluent. This is shown at location points 3 and 4.
Composites from the Substrate Storage tanks
o The mix pumps were started which circulated the substrate tanks and a grab sample
was taken from a sample line installed on the influent feed pump.This location
corresponds to point 18.
Manure solids from the Slope Screen
o Grab samples were taken from the separated solids from the slope screen. This
location is at point 8.
Manure solids from the on-site drying operations
o Grab samples were taken from several different piles of dried manure solids. This
location was in the field where the solids were dried.

28
Figure 5: Map of Facilty Layout and Sample Locations
29
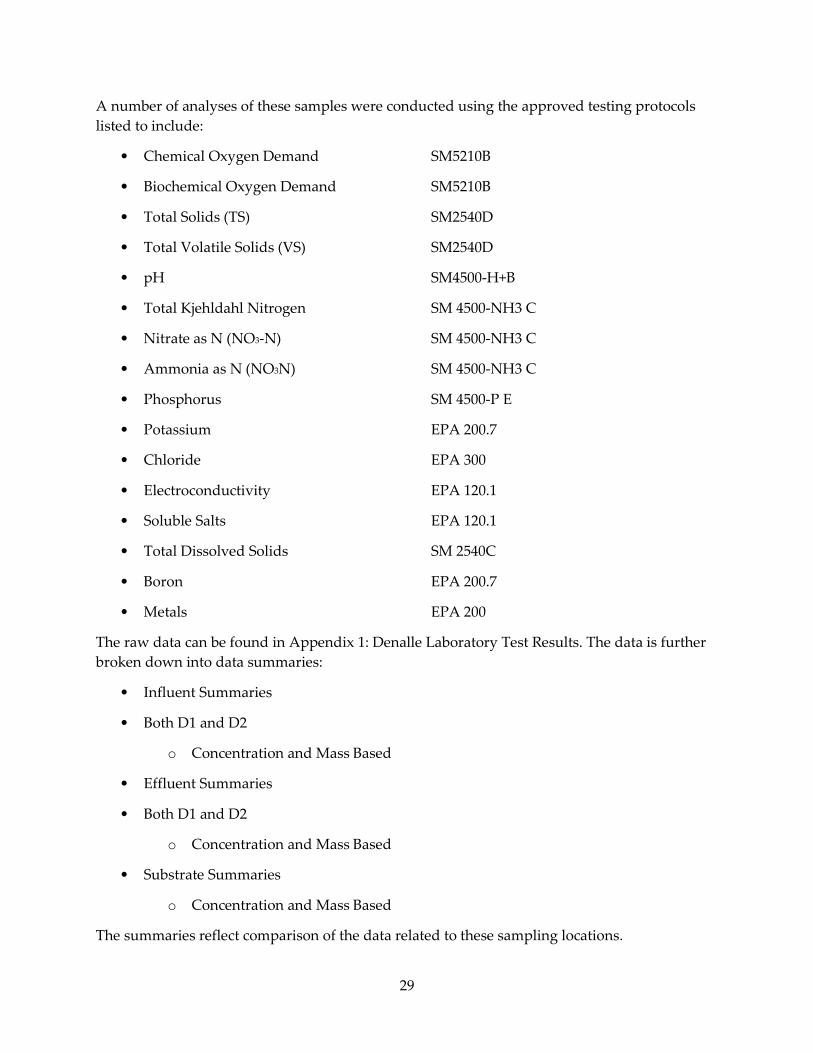
A number of analyses of these samples were conducted using the approved testing protocols
listed to include:
• Chemical Oxygen Demand SM5210B
• Biochemical Oxygen Demand SM5210B
• Total Solids (TS) SM2540D
• Total Volatile Solids (VS) SM2540D
• pH SM4500-H+B
• Total Kjehldahl Nitrogen SM 4500-NH3 C
• Nitrate as N (NO3-N) SM 4500-NH3 C
• Ammonia as N (NO3N) SM 4500-NH3 C
• Phosphorus SM 4500-P E
• Potassium EPA 200.7
• Chloride EPA 300
• Electroconductivity EPA 120.1
• Soluble Salts EPA 120.1
• Total Dissolved Solids SM 2540C
• Boron EPA 200.7
• Metals EPA 200
The raw data can be found in Appendix 1: Denalle Laboratory Test Results. The data is further
broken down into data summaries:
• Influent Summaries
• Both D1 and D2
o Concentration and Mass Based
• Effluent Summaries
• Both D1 and D2
o Concentration and Mass Based
• Substrate Summaries
o Concentration and Mass Based
The summaries reflect comparison of the data related to these sampling locations.

30
5.2 Influent/Effluent
The influent analysis is based on collection of grab samples pulled as the manure liquid flowed
into the new inlet structure outlined above. The influent results clearly indicate low input
volatile solids. The average volatile solid input was 2,577 mg/l and the average total solid level
was 4,710 mg/l. This reflects a TS/VS ratio of approximately 55%. This is about 15% lower than
typical manure from a scrap dairy and is due to the higher dilution associated with a flush
dairy. Typical VS numbers for a scrap dairy in the mid-west would be 40,000 mg/l range. The
low VS input rates are reflective of low gas production associated with manure only digestion.
Both chemical oxygen demand (COD) and the biological oxygen demand (BOD) are lower than
would be expected compared to a scrap dairy, again associated with the flush type dairy system
and the diluted input to the digester. The average COD was 6,665 mg/l and the BOD average
was 2,603 mg/l. This gives a COD to BOD ratio of approximately 40%, which is 5% lower than a
typical scrap dairy.
Electroconductivity averaged approximately 5 micromhos per centimeter (mmhos/cm) and
soluble salts averaged 3,256 mg/l.
The nitrogen, phosphorus and potassium (NPK) were low compared to scrap dairies located in
the Midwestern United States. The averages were as follows, N: 483 mg/l, P: 51 mg/l and K: 405
mg/l. Based on numbers generated from a number of mid-west dairies these numbers are as
follows, N: 2,700 mg/l, P: 340 mg/l and K: 1,700 mg/l. This reflects the low concentration of
manure in the digester feed solids.
Table 11 is a comparison of data between a mid-west scrap dairy and from this flush dairy:
Table 11: Comparison of Midwest Scrap Dairy Versus California Flush Dairy Influent Nutrient Waste Values
Influent Fiscalini Farms
Midwest Scrap Dairy
Total Solids (mg/l) 4,710.0 40,000.0
Total Volatile Solids (mg/l) 2,577.0 21,000.0
Total Kjehldahl Nitrogen (mg/l) 483.0 2,500.0
Total Phosphorus (mg/l) 51.0 320.0
Total Potassium (mg/l) 405.0 1,400.0
pH Units 6.8 8.4
Ammonia Nitrogen (mg/l) 101.0 1,700.0
Carbonaceous Oxygen Demand (mg/l) 6,665.0 63,200.0
Bio-Chemical Oxygen Demand (mg/l) 2,603.0 23,100.0
Magnesium (mg/l) 116.0 800.0
Calcium (mg/l) 276.0 1,600.0

31
The differences in the scrap vs. the flush type manure handling systems are very evident. The
flush system used by Fiscalini Farms removes many of the constituents from the manure prior
to digestion.
Similar results are seen when the effluent from the Fiscalini Farms anaerobic digester system are
compared to mid west dairy scrap anaerobic digester system:
Table 12: Comparison of Midwest Scrap Dairy Versus California Flush Dairy Effluent Nutrient Waste Values
Effluent Fiscalini Farms
Mid-West Scrap Dairy
Total Solids (mg/l) 4,591.0 30,000.0
Total Volatile Solids (mg/l) 1,874.0 19,000.0
Total Kjehldahl Nitrogen (mg/l) 655.0 2,500.0
Total Phosphorus (mg/l) 49.0 300.0
Total Potassium (mg/l) 450.0 1,400.0
pH Units 7.3 8.5
Ammonia Nitrogen (mg/l) 329.0 1,800.0
Carbonaceous Oxygen Demand (mg/l) 10,648.0 63,200.0
Bio-Chemical Oxygen Demand (mg/l) 1,632.0 23,100.0
Magnesium (mg/l) 79.0 780.0
Calcium (mg/l) 383.0 1,400.0
Again the dilute input shows in the dilute effluent from the facility.
A comparison of the influent and effluent numbers for the FF digester system based on the mass
of materials processed through the digester during the study period. This mass basis is based
on averages from the samples taken.
Table 13: Comparison on a Mass Basis Removal of Nutrient Loading
Mass Loading Influent lbs Effluent lbs
Removal %
Influent Vs. Effluent Fiscalini Farms
Fiscalini Farms
Total Solids 762,918.6 468,318.6 39%
Total Volatile Solids 550,026.2 191,111.1 65%
Total Kjehldahl Nitrogen 47,683.0 66,779.5 -40%
Total Phosphorus 4,396.1 4,967.9 -13%
Total Potassium 33,846.0 450.0 99%
Ammonia Nitrogen 13,684.2 33,578.0 -145%
Carbonaceous Oxygen Demand 1,277,569.1 894,627.7 30%
Biochemical Oxygen Demand 399,550.1 134,035.9 66%

32
As can be seen from the results the conversion of VS and BOD were very high. Nitrogen was
converted to ammonia in the digestion process that is preferred for land application as
ammonia is much more easily converted compared to other organic nitrogen sources by the
plants, therefore reducing the amount of organic nitrogen filtrated through the soil profile to
generate nitrate. Overall these results show an anaerobic digestion process that is functioning
well.
5.3 Summary of Total Dissolved Solids (TDS)
One of the concerns about adding off-site substrates to the digester system is the potential
increases in TDS levels in the effluent water. The average concentrations for inorganic ions that
were measured for the raw manure, substrate and anaerobic digester effluent are presented in
Table 13 above. Note that the total volume of substrate added accounted for approximately 17%
of the total flow sent to digestion of the period May through October. There was an increase in
TDS in D2 vs. D1 during the October test period. The overall loading to D2 was higher which
attributed to some of the TDS increase
The largest increases were observed for NH4-N. Note the NPK of the substrate was higher than
the raw manure. Having said that there would have been some increase in NH4-N from just the
manure as organic nitrogen is mineralized to ammonia/ammonium. The remainder of the
increase is likely due to some additional sodium and increased bicarbonate (HCO3) formed as
the ammonia gas (NH3) produced combines with carbon dioxide (CO2)in the biogas.
The exact increase in ammonium (NH4 ) that would have occurred during anaerobic digestion
of the manure itself is not known, approximately 40% of the organic nitrogen is generally
converted to ammonium in anaerobic digester systems. Additional increase in TDS is also due
to some additional bicarbonate produced in the anaerobic digestion process.
5.4 Heavy Metals
Some limited testing for heavy metals was conducted at the start of the project; once for the raw
manure, twice for the digestate and 4 times for the substrate streams. Accordingly, too much
cannot be read into the results but some useful information was obtained nonetheless.
A summary of heavy metal testing for the substrate, raw manure and anaerobic digester
digestate is presented in Table 13. Most metals were less than 0.005 mg/l in all samples. The
additional substrate had about 22.5 mg/l of iron based on several data points. The
concentrations of the other metals were quite low and not generally a concern for disposal.
Copper (copper sulfate is used as a bio-stat in the milking parlor) was observed in the manure
feed but not the substrate; the digestate had 0.53 mg/l. Cadmium was present in all three with
0.003 mg/l in the digestate. The only other metal observed was zinc, which was present at 1.57
mg/l in the digestate and 2.07 mg/l in the substrate feed. Overall it does not appear that heavy
metals were an issue.
Boron was measured on each stream on 5 to 6 dates. The concentrations averaged close to the
same for all three streams at between 0.5 and 0.6 mg/l

33
5.5 Air Emissions
During the study period the H2S level in the biogas was monitored daily using the onsite meter.
Additionally the exhaust NOx level was monitored daily. A summary of the results are
demonstrated in Table 14 below.
Table 14: Comparison of Average NOX ppm in CHP Exhaust Verses Average H2S ppm in the Biogas
Month Average Nox PPM
Average H2S PPM
May 6 165
June 5 213
July 7 285
August 6 212
September 8 192
October 7 264
November 8 228
There does not appear to be any correlation with the levels of substrates inputed into the
digester and the concentration of H2S in the biogas or NOx in the engine exhaust.

34
CHAPTER 6: Cost/Benefit Analysis
6.1 Financial Analysis
For the purpose of the study, OSM tracked the costs associated with the normal operation of the
Fiscalini Farm digester. There were a number of costs associated with repair and replacement
of components that were due to poor design. These costs although noted in the table, are not
considered “normal” operating costs.
Table 15: Costs Associated With Continued Operation of the System
Digester Nonstandard Costs
Component Repair/Replacement Cost
Influent Pump $5,382.00
D2 Mixer Repair $42,000.00
Digester Cleanout $60,000.00
Influent Structure Construction $12,000.00
Total $119,382.00
The financial analysis tracked the following cost categories:
6.1.1 Labor
The digester has a full time operator and a full time supervisor/operator. The fully burdened
cost for the labor was on average $6,100 per month during the study period. Based on
discussion with Fisacalini Farms ownership, this is consistent with previous expenses for the
site. Additionally, there is the cost of administrative activities associated with securing permits,
submitting various filings, securing financing, legal matters, etc. Based on discussions with the
ownership, these costs were fixed at $1,200 per month, bringing the total monthly labor cost to
$7,300.
6.1.2 Other Labor
Certain maintenance activities such as servicing the chillers, routine electrical trouble shooting
and repair required skills beyond the digester operators. Outside contractors were utilized for
this work. Based on the work conducted during the study period and based on discussions
with Fiscalini Farms ownership this cost was fixed at $1,000 per month.
6.1.3 Engine Capital Replacement Reserve
The engine generator system requires certain significant maintenance at defined intervals. The
pro forma outlines these costs based on typical costs of $ 15.75 per hour of engine operation. This
is a standard number in the industry for a biogas engine.

35
6.1.4 Engine Routine Service
This includes oil and filter changes as well as plug changes. The engine oil was changed at 500
hours and included oil filters. The volume of oil was 55 gallons per change. Plugs were
changed every 1,500 hours. Other were parts such as hoses, air filters, act were estimated to be
$250 per month. The monthly operational cost of the engine was $ 1,025 per month during the
study period. Discussion with Fiscalini Farms ownership confirmed that this was a reasonable
historic monthly cost.
6.1.5 Digester and Engine Room Parasitic Load
The digester and engine have a number of pumps, mixers, and electronic components that
consume electricity. The electrical consumption was metered via two separate Modesto
Irrigation District meters, located at the digester and the engine room. Modesto Irrigation
District billed Fiscalini Farms for the electrical consumption for these two locations and those
costs are captured under the parasitic load line item and averaged $9,600 per month.
6.1.6 Engine Room Phone Bill/Internet Connection
Modesto Irrigation District requires Fiscalini Farms to have a designated phone line to allow
them to monitor and control the electrical interconnect switch, and has the ability to remove the
load from the generator set to their distribution system in the event of an emergency. This is a
fixed cost of $200 per month. Additionally the digester has an Internet connection at a cost of
$58 per month.
6.1.7 Miscellaneous Costs
There are a number of normal wear items that require replacement. This includes:
• Belts
• Hoses
• Dust Filters
• Pump Seals
• Gaskets
• Lubricants
• Housekeeping supplies
• Miscellaneous
Based on actual costs during the study period and in discussions with ownership this cost was
fixed at $300 per month.
Historically, in an attempt to increase gas production, silage normally used as animal feed was
put into the digester system. Although this did have a positive effect on gas production it was
not sustainable due to the high cost of the silage and the volitity of the feed commodity pricing.

36
6.2 Debt Service
The capital expenditure for this site was determined to be $4.0 million and the debt service plus
principle payment are based on a 20-year loan at 5.8% interest. This produces a monthly debt
service payment of $ 28,198.
6.3 Revenue
As was outlined above there are 2 revenue streams associated with the Fiscalini Farms
anaerobic digester system. These are:
6.3.1 Electrical Revenue
Electrical Revenues are associated with the sale of electricity from the anaerobic digester system
to the Modesto Irrigation District who monitors the amount of electricity generated from the
system and sends a monthly check to Fiscalini Farms for electrical power generated. The
current rate is $0.109 per kWh. The monthly revenues are entered into the pro forma.
6.3.2 Tip Frees Revenue
Tip Fees are associated with the processing of outside substrates brought into Fiscalini Farm’s
anaerobic digestersystem. The tip fees associated with off-site substrates is entered into the pro
forma.
Presented in Appendix B- Profit and Loss Table is the combined profit and loss statement for
the study period showing revenue and expense. It also shows the average for the selected study
period of May through November 2013. Addiotionally, the table shows the average
profitability of the digester during the selected study period.
It is interesting to note that the profitability of the site improved over the time of the study. This
improvement was substantially related to the increase in use of off-site substrate. The
processing of the off-site substrate generated more gas and therefore more electrical and “tip”
fee revenue. As can be seen from the financials, the digester system operated at a loss during
the study period. Discussions with ownership indicate that this has been the case for the
majority of the time the digester system has been in operations.
Also note in the profit and loss statement under the column “Full Operation” is a projected
financial return based on running the engine at full load for 90% of the year. To allow the
engine to run full load would require approximately 2,000 tons per month of total substrate.
The corresponding tip fees are entered into the financial model. This column indicates that a
profitable scenario can be achieved with additional off-site substrate utilization.
The column labeled “Manure Only” shows the profitability if the digester is run on only
manure waste from the dairy farming activities. As can be seen from the numbers it would not
be financially viable to operate the digester on manure only.

37
CHAPTER 7: Conclusions
The Fiscalini Farms anaerobic digester system located in Modesto, California, functions as
designed. Manure generated from the dairy operations is inputed to the digestion system
where it is converted to biogas that is combusted in a reciprocating engine coupled to an electric
generator. The coversion rates of the manure are consistent with most properly operating dairy
digesters (approximatley 40% Volitile solids distructed). The site has a reasonable power
purchase agreement with the Modesto Irrigation District, their local electric utility.
The vast majority of the dairy operations in California utilize “flush” manure handling systems.
This system due to the climate in California is very effective in removing the manure solids on a
frequent basis from concentrated animial feeding operations . Water recycling is very effective
in minimizing the overall water use for the flush systems. Most of these flush systems also rely
on utilization of the dried manure solids for animal bedding. Again the climate in California
allows this practice to be very successful.
However, the utilization of flush systems has a significant impact on the potential profitability
of an anaerobic digestersystem installed on flush dairy facilities. The recycling of the flush
water does aerobically degrade some portion of the manure prior to digestion limiting the
digestable volitile soilds input to the digester. As was seen with the Fiscalini Farms anaerobic
digestersystem during this study, low input volitile solids from the manure operations results
in low gas production and corrospondingly low electrical generation production rates.
The low electrical production from the anaerobic digester systems like the one installed at
Fiscalini Farms significanly hinders the finanical viability of these types systems when operated
on manure alone. However, they can and do capture methane and do reduce the overall
loading of constituentes for land application. Anaerobic digestionD is also very effective in
converting organic nitrogen into ammonia which increases the crop uptake of nitrogen.
Organic nitrogen has a larger propensity to migrate further down into the soil media, which
could increase the nitrates.
As identified through this study the use of off-site organic substrates significantly improves the
finanical viability of anaerobic digester operations. Substrates processed through the Fiscalini
Farms system accounted for large increases in both gas volumes and electrical generation
production rates. The increased revenues both from electrical generation and “tip” fees will
provide a postitive cash flow for Fiscalini Farms. Furthermore, overall additional constituente
loading of the off-site substrates had little impact on the effluent mass loading from the
digester.
The TDS and electroconductivity tracked consistently with the volume of substrates added to
the digester. It did not appear that the mass loading on the land application would be impacted
by the use of substrates. Levels of nitrogen and phosphorus were realativily low in the
substrates. Additional substrate sourcing could further limit the TDS and electroconductivity in

38
the substrates. Substrate additions had no effect on the hydrogen sulfide levels or the nitrogen
oxide levels in the exhaust from the engine.
The Fiscalini Farms digester will require additional off-site substrates to meet a break even
point. Based on market studies of the surronding area, the volume required is availible.
Therefore, it is recommended that an additional volume of approximatley 1,500-2,000 tons per
month of off-site substrates be sourced into the digeseter system. This will produce the
necessary revenues for continued operations of the digester system in a financially sound
method. Proper selection of the substrate types will minimize any impact to the effluent
constituent loading to a minimum.
Future steps to increase the likelihood of economic, environmental and regulatory success
should include the following:
1. Develop a Procedure to select and manage off-site substrates as co-digestate in
agricultural anaerobic digesters, to include:
a. Analytical characteristics
b. Sampling frequency
c. Based around the operations nutrient management plans
2. Develop “Best Practices” for off-site co-digestate to include:
a. Storage
b. Record keeping
c. Reporting
3. Develop a regulatory system to promote the use of off-site substrates as co-digestate,
outlining requirement in:
a. Specific permit standards for influent and effluent
b. Reporting
4. Develop data base of regionally based off-site substrates, include the following data per
each substraght:
a. Energy value
b. Analytical characteristics
c. Regulatory compliance for effluent concerns
d. Mass balance calculations

39
5. Develop a data sharing system for digester operations to identify a specific substraight
characteristics to determine potential use at the site. Sharing could be thru:
a. Web-Site
b. Meetings
c. Co-ops

40
GLOSSARY
Term Definition
ADPG Anaerobic digester power generation
AID Agricultural industry digester
BOD Biological oxygen demand
Btu British thermal unit
CDEP Connecticut Department of Environmental Protection
CF Cubic feet
CFD Cubic feet per day
CHP Combined heat and power
CO Carbon monoxide
CO2 Carbon dioxide
COD Carbonaceous oxygen demand
CSTR
EPA United States Environmental Protection Agency
°F Degrees Fahrenheit
FOG Fats, oils, and grease
GWh Gigawatt-hour
H2S Hydrogen sulfide gas
HRT Hydraulic retention time
kWh Kilowatt-hour
lb Pounds of mass
MDEP Massachusetts Department of Environmental Protection
MGD Million gallons per day
mg/l Milligrams per liter
mm Millimeter
mmhos/cm Millimhos per centimeter

41
MSA Metropolitan Statistical Area
MW Megawatt
NAICS North American Industries Classification System
NH3 Ammonia
NH4 Ammonium
NOx Oxides of nitrogen
NPK Nitrogen, phosphorous, potassium
NREL National Renewable Energy Laboratory
OSM Organic Solutions Management company
PPA
ppm Parts per million (by volume)
RAS Return-activated sludge
RD&D Research, development, and demonstration
SCADA Supervisory data acquistition and control
scfm Standard cubic feet per minute
SCR Selective catalytic reduction
SRT Sludge retention time
TDS Total dissolved solids
TPD Tons per day
tpy Tons per year
TS Total solids
TVS Total volatile solids
USDA United States Department of Food and Agriculture
VS Volatile solids
VSD Volatile solids destruction

42
REFERENCES
(Marz, 2005). Basisdaten Biogas Deuthchland. Fachagentur Nachwachsende Rohstoffe e.V.
Buzby, J. C., Wells, H. F., Axtman, B., & Mickey, J. (2009, March). Supermarket Loss Estimates
for Fresh Fruit, Vegetables, Meat, Poultry, and Seafood and Their Use in the ERS Loss-
Adjusted Food Availability Data. Retrieved from United States Department of
Agriculture, Economic Research Services: http://www.ers.usda.gov/publications/eib-
economic-information-bulletin/eib44.aspx
CDM. (2010, April 2). Chicago Department of Envronment Waste Characterization Study.
Retrieved from City of Chicago Department of Envronment :
http://www.cityofchicago.org/dam/city/depts/doe/general/RecyclingAndWasteMgmt_P
DFs/WasteAndDiversionStudy/WasteCharacterizationReport.pdf
Challenge, U. E. (2013, December 26). Sustainable Materials Management Food Recovery
Challenge. Retrieved from US EPA Wastes- Resource Conservation:
http://www.epa.gov/foodrecoverychallenge/
Cullar, A., & Weber, M. (July, 2010, January 7, 2013). Wasted Food, Wasted EWnergy: The
Embedded Energy in Food Waste in the United States. Retrieved from University of
Texas: http://pubs.acs.org/doi/pdf/10.1021/es100310d
Darper/Lennon, I. (2002, September 10). Identification, Characterization, and Mapping of Food
Waste and Food Waste Generators In Massachusetts. Retrieved from Massachusetts
Department of Envrionmental Protection, Bureau of Waste Prevention:
http://www.mass.gov/eea/docs/dep/recycle/priorities/foodwast.pdf
DEEP, C. (2012, Spring). Identifying, Quantifying, and Mapping Food Residuals from
Connecticut Businesses and Institutions. Retrieved from State of Connecticut,
Department of Energy and Environmental Protection:
http://www.ct.gov/deep/cwp/view.asp?a=2718&q=325382&depNav_GID=1645
Group, C. C. (2009, August). California 2008 Statewide Waste Characterization Study. Retrieved
from CalRecyle, Solid Waste Characterization Waste Characterization Studies:
http://calrecycle.ca.gov/WasteChar/PubExtracts/2009023/Tables.pdf
Gunders, D. (2012, August). Wasted: How America is Losing Up to 40 Percent of its Food from
Farm to Fork in Landfills. Retrieved from Natural Resources Defense Council, Issue
Paper: 12-06-B: http://www.nrdc.org/food/files/wasted-food-IP.pdf
Karen Dapper, R. M., Owino, D., & Tang, L. (2008). California Dairy Statistics Annual.
Sacramento: California Department of Agriculture.

43
Leven, R. (2012, August). North Carolina 2012 Food Waste Generation Study. Retrieved from
N.C. Department of Environment and Natural Resources, Division of Envrionmental
Assistance and Outreach:
http://portal.ncdenr.org/c/document_library/get_file?uuid=ae965d91-c5a1-47aa-8f09-
9afbbfa6598f&groupId=38322
Stringfellow, W., Camarillo, M. K., Hanlon, J., Jue, M., & Spier, C. (2011). Fisclaini Farms
Biomass Energy Project. Stockton: University of the Pacific.
Timothy W. Jones, P. (2002). Using Contemporary Archaeology and Applied Anthrougpology
to understand Food Loss in the American Food System. Retrieved from University of
Arizona, Bureau of Applied Research in Anthropology:
http://www.ce.cmu.edu/~gdrg/readings/2006/12/19/Jones_UsingContemporaryArchaeol
ogyAndAppliedAnthropologyToUnderstandFoodLossInAmericanFoodSystem.pdf

A-1
APPENDIX A: Profit and Loss Table

A-2
Profit and Loss Statement for Study Period
Fiscalini Farms, L.P.
May 2013
June 2013
July 2013
Aug 2013
Septr 2013
Oct 2013
Nov 2013
Dec 2013
Income $15,442 $23,497 $30,389 $33,495 $24,573 $31,107 $46,584 $55,228
Electrical Revenue $11,115 $8,061 $11,174 $14,608 $10,635 $12,575 $23,107 $26,312
Tip Fees $4,328 $15,437 $19,215 $18,887 $13,938 $18,532 $23,477 $28,916
Expenses $24,702 $26,434 $27,269 $30,136 $28,466 $29,789 $30,325 $31,687
Labor $7,300 $7,300 $7,300 $7,300 $7,300 $7,300 $7,300 $7,300
Other Labor $1,000 $1,000 $1,000 $1,000 $1,000 $1,000 $1,000 $1,000
Digester Parasitic Load $9,600 $9,600 $9,600 $9,600 $9,600 $9,600 $9,600 $9,600 Digester Phone Bill/Internet $258 $258 $258 $258 $258 $258 $258 $258
Engine Maintenance $1,425 $1,425 $1,425 $1,425 $1,425 $1,425 $1,425 $1,425
Engine Capital Reserve $5,119 $6,851 $7,686 $10,553 $8,883 $10,206 $10,742 $12,104
Gross Income -$9,259 -$2,937 $3,120 $3,359 -$3,893 $1,318 $16,259 $23,541
Debt Service $28,198 $28,198 $28,198 $28,198 $28,198 $28,198 $28,198 $28,198
Net Income -$37,457 -$31,135 -$25,078 -$24,839 -$32,091 -$26,880 -$11,939 -$4,657

A-3
Jan 2014 Feb 2014 March 2014 Apri 2014 Study Average Full
Operation Manure Only
$60,632.72 $61,120.61 $ 71,582.21 $64,413.08 $ 43,172.01 $ 98,000.00 $ 1,289.00
$23,073.34 $30,984.95 $ 36,174.31 $28,145.33 $ 19,663.70 $ 53,000.00 $ 1,289.00
$37,559.38 $30,135.66 $ 35,407.90 $36,267.75 $ 23,508.31 $ 45,000.00 $ -
$30,196.74 $33,836.08 $ 36,223.18 $32,529.85 $ 30,132.70 $ 30,523.00 $ 53,016.02
$ 7,300.00 $ 7,300.00 $ 7,300.00 $ 7,300.00 $ 7,300.00 $ 7,300.00 $ 12,514.29
$ 1,000.00 $ 1,000.00 $ 1,000.00 $ 1,000.00 $ 1,000.00 $ 1,000.00 $ 1,714.29
$ 9,600.00 $ 9,600.00 $ 9,600.00 $ 9,600.00 $ 9,600.00 $ 9,600.00 $ 16,457.14
$ 258.00 $ 258.00 $ 258.00 $ 258.00 $ 258.00 $ 258.00 $ 442.29
$ 1,425.00 $ 1,425.00 $ 1,425.00 $ 1,425.00 $ 1,425.00 $ 1,025.00 $ 2,385.71
$10,613.74 $14,253.08 $ 16,640.18 $12,946.85 $ 10,549.70 $ 11,340.00 $ 10,741.00
$30,435.98 $27,284.53 $ 35,359.03 $31,883.23 $ 13,039.30 $ 67,477.00 $ (51,727.02)
$28,198.00 $28,198.00 $ 28,198.00 $28,198.00 $ 28,198.00 $ 28,198.00 $ 28,198.00
$ 2,237.98 $ (913.47) $ 7,161.03 $ 3,685.23 $ (15,158.70) $ 39,279.00 $ (79,925.02)