Daily Management System of the Henry Ford Production … · Daily Management System of the Henry...
15
122 Am J Clin Pathol 2015;144:122-136 DOI: 10.1309/AJCPLQYMOFWU31CK © American Society for Clinical Pathology AJCP / Original Article CME/SAM Daily Management System of the Henry Ford Production System QTIPS to Focus Continuous Improvements at the Level of the Work Richard J. Zarbo, MD, DMD, Ruan C. Varney, CT, Jacqueline R. Copeland, MT, Rita D’Angelo, MS, and Gaurav Sharma, MD From the Department of Pathology and Laboratory Medicine, Henry Ford Hospital, Detroit, MI. Key Words: Daily management; Lean management; Quality improvement; Henry Ford Production System; Toyota Production System Am J Clin Pathol July 2015;144:122-136 DOI: 10.1309/AJCPLQYMOFWU31CK ABSTRACT Objectives: To support our Lean culture of continuous improvement, we implemented a daily management system designed so critical metrics of operational success were the focus of local teams to drive improvements. Methods: We innovated a standardized visual daily management board composed of metric categories of Quality, Time, Inventory, Productivity, and Safety (QTIPS); frequency trending; root cause analysis; corrective/ preventive actions; and resulting process improvements. Results: In 1 year (June 2013 to July 2014), eight laboratory sections at Henry Ford Hospital employed 64 unique daily metrics. Most assessed long-term (>6 months), monitored process stability, while short-term metrics (1-6 months) were retired after successful targeted problem resolution. Daily monitoring resulted in 42 process improvements. Conclusions: Daily management is the key business accountability subsystem that enabled our culture of continuous improvement to function more efficiently at the managerial level in a visible manner by reviewing and acting based on data and root cause analysis. “The business of management is to manage. The thing to be managed is work.” —Henry Ford (1926) 1 Our understanding of the core drivers of success in the transformation to a culture of continuous improvement has matured since 2005 through our adaptation of Lean management to the integrated laboratory product line of the Henry Ford Health System. 2-4 This Henry Ford Pro- duction System has evolved as our business system that continually produces more than 1,000 process improve- ments annually by an engaged, problem-solving labora- tory workforce in four (formerly six) acute care hospitals and 26 medical centers in southeast Michigan. 5 This Lean cultural discipline, predicated on Deming management principles, was the foundation on which these standard- ized laboratories achieved International Organization for Upon completion of this activity you will be able to: • define the system of daily management (DM) implemented at Henry Ford Hospital laboratories as it applies to monitoring and improving the operations of a clinical laboratory. • deploy the system of DM to various work cells in the clinical laboratory. • determine if existing quality indicators provide timely, objective, and actionable information. The ASCP is accredited by the Accreditation Council for Continuing Medical Education to provide continuing medical education for physicians. The ASCP designates this journal-based CME activity for a maximum of 1 AMA PRA Category 1 Credit ™ per article. Physicians should claim only the credit commensurate with the extent of their participation in the activ- ity. This activity qualifies as an American Board of Pathology Maintenance of Certification Part II Self-Assessment Module. The authors of this article and the planning committee members and staff have no relevant financial relationships with commercial interests to disclose. Exam is located at www.ascp.org/ajcpcme.
Transcript of Daily Management System of the Henry Ford Production … · Daily Management System of the Henry...
122 Am J Clin Pathol 2015;144:122-136 DOI: 10.1309/AJCPLQYMOFWU31CK
© American Society for Clinical Pathology
AJCP / Original Article
CME/SA
M
Daily Management System of the Henry Ford Production System
QTIPS to Focus Continuous Improvements at the Level of the Work
Richard J. Zarbo, MD, DMD, Ruan C. Varney, CT, Jacqueline R. Copeland, MT, Rita D’Angelo, MS, and Gaurav Sharma, MD
From the Department of Pathology and Laboratory Medicine, Henry Ford Hospital, Detroit, MI.
Key Words: Daily management; Lean management; Quality improvement; Henry Ford Production System; Toyota Production System
Am J Clin Pathol July 2015;144:122-136
DOI: 10.1309/AJCPLQYMOFWU31CK
ABSTRACT
Objectives: To support our Lean culture of continuous improvement, we implemented a daily management system designed so critical metrics of operational success were the focus of local teams to drive improvements.
Methods: We innovated a standardized visual daily management board composed of metric categories of Quality, Time, Inventory, Productivity, and Safety (QTIPS); frequency trending; root cause analysis; corrective/preventive actions; and resulting process improvements.
Results: In 1 year (June 2013 to July 2014), eight laboratory sections at Henry Ford Hospital employed 64 unique daily metrics. Most assessed long-term (>6 months), monitored process stability, while short-term metrics (1-6 months) were retired after successful targeted problem resolution. Daily monitoring resulted in 42 process improvements.
Conclusions: Daily management is the key business accountability subsystem that enabled our culture of continuous improvement to function more efficiently at the managerial level in a visible manner by reviewing and acting based on data and root cause analysis.
“The business of management is to manage. The thing to be managed is work.”
—Henry Ford (1926)1
Our understanding of the core drivers of success in the transformation to a culture of continuous improvement has matured since 2005 through our adaptation of Lean management to the integrated laboratory product line of the Henry Ford Health System.2-4 This Henry Ford Pro-duction System has evolved as our business system that continually produces more than 1,000 process improve-ments annually by an engaged, problem-solving labora-tory workforce in four (formerly six) acute care hospitals and 26 medical centers in southeast Michigan.5 This Lean cultural discipline, predicated on Deming management principles, was the foundation on which these standard-ized laboratories achieved International Organization for
Upon completion of this activity you will be able to:•define the system of daily management (DM) implemented at Henry
Ford Hospital laboratories as it applies to monitoring and improving the operations of a clinical laboratory.
•deploy the system of DM to various work cells in the clinical laboratory.
•determine if existing quality indicators provide timely, objective, and actionable information.
The ASCP is accredited by the Accreditation Council for Continuing Medical Education to provide continuing medical education for physicians. The ASCP designates this journal-based CME activity for a maximum of 1 AMA PRA Category 1 Credit ™ per article. Physicians should claim only the credit commensurate with the extent of their participation in the activ-ity. This activity qualifies as an American Board of Pathology Maintenance of Certification Part II Self-Assessment Module.
The authors of this article and the planning committee members and staff have no relevant financial relationships with commercial interests to disclose.
Exam is located at www.ascp.org/ajcpcme.
AJCP / Original Article
Am J Clin Pathol 2015;144:122-136 123 DOI: 10.1309/AJCPLQYMOFWU31CK
© American Society for Clinical Pathology
Standardization (ISO) 15189 accreditation in 2013 as the largest ISO-accredited integrated laboratory system in the United States.6
Numerous work and management systems have been created to sustain our Lean culture, whose credo is “relent-lessly pursuing perfection.” These include subsystems for policy deployment, system-wide education and competency, plan-do-check-act (PDCA)–based continuous improvement, nonconformance (deviation) detection, classification and management, controlled electronic document taxonomy and management, functional horizontal management, service-line management review, and daily management (DM).
In any organization, progress toward goal achievement can come from above through major executive-directed change initiatives and technologic innovations, but progress toward daily goal achievement must come from below by managers and teams who are empowered and accountable to improve their work product or service. Just how this is accomplished at the level of the work and aligned with the organization’s goals in a Lean culture is the subject of this article.
The managerial discipline of DM has become a major subsystem supporting our business effectiveness by promot-ing visual workflow management, local accountability, and daily problem solving within work units. DM now provides structure for all local area leaders to facilitate numerous, small team-based continuous improvements through daily tactical monitoring of a balanced set of critical metrics focused on internal and external customers. In effect, DM defines leader standard work and changes the paradigm for managing. DM is not a mere checklist for managers but rather the business system by which managers connect the local processes under their control to the higher level busi-ness strategic objectives.
In DM, both successful process execution and failures are made visible so that the entire workforce can par-ticipate in managing with leaders through process tracking and addressing small-scale problems through the PDCA improvement process to focus on daily outcomes at their local level. The visual nature and quantitative exposure of nonconformances through DM allow the local team to cat-egorize, prioritize, and test corrections with local resources based on root cause analysis and metrics of success.
We have learned this approach from the business systems of Toyota and Danaher Corporations and custom-ized our daily managed metrics under the acronym QTIPS: Quality, Time, Inventory, Productivity, and Safety. In this article, we present our standardized approach to DM and share examples of successful local problem solving within and across laboratory units at the level of the work and extending beyond the laboratory’s walls to clinical suppliers and customers.
Materials and Methods
SettingThe Department of Pathology and Laboratory Medicine
(PALM) is an integrated product line providing all medical laboratory diagnostic services to more than 2,000 physicians across the Henry Ford Health System’s five hospitals (four acute care, one psychiatric), 26 medical centers, and numer-ous affiliated private practices. The main core laboratories are located at Henry Ford Hospital, an 802-bed tertiary care hospital and academic and research complex located in mid-town Detroit that serves as the flagship of an integrated health system. PALM is staffed by 39 senior staff pathologists and clinical scientists and more than 700 technical and nontechni-cal staff. The employees of the PALM product line are trained in and pursue the continuous improvement ideals of the Henry Ford Production System, our successful Lean culture founded in 2006 and based on an adaptation of the Toyota Production System.2,7 PALM is the largest integrated medical laboratory product line in the United States that has been accredited since 2013 to the international ISO 15189 standard for quality and competence. In January 2013, PALM leadership concluded that our product line had acquired sufficient cultural stability in our Lean enterprise through training and experience with PDCA problem solving that we could enhance our manage-ment system and support engaged managers and employees in continuous improvement by adding DM as an integrated management subsystem.
Initial TrainingIn April 2013, the entire medical laboratory leadership
(pathologists with directorial responsibilities, managers, and supervisors) was trained by external consultants in didactic and workshop-based learning sessions over 2 days. The first day of training focused on essentials of devising an effective DM-based management system (incorporating Lean concepts, choosing and implementing customer-centric metrics, and devising a standard work for the gemba— the place where work value is created). The second day of training focused on implementing the DM subsystem (creating DM boards in each division/section, populating them with actionable information important in each gemba). The leadership of each main core laboratory was tasked with initially selecting at least two customer-centric metrics that fulfilled certain criteria ❚Table 1❚ that could be a part of DM. Each laboratory selected metrics that were unique to its own expertise and aligned to customer expectations or monitoring of vital processes.
Initial DesignDuring the training workshop, the laboratory leadership
arrived at a consensus that the PALM product line would
Zarbo et al / Daily Management System of the Henry Ford Production System
124 Am J Clin Pathol 2015;144:122-136 DOI: 10.1309/AJCPLQYMOFWU31CK
© American Society for Clinical Pathology
work to achieve a visual and paper-based DM system that would be posted in individual workstations or laboratories. It was felt that posting of DM measures at corresponding workstations would make current work-related information available to employees rather than being hidden on a shared drive and would drive accountability and ownership of local processes.
Furthermore, it was consented that each workstation or laboratory would define the customer-centric metric and individuals (usually the supervisors or senior technologists) delegated with the responsibility of gathering and posting this information on a daily basis.
Each metric had a certain performance threshold that had to be met within a 24-hour period. If this performance metric was met, it would be considered a “success” and, if not, it would be considered a “failure” and therefore open to closer scrutiny. This information was to be reviewed at a fixed time each day as part of a daily gemba walk that included the medical and technical leadership. The time, location, and number of metrics to be assessed daily were left at the discretion of local laboratory leadership and were subject to factors such as time of the day when infor-mation regarding metrics became available within individual laboratories.
Final Design of DM Display BoardsThe week immediately after initial training, the leader-
ship realized that while laboratories had selected appropriate metrics for DM, there was inconsistency in how this infor-mation was collated and displayed on the boards. A uniform approach to selection of this information and metrics was needed, and we therefore embarked on a standardization exercise.
DM Categories
Performance Domains—ColumnsThe performance domains to be covered by our daily
metrics were standardized across the PALM product line to column headers of Quality (Q), Time (T), Inventory
(I), Productivity (P), and Safety (S). This was abbrevi-ated to QTIPS for easy recall. For clarification, the Time category may include aspects of delivery and service, the Inventory category may include work in process and instrument downtime, and the Productivity category may capture elements related to cost. We concluded that our entire spectrum of quality and performance metrics could be accommodated by each of these domains. Each labora-tory was then tasked with incorporating at least two of these domains into their local DM board, but there was no restriction on pursuing a higher number of metrics or completion of measures to spell out QTIPS. Managers and work groups were given complete autonomy to select meaningful measures of inconsistent performance, in any combination, that would support the team in identifying and resolving workplace problems.
DM Method and Elements
Board Layout for Problem Solving—RowsThe layout for each measure was standardized into five
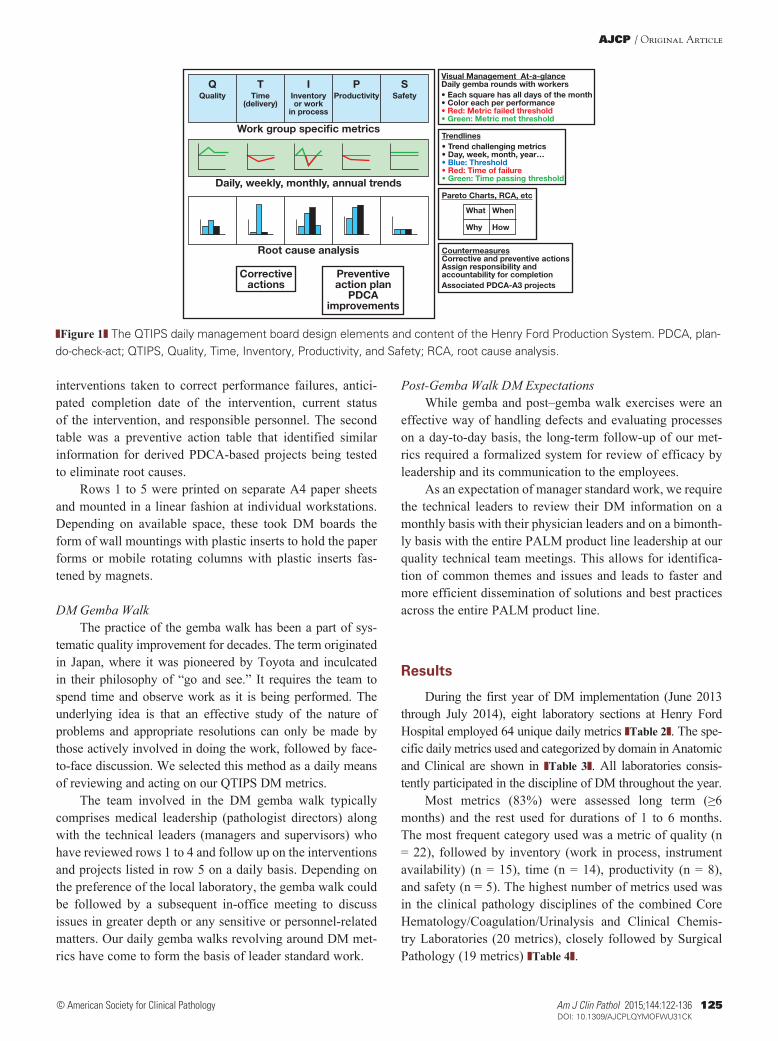
rows that promoted visual data display for ready assessment, trending, root cause analysis, and corrective and preventive actions, as illustrated in ❚Figure 1❚.
Row 1 was the display of a calendar month superim-posed on one of the QTIPS letters with a circle for each day to be marked as a green day (ie, passed performance) or red day (ie, failed performance) based on the previous 24-hour performance. No yellow would be used. If the laboratory did not operate on a specific day, the circle was colored black. This sheet was unmarked at the beginning of the month and was progressively filled out over the month with daily per-formance (red, green, or black). In addition, the row 1 sheet also listed information defining the metric and the standard, the owner of that metric, and the time of gemba review.
Row 2 was the actual the performance of the metric during the previous 24-hour period. This was commonly either a laboratory information system–generated report or a manually plotted form that provided information reflecting the performance deviation from standard.
Row 3 was a graph of the measure’s performance trended over an extended period of time (weeks to the cal-endar year). This trend was based on information captured from row 1.
Row 4 was composed of two Pareto charts. The left side was for a generic first-pass Pareto analysis (when and what) capturing the nature/root cause for all failure days. The right side was a focused Pareto analysis (where and how) reflect-ing a deeper dive characterization of a specific root cause on the left side that was being actively pursued.
Row 5 was divided into two tables. The first table was a corrective action table that captured the details of immediate
❚Table 1❚Criteria for Laboratory-Specific Metrics for Daily ManagementCriteria
1. The metric should be customer focused—in a hospital setting, this would imply patient care focused and a reflection of a laboratory’s value.
2. The metric should be easy and not time-consuming to gather and collate.
3. The metric should reflect the process (in)stability in the past 24 hours.
4. The metric should be amenable to objective measurement and not susceptible to personal bias or subjectivity.
AJCP / Original Article
Am J Clin Pathol 2015;144:122-136 125 DOI: 10.1309/AJCPLQYMOFWU31CK
© American Society for Clinical Pathology
interventions taken to correct performance failures, antici-pated completion date of the intervention, current status of the intervention, and responsible personnel. The second table was a preventive action table that identified similar information for derived PDCA-based projects being tested to eliminate root causes.
Rows 1 to 5 were printed on separate A4 paper sheets and mounted in a linear fashion at individual workstations. Depending on available space, these took DM boards the form of wall mountings with plastic inserts to hold the paper forms or mobile rotating columns with plastic inserts fas-tened by magnets.
DM Gemba WalkThe practice of the gemba walk has been a part of sys-
tematic quality improvement for decades. The term originated in Japan, where it was pioneered by Toyota and inculcated in their philosophy of “go and see.” It requires the team to spend time and observe work as it is being performed. The underlying idea is that an effective study of the nature of problems and appropriate resolutions can only be made by those actively involved in doing the work, followed by face-to-face discussion. We selected this method as a daily means of reviewing and acting on our QTIPS DM metrics.
The team involved in the DM gemba walk typically comprises medical leadership (pathologist directors) along with the technical leaders (managers and supervisors) who have reviewed rows 1 to 4 and follow up on the interventions and projects listed in row 5 on a daily basis. Depending on the preference of the local laboratory, the gemba walk could be followed by a subsequent in-office meeting to discuss issues in greater depth or any sensitive or personnel-related matters. Our daily gemba walks revolving around DM met-rics have come to form the basis of leader standard work.
Post-Gemba Walk DM ExpectationsWhile gemba and post–gemba walk exercises were an
effective way of handling defects and evaluating processes on a day-to-day basis, the long-term follow-up of our met-rics required a formalized system for review of efficacy by leadership and its communication to the employees.
As an expectation of manager standard work, we require the technical leaders to review their DM information on a monthly basis with their physician leaders and on a bimonth-ly basis with the entire PALM product line leadership at our quality technical team meetings. This allows for identifica-tion of common themes and issues and leads to faster and more efficient dissemination of solutions and best practices across the entire PALM product line.
Results
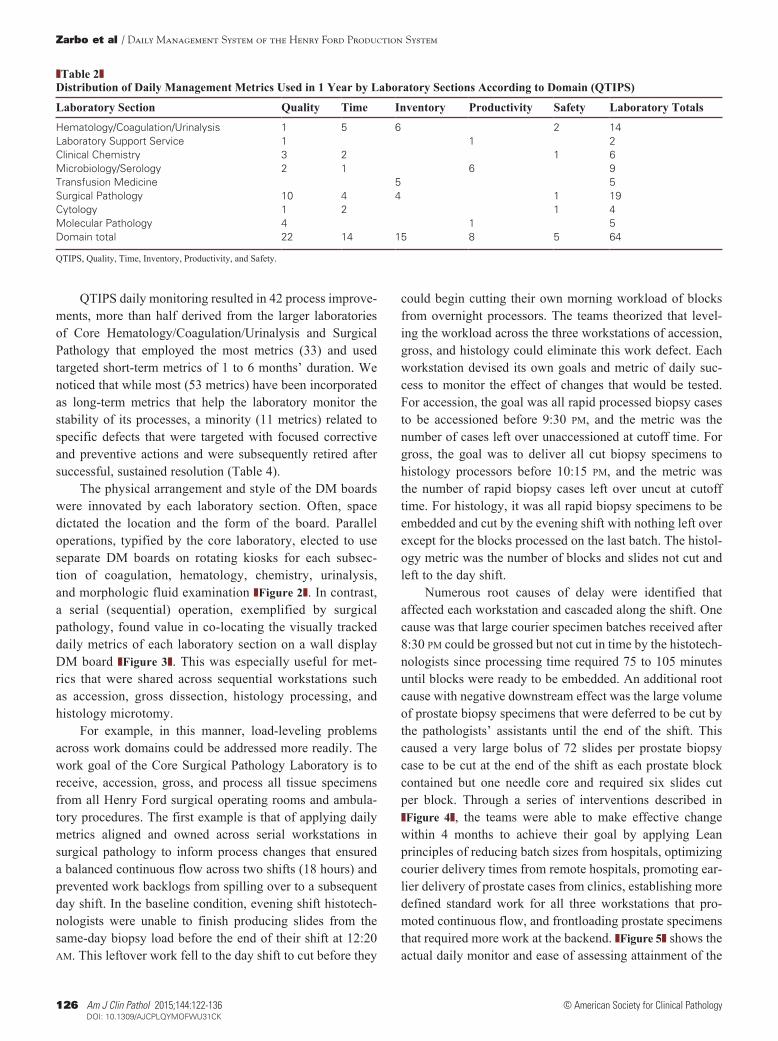
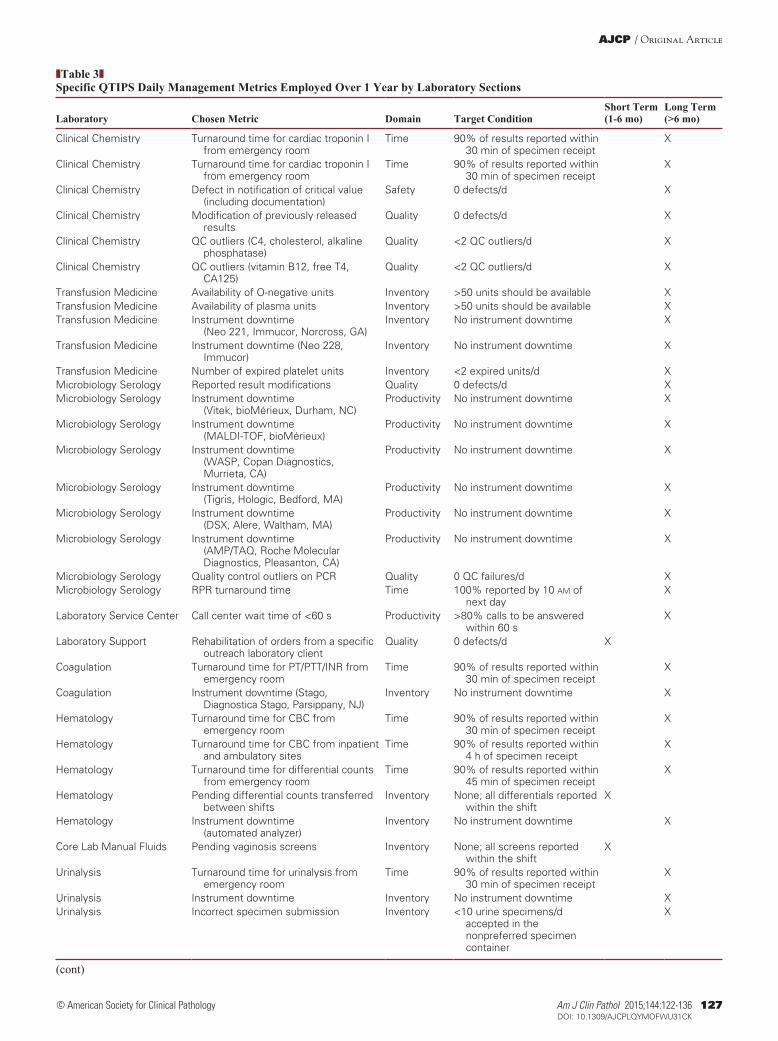
During the first year of DM implementation (June 2013 through July 2014), eight laboratory sections at Henry Ford Hospital employed 64 unique daily metrics ❚Table 2❚. The spe-cific daily metrics used and categorized by domain in Anatomic and Clinical are shown in ❚Table 3❚. All laboratories consis-tently participated in the discipline of DM throughout the year.
Most metrics (83%) were assessed long term (≥6 months) and the rest used for durations of 1 to 6 months. The most frequent category used was a metric of quality (n = 22), followed by inventory (work in process, instrument availability) (n = 15), time (n = 14), productivity (n = 8), and safety (n = 5). The highest number of metrics used was in the clinical pathology disciplines of the combined Core Hematology/Coagulation/Urinalysis and Clinical Chemis-try Laboratories (20 metrics), closely followed by Surgical Pathology (19 metrics) ❚Table 4❚.
Visual Management At-a-glanceDaily gemba rounds with workers• Each square has all days of the month• Color each per performance• Red: Metric failed threshold• Green: Metric met threshold
QQuality
TTime
(delivery)
IInventoryor work
in process
Work group specific metrics
Daily, weekly, monthly, annual trends
Root cause analysis
Correctiveactions
Preventiveaction plan
PDCAimprovements
PProductivity
SSafety
Trendlines• Trend challenging metrics• Day, week, month, year…• Blue: Threshold• Red: Time of failure• Green: Time passing threshold
CountermeasuresCorrective and preventive actionsAssign responsibility andaccountability for completionAssociated PDCA-A3 projects
What When
Why How
Pareto Charts, RCA, etc
❚Figure 1❚ The QTIPS daily management board design elements and content of the Henry Ford Production System. PDCA, plan-do-check-act; QTIPS, Quality, Time, Inventory, Productivity, and Safety; RCA, root cause analysis.
Zarbo et al / Daily Management System of the Henry Ford Production System
126 Am J Clin Pathol 2015;144:122-136 DOI: 10.1309/AJCPLQYMOFWU31CK
© American Society for Clinical Pathology
QTIPS daily monitoring resulted in 42 process improve-ments, more than half derived from the larger laboratories of Core Hematology/Coagulation/Urinalysis and Surgical Pathology that employed the most metrics (33) and used targeted short-term metrics of 1 to 6 months’ duration. We noticed that while most (53 metrics) have been incorporated as long-term metrics that help the laboratory monitor the stability of its processes, a minority (11 metrics) related to specific defects that were targeted with focused corrective and preventive actions and were subsequently retired after successful, sustained resolution (Table 4).
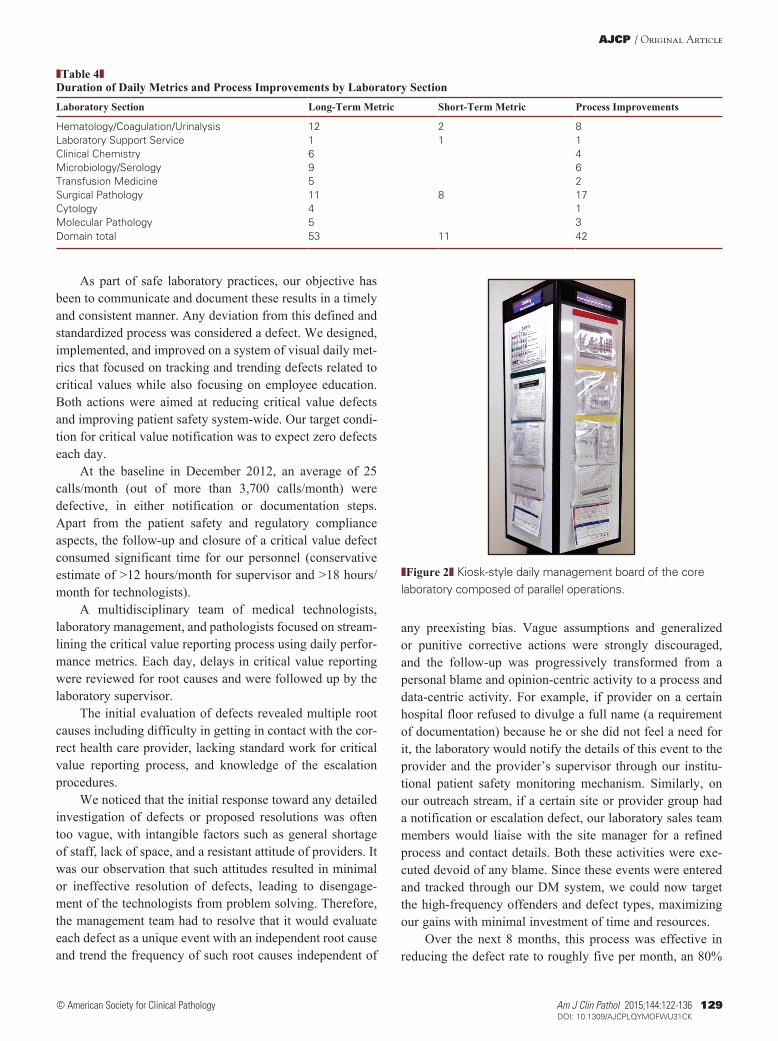
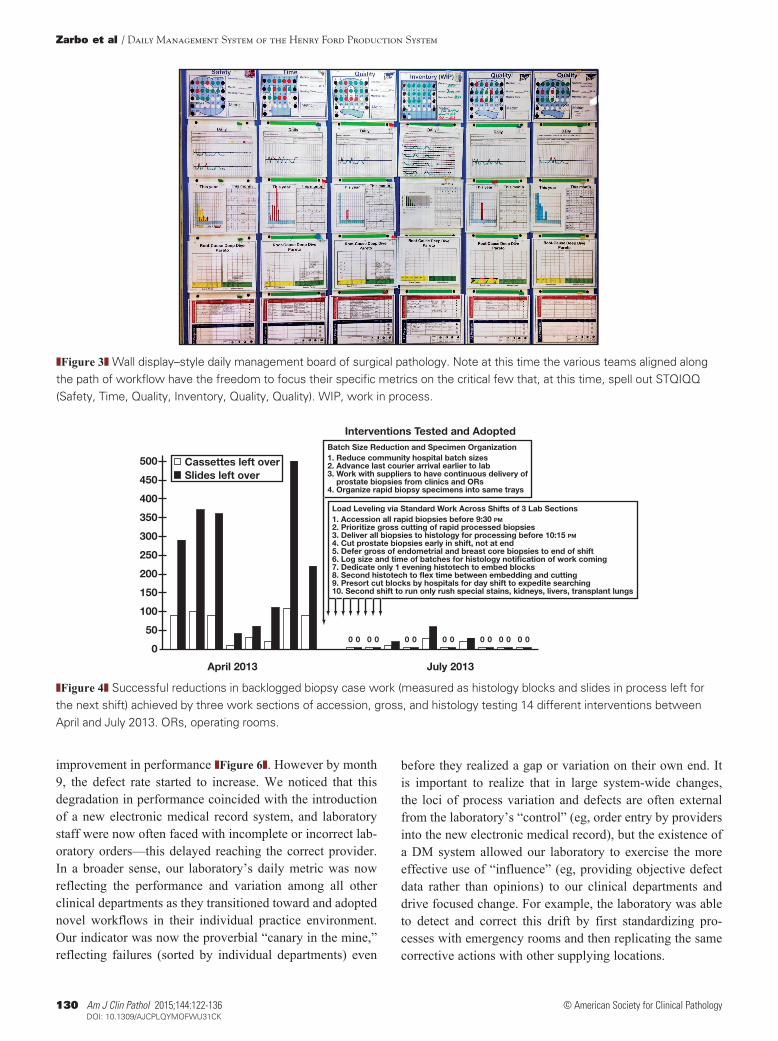
The physical arrangement and style of the DM boards were innovated by each laboratory section. Often, space dictated the location and the form of the board. Parallel operations, typified by the core laboratory, elected to use separate DM boards on rotating kiosks for each subsec-tion of coagulation, hematology, chemistry, urinalysis, and morphologic fluid examination ❚Figure 2❚. In contrast, a serial (sequential) operation, exemplified by surgical pathology, found value in co-locating the visually tracked daily metrics of each laboratory section on a wall display DM board ❚Figure 3❚. This was especially useful for met-rics that were shared across sequential workstations such as accession, gross dissection, histology processing, and histology microtomy.
For example, in this manner, load-leveling problems across work domains could be addressed more readily. The work goal of the Core Surgical Pathology Laboratory is to receive, accession, gross, and process all tissue specimens from all Henry Ford surgical operating rooms and ambula-tory procedures. The first example is that of applying daily metrics aligned and owned across serial workstations in surgical pathology to inform process changes that ensured a balanced continuous flow across two shifts (18 hours) and prevented work backlogs from spilling over to a subsequent day shift. In the baseline condition, evening shift histotech-nologists were unable to finish producing slides from the same-day biopsy load before the end of their shift at 12:20 am. This leftover work fell to the day shift to cut before they
could begin cutting their own morning workload of blocks from overnight processors. The teams theorized that level-ing the workload across the three workstations of accession, gross, and histology could eliminate this work defect. Each workstation devised its own goals and metric of daily suc-cess to monitor the effect of changes that would be tested. For accession, the goal was all rapid processed biopsy cases to be accessioned before 9:30 pm, and the metric was the number of cases left over unaccessioned at cutoff time. For gross, the goal was to deliver all cut biopsy specimens to histology processors before 10:15 pm, and the metric was the number of rapid biopsy cases left over uncut at cutoff time. For histology, it was all rapid biopsy specimens to be embedded and cut by the evening shift with nothing left over except for the blocks processed on the last batch. The histol-ogy metric was the number of blocks and slides not cut and left to the day shift.
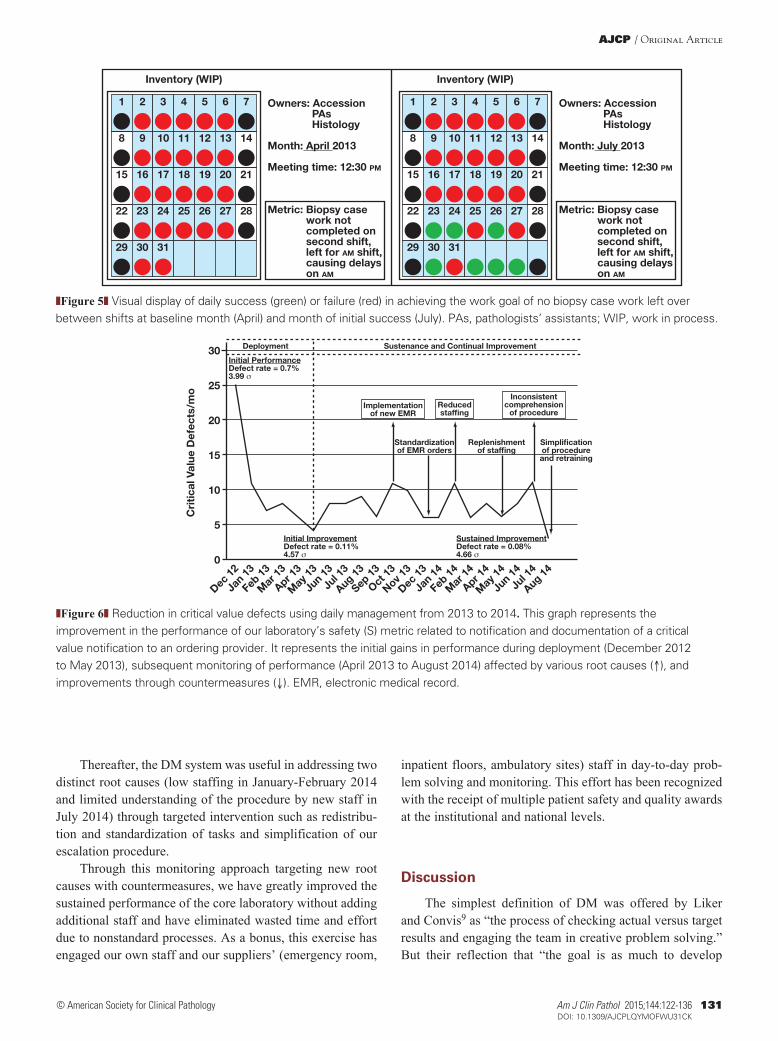
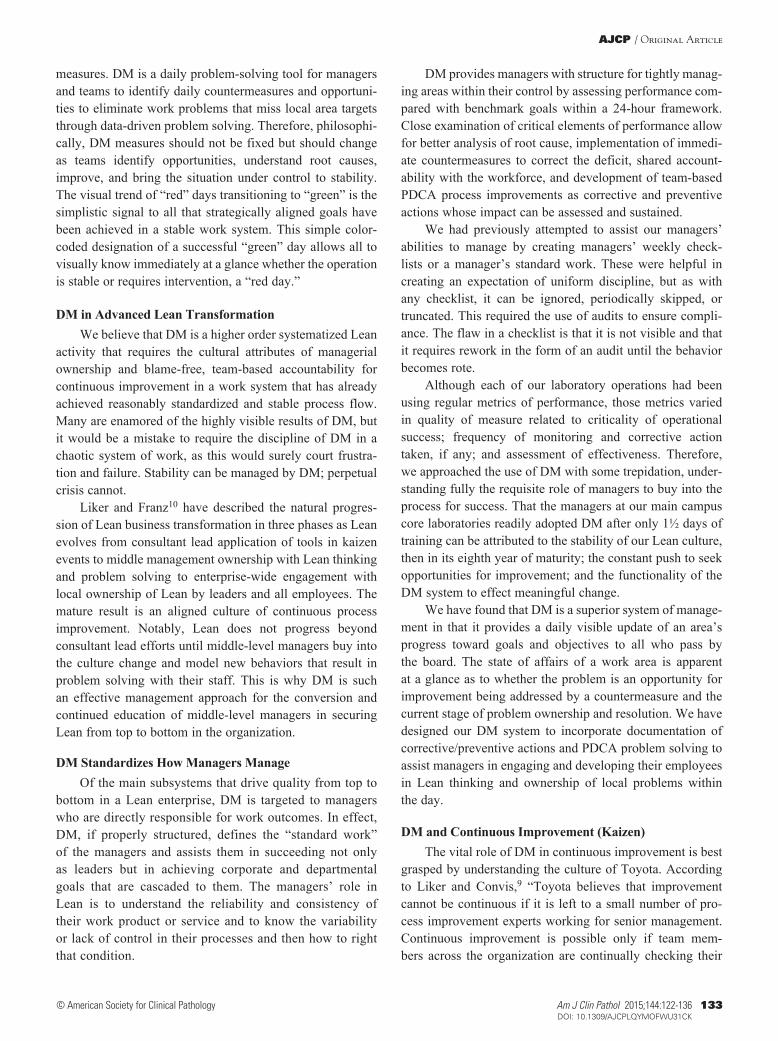
Numerous root causes of delay were identified that affected each workstation and cascaded along the shift. One cause was that large courier specimen batches received after 8:30 pm could be grossed but not cut in time by the histotech-nologists since processing time required 75 to 105 minutes until blocks were ready to be embedded. An additional root cause with negative downstream effect was the large volume of prostate biopsy specimens that were deferred to be cut by the pathologists’ assistants until the end of the shift. This caused a very large bolus of 72 slides per prostate biopsy case to be cut at the end of the shift as each prostate block contained but one needle core and required six slides cut per block. Through a series of interventions described in ❚Figure 4❚, the teams were able to make effective change within 4 months to achieve their goal by applying Lean principles of reducing batch sizes from hospitals, optimizing courier delivery times from remote hospitals, promoting ear-lier delivery of prostate cases from clinics, establishing more defined standard work for all three workstations that pro-moted continuous flow, and frontloading prostate specimens that required more work at the backend. ❚Figure 5❚ shows the actual daily monitor and ease of assessing attainment of the
❚Table 2❚Distribution of Daily Management Metrics Used in 1 Year by Laboratory Sections According to Domain (QTIPS)
Laboratory Section Quality Time Inventory Productivity Safety Laboratory TotalsHematology/Coagulation/Urinalysis 1 5 6 2 14Laboratory Support Service 1 1 2Clinical Chemistry 3 2 1 6Microbiology/Serology 2 1 6 9Transfusion Medicine 5 5Surgical Pathology 10 4 4 1 19Cytology 1 2 1 4Molecular Pathology 4 1 5Domain total 22 14 15 8 5 64
QTIPS, Quality, Time, Inventory, Productivity, and Safety.
AJCP / Original Article
Am J Clin Pathol 2015;144:122-136 127 DOI: 10.1309/AJCPLQYMOFWU31CK
© American Society for Clinical Pathology
❚Table 3❚Specific QTIPS Daily Management Metrics Employed Over 1 Year by Laboratory Sections
Laboratory Chosen Metric Domain Target ConditionShort Term (1-6 mo)
Long Term (>6 mo)
Clinical Chemistry Turnaround time for cardiac troponin I from emergency room
Time 90% of results reported within 30 min of specimen receipt
X
Clinical Chemistry Turnaround time for cardiac troponin I from emergency room
Time 90% of results reported within 30 min of specimen receipt
X
Clinical Chemistry Defect in notification of critical value (including documentation)
Safety 0 defects/d X
Clinical Chemistry Modification of previously released results
Quality 0 defects/d X
Clinical Chemistry QC outliers (C4, cholesterol, alkaline phosphatase)
Quality <2 QC outliers/d X
Clinical Chemistry QC outliers (vitamin B12, free T4, CA125)
Quality <2 QC outliers/d X
Transfusion Medicine Availability of O-negative units Inventory >50 units should be available XTransfusion Medicine Availability of plasma units Inventory >50 units should be available XTransfusion Medicine Instrument downtime
(Neo 221, Immucor, Norcross, GA)Inventory No instrument downtime X
Transfusion Medicine Instrument downtime (Neo 228, Immucor)
Inventory No instrument downtime X
Transfusion Medicine Number of expired platelet units Inventory <2 expired units/d XMicrobiology Serology Reported result modifications Quality 0 defects/d XMicrobiology Serology Instrument downtime
(Vitek, bioMérieux, Durham, NC)Productivity No instrument downtime X
Microbiology Serology Instrument downtime (MALDI-TOF, bioMérieux)
Productivity No instrument downtime X
Microbiology Serology Instrument downtime (WASP, Copan Diagnostics, Murrieta, CA)
Productivity No instrument downtime X
Microbiology Serology Instrument downtime (Tigris, Hologic, Bedford, MA)
Productivity No instrument downtime X
Microbiology Serology Instrument downtime (DSX, Alere, Waltham, MA)
Productivity No instrument downtime X
Microbiology Serology Instrument downtime (AMP/TAQ, Roche Molecular Diagnostics, Pleasanton, CA)
Productivity No instrument downtime X
Microbiology Serology Quality control outliers on PCR Quality 0 QC failures/d XMicrobiology Serology RPR turnaround time Time 100% reported by 10 am of
next dayX
Laboratory Service Center Call center wait time of <60 s Productivity >80% calls to be answered within 60 s
X
Laboratory Support Rehabilitation of orders from a specific outreach laboratory client
Quality 0 defects/d X
Coagulation Turnaround time for PT/PTT/INR from emergency room
Time 90% of results reported within 30 min of specimen receipt
X
Coagulation Instrument downtime (Stago, Diagnostica Stago, Parsippany, NJ)
Inventory No instrument downtime X
Hematology Turnaround time for CBC from emergency room
Time 90% of results reported within 30 min of specimen receipt
X
Hematology Turnaround time for CBC from inpatient and ambulatory sites
Time 90% of results reported within 4 h of specimen receipt
X
Hematology Turnaround time for differential counts from emergency room
Time 90% of results reported within 45 min of specimen receipt
X
Hematology Pending differential counts transferred between shifts
Inventory None; all differentials reported within the shift
X
Hematology Instrument downtime (automated analyzer)
Inventory No instrument downtime X
Core Lab Manual Fluids Pending vaginosis screens Inventory None; all screens reported within the shift
X
Urinalysis Turnaround time for urinalysis from emergency room
Time 90% of results reported within 30 min of specimen receipt
X
Urinalysis Instrument downtime Inventory No instrument downtime XUrinalysis Incorrect specimen submission Inventory <10 urine specimens/d
accepted in the nonpreferred specimen container
X
(cont)
Zarbo et al / Daily Management System of the Henry Ford Production System
128 Am J Clin Pathol 2015;144:122-136 DOI: 10.1309/AJCPLQYMOFWU31CK
© American Society for Clinical Pathology
goal from initiation of the project in April 2013 and when positive results were achieved in July 2013. This monitor was retired once 3 months of consistent process stability was achieved.
The following is an example of successful long-term monitoring and reduction of critical value notification defects in the Core Laboratory, composed of Hematology, Coagulation, Stat-Chemistry, and Urinalysis. This large laboratory operation of parallel sections reports more than 8
million clinical test results every year. Of these, on average 150 test results per day are of a critical nature (ie, they are significantly outside the reference range and reflect a poten-tially immediate life-threatening situation). The ordering provider must be immediately notified so that prompt clini-cal intervention can be initiated for the patient. Furthermore, these results must be released and documented according to the requirements of regulatory agencies in accord with National Patient Safety Goals.8
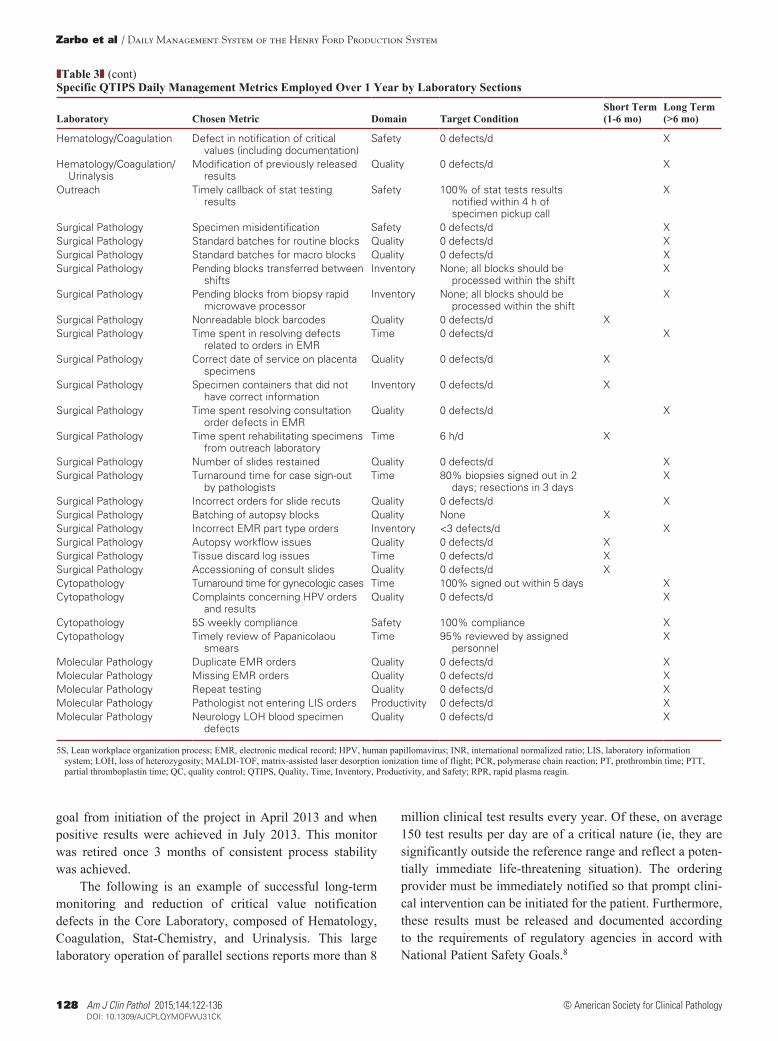
❚Table 3❚ (cont)Specific QTIPS Daily Management Metrics Employed Over 1 Year by Laboratory Sections
Laboratory Chosen Metric Domain Target ConditionShort Term (1-6 mo)
Long Term (>6 mo)
Hematology/Coagulation Defect in notification of critical values (including documentation)
Safety 0 defects/d X
Hematology/Coagulation/Urinalysis
Modification of previously released results
Quality 0 defects/d X
Outreach Timely callback of stat testing results
Safety 100% of stat tests results notified within 4 h of specimen pickup call
X
Surgical Pathology Specimen misidentification Safety 0 defects/d XSurgical Pathology Standard batches for routine blocks Quality 0 defects/d XSurgical Pathology Standard batches for macro blocks Quality 0 defects/d XSurgical Pathology Pending blocks transferred between
shiftsInventory None; all blocks should be
processed within the shiftX
Surgical Pathology Pending blocks from biopsy rapid microwave processor
Inventory None; all blocks should be processed within the shift
X
Surgical Pathology Nonreadable block barcodes Quality 0 defects/d XSurgical Pathology Time spent in resolving defects
related to orders in EMRTime 0 defects/d X
Surgical Pathology Correct date of service on placenta specimens
Quality 0 defects/d X
Surgical Pathology Specimen containers that did not have correct information
Inventory 0 defects/d X
Surgical Pathology Time spent resolving consultation order defects in EMR
Quality 0 defects/d X
Surgical Pathology Time spent rehabilitating specimens from outreach laboratory
Time 6 h/d X
Surgical Pathology Number of slides restained Quality 0 defects/d XSurgical Pathology Turnaround time for case sign-out
by pathologistsTime 80% biopsies signed out in 2
days; resections in 3 daysX
Surgical Pathology Incorrect orders for slide recuts Quality 0 defects/d XSurgical Pathology Batching of autopsy blocks Quality None XSurgical Pathology Incorrect EMR part type orders Inventory <3 defects/d XSurgical Pathology Autopsy workflow issues Quality 0 defects/d XSurgical Pathology Tissue discard log issues Time 0 defects/d XSurgical Pathology Accessioning of consult slides Quality 0 defects/d XCytopathology Turnaround time for gynecologic cases Time 100% signed out within 5 days XCytopathology Complaints concerning HPV orders
and resultsQuality 0 defects/d X
Cytopathology 5S weekly compliance Safety 100% compliance XCytopathology Timely review of Papanicolaou
smearsTime 95% reviewed by assigned
personnelX
Molecular Pathology Duplicate EMR orders Quality 0 defects/d XMolecular Pathology Missing EMR orders Quality 0 defects/d XMolecular Pathology Repeat testing Quality 0 defects/d XMolecular Pathology Pathologist not entering LIS orders Productivity 0 defects/d XMolecular Pathology Neurology LOH blood specimen
defectsQuality 0 defects/d X
5S, Lean workplace organization process; EMR, electronic medical record; HPV, human papillomavirus; INR, international normalized ratio; LIS, laboratory information system; LOH, loss of heterozygosity; MALDI-TOF, matrix-assisted laser desorption ionization time of flight; PCR, polymerase chain reaction; PT, prothrombin time; PTT, partial thromboplastin time; QC, quality control; QTIPS, Quality, Time, Inventory, Productivity, and Safety; RPR, rapid plasma reagin.
AJCP / Original Article
Am J Clin Pathol 2015;144:122-136 129 DOI: 10.1309/AJCPLQYMOFWU31CK
© American Society for Clinical Pathology
As part of safe laboratory practices, our objective has been to communicate and document these results in a timely and consistent manner. Any deviation from this defined and standardized process was considered a defect. We designed, implemented, and improved on a system of visual daily met-rics that focused on tracking and trending defects related to critical values while also focusing on employee education. Both actions were aimed at reducing critical value defects and improving patient safety system-wide. Our target condi-tion for critical value notification was to expect zero defects each day.
At the baseline in December 2012, an average of 25 calls/month (out of more than 3,700 calls/month) were defective, in either notification or documentation steps. Apart from the patient safety and regulatory compliance aspects, the follow-up and closure of a critical value defect consumed significant time for our personnel (conservative estimate of >12 hours/month for supervisor and >18 hours/month for technologists).
A multidisciplinary team of medical technologists, laboratory management, and pathologists focused on stream-lining the critical value reporting process using daily perfor-mance metrics. Each day, delays in critical value reporting were reviewed for root causes and were followed up by the laboratory supervisor.
The initial evaluation of defects revealed multiple root causes including difficulty in getting in contact with the cor-rect health care provider, lacking standard work for critical value reporting process, and knowledge of the escalation procedures.
We noticed that the initial response toward any detailed investigation of defects or proposed resolutions was often too vague, with intangible factors such as general shortage of staff, lack of space, and a resistant attitude of providers. It was our observation that such attitudes resulted in minimal or ineffective resolution of defects, leading to disengage-ment of the technologists from problem solving. Therefore, the management team had to resolve that it would evaluate each defect as a unique event with an independent root cause and trend the frequency of such root causes independent of
any preexisting bias. Vague assumptions and generalized or punitive corrective actions were strongly discouraged, and the follow-up was progressively transformed from a personal blame and opinion-centric activity to a process and data-centric activity. For example, if provider on a certain hospital floor refused to divulge a full name (a requirement of documentation) because he or she did not feel a need for it, the laboratory would notify the details of this event to the provider and the provider’s supervisor through our institu-tional patient safety monitoring mechanism. Similarly, on our outreach stream, if a certain site or provider group had a notification or escalation defect, our laboratory sales team members would liaise with the site manager for a refined process and contact details. Both these activities were exe-cuted devoid of any blame. Since these events were entered and tracked through our DM system, we could now target the high-frequency offenders and defect types, maximizing our gains with minimal investment of time and resources.
Over the next 8 months, this process was effective in reducing the defect rate to roughly five per month, an 80%
❚Table 4❚Duration of Daily Metrics and Process Improvements by Laboratory SectionLaboratory Section Long-Term Metric Short-Term Metric Process Improvements
Hematology/Coagulation/Urinalysis 12 2 8Laboratory Support Service 1 1 1Clinical Chemistry 6 4Microbiology/Serology 9 6Transfusion Medicine 5 2Surgical Pathology 11 8 17Cytology 4 1Molecular Pathology 5 3Domain total 53 11 42
❚Figure 2❚ Kiosk-style daily management board of the core laboratory composed of parallel operations.
Zarbo et al / Daily Management System of the Henry Ford Production System
130 Am J Clin Pathol 2015;144:122-136 DOI: 10.1309/AJCPLQYMOFWU31CK
© American Society for Clinical Pathology
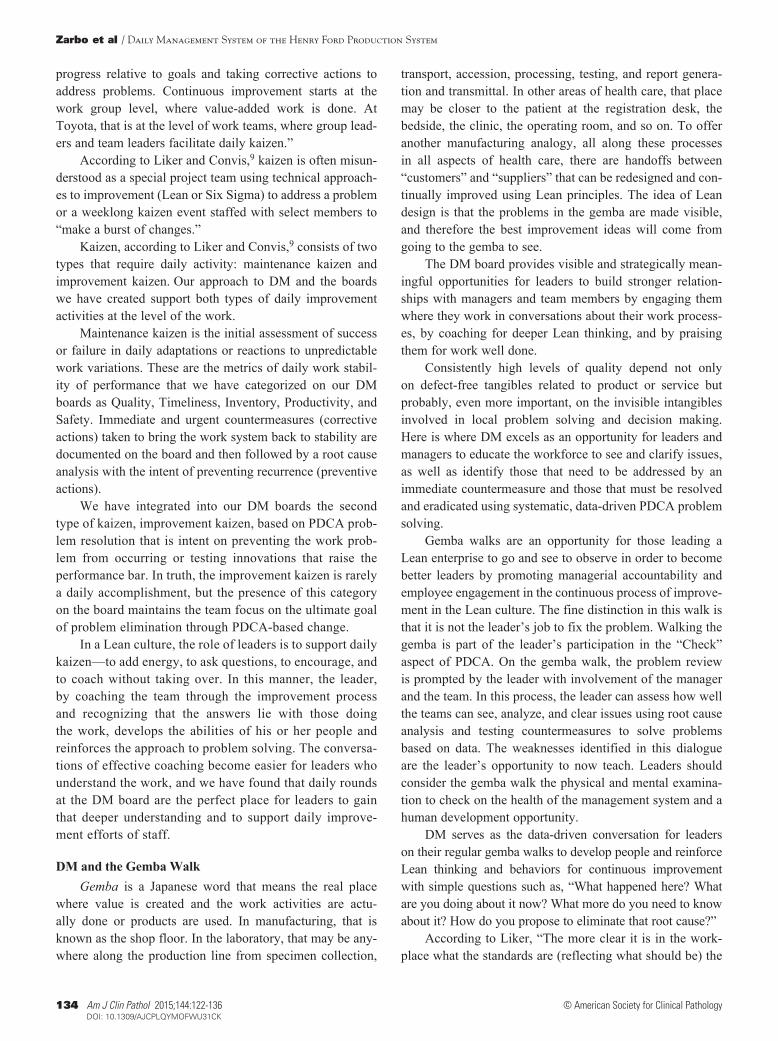
improvement in performance ❚Figure 6❚. However by month 9, the defect rate started to increase. We noticed that this degradation in performance coincided with the introduction of a new electronic medical record system, and laboratory staff were now often faced with incomplete or incorrect lab-oratory orders—this delayed reaching the correct provider. In a broader sense, our laboratory’s daily metric was now reflecting the performance and variation among all other clinical departments as they transitioned toward and adopted novel workflows in their individual practice environment. Our indicator was now the proverbial “canary in the mine,” reflecting failures (sorted by individual departments) even
before they realized a gap or variation on their own end. It is important to realize that in large system-wide changes, the loci of process variation and defects are often external from the laboratory’s “control” (eg, order entry by providers into the new electronic medical record), but the existence of a DM system allowed our laboratory to exercise the more effective use of “influence” (eg, providing objective defect data rather than opinions) to our clinical departments and drive focused change. For example, the laboratory was able to detect and correct this drift by first standardizing pro-cesses with emergency rooms and then replicating the same corrective actions with other supplying locations.
❚Figure 3❚ Wall display–style daily management board of surgical pathology. Note at this time the various teams aligned along the path of workflow have the freedom to focus their specific metrics on the critical few that, at this time, spell out STQIQQ (Safety, Time, Quality, Inventory, Quality, Quality). WIP, work in process.
0
July 2013
Interventions Tested and Adopted
Cassettes left overSlides left over
April 2013
Batch Size Reduction and Specimen Organization1. Reduce community hospital batch sizes2. Advance last courier arrival earlier to lab3. Work with suppliers to have continuous delivery of prostate biopsies from clinics and ORs4. Organize rapid biopsy specimens into same trays
Load Leveling via Standard Work Across Shifts of 3 Lab Sections1. Accession all rapid biopsies before 9:30 PM2. Prioritize gross cutting of rapid processed biopsies3. Deliver all biopsies to histology for processing before 10:15 PM4. Cut prostate biopsies early in shift, not at end5. Defer gross of endometrial and breast core biopsies to end of shift6. Log size and time of batches for histology noti�cation of work coming7. Dedicate only 1 evening histotech to embed blocks8. Second histotech to �ex time between embedding and cutting9. Presort cut blocks by hospitals for day shift to expedite searching10. Second shift to run only rush special stains, kidneys, livers, transplant lungs
0 0 0 0 0 0 0 0 0 0 0 0 0 0
500
50
100
150
200
250
300
350
400
450
❚Figure 4❚ Successful reductions in backlogged biopsy case work (measured as histology blocks and slides in process left for the next shift) achieved by three work sections of accession, gross, and histology testing 14 different interventions between April and July 2013. ORs, operating rooms.
AJCP / Original Article
Am J Clin Pathol 2015;144:122-136 131 DOI: 10.1309/AJCPLQYMOFWU31CK
© American Society for Clinical Pathology
Thereafter, the DM system was useful in addressing two distinct root causes (low staffing in January-February 2014 and limited understanding of the procedure by new staff in July 2014) through targeted intervention such as redistribu-tion and standardization of tasks and simplification of our escalation procedure.
Through this monitoring approach targeting new root causes with countermeasures, we have greatly improved the sustained performance of the core laboratory without adding additional staff and have eliminated wasted time and effort due to nonstandard processes. As a bonus, this exercise has engaged our own staff and our suppliers’ (emergency room,
inpatient floors, ambulatory sites) staff in day-to-day prob-lem solving and monitoring. This effort has been recognized with the receipt of multiple patient safety and quality awards at the institutional and national levels.
Discussion
The simplest definition of DM was offered by Liker and Convis9 as “the process of checking actual versus target results and engaging the team in creative problem solving.” But their reflection that “the goal is as much to develop
1 2 3 5 6 74
8 9 10 12 13 1411
15 16 17 19 20 2118
22 23 24 26 27 2825
29 30 31
Owners: Accession PAs Histology
Month: April 2013
Meeting time: 12:30 PM
Metric: Biopsy case work not completed on second shift, left for AM shift, causing delays on AM
Inventory (WIP)
1 2 3 5 6 74
8 9 10 12 13 1411
15 16 17 19 20 2118
22 23 24 26 27 2825
29 30 31
Owners: Accession PAs Histology
Month: July 2013
Meeting time: 12:30 PM
Metric: Biopsy case work not completed on second shift, left for AM shift, causing delays on AM
Inventory (WIP)
❚Figure 5❚ Visual display of daily success (green) or failure (red) in achieving the work goal of no biopsy case work left over between shifts at baseline month (April) and month of initial success (July). PAs, pathologists’ assistants; WIP, work in process.
❚Figure 6❚ Reduction in critical value defects using daily management from 2013 to 2014. This graph represents the improvement in the performance of our laboratory’s safety (S) metric related to notification and documentation of a critical value notification to an ordering provider. It represents the initial gains in performance during deployment (December 2012 to May 2013), subsequent monitoring of performance (April 2013 to August 2014) affected by various root causes (↑), and improvements through countermeasures (↓). EMR, electronic medical record.
0
5
10
15
20
Cri
tica
l Val
ue D
efec
ts/m
o
Deployment Sustenance and Continual Improvement
Initial PerformanceDefect rate = 0.7%3.99 σ
Initial ImprovementDefect rate = 0.11%4.57 σ
Sustained ImprovementDefect rate = 0.08%4.66 σ
Implementationof new EMR
Standardizationof EMR orders
Replenishmentof staf�ng
Simpli�cationof procedureand retraining
Reducedstaf�ng
Inconsistentcomprehension
of procedure
25
Dec 12
Jan 13
Feb 13
Mar
13
Apr 13
May
13
Jun 13
Jul 1
3
Aug 13
Sep 13
Oct 13
Nov 13
Dec 13
Jan 14
Feb 14
Mar
14
Apr 14
May
14
Jun 14
Jul 1
4
Aug 14
30

Zarbo et al / Daily Management System of the Henry Ford Production System
132 Am J Clin Pathol 2015;144:122-136 DOI: 10.1309/AJCPLQYMOFWU31CK
© American Society for Clinical Pathology
people as to get the results” is key in understanding how DM reinforces the cultural expectation of continuous improve-ment at the ground level of any organization. The concept and practice of DM may, therefore, be viewed differently based on maturity levels of Lean adoption, so we will frame this discussion along several lines as DM is a management subsystem for leaders, managers, and the workforce to pro-mote engagement and continuous improvements aligned with corporate goals.
DM as a Subsystem of a Mature Lean EnterpriseAfter a decade of practical experience in adapting
Lean to laboratories and other clinical domains in health care, we have come to appreciate that Lean is first a man-agement system that structures and incentivizes leaders, managers, and the workforce to align their efforts to con-tinually improve the work systems, services, and products for which they are each responsible. We have further come to know that success requires creating effective and aligned new management subsystems that support the philosophy and work of a continuous improvement culture. The main business subsystems that enable this culture of continuous improvement to function at all levels are policy deploy-ment at the leadership level, DM at the managerial level, nonconformance (deviation) management at the level of the work, and the PDCA-based continuous improvement system at all levels. DM is the subsystem responsible for aligning people to cultivate a culture of problem solving at the level of the work.
Prerequisites for Effective DM and Continuous Improvement
For Lean to be successful as the basis of continuous improvement, leaders must create and then support grass-roots improvements. This requires that the ground has already been prepared, the grass has been fertilized, and the root system will be continually watered and fed.
Success in using a DM approach to continuous improvement with workforce engagement is predicated on the foundation of a preexisting and functional sub-system structure of work groups with respective group leaders (manager), team leaders for quality improvement, and work team members. Liker and Convis9 describe this structure at Toyota, and we have described this structure previously for laboratories.5 The other prerequisites are a trained workforce who understands the goals and rules of continuous improvement and the establishment of a blame-free culture that enables work defects to be consistently identified and analyzed as the basis for daily improvement at the level of the work site. The last element is a dedicated and aligned manager without whom the DM process may die on the vine.
Function of DMThe DM subsystem visually holds managers and
teams responsible for executing their piece of the strate-gic plan at the local level by providing structure and dis-cipline for managers and work teams to link work group performance to departmental metrics and organizational objectives. The business systems of advanced and suc-cessful Lean corporations like Toyota and Danaher rely on DM to make visible each team’s contribution, success, or failure in achieving corporate goals so that adjust-ments and countermeasure solutions derived from sound problem solving can be addressed sooner and in a locally meaningful way.
One of the most important structures for continuous improvement from the base of the organization is a daily visual management system. For example, the Toyota Floor Management Development System focuses the current performance of the work group relative to expected targets organized by major key performance indicator categories of Safety, Quality, Productivity (delivery, service), Cost, and People (human resource development, engagement).9
The DM boards of Danaher Corporation’s business entities revolve around Safety, Quality, Delivery, Inventory, and Productivity. Through our interaction with Danaher, we evolved the DM system of the Henry Ford Production System laboratories to focus process improvements in the categories of Quality, Time (delivery), Inventory (work in process, batch size, instrument availability), Productivity, and Safety. These DM measures are represented by the acronym QTIPS.
What DM IsDM is a powerful visual management subsystem that
provides managers and teams with local structure, align-ment, focus, and accountability for continuous improve-ments of their group’s product or service. When structured by sequential workstations along the path of workflow, DM serves to make visible defective work design resulting in substandard quality. In this fashion, DM also serves to break down barriers of control and isolation that preclude the achievement of continuous flow that is so vital to Lean success. This is illustrated in the surgical pathology labora-tory example of inventory monitoring of work in process to achieve load leveling. Here, group examination for root cause determined that specimen batches left over between shifts resulted not from excess work but because practices adopted unknowingly upstream greatly magnified down-stream work and batch accumulation.
What DM Is NotDM is not a display of stable production or operational
efficiency numbers or a posting of weekly collected data
AJCP / Original Article
Am J Clin Pathol 2015;144:122-136 133 DOI: 10.1309/AJCPLQYMOFWU31CK
© American Society for Clinical Pathology
measures. DM is a daily problem-solving tool for managers and teams to identify daily countermeasures and opportuni-ties to eliminate work problems that miss local area targets through data-driven problem solving. Therefore, philosophi-cally, DM measures should not be fixed but should change as teams identify opportunities, understand root causes, improve, and bring the situation under control to stability. The visual trend of “red” days transitioning to “green” is the simplistic signal to all that strategically aligned goals have been achieved in a stable work system. This simple color-coded designation of a successful “green” day allows all to visually know immediately at a glance whether the operation is stable or requires intervention, a “red day.”
DM in Advanced Lean TransformationWe believe that DM is a higher order systematized Lean
activity that requires the cultural attributes of managerial ownership and blame-free, team-based accountability for continuous improvement in a work system that has already achieved reasonably standardized and stable process flow. Many are enamored of the highly visible results of DM, but it would be a mistake to require the discipline of DM in a chaotic system of work, as this would surely court frustra-tion and failure. Stability can be managed by DM; perpetual crisis cannot.
Liker and Franz10 have described the natural progres-sion of Lean business transformation in three phases as Lean evolves from consultant lead application of tools in kaizen events to middle management ownership with Lean thinking and problem solving to enterprise-wide engagement with local ownership of Lean by leaders and all employees. The mature result is an aligned culture of continuous process improvement. Notably, Lean does not progress beyond consultant lead efforts until middle-level managers buy into the culture change and model new behaviors that result in problem solving with their staff. This is why DM is such an effective management approach for the conversion and continued education of middle-level managers in securing Lean from top to bottom in the organization.
DM Standardizes How Managers ManageOf the main subsystems that drive quality from top to
bottom in a Lean enterprise, DM is targeted to managers who are directly responsible for work outcomes. In effect, DM, if properly structured, defines the “standard work” of the managers and assists them in succeeding not only as leaders but in achieving corporate and departmental goals that are cascaded to them. The managers’ role in Lean is to understand the reliability and consistency of their work product or service and to know the variability or lack of control in their processes and then how to right that condition.
DM provides managers with structure for tightly manag-ing areas within their control by assessing performance com-pared with benchmark goals within a 24-hour framework. Close examination of critical elements of performance allow for better analysis of root cause, implementation of immedi-ate countermeasures to correct the deficit, shared account-ability with the workforce, and development of team-based PDCA process improvements as corrective and preventive actions whose impact can be assessed and sustained.
We had previously attempted to assist our managers’ abilities to manage by creating managers’ weekly check-lists or a manager’s standard work. These were helpful in creating an expectation of uniform discipline, but as with any checklist, it can be ignored, periodically skipped, or truncated. This required the use of audits to ensure compli-ance. The flaw in a checklist is that it is not visible and that it requires rework in the form of an audit until the behavior becomes rote.
Although each of our laboratory operations had been using regular metrics of performance, those metrics varied in quality of measure related to criticality of operational success; frequency of monitoring and corrective action taken, if any; and assessment of effectiveness. Therefore, we approached the use of DM with some trepidation, under-standing fully the requisite role of managers to buy into the process for success. That the managers at our main campus core laboratories readily adopted DM after only 1½ days of training can be attributed to the stability of our Lean culture, then in its eighth year of maturity; the constant push to seek opportunities for improvement; and the functionality of the DM system to effect meaningful change.
We have found that DM is a superior system of manage-ment in that it provides a daily visible update of an area’s progress toward goals and objectives to all who pass by the board. The state of affairs of a work area is apparent at a glance as to whether the problem is an opportunity for improvement being addressed by a countermeasure and the current stage of problem ownership and resolution. We have designed our DM system to incorporate documentation of corrective/preventive actions and PDCA problem solving to assist managers in engaging and developing their employees in Lean thinking and ownership of local problems within the day.
DM and Continuous Improvement (Kaizen)The vital role of DM in continuous improvement is best
grasped by understanding the culture of Toyota. According to Liker and Convis,9 “Toyota believes that improvement cannot be continuous if it is left to a small number of pro-cess improvement experts working for senior management. Continuous improvement is possible only if team mem-bers across the organization are continually checking their
Zarbo et al / Daily Management System of the Henry Ford Production System
134 Am J Clin Pathol 2015;144:122-136 DOI: 10.1309/AJCPLQYMOFWU31CK
© American Society for Clinical Pathology
progress relative to goals and taking corrective actions to address problems. Continuous improvement starts at the work group level, where value-added work is done. At Toyota, that is at the level of work teams, where group lead-ers and team leaders facilitate daily kaizen.”
According to Liker and Convis,9 kaizen is often misun-derstood as a special project team using technical approach-es to improvement (Lean or Six Sigma) to address a problem or a weeklong kaizen event staffed with select members to “make a burst of changes.”
Kaizen, according to Liker and Convis,9 consists of two types that require daily activity: maintenance kaizen and improvement kaizen. Our approach to DM and the boards we have created support both types of daily improvement activities at the level of the work.
Maintenance kaizen is the initial assessment of success or failure in daily adaptations or reactions to unpredictable work variations. These are the metrics of daily work stabil-ity of performance that we have categorized on our DM boards as Quality, Timeliness, Inventory, Productivity, and Safety. Immediate and urgent countermeasures (corrective actions) taken to bring the work system back to stability are documented on the board and then followed by a root cause analysis with the intent of preventing recurrence (preventive actions).
We have integrated into our DM boards the second type of kaizen, improvement kaizen, based on PDCA prob-lem resolution that is intent on preventing the work prob-lem from occurring or testing innovations that raise the performance bar. In truth, the improvement kaizen is rarely a daily accomplishment, but the presence of this category on the board maintains the team focus on the ultimate goal of problem elimination through PDCA-based change.
In a Lean culture, the role of leaders is to support daily kaizen—to add energy, to ask questions, to encourage, and to coach without taking over. In this manner, the leader, by coaching the team through the improvement process and recognizing that the answers lie with those doing the work, develops the abilities of his or her people and reinforces the approach to problem solving. The conversa-tions of effective coaching become easier for leaders who understand the work, and we have found that daily rounds at the DM board are the perfect place for leaders to gain that deeper understanding and to support daily improve-ment efforts of staff.
DM and the Gemba WalkGemba is a Japanese word that means the real place
where value is created and the work activities are actu-ally done or products are used. In manufacturing, that is known as the shop floor. In the laboratory, that may be any-where along the production line from specimen collection,
transport, accession, processing, testing, and report genera-tion and transmittal. In other areas of health care, that place may be closer to the patient at the registration desk, the bedside, the clinic, the operating room, and so on. To offer another manufacturing analogy, all along these processes in all aspects of health care, there are handoffs between “customers” and “suppliers” that can be redesigned and con-tinually improved using Lean principles. The idea of Lean design is that the problems in the gemba are made visible, and therefore the best improvement ideas will come from going to the gemba to see.
The DM board provides visible and strategically mean-ingful opportunities for leaders to build stronger relation-ships with managers and team members by engaging them where they work in conversations about their work process-es, by coaching for deeper Lean thinking, and by praising them for work well done.
Consistently high levels of quality depend not only on defect-free tangibles related to product or service but probably, even more important, on the invisible intangibles involved in local problem solving and decision making. Here is where DM excels as an opportunity for leaders and managers to educate the workforce to see and clarify issues, as well as identify those that need to be addressed by an immediate countermeasure and those that must be resolved and eradicated using systematic, data-driven PDCA problem solving.
Gemba walks are an opportunity for those leading a Lean enterprise to go and see to observe in order to become better leaders by promoting managerial accountability and employee engagement in the continuous process of improve-ment in the Lean culture. The fine distinction in this walk is that it is not the leader’s job to fix the problem. Walking the gemba is part of the leader’s participation in the “Check” aspect of PDCA. On the gemba walk, the problem review is prompted by the leader with involvement of the manager and the team. In this process, the leader can assess how well the teams can see, analyze, and clear issues using root cause analysis and testing countermeasures to solve problems based on data. The weaknesses identified in this dialogue are the leader’s opportunity to now teach. Leaders should consider the gemba walk the physical and mental examina-tion to check on the health of the management system and a human development opportunity.
DM serves as the data-driven conversation for leaders on their regular gemba walks to develop people and reinforce Lean thinking and behaviors for continuous improvement with simple questions such as, “What happened here? What are you doing about it now? What more do you need to know about it? How do you propose to eliminate that root cause?”
According to Liker, “The more clear it is in the work-place what the standards are (reflecting what should be) the
AJCP / Original Article
Am J Clin Pathol 2015;144:122-136 135 DOI: 10.1309/AJCPLQYMOFWU31CK
© American Society for Clinical Pathology
more easily the manager can see the gaps and have produc-tive discussions with people in the process. If there is a chart it should be clear if the process is in control (green) or out of control (red). It should be clear where inputs used should be, how much should be there, and when they should be arriv-ing. It should be clear (without flipping through many com-puter screens) what the technical worker should be working on versus what they are working on. This is called a ‘visual workplace’ and the more it is clear visually what should be happening versus what is happening the more productive the Gemba walks will be” (J. K. Liker, PhD, written com-munication, 2011).
ChallengesAs with any new behavior, there was an adaptation
phase to DM as managers and employees became comfort-able with a daily exposure of their work system failures. This required the blame-free Lean culture to be functional in every section so that challenging metrics (failing measures) could be chosen as a visual focus for the work team to direct improvement efforts. Strong managers who engaged their employees and were adept in team-based approaches to improvement adapted to DM as an immediate problem-solving tool quicker than those who preferred the comfort of offering mostly “green day” metrics. These strong managers were more likely to select new metrics throughout the year as former problems were resolved. Most adopted a rule that 3 months of all “green” days signaled problem resolution and stability so that the metric could be retired. Laboratories that performed their work in a serial structure of worksta-tions connected along the path of workflow and could co-locate their DM metric boards and more readily work together in a true customer-supplier fashion, as illustrated for Surgical Pathology, made improvements that spanned across the value stream and had great impact on the down-stream work result.
Let us address the perception that a process of daily rounding may be too time intensive. If left to an unstruc-tured process, that may be the case. The approach to DM that we describe provides a structure and process to a daily rounding or huddle at the DM board that is overseen by the manager/supervisor and engages those with delegated authority for daily analysis and presentation of select metrics. Several expectations contribute to brevity. First, a successful metric (a green day) is not discussed, just noted. Second, the meeting is conducted standing up as a rapid visual team review in front of the DM board with a goal of quickly documenting and assessing failures in key processes within the previous 24-hour interval. These DM process requirements maintain a focus on rapid meeting closure. Our experience is that the average DM meeting time expended is 2 to 10 minutes per day per DM board.
Time variation is attributed by unstable and failed pro-cesses that may require further sharing of information or questions that arise at the DM board with initial conversa-tions about next steps or subsequent root cause analysis or interventions to be tested. In addition, senior leaders who incorporate the DM board meetings into their gemba walks may prolong the regular daily huddle with additional con-versations with the staff.
Conclusion
We have found that DM is the key accountability sub-system for managers to continually improve their operations in a structured and visible manner. Strategy and policy can only go so far without quality delivered every day at the level of the work. As Henry Ford said in 1918, “Quality is what counts, and nothing but quality.”1 We have found DM to be an essential means of delivering on our organization’s quest to achieve ever higher levels of quality.
Corresponding author: Richard J. Zarbo, MD, DMD, Dept of Pathology and Laboratory Medicine, Henry Ford Hospital, 2799 West Grand Blvd, Detroit, MI 48202; [email protected].
Acknowledgments: The authors thank the leadership and educators of Danaher Corporation and Beckman Coulter for sharing elements of the Danaher Business System that we have adapted to develop our staff in fostering higher levels of sustained continuous improvement. The senior author gratefully recognizes Rita D’Angelo for her contributions over many years in defining and operationalizing the structures, processes, and systems on which this Lean laboratory culture operates with a focus on its people.
References 1. Albion MW. The Quotable Henry Ford. Gainesville:
University Press of Florida; 2013. 2. Zarbo RJ, D’Angelo R. Transforming to a quality culture:
the Henry Ford Production System. Am J Clin Pathol. 2006;126(suppl):S21-S29.
3. D’Angelo R, Zarbo RJ. The Henry Ford Production System: measures of process defects and waste in surgical pathology as a basis for quality improvement initiatives. Am J Clin Pathol. 2007;128:423-429.
4. Zarbo RJ, D’Angelo R. The Henry Ford Production System: effective reduction of process defects and waste in surgical pathology. Am J Clin Pathol. 2007;128:1015-1022.
5. Zarbo RJ. Creating and sustaining a Lean culture of continuous process improvement. Am J Clin Pathol. 2012;138:321-326.
6. Deming WE. Out of the Crisis. Cambridge, MA: MIT Press; 1986.
7. Liker JK. The Toyota Way: 14 Management Principles From the World’s Greatest Manufacturer. New York, NY: McGraw-Hill; 2004.

Zarbo et al / Daily Management System of the Henry Ford Production System
136 Am J Clin Pathol 2015;144:122-136 DOI: 10.1309/AJCPLQYMOFWU31CK
© American Society for Clinical Pathology
8. College of American Pathologists. Laboratory General Checklist. Northfield, IL: College of American Pathologists; 2014.
9. Liker JK, Convis GL. The Toyota Way to Lean Leadership. Achieving and Sustaining Excellence Through Leadership Development. New York, NY: McGraw-Hill; 2012.
10. Liker JK, Franz JK. The Toyota Way to Continuous Improvement: Linking Strategy and Operational Excellence to Achieve Superior Performance. New York, NY: McGraw-Hill; 2011.


![Henry Ford Presentation[1]](https://static.fdocuments.us/doc/165x107/577d35691a28ab3a6b9061a0/henry-ford-presentation1.jpg)