Daily equity-report by epic research 21 march 2013
4
HEADLINES Indian Market Indian equity markets were down 0.90% Nifty down by 51.55 pts and settle at 5694.40 Sensex down by 123.91 pts at 18884.19 Bank Nifty down by 253.15 pts at 11254.90 Global Market European markets were up with FTSE up by 1.12 closed at 6442 ,CAC up by 21.36 closed at 3797 and DAX up by 42.43 closed at 7990. Dow future was up 41.00 closed at 14429.00 WWW.EPICRESEARCH.CO 09752199966 DAILY EQUITY NEWSLETTER 21 ST MARCH 2013 HEADLINES • HDIL dismisses CARE ratings, stk at 52-wk low, down 50% YTD • Sugar stocks sour after CCEA defers decision on decontrol • Deal pipeline stronger; see more orders from US, UK: HCL • Bharti shares technically vulnerable: Analyst
-
Upload
epic-daily-report -
Category
Documents
-
view
47 -
download
0
Transcript of Daily equity-report by epic research 21 march 2013

-=6 HEADLINES
Indian Market
Indian equity markets were down 0.90%
Nifty down by 51.55 pts and settle at 5694.40
Sensex down by 123.91 pts at 18884.19
Bank Nifty down by 253.15 pts at 11254.90
Global Market
European markets were up with FTSE up by 1.12 closed at 6442 ,CAC up by 21.36 closed at 3797 and DAX up by 42.43 closed at 7990.
Dow future was up 41.00 closed at
14429.00
WWW.EPICRESEARCH.CO 09752199966
DAILY EQUITY NEWSLETTER
21ST MARCH 2013
HEADLINES
• HDIL dismisses CARE ratings, stk at
52-wk low, down 50% YTD
• Sugar stocks sour after CCEA defers
decision on decontrol
• Deal pipeline stronger; see more orders
from US, UK: HCL
• Bharti shares technically vulnerable:
Analyst
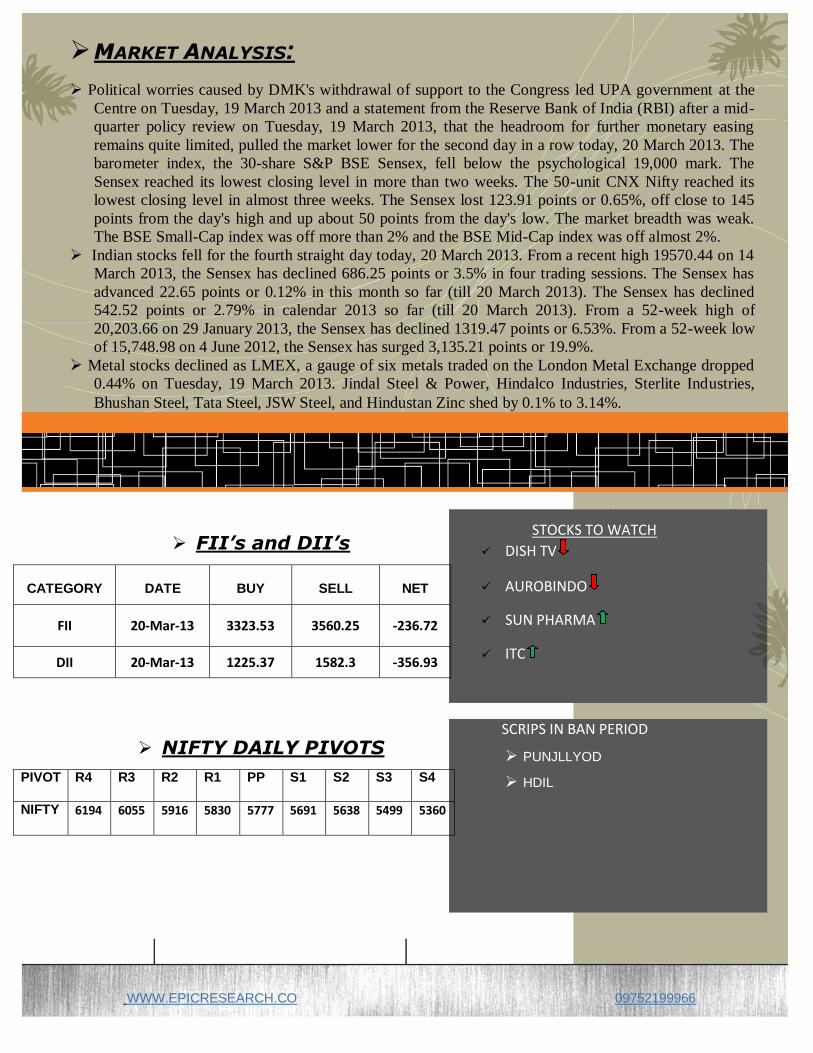
FII’s and DII’s
CATEGORY DATE BUY SELL NET
FII 20-Mar-13 3323.53 3560.25 -236.72
DII 20-Mar-13 1225.37 1582.3 -356.93
NIFTY DAILY PIVOTS
PIVOT R4 R3 R2 R1 PP S1 S2 S3 S4
NIFTY 6194 6055 5916 5830 5777 5691 5638 5499 5360
WWW.EPICRESEARCH.CO 09752199966
MARKET ANALYSIS:
Political worries caused by DMK's withdrawal of support to the Congress led UPA government at the
Centre on Tuesday, 19 March 2013 and a statement from the Reserve Bank of India (RBI) after a mid-
quarter policy review on Tuesday, 19 March 2013, that the headroom for further monetary easing
remains quite limited, pulled the market lower for the second day in a row today, 20 March 2013. The
barometer index, the 30-share S&P BSE Sensex, fell below the psychological 19,000 mark. The
Sensex reached its lowest closing level in more than two weeks. The 50-unit CNX Nifty reached its
lowest closing level in almost three weeks. The Sensex lost 123.91 points or 0.65%, off close to 145
points from the day's high and up about 50 points from the day's low. The market breadth was weak.
The BSE Small-Cap index was off more than 2% and the BSE Mid-Cap index was off almost 2%.
Indian stocks fell for the fourth straight day today, 20 March 2013. From a recent high 19570.44 on 14
March 2013, the Sensex has declined 686.25 points or 3.5% in four trading sessions. The Sensex has
advanced 22.65 points or 0.12% in this month so far (till 20 March 2013). The Sensex has declined
542.52 points or 2.79% in calendar 2013 so far (till 20 March 2013). From a 52-week high of
20,203.66 on 29 January 2013, the Sensex has declined 1319.47 points or 6.53%. From a 52-week low
of 15,748.98 on 4 June 2012, the Sensex has surged 3,135.21 points or 19.9%.
Metal stocks declined as LMEX, a gauge of six metals traded on the London Metal Exchange dropped
0.44% on Tuesday, 19 March 2013. Jindal Steel & Power, Hindalco Industries, Sterlite Industries,
Bhushan Steel, Tata Steel, JSW Steel, and Hindustan Zinc shed by 0.1% to 3.14%.
STOCKS TO WATCH
DISH TV
AUROBINDO
SUN PHARMA
ITC
SCRIPS IN BAN PERIOD
PUNJLLYOD
HDIL
WWW.EPICRESEARCH.CO 09752199966
.
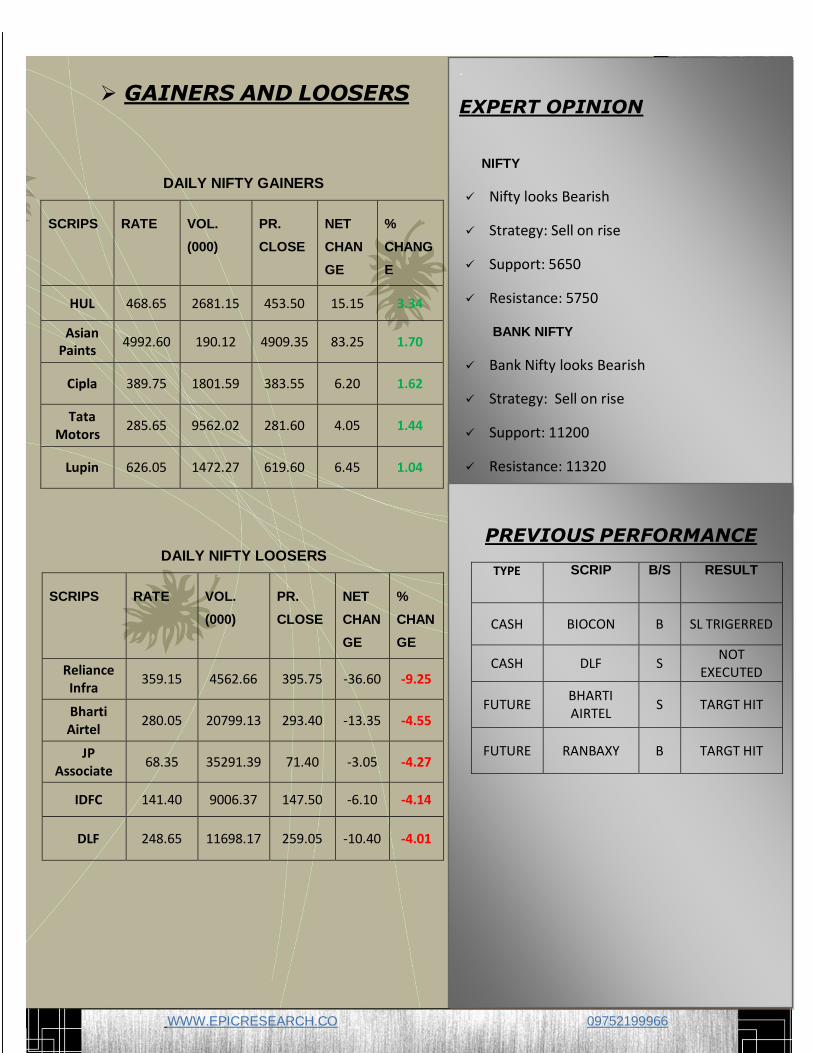
EXPERT OPINION
NIFTY
Nifty looks Bearish
Strategy: Sell on rise
Support: 5650
Resistance: 5750
BANK NIFTY
Bank Nifty looks Bearish
Strategy: Sell on rise
Support: 11200
Resistance: 11320
460
.0
GAINERS AND LOOSERS
PREVIOUS PERFORMANCE
TYPE SCRIP B/S RESULT
CASH BIOCON B SL TRIGERRED
CASH DLF S NOT
EXECUTED
FUTURE BHARTI AIRTEL
S TARGT HIT
FUTURE RANBAXY B TARGT HIT
DAILY NIFTY GAINERS
SCRIPS RATE VOL.
(000)
PR.
CLOSE
NET
CHAN
GE
%
CHANG
E
HUL 468.65 2681.15 453.50 15.15 3.34
Asian Paints
4992.60 190.12 4909.35 83.25 1.70
Cipla 389.75 1801.59 383.55 6.20 1.62
Tata Motors
285.65 9562.02 281.60 4.05 1.44
Lupin 626.05 1472.27 619.60 6.45 1.04
DAILY NIFTY LOOSERS
SCRIPS RATE VOL.
(000)
PR.
CLOSE
NET
CHAN
GE
%
CHAN
GE
Reliance Infra
359.15 4562.66 395.75 -36.60 -9.25
Bharti Airtel
280.05 20799.13 293.40 -13.35 -4.55
JP Associate
68.35 35291.39 71.40 -3.05 -4.27
IDFC 141.40 9006.37 147.50 -6.10 -4.14
DLF 248.65 11698.17 259.05 -10.40 -4.01
6
.
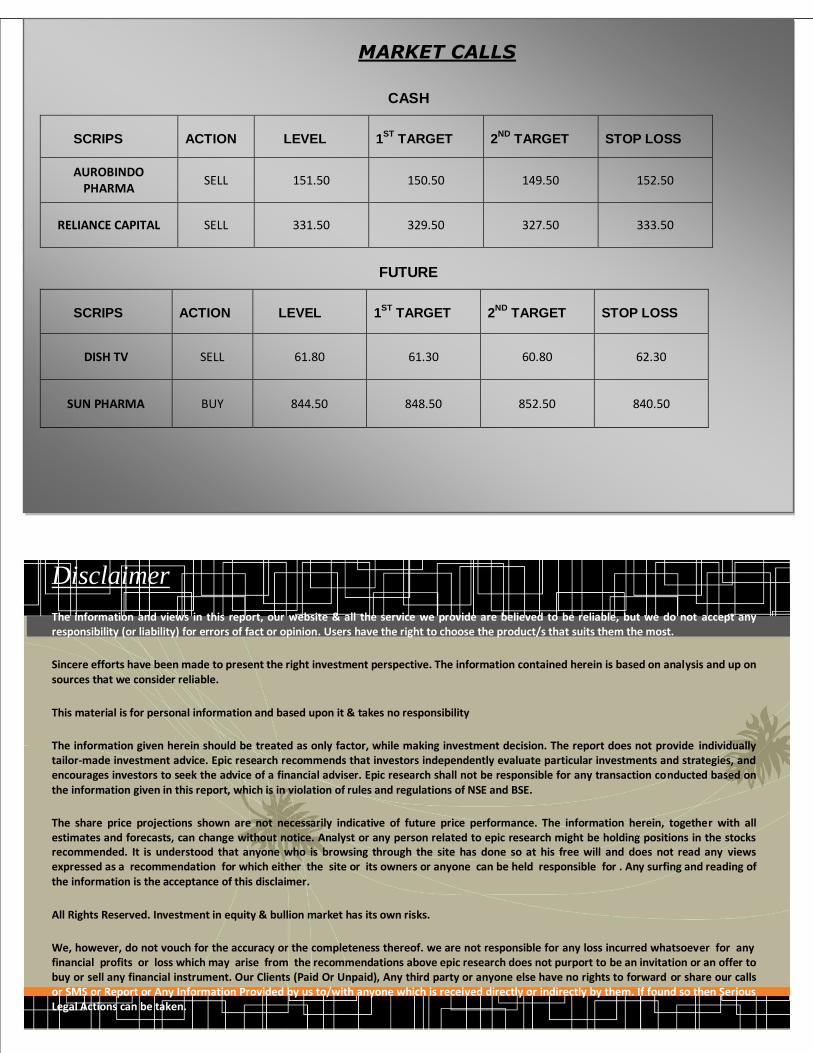
MARKET CALLS
CASH
SCRIPS ACTION LEVEL 1ST
TARGET 2ND
TARGET STOP LOSS
AUROBINDO PHARMA
SELL 151.50 150.50 149.50 152.50
RELIANCE CAPITAL SELL 331.50 329.50 327.50 333.50
FUTURE
SCRIPS ACTION LEVEL 1ST
TARGET 2ND
TARGET STOP LOSS
DISH TV SELL 61.80 61.30 60.80 62.30
SUN PHARMA BUY 844.50 848.50 852.50 840.50
Disclaimer
The information and views in this report, our website & all the service we provide are believed to be reliable, but we do not accept any responsibility (or liability) for errors of fact or opinion. Users have the right to choose the product/s that suits them the most.
Sincere efforts have been made to present the right investment perspective. The information contained herein is based on analysis and up on sources that we consider reliable.
This material is for personal information and based upon it & takes no responsibility
The information given herein should be treated as only factor, while making investment decision. The report does not provide individually tailor-made investment advice. Epic research recommends that investors independently evaluate particular investments and strategies, and encourages investors to seek the advice of a financial adviser. Epic research shall not be responsible for any transaction conducted based on the information given in this report, which is in violation of rules and regulations of NSE and BSE.
The share price projections shown are not necessarily indicative of future price performance. The information herein, together with all estimates and forecasts, can change without notice. Analyst or any person related to epic research might be holding positions in the stocks recommended. It is understood that anyone who is browsing through the site has done so at his free will and does not read any views expressed as a recommendation for which either the site or its owners or anyone can be held responsible for . Any surfing and reading of the information is the acceptance of this disclaimer.
All Rights Reserved. Investment in equity & bullion market has its own risks.
We, however, do not vouch for the accuracy or the completeness thereof. we are not responsible for any loss incurred whatsoever for any financial profits or loss which may arise from the recommendations above epic research does not purport to be an invitation or an offer to buy or sell any financial instrument. Our Clients (Paid Or Unpaid), Any third party or anyone else have no rights to forward or share our calls or SMS or Report or Any Information Provided by us to/with anyone which is received directly or indirectly by them. If found so then Serious Legal Actions can be taken.