Daily equity report
-
Upload
money-capitalheight-research-pvt-ltd -
Category
Documents
-
view
215 -
download
2
description
Transcript of Daily equity report

Daily Newsletter07/07/2011
Daily Newsletter-Equity
www.capitalheight.com
ww.capitalheight.com
www.capitalheight.com
capitalheight.wordpress.com
Phone- (0731)4295950
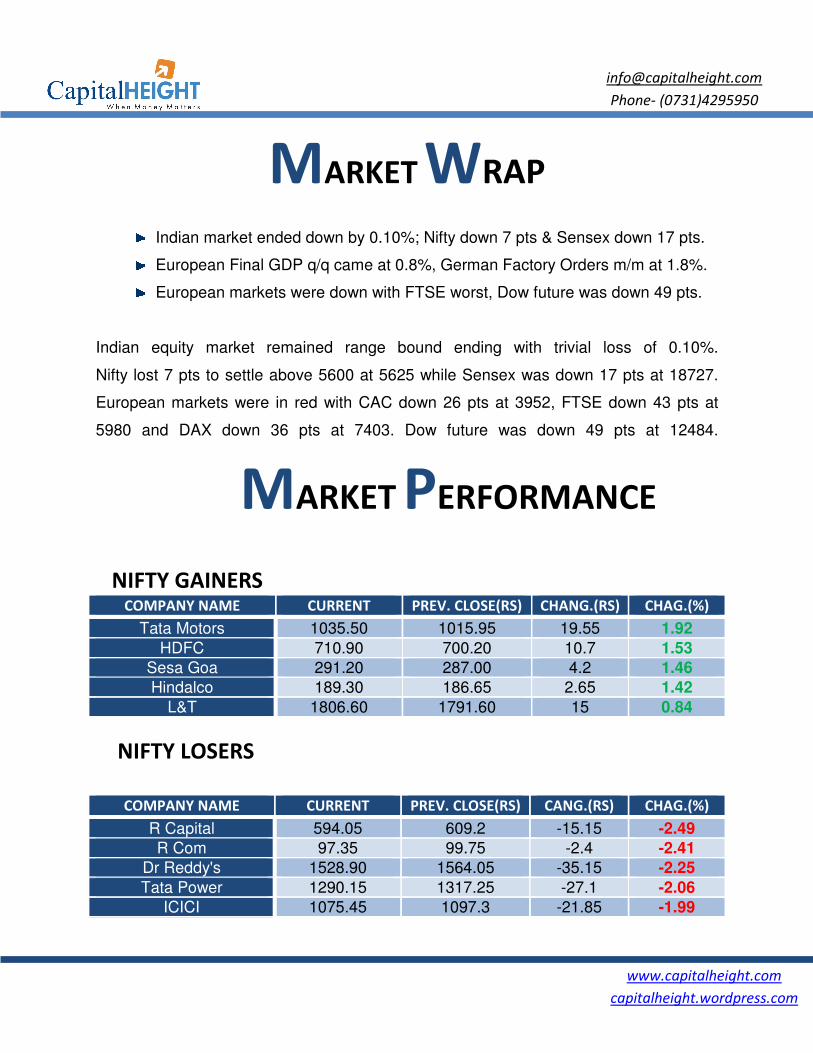
MARKET WRAP
Indian market ended down by 0.10%; Nifty down 7 pts & Sensex down 17 pts.
European Final GDP q/q came at 0.8%, German Factory Orders m/m at 1.8%.
European markets were down with FTSE worst, Dow future was down 49 pts.
Indian equity market remained range bound ending with trivial loss of 0.10%.
Nifty lost 7 pts to settle above 5600 at 5625 while Sensex was down 17 pts at 18727.
European markets were in red with CAC down 26 pts at 3952, FTSE down 43 pts at
5980 and DAX down 36 pts at 7403. Dow future was down 49 pts at 12484.
MARKET PERFORMANCE
NIFTY GAINERS COMPANY NAME CURRENT PREV. CLOSE(RS) CHANG.(RS) CHAG.(%)
Tata Motors 1035.50 1015.95 19.55 1.92
HDFC 710.90 700.20 10.7 1.53
Sesa Goa 291.20 287.00 4.2 1.46
Hindalco 189.30 186.65 2.65 1.42
L&T 1806.60 1791.60 15 0.84
NIFTY LOSERS
COMPANY NAME CURRENT PREV. CLOSE(RS) CANG.(RS) CHAG.(%)
R Capital 594.05 609.2 -15.15 -2.49
R Com 97.35 99.75 -2.4 -2.41
Dr Reddy's 1528.90 1564.05 -35.15 -2.25
Tata Power 1290.15 1317.25 -27.1 -2.06
ICICI 1075.45 1097.3 -21.85 -1.99

www.capitalheight.com
capitalheight.wordpress.com
Phone- (0731)4295950
SECTORIAL INDICES
INDEX P.CLOSE OPEN HIGH LOW LAST % CHANGE
S&P CNX NIFTY 5632.10 5622.70 5655.40 5610.75 5625.45 -0.12
CNX NIFTY JUNIOR
11397.15 11407.75 11443.35 11382.10 11415.75 0.16
CNX IT 6708.40 6695.25 6748.20 6672.25 6704.10 -0.06
BANK NIFTY 11406.10 11379.20 11404.70 11255.05 11283.05 -1.08
INDIA VIX 18.25 18.25 18.49 18.12 18.34 0.49
CNX 100 5554.25 5546.60 5576.70 5536.60 5550.30 -0.07
S&P CNX DEFTY 4392.05 4384.65 4417.50 4375.70 4387.45 -0.10
S&P CNX 500 4537.10 4532.05 4555.30 4524.55 4535.30 -0.04
CNX MIDCAP 8068.90 8069.20 8099.20 8057.15 8080.95 0.15
NIFTY MIDCAP 50 2458.00 2464.30 2471.75 2456.75 2466.80 0.36
CNX INFRA 3097.25 3091.20 3115.25 3091.20 3100.85 0.12
CNX REALTY 283.15 282.70 287.00 282.15 284.80 0.58
CNX ENERGY 8398.45 8397.30 8448.40 8355.15 8403.20 0.06
CNX FMCG 10157.50 10141.60 10203.80 10104.55 10168.65 0.11
CNX MNC 5077.15 5064.50 5104.35 5049.65 5056.25 -0.41
CNX PHARMA 4821.95 4826.20 4838.75 4787.20 4795.60 -0.55
CNX PSE 3413.60 3408.00 3430.05 3398.80 3406.50 -0.21
CNX PSU BANK 4008.15 4005.65 4005.65 3961.70 3972.15 -0.90
CNX SERVICE 6955.70 6935.95 6976.85 6915.15 6932.30 -0.34

www.capitalheight.com
capitalheight.wordpress.com
Phone- (0731)4295950
NSE STATS
ADVANCES 17
DECLINES 33
UNCHANGED 0
INDEX MOVERS (PULLING IT UP)
COMPANY NAME CONTRIBUTION
RIL 14.62
HDFC 14.16
L&T 10.45
Tata Motors 7.36
ITC 4.74
INDEX MOVERS (PULLING IT DOWN)
COMPANY NAME CONTRIBUTION
ICICI -31.29
SBI -10.22
ONGC -6.73
Tata Power -5.52
HUL -4.93
VOLUME SHOCKERS
Company Name Last Price % Chg Last Volume Prev Volume % Chg
Spice Mobility 114.15 10.13 788663.00 4483.00 17492.00
Phoenix Mills 199.40 2.70 625396.00 12599.00 4864.00
Jindal Cotex 113.10 8.44 622745.00 19254.00 3134.00
Sasken Comm 149.80 10.39 1829389.00 57939.00 3057.00
Spanco 141.55 2.46 63597.00 2025.00 3041.00

www.capitalheight.com
capitalheight.wordpress.com
Phone- (0731)4295950
FII TRADING ACTIVITY (NSE & BSE) In Crores
CATEGORY DATE BUY VALUE SELL VALUE NET VALUE
FII 06-JUL-2011 2076.04 1855.59 220.45
DII TRADING ACTIVITY (NSE & BSE) In Crores
CATEGORY DATE BUY VALUE SELL VALUE NET VALUE
DII 06-JUL-2011 991.95 1072.18 -80.23
F&O TRADE STATISTICS
PRODUCT NO OF CONTRACTS TURNOVER IN RS. CR. PUT CALL RATIO
Index Futures 294708.00 7836.33 -
Stock Futures 388850.00 11295.21 -
Index Options 1464383.00 41507.26 1.05
Stock Options 98303.00 2809.87 0.37
F&O Total 2246244.00 63448.67 0.99
ASIAN MARKETS
Name Open High Low Current Value Change % Chg
Nikkei 225 9987.25 10082.48 9967.87 10082.48 110.02 1.09
Hang Seng 22645.35 22737.50 22509.18 22517.55 -230.40 -1.02
Taiwan 8790.94 8842.17 8768.35 8824.44 40.00 0.45
KOSPI 2156.94 2171.19 2155.33 2171.19 9.44 0.43
Jakarta 3923.67 3933.02 3890.55 3908.96 -15.17 -0.39

TECHNICAL
DAILY PIVOT
SCRIPT R4 R3
NIFTY 6120 5942
OUTLOOK
Trend: - Consolidate
Resistance: - 5670
Support: - 5600, 55
Strategy: - Buy on dips
ECHNICAL VIEW
NIFTY
R2 R1 P S1 S2
5764 5694 5586 5516 5408
Consolidate
0, 5720
, 5550
Buy on dips
NIFTY DAILY
www.capitalheight.com
capitalheight.wordpress.com
Phone- (0731)4295950
S2 S3 S4
5408 5230 5052

DAILY PIVOT
SCRIPT R4 R3
BANK NIFTY 11836 11673
OUTLOOK
Trend: - Consolidate
Resistance: - 1144
Support: - 11220,
Strategy: - Buy on Dips
BANK NIFTY
R2 R1 P S1 S2
11673 11510 11412 11347 11249 11184
Consolidate
11440, 11590
, 11100
Buy on Dips
BANK NIFTY DAILY
www.capitalheight.com
capitalheight.wordpress.com
Phone- (0731)4295950
S2 S3 S4
11184 11021 10858

Stock
CapitalHeight’s stock recommendation for
Titan Industries has been in overall uptrend since
making higher top and higher
daily chart has taken support of its long standing support trendline drawn from bottom
of Feb 2011 and reversed. The stock is set to mak
Our recommendation on Titan Industries
tock Recommendation
stock recommendation for 07/07/2011 is Titan Industries.
Titan Industries has been in overall uptrend since Feb 2011 and it is
higher bottom irrespective of market cues. The stock on
daily chart has taken support of its long standing support trendline drawn from bottom
and reversed. The stock is set to make a new higher top at around 240
Titan Industries is BUY above 225 for the TG 226.50
www.capitalheight.com
capitalheight.wordpress.com
Phone- (0731)4295950
ecommendation
Titan Industries.
and it is continuously
The stock on the
daily chart has taken support of its long standing support trendline drawn from bottom
around 240
226.50 – 229.

www.capitalheight.com
capitalheight.wordpress.com
Phone- (0731)4295950
Disclaimer
The information and views in this report, our website & all the service we provide are believed to be reliable, but we do not
accept any responsibility (or liability) for errors of fact or opinion. Users have the right to choose the product/s that suits
them the most.
Sincere efforts have been made to present the right investment perspective. The information contained herein is based on
analysis and up on sources that we consider reliable.
This material is for personal information and based upon it & takes no responsibility
The information given herein should be treated as only factor, while making investment decision. The report does not
provide individually tailor-made investment advice. Capitalheight recommends that investors independently evaluate
particular investments and strategies, and encourages investors to seek the advice of a financial adviser. Capitalheight shall
not be responsible for any transaction conducted based on the information given in this report, which is in violation of rules
and regulations of NSE and BSE.
The share price projections shown are not necessarily indicative of future price performance. The information herein,
together with all estimates and forecasts, can change without notice. Analyst or any person related to Capitalheight might be
holding positions in the stocks recommended. It is understood that anyone who is browsing through the site has done so at
his free will and does not read any views expressed as a recommendation for which either the site or its owners or
anyone can be held responsible for . Any surfing and reading of the information is the acceptance of this disclaimer.
All Rights Reserved.
Investment in Commodity and equity market has its own risks.
We, however, do not vouch for the accuracy or the completeness thereof. we are not responsible for any loss incurred
whatsoever for any financial profits or loss which may arise from the recommendations above. Capital height does not
purport to be an invitation or an offer to buy or sell any financial instrument. Our Clients (Paid Or Unpaid), Any third party or
anyone else have no rights to forward or share our calls or SMS or Report or Any Information Provided by us to/with anyone
which is received directly or indirectly by them. If found so then Serious Legal Actions can be taken.