Dadi Sverrisson Peter C. Boxall Vic Adamowicz · Dadi Sverrisson Peter C. Boxall Vic Adamowicz...
53
Benefits and Costs of Expanding the Protected Area Network in Southern Ontario Dadi Sverrisson Peter C. Boxall Vic Adamowicz Department of Rural Economy University of Alberta
Transcript of Dadi Sverrisson Peter C. Boxall Vic Adamowicz · Dadi Sverrisson Peter C. Boxall Vic Adamowicz...

Benefits and Costs of Expanding the Protected Area Network in Southern
Ontario
Dadi Sverrisson
Peter C. Boxall
Vic Adamowicz
Department of Rural Economy
University of Alberta

General Context
• What makes southern Ontario so special?
Biodiversity in Canada Biodiversity in Ontario
Species RichnessNumber of birds, mammals, reptiles & amphibians, rare & endemic plants

Human Activity in the Mixedwood Plains
d • High human population density• Economic prosperity• Major industries:
• Tourism• Manufacturing• Financial services• Food and beverages• Agriculture
• Agriculture:•Rich soils and beneficial climate• 56,000 farms • Quarter of all farm revenue in Canada

Current Situation Regarding Protected Areas
• The map above shows the level of protected area coverage in Ontario:• Lighter shades of green show low coverage• Darker shades of green show high coverage
• Mixedwood Plains have the lowest coverage of protected areas in Ontario• 630 km2 or approximately 0.6% of the Mixedwood Plains are currently protected

Institutional Framework
• Ontario Parks (OP) invest public funds to acquire protected areas– Some private organizations do also (e.g. Nature Conservancy)
• Protected area selection criteria:– 1% or 50 hectares of every land/vegetation association in the Mixedwood Plains
• Three main methods of acquiring properties:– Direct purchase– Donations– Conservation easements

Possible Benefits from Expanding Protected Areas
• Increased outdoor recreation opportunities
• Natural habitats for healthy populations of flora and fauna
• Availability of places to maintain ecological processes
• Potential for stimulation of local economies through increased tourism
• Enhancement of educational opportunities
Possible Costs of Expanding Protected Areas
• Limits on certain outdoor recreation activities
• Restrictions on land development within reserves
• Limits placed on urban development
• Potentially slower growth in the Ontario economy
• Government costs of expanding the protected area network

Passive Use Benefit Estimation• Involves outlining policy framework(s) for achieving this and couching this framework in trade‐offs
• CVM is a good approach for this– “Would you agree with the policy or program if it provided X at cost $Y?”
• Need potential policies and estimates of costs• Must use survey approaches• Issues – strategic bias, uncertain policies, heterogeneity in preferences

Survey Design Guidelines1. Overview of the general context in which the
public good will be delivered2. Detailed description of the current situation3. Institutional framework4. Define changes in quality for the public good5. Credible payment mechanism that can help
reduce strategic bias6. Pre‐briefing material7. Valuation scenarios8. Debriefing questions9. Focus groups and pre‐tests

Context
THE FUTURE OF PROTECTED AREASIN THE MIXEDWOOD PLAINS
We want to know how much effort you believe should be spent on conserving the natural environment in the Mixedwood Plains.
In the next section, you will be asked to vote …. on the future amount of protected areas in southern Ontario.
For each vote, you will be asked to choose between two differentalternatives:Current situation: Maintaining the existing amount of protected land in the Mixedwood Plains
Proposed program: Increasing the amount of protected land within the Mixedwood Plains.
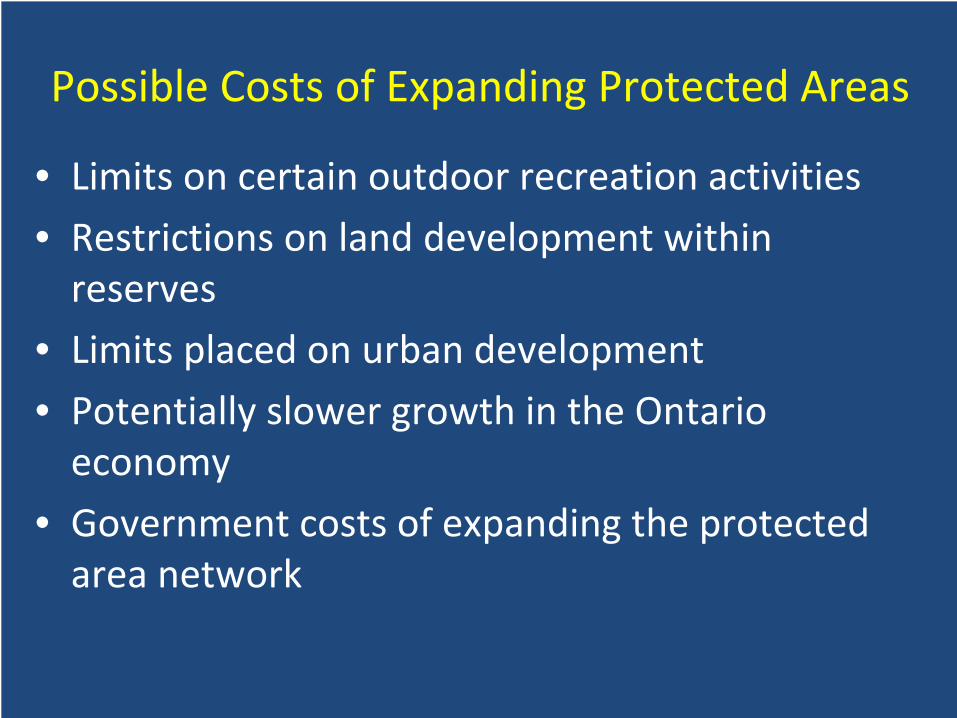
Define Changes in Quality
The proposed program as well as the current situation was described by three characteristics:
• Protected area targets
• Year when protected area target is reached
• Annual investment of public funds.

1. Protected area targetsTo achieve adequate natural habitat representation in the Mixedwood Plains a protected area coverage target may be set by the Ontario Ministry of Natural Resources. The targets can range from 1% - 12% (1,050 km2 – 12,600 km2) of the total area of land in the Mixedwood Plains being protected.
2. Year when protected area target is reachedThe year when the protected area target is reached indicates the time taken to reach the protected areas target. This time frame can range from 10-20 years.Time to complete the proposed protected area expansion will depend on the availability of suitable land and the amount of available funds for land acquisition.
3. Annual investments of public fundsUnder each vote the proposed program will carry a price tagThe price tag represents your household’s annual share of the investment in protected areas by the Ontario Parks partnership over the next five years. Your household’s share of the annual investment will be paid through a one timeincrease in your household taxes that remains for the next 5 years, 2007-2011. The collected funds will be used for the sole purpose of funding a protected area expansion in the Mixedwood Plains.
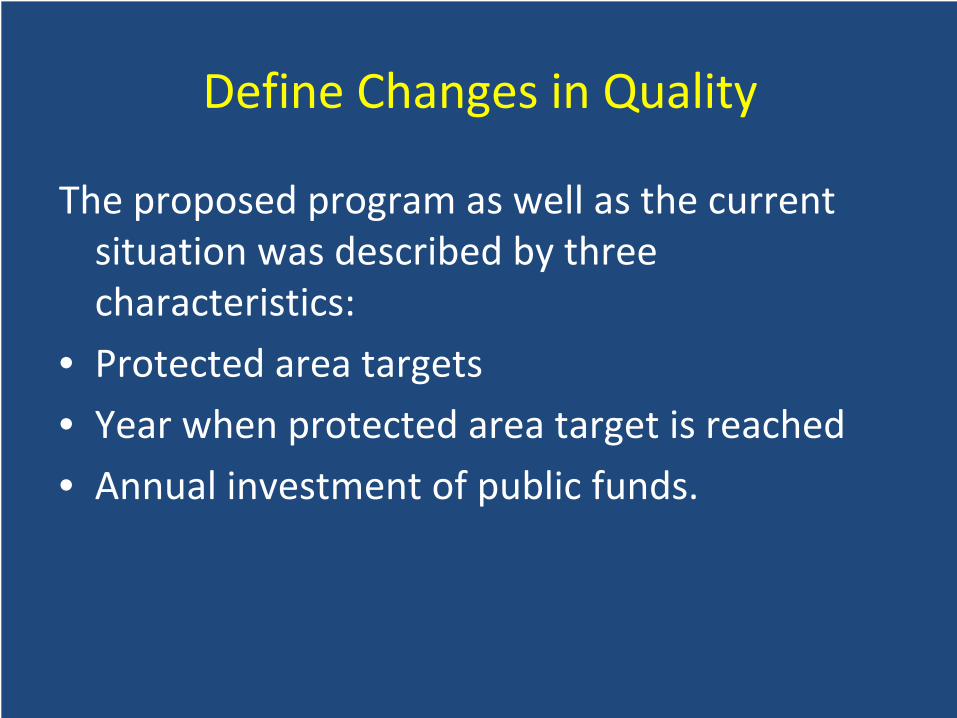
Payment Vehicle• Carefully designed payment vehicles reduce strategic behaviour
• Needs to credibly impose costs on all agents– Tax based payment vehicles do this
– Note the context is also a referendum
– both are incentive compatible
• For the study:– Referendum for a 5 year tax on every household in Ontario

Valuation Scenarios• Each respondent votes 8 times between the current situation and a proposed program– Binary choice valuation format– Is it CVM or choice experiment?
• Attributes and levels describing the proposed programs:– Protected area targets:
• 1% ‐ 5% ‐ 12%
– Year when protected area target is reached:• 2016 or 2026
– Price (Tax imposed) of the proposed program• $20 ‐ $60 ‐ $175 ‐ $325
• All combinations of attribute levels for proposed program resulted in 24 different possible votes– Blocked into 3 versions of 8 votes

Sample Valuation Scenario
Protected area targets
0.6% (630 km2) of the Mixedwood Plains protected
12% (12,600 km2 approx.) of the Mixedwood Plains protected

Pre‐Briefing ScriptReminder of Alternatives
When considering the votes please keep in mind:
Some people might choose to vote to keep the current situation because they think:
Other people might choose one of the proposed program options because they think:
Cheap Talk Script
PLEASE NOTE: Research has shown that how people vote on a survey is often not a reliable indication of how people would actually vote at the polls. In surveys, some people ignore the monetary and other sacrifices they would really have to make if their vote won a majority and became law. We call this hypothetical bias. In surveys that ask people if they would pay more for certain services, research has found that people may say that they would pay 50% more than they actually will in real transactions.It is very important that you “vote” as if this were a real vote. You need to imagine that you actually have to dig into your household budget and pay the additional costs.
Reminder of what is to follow and to treat each vote independently
You will now vote 8 timesAssume that the options on EACH SCREEN are the ONLY ones availableEach time, please vote independently from the other votes - do not compare options on different screens

Debriefing Questions
• Certainty questions after each vote– How certain are you of your vote?
• Very Certain ‐ Somewhat Certain ‐ Somewhat Uncertain ‐Very Uncertain
– Recode uncertain “Yes’s” to “No’s”• Which attributes were important in voting?
– Time frame of the proposed expansion not important– Very important attributes:
• Price of the proposed programs (taxes)• Size of the proposed expansion (% coverage)
• Yea‐sayers identified and removed– “I believe we should protect the natural environment regardless
of the cost”

Focus Groups and Pre‐Tests
• Vital process in the survey design• Four public and expert focus groups were facilitated in November 2006– Student focus group at the University of Alberta– Expert focus group with Ontario Parks staff in Peterborough
– Public focus groups in Peterborough and Thunder Bay– Would have liked to do more
• Internet panel pilot (N=157) randomly chosen Ontarians in February 2007

Why Focus Groups and Pre‐tests?
1. Ability to test language, information provision, format etc.
2. Examine “bid‐levels” in the valuation approach
• Need to set appropriate distribution of tax levels• Choke off demand at high end
• lots of NO votes for highest taxes• Lots of YES votes for lowest tax levels• Shape of the Bid Curve

Data• Internet panel provided by Ipsos Reid
• Sample representative of the public of Ontario– 1,629 participants
– 120 (8.5%) from Northern Ontario
• 8 votes per respondent – 13,032 observations or votes
• Uncertain questions treated as No´s
• 223 yea‐sayers removed– 11,248 final sample size for estimation

Analysis and Issues• Binary response variable
– YES (new program) NO (current situation)– Must use Logit/Probit models – dependent variable is the probability of a YES vote
• Multiple observations from an individual– 8 votes per respondent– Panel regression procedures
• Functional form of the coverage variable– What “shape” should the (value per) coverage variable be?
• Linear, Logarithmic, Quadratic

Basic Econometric Modeling Results
• Use just the “design” variables– Coverage, timing and price
• Include demographic variables– Income, male, age, no. of kids in hshld, resident of Northern Ontario
• Include possibly “endogenous” variables– membership in enviro orgs, visited a protected area in southern Ontario, attitudinal score on New Environmental Paradigm Scale

Econometric Results
• Most results as expected!!• Tax negative and highly significant
– People do not like to pay taxes
• Coverage positive and highly significant– Increased PA coverage is preferred
• Timing (complete network in 2026) negative but not significant– Weak evidence for sooner rather than later– Note: we will delve into this in more detail later

Results continued
• Income positive and significant– Higher incomes tend to vote for the expansion
• Dummy variable for being Male negative and significant– Men tend to vote against the expansion
• Age negative and significant– Older people tend to vote against the expansion
• No of kids negative and significant– Households with more kids tend to vote against expansion
• Northern residency negative and insignificant– Weak evidence for folks in the north tending to vote againstexpansion

• Members of environmental orgs positive and significant– Members tend to vote for the expansion
• Visiting a PA in southern Ontario positive and significant– Visitors tend to vote for the expansion
• NEP score parameter positive and significant– Those with more intense environmental attitudes tend to vote for the expansion
Results continued
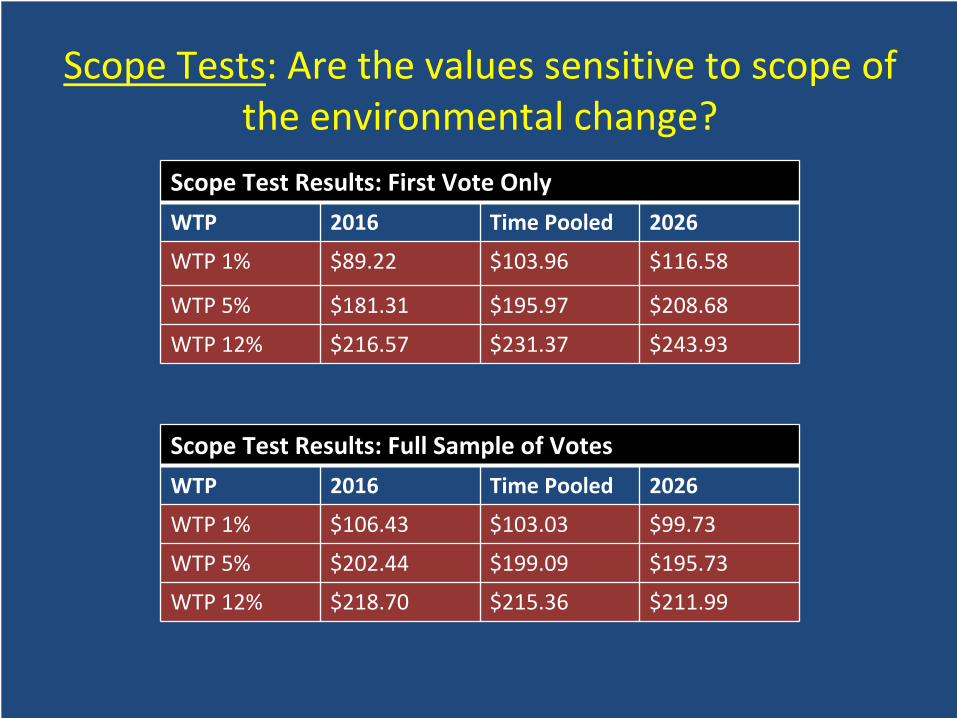
Scope Tests: Are the values sensitive to scope of the environmental change?
Scope Test Results: First Vote Only
WTP 2016 Time Pooled 2026
WTP 1% $89.22 $103.96 $116.58
WTP 5% $181.31 $195.97 $208.68
WTP 12% $216.57 $231.37 $243.93
Scope Test Results: Full Sample of Votes
WTP 2016 Time Pooled 2026
WTP 1% $106.43 $103.03 $99.73
WTP 5% $202.44 $199.09 $195.73
WTP 12% $218.70 $215.36 $211.99

Benefit Estimates• Using logarithmic form of coverage the WTP per household
once a year for five years – $108.18 for a 1% expansion – $183.99 for a 5% expansion – $225.46 for a 12% expansion – SDs of these estimates ranged from $3.31‐$5.10/household
• Translated to an aggregated present value of WTP– $2.2 billion for the 1%– $3.7 billion for the 5%– $4.5 billion for the 12% expansion.
• Low SDs reflect a high level of statistical significance of the coverage and price variables
• Choices made by respondents were generally consistent over the levels of price and coverage in the valuation scenarios.
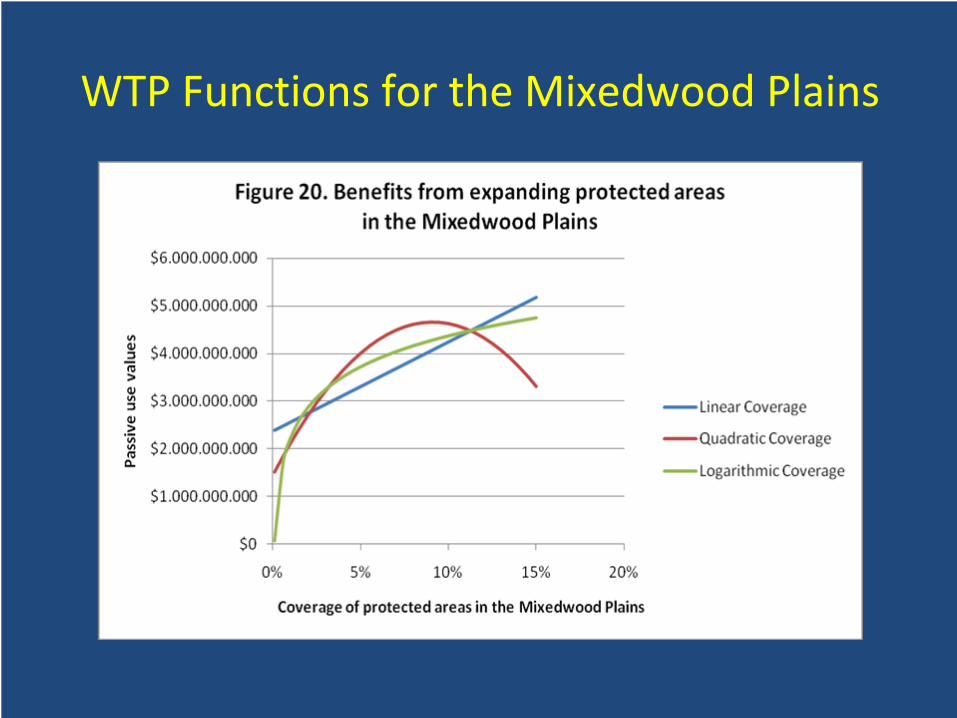
WTP Functions for the Mixedwood Plains

More Detailed Econometric Results
• Uncomfortable with the timing parameter– Recall was negative (~ ‐0.04) and insignificantly different than 0
• Re‐estimate model where timing variable specified as random normal– Parameter on the mean = 0.014478, P>0.6882
– Parameter on the SD = 1.484945, P<<<0.001
– Thus large heterogeneity in preferences for the timing effect
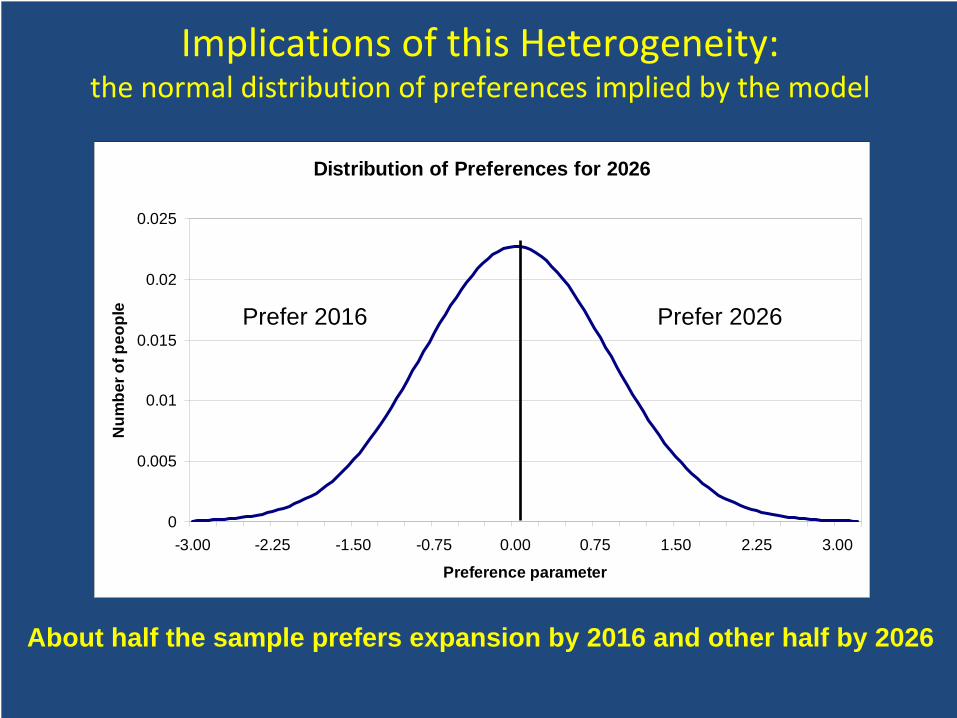
Implications of this Heterogeneity:the normal distribution of preferences implied by the model
Distribution of Preferences for 2026
0
0.005
0.01
0.015
0.02
0.025
-3.00 -2.25 -1.50 -0.75 0.00 0.75 1.50 2.25 3.00
Preference parameter
Num
ber o
f peo
ple
About half the sample prefers expansion by 2016 and other half by 2026
Prefer 2026Prefer 2016

Costs of Protected Area Expansion
• Need an explicit “scenario” in which to apply the benefits and compare the costs
• Since OMNR has explicit targets for expansion we chose a specific Ecodistrict – 6E‐12– Near Ottawa in eastern Ontario– Comprises counties: Ottawa, Stormont, Dundas,
Glengarry, Prescott and Russell• OMNR then identified “desired” areas using their systems and procedures– At various levels of coverage
• Current protected area coverage in 6E‐12 is 0.1%
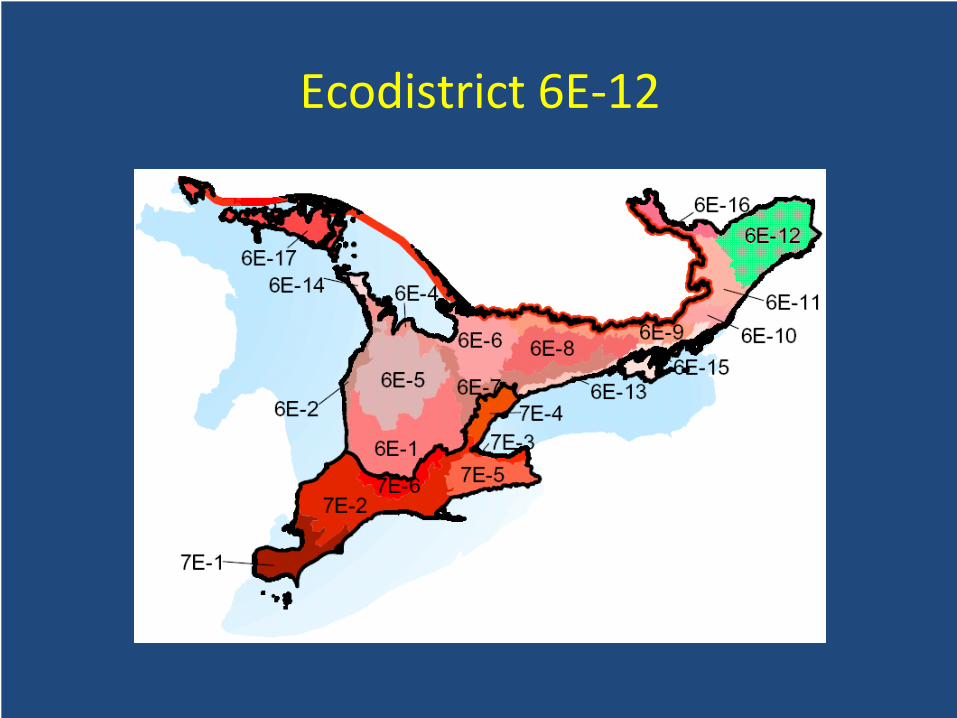
Ecodistrict 6E‐12
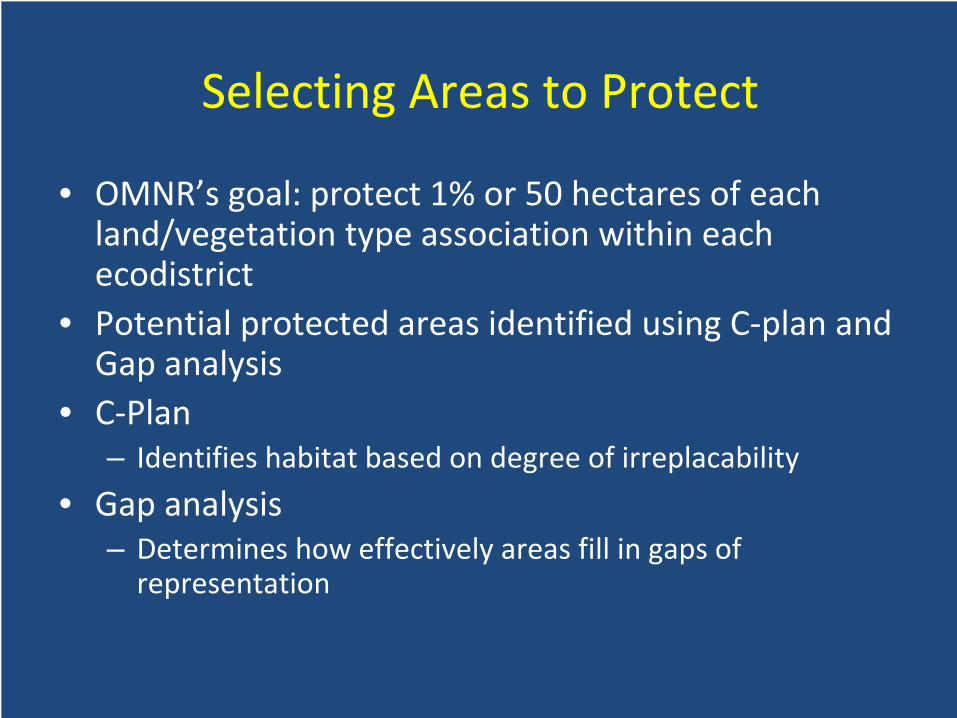
Selecting Areas to Protect
• OMNR’s goal: protect 1% or 50 hectares of each land/vegetation type association within each ecodistrict
• Potential protected areas identified using C‐plan and Gap analysis
• C‐Plan– Identifies habitat based on degree of irreplacability
• Gap analysis– Determines how effectively areas fill in gaps of representation

Enduring Features (L/V) Representation in Ecodistrict 6E‐12

Future protected areas in 6E‐12
• 28 parcels covering 9.31% of 6E‐12

What Would it Cost?Information from a Close Representative Study!
• Greenbelt study by Richard Vynn (2007) as part of his Ph.D dissertation
• Data from the Municipal Property Assessment Corporation
• Data range: southern Ontario from Lake Huron to Northumberland and Peterborough counties
• 1,935 sales of vacant agricultural land

Vyn Used the Hedonic Pricing Method
• Widely used to estimate property values using actual sales
• Land values can be divided into a set of characteristics– Location– Environmental amenities– Population density– Acreage– Etc.
• Some characteristics are more “valuable” than others
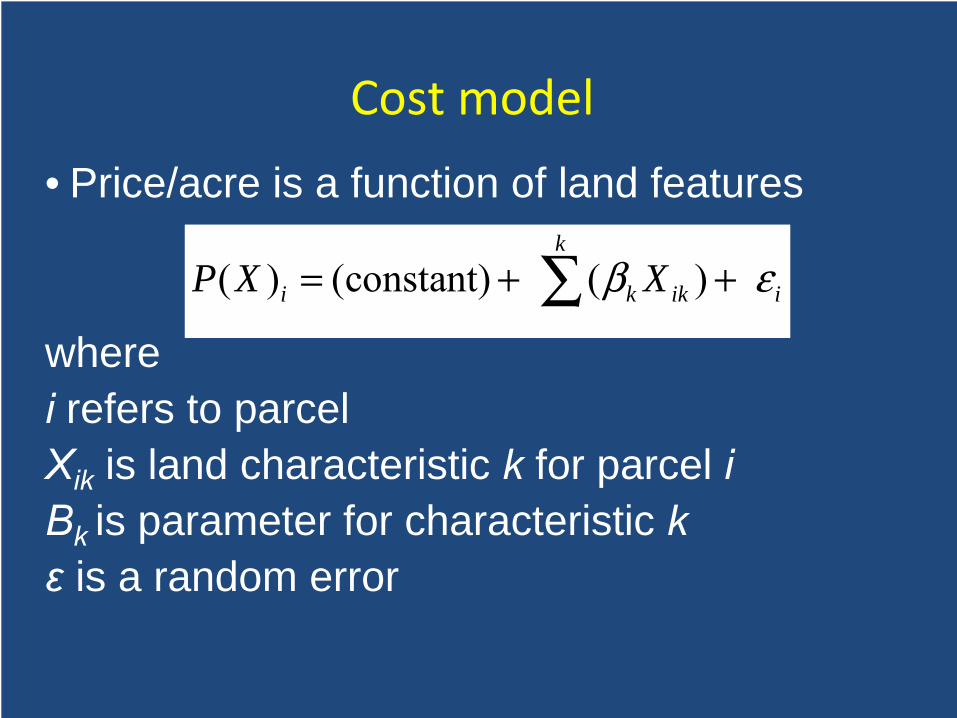
Cost model
• Price/acre is a function of land features
wherei refers to parcelXik is land characteristic k for parcel iΒk is parameter for characteristic kε is a random error
( ) (constant) ( ) k
i k ik iP X Xβ ε= + +∑
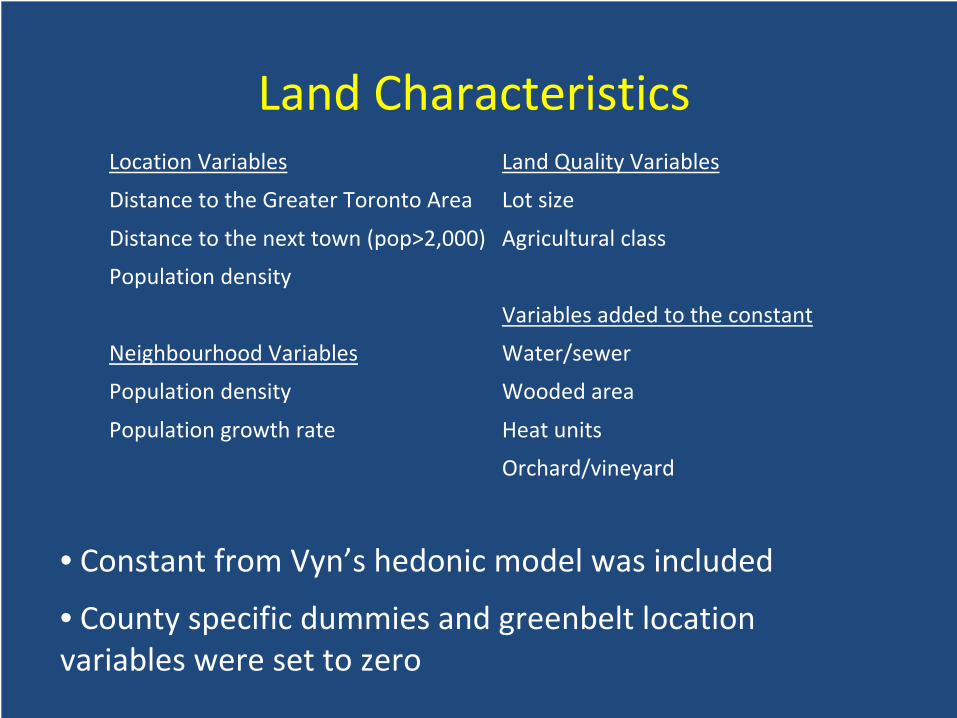
Land CharacteristicsLocation Variables Land Quality Variables
Distance to the Greater Toronto Area Lot size
Distance to the next town (pop>2,000) Agricultural class
Population density
Variables added to the constant
Neighbourhood Variables Water/sewer
Population density Wooded area
Population growth rate Heat units
Orchard/vineyard
• Constant from Vyn’s hedonic model was included
• County specific dummies and greenbelt location variables were set to zero

Cost Calibration I
• 28 protected area parcels in ecodistrict 6E‐12
• Total acreage of all 28 parcels = T
• Weight factor:
• Weighted average:
ii
acreagewT
=
28
1( / )i i
iWA w price acre
=
= ∗∑

Cost Calibration II
• Calibration factor = CF
• CF is added to the constant
• Choose CF so that WA = X$/acre
( ) (constant+CF) ( ) k
i k ik iP X Xβ ε= + +∑
Ottawa(in 6E-12)
Durham
Stormont, Dundas & Glengarry
(in 6E-12)
Peterborough
Prescott &
Russell(in 6E-12)
Northumberland
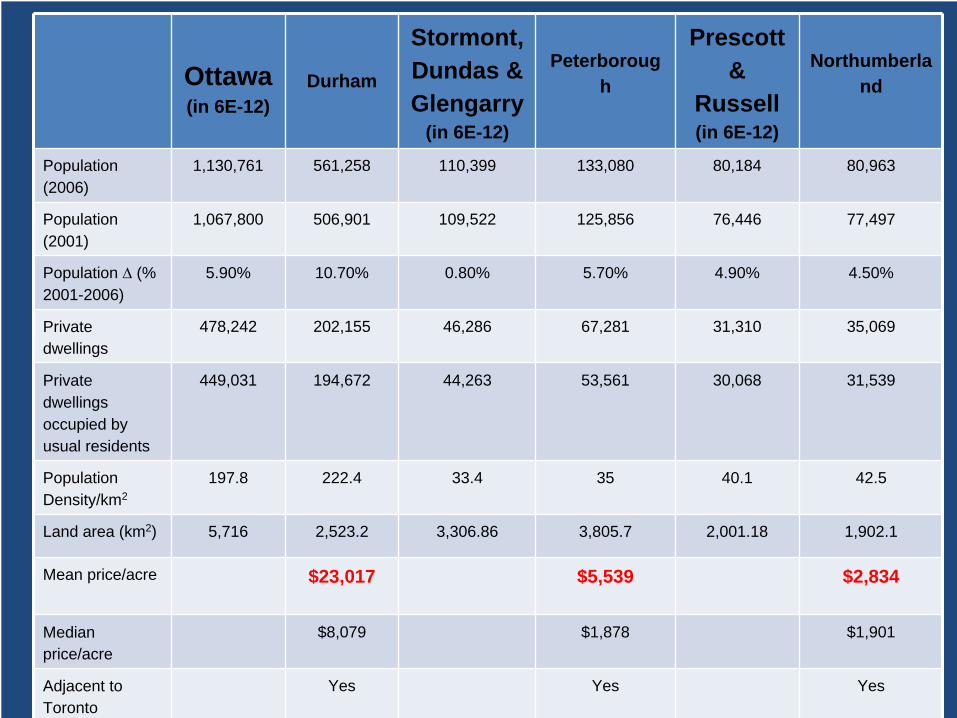
Population(2006)
1,130,761 561,258 110,399 133,080 80,184 80,963
Population (2001)
1,067,800 506,901 109,522 125,856 76,446 77,497
Population ∆ (% 2001-2006)
5.90% 10.70% 0.80% 5.70% 4.90% 4.50%
Private dwellings
478,242 202,155 46,286 67,281 31,310 35,069
Private dwellings occupied by usual residents
449,031 194,672 44,263 53,561 30,068 31,539
Population Density/km2
197.8 222.4 33.4 35 40.1 42.5
Land area (km2) 5,716 2,523.2 3,306.86 3,805.7 2,001.18 1,902.1
Mean price/acre $23,017 $5,539 $2,834
Median price/acre
$8,079 $1,878 $1,901
Adjacent to Toronto
Yes Yes Yes
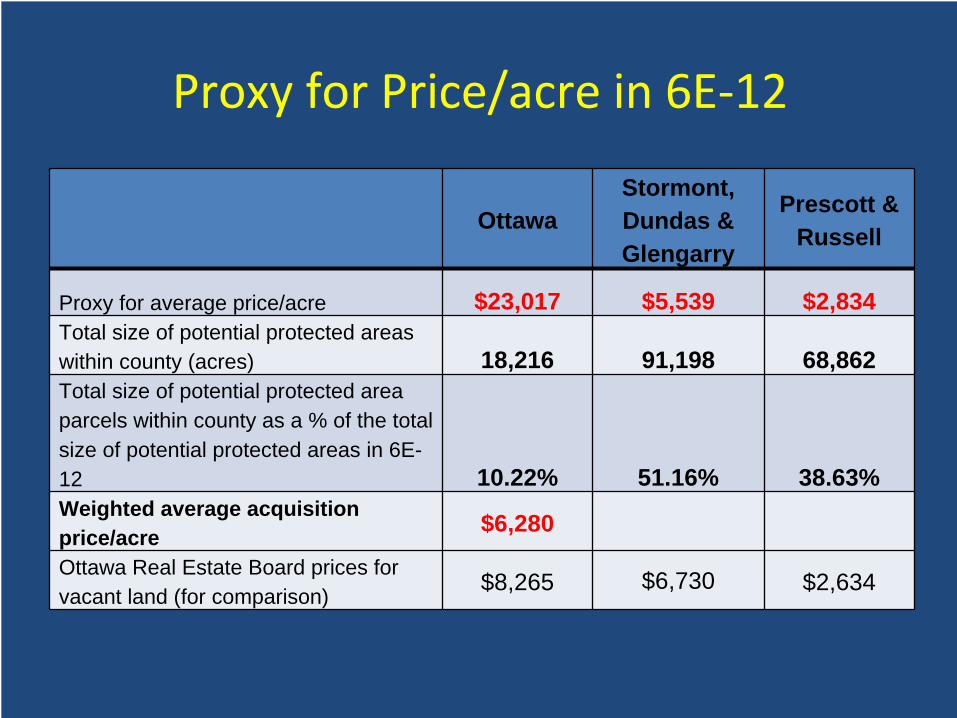
Proxy for Price/acre in 6E‐12
OttawaStormont, Dundas & Glengarry
Prescott & Russell
Proxy for average price/acre $23,017 $5,539 $2,834Total size of potential protected areas within county (acres) 18,216 91,198 68,862Total size of potential protected area parcels within county as a % of the total size of potential protected areas in 6E-12 10.22% 51.16% 38.63%Weighted average acquisition price/acre $6,280
Ottawa Real Estate Board prices for vacant land (for comparison) $8,265 $6,730 $2,634
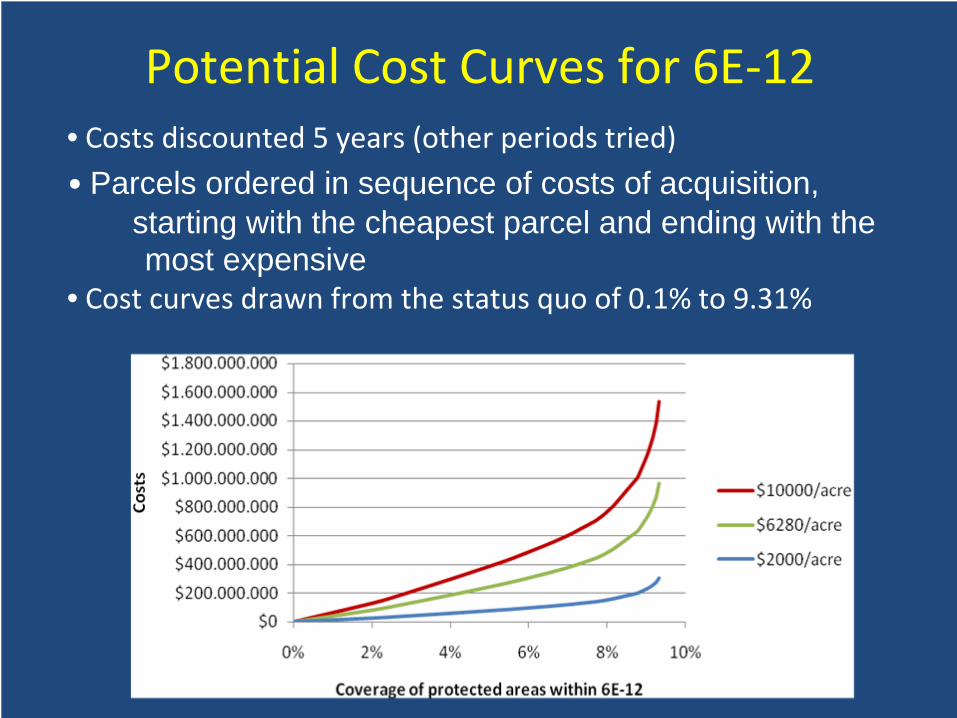
Potential Cost Curves for 6E‐12• Costs discounted 5 years (other periods tried)• Parcels ordered in sequence of costs of acquisition,
starting with the cheapest parcel and ending with the most expensive
• Cost curves drawn from the status quo of 0.1% to 9.31%

Policy Experiments• Have estimates of costs and benefits• How long could expansion take?
– We simulate 5, 10 and 20 years– Longer time frames (10 & 20 yrs) assume taxes collected are invested in a trust
• Must discount values and assume equally division of purchases over time– Treasury Board Guideline – 8%– But land values have increased in Ontario by 2.8% annually since 1998
– Hence discount rate of 5.2% used for costs

An Example of the Present Value of Costs and Benefits of Expanding Protected Areas in 6E‐12: Costs Discounted over 5 Years
$0
$100,000,000
$200,000,000
$300,000,000
$400,000,000
$500,000,000
$600,000,000
0% 2% 4% 6% 8% 10% 12%
C overag e of protec ted area in 6E ‐12
Costs and benefits
Benefits C os ts $10000/ac C os ts $6280/ac C os ts $2000/ac

Policy Experiment 1: What is the optimal level of % protected area in 6E‐12 and what are the associated net benefits?
Optimal levels of PA % coverage (where MB = MC) Maximum net benefits
Cost scenarios $2000/Acre $6280/Acre $10000/Acre
Discounted 5 years 4.38%$263.6M
1.97%$183.4M
1.37%$146.3M
Discounted 10 years 4.73%$271.1M
2.15%$192.4M
1.51%$156.1M
Discounted 20 years 5.45%$285.0M
2.53%$208.7M
1.79%$173.7M
Optimal is defined as the coverage where slope of benefit curve (MB) equals that of the cost curve (MC) – this gives the % coverage level where Benefits minus Costs is maximized

Policy Experiment 2: What is the % coverage cut‐off in 6E‐12 where benefits and costs are the same?
Levels of PA % coverage (where TB = TC)
Cost scenarios $2000/Acre $6280/Acre $10000/Acre
Discounted 5 years >9.3% 6.7% 4.5%
Discounted 10 years >9.3% 7.4% 5.0%
Discounted 20 years >9.3% 8.1% 6.0%
This defines the coverage where further expansion generates greater costs than benefits – i.e. where the total benefit and cost curves cross

Policy Experiment 3: What are the associated net benefits with the OMNR 5% protected area goal in 6E‐12?
Optimal levels of PA % coverage (where MB = MC) Maximum net benefits
Cost scenarios $2000/Acre $6280/Acre $10000/Acre
Discounted 5 years $262.3M $97.8M ‐$45.3M
Discounted 10 years $270.9M $124.8M ‐$2.2M
Discounted 20 years $284.5M $167.4M $65.7M
Determine the net benefits (TB - TC) at the 5% coverage level.

Summary and Conclusions• Ontario public is willing to pay for increasing protected area networks in the Mixedwood Plains
• Benefits appear to be greater than costs for expanding the protected area network
• Maximum net benefits depend on the costs of acquiring additional areas
• Efficiency of PA expansion will depend on resourcefulness of land acquisition at minimum costs

• Valuation approach was designed to be conservative – Hence provides a lower bound of the public WTP for additional protected areas
• Numerous testing procedures provide confidence for benefit results

Future Research• As an economist – interest in the cost curves
– how do the cost curves differ among ecodistricts?
– For 6E‐12 develop more parcels beyond 9.3% coverage
– What mechanisms can be used to obtain the land. • e.g. partnerships with other agencies might lower the cost of attaining the targets, or allow for more land to be protected.
• Efficient mechanisms (auctions?) may also lower the costs of achieving the objectives
• Eco‐gifts etc.

• As an ecologist ‐WTP values represent total coverage– Not individual ecological components
– Which parcels or ecotypes should be protected first from an ecological viewpoint?
– Perhaps some kind of ranking study?
• Information on both provides better policies


![Chemical Reviews Volume 93 Issue 6 1993 [Doi 10.1021%2Fcr00022a003] Kozlowski, Pawel M.; Adamowicz, Ludwik. -- Equivalent Quantum Approach to Nuclei and Electrons in Molecules](https://static.fdocuments.us/doc/165x107/577cc0621a28aba7118fe697/chemical-reviews-volume-93-issue-6-1993-doi-1010212fcr00022a003-kozlowski.jpg)