Dabur India Limited...Dabur is the largest science-based Ayurveda company Overview Awards...
37
Dabur India Limited Investor Presentation J.P. Morgan India Investor Summit – September 2018 1
Transcript of Dabur India Limited...Dabur is the largest science-based Ayurveda company Overview Awards...

Dabur India Limited
Investor Presentation
J.P. Morgan India Investor Summit – September 2018 1
2
Agenda
1. Dabur – Overview
2. Business Structure
3. India Business
4. International Business
5. The way forward
6. Annexure
3
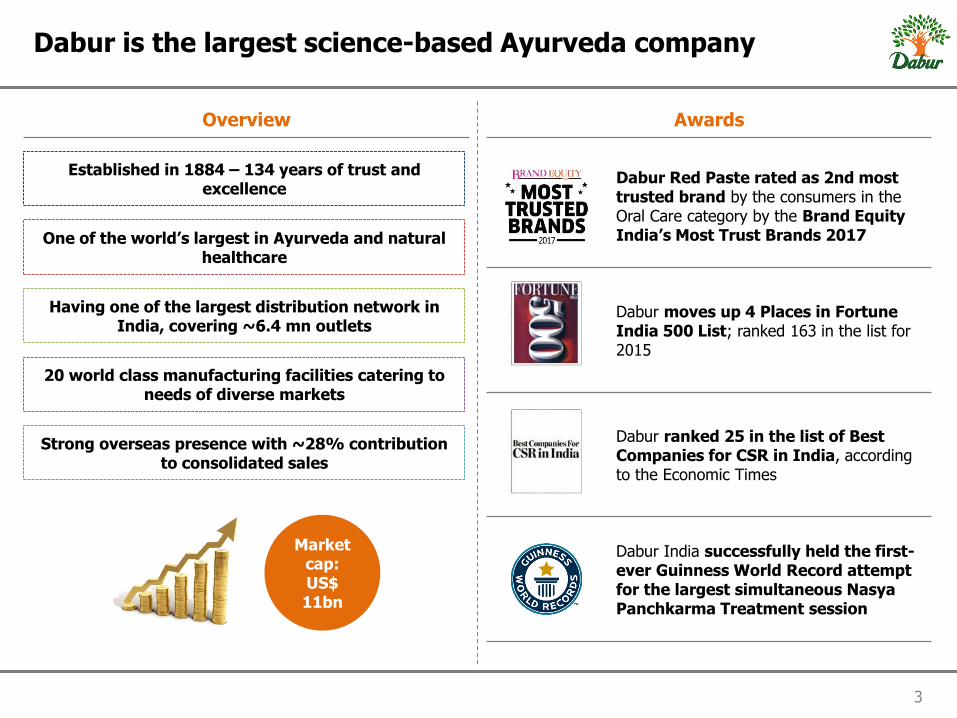
Dabur is the largest science-based Ayurveda company
Overview Awards
Established in 1884 – 134 years of trust and
excellence
One of the world’s largest in Ayurveda and natural healthcare
Having one of the largest distribution network in India, covering ~6.4 mn outlets
20 world class manufacturing facilities catering to needs of diverse markets
Strong overseas presence with ~28% contribution to consolidated sales
Market cap: US$ 11bn
Dabur Red Paste rated as 2nd most trusted brand by the consumers in the Oral Care category by the Brand Equity India’s Most Trust Brands 2017
Dabur moves up 4 Places in Fortune India 500 List; ranked 163 in the list for 2015
Dabur ranked 25 in the list of Best Companies for CSR in India, according to the Economic Times
Dabur India successfully held the first-ever Guinness World Record attempt for the largest simultaneous Nasya Panchkarma Treatment session

4
Manufacturing facilities located across the globe
12 manufacturing locations in India
8 international manufacturing locations
`
Jammu Baddi
Pantnagar
Sahibabad
Tezpur
Nasik
Silvasa
Pithampur
Narendrapur
Katni
Alwar
Newai
Egypt
Nigeria
Turkey
Sri Lanka
Bangladesh
Nepal
South Africa
UAE

5
One of the largest distribution network in India
Urban
Rural
Insti Stockist
Wholesaler
GT Stockist
Retailer Retailer
Consumer Consumer Consumer
Factory
C&F
MT Stockist
Retailer
Consumer
Factory
C&F
Super Stockist
Sub Stockist
Distribution reach of 6.4 mn retail outlets with direct reach of 1 mn+
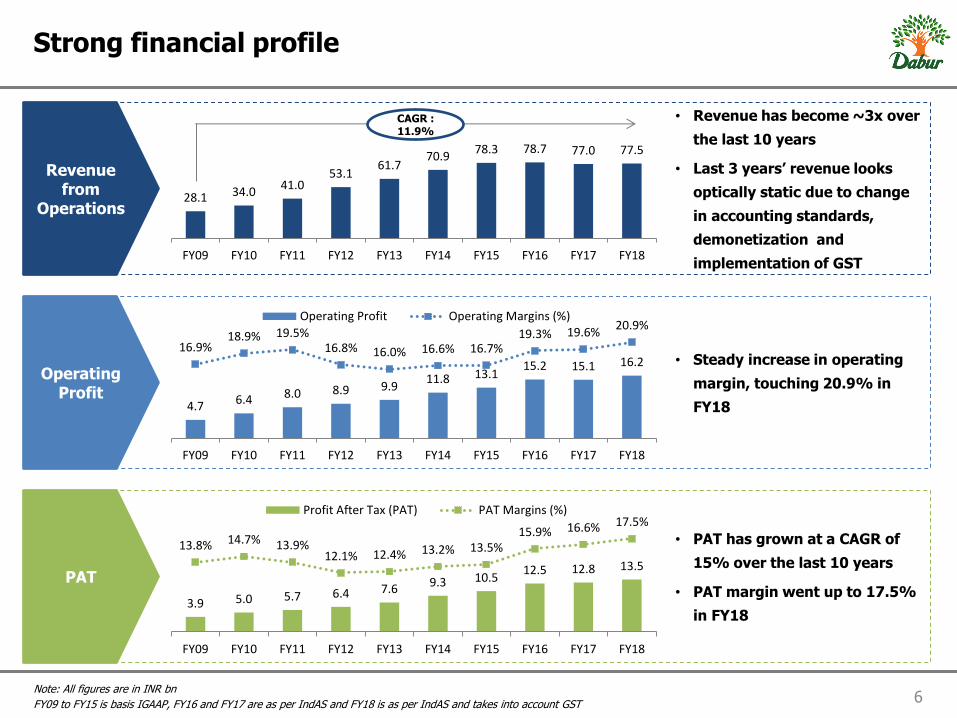
6 Note: All figures are in INR bn
FY09 to FY15 is basis IGAAP, FY16 and FY17 are as per IndAS and FY18 is as per IndAS and takes into account GST
Strong financial profile
• PAT has grown at a CAGR of
15% over the last 10 years
• PAT margin went up to 17.5%
in FY18
• Steady increase in operating
margin, touching 20.9% in
FY18
• Revenue has become ~3x over
the last 10 years
• Last 3 years’ revenue looks
optically static due to change
in accounting standards,
demonetization and
implementation of GST
Revenue from
Operations
Operating Profit
PAT
28.1 34.0 41.0
53.1 61.7
70.9 78.3 78.7 77.0 77.5
FY09 FY10 FY11 FY12 FY13 FY14 FY15 FY16 FY17 FY18
4.7 6.4 8.0 8.9 9.9 11.8 13.1
15.2 15.1 16.2 16.9%
18.9% 19.5% 16.8% 16.0% 16.6% 16.7%
19.3% 19.6% 20.9%
FY09 FY10 FY11 FY12 FY13 FY14 FY15 FY16 FY17 FY18
Operating Profit Operating Margins (%)
CAGR : 11.9%
3.9 5.0 5.7 6.4 7.6 9.3 10.5 12.5 12.8 13.5
13.8% 14.7% 13.9% 12.1% 12.4% 13.2% 13.5%
15.9% 16.6% 17.5%
FY09 FY10 FY11 FY12 FY13 FY14 FY15 FY16 FY17 FY18
Profit After Tax (PAT) PAT Margins (%)

7
Agenda
1. Dabur – Overview
2. Business Structure
3. India Business
4. International Business
5. The way forward
6. Annexure

8
Business Structure
Domestic (72%)
International (28%)
Domestic FMCG (68%)
Others (4%)
Organic (67%)
Acquired (33%)

9
Agenda
1. Dabur – Overview
2. Business Structure
3. India Business
4. International Business
5. The way forward
6. Annexure

3.9%
8.0% 4.0%
Reported Value Growth GST Impact Underlying GSTAdjusted Growth
0.5% 2.4%
(6.6%)
0.7%
(5.0%)
9.8%
17.7%
9.7%
23.7%
4.1% 4.5%
(5.2%)
2.4%
(4.4%)
7.2%
13.0%
7.7%
21.0%
Q1 FY17 Q2 FY17 Q3 FY17 Q4 FY17 Q1 FY18 Q2 FY18 Q3 FY18 Q4 FY18 Q1 FY19
Dabur Value Growth Dabur Volume Growth
10
The domestic business has seen recovery in the past fiscal year with growth picking up since Q2 FY18…
Value and Volume Trend for Domestic FMCG
India Business grew by 8.0% in FY18… …and has started FY19 on a strong footing
Revenue
Operating Profit
Profit after Tax
by 23.7%
by 35.3%
by 35.9%

11 Note: Numbers in the charts represent GST adjusted growth (like-to-like)
…with broad-based growth…
Category Key
Brands
Revenue Contribution
(FY18)
FY18 Growth
Q1 FY19 Growth
Health Supplements
17%
Digestives 6%
OTC & Ethicals
9%
Hair Care 21%
Oral Care 17%
Home Care 7%
Skin Care 5%
Foods 18%
9.4%
10.2%
3.8%
4.1%
14.4%
13.0%
11.0%
0.7%
27.5%
21.6%
16.9%
20.6%
17.3%
17.4%
27.1%
26.1%
Healthcare (32%)
HPC (50%)
Foods (18%)
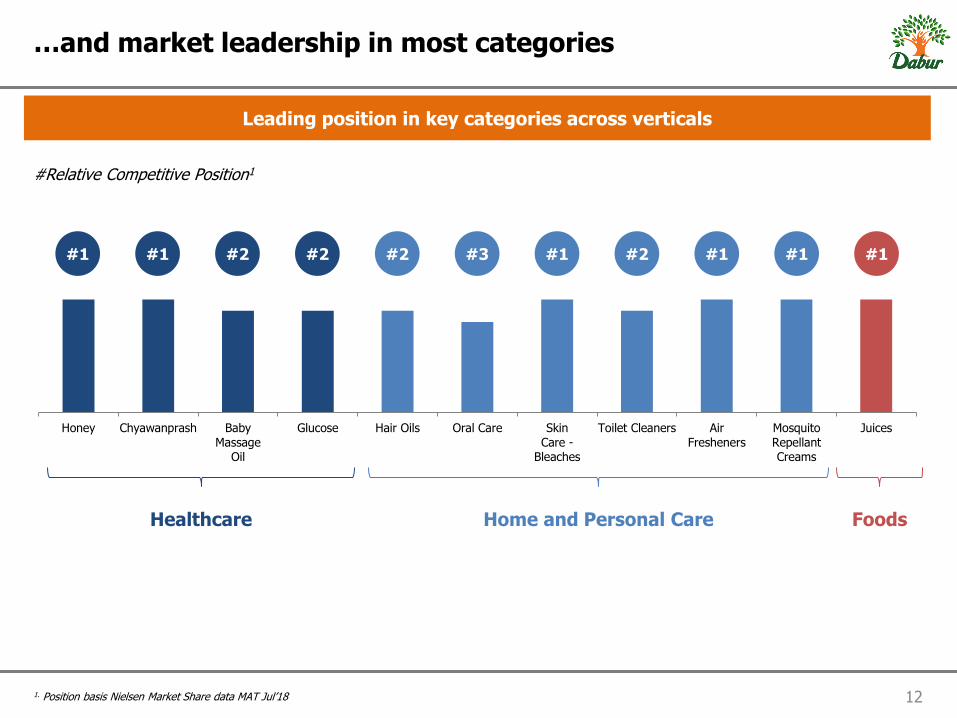
12 1. Position basis Nielsen Market Share data MAT Jul’18
…and market leadership in most categories
Leading position in key categories across verticals
Honey Chyawanprash BabyMassage
Oil
Glucose Hair Oils Oral Care SkinCare -
Bleaches
Toilet Cleaners AirFresheners
MosquitoRepellantCreams
Juices
Healthcare Home and Personal Care Foods
#1 #1 #2 #2 #2 #3 #1 #2 #1 #1 #1
#Relative Competitive Position1

13
Drivers of growth – Project Buniyaad
Urban Strategy
Leveraging potential through Channel based approach
Enabling Technology
Using technology to track and improve performance and automate processes
Portfolio Focus
Leveraging split teams for focused portfolio building
Rural Strategy
Split the front line teams into two to increase reach and frequency – Showing significant positive gains
New Avenues of Growth
Leveraging the alternate channels of MT and E-comm to grow at a rapid pace
Continue Engagement
Using initiatives and technology to build and continuously motivate the trade and front line teams
916,869 910,095 912,332
1,022,974
Mar-15 Mar-16 Mar-17 Mar-18
Direct Reach – No. of Outlets
1
Project Buniyaad achieved its direct reach target of 1 mn outlets and also led to doubling of rural sales people to ~1,400

17.3
17.9
18.6
19.3
20.0
Q1 FY18 Q2 FY18 Q3 FY18 Q4 FY18 Q1 FY19
14
Project Buniyaad has led to larger distribution, higher efficiencies and improved hygiene
Increase in Lines Sold in Rural Increase in Average Brand Sold (ABS) in Rural
Reduced Pipeline
7.30
7.60
7.90 8.00
8.30
Q1 FY18 Q2 FY18 Q3 FY18 Q4 FY18 Q1 FY19
33 31
24
17
FY16 FY17 FY18 Q1 FY19
Days of Stock

15 Note: Enterprise includes Institution, Para Military, CSD and Food Services
Drivers of growth – Channel Changes 2
24.5%
21.7%
11.6%
0.6%
10.1%
23.5% 23.0%
12.5%
0.8%
8.7%
22.2%
23.6%
12.8%
1.2%
7.7%
Wholesale Superstockist MT E-comm Enterprise
FY17 FY18 Q1 FY19
Superstockist, MT and E-comm gaining saliency; Wholesale and Enterprise continues to shrink

16
Recent Product Launches
Real Ethnic Range Real Koolerz Real Mocktails Hajmola Chat Cola Vatika Enriched Coconut Hair Oil
Vatika Shampoo with Satt Poshan
Anmol Jasmine HO
Odonil Zipper
Honitus Hotsip
Fem De-Tan Bleach
Dabur Red Gel
Oxy Pro Clear Facial Kit
Odonil – Fruit Blast
Odomos Fabric Roll On
Glycodab Tablets

17
Agenda
1. Dabur – Overview
2. Business Structure
3. India Business
4. International Business
5. The way forward
6. Annexure
18
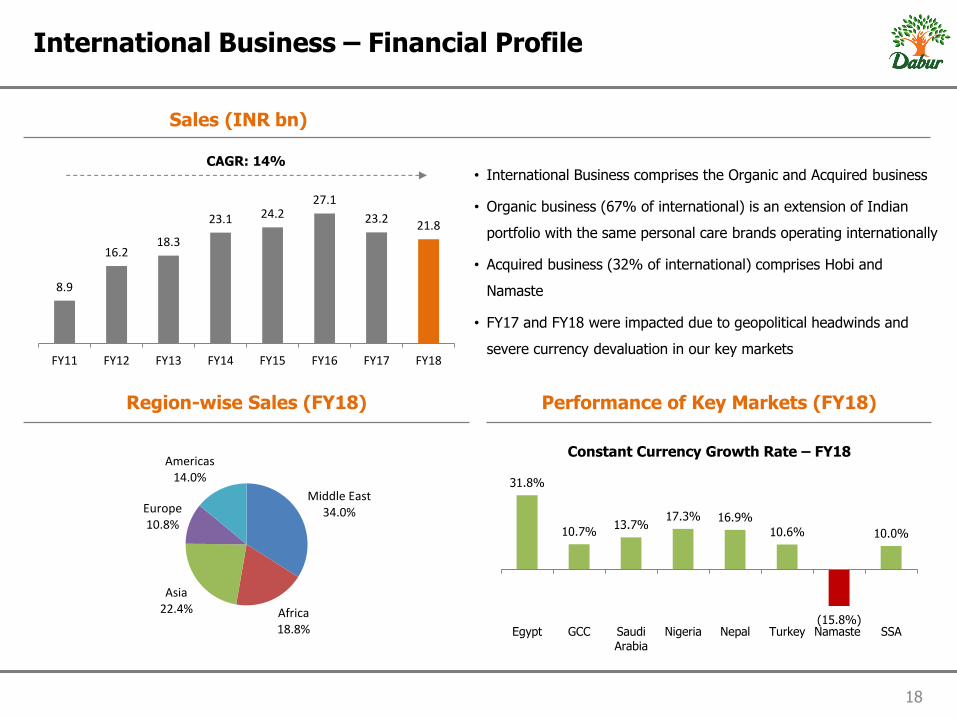
International Business – Financial Profile
Sales (INR bn)
Region-wise Sales (FY18) Performance of Key Markets (FY18)
• International Business comprises the Organic and Acquired business
• Organic business (67% of international) is an extension of Indian
portfolio with the same personal care brands operating internationally
• Acquired business (32% of international) comprises Hobi and
Namaste
• FY17 and FY18 were impacted due to geopolitical headwinds and
severe currency devaluation in our key markets
8.9
16.2 18.3
23.1 24.2 27.1
23.2 21.8
FY11 FY12 FY13 FY14 FY15 FY16 FY17 FY18
CAGR: 14%
Middle East 34.0%
Africa 18.8%
Asia 22.4%
Europe 10.8%
Americas 14.0% 31.8%
10.7% 13.7%
17.3% 16.9%
10.6%
(15.8%)
10.0%
Egypt GCC SaudiArabia
Nigeria Nepal Turkey Namaste SSA
Constant Currency Growth Rate – FY18

19
Organic International Business
FY06 FY18
Organic International Business has evolved from being just a Hair Oil business to a diversified personal care entity
Hair Oil 93%
Oral Care 2%
Others 5%
Hair Oil 34%
Hair Cream 11%
Shampoo 17%
Hamamzaith & Styling
9%
Oral Care 12%
Skin Care 7%
Others 10%
c
Key Brands

20 Source: IMF WEO April 2018
MENA and SSA GDP Growth Expected to Improve
Middle East & North Africa Sub-Saharan Africa
2.2%
3.2% 3.6%
2017 2018 2019
MENA Region - GDP Growth %
2.8%
3.4% 3.7%
2017 2018 2019
SSA Region - GDP Growth %

21
International Business – Strategic Levers
Innovation
GTM
Cost Management
- Capitalize on global Back to Nature trend - Drive penetration through value offerings
- Distributor restructuring - Real-time analytics - JBP (Joint Business Planning) with Key Accounts
- Saving initiatives - Manufacturing efficiencies

22
Agenda
1. Dabur – Overview
2. Business Structure
3. India Business
4. International Business
5. The way forward
6. Annexure

23
Key Elements
Driving Innovation and Renovation for Market Leadership
1
Regionalization 2
Channel Focus Strategy
Cost Optimisation and Improving Service Levels
Capability Improvement
5
4
3

24
Driving Innovation and Renovation for Market Leadership
(a) Focus on Core and Scalable Brands
1
Enhanced Investments in Core Brands
Accelerated Growth from Scalable Brands

25
Driving Innovation and Renovation for Market Leadership
(b) Creating Competitive Leverage
1
Superior Claims
Superior Formulation Superior Packaging
Superiority over mineral oils
Superiority over other Almond HO
2x stronger hair vs
Other Amla HO
26
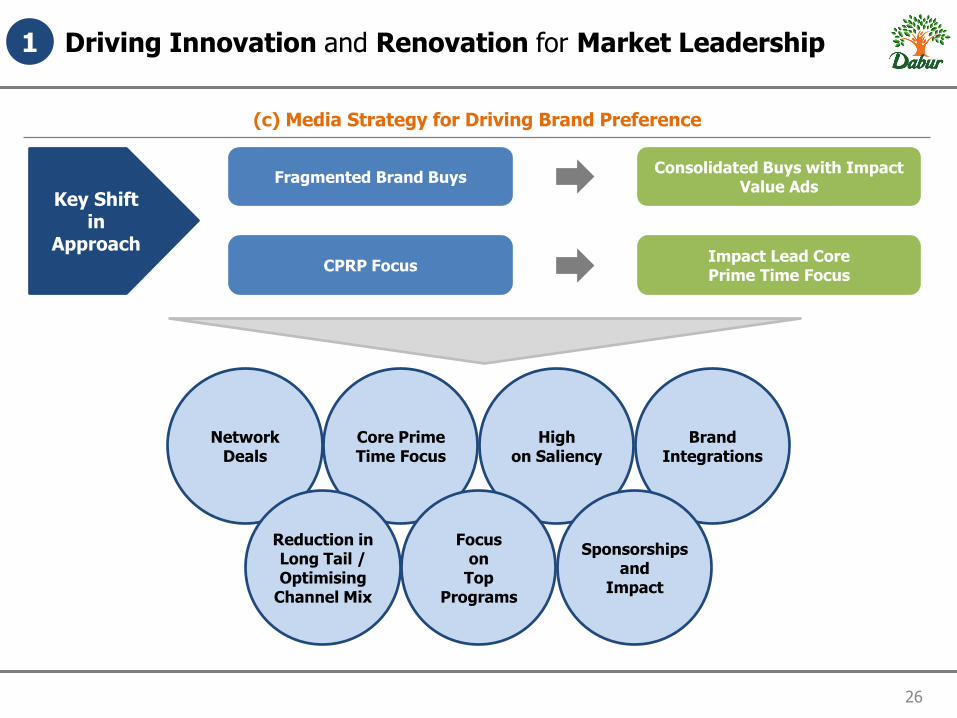
Driving Innovation and Renovation for Market Leadership
(c) Media Strategy for Driving Brand Preference
1
Key Shift in
Approach
Fragmented Brand Buys
CPRP Focus
Consolidated Buys with Impact Value Ads
Impact Lead Core Prime Time Focus
High on Saliency
Core Prime Time Focus
Network Deals
Reduction in Long Tail / Optimising
Channel Mix
Focus on
Top Programs
Brand Integrations
Sponsorships and
Impact

27
Driving Innovation and Renovation for Market Leadership
(d) Driving NPDs
1
Q1 FY19
Strengthening our
Ayurvedic/ Natural
Offerings
Products for
Gen Y and Z
Premiumization
The Way Ahead

28
Regionalization 2
RI : Regional Insights (Long Term Strategic)
SE : Speed of Execution (Quick Wins, Low Investment)
• Capture Consumer, Packaging and Media Insights
• Use Analytics for Specific meaningful actions
• Dive into new adjacent categories
• Regions to provide new growth opportunities
• Trade interventions
• Activations and visibility drives
• Distribution initiatives
• Consumer promotions
RISE Regional Insights
And Speed of Execution

29
Channel Focus Strategy 3
Increasing Direct Distribution
• E-commerce and MT saliency
going up
– Strong growth across
platforms
• Backed by media activation,
visibility and consumer
promotions
Rural Focus E-commerce/ MT Focus
One of the largest distribution network in FMCG in India covering
6.4 mn+ outlets
0.91
1.02
1.20
FY17
FY18
FY19E
Aim to increase direct reach to 1.2 mn outlets
by end of FY19
Range Expansion
Drive Sell Out
1. Increase lines sold in
rural
2. Conversion of bigger
substockist to direct
1. Activations involving RSP
2. Involvement of
Substockist
3. Activation and sell out at
Wholesale

30 OTIF – On Time and In Full
Cost Optimisation and Improving Service Levels
Project Lakshya
4
Targets
• Improve range availability at C&FA
and Distributors
• Improve Lead Time Adherence
• Improve MT OTIF
• Reduction in Logistics Cost
• Reduction in Finished Goods
Inventory
Service Level
Cost
Inventory

31 DRDC – Dabur Research and Development Centre
Capability Improvement
Matrix Organisation Strengthening the Team
5
Sales
Marketing
Trade Marketing
DRDC
Marketing Services
Operations
Shared Goals across Functions
E-comm Head
Parlor Channel Head
Healthcare Head
OTC Head
Digital Head
Ayurveda Head

32
The next growth wave
Build bigger brands
More than 15 brands in the range of INR >0.1 to 1 bn which can grow to INR 1bn+
Geographical expansion
Expand into overseas focus markets where our brands are relevant – MENA, Africa, SAARC
Consumer Health Strong core competence, low competitive intensity, strong profitability, low penetration
Driving distribution expansion
Direct reach of 1.2 mn+, increasing the no. of SKUs, rural potential, IT enablement, data analytics and e-commerce
Continued Innovation and Renovation for Younger Consumers
NPD pipeline primed to deliver new products in key categories – 4-5 new products every year

33
Agenda
1. Dabur – Overview
2. Business Structure
3. India Business
4. International Business
5. The way forward
6. Annexure

34 Note: All figures are in INR crores, unless otherwise stated
Consolidated Profit & Loss
Q1 FY19 Q1 FY18 Y-o-Y (%) FY18 FY17 Y-o-Y (%)
Revenue from operations 2,080.7 1,790.1 16.2% 7,748.3 7,701.4 0.6% Other Income 73.7 81.3 (9.4%) 305.2 298.3 2.3% Total Income 2,154.3 1,871.3 15.1% 8,053.5 7,999.8 0.7%
Material Cost 1,048.6 914.5 14.7% 3,846.4 3,843.2 0.1% % of Revenue 50.4% 51.1% 49.6% 49.9%
Employee expense 224.1 203.5 10.1% 792.8 789.6 0.4% % of Revenue 10.8% 11.4% 10.2% 10.3%
Advertisement and publicity 199.0 150.0 32.6% 606.7 646.1 (6.1%) % of Revenue 9.6% 8.4% 7.8% 8.4%
Other Expenses 222.9 213.1 4.6% 885.0 913.5 (3.1%) % of Revenue 10.7% 11.9% 11.4% 11.9%
Operating Profit 386.1 308.9 25.0% 1,617.4 1,508.9 7.2% % of Revenue 18.6% 17.3% 20.9% 19.6%
EBITDA 459.8 390.2 17.8% 1,922.6 1,807.3 6.4% % of Revenue 22.1% 21.8% 24.8% 23.5%
Finance Costs 14.9 13.3 12.0% 53.0 54.0 (1.8%) Depreciation & Amortization 42.7 39.1 9.4% 162.2 142.9 13.5% Profit before exceptional items, tax and share of profit/(loss) from joint venture
402.1 337.8 19.0% 1,707.4 1,610.4 6.0%
% of Revenue 19.3% 18.9% 22.0% 20.9%
Share of profit / (loss) of joint venture 0.2 0.4 n.m. 0.2 0.3 (5.6%)
Exceptional item(s) 0.0 14.5 (100.0%) 14.5 0.0 n.a. Tax Expenses 72.4 58.9 22.9% 335.4 330.3 1.5%
Net profit after tax and after share of profit/(loss) from joint venture
330.0 264.8 24.6% 1,357.7 1,280.3 6.0%
% of Revenue 15.9% 14.8% 17.5% 16.6% Non controlling interest 0.8 0.7 7.4% 3.3 3.4 (0.7%) Net profit for the period/year 329.2 264.1 24.6% 1,354.4 1,276.9 6.1%
% of Revenue 15.8% 14.8% 17.5% 16.6%
All figures are in INR crores, unless otherwise stated
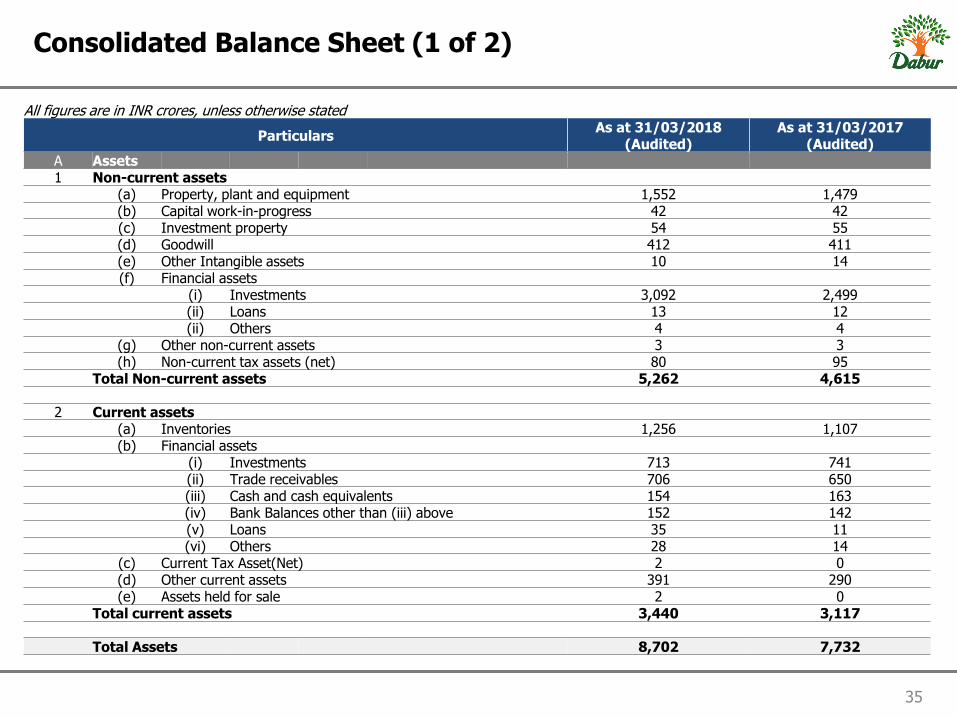
Particulars As at 31/03/2018
(Audited) As at 31/03/2017
(Audited) A Assets 1 Non-current assets (a) Property, plant and equipment 1,552 1,479 (b) Capital work-in-progress 42 42 (c) Investment property 54 55 (d) Goodwill 412 411 (e) Other Intangible assets 10 14 (f) Financial assets (i) Investments 3,092 2,499 (ii) Loans 13 12 (ii) Others 4 4 (g) Other non-current assets 3 3 (h) Non-current tax assets (net) 80 95 Total Non-current assets 5,262 4,615 2 Current assets (a) Inventories 1,256 1,107 (b) Financial assets (i) Investments 713 741 (ii) Trade receivables 706 650 (iii) Cash and cash equivalents 154 163 (iv) Bank Balances other than (iii) above 152 142
(v) Loans 35 11 (vi) Others 28 14 (c) Current Tax Asset(Net) 2 0 (d) Other current assets 391 290 (e) Assets held for sale 2 0 Total current assets 3,440 3,117 Total Assets 8,702 7,732
35
Consolidated Balance Sheet (1 of 2)

36
Consolidated Balance Sheet (2 of 2)
All figures are in INR crores, unless otherwise stated
Particulars As at 31/03/2018
(Audited) As at 31/03/2017
(Audited)
B Equity and Liabilities
1 Equity
(a) Equity share capital 176 176
(b) Other Equity 5,530 4,671
Equity attributable to shareholders of the Company 5,707 4,847
Non Controlling Interest 27 25
Total equity 5,733 4,872
2 Non-current liabilities
(a) Financial liabilities
(i) Borrowings 364 471
(ii) Other financial liabilities 4 4
(b) Provisions 56 53
(c) Deferred tax liabilities (Net) 109 108
Total Non-current liabilities 534 636
3 Current liabilities
(a) Financial liabilities
(i) Borrowings 464 440
(ii) Trade payables 1,410 1,309
(iii) Other financial liabilities 238 174
(b) Other current liabilities 173 169
(c) Provisions 107 93
(d) Current tax Liabilities (Net) 41 38
Total Current liabilities 2,434 2,224
Total Equity and Liabilities 8,702 7,732

For more information & updates,
Contact:
Gagan Ahluwalia
Ankit Joshi