D3.2-1st Prosocial affect fusion and player modelling ...
74
HORIZON2020 FRAMEWORK PROGRAMME ICT – 21 -2014 Advanced digital gaming/gamification technologies Gamification of Prosocial Learning for Increased Youth Inclusion and Academic Achievement D3.2 1 st Prosocial affect fusion and player modelling
Transcript of D3.2-1st Prosocial affect fusion and player modelling ...

HORIZON2020 FRAMEWORK PROGRAMME
ICT – 21 -2014
Advanced digital gaming/gamification technologies
Gamification of Prosocial Learning
for Increased Youth Inclusion and Academic Achievement
D3.2
1st
Prosocial affect fusion and player modelling

18/12/2015 | ProsocialLearn | D3.2 1st
Prosocial affect fusion and player modelling
Page | 2
Document Control Page
WP/Task WP3 / T3.2 and T3.3
Title D3.2 1st Prosocial affect fusion and player modelling
Due date 31/10/2015
Submission
date 18/12/2015
Abstract
This document presents a snapshot of the work carried out in WP3 up to M10.
It starts with an extensive discussion on the possible approaches to multimodality and
on the different facets of multimodal data fusion. It then expands the user model
briefly introduced in D2.3 1st
User requirements and Architecture and also includes the
first attempt of operationalizing the Prosocial Core Domains presented in D2.1 User
requirements. Finally the first outline of the user graphical interface is also discussed.
Author(s) Lee Middleton (ITINNOV), Simon Crowle (ITINNOV), Ken Meacham (ITINNOV)
Contributor(s)
Kostas Apostolakis (CERTH), Kosmas Dimitropoulos (CERTH), Athanasios Psaltis
(CERTH), Spyridon Thermos (CERTH), Kyriaki Kaza (CERTH), Kyriakos Stefanidis (CERTH),
Stefano Modafferi (ITINNOV), Laura Vullier (UCAM), KAM Star (Playgen)
Reviewer(s) Christopher Peters (KTH), Fangkai Yang (KTH), Kosmas Dimitropoulos (CERTH)
Dissemination
level
internal
public
confidential
Document Control Page
Version Date Modified by Comments
0 28/9/2015 Lee middleton, Simon Crowle Draft outline
0.1 16/10/2015 Lee middleton, Kostas Apostolakis, Merge contributions
0.2 23/10/2015 Lee middleton, Kostas Apostolakis, Merge of contributions
0.3 30/10/2015 Lee middleton, Simon Crowle Merge of contributions
0.4 06/11/2015 Lee Middleton + others Merge of contributions
0.5 15/11/2015 Laura Vullier, Kam Star Fairness model
0.6 30/11/2015 Stefano Modafferi Final version assembly
0.7 18/12/2015 Stefano Modafferi Final version implementing
QA review comments.
1 18/12/2015 Pilar Perez Final vesion. Format and
quality review

18/12/2015 | ProsocialLearn | D3.2 1st
Prosocial affect fusion and player modelling
Page | 3
List of Abbreviations
Abbreviation Description
ANN European Commission
DoA Collaborative for Academic, Social and Emotional Learning
FFT Games based learning
MAP Original Equipment Manufacturer
MFCC Software as a Service
NN Value-added reseller
PEP Augmented Reality, Alternate Reality
PLOs Massively Multiplayer Online Games
PsL ProsocialLearn
RMS Root mean square
SAVE (model) Socio-cultural Appraisals, Values and Emotions (model)
SLA1 (Dashboard) Student Learning and Assessment (Dashboard)
SVM Support Vector Machine
1 The acronym SLA will be changed in future version to avoid confusion with the well-known meaning of
“service level agreement”

18/12/2015 | ProsocialLearn | D3.2 1st
Prosocial affect fusion and player modelling
Page | 4
This deliverables complements D3.1 User data acquisition and mapping in game, where the
techniques and approaches for data acquisition are presented. It therefore focuses on the different
aspects of the multimodal fusion, also discussing the associated problems (e.g. synchronization). It
also presents possible emotion and engagement models.
The deliverable also illustrates the first draft of the operationalization process leading the
psychological models defined in D2.1 User requirements. It also progress in the definition of the user
model and it includes some initial outlines of the graphical interface of the platform.
Executive summary

18/12/2015 | ProsocialLearn | D3.2 1st
Prosocial affect fusion and player modelling
Page | 5
1 Introduction ..................................................................................................................................... 7
1.1 Purpose of the document ........................................................................................................ 7
1.2 Scope and audience of the document..................................................................................... 7
1.3 Document structure ................................................................................................................ 7
2 Multimodal Fusion........................................................................................................................... 8
2.1 Synchronisation ....................................................................................................................... 8
2.2 Emotions comparison ............................................................................................................ 10
2.2.1 A brief overview of Models of emotion ........................................................................ 10
2.2.2 Unifying the emotional descriptions ............................................................................. 13
2.2.3 Recommendations......................................................................................................... 14
2.3 Engagement comparison ....................................................................................................... 14
2.3.1 Some characteristics associated with user engagement .............................................. 15
2.3.2 A brief overview of Models of engagement .................................................................. 16
2.3.3 Recommendations......................................................................................................... 17
2.4 Sensor inputs for multimodal fusion ..................................................................................... 18
2.4.1 Voice .............................................................................................................................. 18
2.4.2 Visual information coming from facial analysis............................................................. 19
2.4.3 Visual information coming from body motion analysis ................................................ 20
2.5 Multimodal fusion state of the art ........................................................................................ 20
2.5.1 Statistical rule-based fusion methods ........................................................................... 20
2.5.2 Classification-based fusion methods ............................................................................. 21
2.6 Multimodal fusion in ProsocialLearn ..................................................................................... 24
2.6.1 Fusion approach ............................................................................................................ 24
2.6.2 Decision level fusion ...................................................................................................... 26
3 User Model .................................................................................................................................... 32
3.1 The role of User Modelling in ProsocialLearn ....................................................................... 32
3.2 User modelling: related work ................................................................................................ 32
3.3 User model principal elements ............................................................................................. 33
3.4 User Profile data .................................................................................................................... 34
3.5 User History data ................................................................................................................... 34
3.6 User model representation ................................................................................................... 34
Table of Contents

18/12/2015 | ProsocialLearn | D3.2 1st
Prosocial affect fusion and player modelling
Page | 6
3.7 Model acquisition and persistence ....................................................................................... 36
3.8 Access to user model data .................................................................................................... 37
4 Prosocial Core Domain Models ..................................................................................................... 40
4.1 Trust ....................................................................................................................................... 41
4.1.1 Computational Model ................................................................................................... 42
4.1.2 Correlating to the SAVE Framework .............................................................................. 46
4.2 Cooperation ........................................................................................................................... 47
4.3 Fairness .................................................................................................................................. 49
5 User graphical interface ................................................................................................................ 54
5.1 Creating a new Teacher user ................................................................................................. 54
5.2 Creating a new Class .............................................................................................................. 55
5.3 Creating a new Student user ................................................................................................. 56
5.4 Setting up Class Groups ......................................................................................................... 56
5.5 Scheduling Game Sessions .................................................................................................... 57
5.6 Student Game History ........................................................................................................... 58
6 Conclusions .................................................................................................................................... 61
7 References ..................................................................................................................................... 62
8 Appendix A: Game Data Ingest Service Message Format ............................................................. 67

18/12/2015 | ProsocialLearn | D3.2 1st
Prosocial affect fusion and player modelling
Page | 7
1 Introduction
1.1 Purpose of the document
This deliverable covers preliminary work on dynamic fusion of the input modalities (T3.2) and
modelling of the player profile (T3.3) within WP3.
Within the deliverable main different topics inherent WP3 are addressed, including the definition of
emotion, engagement and prosocial operational models as well as an advanced version of the user
model. The models present different level of maturity and all of them will be revised in the next
iteration of this deliverable.
1.2 Scope and audience of the document
This deliverable summarizes the state of the work of WP3 at M10. The intended audience is mainly
the technical persons in charge of designing and implementing the different components of the
ProsocialLearn architecture and in particular the components addressing data fusion, the user model
manager, the prosocial state manager and the user interface.
1.3 Document structure
The document is split into the following high level sections.
Section 2 covers pre-processing of the data and the fusion architecture realised in the project.
Section 3 describes the user model.
Section 4 presents the operational version of three different Prosocial Core domain models.
Section 5 addresses the graphical user interface topic.
18/12/2015 | ProsocialLearn | D3.2 1st
Prosocial affect fusion and player modelling
Page | 8
2 Multimodal Fusion
This section illustrates different approaches to the multi-modal fusion. It also discusses the problem
of synchronization and the definition of a common model for emotions and engagement.
2.1 Synchronisation
Despite their beneficial effect, multimodal fusion methods come with a certain cost and complexity
in the analysis process. This is due to the diversity of characteristics of the modalities involved. The
fact that different media are usually captured in different formats and rates, make it hard to
represent the time synchronization between the multimodal features. For example, a web camera
captures image sequences at a frame rate which may be quite different from the rate that a
microphone captures sound samples. Therefore, a pre-processing part of the fusion module should
deal with the asynchronous observations to better accomplish the task. Another thing to be
considered when selecting the fusion strategy is the dissimilarity of the processing time of different
types of media streams.
The time when the fusion must be carried out is an important consideration in this multimodal task.
Certain characteristics of sensors, such as varying data capture rates and processing time of the
sensor, poses challenges on how to synchronize the overall process of fusion. Often this has been
addressed by performing the multimedia analysis tasks (such event detection) over a timeline (Chieu
and Lee 2009). A timeline refers to an actual picture of events happened in a certain period of time,
containing important information for the examined task. The timeline-based accomplishment of a
task requires identification of events at which fusion of multimodal features should take place. Due
to asynchrony and diversity among streams and because of the fact that different analysis task are
performed at different granularity levels in time, the identification of these events, i.e. when the
fusion should take place, is a challenging issue (Atrey, Kankanhalli, and Jain 2006).
As the fusion can be performed at the feature as well as the decision level, the issue of
synchronization is also considered at these two levels. In the feature level synchronization, the fusion
scheme integrates the unimodal features captured at the same time period, before learning concepts
(Chetty and Wagner 2005). On the contrary, the decision level synchronization needs to determine
those events along the timeline at which the learned decisions from all unimodal features are
integrated to learn higher concepts. However, in both levels of fusion, the problem of
synchronization arises in different forms.
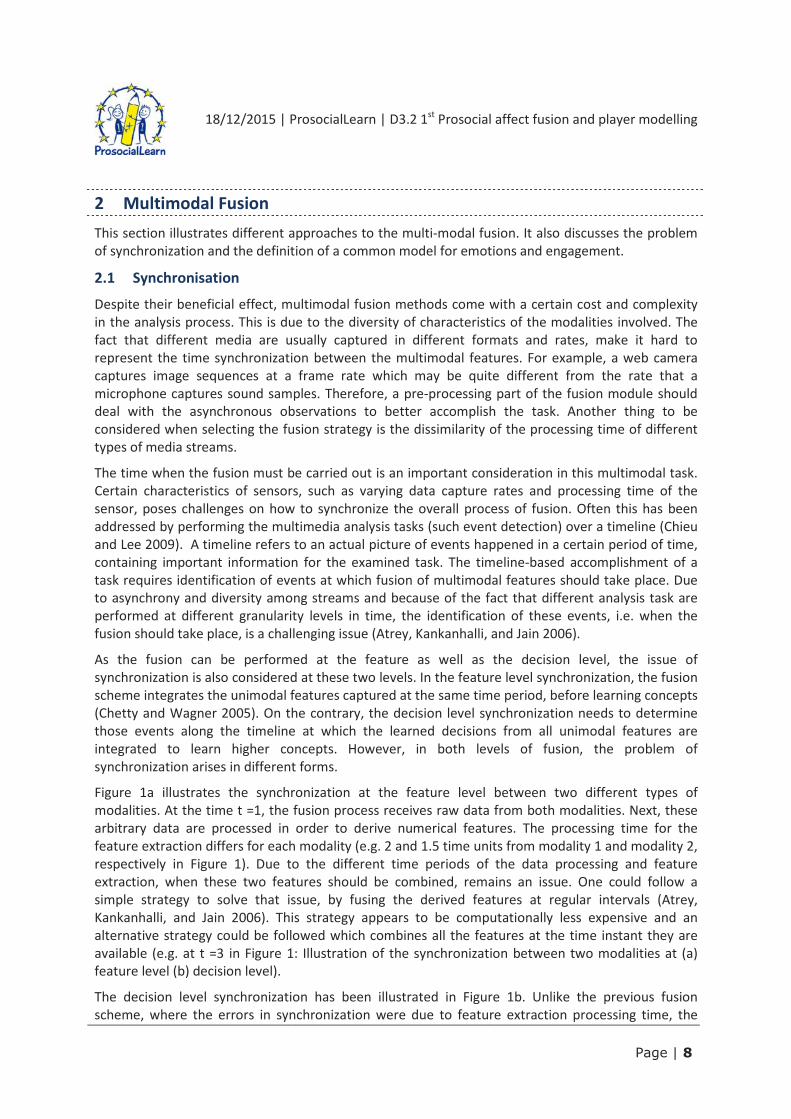
Figure 1a illustrates the synchronization at the feature level between two different types of
modalities. At the time t =1, the fusion process receives raw data from both modalities. Next, these
arbitrary data are processed in order to derive numerical features. The processing time for the
feature extraction differs for each modality (e.g. 2 and 1.5 time units from modality 1 and modality 2,
respectively in Figure 1). Due to the different time periods of the data processing and feature
extraction, when these two features should be combined, remains an issue. One could follow a
simple strategy to solve that issue, by fusing the derived features at regular intervals (Atrey,
Kankanhalli, and Jain 2006). This strategy appears to be computationally less expensive and an
alternative strategy could be followed which combines all the features at the time instant they are
available (e.g. at t =3 in Figure 1: Illustration of the synchronization between two modalities at (a)
feature level (b) decision level).
The decision level synchronization has been illustrated in Figure 1b. Unlike the previous fusion
scheme, where the errors in synchronization were due to feature extraction processing time, the

18/12/2015 | ProsocialLearn | D3.2 1st
Prosocial affect fusion and player modelling
Page | 9
error grows as added extra time in the decision making process. For example, as shown in Figure 1b,
the time taken in obtaining the decision could be 1.5 and 1.75 time units for modality 1 and modality
2, respectively. However, fusing the obtained decisions could be done using different strategies as for
example the time instant all the decisions are available, (t =4 in Figure 1b). Different strategies should
be adopted to match each multimodal fusion process.
Another important synchronization issue is to determine the amount of raw data needed from
different modalities for accomplishing a task. To mark the start and end of a task (e.g. event
detection over a timeline), there is a need to obtain and process the data streams at certain time
intervals. For example, from a video stream of 25 fps, less than a second of data (10 frames) could be
sufficient to determine a human facial emotional expression event (by computing the facial muscle
displacement in a sequence of images); however the same event (body emotional gesture) could be
detected using 3 seconds of Kinect2 stream data of 30 fps. This time period, which is basically the
minimum amount of time to accomplish a task, could be different for different tasks when
accomplished using various modalities. Ideally, it should be as small as possible since a smaller value
allows task accomplishment at a finer granularity in time. In other words, the minimum time period
for a specific task should be just large enough to capture the data to accomplish it.
Figure 1: Illustration of the synchronization between two modalities at (a) feature level (b) decision level
Clock synchronization3 is a problem from computer science and engineering which deals with the
idea that internal clocks of several computers may differ. Even when initially set accurately, real
clocks will differ after some amount of time due to clock drift, caused be clocks counting time at
slightly different rates. Network Time Protocol 4 (NTP) is a networking protocol for clock
synchronization between computer systems over packet-switched, variable-latency data networks.
NTP is intended to synchronize all participating computers within a few milliseconds of Coordinated
Universal Time (UTC). It uses an algorithm to select accurate time servers and is designed to mitigate
the effects of variable network latency. NTP can usually maintain time within tens of milliseconds
over the internet, and can achieve better than one millisecond accuracy in local area networks under
ideal conditions. Asymmetric routes and network congestion can cause errors of 100ms or more. NTP
uses tree-like topology, but allows you to connect a pool of peers for better synchronization on the
same strand level. This is ideal for synchronizing clocks relative to each other. For better relative and
absolute clock synchronization, one has to run its own NTP server.
2 https://en.wikipedia.org/wiki/Kinect 3 https://en.wikipedia.org/wiki/Clock_synchronization 4 https://en.wikipedia.org/wiki/Network_Time_Protocol

18/12/2015 | ProsocialLearn | D3.2 1st
Prosocial affect fusion and player modelling
Page | 10
2.2 Emotions comparison
In order to use the outputs from the emotional classifiers in the fusion stages, the emotions need to
be brought into a consistent representation. This representation and the underlying model need to
obey a number of mathematical properties. Namely, one in which each emotion has a unique
mapping into the space and that emotions in the space correspond to changes in emotional state.
Furthermore, the space needs to be metric so that distances in the space are defined for any pair of
emotions, are symmetric, and obey the triangle inequality. The space should allow traces of
emotions over time. This leads to an ideal that small changes in the values of the space should lead
to related emotions. Before making concrete proposals this section will briefly review the existing
emotion models.
2.2.1 A brief overview of Models of emotion
Classically there are two views of emotions. These are discrete or categorical models and
dimensional models. In discrete emotional models, all people are considered to have a set of innate
emotions. It further views these emotions to be fundamental (like atomic particles) and consequently
exist across cultures. The most famous of these models is due to (Ekman 1992). Ekman proposed a
model consisting of six basic emotions: anger, disgust, fear, happiness, sadness, and surprise.
Generally, these models are supported by the study of language (Bann and Bryson 2013) with the
view that emotions are influenced by our ability to express them.
An example of the Ekman model is shown in Figure 2. There are two specific emotions illustrated. As
the emotions are categorical in nature you can experience a mix of these simultaneously. Under this
sort of model the emotional space could be considered a vector with real valued elements. These
models are simple to understand but suffer from lack of extensibility. Addition of an emotion is
simply via the addition of an element to the vector. However, this treats all emotions are unique
where in reality a number of emotions are related. For example, “angry” and “annoyed” are very
related. This inability to disambiguate emotions makes it a non-ideal representation. Consequently,
discrete models are not a good fit for a unifying representation for emotions.
Figure 2: Ekman model of emotion (left) angry (right) happy
Dimensional models express emotions as being made up of values aligned with more or more axes.
These are the historical view with an underlying notion that that a complex neurophysiological
system in the brain gives rise to all possible emotions. Typically the axes include valance, arousal, and

18/12/2015 | ProsocialLearn | D3.2 1st
Prosocial affect fusion and player modelling
Page | 11
a number of other parameters such as pleasure, arousal, or pleasantness. These models most
commonly have two dimensional axes but unidimensional models have been proposed.
The circumplex model of (Russell 1980) implies a circular interpretation to emotional states.
Grounded in a neurophysiological model where separate valance and arousal circuits in the brain
combine to produce emotional responses. Values in the circumplex are usually considered in terms
of their angle about the origin and the magnitude of the emotion. As a consequence this model is
usually considered as a circle about the origin. An image showing a number of emotions and their
position in space is shown in Figure 3.
Figure 3: Circumplex model of emotion
Another circular model of emotion is attributable to (Plutchik 2001). It illustrated in Figure 4. It
consists of four basic emotions and their opposites. Increased intensity emotions were along the
same axis as the basic emotions. This allows for multiple rings of emotion. Furthermore, by drawing
an analogy with colour wheels he allowed emotions to be mixed. Thus, for example, anticipation plus
joy was equal to optimism. Unfortunately, the model does not support addition of different intensity

18/12/2015 | ProsocialLearn | D3.2 1st
Prosocial affect fusion and player modelling
Page | 12
of emotions. So, for example, interest plus joy is also equal to optimism. This additive approach
makes it difficult to generally define arithmetic on this model.
Figure 4: Plutchik wheel of emotion
A more recent work on bringing emotions together was presented in (Cowie et al. 1999). Subjects
were asked to rate different emotional words using a similar emotional space as proposed by (Russell
1980). Analysis of a number of subjects leads to a basic English vocabulary for emotion and a series
of schema describing them.
Vector based models of emotion define a specific position in space associated with each emotion.
The first such model was (Bradley et al. 1992). The defining dimensions of this model were arousal
and pleasantness. This is a rotation of the space employed in the circumplex model.
It may be that two dimensional models are insufficient to describe emotional spaces. An example of
this is given by the Pleasure-Arousal-Dominance (PAD) model of (Mehrabian 1996). This is illustrated
in Figure 5. Multi-dimensional spaces may represent the emotional space more accurately but
getting data for them is difficult. Generally the approach involves use surveys of the target group
under question. This is difficult for us to perform in practice as would require domain experts to
perform the analysis. Furthermore, it would need different experts for different languages.

18/12/2015 | ProsocialLearn | D3.2 1st
Prosocial affect fusion and player modelling
Page | 13
Figure 5: Pleasure-Arousal-Dominance (PAD) emotional space
There are a number of different models presented in this section to represent emotions. The two
dimensional models are more useful to our application as they have an intuitive visual interpretation.
Additionally, similarities between emotions can be performed via distance measures.
2.2.2 Unifying the emotional descriptions
In D3.1 the initial models for classifiers for emotion were presented. These were developed in
parallel using pre-defined corpuses. As a consequence of which the words used to describe emotions
were different. The use of a common dimensional space is useful to provide a common way in which
to refer to emotions. Table 1 shows the different emotional states described in D3.1.
Modality States
Voice angry, empathic, neutral, positive
Facial expression surprise, fear, happy, sad, angry
Table 1: emotional states described in D3.1
It is possible to map these into a valance-arousal space such as described by (Russell 1980). A
corresponding visualisation is pictured in Figure 6. Note that the voice emotions are drawn as a
bounding rectangle around a cluster of emotions. The two sets of emotional labels seem to be very
distinct with little or no overlap between them.

18/12/2015 | ProsocialLearn | D3.2 1st
Prosocial affect fusion and player modelling
Page | 14
Figure 6: Mapping existing emotions into valence arousal space (green) voice (yellow) facial expression
There are several options. The first would be to extend the clusters to include the nearest words. This
will especially work with the “angry” and “positive” groups. In this case, new clusters need to be
created for “sad” and “surprise”. A second option would be to discretise the space based on these
labels. This would be a space partitioning such as a Voronoi tessellation (Aurenhammer, 1991) or a
guided segmentation based on sectors.
2.2.3 Recommendations
It is considered that the best way to unify the emotions in the project is to use a dimensional space
to represent the emotions. That way it is possible to use a discretisation process to split the space to
cover all the different emotions required for all the different input modalities. Furthermore, this
approach allows the classifiers to continue using the same labels but using basins of attraction
around emotions concepts we can cluster them together. The exact dimensional space to use is still
to be decided. However, due to the prevalence in the literature, valance-arousal spaces are a good
candidate.
2.3 Engagement comparison
An important step towards creating an adaptation mechanism is to understand the relationship
between game mechanics and features contributing to the learning effectiveness of a game. Such

18/12/2015 | ProsocialLearn | D3.2 1st
Prosocial affect fusion and player modelling
Page | 15
understanding would allow measuring different features at fusion stage of the prosocial platform
that in turn can feed back the game adaptation process. (Olsen, Procci, and Bowers 2011) proposes
an approach for measuring effectiveness for learning where effectiveness is seen as a collective
measure of usability, playability and learning outcome. In order to have any reliable measure of
playability, some basic level of usability need to be there. Furthermore, no learning outcomes can be
achieved unless there is some level of playability present. Resnick et al. define playability as “the
entertainment without fear of present or future consequences; it is fun” (Resnick and Sherer 1994).
There aren’t well developed and used measures for playability; it is measured by using the developed
scales for immersion, presence, flow and engagement (Olsen, Procci, and Bowers 2011). These can
be conceptualized as representing a progression of ever-deeper engagement in game-playing.
Engagement is an essential element of the player experience. According to (Lehmann 2012) user
engagement is the quality of the user experience that emphasizes the positive aspects of the
interaction, and in particular the phenomena associated with being captivated by a game, and so
being motivated to use it. Successful games are not just played, they are engaged with; players invest
time, attention, and emotion into them. In an environment where pupils display quite often splitting
attention problems, it is essential that game industry design engaging experiences. So-called
engagement metrics are commonly used to measure game player engagement. Various methods
have been described in literature to measure engagement.
Immersion is typically used to describe the experience of becoming engaged in the game-playing
experience while retaining some awareness of one’s surroundings (Banos 2004; Singer and Witmer
1999). It is likely that most regular game players experience some degree of immersion.
Presence has been commonly defined in the terms of being in a normal state of consciousness and
having the experience of being inside a virtual environment (Tamborini and Skalski 2006). Most, but
not all video game players are likely to have the capacity to experience presence, given the
appropriate conditions.
Flow is the term used to describe the feelings of enjoyment that occur when a balance between skill
and challenge is achieved in the process of performing an intrinsically rewarding activity (Moneta and
Mihaly Csikszentmihalyi 1999). Flow states also include a feeling of being in control, being one with
the activity, and experiencing time distortions. Because it involves experiencing an altered state, the
flow experience may be somewhat less common than immersion or presence.
Psychological absorption is the term used to describe total engagement in the present experience
(Irwin 1999). In contrast to immersion and presence, and in common with flow, being in a state of
psychological absorption induces an altered state of consciousness. Becoming involved while forget
about themselves and their environment and experience the narrative as if it was real and being part
of it.
2.3.1 Some characteristics associated with user engagement
Player engagement possesses different characteristics depending on the game; e.g. how users
engage with a single player or a multiplayer game is very different. However, the same engagement
metrics are typically used for all types of player, ignoring the diversity of experiences. In addition,
discussion on the “right” engagement metrics is still going on, without any consensus on which
metrics to be used to measure which types of engagement. In the following we will try to
demonstrate the diversity of user engagement, through the identification and the study of models of
player engagement.

18/12/2015 | ProsocialLearn | D3.2 1st
Prosocial affect fusion and player modelling
Page | 16
In a recent study, (Attfield 2011), suggested the following characteristics associated with user
engagement.
Being engaged in an experience involves focusing attention to the exclusion of other things,
including other people. There is a relation between subjective perception of time during gameplay
and the level of player engagement. The more engaged someone is, the more likely they are to
underestimate the passage of time. Focusing attention could possibly be measured by
questionnaires, follow-on tasks and gaze tracking algorithms.
O’Brien defines engagement as “a category characterized by positive affect, where engaged users are
affectively involved” (O’Brien and Toms 2008). Affect relates to the emotions experienced during
interaction, and could be measured in real time using physiological sensors such as facial emotion
detection and body emotion detection.
Aesthetics concerns the sensory, visual appeal of an interface and is seen as an important factor for
engagement. Some players became engaged by the layout or aesthetics of the game. They talked
about being attracted to graphics, music and features that first caught their attention. Furthermore,
interactive experiences can be engaging because they present users with novel, surprising, unfamiliar
or unexpected experiences. Novelty appeals to our sense of curiosity, encourages inquisitive
behaviour and promotes repeated engagement. Such reactions could be captured by facial and body
expression recognition in combination with gaze tracking algorithms.
Richness captures the growth potential of an activity by assessing the variety and complexity of
thoughts, actions and perceptions as evoked during the activity (e.g., variety, possibilities,
enjoyment, excitement, challenge). Body sensors (Kinect), hand motion sensors (Leap Motion) and
other input tracking devices such as mouse and keyboard, could be a reliable indicator of the level of
richness experienced.
In the table below, we summarise the identified characteristics of user engagement presented in the
previous paragraph, highlight their possible ways to objectively measure them.
Characteristic Definition Measures
Focusing Attention Focusing attention to the exclusion of other
things
Gaze tracking, follow-on tasks,
Questionnaires
Positive Affect Emotions experienced during interaction Face & Body emotion Detection
Aesthetics Sensory and visual appeal of an interface Face & Body expression
Recognition, Gaze tracking
Novelty Novel, surprising, unfamiliar or unexpected
experiences
Face & Body expression
Recognition, Gaze tracking
Richness Levels of richness In game activity, mouse clicks
Table 2: Characteristics of user engagement and possible measures
2.3.2 A brief overview of Models of engagement
Having defined user engagement and elaborated some of its main characteristics we now look into
potential approaches to its assessment.

18/12/2015 | ProsocialLearn | D3.2 1st
Prosocial affect fusion and player modelling
Page | 17
User experience evaluation metrics can be divided in two main groups: subjective and objective.
Subjective measures record a user’s perception, generally self-reported questionnaires. User’s
subjective experiences are central to user engagement and we consider methods for assessing these.
Subjective experiences, however, can have objectively observable consequences, and so we consider
objective measurements may be indicative of user engagement. These include independent
measures such as the passage of time or number of mouse clicks to complete a task.
In the first group, post-experience questionnaires, interviews and tests are used to elicit user
engagement attributes or to create user reports and to measure engagement in relation to a given
game experience. They can be carried out within a lab setting, or via on-line mechanisms (including
crowd-sourcing). Such an instrument was developed by (Brockmyer 2009). They developed a game
engagement questionnaire which measures the levels of engagement when playing games.
Engagement is seen as passing through several stages from low to high engagement (Brockmyer
2009). These stages are immersion, presence, flow and absorption where immersion indicates the
lowest levels of engagement and absorption is associated with the highest levels of engagement. The
questionnaire has the potential to identify the different levels of engagement when playing a game.
In a more recent study (Whitehill 2014), human annotators were instructed to label clips/images for
“How engaged does the subject appear to be”. They have followed an approximate scale to rate
engagement, where “Not engaged at all” indicated the lowest levels, while “Very engaged” is linked
to highest levels of engagement. (Attfield 2011) noted that it is not straightforward how to produce a
general purpose user engagement questionnaire, some characteristics may generalize well, and
others may not. Thus, we need to generate new user engagement instruments relevant to specific
kinds of interaction and user. Subjective methods have known drawbacks, are not sensitive to ways
in which an interaction changes over time. In this case questionnaires may not be the best tool, and
objective measures seem better suited.
The second group uses task-based methods (follow-on task), and physiological measures to evaluate
the cognitive engagement (e.g. facial expressions, vocal tone, body activity) using tools such as gaze
tracking, face and mouse tracking. In game data such as task duration, task accomplishment and
other task related events could be indicative of player engagement. The performance on a side quest
task immediately following a period of engaged interaction is something that could be used a
measure of cognitive engagement. Game researchers have found that the more engaged the person
is during gameplay, the longer it takes them to complete the unrelated side quest afterwards
(O’Brien and Toms 2008). In contrast, physiological data could be captured by a broad-range of
sensors (Kinect, camera, microphone, Leap motion) are related to different affective states. For
example, a camera could capture gaze changes (related to attention, strong emotion, difficulty) and
facial muscle changes (related to positive or negative affect). In addition, mouse and keyboard inputs
could capture stress and certainty of response, while Kinect and leap could capture actions related to
boredom and fun. Such sensors have several advances over questionnaires, since they are more
objective and they are continuously measured while there is a direct connection with the emotional
state of the user. In general, such measures could be highly indicative of engaging states through
their links with attention, affect, perception of aesthetics and novelty.
2.3.3 Recommendations
Considering what has been described above, the best way to acquire a quantitative indicator related
to engagement is to use task based metrics implemented in game scenarios, which measure the level
of accomplishment, or the duration of specific game quest, fused with vision-based facial and motion
analysis data captured by sensors in a control environment.

18/12/2015 | ProsocialLearn | D3.2 1st
Prosocial affect fusion and player modelling
Page | 18
2.4 Sensor inputs for multimodal fusion
In this section we will discuss some of the sensor inputs (as described by D3.1 User data acquisition
and mapping in game) will be fused together in the ProsocialLearn platform.
2.4.1 Voice
In D3.1 the classifier was trained using a standard dataset (FAU-AEC5). This corpus is a pre-prepared
to make the analysis easy. Specifically, the audio stream was cut into small chunks corresponding to a
word or a group of words with emotional content. This made training the classifiers easy however for
fusion we will have to use continuous audio which is aligned with the other modalities. The
alignment process is discussed in section 2.1. This will discuss how to move from discrete to
continuous classifiers.
The previous analysis started with pre-emphasis filtering. This stage is kept as it serves a useful
purpose in removing noise and flattening the spectrum. The specific implementation is performed via
a finite impulse response filter. The signal is then split into overlapping windows. The window serves
to split into short term sequences which can be subsequently analysed. A diagram showing the
windowing is given in Figure 7. The specifically overlap and offset are tuneable. However, for a 16kHZ
audio signal a window size of 512 samples corresponds to approximately 3ms which is similar to the
framerate of the video. Depending on the subsequent analysis the overlap should be varied. As an
example (Heinzel, Rudiger, and Shilling 2002) proposes that overlap should be chosen to preserve
flatness and minimise computational effort. They note that a pragmatic solution is to use a 50%
overlap which works well in the situations where the spectral impulse response of the system is
unknown. Consequently, for this work we chose a 50% overlap.
After the initial windowing the individual frames are combined to know when human speech is
occurring or not. (Morrison, Wang, and De Silva 2007) proposed the use of endpoint detection using
the energy contour of the frames along with the zero crossing rate. Using this approach individual
frames can be marked as belonging to speech and passed for subsequent processing or not and
discarded. The specific way in which the frames are processed is shown in Figure 8. After the signal is
segmented into segments with speech within them is classified as described in D3.1.
5 https://www5.cs.fau.de/de/mitarbeiter/steidl-stefan/fau-aibo-emotion-corpus/
Figure 7: Windowing the audio signal into frames

18/12/2015 | ProsocialLearn | D3.2 1st
Prosocial affect fusion and player modelling
Page | 19
Figure 8: Processing continuous speech to produce classified emotional utterances
2.4.2 Visual information coming from facial analysis
2.4.2.1 Facial expressions
Seeking those features that enhance the affect recognition algorithms, output data of the visual
information coming from facial expression analysis has been classified into low-level, mid-level, and
high-level of feature abstraction, based on the amount of information being encapsulated in the
extracted signal. More specifically, the features extracted by applying facial expression analysis
techniques include actual anthropometric measurements, Action Unit intensities and emotional
states.
Τhe number of available sensors, and the total number of features that can be extracted throughout
the duration of the a single gameplay session, determine the choice of the appropriate level of
feature abstraction, leading to robust and reliable decisions in the fusion process. Facial expression
data could be directly fed to our fusion algorithms, as they contain the required information in each
frame.
2.4.2.2 Gaze analysis
As described in Deliverable D3.1, multiple levels of feature descriptors are extracted, with regards to
raw gaze pattern measurements as well as indications on higher level cognitive processes, such as
engagement and attention. In contrast to the Facial expression analysis features described in the
previous sub-Section, the fusion algorithms will gain access only to raw gaze pattern measurements,
as according to literature higher concepts do not show direct link to specific emotions.
In a similar way to facial expression feature analysis, determining visual characteristics such as head
pose and the direction of a user’s gaze are a vital part of this kind of feedback. In this respect, we can
use the position and movement of prominent points around the eyes and the position of the irises to

18/12/2015 | ProsocialLearn | D3.2 1st
Prosocial affect fusion and player modelling
Page | 20
reconstruct vectors which illustrate the direction of gaze and head pose. These vectors will be used
as an indication of whether the user is currently attentive, i.e. looking into the screen or not and, in
conjunction with our gaze tracking system, whether the users’ eyes are fixed at a particular spot for
long periods of time. Prosocial affect fusion algorithms will blend gaze information with face data to
get an indication of whether the game attracts their attention.
2.4.3 Visual information coming from body motion analysis
2.4.3.1 Body motion
Extracting body motion analysis features that can be fused along with the data acquired from visual
and audio cues is a challenging task. Furthermore, body motion analysis data are crucial in generating
multi-modal data in gameplay environments where players’ facial analysis data are noisy or even
missing.
In a similar way to facial expression features, the fusion algorithms will process either low-level
feature group or high-level features in order to reach a decision on the player’s prosocial affective
state. The first group includes features such as kinetic energy, fluidity, symmetry, which could be
extracted and used in real time by the fusion process. On the other hand, the latter presupposes the
creation of a time window, where the classifier can process and analyze the motion characteristics,
making a decision about the action (emotion) performed by the user. Most of the body features
described in Deliverable D3.1 are extracted through joint-oriented skeleton tracking using depth and
RGB information from Kinect sensor.
2.4.3.2 Hand motion
Analysis of arm movements has shown that, considering a dimensional emotional space represented
by measures for valence and arousal, the velocity, acceleration, and jerk of the hand movement is
highly correlated with the arousal component. Thus, features related to the user’s motion of the
hands cannot be used for emotion fusion process.
2.5 Multimodal fusion state of the art
In this section, we provide an overview of the different fusion methods have been used in the
literature to perform various multimedia analysis tasks. The fusion methods are divided into the
following categories: statistical rule-based methods, classification based methods (see Table 3).
Multimodal Fusion Methods
Statistical Rule based Classification-based
Linear Weighted Fusion,
Majority Voting
SVM,
Naïve Bayes,
Neural Networks
Table 3: A list of multimodal fusion methods per category
2.5.1 Statistical rule-based fusion methods
The rule-based fusion method includes a variety of basic rules of combining multimodal information.
These include statistical rule-based methods such as linear weighted fusion (sum and product), MAX,
MIN, AND, OR, majority voting. The rule-based schemes generally perform well if the quality of
18/12/2015 | ProsocialLearn | D3.2 1st
Prosocial affect fusion and player modelling
Page | 21
temporal alignment between different modalities is good. In the literature has been used for face
detection, human tracking, monologue detection, speech and speaker recognition, image and video
retrieval, and person identification.
2.5.1.1 Linear weighted fusion
Linear weighted fusion is one of the simplest and most widely used methods. In this method, the
information obtained from different modalities is combined in a linear fashion. The information
could be the low-level features (e.g. pixel positions), mid-level characteristics (e.g. distances) or the
semantic-level emotional states (e.g. happy, sad). To combine the information, we need to assign
normalized weights to different modalities. Researchers used computational and estimation methods
to normalize the different modality weights (Jain, Nansakumar, and Ross 2005). Features or decision
could be fused using sum or dot operators:
��� � ���
������
�
��
Several researchers have adopted the linear fusion strategy both at the feature level (Yan, Yang, and
Hauptmann 2004; J. Wang et al. 2003; Iyengar, Nock, and Neti 2003), and decision level (Hua and
Zhang 2004; Yan, Yang, and Hauptmann 2004) for performing various multimedia analysis tasks.
Majority voting is a special case of weighted combination with all weights to be equal. In majority
voting based fusion, the final decision is the one where the majority of the classifiers reach a similar
decision (Sanderson and Paliwal 2004).
This method is computationally less expensive compared to other methods. However, it is observed
that the optimal weight assignment is the major drawback of the linear weighted fusion method. The
issue of determining and adjusting the weights for different modalities is an open research issue.
2.5.2 Classification-based fusion methods
Instead of naively combining the data using statistic rule-based methods, it is possible to use
classification techniques that have been used to classify the multimodal observation into one of the
pre-defined classes. The methods in this category are the support vector machine (SVM), Naïve Bayes
and Neural Networks.
2.5.2.1 SVM
One of the most common approaches is to employ SVM. SVM has become increasingly popular for
data classification and related tasks. It has been used by most researchers in tasks including feature
categorization, concept classification, face detection, and modality fusion. From the perspective of
multimodal fusion, SVM is used to solve a pattern classification problem, where the input to SVMs’
classifier is the decision scores given by the unimodal classifier.
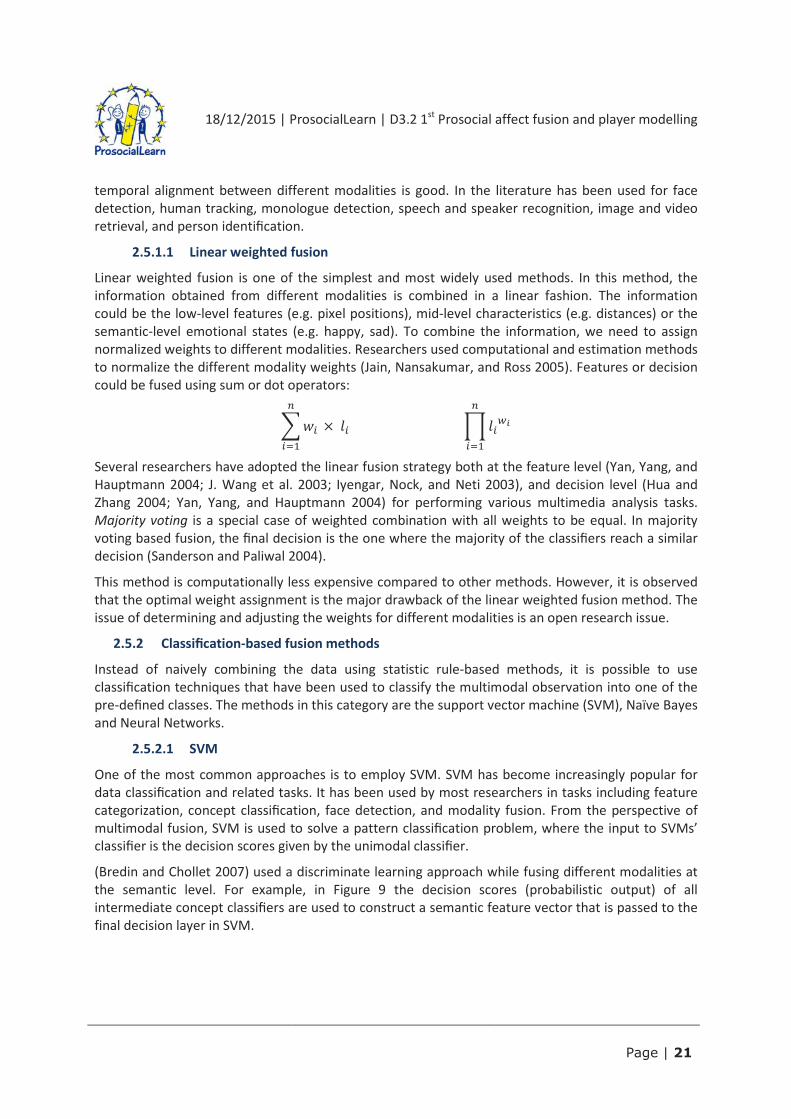
(Bredin and Chollet 2007) used a discriminate learning approach while fusing different modalities at
the semantic level. For example, in Figure 9 the decision scores (probabilistic output) of all
intermediate concept classifiers are used to construct a semantic feature vector that is passed to the
final decision layer in SVM.

18/12/2015 | ProsocialLearn | D3.2 1st
Prosocial affect fusion and player modelling
Page | 22
Figure 9: Support Vector Machine based fusion
2.5.2.2 Naïve Bayes
This approach is very simple to apply to data at feature as well as at decision level. The Bayesian
inference is often referred to as the ‘classical’ method for fusion multimodal data acquired by various
sensors. It has been used very commonly in fusion problems since it has been the basis for many
other methods. The observations obtained from multiple modalities or the decisions obtained from
different classifiers are combined, and an inference of the joint probability of an observation or a
decision is derived (Rashidi and Ghassemian 2003).
For statistically independent modalities, the joint probability of a hypothesis H based on the fused
decisions can be computed as:
��|�, ��, . . , ��� � 1� ���|�������
This posterior probability is computed for all possible hypotheses E. The hypothesis that returns the
maximum probability is determined using the MAP rule:
argmax ∈" ��|�, ��, . . , ��� One of the major advantages of Bayesian inference is that it can compute the posterior probability of
the hypothesis based on the new observations. It requires a priori and the conditional probabilities of
the hypothesis to be well defined. In absence of any knowledge of suitable priors, the method does
not perform well. Dempster-Shafer theory comes as a solution to this as it allows defining the priors
needed.
2.5.2.3 Neural Networks
Like other machine learning methods, Neural network (NN) have been used to solve a wide variety of
tasks including multimodal fusion. Neural networks are considered a non-linear black box that is used
to estimate functions that can depend on a large number of input data and are generally unknown.
Basically the network ‘learns’ from the observed data to recognize patterns and produce noiseless
outputs. In addition it has ability to generalize, as it produces outputs for inputs it has not been
taught how to deal with (unseen data).
The output of a neuron is a function of the weighted sum of the inputs plus a bias term:
#�$� % $���%. . . %$��� % &'()� The network architecture design between the input and output nodes is an important factor for the
success or failure of this method (see Figure 20). The weights along the paths, that connect the input

18/12/2015 | ProsocialLearn | D3.2 1st
Prosocial affect fusion and player modelling
Page | 23
nodes to the output nodes, decide the input–output mapping behaviour. These weights can be
adjusted during the training phase to obtain the optimal fusion results. The most common technique is
to adjust the weights so that the difference between the network output “predicted” and the required
output “ground truth” is reduced Brierley et al back propagation method (P.Brierley, 1998, )
Figure 10: Artificial Neural Network
2.5.2.4 Deep Learning
Deep Neural Networks (Neural Networks with more than one hidden layer) have become increasingly
popular. Unlike the classical ANN, a pyramid of artificial neurons split into several layers, where each
layer takes input data from the layer below. It has been widely used to convert large amount of data,
in most cases noisy data, into smaller amount of better structure info. We can train deep networks to
produce useful representations. Deep learning solutions are very powerful, they are the state of the
art in several machine learning problems (Rashidi and Ghassemian 2003; Mroueh, Marcheret, and
Goel 2015; Kahou et al. 2015; Terusaki and Stigliani 2014; Schroff, Kalenichenko, and Philbin 2015).
Figure 11 illustrates Deep Learning network architecture.
Figure 11: Typical deep learning architecture

18/12/2015 | ProsocialLearn | D3.2 1st
Prosocial affect fusion and player modelling
Page | 24
Deep learning networks can be applied at feature level as well as at decision level, being trained
directly on raw data or decisions accordingly. The layer-wise architecture improves performance
while avoiding overfitting. Deeper networks with fewer hidden variables can provide simpler, more
descriptive model. However, these networks are hard to optimize, and the more layers they include
the longer time it takes to be trained. Figure 12 presents a deep network which fuses visual cues at
the first layer utilizing the correlation between multimodal features at an early stage, while adding
more informative features about the state of the game in a latter fusion layer. Fused information
could be used as a measure of confidence for user engagement.
Figure 12: Fusion using a deep neural network
2.6 Multimodal fusion in ProsocialLearn
A common distinction when defining multi-modal approach considers if the fusion happens at
feature or at decision level. We have already presented these possibilities when introducing the
problem of synchronization in Section 2.1.
Feature level fusion works well when the information produced by different sensors is consistent and
compatible. When signals different in nature are present is instead better to adopt a decision level
approach that is computationally lighter and predicates on consistent space (in our case the emotion
space). The different nature of video and audio signals suggests therefore the use of a decision level
multimodal fusion for the emotion classification.
While the decision level approach remains the main choice, feature level fusion will be pursuit in the
project when convenient (e.g. if multiple video sensors are used).
2.6.1 Fusion approach
2.6.1.1 Early Fusion
According to literature, the most widely used strategy is to fuse the data at the feature level. Snoek
et al., defines early fusion as “the fusion scheme that integrates unimodal features before learning
concepts” (Snoek, Worring, and Smeulders 2005). In the early fusion approach, the monomodal

18/12/2015 | ProsocialLearn | D3.2 1st
Prosocial affect fusion and player modelling
Page | 25
features are first extracted. After analysis of monomodal signals, the extracted features from each
modality are combined into a single representation. A simple technique would be to concatenate all
features from multiple cues into one feature vector (multimodal representation). Using machine
learning approaches, we can train a classifier with few examples to learn higher semantic concepts.
Figure 13 shows a bimodal early fusion scheme, where initially data fused and then fed to the
classifier.
Figure 13: Bi-modal early fusion scheme
In the feature level fusion approach, the number of features extracted from different modalities may
be numerous. In the following, we present the features of each modality, which give us an indication
of the user's engagement, attention.
• Visual features: According to Deliverable D3.1 it may include features based on eyes (e.g.
Distances between eyes’ and eyelids.), eyebrows (e.g. Angles between eyes and eyebrow)
mouth (e.g. Distances between mouth and lips, gaze (e.g. Gaze Distance, Location on screen,
Pupil diameter, Blinking), and so on.
• Motion features: Motion can be represented in the form of kinetic energy which measures
the pixel variation within a shot, motion direction and magnitude histogram, optical flows
and motion patterns in specific directions. Motion vector includes features based on body
(e.g. Kinetic energy, contraction index, density, smoothness, fluidity, symmetry,
forwards/backwards leaning of the upper body and relative positions, directness), head (e.g.
yaw, pitch roll of the head), hand (e.g. velocity acceleration, fluidity of hand barycenter).
These features are extracted through joint-oriented skeleton tracking using depth and RGB
information from Kinect sensor. Hand features are gathered for both hands using Kinect
sensor in a full-body movement tracking environment or for a single hand using LEAP Motion
sensor.
• Audio features: The audio features may be generated based on the short time Fourier
transform including the fast Fourier transform (FFT), mel-frequency cepstral coefficient
(MFCC) described in Deliverable D3.1.
• Text features: The textual features can be extracted from chat messages in the context of
Negative, Neutral and Positive.
• Metadata: The metadata features are used as supplementary information in the production
process, such as the game event, the time stamp as well as the duration and effect of the
action performed. They can provide extra information to audio or visual features. The
context is accessory information that greatly influences the performance of a fusion process.

18/12/2015 | ProsocialLearn | D3.2 1st
Prosocial affect fusion and player modelling
Page | 26
There are several advantages of fusing the modalities at feature level. The multimodal feature
representation might be the most important. Since the features are integrated from the beginning of
the process, the fusion utilizes the correlation between multimodal features at an early stage. In
addition, the requirement of only one learning phase leads to better performance. However, it is
hard to combine and synchronize all these multimodal features into a common representation
because of their different format and processing time.
2.6.1.2 Late Fusion
The other approach is decision level fusion or late fusion which fuses multiple modalities in the
semantic space. In a similar way to early fusion, Snoek et al., defines late fusion as the “fusion
scheme that first reduces unimodal features to separately learned concept scores, and then these
scores are integrated to learn concepts”. In the late fusion approach, the monomodal features are
first extracted. After analysis of monomodal signals, the extracted features from each modality are
fed to a modality specific classifier described in D3.1. Each classifier is trained to provide a local
decision. The local decisions are then combined into a single semantic representation, which further
analysed to provide the final decision about the task. In terms of engagement, local classifiers return
a confidence as a probability in the range of [0, 1]. A bi-modal fusion scheme for late fusion is
illustrated in Figure 14.
Figure 14: bi-modal late fusion scheme
Early and Late fusion approaches mainly differ in the way they combine the results from feature
extraction on the various modalities. The latter fuses unimodal decisions into a multimodal semantic
representation rather than a multimodal feature representation. As a result, the fusion of decisions
becomes easier, while reflecting the individual strength of modalities. Moreover, the late fusion
approaches are able to draw a conclusion even when some modalities are not presented in the
fusion process, which is hard to achieve in the early fusion approach. In addition, late fusion schemes
offer flexibility, in a way that different analysis models could be used to different modalities (e.g.
SVM for face features, ANN for body features). In contrast with early fusion techniques, decision
level approaches fail to utilize the feature level correlation among modalities. Furthermore, as every
modality requires different classifier to obtain the local decisions, the learning process becomes
quite expensive and hinders the overall performance.
2.6.2 Decision level fusion
In this section we will examine the use of decision level fusion to improve the results of multimodal
fusion. Decision level fusion operates on the outputs of classifiers. It will not perform well in the
cases where all the fused classifiers are performing poorly. We will examine a number of different
approaches: naïve, using statistical smoothing, and Dempster-Shafer evidence theory.

18/12/2015 | ProsocialLearn | D3.2 1st
Prosocial affect fusion and player modelling
Page | 27
The first step is to create datasets to be fused. We can achieve this using the results from the
classifier run over the test set (as described in D3.1) and a synthetic dataset. To make the comparison
simpler we will just use a simulated measure of emotion that comes from something in the game.
Both of the emotions measures return a confidence in the range of [0,1]. In terms of the voice
emotion classifiers this has required that the classifiers be trained to produce a probabilistic output.
The graph in Figure 15 illustrates the waveforms along with the ground truth value. Examination of
the figure shows the estimates of emotion to be relatively uncorrelated. The other emotion detector
is relatively better at finding the cases where the classifier finds no emotion compared with the voice
emotion signal. The root mean square (RMS) error of the sequence is shown in Table 4. The other
emotion signal has roughly twice the error of the voice emotion.
Signal RMS-error
Voice emotion 0.112181088435
Other emotion 0.236679782547
Table 4: RMS error for the different signals
Figure 15: Emotional signals for input to the fusion system along with ground truth
2.6.2.1 Naïve Fusion
The simplest fusion approach is to use the most common results for the classifiers. This uses a simple
statistical metric. There are a number of choices here. The most common of which are the mean,
mode, and median of the data. In the case of an unknown distribution the median is a better

18/12/2015 | ProsocialLearn | D3.2 1st
Prosocial affect fusion and player modelling
Page | 28
descriptor as it is more robust. As an example if the distribution is very skewed the median is the
best measure. In the case of a normally distributed signal then median, mean and mode behave
similarly. The result of performing median based fusion is shown in Figure 16. In reality we will not
use the signal like this but perform a hard threshold on the data. The RMS errors are shown in Table
5. In both cases there is a definite improvement over the raw signals.
Signal RMS-error
median 0.0992
Thresholded median 0.0700
Table 5: RMS errors of the fused signals
Figure 16: Fusion based on median of the values
While this approach shows an improvement over the original signals it is a very noisy signal. This
noise is especially prevalent in the region around 0.5 which is the decision threshold. A consequence
of this is that it is very likely that the state will get flipped erroneously.
2.6.2.2 Statistical Smoothing based Fusion
Instead of naively combining the data using a summary statistic it is possible to create a weighted
sum of the different signals. One of the most common approaches is to employ Kalman filters (Gan
and Harris 2001). However, this requires a sufficient model of the various sensors and their states.
For information that is coming via the game this is not always an option. The approach we employ is
based on statistical smoothing. Specifically we use Fraser-Potter smoothing (Fraser and Potter 1969).

18/12/2015 | ProsocialLearn | D3.2 1st
Prosocial affect fusion and player modelling
Page | 29
The essence of this approach is to weight each signal by the inverse of the statistical variance and
normalise the result:
*+ � 1,� % ,�� -
*,� %*�,��.
This approach is very simple to apply to data as it only requires the variances to be computed. These
can be computed either incrementally or globally (if you know the underlying distribution). The result
of applying this weighting to the data gives the result shown in Figure 17. Visually, this result
performs similarly to the previous result though with less noise. The RMS errors are given in Table 6.
The performance is improved over the naïve case. This supports our intuition that the signal was less
noisy.
Signal RMS-error
Fusion via internal smoothing 0.0910
Thresholded fusion 0.0500
Table 6: RMS errors for fusion via fixed internal smoothing
Figure 17: Fusion using a fixed interval smoother
This approach is a significant improvement over the naïve fusion approach. The noise is smaller and
the signal is generally smoother. As this has very simple computation and achieves good
performance this is a good candidate for the feature level fusion.

18/12/2015 | ProsocialLearn | D3.2 1st
Prosocial affect fusion and player modelling
Page | 30
2.6.2.3 Dempster-Shafer Fusion
Dempster-Shafer theory is an extension of traditional probabilistic modelling to allow you to reason
over uncertainty (Dempster 1968; Shafer 1976). It is used very commonly in fusion problems as it
allows you to relax the requirements to define the priors as needed in Bayesian networks (Wu et al.
2002). Before applying the theory you need to define the frame of discernment. This completely
specifies a set in which all the sensors operate. In the case of our system described here the frame of
discernment is simple:
Ω � 0�1, 12 From this the power set is formed which is the space over which we reason. The power set includes
all the possible combinations of the system:
24 � 05,�1, 1, 0�1, 122 At the start of the system, probabilities are assigned to each of these states. The probability, called a
mass function, operates on each of the states in the power set. Fusion proceeds via the Dempster-
Shafer combination rule:
6�7� � 6⊕6� � ∑ 6�:�6��;�<∩>�?1 @ ∑ 6�:�6��;�<∩>�A
For each sample the evidence is combined using the rule and the fused result is found. The results
after doing this are shown in Figure 18. This approach looks even more like the ground truth than the
previous approach. The RMS errors are presented in Table 7. As suspected from the visual inspection
the performance of this approach is better than the other two fusion techniques.
Signal RMS-error
DS fusion 0.0657
Threshold of DS Fusion 0.0700
Table 7: RMS error for Dempster-Shafer fusion

18/12/2015 | ProsocialLearn | D3.2 1st
Prosocial affect fusion and player modelling
Page | 31
Figure 18: Fusion using Dempster-Shafer evidence theory
It is possible to extend the basic Dempster-Shafer approach in a number of ways. Currently, we
assume that each sample is independent of the previous ones. However, as this is a time varying
signal this causes some transitions that are erroneous. It would be good to employ a temporal filter
over this fusion approach such as described in (X. Wang and Zhao 2014). This uses an exponential
window which allows for identification for trends in the signal. This will be effective here as emotion
is unlikely to change radically for a single sample as illustrated by Figure 18. This will be a focus for
future work on this approach.
The extra work to move to Dempster-Shafer fusion over statistical smoothing is mostly upfront (in
computation of the frame of discernment). The improved performance, along with little
computational overhead, indicates that this is a very good approach to apply in the ProsocialLearn
platform.

18/12/2015 | ProsocialLearn | D3.2 1st
Prosocial affect fusion and player modelling
Page | 32
3 User Model
3.1 The role of User Modelling in ProsocialLearn
User modelling is a method of structuring and updating data related to end-users of a system with
the view to using it as input to an adaptive process that modifies system behaviour in specific ways
that improve interaction outcomes. There are a variety of stakeholders within the project that are
identified as users of the PsL platform – these roles have been identified in the architecture
deliverable D2.3. The scope of user modelling within PsL will be limited to the primary beneficiaries
of the platform: the students. Henceforth, when we refer to the user model, we are referring to that
data which is collected, stored and processed in relation to individual students. Readers should note
that other end-users of the PsL platform have an interest in user model data (namely teachers,
parents and experimental psychologists) but they themselves are not the subject of the user model.
Our definition of the PsL user model is driven by the requirements generated during the early phases
of the project's development and guided by user modelling methods found in the research literature.
When used in application design, user models are typically representative of a relatively narrow view
on users working in a specific problem domain within a particular context (Clemmensen 2004). In the
case of ProsocialLearn our specific focus on the user relates to their prosocial behaviours and
emotional responses during game play. In the sections that follow, we review related user modelling
work in the literature and present the PsL user modelling methodology and initial design.
3.2 User modelling: related work
Efforts to model the users of interactive systems has its origins in the early work of computer
scientists and psychologists during which the development of specification models of human
cognition to predict task performance at the user interface (Biswas and Robinson 2012) was carried
out. Notable examples of this pioneering work include the introduction of formal grammars to model
user interactions (Payne and Green 1986; Newell and Simon 1995). This progressed into the
construction of reasoning frameworks that could be tailored for specific application domains
(Blandford, Butterworth, and Curzon 2004). With the advent of wide spread use of mobile and
ubiquitous interactive devices and sensors (Jaimes and Sebe 2005), the breadth and depth of
contextual information and influences impacting human-computer interaction expanded significantly
(Castillejo, Almeida, and Lopez-de-Ipina 2014). Concomitant with the growth of mobile computing,
the wide spread engagement with online communities through social networking platforms
generated a demand for flexible approaches to modelling users interactions through the application
of ontology based representation systems (X. H. Wang et al. 2004).
Within the large corpus of research relating to user modelling is the learner model sub-domain in
which information about the learner such as subject knowledge; learning preferences and goals; user
background and traits; and contextual state are considered. It is typical that the information
aggregated to represent users is collected from a variety of data sources (Brusilovsky 2004) – various
interoperability efforts exist to integrate these (Martinez-Villasenor 2014; Carmagnola, Cena, and
Gena 2011). Kardan et al review a number of approaches to using such data in adaptive processes
that assist learning process in conventional learning domains (Kardan, Aziz, and Shahpasand 2015).
These include identifying student preferences and learning style using machine learning techniques;
ontological approaches to representing user knowledge; and learner management software suites. In
their review, systems and methodologies that address aspects of social learning are identified as a
new and emerging sub-discipline of the field.

18/12/2015 | ProsocialLearn | D3.2 1st
Prosocial affect fusion and player modelling
Page | 33
A methodology for the design and development of learner models has been described by (Cocea and
Magoulas 2015) as process in which the following questions are asked:
• What is being modelled?
• How is the information represented?
• How is the model maintained?
These questions form the basis of a requirements analysis that will shape the architecture and
functionality of the user model. In order to answer these questions an iterative, multi-stage design
process takes place. A preliminary conceptual user model (based on the knowledge domain) is
proposed first. Following this, related data is collected from test scenarios in which system
adaptation is expected to play a role. Next, a mapping of the collected data to the conceptual model
is attempted and evaluation of its efficacy in characterising user behaviour is carried out - the results
of the evaluation feed into the next cycle of design (see Figure 19).
Figure 19: Cocea et al.'s User Modelling design methodology
The primary role of user modelling in the ProsocialLearn project is to effectively represent the
student learners with information that allow games to adapt based on their interactive and affective
responses during game play – an application of user modelling that has been identified as a novel
and emerging field of research. For this reason we will be guided by the user modelling design
methodology provided by (Cocea and Magoulas 2015); in this document we begin this process by
setting out our initial conceptual model in terms of what is being modelled; specifying how the
information will be represented and describing its maintenance and persistence. In the sections that
follow we describe what is being modelled; how the data is represented and how it is maintained.
3.3 User model principal elements
We consider two orthogonal data sets in the representation of our end-users: the user profile and
the user history. The former characterises aspects of the user's background in terms of simple
demographics and selected questionnaire data specifically captured for the experimental purposes of
PsL game studies. This data is intended to be used to support the scientific experimentation carried
out in the project as a means of identifying and controlling for variation in participant characteristics
that may impact the outcome of an experiment. In the latter case, a variety of data will be collected
during game play (such as game transactions; measurements of emotion and engagement; game

18/12/2015 | ProsocialLearn | D3.2 1st
Prosocial affect fusion and player modelling
Page | 34
outcomes) and will be stored in the user history partition of the user model. Historical data will be
used for three purposes: (i) as input to the PsL game adaptation algorithm, (ii) as information to be
used by teachers in the assessment of students' progress and (iii) as data for experimental analysis.
The features and application of the user model to game adaptation will be evaluated in game studies
over the course of the project; modifications and extensions to the model (such as the inclusion of
social graph data) may be applied in future versions.
3.4 User Profile data
The user profile data is anticipated to serve two main purposes. First, to provide sufficient identity
and contextual information to allow the teacher to manage game classes effectively using the
ProsocialLearn student learning and assessment dashboard. Second, to provide references to
associated experimental data (principally in the form of questionnaire responses) that will assist in
the project’s experimental analysis of game play results. The selection, administration and collection
of questionnaire (or test) data will be particular to the experiment being carried out; considered
private and sensitive; and is expected to be managed separately and securely. For this reason, only
references to uniquely identified response data sets should be made in the user profile. Examples of
the characteristics of experimental participants that could be captured in experimental case studies
include representations of social exclusion; anti-social behaviour; academic performance; and
personality traits – see D2.5 (Evaluation Strategy and Protocols) for further information.
3.5 User History data
The user history element of the PsL user model encapsulates observations made directly or indirectly
(via a classification process) of users’ behaviour during game play. Users will be associated with data
related to game instances they have played, including:
• Game generic info (such as game time and outcomes)
• References to other players in the game
• Classifications of their emotion over time
• Game transactions associated with them over time
• Aspects of their engagement with the game over time
• Their position in prosocial state space over time
Data sources will vary depending on the type of observation that will be used; this is described
further in Section 3.7.
3.6 User model representation
The conceptual user model presented in D2.3 is depicted in Figure 20 while in Figure 21 we provide
the first version of the entity relationship model that will form the basis for user model
implementation in the PsL project. The diagram in Figure 20 is divided into two parts, one modelling
information obtained while the player is playing (right part of the diagram, called User History) and
one modelling information obtained externally via other means, such as questionnaires. The identity
record information are kept separately for privacy and security reasons and the player is identified in
the platform by a unique identifier, traceable back to the real identity only by the platform for
providing persistence across games and by the users (like teachers) with the right to access such
information.

18/12/2015 | ProsocialLearn | D3.2 1st
Prosocial affect fusion and player modelling
Page | 35
Identity record Game PlayedSocial and Cultural background
1
1 *
Emotion Data
1
User Model
User Profile User History
Psychometrics
1
11
Game Log
PSL State Assessment
*
Engagement Data
**
1
*
-Current-historical
PSL Objectives
1
*
Figure 20 High Level conceptual model (cf D2.3)
In the model, every user has a corresponding UserModel in which characteristics of themselves as
individuals and their game playing history are stored. The UserProfile entity is a light-weight
container carrying a game player name (as a nick-name, not uniquely identifying the user) and
unique identifiers that connect them to classroom meta-data stored elsewhere on the PsL platform.
Private information describing identity details and references to questionnaire data sets (the
IdentityRecord) is not stored directly within the user model, but may be accessible via a secure
service by using the identity record key stored in the UserProfile in conjunction with appropriate
access login.

18/12/2015 | ProsocialLearn | D3.2 1st
Prosocial affect fusion and player modelling
Page | 36
Figure 21: Version 1 of the PsL User Model entity relationship model
History related to games played and Prosocial Learning Objectives (PLOs) is represented by a
UserHistory entity in which references to previous games (GameInstance) and the most current set of
PLOEvaluations respectively are stored. GameInstance encapsulate the running of a specific game,
including its game title; start and end; and a set of UserPlayData IDs in which individual users that
took part in the game are (anonymously) identified. Every GameInstance has associated meta-data
(PSStateModelInfo) that specifies which prosocial state space model is associated with the game as
well as a map of contextual information about the conditions under which game play took place.
Each UserPlayData represents a single user’s behaviour over time during game-play as represented
by their emotion state; the game transactions they took part in; levels of engagement; and prosocial
state. Inputs that make up the dimensions of the state space are recorded in data series that capture
emotional responses, game transactions and engagement data. A final assessment of the user’s
prosocial state (linked to a specified prosocial state space model) is also represented as a data series
in which a snapshot of the state space as a series of vectors is recorded. Finally, a qualitative
assessment of the student’s progress toward achieving a PLO (PLOEvaluation type) is linked to each
player and related to the specific game instance.
3.7 Model acquisition and persistence
ProsocialLearn user model data will be captured from a number of different sources and modalities.
User profile data is expected to be acquired from parents and children using conventional forms of
questionnaire administration, the individual responses of which will be managed separately. This

18/12/2015 | ProsocialLearn | D3.2 1st
Prosocial affect fusion and player modelling
Page | 37
data is expected to be used (in anonymous form) for experiment analysis purposes and will not be
directly accessible by other parts of the fusion platform.
User history data will be formed of data generated by game logging6, some of this directly produced
by game mechanics logic whilst other elements will be the result of emotion classification processing.
In Figure 22 we present the data acquisition flow for acquiring user history data.
Figure 22: Data acquisition process for user modelling
In this workflow, data sources used to generate user history data originate from the game clients via
the server and the emotion fusion service. The data is handled via a message broker provided by the
game logging service and eventually arrives, transformed, at the user modelling service which
persists the data. Features captured by sensors are transformed by emotion and engagement
classifiers and then fused. Game transaction logs are transformed by a parsing process provided by
the game logging service and fed on the user modelling service. The PsL state manager operates on
emotion, engagement and game transaction data by querying the user modelling service to generate
prosocial state spaces. For a specification of the Game Data Ingest Service messaging format, see
appendix A.
3.8 Access to user model data
User model data will be accessed by both user-facing interactive applications as well as middleware
services running on the PsL platform. The scope of the ‘data view’, as well as the means by which it is
accessed, will depend on the platform components wishing to gain access to the data. Enabling
qualified access to the user model will require that system components be able to ‘sign-on’ using
identities that afford them varying degrees of access to data related to individuals or groups. For
example, compare views of student model data as they relate to the requirements of teachers,
parents and experimental psychologists. The teacher’s view of student model data will support game
planning and student assessment and may require access to multiple instances of profile/historical
information linked directly with student identities. Each child’s parent or guardian is expected to
have access to the same information, but scoped only to their children. An experimenter’s view of
student model data is typically framed within the perspective of comparing groups of (anonymised)
data sets related to game instances with the aim of finding correlations or significant differences. In
Table 8 we explore use-cases in which varying access to user model data are outlined.
6 The meaning of the word logging is in this context the set if information necessary to assess the prosocial
state of a user and there is therefore a need for acquiring and analysing these information as fast as possible to enable the game adaptation. The service in charge of collecting these information is called Game Data Ingest Service to stress the difference with a standard game log.

18/12/2015 | ProsocialLearn | D3.2 1st
Prosocial affect fusion and player modelling
Page | 38
Use-case En
d-u
ser/
serv
ice
Sco
pe
Pe
rso
na
l d
ata
req
uir
ed
?
Re
ad
acc
ess
Wri
te a
cce
ss
Student profile questionnaire
responses (by parent or teacher)
Parent or Teacher
Questionnaire
service
Individual Y Personal identity data Questionnaire data
Game lesson planning using the
Student Learning and
Assessment Dashboard (SLA7)
dashboard
Teacher
SLA dashboard
Group Y Game history data None
Configuration of game settings
before start
Game server Group N Game history data
Recording of game-play
interactions: game instance
usage and in-game achievements
Game server Individual N None Game history data
Review game progress at game-
time
Teacher
SLA dashboard
Individual &
Group
Y Game history data None
Evaluate game outcomes; record
notes on lesson.
Teacher
SLA dashboard
Individual &
Group
Y Game history data Game history data
Assembly of game data for
experimental analysis
Psychologist
SLA dashboard
Group N Questionnaire data
Game history data
None
Table 8: Use cases for access to the user model data
It is clear that well defined roles and access policies should be defined such that services interfacing
the user model data, which may include private data, only do so when it is necessary and only with
the correct authorisation. To this end, we recommend that the user model data be protected by a
policy enforcement pattern (PEP), provided by the SSO.
7 The acronym SLA will be changed in future version to avoid confusion with the well-known meaning of
“service level agreement”

18/12/2015 | ProsocialLearn | D3.2 1st
Prosocial affect fusion and player modelling
Page | 39
Figure 23: Abstracted Policy Enforcement Pattern (PEP) for user model access
In Figure 23, we present the abstract, logical arrangement of PEP components that could control
access to user model data. Using well defined policies, software services supporting end-user
interactions would then be provided with only the necessary data from the user model, over a secure
channel.

18/12/2015 | ProsocialLearn | D3.2 1st
Prosocial affect fusion and player modelling
Page | 40
4 Prosocial Core Domain Models
D2.1 presents the concept of Core Domains that are defined as six different aspects of prosociality
with specific peculiarities and characteristics.
The SAVE model Socio-cultural Appraisals, Values and Emotions (Keltner et al. 2014) is used for
characterizing the propensity to act in a prosocial fashion. It compares costs versus benefit and
derives the willingness to act if the benefits are greater than the costs.
The actual formula is presented in Eq.(1):
M� �D � �1 % BEFGH� % K � BJFKLMLFNO @ CLNNQKOLRN� S CQKOLRN�1� where:
• M is defined as the social momentum for acting prosocially, or the influence of the socio-
cultural milieu. A value for M ranging from 0 to 1 shows social resistance. A value from 1 to
infinity shows a positive influence of the milieu. A value of 1 corresponds to an absence of
social influence.
• D is defined as the set of individual differences in prosociality and situational factors.
• BEFGH is the perceived benefit to oneself for acting prosocially. The benefits can be indefinite.
• K is the set of the giver’s biases and perceptions of the specific recipient, which range from
positively valenced preferences (e.g., in-group members) to negative values that reflect
adversarial stances toward others (e.g., competition, intergroup biases).
• BJFKLMLFNO is defined as the benefit another person can receive from the prosocial action (e.g
money, friends etc).
• CLNNQKOLRN is defined as the cost, or perceived consequences of not acting prosocially. This
can take the form of guilt for the individual, or reputation loss, gossip etc at the group level.
• CQKOLRN is the perceived cost to oneself for acting prosocially. For example, prosocial behavior
can involve the giving up of a valued resource (e.g., money) to benefit another
It is immediately clear that the above formula, that remains valid in general, needs to be adapted to
the case of ProsocialLearn. In particular all the constants in the formula have not yet been firmly
determined, still lacking experiments for their calculation. The scenario of ProsocialLearn also relies
on the use of on-line games and user observations for the production of information indicating
prosociality attitude. It is therefore important to design an operational, possibly simplified, version of
the SAVE model that needs to be specialised for a given core domain and akes use of game and
observation data.
ProsocialLearn is also trying to include in the assessment of ProSociality the role of emotions as
derived from observation. In the SAVE formula emotions are not explicitly considered and it is
desirable to overcome such limitation in the used operational models where the emotions would
play a direct and explicit role.
The definition of operational model for complex and intrinsically not clear-cut concepts is quite
difficult and the work is still in the early stages. This section reports the results achieved so far and
considers only the domains of Trust, Cooperation and Fairness. The models present different level of
maturity and all of them will evolve and be presented again in the next version of the current

18/12/2015 | ProsocialLearn | D3.2 1st
Prosocial affect fusion and player modelling
Page | 41
deliverable. The other core domains defined in D2.1 will be addressed in the next version of this
deliverable.
4.1 Trust
Dunn and Schweitzer define trust as “the willingness to accept vulnerability based upon positive
expectations about another’s behavior” (Dunn and Schweitzer 2005). In order to formalize a suitable
computational model that is suited for prosocial games targeting children aged 7-10, we discriminate
between trust factors using Rotenberg’s BDT approach (Rotenberg 2010). BDT, which was explored
as part of D2.1, stands for Basis, Domain, Target, and is a 3-dimensional framework of trust. The BDT
is defined as follows:
There are three distinct Bases of trust:
1. Honesty, as a base defines when a person is telling the truth and has genuine and not
manipulative intent.
2. Emotional Trust, as a base refers to a person refraining from causing emotional harm, such as
the case of maintaining confidentiality to disclosures (keeping secrets), and avoiding acts that
elicit embarrassment.
3. Reliability, as a base refers to whether a person fulfils his/her word or promises.
Additionally, the three Domains of Trust are defined as follows:
1. The Cognitive/Affective domain refers to a person’s belief that others demonstrate the three
Bases of Trust.
2. The Behavior-dependent domain comprises when a person behaviorally expects/relies on
others to act in a trusting fashion as per the three Bases of Trust.
3. The Behavior-enacting domain, also referred to as trustworthiness, comprises when an
individual behaviorally engages in the three Bases of Trust.
Finally, the framework includes two Target components, which are:
1. Specificity or whether the target of trust is defined as a general category or a specific person.
2. Familiarity or whether the target of trust is defined as slightly or highly familiar.
The BDT framework, therefore, explains that trust includes a defined set of beliefs (expectations)
about persons – reliability, emotional trust and honesty – which comprises, at the trusting end of the
continuum, positive expectations of their behavior. The framework is graphically depicted in Figure
24.

18/12/2015 | ProsocialLearn | D3.2 1st
Prosocial affect fusion and player modelling
Page | 42
Figure 24: BDT framework structure.
In formalizing a computational model ,we choose to represent trust T as a continuous real variable
(T ∈ U) defined in a specific range: T ∈ V@1,%1� for each of the three Bases of Trust (honesty,
emotional trust, reliability), in a similar manner as the singular trust-value approach by (Marsh
1994a). A value close to @1 basically means that the person has complete distrust in that particular
base, therefore demonstrating cynical behaviour. Accordingly, too much trust (blind trust)
demonstrated by a value close to %1 can be explained as the person being naïve8. Both behaviours
(i.e., being cynical or being naïve) have been reported to have negative consequences in children
social inclusion and academic achievement (Rotenberg, Boulton, and Fox 2005). Any form of trust
training should focus on children achieving and maintaining moderate levels of trust. Naïve students
for example, should be trained in the cognitive/affective (i.e. not to be so quick to believe others
demonstrate the three bases of trust) and behaviour-dependent domains (i.e. not to expect others to
act trustworthy so blatantly) while cynical students should undergo similar training scenarios in both
domains, but tailored with rather opposite goals (like, learning to depend on those who have been
proven reliable over the course of time). From this formalization, it becomes apparent that the three
bases of trust constitute the theme or scenario of the training episode, i.e. an episode dedicated to
honesty, emotional trust or reliability, while the three domains regulate the means by which the
scenario is resolved (i.e. whether the child will be called upon to resolve a situation by reconsidering
their trust beliefs, expect specific outcomes from other characters and demonstrate trustworthiness
themselves). The target component then selects the actors/characters to perform the scenario and
deliver the intended training.
4.1.1 Computational Model
We will consider the heuristic formalism of (Marsh 1994a) to model all components of the BDT
framework for Trust. In this formalism, developed for use in Distributed Artificial Intelligence (DAI)
systems of cooperating autonomous agents, distinctions are made between agents �(, &, W, … � and
situations �Y, Z, [, … �. More specifically, situations are modelled in perspective, i.e. from the point of
8 According to the definition of T, a value of @1 (complete distrust) is possible while a value of %1 (blind trust) is not. This is apparent in
the definition of trust according to (Broadie 1991), i.e. that it implies a consideration on the part of the trusting party of something or
someone in order to search for evidence to believe (in) something and arrive at the decision to trust or not to trust. Complete distrust
(@1) complies to this, it implies that, after consideration has occurred, that specific person can definitely not be trusted. A value of %1
means that however is being trusted is not being considered at all (why bother, if trusting blindly anyway?). Therefore, blind trust is not
trust, as it does not involve thought and consideration of things (Luhmann 2000).

18/12/2015 | ProsocialLearn | D3.2 1st
Prosocial affect fusion and player modelling
Page | 43
view of each agent, therefore creating the set ��Y\ , Z] , [ �, … , �Y\ , Z] , [ �, … , �Y\ , Z] , [ �, … �. In
Marsh’s formalism, Trust is separated into three distinct aspects, namely Basic Trust, General Trust
and Situational Trust. In the following paragraph we elaborate on these concepts, and attempt to
map them onto the BDT framework. Since we aim at measuring trust as a prosocial core factor of the
human player, we adopt agent * for the remainder of our notations as the trusting end of the trust
bond, i.e. the agent who is in need of determining whether to trust a given agent _ or not. Therefore,
from this point on, we will refer to the player simply as *. For the player *, knowing another
character9 _ will be denoted as a�_� and will take a true/false value (0, if * does not know _, and 1
otherwise). Therefore if a�_� � 1, we infer that * has already met _.
Basic Trust Tab refers to *’s general trusting disposition (S. D. Boon and J. G. Holmes 1991) at a
specific time c, and takes on values within the range V@1,%1�. The higher Tab is, the more trusting *
is at time c. This metric is a general indicator of user disposition to trust a character that has only
recently been encountered. This disposition is then further adjusted according to past experiences,
i.e. dependent on what has happened to * in the past. Therefore, we will accept that good
experiences lead to greater disposition to trust, and vice versa (S. D. Boon and J. G. Holmes 1991). As
this trust aspect does not imply any trust directed towards any other agent or depending on a
particular situation, we can map Tab on the BDT framework in all cases in which the Target’s
Specificity is general. Furthermore, the subject touches upon the Cognitive/Affective domain,
demonstrating how *’s beliefs stand that others demonstrate the three bases of trust. This can
indicate a measure of optimism/pessimism, as optimistic characters will expect the best in all things
and be always hopeful for the outcome of situations, while pessimists act in the exact opposite way
(Marsh 1994b). A flow diagram showcasing this simplest case of trust is presented in Figure 25. Here,
the final decisions represent a general disposition towards behaving in that particular manner. Also,
distrust and no trust (or zero trust) are two different concepts (which are better explained in the next
paragraph).
Figure 25: Flow diagram for agent d Basic trust edf. 9 The word character is used with an equivalent meaning of player.

18/12/2015 | ProsocialLearn | D3.2 1st
Prosocial affect fusion and player modelling
Page | 44
General Trust refers to trust in other agents, therefore Ta�_�b is a measure of how much * trusts in _ at a specific time c, and like basic trust, it will take up values in the range V@1,%1�. The values of
general trust are a basic indication of the trust * has in another character _ at any time. A value of 0
means * has no trust in _, which could be the outcome of past transactions appraised both positively
and negatively or simply because * has not yet met _ , i.e. a�_� � 0. On the other hand, a value of @1 reveals a strong disposition of * to generally distrust _, which is indicative that they have met
before i.e. a�_� � 1, and * has drawn this conclusion through any number of negative experiences * has come into in the past by making a decision to trust in _. A flow diagram for general trust can be
seen in Figure 26.
We can already map these values onto BDT by setting the Target’s Specificity to a specific agent _.
Furthermore, the general trust value represents the probability that * will behave as if he trusts _,
i.e. that * will expect that _ will behave according to *’s best interest and will not attempt to harm *.
This is a direct reference to the Cognitive/Affective and Behavior-dependent Domains of the BDT
framework, as well as the Behavior-enacting domain when viewed from _’s perspective (i.e. *’s own
estimate of how much it is trusted by _), as defined in the previous paragraph. Since General trust
can be defined across all Domains of the BDT framework, we will adopt it as a measurement for each
character in the game with whom * interacts with. It is the single, general measure of trust * has in _, and is built across time, from the moment the two agents meet up until time c.
Figure 26: Flow diagram for agent d General trust ed�h�f in agent h.

18/12/2015 | ProsocialLearn | D3.2 1st
Prosocial affect fusion and player modelling
Page | 45
Situational Trust refers to the amount of trust * has in _ in situation Y. Similar to basic and general
trust, situational trust Ta�_, (a�b is defined within the V@1,%1� space. This will be the most
important aspect of trust in cooperative situations, as it provides a measure of trust in another to
engage in cooperation to resolve a situation. If this measure is above a specific threshold, then
cooperation ensues. A flow diagram is shown in Figure 27.
Figure 27: Flow diagram for agent d Situational trust ed�h, i�f in agent h for a situation i.
As is the case with the general trust aspect, situational trust in the scope of the project refers to trust
in each one of the three bases of trust, as defined in the BDT framework. Therefore, Eq. (3) holds for
each base, namely Honesty (Ta �_, j�b, j ∈ k), Reliability (Tal�_, m�b , m ∈ n) and Emotional Trust
(Ta"�_, o�b , o ∈ p).
Having determined the situational trust Ta�_, (a�b in _, * can consider whether or not to cooperate,
or otherwise engage in trusting behavior. To determine the answer, threshold values for trust will be
defined. (Marsh 1994b) defines the cooperation threshold as a barrier for overcoming trust issues. If
the situational trust is above a cooperation threshold qa�(�b cooperation will occur, otherwise
cooperation will not occur. When *’s trust in _ with regard to situation ( is less than the cooperation
threshold (denoted as qa�(�), but still larger than 0, we define the concept of untrust. On the other

18/12/2015 | ProsocialLearn | D3.2 1st
Prosocial affect fusion and player modelling
Page | 46
hand, an active judgement in the negative intentions of another formalizes the concept of distrust, or
that * believes that _ will act contrary to their best interests in the situation ( . A graphical
representation of the continuous values of trust and where definitions are placed is shown Figure 28.
Figure 28: Trust continuum, from Distrust to Trust and Untrust.
We have laid out a strong foundation on which we aim to build our computational model, which will
be presented in future editions of this deliverable (D3.3, D3.4). It is important however to note that
we foresee using this computational model to compute *’s general trust aspects for each base and
each agent/person _ in the game, as a post-hoc metric to the actual decision to cooperate with _
based on trust. This will provide us with ground truth data for that particular player’s relationships
with other agents in the game. However, *’s dilemma at any given time c, where it has to decide
whether to trust in _ during a situation (, will only be measured as an estimate. Therefore, while
processing a new situation unfolding at current time c, * has to be rated according to the trust it
demonstrates across all Domains. This means, that we can compute what *’s trust value in this
particular case should be, then monitor *’s decision on whether to trust in _ or not, re-evaluate its
general trust aspects to get new ground truth values for future cases at time c % 1 and propose
adaptations according to whether * acted out on its expected trust factor at time c. More on this
adaptation will be presented in D4.1.
4.1.2 Correlating to the SAVE Framework
Assuming the giver is the person who acts in a prosocial fashion, we can expand the formula of the
SAVE framework (Eq. 1), and moving the total perceptions of cost into one part of the inequality, we
end up with the following representation of the SAVE framework:
r � s� � s1 % :tuvwx % ` � :yu^�z�u�b @ ;���\^b�{�x S ;\^b�{� ⇔
r � s� % sD � :tuvwx % ` � :yu^�z�u�b @ ;���\^b�{�x S ;\^b�{� ⇔
�r � D� % sr � D � :tuvw� % �M � ` � :yu^�z�u�b� @ �M � ;���\^b�{�x S ;\^b�{� ⇔
}�r � �� � s1 % :tuvwx~ % �M � ` � :yu^�z�u�b� @ �M � ;���\^b�{�� S ;\^b�{�⇔
}�r � �� � s1 % :tuvwx~ % sr � ` � :yu^�z�u�bx S s;\^b�{� %�r � ;���\^b�{��x�2� According to the definitions of r, �, and :tuvw, the first left-hand term }�r � �� � s1 % :tuvwx~ can
be summarized as the giver’s psychological stance against its own perception of the situation, i.e. it is
a self-assessment of the utility to be gained from a situation, weighted by the importance (a
subjective measure which corresponds to the definition of �) and the general influence the agent
perceives from its society in behaving prosocially, i.e. “is it the right thing to do?”. Accordingly,
considering the definitions of ` and :yu^�z�u�b, the second term on the left-hand side of the formula

18/12/2015 | ProsocialLearn | D3.2 1st
Prosocial affect fusion and player modelling
Page | 47
sr � ` � :yu^�z�u�bx corresponds to the giver’s perception of the recipients capability and stance
against that particular individual, weighted by that individual’s utility of the situation. The right-hand
term s;\^b�{� %�r � ;���\^b�{��x corresponds to the perceived cost of acting and not acting, which
may be geared towards a consideration of the risks involved in each situation. Since we agree with
the scientific literature that the act of trust is in fact prosocial behavior, according to (Keltner et al.
2014), trust should be governed by Eq. (2). If the condition holds true, prosocial behaviour, i.e. trust,
will ensue. Since we refer to the giver as agent * and the recipient as agent _ for the majority of this
text we will re-write Eq.(2) in an appropriate fashion:
s�ra � �a� � �1 % :a�x % sra � a � :�x S s;a\ %�ra � ;a�\�x → #�*, _, (��3� Where the subscript * denotes that the given variable is considered from *’s point of view, and the
superscript ( is used to indicate that situation ( unfolds. Similarly, �( refers to the situation ( not
unfolding, since * will not in fact, cooperate with _. This is denoted as #�*, _, (�, i.e. * trusts in _ for
situation (. Eq. (14) basically boils down to:
���W� c'��a\ % ���W� c'��a� S ���W� c'��ay�t� → #�*, _, (��4� i.e. if my perception of the situation ( and my perception of the candidate trustee _ is above a
threshold set for my perception of the risks involved for situation ( happening or not happening, I
can trust in _.
This representation of the SAVE framework is very much likely in tune with our computational model,
since both state that * has to overcome some uncertainty factor (cooperation threshold) in order to
decide to trust in _. We are encouraged by this revelation, and will further explore the correlation
between our emerging computational model and the SAVE framework in future editions of this
deliverable.
4.2 Cooperation
Cooperation has been discussed under different fields and with different angles. “game theory” and
“cooperative game theory” focuses on the strategy that agents put in play to maximize their payoff.
Other approaches focus on the observation of cooperation to identify reasons behind the
cooperation and the factors influencing it. Cooperation models are also quite dependant on the
context in which they are used.
The reason for cooperating is at a first glance always derived from a cost benefit analysis. The benefit
may or may not be for the helper. According to (Lehmann & Keller, L, 2006) the difference between
altruism and cooperativeness is in the direct benefit for the helper. If the benefit is positive it is
defined as cooperation, if it is negative it is defined as altruism. The authors identify four general
situations where helping is favoured of which two are related to cooperation. “The first is when the
act of helping provides direct benefits to the FI10 that outweighs the cost of helping (i.e. there are
direct benefits). […] . The second situation is when the FI can alter the behaviour response of its
partners by helping and thereby receives in return benefits that outweigh the cost of helping. In both
situations, the helping act is cooperative as it results in an increase of the fitness of both the FI and its
partners. A difference, however, is that in the first situation the increase of the FI’s fitness is because
10 In the paper “FI” stands for focal individual. In the contest of the model used in PsL is simply the player in
charge of taking the decision.

18/12/2015 | ProsocialLearn | D3.2 1st
Prosocial affect fusion and player modelling
Page | 48
of its own behaviour while in the second situation it results from the behavioural change induced in its
partner(s).”
In particular the considered scenario is defined as
• “non-cooperative”11,12 according to (Peleg & Sudholter, 2003) because there is not agreed
binding among players before the game starts.
• “non zero sum”13. In game theory and economic theory, a zero-sum game is a mathematical
representation of a situation in which each participant's gain (or loss) of utility is exactly
balanced by the losses (or gains) of the utility of the other participant(s). If the total gains of
the participants are added up and the total losses are subtracted, they will sum to zero. In
our scenario better explained below, this condition is not verified.
Our model considers cooperation scenarios as defined above, and in particular considers private and
public good scenario as following:
• A succession of decision points exist that leads to an “all win” or “all lose” scenario.
• In each decision point a user
o can decide to help another user sacrificing part of his private resources and so
maintaining unaltered the probability of the “all lose” scenario
o can decide not to help another user preserving his private resources and so
increasing the probability of the “all lose” scenario
• The all lose scenario happens after a fixed amount of decision point has been resolved with
a “not to help” choice
A common way for defining the contribution to a common good is to calculate the marginal
contribution of a user. In this case we can identify the contribution as the payment for the
maintaining of the “all lose” probability.
Let be
• TMAX the maximum number “not to help” decisions before the “all lose” scenario happens.
• T the number of already happened “not to help”.
• DEC the total number of decision points. This parameter is calculated as average of values in
already executed scenarios.
At a given decision point, the probability that “all lose” scenario is verified is
• P”All Lose”= 1 @ ���������
with TMAX≥T and T=TMAX defining the condition of “all lose”.
When TMAX-T=1 deciding to help or not to help is a pure cognitive exercise, because not helping
means to lose everything also for the helper (“all lose” scenario).
11 Note that ‘cooperative’ and ‘non-cooperative’ are technical terms and are not an assessment of the degree of cooperation
among agents in the model: a cooperative game can as much model extreme competition as a non- cooperative game can
model cooperation.
12 https://en.wikipedia.org/wiki/Non-cooperative_game 13 https://en.wikipedia.org/wiki/Zero-sum_game

18/12/2015 | ProsocialLearn | D3.2 1st
Prosocial affect fusion and player modelling
Page | 49
When TMAX-T=2 a player may decide to preserve his private goods relying on the fact that someone
else will be forced to help the next decision point to avoid the “all lose” condition (see point above).
This situation is similar to the well-known free-rider problem in game theory.
The scenario discussed above is characterized by a given situation when it is obvious that cooperate
is the only choice and a concept of “distance” from this situation. The distance is the number of
subsequent decision points in which it is affordable to have the “all lose” scenario14.
As for the cooperation measurement the idea is therefore to reward (i.e. consider more cooperative)
the action of helping the more it is far from the “pure cognitive” exercise.
The function expressing the positive cooperativeness of a user is the counting of times he decides to
help weighted by inverted probability of the “all lose” scenario ���������
Positive Cooperative Level = ∑ ����������NNL With n= number of “help”
Analogously a Negative Cooperative Level for a user represents the free riding scenario and it counts
the time the user decides not to help weighting them with the distance to the “all lose” scenario at
the time of the choice ��������� .
Negative Cooperative Level = @∑ ����������NNL With n= number of “not help”
The Cooperative level is therefore defined as the algebraic sum of Positive and Cooperative level.
This value may be normalised in the model so that it becomes independent from the “DEC”
parameter.
This is a simplistic approach to extract values of cooperation from that will be tested and assessed,
but it is considered a fair representation of a cooperation value as derived from in game data. The
model will be completed adding to it a representation of emotions.
The proposed model follows the approach of the SAVE model where a cost/benefit balance is
applied. In this simplified version there is the concept of personal cost, personal benefit and global
benefit that are combined and evaluated after any decision taken by the player. A direct mapping of
the terms of this model against the SAVE model is more difficult because the SAVE model describes a
propensity to be prosocial while the goal of this operational model is to provide an actual
measurement of cooperation and the constant in the SAVE model are not yet defined.
4.3 Fairness
This model is directly inspired from the SAVE framework presented at the beginning of this section.
M� �D � �1 % BEFGH� % K � BJFKLMLFNO @ CLNNQKOLRN� S CQKOLRN
14 Different strategies can exist in this type of game. A possible one (to be verified by the actual experiment) is that each
player will decide to free-ride (preserving his own private goods) up until the last possible moment (i.e. the obvious decision
point). Deviation from this strategy will give us information on how the human player acts in reality.

18/12/2015 | ProsocialLearn | D3.2 1st
Prosocial affect fusion and player modelling
Page | 50
In the following we will discuss the values of the constants and how we may calculate it in the case of
a fairness based game.
As said M corresponds to the social momentum for acting prosocially, or the influence of the socio-
cultural milieu. Values ranging from 0 to 1 show social resistance. Values from 1 to infinity show a
positive influence of the milieu. A value of 1 corresponds to an absence of social influence. We do
not know yet what the value will be for this as the literature shows no clear relationship between
Socio Economic Status (SES) or culture and children's prosocial behaviour (see report D2.1). We
might however get this value from the pilot studies we will conduct. Waiting to have a clear value of
the influence of the SES in our games, we recommend leaving this value at 1 for no influence. In the
pilot studies, we should make sure we record the social status of the area where we conduct the
testing (if not of the children).
D represents individual differences in prosociality and situational factors. We will be able to get this
value from (a) the data we collect on individual differences (e.g. personality and attachment style)
and (b) the situational factors such as the instruction of the game (who will know about the student
being prosocial etc; these instructions will be different for each games). There is no a priori value for
this.
In order to simplify the influence of individual differences and situational factors, we actually
recommend separating D into I and S such as D= (I+S). This way, we can clearly explain the influence
of I, the personality and attachment style that we will get from the questionnaires; and S, which will
depend on the instructions.
I itself could be split in I= (A +P), A standing for attachment style and P for personality. These are the
two traits we will be measured in this project. However, as a note, I could actually be a combination
of more than just these two traits.
Because research has shown that securely attached children are more socially competent and have
better friendship quality (see D2.1 report, p32-33), A could for instance take a value of 1 to infinity
for securely attached children and negative values for non-securely attached children. We could
reduce infinity to 100 by having a scale going from -100 to +100 on how secured these children are
(from the questionnaires). However, note that the ‘0’ value should be omitted. So in fact we should
go from -100 to -1 for insecurely attached children and +1.1 to +100 for securely attached children.
The same could be done for agreeableness (calculated on the personality questionnaire) for the
value P.
The value of S will largely depend on the instructions of each game, but below is a suggestion for
likely scenarios. Prosocial behaviour is highly contagious (see Nowak and Roch, 2007; Christakis &
Fowler 2009). That is, if you are in an environment where everyone shares and is fair to each other,
you will likely be more prosocial yourself. Backstories can help us determine this function. If the
children know that other children will know the outcome of their decisions and if all the other
children are prosocial, then D should have a positive value (from 1.1 to 100 for instance). In the
opposite case, negative values should be used if the context describes people who are not being
prosocial towards each other.
Bself corresponds to the perceived benefit to the self. These benefits can be indefinite and can take
many forms. It can for instance be: money, friends, reward, making a difference, being equal, etc.The
instruction and context of the games should help us to determine what the benefits might be (if
anonymous setting, making friends will not be a benefit; but making a difference could be etc).

18/12/2015 | ProsocialLearn | D3.2 1st
Prosocial affect fusion and player modelling
Page | 51
Brecipient is the benefit another person can receive from the prosocial action (e.g money, friends
etc). This is how much money the receiver makes in the giver-receiver game for instance.
Specifically, we can summarise the action of Bself and Brecipient by the figure 1 below. In this figure,
the benefit for the self and the recipient take the form of: concern for substance (sweets in this case:
what is the maximum amount of sweets I can get?) and concern for relationship (what is the best
amount that I can give to keep my relationship with my friends). The expectation however will be
different if the game is played anonymously (no concern for relationship) or if the game is played in
collaboration or not. Indeed, if the game is played in collaboration, the monetary value (the sweets)
that is considered ‘fair’ will likely be higher than if the game is play independently (why would they
give half of their gain if the other player has not helped to collect the sweets?). The results from the
pilot study will help us determine what the values are for this specific game in these specific
situations.
Figure 29: Bself and Bother in the Giver-Receiver game.
K is the giver’s biases and perceptions of the specific recipient, which range from positively valenced
preferences (e.g., in-group members) to negative values that reflect adversarial stances toward
others (e.g., competition, intergroup biases). The instruction context will help us determine this
again: Do they have to be generous to their friends or enemies? Is the other player a close friends or
just a classmate? In the case of the anonymous giver-receiver game, this should be 1 so it has no
influence. See Figure 2 for values of K for a game where the other player interacting is an enemy or a
friend.
Figure 30 K, the giver’s bias and perception

18/12/2015 | ProsocialLearn | D3.2 1st
Prosocial affect fusion and player modelling
Page | 52
Cinaction corresponds to the cost or perceived consequences of not acting. This can take the form of
guilt for the individual, or reputation loss, gossip etc at the group level. Again, the context and
instruction will help determine what will have an influence. This value could for instance be 0 in the
anonymous giver-receiver game for the group level. But might not be 0 is the giver feels guilty for not
acting for instance. The inclusion of emotions in our model will help determine whether Cinaction
can take the form of guilt, which will help get a better estimate of their prosocial skills.
Caction is the cost to the self for acting prosocially. For example, prosocial behavior can involve the
giving up of a valued resource (e.g., money) to benefit another. This is for instance how much sweets
they give away in the giver-receiver game. They might also gain some positive emotions, feeling good
about being generous and the fusion of emotions will help us have a better approximation of
Caction. The value can for instance vary from 0 to 100 according to how many sweets they share.
Caction is not only how much they share but how they feel about it etc. This is developed below.
Figure 31 Caction: monetary part only
To determine the values for Caction and Cinaction, the pilot study will be of considerable help. To do
so, it is important to add a few questions to the giver-receiver game to better capture the whole
range of values that we are interested in.
Amendment 1:
After we ask the children to share the sweets or after they see how much the other player decided to
give them, we should ask a few more questions considering:
• The emotional state of self
• The emotional state of the other
• What they think is fair, as a giver and a receiver.
• How they and the other person feels
For the receiver in particular, we should ask questions such as:
• What do you think would be fair for you to receive?
• How do you feel about the other person?
• Would you have shared more?
• Do you think they are being fair?
• How are you feeling right now?
• If they were your friend, should they have shared more or less?
• If they were your enemy, should they have shared more or less?
In return, we should ask the giver:
• How do you think the other person feels?
• How fair do you think you were on the other person?
• The other person thought you were fair/unfair and feel happy/sad. How do you feel about it?

18/12/2015 | ProsocialLearn | D3.2 1st
Prosocial affect fusion and player modelling
Page | 53
• Do you think you should have shared more or less?
• Would you have shared more if they were your friend? (how much would you shared if they
were your friend?)
• Would you have shared less if they were your enemy?
Another alternative would be to create a fictional character with a backstory making them being
liked/dislike by the player. We could have two conditions, one with a friend, one with an enemy. This
would create 8 conditions in total:
1. Play on your own against friend � Give
2. Play on your own against friend � Receive
3. Play on your own against enemy� Give
4. Play on your own against enemy� Receive
5. Play in collaboration against friend � Give
6. Play in collaboration against friend � Receive
7. Play in collaboration against enemy � Give
8. Play in collaboration against enemy � Receive
This might be slightly too long for the purpose of the testing in school. We could also maybe do
groups of children. Some do Game 1 to 4, some 5 to 8 etc.
To summarise, it is currently difficult to have an a priori value for what the values of all these
variables should be. However, we are hoping that the pilot study will help us get a better estimate for
specific games. These estimates will have to be re-adjusted for new games with different
instructions.

18/12/2015 | ProsocialLearn | D3.2 1st
Prosocial affect fusion and player modelling
Page | 54
5 User graphical interface
ProsocialLearn designs and offers graphical interfaces to the different classes of the end-users. The
interfaces will present a unified look and feel and they can be logically grouped in two sets:
management interfaces and querying interfaces.
The management interfaces group all the functionality needed to i) deploy, publish, access games ii)
create users and roles iii) manage logins and access rights.
The querying interfaces are described in the Description of Activities15 as Student Learning and
Assessment Dashboard (SLA Dashboard) and they group the functionalities that through appropriate
queries on the available data present all the information to the end-users (e.g. the assessment of a
given properties for a student across a set of games).
This chapter introduces the Student Learning and Assessment Dashboard, outlining its place within
the ProsocialLearn project and system, and presents some initial design ideas for the first prototype.
It focuses on a specific subset of end-users including:
• Teacher
• Student
• Parent
• Psychologist
It is also likely that an overall Admin user will be required, for general configuration and maintenance
of the dashboard, setting up initial user accounts, etc.
Our initial focus is on use cases most relevant to the Teacher (as outlined in the previous section)
including game lesson planning and presentation of game history. These will help to drive the design
of the initial prototype for the SLA Dashboard, and will be further developed and added to as the
project progresses.
5.1 Creating a new Teacher user
Before a teacher can use the SLA Dashboard, they will require a login account. This may require some
assistance from an Administrator in the first instance, or that a responsible teacher is also provided
with an Admin role in the system.
Figure 32 shows a mock-up of the New User dialog, which will pop-up after selecting “New User”
from the main dashboard menu (for example). Several different types of user can be created via this
dialog, by selecting the appropriate Role (e.g. Teacher, Student, Parent, and Psychologist). In this
case, we select “Teacher” as the role. The dialog will be context sensitive, and will therefore only
show fields that are relevant to the particular type of user (for example only Student users will be
shown input fields related to demographics, as we will see later).
The Teacher will be requested to enter general details such as Login ID, Firstname, Surname, Date of
Birth and Gender. They will also be able to select the Class that they teach, or enter a new one via
the “New Class” button. This feature is shown in the next section.
15 ProsocialLearn Description of Activities (previous known as DoW)

18/12/2015 | ProsocialLearn | D3.2 1st
Prosocial affect fusion and player modelling
Page | 55
Figure 32: Creating a new Teacher
5.2 Creating a new Class
Figure 33 shows a dialog for creating a new Class, which simply requires a Name and a Teacher.
Once classes are set up, Students can be created and added to their correct Class (as we will see in
the next section).
Figure 33: Creating a new Class

18/12/2015 | ProsocialLearn | D3.2 1st
Prosocial affect fusion and player modelling
Page | 56
5.3 Creating a new Student user
Figure 34: Creating a new Student
Figure 34 shows the dialog for creating a new Student user. This is similar to creating a Teacher,
however additional input fields will be displayed for entering demographic, cultural, social data, etc.
The exact fields required here will be clarified during the project.
Note that, when selecting a Student’s Class, the Teacher field will be automatically populated, as this
has already been assigned for the class.
5.4 Setting up Class Groups
In order to play prosocial games, a teacher will need to be able to organise the students in his/her
class into various Groups (also known as cohorts). For example a particular game might require four
participants, therefore the students will need to be put into groups of four. Figure 35 shows a mock-
up of a proposed dashboard page for setting up Groups. Here, we start with a pool of Students
(associated with the Teacher’s Class). Using the GUI, the teacher will be able to create a new Group,
then drag students into these. Students may be colour-coded according to gender, so the teacher can
allocate students into same-sex or mixed groups, as required. By selecting individual Students, a
teacher will be able to view their profiles, in order to facilitate their allocation to groups. Profiles may
be viewed side by side. Once allocated to Groups, teachers may then schedule groups for playing
games.

18/12/2015 | ProsocialLearn | D3.2 1st
Prosocial affect fusion and player modelling
Page | 57
Figure 35: Setting up a Group
5.5 Scheduling Game Sessions
It is likely that a teacher will need to schedule groups of students to play games within various
sessions. For example, a school might have limited computing resources, so not all students in a class
might be able to play games at the same time. Game sessions will also help teachers to organise their
students to play a series of games, and subsequently to track their progress. Each session will have a
name, along with an associated game and student group that will play in that session. A scheduled
date and time will be provided. Ideally, game sessions will be displayed in some form of calendar for
the teacher, as shown in Figure 36.
Figure 36: Setting up a Game Schedule

18/12/2015 | ProsocialLearn | D3.2 1st
Prosocial affect fusion and player modelling
Page | 58
The Game Calendar will enable a teacher to quickly see when game sessions are scheduled. New
sessions may be created directly in the calendar. In Figure 36, we have assumed that one Group plays
a particular Game within a Game Session. For example, session “Candy Quest A” is set up for Group
A, whereas “Candy Quest B” is for Group B. Teachers may wish to have other grouping options, e.g.
having several groups of students playing simultaneously, during a particular session (i.e. time slot).
Another benefit of defining sessions in this way is that the teacher will maintain control over which
students may play games at any given time. For example, a teacher would not want students to start
playing a random game at some unspecified time. There is no point in an individual student playing a
cooperation game on their own! A formal session would provide some form of access control,
whereby a student could only play a particular game within a fixed time period.
A session would also have some form of state, e.g. “Scheduled”, “Running” or “Complete”; it could
automatically enter the “Running” state, once its time slot starts, then change to “Complete” once
the time slot expires. Alternatively (or in addition), the teacher might have a direct control in the
dashboard to start a session with a group of students (and then to stop it once the game has been
played). In this case, it may be useful to store the actual start and end time of the game playing
session, in addition to the original scheduled times. The exact mechanisms of game scheduling,
students logging in and joining sessions, playing games, etc., will be further refined in the coming
months.
5.6 Student Game History
Once game sessions have been scheduled and played, the teacher will be in a position to review
these as a summary or history. This will provide the teacher with a quick overview of sessions related
either to a student or a group of students, showing:
• What game sessions are scheduled, running or completed
• What games have been played
• What prosocial domains have been evaluated through these games
• What prosocial domain “scores” that the student has achieved in each session
These features may be displayed in a table, as in Figure 37, which lists all sessions involving a
particular student. It shows the student’s name, group and the current date of this summary. The
teacher would be able to sort the table by various columns, e.g. date, game played, etc. By selecting
a particular session, the teacher could view further details of a completed game session (e.g. the low-
level game data), or edit the schedule details (for a schedule that had not yet been run). Other
options may also be available here.
Below the session summary table, it would be useful to display some charts to summarise aspects of
the student’s progress over a series of games. Here we propose to show charts for each PsL domain
(e.g. Trust, Cooperation, and Empathy), i.e. how the scores progress over time. Other visual
representations will be explored.
Along with a summary of an individual student’s sessions and progress, it would be useful to be able
to see figures for all students in a particular group. This is shown in Figure 38. Here, student scores
are itemised in the table, and would also be displayed as distinct lines on the charts below.

18/12/2015 | ProsocialLearn | D3.2 1st
Prosocial affect fusion and player modelling
Page | 59
Figure 37: Displaying a Student Game History

18/12/2015 | ProsocialLearn | D3.2 1st
Prosocial affect fusion and player modelling
Page | 60
Figure 38: Displaying a Group Game History

18/12/2015 | ProsocialLearn | D3.2 1st
Prosocial affect fusion and player modelling
Page | 61
6 Conclusions
This deliverable presented an initial overview of the multimodal fusion that is going to be applied in
ProsocialLearn. The synchronization problem has been described and tests are being performed for
identifying the best solution for solving the problem in the actual case of the PsL platform.
The debate between feature level and decision level fusion has been introduced. It is anticipated that
the project will follow a mixed approach fusing at feature level information extracted from
compatible sources (e.g. videos) while the general approach will be will be to perform decision level
multimodal fusion to combine information extracted from different sources.
The possible different emotion and engagement models have been analysed and, though the final
decision is still open, it is anticipated that one of the models including Pleasure/Arousal attributes
will likely be chosen.
The first draft design of operational models for the implementation of ProsocialLearn Core domains
is presented. The models will be further improved and tested through the short studies.
An improved version of the user model already (presented in D2.3) is also described and finally the
deliverable also includes some initial outlines of the graphical interface of the platform.

18/12/2015 | ProsocialLearn | D3.2 1st
Prosocial affect fusion and player modelling
Page | 62
7 References
Aurenhammer, F. (1991). Voronoi Diagrams – A Survey of a Fundamental Geometric Data Structure.
ACM Computing Surveys, 345–405.
Atrey, P. K., M. S. Kankanhalli, and R. Jain. 2006. “Information Assimilation Framework for Event
Detection in Multimedia Surveillance Systems.” ACM Multimedia Systems Journal 12 (3): 239–
53.
Attfield, Simon. 2011. “Towards a Science of User Engagement (position Paper).” In Proceedings of
WSDM Workshop on User Modelling for Web Applicaitons.
Bann, E. Y., and J. J. Bryson. 2013. “The Conceptualisation of Emotion Qualia: Semantic Clustering of
Emoiton Tweets.” In Proceedings of the 13th Neural Computation and Psychology Workshop.
Banos, Rosa Maria. 2004. “Immersion and Emotion: Their Impact on the Sense of Presence.” Cyber-
Psychology and Behaviour 7 (6): 734–41.
Biswas, P., and P. Robinson. 2012. “A Brief Survey on User Modelling.” In HCI in Speech, Image and
Language Processing for Human Computer Interaction.
Blandford, A., R. Butterworth, and P. Curzon. 2004. “Models of Interactive Systems: A Case Study on
Programmable User Modelling.” International Journal of Human-Computer Studies 60: 149–200.
Bradley, Margeret M., Mark K. Greenwald, Margaret C. Petry, and Peter J Lang. 1992. “Remembering
Pictures: Pleasure and Arrousal in Memory.” Journal of Experimental Psychology: Learning,
Memory, and Cognition 18 (2): 379–90.
Bredin, H., and G. Chollet. 2007. “Audio-Visual Speech Synchrony Measure for Talking-Face Identity
Verification.” In Proceedings of IEEE International Conference on Acoustics, Speech, and
Signal Processing, 233–36.Aurenhammer, F. (1991). Voronoi Diagrams – A Survey of a
Fundamental Geometric Data Structure. ACM Computing Surveys, 345–405.
Lehmann, L. K. (2006). The evolution of cooperation and altruism – a general framework and a
classification of models. Journal of Evolutionary Biology 19:5.
Brierley, P. 1998. Appendix A in "Some Practical Applications of Neural Networks in the Electricity
Industry". Eng.D. Thesis.
Broadie, A. 1991. “Trust. Presentation given for the Henry Duncan Prize.”
Brockmyer, Jeanne H. 2009. “The Development of the Game Engagement Questionnaire: A Measure
of Engagement in Video Game Playing.” Journal of Experimental Social Psychology 45 (4): 624–
34.
Brusilovsky, P. 2004. “KnowledgeTree: A Distributed Architecture for Adaptive E-Learning.” In
International Conference on World Wide Web, 104–13.
Carmagnola, F., F. Cena, and C. Gena. 2011. “User Model Interoperability: A Survey.” User Modelling

18/12/2015 | ProsocialLearn | D3.2 1st
Prosocial affect fusion and player modelling
Page | 63
and User-Adapted Interaction 21 (3): 295–331.
Castillejo, E., A. Almeida, and D. Lopez-de-Ipina. 2014. “Modelling Users, Context and Devices for
Adaptive User Interface Systems.” International Journal of Pervasive Computing and
Communications 10 (1): 69–91.
Chetty, G., and M. Wagner. 2005. “Audio-Visual Multimodal Fusion for Biometric Person
Authentication and Liveness Verification.” In Proccedings of the 2005 NICTA-HCSNet Multimodal
User Interaction Workshop, 17–24.
Chieu, H. L., and Y. K. Lee. 2009. “Query Based Event Extraction along a Timelien.” In Proceedings of
the ACM Conferenc Eon Research and Development in Information Retrieval, 425–32.
Clemmensen, T. 2004. “Four Approaches to User Modelling – a Qualitative Research Interview Study
of HCI Professionals’ Practice.” Interacting with Computers 16 (4): 799–829.
Cocea, M., and G. Magoulas. 2015. “Participatory Learner Modelling Design: A Methodology for
Iterative Learner Models Development.” Information Sciences 321 (10): 48–70.
Cowie, R., E. Douglas-Cowie, B. Apolloni, J. Taylor, and W. Fellenz. 1999. “What a Neural Net Needs
to Know about Emotion Words.” In Proceedings 3rd World Multiconference on Circuits, SYstems,
Communications, and Computers.
Dempster, A. 1968. “A Generalisation of Bayesian Inference.” Journal of the Royal Statistical Society,
205–47.
Dunn, J. R., and M. E. Schweitzer. 2005. “Feeling and Believing: The Influence of Emotion on Trust.”
Journal on Personality and Social Psychology 88 (5): 736.
Ekman, Paul. 1992. “An Argument for Basic Emotions.” Cognition and Emotion 6: 169–200.
Fraser, D. C., and J. E. Potter. 1969. “The Optimum Linear Smoother as a Combination of Two
Optimum Linear Filters.” IEEE Transactions on Automation and Control 14 (4): 387–90.
Gan, Q., and C. J. Harris. 2001. “Comparison of Two Measurement Fusion Methods for Kalman-Filter-
Based Multisensor Data Fusion.” IEEE Transactions in Aerospace and Electronic Systems 37 (1):
273–79.
Heinzel, Gerhard, Albrecht Rudiger, and Roland Shilling. 2002. “Spectrum and Spectral Density
Estimation by the Discrete Fourier Transform (DFT), Including a Comprehensive List of Window
Functions and Some New at-Top Windows.”
Hua, X. S., and H. J. Zhang. 2004. “An Attention-Based Decision Fusion Scheme for Multimedia
Information Retrieval.” In Proceedings of 5th Pacific-Rim Conference on Multimedia.
Irwin, Harvey J. 1999. “Pathological and Non-Pathological Dissociation: The Relevance of Childhood
Trauma.” The Journal of Psychology 133 (2): 157–64.

18/12/2015 | ProsocialLearn | D3.2 1st
Prosocial affect fusion and player modelling
Page | 64
Iyengar, G., H. J. Nock, and C. Neti. 2003. “Audio-Visual Synchrony for Detection of Monologue in
Video Archives.” In Proceedings of IEEE International Conference on Acoustics, Speech, and
Signal Processing.
Jaimes, A., and N. Sebe. 2005. “Multimodal Human Computer Interaction: A Survey. Computer Vision
in Human-Computer Interaction.” Lecture Notes in Computer Science 3766: 1–15.
Jain, A., K. Nansakumar, and A. Ross. 2005. “Score Normalization in Multimodal Biometric Systems.”
Pattern Recognition 38 (12): 2270–85.
Kahou, Samira Ebrahimi, Xavier Bouthillier, Pascal Lamblin, Caglar Gulcehre, Vincent Michalski,
Kishore Konda, Sébastien Jean, et al. 2015. “EmoNets: Multimodal Deep Learning Approaches
for Emotion Recognition in Video,” March. http://arxiv.org/abs/1503.01800.
Kardan, A., M. Aziz, and M. Shahpasand. 2015. “Adaptive Systems: A Content Analysis on Technical
Side for E-Learning Environments.” Artificial Intelligence Review 44 (3): 365–91.
Keltner, D., A. Kogan, P. K. Piff, and S. R. Satum. 2014. “The Sociocultural Appraisals , Values, and
Emotions (SAVE) Framework of Prosociality: Core Processes from Gene to Meme.” Annual
Review of Psychology 65: 94–107.
Lehmann, Janette. 2012. “Models of User Engagement.” In User Modelling, Adaptation, and
Personalization, 164–75.
LEHMANN, L. KELLER, L. (2006). The evolution of cooperation and altruism – a general framework
and a classification of models. Journal of Evolutionary Biology 19:5.
Luhmann, N. 2000. “Familiarity, Confidence, Trust: Problems and Alternatives.” Trust: Making and
Breaking Cooperative Relations 6: 94–107.
Marsh, S. P. 1994a. Formalising Trust as a Computational Concept.
———. 1994b. “Optimisim and Pessimism in Trust.” In Proceedings of Ibero-American Conference on
Artificial Intelligence.
Martinez-Villasenor, M. de Loudres. 2014. “Enrichment of Learner Profile with Ubiquitous User
Model Interoperability.” Computacion Y Sistemas 18 (2): 359–74.
Mehrabian, A. 1996. “Pleasure-Arousal-Dominance: A General Framework for Describing and
Measuring Individual Differences in Temperament.” Current Psynchology: Developmental,
Learning, Personality, Social 14: 261–92.
Moneta, Giovanni B., and Mihaly Csikszentmihalyi. 1999. “Models of Concertation in Natural
Environments: A Comparitive Approach Based on Streams of Experimental Data.” Social
Behaviour and Personality 27 (6): 603–37.
Morrison, Donn, Ruili Wang, and Liyanage C. De Silva. 2007. “Ensemble Methods for Spoken Emotion

18/12/2015 | ProsocialLearn | D3.2 1st
Prosocial affect fusion and player modelling
Page | 65
Recognition in Call-Centres.” Speech Communication 49 (2): 98–112.
Mroueh, Youssef, Etienne Marcheret, and Vaibhava Goel. 2015. “Deep Multimodal Learning for
Audio-Visual Speech Recognition.” In Proceedings of IEEE International Conference on Acoustics,
Speech, and Signal Processing.
Newell, Allen, and H. A. Simon. 1995. “GPS, a Program That Simulates Human Thought.” In
Computers & Though, 279–93.
O’Brien, Heather L., and Elaine G. Toms. 2008. “What Is User Engagement? A Conceptual Framework
for Defining User Engagement with Technology.” Journal of the American Society for
Information Science and Technology 69 (6): 938–55.
Olsen, Tanner, Katelyn Procci, and Clint Bowers. 2011. “Serious Games Usability Testing: How to
Ensure Propoer Usability, Playability, and Effectiveness.” In Design, User Experience, and
Usability: Theory, Methods, Tools, and Practice, 625–34.
Payne, S. J., and T. R. G. Green. 1986. “Task-Action Grammars: A Model of Mental Representation of
Task Languages.” Human Computer Interaction 2 (2): 93–133.
Peleg, B., & Sudholter, P. 2003. Introduction to the Theory of Cooperative Games. amsterdam: Kluwer
Academic.
Plutchik, R. 2001. “The Nature of Emotions.” American Scientist 89 (4).
Rashidi, A., and H. Ghassemian. 2003. “Extended Dempster–shafer Theory for Multi-System/sensor
Decision Fusion.” In Proc. of Commission IV Joint Workshop on Challenges in Geospatial
Analysis, 31–37.
Resnick, Hy, and Moshe Sherer. 1994. “Electronic Tools for Social Work Practise and Exucation: Part
1.” Computers in Human Services 11 (1): 2.
Rotenberg, K. J. 2010. “The Conceptualisation of Interpersonal Trust: A Basis, Domain, and Target
Framework.” Interpersonal Trust during Childhood and Adolesence, 8–27.
Rotenberg, K. J., M. J. Boulton, and C. L. Fox. 2005. “Cross-Sectional and Longitudinal Relations
among Children’s Trust Beliefs, Psychological Maladjustment, and Social Relationships: Are Very
High as Well as Very Low Trusting Children at Risk?” Journal of Abnormal Child Psychology 33
(5): 595–610.
Russell, James A. 1980. “A Circumplex Model of Affect.” Journal of Personality and Social Psychology
39 (6): 1161–78. doi:10.1037/h0077714.
Boon, S.D. and J. G. Holmes. 1991. “The Dynamics of Interpersonal Trust: Resolving Uncertainty in the
Face of Risk.” Cooperation and Prosocial Behaviour, 190.
Sanderson, C., and K. K. Paliwal. 2004. “Identity Verification Using Speech and Face Information.”

18/12/2015 | ProsocialLearn | D3.2 1st
Prosocial affect fusion and player modelling
Page | 66
Digital Signal Processing 14 (5): 229–80.
Schroff, Florian, Dmitry Kalenichenko, and James Philbin. 2015. “FaceNet: A Unified Embedding for
Face Recognition and Clustering.” In Proceedings of the IEEE Conference on Computer Vision and
Pattern Recognition. http://arxiv.org/abs/1503.03832.
Shafer, G. 1976. A Mathematical Theory of Evidence.
Singer, Michael J., and Bob G. Witmer. 1999. “On Selecting the Right Yardstick.” Presence:
Teleoperators and Virtual Environments 8 (5): 566–73.
Snoek, Cees G. M., Marcell Worring, and Arnold W. M. Smeulders. 2005. “Early versus Late Fusion in
Semantic Video Analysis.” In Proccedings of the 13th Annual ACM International Conference on
Multimedia.
Tamborini, Ron, and Paul Skalski. 2006. The Role of Presence in the Experience of Electronic Games.
Terusaki, Kevin, and Vince Stigliani. 2014. “Emotion Detection Using Deep Belief Networks.”
Wang, J., M. S. Kankanhalli, W. Q. Yan, and R. Jain. 2003. “Experiential Sampling for Video
Surveillance.” In Proceedings of ACM Workshop on Video Surveillance.
Wang, X. H., D. Q. Zhang, T. Gu, and H. K. Pung. 2004. “Ontology Based Context Modelling and
Reasoning Using OWL.” In Proceedings of the Second IEEE Annual Conference on Pervasive
Computing and Communications Workshop, 18–22.
Wang, Xaioyun, and Tingdi Zhao. 2014. “Operation Condition Monitoring Using Temporal Weighted
Dempster-Shafer Theory.” In Annual Conference of the Prognostics and Health Management
Society.
Whitehill, Jacob. 2014. “The Faces of Engagement: Automatic Recognition of Student Engagement
from Facial Expressions.” IEEE Transactions on Affective Computing 5 (1): 86–98.
Wu, Huadong, Mel Siegel, Rainer Stiefelhagan, and Jie Yang. 2002. “Sensor Fusion Using Dempster-
Shafer Theory.” In Proccedings of the IEEE Instrumentation and Measurement Conference.
Yan, R., J. Yang, and A. Hauptmann. 2004. “Learning Query-Class Dependent Weights in Automatic
Video Retrieval.” In Proceedings of ACM International Conference on Multimedia, 548–55.

18/12/2015 | ProsocialLearn | D3.2 1st
Prosocial affect fusion and player modelling
Page | 67
8 Appendix A: Game Data Ingest Service Message Format
The PsL platform provides a Game Data Ingest Service that is capable of capturing data used for
characterising game play from a number of perspectives:
• Anonymised game player information
• High-level game events
• Game transactions
• Emotion classifications
A technical description of the transport mechanism and message format specification for these data
types is provided in the sections that follow. Please note: this specification is versioned and subject
to change, according any evolution of requirements as the project progresses (these will be updated
in subsequent versions of this document).
Game ingest transport and end-point
All game log messages provided to the Game Data Ingest Service will be delivered via a pub-sub
based messaging broker. There are many internet based message brokering systems and
technologies16 available and a review of these is beyond the scope of this document. An important
criteria for selecting support for network based transport is a low technical barrier for adoption; i.e.,
game developers should be offered a technology that is widely available and easy to use. To this end,
the platform will initially offer a WebSockets based transport layer and end-point as a means of
delivering log messages.
End-point definition
In order to send a game log message to the logging service you will require:
• A WebSocket connection accepted by the logging service WS port17
• A correctly formatted message consisting of:
o A game topic label
o A log message payload
The details of the message format are provided at the end of this appendix.
16 Well known of these include RabbitMQ, ActiveMQ and Apache Qpid. 17 This is port 7080 by default; this port number may varying, depending on configuration of the platform.

18/12/2015 | ProsocialLearn | D3.2 1st
Prosocial affect fusion and player modelling
Page | 68
Figure 39: High-level interaction between logging game client and the PsL Game Data Ingest Service
In the figure above a high-level overview of the game log processing between game client and the
Logging Service is illustrated. Note that it is the game developer’s responsibility to select the
appropriate WebSocket API technology for their game platform and to construct correctly formed
logging messages using the format specification.
Technical platform WebSocket API
Javascript/Web browser Native Javascript support (Chrome; Firefox etc)
Java Java 7 JSR 356/Autobahn.ws
C# .NET Framework 4.5+/WebSocket4net
C++ Libwebsockets/Autobahn.ws
Python Autobahn.ws

18/12/2015 | ProsocialLearn | D3.2 1st
Prosocial affect fusion and player modelling
Page | 69
Message format
The ProsocialLearn logging system provides a message brokerage service that manages the direction
and translation of game log messages. Each game logging client is required to send messages to the
logging service which begin with a topic label and follow with a log payload. The contents of the log
payload will depend on the type of message being sent; each message payload consists of a ‘log
prefix’ that prescribes the type and other identifying data of the message and a ‘log message body’
that contains meta-data specific to the message type and also actual data.
A topic label is used to identify the type of game (as defined by its title) and the particular instance of
the game being played (using an alpha-numeric representation of a UUID); the two elements are
separated by a period symbol.
game title separator game instance UUID alpha-numeric string
Example topic label: Candy Quest . f2207240-0606-486b-89ee-c7fb04f0add3
All messages sent to the logging service should be wrapped in the following simple JSON container:
topic label log payload
UTF-8 char array UTF-8 char array
{ “topic”: “<topic label>”, “message” : “<log payload>” }
Fully wrapped examples of these messages can be found in the log message bodies section, later in
this appendix.
Log primitive data type definitions
The message format uses a small number of primitive data types expressed alpha-numerically,
conventions for messages and their types are defined here:
• All messages are represented as UTF-8 strings
• Each indexed element is separated with a ‘DLIM’ type.
• All messages are ended using a ‘TERM’ type.
• Quotation marks must be escaped
• All identifiers are standard 128bit UUIDs (type 4)
• All string data is UTF-8 formatted
TYPES
Number of UTF-
8 chars Notes
DLIM | 1
TERM TERM 4
ENUM XXX up to 3
Unsigned numeric value representing a unique member of a
set. 0 always means 'undefined'
UUID 8-4-4-4-12 format 36
INTEGER [-] XXXXXXXXXXXXX 14
STRING alpha-numeric array
arbitrary or
fixed, as
specified
FLOAT [-] XXXXXXXXX.XXXXXX 18

18/12/2015 | ProsocialLearn | D3.2 1st
Prosocial affect fusion and player modelling
Page | 70
TIME XXXXXXXXXXXXX 13 Unsigned integer specifying UTC EPOCH milliseconds
Log prefix
The log prefix includes meta-data that provide identifiers for the message including the version of the
log message [index 0], the local time of logging [index 1] and the primary type of the log message [3].
Log prefix
Index 0 1 2
Parameter Log version (ENUM) Time stamp Log type (ENUM)
Specification 1 v0.1 timestamp: TIME 1 Game Player Info
2 Game Event
3 Cooperation transaction
4 Fairness transaction
5 Generosity transaction
6 Emotion classification
Detailed specification of these message types is explored in the log message body sections below.

Game client log message bodies
GAME PLAYER INFO message type
Game player info
Index 0 1 2 3 4 5 6
Parameter Log sub-type (ENUM) Param 1 Param 2 Param 3
Specification 1 Player info Player ID: UUID Player nick-name : STRING [64 chars] [TERM]
2 Avatar info Avatar ID: UUID Avatar nick-name :STRING [64 chars] [TERM]
3 Player/Avatar map Player ID: UUID Avatar ID:UUID [TERM]
Parameters
• Player and Avatar IDs: UUIDs uniquely and consistently representing the game players and
any avatars used by them.
• Nick-names: 64 character string used to display the name of the player or avatar on-screen in
the game
Examples
1 Player info
{"topic":"ExampleGame.96b1d4a5-8f1f-4521-a07e-
46e17ad991cc","message":"1|1446557597388|1|1|35f20b21-e727-46ac-85fc-
0d7bebb6e44f|Alice|TERM"}
2 Avatar Icon info
{"topic":"ExampleGame.96b1d4a5-8f1f-4521-a07e-
46e17ad991cc","message":"1|1446557597395|1|2|cca02bca-94cf-4872-bcbe-ad24bf07b271|The
Guide|TERM"}
3 Player/Avatar Icon map
{"topic":"ExampleGame.96b1d4a5-8f1f-4521-a07e-
46e17ad991cc","message":"1|1446557597395|1|3|35f20b21-e727-46ac-85fc-
0d7bebb6e44f|cca02bca-94cf-4872-bcbe-ad24bf07b271|TERM"}

31/10/2015 | ProsocialLearn | Prosocial affect fusion and player modelling
Page | 72
GAME EVENT message type
Game event
Index 0 1 2 3 4 5 6
Parameter Log sub-type (ENUM) Param 1 Param 2
Specification 1 Game started [TERM]
2 Game ended [TERM]
3 Level started Level ID: INTEGER Title of level: STRING [64 chars] [TERM]
4 Level ended Level ID: INTEGER [TERM]
5 Scenario started Scenario ID: INTEGER Title of scenario: STRING [64 chars] [TERM]
6 Scenario ended Scenario ID: INTEGER [TERM]
Parameters
• Game started/stopped: uses the ENUM value to indicate these events (time-stamp provided
in the log prefix)
• Level/Scenario started: level IDs are represented by arbitrary integers; a string title should be
provided to assist understanding of the game structure if possible; otherwise repeat the level
ID.
• Level/Scenario stopped: the completion of a particular level or scenario as identified by the
ID provided at its start.
Examples
1 Game started
{"topic":"ExampleGame.96b1d4a5-8f1f-4521-a07e-
46e17ad991cc","message":"1|1446557597395|2|1|TERM"}
2 Game ended
{"topic":"ExampleGame.96b1d4a5-8f1f-4521-a07e-
46e17ad991cc","message":"1|1446557597395|2|2|TERM"}
3 Level started
{"topic":"ExampleGame.96b1d4a5-8f1f-4521-a07e-
46e17ad991cc","message":"1|1446557597396|2|3|1|Level 1|TERM"}
COOPERATION transaction message type (EXAMPLE)
Game transaction messages are under development within the project as the PsL core domain
models are further refined. Below is an example of one such set of game transaction messages, for
cooperation.
Cooperation
transaction
Index 0 1 2 3 4 5 6
Parameter Log sub-type (ENUM) Param 1 Param 2 Param 3

31/10/2015 | ProsocialLearn | Prosocial affect fusion and player modelling
Page | 73
Specification
1 Avatar private goods
value Avatar ID: UUID
goods value:
FLOAT [TERM]
2 Avatar private benefit
value Avatar ID: UUID
benefit value:
FLOAT [TERM]
3 Game public goods
value
goods value:
FLOAT [TERM]
4 Game public benefit
value
benefit value:
FLOAT [TERM]
5 Move classification Avatar ID: UUID moveType:ENUM
availStagMoves:FL
OAT
1 Stag move
2 Hare move
3 Neutral move
continues…
3 7 8 9 10
Log sub-type (ENUM)
5 Move classification availHareMoves: FLOAT availNeutralMoves:FLOAT Transaction duration (ms): INTEGER [TERM]
Parameters
• Private goods and benefits values: numerical values currently attributed to a specific player
(represented by their avatar).
• Public goods and benefits values: numerical values representing the current public good and
benefits values for the game.
• Move classification: the classification of a move made by the player (represented by the
avatar) using the moveType enumeration.
• Move avail(ability) [parameters 6-8]: a quantification of the availability of possible moves
represented by the moveType enumeration.
• Transaction duration: the time in milliseconds taken for the player to make a move, once it
was available to them to do so.
Examples
1 Avatar private goods value
{"topic":"ExampleGame.7efe923b-bcd8-4822-85fb-
408d03b61796","message":"1|1446560340233|3|1|cca02bca-94cf-4872-bcbe-
ad24bf07b271|10|TERM"}
2 Avatar private benefit value
{"topic":"ExampleGame.7efe923b-bcd8-4822-85fb-
408d03b61796","message":"1|1446560340233|3|2|cca02bca-94cf-4872-bcbe-
ad24bf07b271|20|TERM"}
3 Game public goods value

31/10/2015 | ProsocialLearn | Prosocial affect fusion and player modelling
Page | 74
{"topic":"ExampleGame.7efe923b-bcd8-4822-85fb-
408d03b61796","message":"1|1446560340233|3|3|1.5|TERM"}
4 Game public benefit value
{"topic":"ExampleGame.7efe923b-bcd8-4822-85fb-
408d03b61796","message":"1|1446560340233|3|4|2.5|TERM"}
5 Move classification
{"topic":"ExampleGame.7efe923b-bcd8-4822-85fb-
408d03b61796","message":"1|1446560340233|3|5|cca02bca-94cf-4872-bcbe-
ad24bf07b271|1|1|2|3|3000|TERM"}