D T IC A · B. W. Calien R. A. Fiedler ... Illinois 61801 D T IC S ECTE AUG 2 01992 April 1992 A...
111
PL-TR-92-2115AD-A256 687 HYDRODYNAMIC METHODS FOR MONITORING UNDERGROUND NUCLEAR TESTS F. K. Lamb J. D. Sullivan B. W. Calien R. A. Fiedler University of Illinois at Urbana-Champaign Department of Physics 1110 West Green Street Urbana, Illinois 61801 D T IC S ECTE AUG 2 01992 April 1992 A Final Report 16 September 1988-31 December 1991 Approved for public release; distribution unlimited PHILLIPS LABORATORY AIR FORCE SYSTEMS COMMAND HANSCOM AIR FORCE BASE, MASSACHUSETTS 01731-5000 92-23092 12 8 19 019 ii lF 1 i1I1IItlll
Transcript of D T IC A · B. W. Calien R. A. Fiedler ... Illinois 61801 D T IC S ECTE AUG 2 01992 April 1992 A...
PL-TR-92-2115AD-A256 687
HYDRODYNAMIC METHODS FOR MONITORING
UNDERGROUND NUCLEAR TESTS
F. K. Lamb
J. D. SullivanB. W. Calien
R. A. Fiedler
University of Illinois at Urbana-ChampaignDepartment of Physics
1110 West Green Street
Urbana, Illinois 61801 D T ICS ECTE
AUG 2 01992April 1992 A
Final Report
16 September 1988-31 December 1991
Approved for public release; distribution unlimited
PHILLIPS LABORATORYAIR FORCE SYSTEMS COMMANDHANSCOM AIR FORCE BASE, MASSACHUSETTS 01731-500092-23092
12 8 19 019 ii l F 1 i1I1IItlll

SPONSORED BYDefanse Advanced Research Projects Agency
Nuclear Monitoring Research OfficeARPA ORDER NO. 5307
MONITORED BYPhillips Laboratory
Contract No. F19628-88-K-0040
The views and conclusions contained in this document are those ofthe authors and should not be interpreted as representing theofficial policies, either expressed or implied, of the DefenseAdvanced Research Projects Agency or the U.S. Government.
This technical report has been reviewed and is approved forpublication.
Solid Earth Geophysics Branch Solid Earth Geophysics BranchEarth Sciences Division Earth Sciences Division
DONALD H. ECKHARDT, DirectorEarth Sciences Division
This report has been reviewed by the ESD Public Affairs Office(PA) and is releasable to the National Technical InformationService (NTIS).
Qualified requestors may obtain additional copies from the DefenseTechnical Information Center. All others should apply to theNational Technical Information Service.
If your address has changed, or if you wish to be removed from themailing list, or if the addressee is no longer employed by yourorganization, please notify PL/IMA, Hanscom AFB, MA 01731-5000.This will assist us in maintaining a current mailing list.
Do not return copies of this report unless contractual obligationsor notices on a specific document requires that it be returned.

REPORT DOCUMENTATION PAGE i N, '4)4 004M
. p• .^ • .j•-.. . . , , •.. .. ,, ., , .. .. . ,h,,, p •-f p .p,, •., , ' -. *. a'. -, .'. 4v . -,q , ' ? ?Pil• . su~ ,.
,l ,' ' 4, ",) • . ; ... , . .' •* . ",.4CO 1@ .- •L .•.. •,t..,, t 1- f l•, h''8>', fl" ' ¾, 4'd 1,0: .(? S0 0
1 AGENCY USE ONLY ,?,.' b'A. 2 REPORT DATE 3 REPORT TYPE AND DATES COVERED
April, 1992 Final Report 9/16/88-12/31/914. TITLE AND SUBTITLE S. FUNDING NUMBERS
Hydrodynamic Methods for Monitoring Underground ContractNuclear Tests F19628-88-K-0040
P_ F 62714E6 AUTHOR(S) PR 8A10
F. K. Lamb* B.W. Callen TA DAJ. D. Sullivan* R. A. Fiedler WU AL
7. PERFORMING ORGANIZATION NAME(S) AND ADDRESS(ES) 8. PERFORMING ORGANIZATION
University of Illinois at Urbana-Champaign REPORT NUMBER
Department of Physics1110 West Green StreetUrbana, IL. 61801
9 SPONSORING /MONITORING AGENCY NAME(S) AND ADDRESS(ES) 10. SPONSORING/MONITORING
Geophysics Laboratory AGENCY REPORT NUMBER
Hanscom AFB, MA 01731-5000
Contract Manager: James Lewkowicz/GPEH PL-TR-92-2115
11 SUPPLEMENTARY NOTES
* Co-investigators
12a. DISTRIBUTION/AVAILABILITY STATEMENT 12b. DISTRIBUTION CODE
Approved for public release; distribution unlimited
13. ABSTRACT (Maximum 200 words)
Research performed under this contract is designed to improve the analysis andinterpretation of shock-wave data in the hydrodynamic region gathered in the past or in thefuture to monitor agreed limitations on underground nuclear testing. Researchaccomplishments include: (1) refinement and comparison to numerical simulations andactual nuclear test data of an approximate analytical model of the shock-front radius vs.time relationship for a variety of geologic media; (2) assembly of a Hugoniot database forseveral important classes of geologic materials; (3) investigation-by means of theapproximate analytical model--of the nature and physical basis of the insensitive intervaldiscovered empirically in hydrodynamic data taken at US test sites; (4) a rigorous analysisof the conditions under which cube-root scaling is an exact condition in the hydrodynamicregion; (5) detailed analysis using state-of-the art, one-dimensional hydrodynamicnumerical simulations of the effects of source parameters on hydrodynamic yieldestimation; (6) the development of a state-of-the-art, two-dimensional hydrodynamic codesuitable for simulating two-dimensional source and/or ambient medium effects.
14. SUBJECT TERMS 15. NUMBER OF PAGES
Threshold Test Ban Treaty, hydrodynamic methods, shock waves, 110underground nuclear explosions 16. PRICE CODE
17. SECURITY CLASSIFICATION 18. SECURITY CLASSIFICATION 19. SECURITY CLASSIFICATION 20. LIMITATION OF ABSTRACTOF REPORT OF THIS PAGE OF ABSTRACTUnclassified Unclassified Unclassified SAR
NSN 7540-01.280-5S00 Stancdard For," 298 (Rey 2-89)0'v b" bV S .I%1%d zl9.'S
2 9S '02
I. OBJECTIVES
The overall objective of the project was to improve the analysis and interpretation ofshock wave data gathered in the past or in the future to monitor agreed limitations onunderground nuclear testing. Specific objectives were to explore the effects of the ambient
geologic medium on yield estimates made using shock wave methods; to investigate theeffects of different test geometries; and to explore the possibility of using shock wave
methods to monitor limitations well below the current yield limit of 150 kt.
II. ACHIEVEMENTS
The overall and specific objectives of this project have been achieved. In particular:
(1) We refined and fully analyzed a simple analytical model for shock-wave propagation in
homogeneous media proposed earlier by one of the investigators (FKL) to understand tileusefulness of the model in exploring the sensitivity of shock-front radius vs. time (RVT)
relationships to variations in the properties of ambient geologic media. As part of ourevaluation, we used the model to estimate the yield of six underground nuclear explosions,using unclassified radius vs. time data, as well as numerical simulations of explosions in
two different media. (The RVT data from the six actual explosions represent all currentlyavailable unclassified data applicable to studies in the hydrodynamic region.) When we
used the best piccewise-continuous representation of Hugoniot data available in the openliterature, we found that the analytical model gave yield estimates accurate to eight percentor better for all cases studied.
(2) In order to exploit capabilities offered by the analytical model for carrying out simple
sensitivity and error analyses, we collected Hugoniot data from the open literature for awide range of geologic media believed to be characteristic of U.S. and (former) Soviet test
sites.
(3) Using the analytical model, we carried out a two-part study of the insensitive interval.This interval, which was discovered empirically in studies of U.S. test data, is a portion of
the hydrodynamic region for which the shock-front radius vs. time relationship is relatively
insensitive to the properties of geologic media, yet still sensitive to the yield. Using a first-order approximation to the crossing point predicted by the analytical model for the radiusvs. time curves for two different media, we first demonstrated that the existence of an
insensitive interval is related to the existence of a simple power-law correlation between
the parameters describing the Hugoniot in the linear (high-pressure) region for silicates and,•irnilarly, for carbonat- (These two classes are representative of media encountered in the
majority of U.S. underground tests.) Next, without making any approximations, we usedthe analytical model together with a simple representation of experimental uncertaintiesto sttidy further the characteristics of the insensitive interval and to map its location
1

for silicate and carbonate ambient media. These latter studies are illustrative of theresults one would expect from a full error and uncertainty analysis of hydrodynamic yielddetermination. To carry out a full analysis one must have detailed knowledge of theexperimental apparatus employed to gather data in the hydrodynamic region (currently
unavailable in the open literature) and of uncertainties in parameters characterizing theambient medium. The product of such an analysis would be an optimal set of weights tobe assigned to experimental data throughout the hydrodynamic region; the most heavilyweighted region would correspond to the insensitive interval.
(4) Essentially all models-empirical, numerical, or otherwise-used to reduce data takenin the hydrodynamic region assume cube-root-of-yield scaling, yet previous theoreticalstudies of this scaling are incomplete and, in some cases, are in error. Accordingly, we
carried out a rigorous examination of the conditions necessary for cube-root scaling toobtain in the hydrodynamic region. We find that the initial value data (source data) mustalso scale if cube-root scaling is to be exact.
(5) We modified an existing one-dimensional, state-of-the-art hydrodynamic code (Zeus)
at the UIUC National Center for Supercomputing Applications (NCSA) in two importantways: (i) the code was modified to accept tabular representations of the equation-of-stateof source and ambient media, and (ii) the code was changed to explicitly conserve totalenergy. The resultant code permits distinct equation-of-state choices to be made for thesource and ambient medium and is optimized to run efficiently in a vector processing mode.The modified code was carefully checked against the analytic Sedov-Taylor blast wave
solution, which is asymptotically correct for explosions in an ideal gas medium. Finally.we used the modified one-dimensional code to simulate a set of underground explosionsin order to study 'he dependence of hydrodynamic yield estimates on the mass, size, andcomposition of the source. These simulations were carried out for two different ambient
media and three different source equations of state.
(6) We developed a modified version of the state-of-the-art, two-dimensional Zeus codeat NCSA. The changes and characteristics of Zeus-2D-Mod are similar to Zeus-iD-Moddescribed just above. Zeus-2D-Mod can be utilized to simulate two-dimensional sourceand/or ambieint medium effects, such as cylindrical sources and layered media.
Accesion For
NTIS CRA&IDTIC TAB BUnannounced i "Justification .. IC Q.t... L... " .
By .... .......
Dist
A-I 9-
III. PAPERS PREPARED UNDER THIS CONTRACT
1. F. K. Lanm, B. W. Callen, and J. D. Sullivan, "Yield Estimation Using Shock Wave
Methods," Explosion Source Phenomenology, Geophysical Monograph 65, edited by
S. R. Taylor, P. G. Richards, and H. J. Patton, American Geophysical Society,
Washington, D. C., pp. 73-89, 1991.
2. F. K. Lamb, B. W. Callen, and J. D. Sullivan, "An Approximate Analytical Model
of Shock Waves from Underground Nuclear Explosions," Journal of Geophysical
Research, Vol. 97, No. B1, pp. 515-535, 1992.
3. B. W. Callen, F. K. Lamb, and J. D. Sullivan, "Insensitive Interval in theEvolution of Shock Waves," Shock Compression in Condensed Matter-1989, edited
by S. C. Schmidt, J. N. Johnson, and L. W. Davidson, Elsevier Science, New York.
pp. 241-244, 1990.
4. F. I%.. Lamb, B. NV. Callen, and J. D. Sullivan, "Insensitive Interval in the Evolution of
Shock Waves from Underground Nuclear Explosions," presented at the 11th AnnualAFGL/DARPA Seismic Research Symposium (GL-TR-90-0301, ADA229228), San
Antonio, Texas, 2-4 May 1989.
5. B. W. Callen, F. hK. Lamb, and J. D. Sullivan, "Hydrodynamic Determination of the
Yield of Underground Nuclear Explosions," presented at the 12th Annual DARPA/GL
Seismic Research Symposium (GL-TR-90-0212, ADA226635), Key West, Florida, 18-
20 September 1990.
6. B. W. Callen, R. A. Fiedler, F. K. Lamb, and J. D. Sullivan, "Effects of Source
Parameters on Hydrodynamic Yield Estimation and New Results on the Insensitive
Interval," presented at 13th Annual PL/DARPA Seismic Research Symposium (PL-
TR-91-2208, ADA241325), Keystone, Colorado, 8-10 October 1991.
7. F. K. Lamb, R. A. Fiedler, B. W. Callen, and J. D. Sullivan, "Effects of Source
Parameters on Hydrodynamic Yield Estimation," detailed manuscript in preparation
for submission to Journal of Geophysical Research.
S. B. W. Callen. F. K. Lamb, J. D. Sullivan, and R. A. Fiedler, "The Insensitive Interval and
Optimal Weighting of Experimental Data from the Hydrodynamic Region," detailed
manuscript in preparation for submission to Journal of Geophysical Research.
C'opies of papers (1) (6) are contained in Appendix A to this report.
3
Appendix A
YIE I. D [SllIAI-0 Io ; IN( 'llOCK \%AVE M E IIWDS
Fre•leri~k K Laiib• Bruce \% C allen, and J.-rnniah D Sulhlan
Department of Physics and Prograii in Arnis Control D) sarniamiiint. and I titerrnatiiil ,-m, i ii
University if Illinois at Urbana-Champaign. 1 rhana Illinois 61801
.4bstract The yields of underground nuclear explosions can be es- explosion can therefore be estimated by comparing measurements oftimated using shock wave methods These methods make use of the those quantities with a model of the evolution of the shock wave infact that the strength of the expanding shock wave prliured by an the asribient geologic medium. Although in principle the yield ranunderground explosion increases with the yieil W',e first *liscusis the he estimated from measurements of the post-shock particle speed orbasis of shock wave yield estimation methos. including the proper- pressure, in practice constructing and emplacing transducers to mea-ties of shock waves in r, 4k, the evolution of the shock waves produced sure these quantities and obtaining reliable measurements has provedby underground nuclear explosions, and the dependence of the evo- difficult For this reason, U. S. efforts to develop shock w- - ,'eldlution on the properties of the ambient medium W'e then describe estimation methods have for the past 15 years emphasized tec, wuesseveral techniques that have been developed in the United States for sensing the position of the shock front as a function of time andto measure the shock front position as a function of time, including for analyzing such position measurements to obtain a yield estimatethe so-called CORRTEX technique Finally. we consider several of Hence, in the present review we focus primarily on this approachthe algorithms that have been used to derive )eld estimates from We begin in §2 by summarizing some of the relevant properties ofmeasurements of the shock front position as a function of time the shock waves in rock and reviewing the phases of an underground nu-application of these algorithms to low-yield explosions and the ex- clear explosion. We then introduce a simplified model and use it topected accuracy of shock wave methods illustrate how the shock wave produced by a spherically-symmetric
point explosion would evolve Finally, we discuss the more complexevolution of the shock waves produced by actual underground nu-
I introduction clear tests. In 13 we explain the CORRTEX technique currently usedby the United States to measure the position of the shock front as
Shock wave methods have long been used to estimate the yields a function of time. In 14 we describe several of the algorithms thatof nuclear explosions, both in the atmosphere (see. for example, Se- have been used to derive yield estimates from shock front positiondov (,1946, 19591 and Taylor [)950a. 1950b[) and underground (see. measurements, the application of these algorithms to low-yield explo-for example. Johnson, Higgins, and Violet [19591, Nuckolls [19591, stins, and the expected accuracy of shock wave methods. Our con-Butkovich [1965)) Shock wave methods were introduced as a treaty- clusions are summarized in J6. For a discussion of the implicationsmonitoring tool in the original 1976 Protocol of the Peaceful Nu- of using shock wave methods to monitor present and possible futureclear Explosions Treaty (PNET). which explicitly established such limitations on underground nuclear testing, see Lamb [1988].methods as among those that could be used to monitor the yield ofany salvo of underground explosions with a planned aggregate yield 2 Shock Waves from Underground Nuclear Explosionsgreater than 150 kilotons (kt) [U S Arms Control and DisarmamentAgency. 1990a]. the United States and the Soviet Union have re- In this section, we summarize briefly the general properties of shockcently ratified new verification protocolq for bot. the PNET and waves in rock, describe the phases of an underground nuclear explo-the Threshold Test Ban Treaty (TTBT) that allow the use of shock sion. and discuss the evolution of the spherical shock wave producedvave yield estmation rnpthc.'- for explroions having a planned yield by a point explosion in a uniform solid medium. Finally, we describegreater than 50 kt (the texts of these protocols may be found in U S the sometimes quite complex shock waves in rock produced by actualArms Control and Disarmament Agency [1990b)) nuclear tests
In this article, we review shock wave yield estimation methods andtheir application to nuclear test monitoring Such methods make Shock Waves in Rockuse of the fact that the strength of the shock wave produced by anunderground nuclear explosion increases with the yield of the explo- Shock waves in rock behave differently from shock waves in air,sion, other things being equal. As a result, the speed of the shock primarily because the atoms in rock are close together and interactfront and the particle speed and pressure just behind it are greater strongly (see Zel'dovich and Raizer (19671, pp 685-70.5). that is, theat a given radius for explosions of greater )ield The yield of the equation of state is fundamentally different
Elastic and plastic waves.-The strength of a shock wave can liecharacterized by the peak pressure that it produces Weak shock
At,, Depsajx-meni if Airnnorny waves and acoustic waves in rock propagate at a constant speed.
the so-called elastic wave speed (see Zel'dovich and Raizer 119671.
Explosion Source Phenomenology pp 741-746)Geophysieal Monograph 65 / hsn + •G0\Copynght 1991 American Geophysical Unn =\ , .Il
The U.S. Government is authorized to reproduce and sell this report. 73Permission for further reproduction by others must be obtained fromthe copyright owner.
5

74 YIELD ESTIMATION USING SHOCK WAVE METHODS
Here Ko and Go are the bulk and shear moduh, respectively, of the This relation is called the Ilugoniot It is not the therrmd),JvnarTcrock in its standard state, and p0 is the mass density The speed cl path followed by a fluid element dluring shock comnpression hit rat hlris also sometimes called the longitudinal sound speed For granite, the locus of all final states (p. I, ) that cart be reached by shock CIA,)K0 =z 36GPa and Go 0 32t;Pa [lHolzer. 1965] giving c, : 5 5 kms-' pression from a given initial starte (p,. i,) fhe final thermodynamicfor po = 2 65 Mgm-
3. state depends on the strength of the shock wave
Shock waves that are strong enough to produce a peak radial stress By analogy with the equation that relates the pr.ssure J i fluid,pi greater than the critical shear stress Pei of the rock cause the after adiabatic compression to the specific volume after compr-ss,.i,rock to become plastic (for granite. Pvr, is absout 4 GPa for high and the pressure and specific volume 1,,,fore compression, relation 1 11strain rates [Hlolzer, 19651) Such waves are called plastic waves, The is sometimes called the "shock adiabat' Ilo-vcer, the "shock adl;aspeed of a plastic wave increases with its strength The weakest such bat" is not an isentrope, since shock comnpression of a fluid increa',eswaves propagate at the low-pressure plastic wave speed [Zel'dovich its entropy (the stronger the shock ,ass, the greater the increa.se inand Raizer, 1967, ppý 741 746] the entropy). Thus, the Hugoniot curse crosses isentropes. as shc,%ri
in Figure 1. The final pressure pt produced by shock compression isC Ko t/2 a function of two parameters, such as pc and V0. as well as the final
Po 0 ) specific volume V1, whereas the pressure p along an Isentrope is a
function only of the specific volume and the entropy (see Zel'doicbwhich is determined by the compressibility of the rock in its standard and Raizer [19671, pp. 49-50 and 705-710)state. The speed co is also sometimes called the bulk sound speed. The Ilugoniot may also be expressed as a relation between D andSince only the bulk modulus contributes to co, it is necessarily less ui, that isthan cE. For solid granite, co 0 - 4kms-I D = D(ui) (5)
If a plastic shock wave is strong enough that the shear strength ofthe rock can be neglected, it is called a hydrodynamic shock wave. If, To see that this implies a relation of the form (4), note that in the
further, a shock wave is so strong that the speed of the wave front frame in which the undisturbed rock is at rest conservation of mo-
is much greater than the acoustic wave speed in the undisturbed mentum across the front of a hydrodynamic shock wave implies
rock, the pressure behind the wave front is predominantly thermalpressure, and the ratio of the density just behind the wave front to Pt - Po = poDut . (i)
the density just ahead of the front is close to its limiting value, it iscalled a strong shock wave (see Zel'dovich and Raizer [1967], pp. 685- Using relation (5), D can be eliminated from equation (6) in favor
705). As discussed below, shock waves in hard rocks such as granite of ul, pi, P0, and V0 . The post-shock particle speed ui can then
are strong only when the peak pressure Pt is Z I TPa. be eliminated from equation (3), giving a relation of the form (4)
Shock compressuon.-The equation of state of a rock may be writ- Figure 2 shows a Hugoniot for solid quartz expressed in this way Theten as a relation between the pressure p, the specific volume V = l/p, step in the curve ak ut = 2 kms- I reflects a phase transformation thatand the specific internal energy t. Before the shock front arrives, the occurs at about 40GPa. Hugoniots for granite are generally similarrock is at rest with specific volume V0, specific internal energy to, to this quartz Huugoniot, although they differ in detail In generaland pressure Po. As the shock front arrives, the pressure rises rapidly the Hugoniot of rock in the field depends on the bulk density, grainand the rock is severely compressed. We denote e specific volume, density, chemical composition, fracture pattern, porosity, and waterspecific internal energy, and pressure just after the shock front haspassed by V1, (1, and pt, respectively. The changes in these thermo-dynamuc variables occur over such a small distance that the shockfront often may be approximated as a mathematical discontinuity.Henceforth we shall assume, unless otherwise stated, that the shockwave is strong eno,.gh that it is hydrodynamic.
The curve on the equation of state surface p = p(V,i) that is rel-evant for determining the thermodynarmic state of rock subjected toshock compression may be seen as follows. Although the shock wave Wproduced by an underground nuclear explosion evolves with time, &the time scale of this evolution is much longer than the time requiredfor the shock front to pass through a given fluid element. Thus, ISthe change in the thermodynamic state of a given element as theshock front passes through it may be found by considering a steadyshock wave with the instantaneous speed of the actual shock wave PoIn the frame in which the unshocked material is at rest, conservationof mass, momentum, and energy across the front of a steady shock V0wave give (see Zel'dovich and Raizer [19671, pp. 45-50 and 705-710) Spccific Volume
poui ( Fig I Hlugoniot (labeled If) for a kp,.thitical non-li-rous ii;it.r iI- ( (Po + P,)V 0 - V, TA + o (3 ,uititially in the state (p0. V•,) (dot) and se'veral isentropes (labe'led 1,
their e•itr.pies Si < S2 < S.1) Ifor th, saiie material All final states (pwhere D and ul are, respectively, the speed of the shock front and II) that can be reached via shock .iimilprtssion from (Ps. 10) lie al-inthe particle speed just behind the shock front When combined with /I lhe stronger the shock wave. the ýiialler the final specific volumethe equation of state t = t(p. V), equation (3) gives the pressure just and the higher the final pressure Ilie Ilugoniot crosses isentropes .4behind the shock front in terms of the specific volumejust behind the increasing e'ntropy as the final spcitic volume decreases, showing thatfront and the pressure and specific volume just ahead of the front, the entropy of the final state increases with the strength of the shockthat is, wave The vertical dashed line indicates the limiting specific volume
Pi = PH ( "V.p,. VO) (4) for a strong shock wave in this material
6

LAMB ET AL 75
4C tTABLE I Approximate llugonmists for Granite and Wet 'Full,
RA,,:k Pa (Mg r-n) A (kins-) It 1.1 (in) Li10(M)
30 (;ranite 2 67 28 1 I115 3 t 20Wet tuff 1 95 145 1 62 7 0 :17
' "The paranieters po. A, and B are from Moss 1198F] and w-re obtained byr_1 fitting a NMie-.Grneisn equation of state to tabulated equations of state" 20 King et al . 19R9[ for quartz and wet Luff at high pressures L, and .so
are characteristic shock wave transition radii (see eq [12]) for I lit andI S) kt explosions
10- speed ci However, the large-ul relation usually is not valid for smallul. and hence A usually does not equal co In granite, for examtple,4 is about 3kms-' whereas co is about 4km s-
Even if the Hugoniot is not linear over the range of ui that is of in-0 terest, a curve consisting of piecewise-lInear segments of the form (7)0 10 20 30 may serve as a practical approximation to II(ul ) for many purposes
Post-shock particle speed (kmn s 1) Release -After the shock front has passed, the pressure falls andthe fluid expands. This is often referred to as "release" For a shock
Fig 2 Relation between shock speed D anrt particle speed ul just front of given strength, the curve on the equation of state surface thatbehind the shock front for .ohd quartz The curve is a piecewise-linear describes the evolution of the thermodynamic state of the materialapproximation by Lamb Callen and Sullivan [19901 to Hugoniot data during release is very nearly an isentrope. since heat conduction isc-mpiled hb King et al 1>989 from Al'thuler et a) [19771, Chung and almost always negligible. This curve is therefore frequently called the
Simmons [1969]. McQueen Fritz snd tlop~on fl977i, Wackerle [1962]. release adiabat (see, for example, Murri et al. [1974[).and Ragan 1984j Note the -pproximate linearit" of thOw Hugoniot atlarge ui [he step in the curve at ul z "2 km s- reflects a phase Phases of an Underground Nuclear Erplosiontransformation that occurs at about 40 (;Pa
For present purposes, the time development of an underground
content, and may differ from the l{ugonioLs of the small samples that nuclear explosion may be divided into three phases (see Glasstone
can be tested in laboratories and Dolan [1977] or Germain and Kahn [19681)For some rocks, the Hugoniot at high particle speeds (high pres- Initial phase.-The energy released by a nuclear explosion initially
sures) may be adequately represented by a linear relation of the form emerges as nuclear radiation, fission fragments, and thermal elec-
(see Zel'dovich and Raizer [1967], pp 705-710) tromagnetic radiation. The temperature in the nuclear charge risessteeply, reaching 10' K within a microsecond or so. At the very earli-
D = A - But , (7) est times, energy is carried outward by the expanding weapon debrisand radiation. As a result, the vaporized nuclear charge and nearhy
for some constants A and B As shown below, the ambient pressure rock form a bubble of hot gas in which the initial pressure is of order
Pi is negligible compared to p: for all depths and times of interest I0TPa. The enormous pressure in the bubble causes it to expand
here Relation (7) then implies that rapidly, creating a cavity and driving a shock wave into the rock sur-rounding the emplacement canister. The radial stress produced by
42( -)the shock wave greatly exceeds the critical stress at which the rockPH (B B )2 / (8) becomes plastic. Thus, to a good approximation the strength of the
(B - 1)2 V- rock can be neglected and the rock can be treated as a fluid. Duringthe initial phase the evolution of the explosion can be followed using
(see Zel'dovich and Raizer [1967], pp 705-710) Table I lists values the equations of hydrodynamics and radiation transport.of 4, B. and Pu for granite and wet tuff that were derived by fitting H&,idrodynarnic phase.-Within - 10-100las, depending on the de-a Hugontot of the form (8) to high-pressure equations of state for sign and yield of the nuclear charge and the composition and distri-sirmlar materials. bution of the matter surrounding it, the outward flow of energy via
For Hugoniots of the form (8), the ratio pr/po of the material den- radiation becomes unimportant and the explosion can be describedsity immediately behind the shock front to the material density ahead by the equations of hydrodynamics alone. At this point the explosionof the shock front increases with the strength of the shock wave until enters the (purely) hydrodynamic phase. As the shock wave expands,it reaches a certain value (p/po),.. = (Vo/V),x.n = B/(B - I). Once it weakens. Eventually, the radial stress produced by the shock wavethe shock has become this strong, any further increase in its strength is not much greater than the critical stress of the rock. At this pointdoes not produce any increase in the ratio p/po. For this reason, the the rock can no longer be treated as a fluid and the hydrodynamicdensity ratio (p/po).- is referred to as the limiting density ratio. For phase of the explosion ends.the granite Hugoniot listed in Table 1, the limiting density ratio is Final phase.-The final radius R, of the cavity produced by an- 3 Peak pressures - l-IOTPa are required to achieve density ratios underground nuclear explosion depends somewhat on the depth ofnear the limiting value. For extremely strong shock waves, changes the explosion and the composition of the surrounding rock, as wellin material properties caused by ionization, relativistic corrections to as the yield. For a burst of yield W, a useful approximate expressionthe electron pressure, and radiation affert the Hugoniot and alter the is [Terhune et al., 1979]limiting density
Ifa single linear D vs u, relation adequately describes the Hugo- R, N 14(W/I kt) 1 3 m (9)
niot at large ut and if this relatin could be extrapolated to smallul, the constant A4 would corrrsp,,nd to the low-pressure plastic wave The cavity reaches its final radius in about 90(41/I kt)i'3 m5 [Ter-

76 YIELD ESTIMATION USING SHOCK WAVE METHODS
hune et al, 19791 the Iluguntot " his reiquir,'nrit is i.,st,,pe, i th, rne od.lI ,..Even after the c ompresasion wave is InI Ioug-,r ,idrid ldrni,, the sUiiinng that f is ridependent If R?
rarefaction wave that follows is still strong eniough to frai-t ir,- rock The factor f is iiideprider, t -f le lr self inulirar shock wa .,.-Intense fracturing typically occurs out to a radi.i ! - ? r.-rliurie bhlow) but ned not I,- i,.rit -,I R fOr sh,'k a,,es Ir,,,,et al , 19791 Beyond this point, the dlr-,- f friiturmrg .,uti,',l by thc aitutl underground nuch-,sr *-xi ,.... I .taiii,.. l.s7 Itrnih i W,expanding shock wave drops draniatial- l i until, it - We_, fra, luring aid isullih%•t. 99l[01 N--.11ril,, I. 1+ -,l, k waa e ta-lius arid trr ,essential lv stops (Rarefaction waves caurised b) r•flctii)n o thef shock i ..i...- l data from actual iii, 't•gr, g r ,il niu clear tests - w I % fr r;,wave front the surface or collapse of the roof of tlIn Iasny timay cause (miputer simulations f s4tu-h te-•,r III -:,at, that relation I 10i I;!. ffracturitng beyond this raitus ) The shick wae ih,.eiin ,iiti w,rs to rmnstarit is fairl) well Nattsfi,, fOr '.X,;L•,siIns in quartz and a1.t 1L if
expand nearly elstically, eventually -. Ivilsiig into (it, - In-uha irg -asi untit relatively late- tuioits ýlari, 1'0(7 Moi . 19,8, Laniii. Calli,.(of a train of elastic (seisric) waves and Sullivan, 19901 The h.-,t sAlne of I to use for explosions in a
In the remainder of this section we focus onl tht, .- volhtton ,of t it given rock can be detertoite,- b. litting the post-shock particle '•pleIshock wave during the hydrodynamic phase and ,ortiewhat hesrind relation 110) (or the relations fir the shock speed. shock front radius
and post-shock pressure that follow from it) to data from numrerisalApprozimate Model simulations or actual underground explosions in that rock For stiork
waves in quartz and wet tuff, f z 0 53 provides a relatively ac-ut-For pedagogical purposes, it is useful to consider the shock waie rate description of the evolution during the hydrodynamic phase and
that would be produced by a spherically-syrmmetric explosion in a somewhat beyond [Moss, 1988. Lamb. Callen, and Sullivan. 19901uniform medium before confronting the full complexity of the shock For simplicity, let us assume that the Ilugonot of the medium ranwaves produced by actual underground nuclear tests. The shock wave be adequately represented by a single linear relation of the form (7)produced by such an idealized explosion is spherically-syrttmetric at over the whole range of ur of interest Then co = A. Therefore Inall times Even so, tracking accurately the change in the thermody- the following discussion we refer to A as the low-pressure plastic wavenarruc state of an element of rock as it undergoes shock compression speed Given the ansatz (10), the Ilugoniot (7) can be rewritten a-and release requires knowledge of the equation of state of the rock [Lamb, 1987, 1988[over a wide range of densities and internal energies Such an equation of state ix usually quite complicated, arid often can be presented D d R r L 3
"12
only in tabular form. Hence, for pedagogical purposes it is also use- D - 4- = A [1+ ,j (l11
ful to consider first a simpler, more approximate description of thebehavior of rock subjected to a shock wave where
In fact, the basic features of the evolution of the shock wave /3frWB2 \is
produced by a spherically-symmetric explosion in a uniform solid L =_ 4poA2 121
medium are illustrated by a simple analytical model This model wasproposed by Lamb [19871, who showed that it is exact for strong, self- is a characteristic length that separates the region where D (x R`1:similar shock waves and that the shock-front radius vs time curves from the region where D 2 A Typical values of L for I kt and 150 ktit predicts agree iairly well with data from several underground explosions in granite and wet tuff are listed in Table I for the %aluesnuclear tests and numerical simulations of underground nuclear of A and B given there.explosions The model was proposed independently by Moss [19881, Given the shock-front radius R0 at the time
to at which the explo-
who showed that the particle-speed vs radius relationship it predicts sion becomes purely hydrodynamic, the first-order differential equaagrees fairly well with data from underground nuclear explosions tion (11) can be integrated to obtain a simple, closed expressionand numerical simulations. A detailed description and assessment of for R(t), from which one can calculate D(t), ul(t), pi(l), and pl(t)the model has been given by Lamb, Callen, and Sullivan [1990], who [Lamb, 1987; Moss, 1988; Lamb, Callen, and Sullivan, 1990) Thisfind that the model provides a remarkably accurate description of model shows in a qualitative way how the evolution of the shock wavethe motion of the shock front throughout the hydrodynamic phase. depends on the yield of the explosion and the Hugoniot of the rok
Without loss of generality, the particle speed ut just behind the As an example, the peak pressure, peak density, and radius of theshock front can be related to the hydrodynianic yield W of the ex- shock front at various times are Irsted in Table 2, for I kt and 150 ktploston and the radius R of the front via the expression
TABLE 2 Shock Wave Evolution in Granite'
ul) , (t0) lressure Density I kt Explosion 150kt Explosion
(CPa) (p-,) I rittue (psi R (ts) Time (its) R (tirwhere f IS a diniensionle.si, factor that generally del--n.nds ,ui the e';,a-tion of state of the ambient medium and the raiiis of th shoci, Iront 7,000 0 9 4 0 5 20 1
An important assumption of the model is that f is Independen-t of 1,000 08 10 0 9 s0the shock front radius R for all shock front radii of itn'-rcst 400 0 7 .0 1 4 200
In this model, the compression of the ambient menliunt at the shockfront is treated exactly, via the Iankune-Hugor It jUmp conditionsand the Ihugonmot of the medium In contrast, the rarefaction that 50 05 200 3 1,200 17
occurs as a shocked fluid element is left bchjr-.! I, treated only approx- I5 0.4 600 5 3,000 30imately, via the parameter f The value - (his parameter depends onthe density, velocity, and specific inter-ial enerrgy histrihutions %ithin "For the model of a spherically-symmetric. point explosion described inthe shocked volume I hese distribu; ions, and ,I tis f rould he deter- the text The Hugoniot (7) was us•d, with the values of A and B givwn
fn Table I The phase transforniation that occurs when the post .h-wkpr.-sure Pr is -30-40GPa Isee Fig 2) has been neglected The pist sl,, vtion t hl wever, such a siniulatioon requires kii, I-,i. iti f the .-1 iation dernsity p, is expressed in termni of the limiting density p.,_ olf granite,.--ofstate fir substantial ranges of pressure ali I It--it., nIt p allong tesxt), whi, h is 9 4 Mgm-r for this lugions ,t From Lamb (I9i8]
8

LAMB ET AL. 77
poirnt explcosions TI grail,-ý N -- fil.t x-pl.~-- rier in whit it a ''e. le '21 %I, \5elr-e~ iF-- sh- k frIt Itralllus at, whicihl this occurslarge a.mount of•eno'-r'. I, reila.-l iistadniii n,-i',, iti t infil rt,-sirial h H [1 ,)r .i I kt eon in granite R, is -- I in, whereas for a
volunme ) For si lipltiii " we ha'- s ita.• - lit l *,In i Os1 1 r , lt e.vilo ýi, i s o i ni
purely hydrodynamui after the initial .nergKy r,.-,as at title I = (I ,-r riost ,,f the transit,,n intersal. thi,, thrnial pressure just be-
"The corresponJing initial condition fo>r e, I, i II I,, R - 0 ,1l1nJ the shoik front is not much greater than the cold pressure of
! = 0 As discussed below the hydrod.namic hi•i.,, -.nds ii gralnte :h-, i onpressed rock. alr.hich the speed D of the shock front is still% hen the post shock pr~sure Pi has iail-il t, &-it it ;lPi Thus. the :i,,ih larfg-r than the hw pr.ssure pla.stic waie speed A In this Inter-pressure N of the oiverburden. whch is , 2,N11 Vl'a at the .lepthi, that * i:e IitIlin if the shock wave is more sensitive to the properties
are relevant here i• I km), is negligible coiipar-.I 1t- p11 throiihiut 4 tihi. ieliii•i than it is in the strong shock interval- For exainple,the hydrodynamic phase _' the explosion. te i tlhioii of the shock front in the simplified model discussed above
More generally the model can be (ised to, ,tain a crlosid-forni 0.Ti-nds on 4 as well as B and po during the transition interval. Con-
expresPsion for H(t) for any piecewise linar ltug .mit 0i ui rhis .lueritl.'% ilire knowledge of the ambient rock Ls required in order
the model can be usd with more realistic Hiigoiis hke that shown I" make at,,urate yield estimates using data from this interval
in Figure 2 When currently available hluioniot dita is used. the As the shock wave expands and weakens, the minerals in the rock
model predicts post-shock particle speeds and pr.ssures. shock-fr,,nt (ehind the shock front may undergo polymorphic transitions Forspeeds, and shock-front radii that agree quite well with data fron examnple the mineral constituentsofgrantic rocks appear to undergo
underground nuclear explosions and with nimirical ýimulations of -eral polymorphic transitions when the peak post-slock pressure
such explosions [Lamb. Callen, and Sulhian iPN'i.ý) fails below - 30-40GPa (see Fig. 2).When the shock speed falls below the elastic wave speed cl, the
Ciaractenstic Intervals shock wave splits into an elastic wave followed by a plastic wave(see Zel'dovich and Raizer [1967], pp 741-746). In granites, this is
During the hydrodynamic phase, the shock wave produced by a expected to occur when the peak pressure has fallen to -20-30GPaspherically -symmetric point explosion in a tonif-,rr medium evolves (see Butkovich [1965], Holzer [1965], and Fig. 2). Since the plastic
differently in the strong-shock, transition and l,,-pressure plastic- wave slows as it weakens whereas the elastic wave travels at the nearlywave intervals constant speed ce, the plastic wave falls further and further behind
Strong-shock riterval -- initiaily, the speed of the shock front Is the elastic wave This two-wave structute is clearly seen in laboratorymuch greater than the speed of souwti Ii the undisturbed rock, the experiments on small samples of granite and other rocks Whetherpressure behind the shock front is predominantly thermal pre.,sure, it persists in rock in the field is not as certain.
and the ratio of the density Immediately behind the shock front to The elastic precursor raises the pressure of the rock toper,1 , which is
the density ahead of the front is cloýse to i. limiting value Thus, the 4 GPa for granite [Holzer, 1965], and accelerates it. The following
shock wave is strong plastic shock wave therefore propagates through rock that is already
"The shock wave produced by a point explosion in a uniform movirmg at - 1-10 ms-. However, the speed of the plastic shockmedium is self-simrular as long as it remains strong (see Zel'dovich wave is at least c0 , which is several kmsn (see above). Thus, even
and Raizer [1967], Chap. I and XI1, Sedov [1959]. Barenblatt [1979]) after the shock wave has split, the acceleration of the rock by the
In such a motion, the distributions wtth radius of the pressure, elastic precursor can usually be neglected and low-pressure plastic
density, and particle velocity evolve with time in such a way that wave taken to propagate at the plastic wave speed relative to the
only the scales of the distributions change. while their shapes remain undisturbed ambient n.edium, as was done in writing eq. (6).
unaltered For such a strong, self-simular shock wave the radius as Lo.-presssee plastic wave sntcnal.-As the shock wave expands
a function of time depends in a simple way on the properties of the and weakens further, the thermal pressure behind the shock front
medium and the yield of the explosion This simple radius vs. time becomes a small fraction of the total pressure and the shock speed D
curve could be used to estimate the yield of actual underground approaches the low-pressure plastic wave speed A. At a certain radius
nuclear explosions, if there were an interval of strong, self-similar Rp. (- L), the shock speed has fallen to 1.2 times the low-pressure
motion and if data from this interval could be obtained plastic wave speed and we say that the shock wave has entered the
For example, the simplified model described above predicts that low-pressure plastic wave interval.2
For an explosion in granite, this
the radius of the shock front produced by a point explosion satisfies occurs when the peak pressure has fallen to - 15GPa, corresponding
ýLamb, 1987, 19881 to a peak density ratio - 0.4 times the maximum (see Table 2). For aI kt explosion in granite R..t is 5 m, whereas for a 150 kt explosion
R 1--6 w ) \ .J WI/- , (13) 3For the simplified Ifugoniot ofequation (11), the low-pressure plas-\ )' )tic wave interval corresponds to R > 3 L. In this interval,
during the strong-shock interval (R < L) This expression illustratesthe more general result that the radius of a strong, self-sirmlar shock R : const. + A t, (14)wave varies as the two-fifths power of the time since the beginning of
the explosion, independl - ,4f the properties of the medium. In the where the constant is determined by the motion in the strong shock
simplified model, the rat,-is of the shock front depends only on p0 and transition intervals.
and B. for a given choice of f When the peak pressure in the plastic wave is no longer much
Unfortunately, as explained below, strong, self-stmilar motion does greater than the critical shear stress pct, the shear strength of the
not develop in actual underground nuclear tests, gtven current testing rock can no longer be neglected in treating the evolution of the plastic
practices and the yields permitted by the fI[BT shock wave. In granite, for example, penn is i:n 4GPa, and hence the
Trnnsition interval -- As the shock wave expands, it weakens and hydrodynamic approximation begins to fail when the peak pressure
slows, and the peak pressure and density drop When the the peak behind the plastic wave falls below about 15GPa, which occurs soon
density ratio has fallen to " 8 times the limiting value. we say that after the shock wave has split. For granite, the hydrodynarruc zone
the shock wave has entered the transition interval For an explosion extends about 5 (,/I kt)i/3 meters from the center of the explosion
in granite, this occurs when the peak pressure has fallen to - I TPa (see Table 2)
9

78 YIELD ESTIMATION USING SHOCK WAVE METHODS
Underground Nuclear Tests Agency, 1990b]. The TTBT protocol al.ý requires that an, pipe 'rc..blewa, connected to an explosive mloister pass through a 'c*,nkc.
The evolution of the shoik wave pioduced by an actual uiid,Ir s,.ction" designed to restrict the flow of energy out 4f the c-ni.terground nuclear test is generally more complex than the e'olu•i•o lI he distortion of the shock front ause- by a canister, open pipejuL;t described For one thing, the shock wave is produced by an i.-- ir rableway of a given size is less for higher-yicid than for Iwprpherical source of finite size rather than a spherically symmetric point yield explosions, since the hydro,'Nnannic zone extends further fr,,njsource. For another, natural or man-made geological or geophysical the canister and emplacement hole for a higher-yield explosion Tr"-structures near the emplacement point niay signilicantly distort the call that the hydrodynamic zone extends about 51W/I kt)'" ri,-tersevolution. froni the center of the explosion) Moreover. higher-yield chargos
Test geometries. -In preparation for a nuclear test, one or more nu- usually are not exploded in tunnelsclear expl.sives are customarily placed in each container or covering The shock wave produced by a test involving multiple expl,AsivThese containers are called explosive canisters Explosive cansters as canisters could be very complex, creting a daunting vetificatio,nlong as 12 m with diameters as large as 3 m are permitted in the stan- problem For this reason the TIBT protocol specifies that a testdard test geometries defined in the recently adopted TTBT verifica- involving multiple explosives can be considered to have a standardtion protocol [U. S. Arms Control and Disarmament Agency, 1990b] geometry only if the explosives are placed in a single canister or theLarger canisters may be used in nonstandard tests positions of the explosive canisters and their detonation times arc
Any drill-hole, shaft, adit. or tunnel in which one or more explosive arranged so that a shock-wave yield estimate can be made for eachcanisters, associated cables, and other equipment have been installed canister separately.is called an emplacement hole. Emplacement holes may be vertical Even C'ie shock wave from a test having a standard geometry andshafts drilled deep into the ground, horizontal tunnels carved into the conducted in a uniform medium may not be completely sphericalsides of mesas or mountains, or large underground cavities (see U S. at the relatively small distances where hydrodynamic measurementsCongress [19891, pp. 15-18).' The standard vertical and horizontal must be made. For example, the hydrodynamic zone of a 150 kt ex-geometries defined by the TTBT verification protocol allow the use of ploion in granite extends only about 20 m from the center of the ex-vertical emplacement holes with diameters up to 4 m and horizontal plosion. Shock front position measurements must therefore be madeemplacement holes with cross sections as large as S m by 5 m. Tests - 10-20 m from the center of the explosion in order to be usable inwith planned aggregate yields less than 35kt may be conducted in hydrodynamic yield estimation algorithms. These distances are com-cavities as large as 20,000 cubic meters (the radius of a hemispheri- parable to the dimensions of the largest explosive canisters ailovd incal cavity with this volume is about 20 m) Nonstandard tests may standard test geometries. Thus, even the shuck wave from a standardbe carried out in larger emplacement holes or cavities if the parties test may be somewhat aspherical in the region where hydrodynamicagree on verification measures [U S. Arms Control and Disarmament measurements are made.Agency, 1990b]. Historically, about 90% of U S. nuclear tests have The shock wave from an underground nuclear explosion cannot be-been conducted in vertical shafts, the remainder have been conducted come self-similar until it has enveloped a mass of rock much greaterin tunnels or cavities. than the mass of the nuclear explosive and canister, and energy trans-
Cableways and cables as well as open or partially-open pipes are port by radiation is negligible [Barenblatt, 1979, Ch. 2]. The radiustypically installed in the emplacement hole to carry signals or radia- RO at which this occurs is necessarily larger than the radius of thetion away from the explosive canister or canisters There have been emplacement hole or cavity and depends on the design of the nuclearas many as 250 or more such cables and pipes in recent U. S. nuclear charge and surrounding equipment. Unless there is a range of radiiweapon tests. Once the explosive canister, diagnostic equipment, satisfying R0 < R <: R,, where R. is the radius at which the tran-pipes, and cables have been positioned in the emplacment hole, the sition interval begins, the shock wave will not have time to becomeemplacement hole is stemmed with sand, gravel, and plugs (if it is self-similar before entering the transition interval Since R0 is Z 2 mvertical) or grout (if it is horizontal) in order to prevent escape of for current U. S. practices and allowed yields, no such range exists inradioactive gases (for an example of a stemming plan for a vertical granite even for explosions as large as 150 kt, as shown by the datashaft, see Glenn et al. [1983] or Glenn et al [1986], for an example in Table 2. Thus, the simplicity of estimating yields from an intervalof a filling plan for a horizontal tunnel, see U. S. Congress [19891, of self-similar motion cannot be realized. Furthermore, the structurep. 43). For tests conducted in tunnels, an ancillary tunnel (called of the shock wave in the hydrodynamic measurement zone is morethe bypass drift) is constructed parallel to the emplacment tunnel sensitive to the properties of the source than it would be if it wereto allow access to the room in which the nuclear explosive is to be evolving from a self-similar wave.placed and to other parts of the tunnel system close to the time of For example, even if the shock waves produced by two nuclearthe test. After the nuclear explosive has been positioned, the bypass tests with the same yield were spherically symmetric at all radii.drift is filled with grout. they could have different speeds at a given radius, because the e/-
Source effects.-Unless impeded, vaporized weapon debris and ra- fectiue size of the shock wave source could differ from one explosiondiation would fill many meters of the emplacement hole soon after to another. Moreover, the design and composition of the nuclearthe nuclear charge is detonated, producing a shock wave that would explosive and canister affects the equation of state of the effectiebe highly aspherical initially (see Lamb [1988]) As such a shock hydrodynamic source, which is different from the equation of statewave expands, it tends to become more spherical if the surrounding of the surrounding rock. As a result, the fraction of the total devicemedium is uniform. However, the shock wave will remain significantly energy that couples to the shock wave can vary from one device toaspherical until it has propagated a distance from the center of the another. Indeed, Moran and Goldwire 119901 have shown that theexplosion grater than the length of the source. Such an aspherical yields of spherically-symmetric explosions inferred from data takenshock wave would make accurate yield estimation much more difficult in the hydrodynamic measurement zone may differ from the actualthan for a spherical shock wave, particularly if shock front position yields by 20%, for hydrodynamic sources that they present as modelsdata were obtained from only one set of sensing cables (see below) of the hydrodynamic sources produced by nuclear explosions Sirrular
For this reason, the TTBT verification protocol restricts the di- results have been obtained by Callen, Fiedler. Lamb, and Sullivan (inmensions of explosive canisters and any attached car' ters contain- preparation].ing diagnostic N-uipment [U. S. Arrms Control an , Disarmament Inhomogeneihes in the ambient medium - In addition to its depeii-
10

LAMB ET Al. 79
dence on the properties oif thi' surce, ,th-, olttion of the shock wave satellite hole requires sophisticated drilling cpabilities in order toproduced by an underground nucle•ar exi ,,. ii sil I,e affected by any make sure that the satellite hole maintains the proper separationnatural or ni animade structures ii thli.- iurrutiihng imedium In or- front the nuclear charge emplacement hole at the depth of the nucleard'r to peleilld) p,'tiltially ,it urbing -I rno-tr .' O IT Il' prntoOl charge (see below and §4) Conversion of the uncrushed cable lengthrequires th. tO testintg party pro•it. , g.-.,gital and geophysical to the position of the shock front is more complicated if the cable isdes-ription of the test location. Includtig th. depth of the water table, placed in a satellite hole than if it is positioned in the emplacementlithographic descriptions of each formation, anid any known geological hole On the other hand, the satellite-hole geometry reduces theor geophysical discontinuities within the hydrodynamic measurement IAtrusiveness of the method and "jetting" and other phenomena thatzone The protocol also requires the t,'sntig party to nake available ran crush or short sensing cables ahead of the hydrodynamic shockthe planned rroas.sectional dimensions of ea,-h ,reliacement hole tn front In the discussion that follows, we shall assume that the senisingeach hydriynasinr measurement zone as w-l as a description of the cabhl.s have been placed in a satellite hole unless otherwise. statedmaterials that will be used to stein each suth emplacement hole, In lT' sate.llite-hole geometry is shown in Figure 3a.order to minirruze the effects of voids on the . olution of the shock If a s0"nsing cable i- strong enough that it is not crushed by thewave, the protocol requires that the locations and %,luim's of all voids elastic precursor (if present) or other unwanted signals, but weakwithin thli hyilr,'dyrialic [I Ii.e;ureiii.tit zow. Ia d,'teririined. usiing eri'iigh that it Is crusheid by the preslsur, peak at the hydrodynamicItihi,,Is '•li1I as ''evtrltagrietic iwn '.ii,.t.t.s, radar, and acous- sh,, k frmnt, thi, cablc will be electrically shorted or its Impedancetic sorindrig. any voids within the hydriilyriamic riwa.surernent zone substantially changed near the point where the hydrodynamic shockwith voilumes griater than t,-n cubi, ri,.t,'rs and any voids nea' the front intersects it As the shock front expands with Limne, the lengthrmp1acem,iint hi' I with volumeitis grt-ahr ithan oine rciilic ineter ltirst ,f cable fromt the electrical equipment to the nearest point at which it
thetn ,- fill,''I wili diense ste'miing mat-.rial hai I ,a crushed is m.asured, as mhirwn !n Figure 3b If the path ofExpli.stiiis 'if nuclear charges in vertical shaft or tunnel complexes t-.. ,ensing cable relative to the center of the explosion is known arid
or in cavities may be accompanied by complicated (and unantici- the time at which the explosion began can be determined, then thepated1 energy flows and complex shock wave patterns. In order to length of the uncrushed cable can be used to determine the positionminimize these effects, the TTBT protocol specifies that if a test in- of the shock front along the path traced by the sensing cable, as avolves explosions in more than one emplacement hole, no more than function of the elapsed time since the beginning of the explosion.one such hole may depart from the standard vertical or horizontal In order to sample a substantial portion of the hydrodynamic mea-configiration If a test is to be conducted in a cavity, the protocol surernent zone for explosions with yields near the 150kt limit of thegives the verifying party the right to measure the shape and volume TTBT, the sensing cable must pass within - 10m of the center ofof the cavity the explosion. For this reason, the TTBT protocol requires that for
standard tests, the axis of any satellite hole must be located 11-3 me-3 Measuring Shock Waves ters from the axis of its associated emplacment hole throughout the
hydrodynarric measurement zone. For standard vertical tests withAs noted in the Introduction, the evolution of the shock wave pro- yields near 150 kt, this requires drilling the emplacement and satel-
duced by an underground nuclear explosion can in principle be mea- lite holes to depths Z 650m while maintaining a lateral separation ofsured using either sensing elements or transducers (see Holzer [1965]). about 10m.In the present context a sensing element is any switch, cable, or cable Voids or excavations near the satellite hole can distort the shocksegment that provides data on the position of the shock front as a front, causing the sensing cables to be crushed in complex patternsfunction of timrie, whereas a transducer is a devrc,, that converts a For this reason, the TTII'r protocol requires that for standard tests.physical proiperty of the shock wave, such as the radial stress, strain, any void that is near a satellite hole and that has a volume greateror particle speed, into a recordable signal. In practice, constructing, than one cubic meter must be filled with dense stemming material.emplacing, and obtaining reliable data from transducers has proved Ex CORR Eaperiental CORRTEXdifficultequipnt record equipment recorde
For this reason, U S efforts to develop shock-wave yield estima- % %tion methods have for the past 15 years emphasized sensing elements.This approach is also the one that the 'ITBT protocol allows forSesnshock-wave monitoring of nuclear tests with standard vertical or hor- cable
izontal geometries Hence, in the present section we focus primarilyon shock-front sensing techniques, The TITBT protocol allows theuse of transducers as well as sensing elements for monitoring testswith nonstandard geometries [U S. Arms Control and Disarmament " /Agency, 1990b] Expletie
Use of Sensing Cables cable Not Ps
Cantax ofOne way of measuring the position of the shock front is to place eaplaron
an electrical sensing cable near the site of the explosion and then 7'measure the point where it is being crushed at A given time by thepressure peak at the shock front. The crushing point is measured Expartlingby electrical equipment attached to the cable but positioned a safe a b hock wavedistance from the explosion. This technique has been utilized in theUnited States since the early 1960s. Fig 3 Schematic drawings illustrating (a) placement of a shock front
Sensing ables may be inserted in the emplacement hole before it sensing cable in a satellite hole arid (h) progressive shortening of theis filled or placed in oine or more "satellit" holes" that have been , abd,' l, y Ih,' expanding sl4,,k frn'r piohtl i-d by a incl,-ar ,Xpsloiio',idrilled or excavated nearby specifically for this purpose. Use of a Fronr Lamrrb [1988]
11
80 YIELD ESTIMATION USING SHOCK WAVE METHODS
AlIso. a sa~t II te hole must Iý, at l'a,it Ls close to its as&sc iated ern - b the cr ushinog point or abiout 0 5t it in the d istan e to t h" r u Iifigplace,uieit hole as to any other holes or excavatifis For standard pointloio-n,.iital testsa, the, ax is of a satell io, hol mi ust bie at lea.st 6 ci fromt.kiiy otlher Irdlled -r s-xc.vaitef citvilii-s ,r hoh-s iii ..rl-r to itiiiiiifi.,- Irh I viiiiing the Shock Front P'.'iilti" /Ii,ii
I iei disturbintg elfects of such holes MI i-f is.-r, if drilledl a sateithtehole ii fist have a diameter of rio less than 0I :3 ti anid no more t
1ian [it order to uniiderstanid how the ,' %oii (iii of t h" shock front ro
0 .5ni, if excavated, IL must have a cross section no greater than 2 5 it fluced by an underground explaicion can he follovved using GORRTEXby 2 5 In Similar restrictions apply to satellite holes for nonstandard or SLIIFER measurements, it is helpful to consider first an ideaiaz-dtests (U S. Arms Control and D~isarmamient Agentcy, 19901,1iurialysmmti explosion tii a uniforni medium and a slingie
If hiydrodynsamic methods art! to be used to monitor a W0ktt low- sensing table in a satellite hole that is relatively straight within thethreshold test ban, the sensing cable will have to pass within - liii of hydrotdyiiamic measurement zonetie I.i ...ltr if I lie exploilosil n IIIlorer 1,, samptlle a siubstanitial piortioin of After the nuclear charge L5 delonated, the sphfhrical shock frutittill lic~flnirlyiiiiniic IIIe&4iIrrmiiiit zofnei -For :1 statiflirf verti- al test g, lii lidicflr by the ixplftlffiiii eisfiti w .iy fromii Ih " e liter if tit,-onlictry. this would require ilrilliiiK vy11 iAI 1-111i0Iaf riieit aIi'd satellite ploififfi (see Fig 3b) Sfome timie i-lifse biefore the shifck front bliV,1li%holes to depths 2! 200Cm while maintaining a 4 mi lateral separation to crush Lthe sensing cable. This time depends on the distance 1iwbetween them tween the center of the explosion and the point where the cable is
SensinK cables with crushing strengths ranging from as little as closest to the center of the exploision.3 MPa to as much as 3GPa have been used (Schmitt and Dick, 1985] At the instant of first crush, the length of uncrushed cable decreasesHowever, even cables with cruahing strengths as high as 3GPa can discontinuously from its original length to the length to the point ofbe crushed by the elastic precursor in granite, since pint is - 4 GPa. first crush (see Fig. 4), As the shock front continues to expand.Thus, once the shock wave has split, the length of uncrushed cable the crushing point nearest the electrical recording equipment movesmay indicate the position of the elastic precursor rather than the po- steadily along the cable, reducing its uncrushed length. If the timesition of the trailing hydrodynamnic shock front [Virchow et a] . 1980; at which the explosion began and the path of the cable relative toDeupree et aM., 1980]. If so, the sensing cable will not provide data the center of the explosion are both known, the radius of the shockabout the position of the hydrodynarmic shock front [Hlolzer, 19651 froiit as a function of the time since the beginning of the explosionIf the data is incorrectly interpreted as showing the position of the can he calculated from the recorded change in the length of the cabilehydrodynamic shock front, the estimated yield of the explosion will as a function of time,be erroneously high. In some cases the cabile may he crushed by the Arcurate knowledge of the titiie at which the nuclear charge wa~selastic precursor in some regions and by the plastic wave in others, detonated is required in order to determine accurately the shock friontThus, use of sensing cable data from regions where the peak pressure radius as a function of time- For this reason, the TTBT protocol re-of the shock front has fallen below -20 GPa requires special care. quires the testing party to provide the verifying party with an electri-
Fu~rther information on the use of sensing cables may be found inthe U. S.-Soviet agreement on the conduct of the 1988 Joint Verifi- Fcation Experiment [U. S. Department of St.ite, 1988]. 0
Measunring I/hc lenigh of the Sensting Cable
IDuiiniig the 196l0-1 aiid 1970s, the limitn offif thit, i-iisliiig l-iffnt 20
was measuired in the United States using a technique called SLIFFEIj4 5
[Heusinkveld and Holzer, 1964; Holzer, 19651. In this approach, the Firstcrush
cable is used as the inductive element of a resonant oscillator. As the .52 -.40cable is progressively crushed, the frequency of the oscillator changes. I"By knowing the propagation velocity of electromagnetic signals in thecable and the frequencies of the oscillator that correspond to at leasttwo cable lengths, one can convert measurements of the change in -
oscillator frequency during the explosion to estimates of the change2in the length of the cable.
In the late 19709, an improved technique for measuring the -80-length oif sensing cables, called CORRTEX
5, wasi developeth [Virchow3
et al., 1980, IDeupree et ail ,1980; Storey et al , 1982, Lcvs AlamosNatI. L~ab., 1986] In this approach, a sequence of electrii-al pulses 18in melit alo ng Lthe table at preselected timile intervalsi At i(1wi , r ishin i 2iig
point, these pulses are reflected back along the cabile tfo the reciirliiig Imic finii
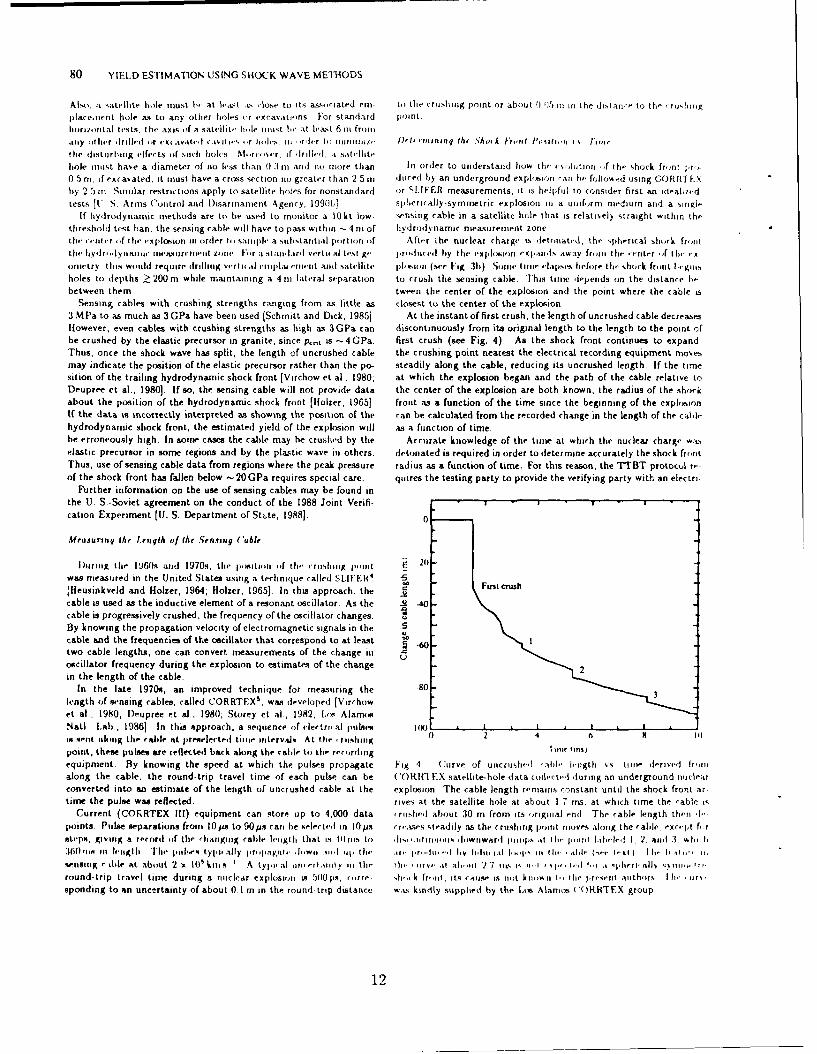
equipment. By knowing the speed at which the pulses propagate Fig 'I Curve of uncrtishicI -ail- leiigthi v-s tiime fderivedl fruit1along the cable, the round-trip travel time of each pulse can be (()RICEX satellite-hole data collectedi during an underground nuclearconverted into an estimate of the length of uncrushed cable at the explosion The cable length remainis coinstant until the shock front ar-time the pulse was reflected. rives at the satellite hole at about 1 7 iris, at which time the cable is
Current (COR5 RTEX 111) equipment can store up to 4,000 data ( rushed about 30 m from its iirigmial enid The cable length theii -I,-points Pulse separations fromn i 0 ps to 90 ps can lie selected iiit u crase-s steadily as the crushing point mioves aloing the cabile esc,,pt firsteps,. giving a recordl if the Chuanginig calile leligtlu that is Willis to iis, t,iifmiuiii do ,iwniwasrdl hIit1hs it Ih$- 1if01t1t 1ife I,2. all" -I. Whii- hi360"1"ins I eiitli Tlhei 11111!1. tyjI-IIf y 4 -1 0 1 frfiiit - li~wii .iii '11, the, Pif jrhr - -1ff I. 1i5 lihi, 1.0 If-i 1 ., iiit Ihr 'Ah,lt (vi. ie-s X I t. ll i t ii ow ,
wensing K ,%de at abotut 2 x 10`~ k itis I A tylp)i sI ul it ii fu IoIit y II II the 1)u, i tive i .1 ii 270 Ilie r, 11-.t ,i i t1 , -1. -1 't .i ,i ri, n~ll5 Siii, 1o'IfI-.
round -trip travel time during a mitic lar ex plosioni vi 500U Is. frorre hi, k friont, its c Atse is no t t linv ti ti le prestelt miit him, [hri -i
spondling to an unctir'ainty of about 0.1 mn in the round-trip distance was kindly supplied by the Los Alamuos CORRTEX group
12
LAMB ET AL. 81
cal pulse corresponding to the time of detonation, with an accuracy crush by the time thl, crriihiig is detected An error of this iiagiiitld,.of ± I + s, for each explosion If this electrical pulse is not received, in determining Lte piit of first crush could introduce an error of•l kt
the time of detonation can still be estimated from the time at which in estimating the yield of a 150kt explosion This unc~rtaiitty canthe electromagnýtic pulse (EM P) caused b) the nuclear explosion ar- be reduced by using the SLIFElR technique to determine the point
rives at the CORRTEX recorder. The CORRTEX technique is less of first crush, or by placing many CORRTEX cables in each satelliteaffected by electromagnetic signals produced by the explosion than hole and staggering the times at which pulses are transmitted down
were earlier techniques In order to prevent the pick-up and recording the cables
of electromagnetic signals that could reveal sensitive nuclear design If the explosion is not spherically symmetric, due to the test geinformation to the verifying party, the TTBT protocol provides for ometry or the presence of natural or man-Made inhomogeneities %i
installation of "anti- intrusiveness" devices in each cable running from the surrounding medium, reconstruction of the evolving shape of the
a satellite hole to any recording facility of the verifying party shock front becomes more complicated and can be quite difficult, ,s-
As discussed in J4, an error of I in in the measured radius of the peciall) if there is only one satellite hole, since there will then Ieshock front will cause an error of about 50 kt in the yield estimate, for data ,nly ahout the mntion of the crushing point nearest the recrdyields near 150 kt Thus, accurate knowledge of the path of the sens- ing equipment along a single path in three-dimensional spare (no dataing cable relative to the center of the explosion is required in order can be collected from the cable beyond the point of first crush, whereto make an accurate yield estimate. The paths of the emplacement the behavior of the shock wave may be significantly different) Theand satellite holes can be determined by directional surveys, geode- reconstruction problem is particularly difficult for nuclear explosionstic measurements, depth measucements, and distance measurements in vertical shaft or tunnel complexes or in cavities, which may be
"[he paths of sensing cables within the satellite hole mnust also be accompanied by complicated (and unanticipated) energy flows andknown accurately If, for example, the cable wanders within the hole complex shock wave patterns.and this is not taken into account, the length of the cable crushed by In the context of treaty-monitoring, problems of this kind can
the shock wave will be greater than the distance along the satellite be reduced by cooperative agreements. Thus, for example, the
hole traveled by the shock front, causing the the speed of the shock TTBT verification protocol [U. S Arms Control and Disarmamentwave and therefore the yield of the explosion to be overestimated. Agency, 1990b] allows the verifying party to use up to six sensing
The path of a cable within the satellite hole can be fixed by creating cables in each of three satellite holes drilled or excavated at differentfiducial loops in the cable at predetermuned points; such loops will azimuths, in order to monitor a nonstandard test. In addition, thecause the length of uncrushed cable to decrease discontinuously as verifying party may use transducers to measure the peak pressurethe shock front passes over them (see Fig. 4) Using these jumps, the or other properties of the shock front, in addition to its position ascable length measurements can be adjusted for systematic errors. a function of time. The verifying party may also request a reference
Although the paths of the satellite and emplacement holes can be test carried out in accordance with a variety of yield, canister,
determined relatively accurately, the position of the center of the and placement requirements, in order to calibrate seismic yieldexplosion within the explosive canister usually will not be accurately estimation methods. Finally, an explosion with a planned aggregateknown to the verifying party in advance of the test. In principle, the yield greater than 35 kt can be carried out in a cavity only if bothcenter of the explosion could be offset from the axis of the explosive parties agree on verification measures.
canister by a substantial fraction of the 1-15m canister radius and
could be located either near the top or near the bottom of a 12 in- 4. Yield Estimation Algorithmslong canister. Such a large uncertainty in the position of the center of
the explision would lead to a very large uncertainty in the estimated Once measurements of the length of the sensing cable have beenyield of the explosion, converted to estimates of the position of the shock front as a function
In practice, the position of the center of the explosion relative to of time, the yield of the explosion can be estimated by applying anthe axis of the explosive canister can often be determined from the algorithm, by which we mean a particular procedure for comparingshock front position data, if the explosion is spherically symmetric the shock front position data with a particular model of the motionFurthermore, if the satellite hole is eseentially straight and parallel of the shock front Because shock wave yield estimation methods are
to the emplacement hole and extends well past the nuclear charge evolving as research continues, the description of yield estirmationemplacement point, the position of the center of the explosion along algorithms given here should be viewed as a status report
the axis of the explosive canister can be determined from cable length We first describe the components of a yield-estimation algorithmmeasurements, since its position is the same as the position of first and then discuss the weighting of shock-front-position data, includ-crush on the sensing cable (see Fig 4). In part to make sure that the ing heavier weighting of data in the so-called "insensitive interval".
location of first crush can be determined, the TTBT protocol requires Next we summarize the conditions under which explosions satisfythat for a test configuration to be standard, each satellite hole must "cube-root scaling" and describe yield estimation algorithms thatextend beyond the end of the associated emplacement hole by at least are based on this scaling. These include the power-law algorithm,30 and 15 m, respectively, for vertical and horizontal emplacement similar-explosion scaling, algorithms based on analytical models, andgeometries, simulated-explosion scaling. All assume that the explosion is spheri-
The discrete character of CORRTEX cable-length measurements cally symmetric and that the ambient medium is uniform When thiscan lead to a significant uncertainty in determining the point of first is the case, the shock wave is spherically syninnetric and the props-
crush, since the cable crushing point moves along the cable at very gation of the shock front can be described by a radius vs time curve
high speed just after the shock front first reaches the cable. For If the explosion is aspherical or the ambient medium is nonuniform,example, if the satellite hole is 10 m away from the emplacement the evolution is more complicated and detailed numerical modeling
hole and the yield of the explosion is 100 kt, the shock front will be may be required, as discussed at the end of this section.
moving at about 10kms-s when it reaches the sensing cable Hence,even if the CORRTEX equipment is set to make measurements every Generul Features
10 ps, the radius of the shock front will increase by 0 1 m between oneCORRTEX pulse and the next Hlowever, in the most unfavorable case A yield estimation algorithni consists of (1) a model of the motionthe shock front will have moved 1 4 in away from the point of first of the shock front that depends on the yield and (2) a procedure
13

82 YIELD ESTIMATION USING SHOCK WAVE METHODS
for comparing the model with shock-front-position data to derive a another similar rock, so that the insnsitive rit,.ral is not sharplyyield estimate. The procedure normally includes a prescription for definedweighting the data when comparing it with the model For example, The existence of an insenstitme ntersal for this ,I,',tion of mediaif the model describes the shock wave evolution more accurately at is not well understood from a funlamerital ph)sial pint of viewsome times than at others, data taken during the time when it is However, work by Lamb, Callen. and Sillihan [!989, and in prepa.more accurate should be weighted higher than data taken at other ration, see also ('allen, Lamb. and Sulhivan. 19901 indiates that th.times. A simple weighting procedure would be to assign unit weight existence of an insensitive interval for this colleiion of silicates is ato data collected during a certain interval and zero weight to data consequence of a particular correlaton amrtong the physical proper-collected outside it. A more sophisticated procedure would be to ties of these rocks Lamb et al have also describ-,,. a procedure forassign weights that gradually increase and then decrease with time determining in advance whether an insensitive interval exists for ain an optimal way At a minimum, weights should be chosen to given collection of media Previously, whether such an interval existseliminate data corrupted by non-hydrodynamic effects of the kind could be determined only fromn nuclear test exp#-ri,'nce or numneri-aldiscussed in J3 simulations of the evolution of shock waves in all the media in the
Given the uncertainties in the ambient medium of nuclear weapon collectiontests that are typically encounr'red, it is usually appropriate to give Knowledge of whether an insensitive interval exists and, f so, itsa higher weight to data collected during the so-called "insensitive position and extent is especially :mportant when attempting to useinterval" (see Lamb [19881). This interval is so-named because ob- the power-law algorithm, since this algorithm gives relatively accu-servations have shown that the radius of the shock front produced rate yields only if such an interval exists and only if the data usedby a nuclear explosion of given yield is relatively insensitive to the come from this interval. However, exploitation of any insensitive in-medium in which the explosion occurs during a certain interval in terval is also important for optimal use of other algorithms Giventime and radius toward the end of the transition interval, for explo- typical uncertainties about the physical properties of the geologicsions in the particular geologic media for which the United States has medium surrounding the nuclear explosive, assigning more weight togood experimental data or theoretical models [Bass and Larsen, 1977; data taken during the insensitive interval will improve the precisionLamb, 1988; Lamb, Callen, and Sullivan, 1989, and in preparation, of any yield-estimation algorithm, even if the model employed in theCall|n, Lamb, and Sullivan, 1990]. These media include the dry al- algorithm provides a relatively good description of the evolution of aluvium, partially saturated tuft, saturated tuff, granite, basalt, and shock wave in rock outside as well as within the insensitive intervalrhyolite at the nuclear test sites the United States has used Thesemedia are mostly silicates and almost all are located at the Nevada Scahng AlgorithmsTest Site. For explosions in these media, the radius of the shock frontappears to depend only weakly on the medium during the insensitive All scaling algorithms assume that the explosion is spherically syrn-interval, despite the fact that phase transitions and shock wave split- metric and that the ambient medium is uniform As noted above, theting occur in some of these media within the insensitive interval. As shock front is then spherical and its evolution can be described byshown in Figure 5. the radius of the shock front in one rock grad- a shock-front radius vs. time (RVT) curve. Scaling algorithms as-ually approaches, crosses, and then gradually deviates from that in sume further that the RVT curve scales with the cube root of the
yield. In addition to the central role of cube-root scaling in scaling.I algorithms, most of the very limited quantity of RVT data from uin
derground nuclear explsions that have been made publicly availablehave been scaled so that the apparent yield is I kt, on the assumptionthat cube-root scaling is valid, in order to protect the confidentiality
of the original data. We therefore begin our description of yield-"20 estimation algorithms with a brief discussion of cube-root scaling
a Csbe-root scaling.-In its usual form, cube-root scaling assumesthat if R = g(t) is the RVT curve produced by a I kt explosion in agiven medium during the hydrodynamic phase, the curve produced
, Wet Tuff by an explosion with a yield of W kt in the same medium is given by
,5 - R= W'1 3
g(t/41 13
) (15)
It is frequently assumed, incorrectly, that this scaling follows fromthe hydrodynamic equations alone Actually, in order to determine
Quartz whether the RVT curves of two nuclear explosions scale with thecube-root of the yield, one must examine not only the hydrody-
0 1namic equations, but also the jump conditions across the shock front,
05• 1.0 11 10 23• the equation of state of the ambient medium, and the initial data
Time (ms) (that is, the pressure, density, and internal energy profiles at thetime the explosion becomes purely hydrodynamic). Previous anal-
Fig 5. Typical shork front radius vs time curves fur IOt) kt explosions yses [Brode, 1968; King et al., 19891 have neglected one or more ofin two different silicate rocks fouind at the Nevada Test Site Note the these considerations."insensitive interval" near I 6 ms during which the two curves lie close The RVT curves produced by different point explosions in theto one another. Experience has shown that radims vs time curves fcur same medium are congruent during the hydrodynamic interval,other silicate media found at U S test sites ilvo lie !,s,, t these curves once they have been scaled using equation (15) [King et al , 1989,near 1.6 ms Because the curves gradually appr.,a h '-aui )ther crwus, Callen, Fiedler. Lamb. and Sullivan. in preparationj Ilowever, theand thee gradually deviate from one another, the insensitve interval is RVT curves produced by different hidrodynamic sources of finitenot sharply defined sue -such as the effective sources produced by underground nuclear
14

LAMB ET AL. 83
explosions-scale exactly only if the sources have the same equation 1000
of state and their masses. radii. and initial pressures scale appro-
priately with their yields (Callen, Fiedler. Lamb, and Sullivan, in Granite model
preparation) These requirements usually ar- niot satisfied by nuclear ....... Power law for-mula
weapon tests Thus, for most nuclear weeajit tests, cube.r,,ot scaling
is at best only approximately valid, even during the hydrodynamic
interval The numerical simulations of Moran and Goldwire [19901 100show that cube-root scaling may he in error by 20-30% in yield
during the hydrodynamic interval for hydrodynamic sources that
they present as models of the hydrodynarmic sources produced by E
different nuclear explosives and test geornitrres Callen, Fiedl,'r, E
Lamb, and Sullivan [in preparation] reach similar conclusions, based ,on their numerical simulations of undergrourul explosions Despite ..z
tothe approximate nature of cube-root scaling for underground nuclear
tests, yield estimation algorithms that assume this scaling often
work quite well (see Lamb, Callen. and Sullivan [19901) Further 0
investigation of the domain of validity of cube-root scaling is needed .2Power-l4w algonthm -This is the simplest yield-estimation algo- "
rithm currently in use The power-law algorithm assumes that the
expansion of the shock wave produced by an underground nuclear
explosion can be accurately modeled by a simple power-law formulathat does not depend on the medium in which the explosion occurs
(see Bass and Larsen [1977]). The power-law formula is
R(l) = a WiI3
(Z/Wi/3
)6
, (If)
where R is the radius of the shock front in meters, W is the yield 0001 .001 .01 .1 1 10 100 1000
of the explosion in kilotons, t is the elapsed time since the beginning Time (ms)of the explosion in rmlliseconds, and a and b are constants For- Fig 6 Comparison of the power law formula (16) with a model of
mula (16) has no theoretical basis, in contrast to the power-law for- the evolution of a shock wave is granite produced by a spherically
mula foe the radius of a strong, self-similar shock wave; it is instead symmetric point explosion with a yield of 62 kt, showing the agree-a purely empirical, approximate relation based on the observation ment of the formula with the model during a portion of the transition
that in many cases RVT data from cables in the emplacment holes interval and the deviation of the formula from the model at earlier
of U S. nuclear tests fall close to relation (16) for a short time after and later times The effect of the phase transformation at 30 GPa isthey are no longer disturbed by non-hydrodynamuc signals The fact included in the model From Lamb [19881
that formula (16) only approximates the actual RVT curve for a brief
time is demonstrated by Figure 6, which compares it with a detailed is an insensitive interval for the collection of rocks being considered
model of the evolution of the shock wave produced in granite by a and if the constants in the formula have been chosen appropriately,
spherically-symmetric point explosion with a yield of 62 kt. the yield estimates near the bottom of the distribution should ap-
According to the assumption on which the power-law algorithm is proximate the actual yield of the explosion. This is the case for the
based, the values of a and b in equation (16) do not depend on the Piledriver estimates, which lie near the 62kt official yield near the
medium (because of this and the fact that it has frequently been used bottom of the "U".
at Los Alamos National Laboratory, eq [16] is sometimes referred to In making the final yield estimate, only RVT data that fall within
as the "Los Alamos Universal Formula"; see Heusinkveld 1982)) The a certain narrower interval (sometimes called the "algorithmic in-
values of the constants a and b are typically determined by fitting terval") are used. The procedure used to select this interval varies
equation (16) to a selected intersal of RVT data from a collection tremendously from group to group. Often there is no set protocol.
of nuclear ,xpl,)ions If only data from the insensitive interval for Instead, the data to be used are selected by eye, on the basis of ex-
the particular collection of media being considered are used, the data perience. Heusinkveld [1979, p. 13] says that investigators at Los
can be approximated by a single curve, as explained above. However, Alamos found that the power-law formula (with the a and 6 val-
different individuals and groups have found different best-fit values ues cited above) agrees best with RVT field data during the interval
of a and 6 for different collections of data Even the values used 0 16 wi'3
rns to 0.6 W/3 nms after the beginning of the explosion,by a single group have changed with time by amounts that have where W is the yield of the explosion in kilotons. More recently, the
caused yield estimates to change by tens of percent. For illustration interval of best agreement has been cited as 0. 1 to 0.5 scaled no [U. S.
in this article, we use the values of a and b suggested by Bass and Congress, 1988]. Indeed, these intervals roughly correspond to the
Larsen [1977] and Heusinkveld [1979, 1982], namely 6.29 and 0 475, insensitive interval identified by Lamb, Callen, and Sullivan [1989,
respectively, and in preparation; see also Callen, Lamb, and Sullivan, 1990]. One
In the usual form of the power-law algorithm, formula (16) is used possible protocol would be to use only radius vs. time data from
to derive a yield estimate W, from each of the shock-front radius and a prescribed interval of scaled time in the final yield estimate (see
time measurements R. and 1, over a broad interval that is thought to Lamb [19881). Because the beginning and ending clock times of any
include the insensitive interval Due to the departure of the power- prescribed interval in scaled time depend on the yield, use of such
law formula from the actual RVT curve at both early and late times a protocol requires that an iterative procedure be followed to esti-
(see Fig. 6), the sequence of yield estimates W, typically forms a mate the yield of an explosion of unknown yield. For definiteness, we
U-shaped distribution, as illustrated by the yield estimates for the take the algorithmic interval to be 0.1 to 0.5 scaled ms throughout
Piedrmver explosion in granite, which are shown in Figure 7 If there the present article. Table 3 lists the time and radius intervals that
15

84 YIELD ESTIMATION USING SHOCK WAVE METHODS
200 indeed be explained in part if these intervals were wthin the strongshock region and if the motion were self-similar The formula for
"- the radius of the shock front would then be a power-law function tiftime and the exponent of i would be exactly 0 4 (see eq 1137) In
ISO reality, however, the shock-wave motion is not self-sirrular during theIintervals used in the power-law algorithm for current test geometries
* and the yields permitted by the TTBT In fact. the shock wave is notS• even strong during this interval, since the shock speed is onk a fw
times the low-pressure plastic wave speed while the peak pressure is•E much less than the pressure required to achieve the limiting density'A too s ratio Indeed, the exponent of time usually used in the power-law.LI. a algorithm, 0.475, is significantly greater than the exponent 0 4 that
" 5a * characterizes a strong, self-similar shock wave [Ileusinkveld, 1979.a a •p. 13; Lamb, 1988]. As explained above, the relative insensitivity of
50 the radius of the shock front to the medium during the algorithmic
interval appears to be due to a particular correlation among the phys-ical properties of the rocks in the collection being considered [Lamb.Callen, and Sullivan, 1989, and in preparation; Callen, Lamb. and
Sullivan, 1990].• c " The sensitivity of an individual yield estimate to an error in the
0 1 2 3 4 inferred location of the shock front depends on the position of the
Time (ms) data point within the algorithmic interval and the yield of the ex-
Fig. 7. The sequence of yield estimates obtained by applying the power- plosion. For example, the sensitivity dW/dR, as determined from
law formula to SLIFER data from the Piledriver explosion in granite equation (16), varies from 13 kt m-' at the beginning of the interval
Note the U-shaped distribution of the yield estimates, which is due to to 5.9 kt m-1 at the end of the interval, for a I0 kt explosion, and
the failure of the power-law formula to describe accurately the actual from 58 to 27ktm-1 , for a 150kt explosion
radius of the shock front as a function of time over any extended in- The power-law algorithm does not work well for all test geome-
terval. The yield estimates near the bottom of the "U" are close to tries and all media. This is illustrated in Figure 8, which shows
the official yield, which is 62 kt. The interval between the two vertical the yield estimates obtained by fitting equation (16) to good-quality
bars is the algorithmic interval defined in the text, for a yield of 62 kt. SLIFER data from a typical low-yield explosion in alluvium The
From Lamb [1988]. shock-front radius and time measurements for this event were mul-tiplied by W11-3
before being made publicly available. As a result,
TABLE 3. Measurement Intervals for the Power-Law Algorithm' the apparent yield should be I kt, if cube-root scaling is valid (Thename of this event and its official yield remain classified.) The yieldYield (kt) Time Interval (ma) Radius Interval (in) 0.9 - , . , - , - , .
1 0.10 - 0.5 2.1 - 4.5t0 0.21 - 1.1 4.5 - 9.750 0.37 - 1.8 7.7 - 17 0.8
100 0.46 - 2.3 9-8 - 2141
150 0.53 - 2.7 11 - 24
"Corresponding to 0.1 to 0.5 scaled ms after the beginning of the explosion 0.7
(see text). From Lamb [1988].
correspond to this interval in scaled time, for several yields- .. 6Proper use of the power-law algorithm requires that shock-wave i K
sensing cables be placed close enough to the center of the explosion .•that they sample the insensitive interval and that only data from this " 0interval be used in the final analysis, since the shock wave evolution ) 0
model used in the algorithm approximates the actual evolution of theshock wave only during this interval, if at all. 0.4a aM
It has sometimes been argued incorrectly that the interval in scaled 0,4time used in the power-law algorithm lies in the strong shock intervaland that the relative insensitivity of yield estimates to the propertiesof the medium during the algorithmic interval stems from this. (Forexample, according to the U. S. Department of State [1986a, 1986bJ, 0.1 0.3 0.5 0.7 0.9 1.1
"The accuracy of the method is believed to be relatively, but not Time (scaled ms)wholly, independent of the geologic medium, provided the satellitehole measurements are made in the 'strong shock' region ... ".) This Fig 8 Yield estimates derived by applying the power-law formula (16)misconception apparently has arisen at least in part because the in- to SLIFER data from a low-yield explosion in alluvium (note the offsetterval formerly used to estimate the yields of nuclear explosions in of the vertical axis from zero) If the power-law algorithm and cube-rootthe atmosphere using hydrodynamic methods is within the strong scaling were valid, the yield estimates would form a U-shaped distribu-shock region. tion with a rrunimum near 1 kt Difficulties in applying the power-law
The relative insensitivity of the radius of the shock front to the algorithm to low-yield explosions in alluvium are not uncommon Frommedium during the intervals used in the power-law algorithm would Lamb (19881.
16

LAMB ET AL 85
estimates given b t he power I;lva lgorithm rang., From 0 30 to 0 82 kt s'ZIM4afled-erplosion •cahny -The basis of so-called simulated-
and do not form a I'-shaped .listrif uti,m The aserage of the yield, explosion scaling is the same as that of similar-explosion scaling,
estimates that lie -ithii the Mg ,rIthrTr iritersal is about 06 kt 're namely the fact that the RVT curves of shock waves produced by
overall appearance of the )ield %s tmio curse shows that the assump- different nuclear tests in the same medium frequently are quite
tions of the algorithm are not satisfied sin-ular during the hydrodynamic interval, once they have beenSimilar-ezplosvon scaling -As noted in the discussion of cube-rooi scaled using equation (IS)
scaling, the RVT curves of shock waves produced by point explosions In simulated-explosion scaling, the yield of an explsoloii of un-
with different yields but in the same uniform meditim will coincide known yield is estimated by scaling the RVT curve from a Iiniu rical
during the hydrodynamic interval. ,twee they have been scaled using simulation of an explosion in a similar medium so that it follows the
equation (15) (see, for exaniie, ' Fig Pl) of llol,er [1965]) Even for lW F data nwasuri',l during the expulosion of interest (see, for example,nuclear tests wh, h certainly are ii.,t ,(p oit ex- plosioins the s- M ,I igs 10, 11, itiml 1.1 of Hlolzer f19t65J)) lhtils, tile- siiulatedl explosion
HVlI , urve, rreqiuintly agree , l,.-'ly 1rer e,-i.,t i sini~lmr mi 4.t I hi i ,lihig algorrlthitt 1s i0 ,11ili, alt to ih,, hniiiilar ex,l,ti,,i ,,, alih g a ,lg,
is the basis of the "smilar-exphloion" scaling algorithli In this al rtithi, extrpt that data frot a compute r siunilation is i.,d, In Iplar.
gorithm, the yield of an explosion of interest is estimated by scaling of data from a reference explosion This has the advantage, from a
RVT measurements from a reference explosion of known yield in a treaty-monitoring viewpoint, of allowing the verifying party to con-
sirrular medium so that they agree with the RVT measurements made struct a reference explosion via numerical simulation if it does not
during the explosion of interest Unlike the power-law algorithm, the have access to field data from a similar explosion but does have a
sinular•-xplcison scaling algorithm can make good use of data taken good model of the equation of state of the ambient medium
outstide the insensitive interval, since the ambient riedia of the ex- A potential difficulty with simulated-explosion scaling is that the
plosion of interest and the reference explosion are assumed to be equation of state of the ambient medium constructed from laboratory
identical measurenments made on small samples may not accurately reflc-t the
Similar-explosion scaling generally works well if the ambient me- equation of state of the rock in the field. In part for this reason,
dia of the two explosions are very sirrular Occasionally, applica- computer simulations that generate reference explosions for use in
tion of this algc ,thm hu led to an unexpectedly large error in the simulated-explosion scaling algorithms often make use of "generic"
derived yield, presumably hecausp the ambient media were not as equations ofstate, which are based both on laboratory measurements
sirrular as had been thought (see Holzer [19651). Usually, however, and shock wave data from actual underground nuclear explosions.
simrilar-explosion scaling provides an accurate yield estimate. Its For example, a "quartz" equation of state may be used to simulate
main disadvantage from a treaty-monitoring viewpoint is that the explosions in hard silicate rocks, such as granites, while a "wet tuff"
verifying party may not have access to data from nuclear explosions equation of state may be used to simulate explosions conducted below
in a medium sirrular to that in which the test mi question is being the water table in a variety of tuffsconducted Like the similar-explosion scaling algorithm, the simulated-
Analytical modeling -- Another possible approach to yield estima- explosion scaling algorithm can make use of data taken outside the
tion uses analytical models of the shock wave evolution, such as insensitive interval.
those proposed by Heusilnkveld (1979, 19821, Lamb [1987, 19881 and
Mosm [19881, and Axford and Ilolm [1987) Detailed numerical modeling"lihe analytical niiodel of Lamb ailn Moss (see 52) treats the prop-
erties of the ambient medium and the motion of the shock front in a All the algorithms discussed up to this point issumc that cube root
simplified way that nevertheless includes the most important effects, scaling is accurate However, as we have previously noted, nuclearThe result is a relatively simple analytical expression for the radius tests typically violate the conditions required for cube-root scaling to
of the shock front as a function of time The model also gives simple hold exactly. This is particularly true for those tests defined as non-expression@ for the post-shock pressure, particle speed, and density standard by the TTBT protocol. Such tests may have large explosiveSuch a model is a useful tool for studying the evolution of shock canisters or lines of sight without choke sections, may be conductedwaves in g,.-', rnedia aanl th, deperndence of the evolution on the in vertical shaft or tunnel complexes or in large cavities, and mayambient medium. lead to significant transport of energy via radiation even at relatively
The model of §2 can also be used to derive relatively accurate large distances from the center of the explosion (see, for example,yield estimates from RVT data, if 'he required physical properties Ying et al. [1989]). Even if a test has a standard vertical or horizon-of the ambient medium are known For examnple, Lamb, Callen, tal geometry, the presence of a geological or geophysical discontinuityand Sullivan [1990] have shown that the model gives yield estimates in the hydrodynamic measurement zone may cause a deviation of thefor U S underground nuclear tests conducted in granite, basalt, shock wave from spherical symmetry (see Lamb [1988]); violations ofand saturated wet tuff that are within 10% of the official yields of the other conditions that are required for cube-root scaling to be anthese events, when realistic Hugoniots and RVT data from only the accurate approximation may occur as well.hydrodynarruc interval are used. At present, detailed numerical simulations using two- and three-
Like the similar-explosion-scaling algorithm but unlike the power- dimensional finite-difference or finite-element hydrodynamic codeslaw algorithm, yield-estimation algorithms based on the model of 12 are the only way one can model nuclear tests in which transportcan make use of data taken outside as well as inside the insensitive of energy via radiation is important in the shock-front measurement
interval, since the model describes the evolution of the shock wave zone, in which shock wave evolution in this zone is significantly af-throughout the hydrodynamic phase The model can also be used to fected by the physical properties of the hydrodynamic source, or inestimate the uncertainty in the yield caused by lack of knowledge of which the ambient medium is significantly inhomogeneous. Numer-the properties of the ambient medium, and is more convenient than ical simulations are also the only way one can model shock wavenumerical simulations for analyzing how shock wave evolution is af- evolution beyond the hydrodynamic zone, although in this zone the
ferted by changes in the physical propeirties of the ambient medium predictive power of present constitutive relations for geologic media
For this reason, the model was used by Lamb, Callen, and Sulli- and present computer codes is limited.van [1989, and in preparation. s"e also ('allen. Lamb, and Sullivan, In addition to the difficulties sometimes encountered in modeling
19901 in their investigation of the physical origins of the insensitive accurately the equation of state of the ambient medium, which have
intrval already been discussed, numerical simulations of explosions in shaft
17

86 YIELD ESTIMATION USING SHOCK WAVE METHODS
or tunnel complexes. in media with voids or geophysical distytinu- Accuracy of Shock Wave Methodsities, or in cavities also have to confront the difficulhies involved IF)
treating accurately the interaction of ashock wave with sharp bound- What aciuraiy can he exp0ectted f(r, rnutine iijtmring o.f hearies between different rocks or between rocks and air yields of underground nuclear tests •-.ng shck-.a.e rnethods' In
In algorithms based on detailed numeri. l modeling, a nvw s.ciu- our judgment, shock-wave methods h i.e it %et been studied in thelation must be run for each yield considered Hence, estimating the [.nited States Ls widely or as thor.. ghl a&, i••ric methods Furyield of even a single nuclear test can be computationally intensive therinore, very few of the studies that niave beer) arried out have
It may be possible to use data taken within a shaft or tunnel corn- been published in the open literature F. .xamrple the results o,f theplex or cavity, if radiation transport and shock wave propagation 1988 Joint Verification Experiment ,arr-e.I out 1, iho United Stateswithin the complex or cavity can be accurately simulated It may and the Soviet Unmon, have still not been made available to the publicalso be possible to use data from beyond the hydrodynamic zone, if even though they are fully available to both go,'rriments The statusreliable constitutive relations are available for the ambient medium of shock-wave methods in the Soviet I :jon is -sen less clear, withObviously, algorithris that make use of such data are not purely by- essentially no Information available in the ,pen literature Given thedrodynamic very limited information available in the )pen literature, it is all but
impossible to present here a meaningful assessment of the probableLow- Yield Explosions accuracy of shock-wave methods when used as a treaty-monitoring
too[ Nevertheless, the most likely sources of systematic and randomTamped underground ncclear explosions as small as a few kilotons error can be identified
produce shock waves that evolve in the same way as those produced Variations in the contents of the explosive canister can cause sys-by larger-yield explosions However, because the hydrodynanuc zone tematic errors in yield estimates based on shock-wave methods Forfor such low-yield explosions ends much closer to the explosive rants- example, Moran and Goldwire [1990] have shown, as noted earlier,ter than it does for tests with yields Z 50kt, the effects ofthe canister, that the yields ofspherically-symmetric explosions inferred from datacableways, and open lines of sight on the evolution of the shock front taken in the hydrodynamic measurement zone may differ from theare generally more important Moreover, low-yield tests can be and actual yields by 20%, for the hydrodynamic sources they present asoften are set off at shallow depths in softer material, such as alluvium, models of the sources produced by different nuclear explosives andor in tunnels or cavities. The shock waves produced by such explo- test geometries The conclusions of Moran and Goldwire (1990] aresions can differ markedly from the models of spherically-symmetric supported by the numerical simulations of Callen, Fiedler, Lamb, andshock waves in hard rock that are used in most hydrodynamic yield Sullivan [in preparation), who also find that the characteristics of theestimation algorithms Moreover, the shock waves produced by such source can affect yield estimates based on hydrodynamic algorithrmsexplosions have been observed to differ from test to test These dif- Since the contents of the explosive canister are unlikely to be knownferences are potential sources of error in the yield estimate, to the verifying party, such differences are a source of uncertainty for
Serious practical, operational, and engineering problems also arise hydrodynamic yield estimates made under treaty-monitoring condi-in trying to use hydrodynamic methods to estimate the yields of tions.explosions with yields of a few kilotons. For one thing, the sensing In addition to systematic errors caused by differences between thecable must be placed very close to the nuclear charge in order to assumed and actual properttes of the hydrodynamic source, any dif-sample the hydrodynamnc zone Drilling emplacement and satellite ferences between the actual and assumed geological and geophysicalholes 4 meters from one another to the depth at which the explosive properties of the surrounding medium will cause systematic or ran-canister is emplaced (Z 200 m), which would be required in order to dom errors in the yield estimate. For example, incorrect assumptionsuse hydrodynamic methods to monitor a 10kt test in a standard about the average properties of the ambient medium, including thevertical geometry, is at or beyond the capabilities of current drilling equation of state of the rock, would bias the yield estimate, decreas-techniques.' In horizontal tunnel geometries, the need to take data ing its accuracy, whereas variations in the properties of the mediumso close to the center of the explosion would force placement of the on small scales would cause scatter in shock-front position measure-sensing cahle so close to the tunnel wall that the motion of the shock ments, decreas:ng the precision of the yield estimate [Lamb, 1988].front along the sensing cable would probably be significantly distorted Large-scale geological or geophysical structures within the hydro-by the tunnel, d)nanic measurement zone can also affect the yield estimate. For
The need to make measurements close to the center of the explosion example, the alluvial deposits at the Nevada Test Site are weakly con-would also necessitate more stringent restrictions on the dimensions solidated erosion products of the surrounding mountains with phys-of explosive canisters, cableways, and open lines of sight, in order to ical properties that vary widely Layers of gravel, the residues ofassure accuracy Such restrictions might be deemed an unacceptable ancient stream beds, are often encountered in drilled holes Whileinterference with test programs. Finally, because the shock front mobt shock-front position measurements at NTS behave as expected,must be measured at much smaller radii, any errors in surveying the an occasional test has produced irregular data that defy simple ex-emplacement and satellite holes or in determining the time of the planation Such results have been attributed to spatial variations inexplosion and the point of first crush are more Important than for the ambient medium (Holzer, 19651 As another example, dissolutionlarger-yield explosions cavities may be present in the carbonate rocks of the Soviet Northern
It is possible that some of these difficulties coud be alleviated by Test Site on the island of Novaya Zerniya Such cavities, if locateddeveloping models and algorithms that would al;ow routine use of within the hydrodynamic measurement zone and unrecognized or un-shock wave position data taken at distances beyond the hydrody- filled, could significantly distort the shock front, thereby biasing thenamic interval, although current experience with such data is not yield estimatevery encouraging In any case, these and other potential solutions Man-made structures within the hydrodynamic measurement zoneto the problems that would be encountered in monitoring low-yield can also cause systematic errors in the yield estimate, if they aretests using hydrodynamic methods have not yet been carefully and not adequately filled or modeled. Such structures may include ver-thoroughly studied Thus, at the present time hydrodynamic yield tical shafts or horizontal tunnels as well a&s cavities Other potentialestimation methods could not be used with confidence to monitor sources of bias include errors in deterrmning the time of detonationcompliance with thr-,shold test bans in which the threshold is less and the position of the center of the explosion and in determiningthan several tens of kilotons the paths of the sensing cables relative to the center of the explosion
18

LAMB ET AL 87
SLIFER data have he.-n rfll#,fted frrnu sensing cables pOy~itionfd pro-luo'd by An und,.rgr,,jint expl,-.io increases with the yield ofin the nuclear explosie ,-rillaeinient hole fo=r ltmany tens of under- the e.xplosioni At pres-,int th, moost accurate yields are given byground nuclear tests, and fromf .,enisilc ,dtl, pisitioned in satellite al,,rjthiiis that use ,rely data rcllert,-. within the hydrodynamicholeb for several tees of tests I!; S 198r r 1s. 19$8J t:ORR'IE.X &ata Zon0- which extends - k, /l)t t iw,"rs from the center of thehas reportedly been collected from sensing cables positioned in the explosionemplacement hole for - 10O nuclear tests. amd from sensing cables The esolution of the shock wave within the hydrodynanic zonepositioned in one or more satellite hol,',s for a dozen or so tests [1 S dep,.nds on the properties of the source and the nature of the sur-Department of State, 1986a, 1986b, I; S Congress 19881 A sery ro.indig geologic nediumui When hlydrodynaniic methods are usedsmall fraction of the SLIFER data has teen relea.sed pubhily, Host of under treaty monitoring rcooit ,ms. the verifying party's lack of init only after having b-en scaled (assuinine the salidity of rdcub riot furyiation about the cont,'nts ,f thi '-xllosive canister introduces amiscaling) so that the apparent yield is I kt (see lieusinkveld [19791 and uncrtainty inl the derived yield that may le about 20% for testsHeusinkveld [19821) At present, all 'ORRTEX data remain cla.ssi- c, ducted in standard ge,,metrues Any errors or uncertainties in de-fied teriuning the time of the explosion ,r the position of the shock front
According to the U. S Department of State [1986a, 1986h), hy- relative to the center of the explos•'n or in modeling the equationdrodynamic yield estimates have fallen within 15% of radiochenu- of state of the ambient mediuri and the effects of any natural orcal yield estimates (at the 95% confidence level), for historic tests man-made geological or geophysical structures will increase the un-with yields greater than S0 kt conducted in the geologic media of the certainty of the yield estimate For standard tests with yields greaterNevada Test Site. According to these same reports, hydrodynamic than several tens of kilotons conducted in ambient geologic media formethods are expected to have an uncertainty of a factor of 1 3 at the which the verifying party has direct experience or good theoretical95% confidence level when used under treaty-monitoring conditions models, the uncertainty in yield estimates may be as small as 30%at the Soviet test sites near Shagan River to mcnitor explosions with Nuclear tests conducted in cavities or in vertical shaft or horizontalyields greater than 50kt However, some scientists familiar with by- tunnel complexes typically produce more complicated shock wavesdrodynamic methods believe that the uncertainty could be somewhat Hence the uncertainty in the estirnated yield 'if such a nonstandardlarger (see U S Congress [1988), appendtx on CORRTEX). test is likely to be greater than for a test conducted in a standard
While one may hope that the uncertainties will turn out to be a. vertical or horizontal geometrysmall as 30%, only time and experience will show what the uncer- The algorithms that lase been used to extract yield estimates fromtainties actually are. This is especially so because the U S nuclear shock-wave measurements within the hydrodynamic zone vary in ac-community does not yet have experience with monitoring tests in ge- curacy and reliability Even the best hydrodynamic algorithms mayologic media such as the frozen carbonate and silicate rocks at the not always be more precise than seismic algorithms, especially if re-Soviet Northern Test Site on Novaya Zemlya Island, or in monitoring gional as well as teleseismic phases are used in constructing the sets-nuclear tests involving complex geometries, substantial cavities, or mic yield estimate [Hansen, Ringdal, and Richards, 19901. Shock-multiple explosions at Soviet test sites. wave yield estimation algorithms are not affected by the large-scale
It has been claimed in Congressional hearings on ITBT and features of the test site or the geophysical properties of the earthPNET verification and elsewhere' that hydrodynamic methods beneath it, as seismic algorithms are, but shock-wave algorithms areare "direct" whereas seismic methods are not. In fact, both hy- more affected than seismic algorithms by local structures that disturbdrodynamic and seismic methods estimate the yield indirectly, by the evolution of the shock wave, such as tunnels, shafts, and voids,measuring the ground motion produced by the explosion In both and geological and geophysical discontinuities. Thus, for explosionsmethods, the important events are: (I) production of a signal by with yields greater than several tens of kilotons, shock-wave methodsthe exploding nuclear charge, (2) propagation of the signal to points can complement seismic methods. The yields of such undergroundmore or less remote from the detonation point, and (3) detection nuclear explosions can therefore be estimated more accurately byof the signal by sensors at the remote points Relevant questions combining the two methods than by using either method alone.for both methods include how the size of the signal varies with Acknowledgermens.-lt is a pleasure to thank T. Ahrens, D. Eilers,yield, how well the propagation of the signal is understood, and how R. Ged, M. Heusinkveld, R. Hill, B. Leith, and G. Miller for helpfulaccurately and precisely the signal can be measured discussions of shock wave propagation and yield estimation. The
It has also been asserted that use of hydrodynamic methods in and authors are also grateful to T Ahrens and W. Moss for carefullyof itself eliminates the possibility of systematic error or "bias" (see, reading a draft of this review and suggesting numerous improvementsfor example, the testimony of J H McNally in U. S. Senate (1987], This work was supported in part by DARPA through the Geophysicspp 27 and 99-101). If what was meant is that hydrodynamic meth- Laboratory under contract F-19628-88-K-0040ods do not suffer from "regional seismic bias", the statement is truebut trivial, since regional seismic bias obviously is not relevant tonon-seismic yield-estimation methods On the other hand, if what Noteswas meant is that hydrodynamic methods do not suffer from hiss inthe seanse of sythmatic errornamic t sementh s donotsufr fr balse Bo 'The motion of the shock wave changes only gradually and so thethe se nse of syste m at ic error, the statem ent is ob'4iously false. B oth p i t a h c t i a d t n e h r n i i n i t r a s p r lhydrodynarruc and seismic yield estimation methocd -r: .ubject to point at which it is said to enter the transition interval is purelysystematic as well as random errors Relevant questions are the ex- conventional. Throughout the present article we use the convention
pected sizes of the errors, and whether they are so large as to be of that the transition interval begins when the peak density ratio falls
concern to 80% of its lirruting value.2Again, the motion of the shock wave changes only gradually and
5 Conclusions so the point at which it is said to enter the low-pressure plastic waveinterval is purely conventional. Throughout the present article we
Shock-wave yield estimation methods were developed by the use the convention that the low-pressure plastic wave interval beginsUnited States and the Soviet Union primarily as tools for estimating when the shock speed falls to 1.2 times the low-pressure plastic wavethe yields of their respective nuclear tests These methods make speed.use of the fact that the strength of the expanding shock wave 'in order to prevent seepage of radioactive gases to the surface, the
19

88 Y IELD ESTIMAT1ON US ING S HOC K W ANvE METHODS
depth of b u rial ([DOB) of U S tests is at lea~st 12, 1 1[V/1 k t) "3 lin I ni-t-,llattr. Y %I (1)15a --i i > 69 17,44 Plenum New
Th is requ ires a DO B of at least 650) in for a IS Wlkt , x loIsioir %Vhen NIrk l9kt6the DOB given by this relation would be' relatis-!t miall, or in rriwida llanv-ri It A ,F IfingdAl aliil P' (; H) * ardi. lh.- (abdavtt .f rifwith a substantial water content, the a, tial l)( )h is 11icrearsed init:.ir-~,rt anid their poerjt:.. fr accurate- t-stimasti,,ri oforder to assure con, at nent of radioac tive gas,.. I h-actual D OlB of It lds, of svwt in li-rgroun~ ri-i iib-ar exp;l,k tons GspI iC
an explosion at the Nevada Test Site is normially Yit le.ss Thtan 21)1)ni lu.ah ýrir~ kllariscri Air Force I-aM ass ) Rep GIT [I ot-,See U. S Congress 11989). pp 35 37 006 1. l-.4hrir~ 19911
'SLIFER is an acronymi for Shorted l~orart),rj ItltjCator lvy Fre- lleiisitiksell. %I -arid F Hlolzer, Met hA ci onltinruous slio'k frctirtquency of Electrical Resonance pcisit tor rneasurinetv-i Rev S,-i In-t 3-5 1 105ý- 1107, 1964
SCORRTEX is an acronymn for Continuous llelectonieiii'i for Raditus fll-usirtkA-ld MI Arai~slvst oSLf SIIbFR Iata frooi underground nuclearversus Time Experiments It is a nsminwi.r, strice 11w saiitpirig ii evjittstiiis L~awr,-rire Livermnore Nat,,,nal lal~oratory. Rep (IULltime is discrete 526414. 1979
ll.,iiviitk eld M , A nalysis if slicrk wa~e arrivsal time from under-"During preparations for the 1988 U S -Soviet Jloin~t Verification grouiid exhsliosins. J (;ophys Res . 97, 1891- 1898, 1982
Experiment (see U S. Department of State [1988)), the Soviets Stated Holzecr. F . Measurements and calculations of peak shock-wave pa.that they did not have the technology to drill satellite and ernplace- rarriters from undergrorund nuclear detunations, J. Geophys Res.ment holes to the required depth (presumably -~ 6.50 ni) while main- 70, S93 905. 1965taining a horizontal displacement within the tolerance (presumably Johnson, G W , G H. Higgins, and C E Violet, Underground nu-- 10 m) required by the United States. As a result, the United States clear detonations, J Geophys Res . 6-1, 1457-1470, 1959.flew its drill rig and crew to the Soviet test site See C P. Robinson, King, D S , B E Freeman, D. D Eilers, and J D. Johnson, TheTestimony before the Subcom~mittee on Arms Control, International effective yield of a nuclear explosion in a small cavity in geologicSecurity, and Science, House Committee on Foreign Affairs, June 28, material, J1 Geophys. Res , 94, 12317512385, 1989.1988. Lamb. F K , A4n approximate solution for ground shock propagation.
'See U S Senate [1987], R. B. Barker, at pp 8. 19, and 89-90, ['niversity of Illinois Program in Arms Control, Disarmament. andD. A. Vessr, at p. 94; S. Rt. Foley, at p 11, J H McNally, at pp 27 International Security, Rep WP-2-87-2, February 1987.and 99-101; H. A. Holmes, at pp. 5Sand 108. Seecalso Robinson (1990[ Lamb, F K , Monitoring yields of underground nuclear tests usinghby-
drodynarwuc methods, in Nuclear Armas Technologies in the 1990s,References D Schroeer and D. Hafemneister, eds., pp. 109-148, American In-
stitute of Physics, New York, 1988AI'tshuler, L. V., N. N Kalinin, L. V. Kuz'mina. and B. S. Chekin, Lamb, F K , B W Callen, and 1. D. Sullivan, Insensitive interval in
Shock adiabats for ultrahigh pressures, Soy. Phys. -JETP 45, 161 - the evolution of shock waves from underground nuclear explosions,171, 1977. Rep prepared for I11th Annual AFGL/DARPA Seismic Research
Axford, R. A. and D. D. Holm, in Proc. Nuclear Explosion Design Symposium, San Antonio, Tex , May 1989; University of IllinoisC7onference, Los Alamos National Laboratory, October 1987 Physics Dept Rep, P-89-5-77. May 1989
Barenblatt, G. I , Similarity, Self-similarity, and Intermediate Asyrrp- Lamnb, F K , B W Callen, and J D Sullivan, An approximate sos-totics, Consultants Bureau, New York, 1979 [English Translation). lytical model of shock waves from underground nuclear explosions.
Bass, R. C., and Larsen, G . E , Shock propagation in several geologic submitted to J. Geophys. Res , Deceniber 1990materials of interest in hydrodynamnic yield determiunat ions, Sandia Los Alanics National Laboratory, Public information sheet on CORR-Laboratory, Rep. SAND77-0402, 1977 TEX. April 1986.
Brode, H. L., Review of nuclear weapons effects. Ann. Rev Nuclear MlcQiieen, R., 3. N. F~ritz, and J W Hopson. High-pressure equationSc,., 18, 153-202, 1968. of state ofSiO2 , M-6 Prog Rep. M-6-200, pp. 78-136, Los Alamos
Butkovicb, T. R., Calculation of the shock wave from an underground National Laboratory, Los Alamos, N M., Jan.-March 1977.nuclear explosion in granite, J. Geopliys. Res., 70. 885-89i, 1965. Moran, B . and H C. Goldwire, Jr , Effect of source modelling
Callen, B W., F. K. Lamb, and J. D Sulliv-an, Insensitive interval in on the inferred yield from an underground nuclear explosion, inthe evolution of shock waves from explosions, in Shock Compres- Shock Compression of Condensed %fatter-1989, S. C Schmuidt.
sion of Condensed Matter-1989, S. C. Schmidt, J N Johnson, and J N' Johnson, and L. W Davison. rds., pp 645-648, ElsevierL W. Davison, eds., pp. 241-244, Elsevier Science Pubs , Amster- Science Pubs , Amnsterdam, 1990darn, 1990. Murri. WV 3 , D. R. Curran, C F Petersen, and R C. Crewdson.
Chung, D H., and G. Simmons, Pressure derivatives of the elastic Response of solids to shock waves, in Advances in High-Pressureproperties of polycrystalline quartz and rutile, Earth Planet .%i. Research. Vol 4. R.I H.lentorf. Jr , ed , 1-163. Academic Press.Lett., 6, 134-138, 1969ý London, 1974
Deupree, R, G_ D. D Falers, T. 0 McKown, and "". If Storey, Moss, W C , A method to estimate the yield of an undergroundCORRTEX- a compact and versatile system for time domain reflec- nuclear explosion, J. Appl Phys, ,63. 4771-4773, 1988Cometry, Los Alarnos National Laboratory, Rep LA-UR-80-3382, Nuckolls, J 11., A computer calculation of Rainier (the first 1001980. miulliseconds), in Proc. Second Plowshare Symposium, A'fasi 13-15,
Germain. L S , and Kahn, J S., Phenornenolo~gy antd ccntainment of 1959, 5,ac, Francisco, California Part I Phenomenology of Un-underground nuclear explosions, Lawrence Radiatioin Laboiratory. derground Nuclear Explosions, University of California RadiationRep UCRL-50482, November 1968. Laboratory, Rep. UCRL-5675, pp. 120-134, 1959.
Glasatone, S , and P Dolan, Effects of Nuclear Weapons, U.- S Gov- Ragan, C. E ,Ill, Shock wave experiments at three-fold compression,ermient Printing Office, Washington, 1977 Phys Rev A29, 1391-1402, 1984
Glenn. H. D., T F. Stubbs, J. A Kalinowski. andI E C Woodward, Robinson, C P, Verifying testing treaties -old and new (interview).Cc-itaunment analysis for the Queso event. L.awrence L~ivermore. Arras Control Today, 20, 3-7, 1990.National Laboratory, Rep UCRL-89410r Auiguti 19),3 Scbrrirt, G G , and R D Dick. Use of CORRTEX to measure ex-
Glenn, If D_. T F Stubbs, and J A Kalinowski, in Shock Waves in plosive performance and stem behavior in oil shale fragmentation
20

LAMB ET AL. 89
tests. Los Alanmos Nati,, nal Lah-.raiy r, 1(,,[, LA I R "' 2.11 ( I',,tigress ( tti,-, f Terlcit, lgy Assessnient, The ContainmentSed,lv I, I [he motion of air in i r.ug *v .- ooi Pu1 an.I df tidcrground Nuclear Explosioni, OTA-ISC-4 14, U S Govern-A k.ifetni% i natuk S5';[?. 04. Ila- _2. 17 ̀01 i -i;lln Priiiting Office, Washington. 1) C' , October 1 989
I.d 1 1 'itrularit ,v ;io I l nIilii!l-, In.I MI, .s hail A, a I Congress, Ofic )li f TechIinology A.ssessment, Seismicu Vvrifica-lIonic Press New York. 1 959 jFnglish traiivlatic~iij ,[ FNuclear Testinig Treaties. ITIA-IS(t '361. U S Governmenit
Sti)rey W It Jr 1) D Edkrs I- Ir \IK-ni 1) %1 11Idi in-I Print-ing Offire. Washington, 1) C ,May 1998Conradl, CORRTEX 11 a dlual iur.r-'.,r ontr,,1lcl in':riuilo [t ', D epartmnent of State, Bureau of Public Affairs, U S policyfin' dynamic shock position measurements. L", Alaniie Natirosia r, Iriling limiitationis (,n nuclear testing, Special Report No 150,Laboratory, Rep LA-LR-82-.5-5. 198t2 Vigust 19863 (a)
Taylor, G I .The formation of a blast wave b a %ery intens e ';I I iepartmientt of State, Bureau of Public Affairs, Verifying nu-ploaion I Theoretical discussion, Pro, RoY Sor (Lonldon). 14201, 1-ar testing limitations possible LT S -Soviet cooperation, Special159-174 19.50 (a) lfep.,rt No 1.52, August 1986 (b)
Taylor, G I ,The formation of a blast wave by. a vinry intense explo>- I S Departmnent of State, Agreemrent Between the United States%ion If The atomic explosion of 1915, Pcoc Royv Soc ('London). f .4 ri-rca and the Union of Soviet Socialist Republics on the4201. 17.5 186. 1950 (b) ( Induct of a Joint Verification Expeciment, May 19R8
[enhune, R W .H D Glenn 1) E Burton. It 1, McKaguv'. and] I S Senate, Threshold Test Ban T1reaty and Peaceful Nuclear ExpliiJ T Rambo, Numerical simulation of tit, Baneberry event, Stic/ sons Treaty, Hearings Before the Committee on Foreign Relations.Tech . 46, 159-169, 1979. U S. Government Printing Office, Washington, D C., 1987.
U S Arms Control and Disarmament Agency, Arrms Coiitrol Agree- Nirchow, C. F., G. E. Conrad, D M Holt, and E. K. Hodson,.mients. 1990 (a). %11 ic roprocesaor-cont rolled time domain reflectometer for dynamic
U S Arrms Control and Disarmament Agency, Treaty' Between the shock position measurements, Rev Sci. Inst., 51, 642-646, 1980United States of Amnerica and the Union of Soviet Socialist Re- Wackerle, J., Shock wave compression of quartz, J. AppI. Phys., 33,publics on the Limiutation of Underground Nuclear Weapons Tests 922--937, 1962.and Treaty Between the United States of America and the Union 7el'dovich, Ya. B , and Yu. P. Raizer, Physics of Shock Waves andof Soviet Sorialist Republic~s on Underground Nuclear Explosions High- Temperature Hyi drodynamic Phenomena, Academic Press-,for Peaceful Purposes Text of Treaties and Protocols, 1990 (b) New Ycirk. 1967 [English translaticinj
21

JM L R AI . (&, 0)'10i l( AI RESi AR. IEI. '(, t. )7 NO() E 1 1 -,\(,I 1, - , I \\I \k)R'i t 1992
An Approximate Analytical Model of Shock WavesFrom Underground Nuclear Explosions
F K. Lok.iBa.I B. W. (C.As It N.' ANt) J. D. Sut .,
Depritment of 1hý it, i and Program tn Armns Control. h.arma,-mm'nt. and lratcrmsilmionaim S.et dri ivUn merstN ot Ilmnm•m. Urbunau.C-himmpaten
We discuss an approximate analytical nmodcl for the hsdrodsnamuc CvditoWRi okt he ,hock frntproduced hy a spherically symmetric explosion mn a homogeneous mcdium The model assumes aparticular relation betieen (he energy of (he explosion. the density 4 the niedimn into which theshock wave is expanding. and the particle speed immediately behind ihe .hock tron he assumedrelation is exact for shock waves that are strong and self-similar Comparison ",th numericalsimulations indicates that the relation is also approximately valid for shock Waves that are neitherstrong nor self-stmdlai Using the assumed relation and the Elugonmot of the ambeni medium expressedas a relation between the shock speed and the posthock particle speed, one can calculate the radiusand other properties of the shock front as a function of time The model also allow s one !o investigatehow the evolution of the shock wave is influenced by the properties of the ambient medium and howthese properties affect the characteristic radius at which the shock Wave becomes a low-pressureplastic wave The shock front radius versus time curves predicted bý the model agree well withnumerical -simulations of explosions in quartz and wet tuff and with data from four undergroundnuclear tests conducted in granite, basalt, and wet tuff when the official yields are assumed. When themodel is used instead to fit radius versus time data from the hydrodynamic phases of these tests, itgives yields that are "inhl-n 8C', of the ofticial yields when piecewise-linear approximations to theHugoniots are used rhis accuracy is comparable to the accuracy of other models,
I. INTRODucttrON called hydrodynamic phase [see Lamb, 1988], because theevolution of the shock wave during this phase is relatiels
Shock wave methods have long been used to estimate the simple. The energy released by a nuclear explosion initiallsyields of nuclear explosions, both in the atmosphere (see, for emerges from the nuclear device as nuclear radiation. fissionexample. Sedov [19461 and Taylor [1950b]) and under- fragments, and thermal electromagnetic radiation [see (lao-
ground (see, for eý'ample. Johnson et al. [19591 and Nuckol5s stone and Dolan. 197?. pp. !2-25 and 61-63]. At the ,ern[1)591). All such methods are based on the fact that the earliest times, energy is carried outward by the expandingstrength of the shock wave produced by an explosion weapon debris and radiation. As this debris and radiatiinincreases with the yield, all other things being equal. As a interact with the surrounding medium, a strong shock Waveresult, the peak pressure, peak density, and shock speed at forms and begins to expand. The evolution of the explosiona given radius all increase monotonically with the yield. dunng this phase can be followed using the equations ofHence, by comparing measurement, of these quantities with hydrodynamics and radiation transport. However, withinthe values predicted by a model of the evolution of the shock - 10--100 s. depending on the yield and the composition andwave in the relevant ambient medium. the explosive yield distribution of matter surrounding the nuclear charge. thecan be estimated. Shock wave methods for determining the outward flow of energy via radiation become. unimportant.yields of underground nuclear explosions are of increasing and the explosion can be descnbed using the equations otinterest as one means of monitoring limitations on under- hydrodynamics alone. At this point the explosion enters theground nuclear testing. These methods were hrst introduced (purely) hydrodynamic phase. [he radial stress produced byas a treaty-monitoring tool in the original Protocol of the the shock wave at the beginning of this phase greatlyPeaceful Nuclear Explosions rreaty of 1976 [U.S Arm.i exceeds the critical stress at Which the surrounding rockControl and Disarmament Agem v. 190a [. Hydrodynamic becomes plastic, so that to a good approximation themethods were explored further in a joint U.S -USSR verifi- shocked medium can be treated as a fluid. As the shock waisccation experiment [U.S. Department Y) State. 19881 ,ind expands, it weakens. Eventually. the strength of the rockhave now been incorporated in new protocols to the thresh- can no longer be neglected. the fluid approximation fails, andold Test Ban and Peaceful Nuclear Explosions Treaties the hydrodynamic phase ends. Yield estimation methods[U.S. Arms Control and Disarrnarnct Aientv. 1990h)]. that use measurements made during the hirdrodynatmuc
Most shock wave algorithms for estimating the yields of phase are called hydrodynamic methods.underground nuclear explosions have focu,,ed on the ,,o- All hydrodynamic methods require a model of the evolu-
timn i the shock wave Models in recent or current use
'Also at Department of Astronomv. L niversut, of Illinois. t'r range in sophistication from an empincal power law tormulahana-Champaign that supposes the e ,olutton is completelv independent of the
-Now at Department of Physics l)vurs ( ollege. Springfield medium 8as i anmd L[,'r,,n. 19771 (see also lteuunlt, id
Missouri [19821 and Lamb 1198891) to multidimensional numericalCopynght 1992 by the American (ieophs.,ial L. niln simulations based on dcetaled equations of state i for recent
Paper number 91JB02348 examples of one-dimensional simulations. see Mos 1 )oil0148-0227/92/91JB-02348505 ou) Am:c ct ,i I1l9891. and tloran and Goild ire 1199011 Whcn
The U.S. Government Is authorized to reproduce and sell this reoort.
Permission for further reproduction by others must be obtained from j 0
the copyvight owne.
22

Nb I ,I %I Eli I k I 55 i, SI " I , , I % i , f sI , 'I " II .), 5.1-.I
detailed equations ot [,ide data are as ,ala-ie, , striate - the-art Ii section ; A isse s` the accurac s of the model We hfist
numerical sIMiulatiO, ife expected to he highl accuratc. at shoA that ihe arsatz •,s exact for a shock wave that is strong
least for sphericall,, %inmciiec. tamped e xplosions in horo- and scit- similar 'e then compare this ansatz with results
cencous media Ne ertheles,. a simple anals i al niodel Af trm numeric:al siimiiulations and find (hat it is also remark-
(he shock wave produted bh such explosions that illo\&- one ably accurate ot 1sphcrical shock wAaves that are neither
to determine how the e.olutron depends on the Huponiot strong nor sellsit imila Finally, we compare the radius
ank the yield is useful for several reasons. First, detailed sersus time and particlc velocity versus radius curves pre-
equations of state tre asailahle only for a few geologic dicted by the model \,ith the corresponding curves ohtained
media. Second, large codes can be run for onl, a limited from numerical simulations of underground nuclear explo-
number of cases. rhird and most importantlýy, an anals tcal sions We conclude that the model with point source bound-
model is more conýenucnt than numerical simulations Ior ar, conditions prov ides a remarkably good description of the
analy-zing how the esolution is affected bs the properties of spherically s`mmetric shock waves produced by such explo-
the ambient medium. -ions.
This is the first of seseral papers in which we unesttgate In section 4 we show that the radius versus time curves
the evolution of the shock wave produced by a sphericall, gvien by the analytic:t.l model of section 2 provide an
symmetric explosion it a homogeneous medium during the excellent description of the field data from four underground
hydrodynamic phase Such a shock wave is n.cessaril, nuclear tests conducted by the United States. dcspit- the
spherically symmetric. Here .%e inestugate a simple anailt- fact that these tests are not po.nt explosions and that the
tcal model In this nmodel the compression of the medium at ambient media may he nonuniform. In fact, the model
the shock front is treated exactly, using the Rankine- s`ometimes describes the data accurately even well beyond
Hugomot jump conditions and the Hugonuot of the ambient the hydrodynamic phase of the explosion. When the model
medium. rhe rarefaction of the shocked fluid that occurs as and the Hugomots of sections 3 and 4 are used to estimate
the shock front advances is treated approximately. s ia an yields using data from the hydrodynamic phase of these fouransatz relating the specific kinetic energy of the fluid just nuclear explosions, the resulting estimates are within 87 of
behind the shock front to the mean specific energy wi•thin the the official yields. For comparison, when the numerical
shocked volume This model was proposed by Lamb [198']. simulations described in section 3 are fitted to the same data.who showed that it is exact for strong. self-si`milar shock the resulting yield estimates are within 9%/ of the official
waves. Lamb [1987] also made a preliminary comparison of yields. Our lack of knowledge of the geometry of these tests.
the shock front radius ;ersus time curves predicted by the of the way in which the data was gathered, and, in the case
model with data from several underground nuclear explo- of one explosion, of the medium in which the explosion
sions and numerical simulations The model was proposed occurred makes it difficult to assess whether the relatively
independently by Mis, I 19891. who compared its predictions small differences, betw,.een the various yield estimates are due
with particle speed data from underground nuclear explo- to errors in the radius versus time data, departures from
sions and numerical simulations. Their results showed that spherical symmetry due to asphericity of the source and/or
the model provides a useful approximate description of the inhomogeneity of the ambient medium, uncertainties in the
shock wave evolution throughout the hydrodynamic phase. yield standard, or inadequacies of the models. The U.S.
rhe model is similar in spirit to one proposed earlier by Department of State [1986a. b] has claimed that hydrody-
iteusinkveld [1979. 1982] but is more satisfactory theoreti- namic methods are accurate to within 15% (at the 95t7'
cally and appears to provide a more accurate description of confidence level) of radiochemical yield estimates for tests
underground nuclear explosions, as shown in our appendix. with yields greater than 50 kt in the geologic media found it
In section 2 we hrst discuss the assumptions on which the the Nevada 'rest Site (see also U.S. Congress. Office oJ
model is based, minluding the ansatz relating the specific Teihnology Asse.ssment [1988. pp. 129-139] and Lamb
kinetic energy of the fluid just behind the shock front to the [1988J). Thus the analytical model of section 2 appears to be
mean specific energ,, wýithin the shocked volume Next. we competitive with other models for purposes of yield estima-
combine the ansat, with the Hugoniot of the ambient me- tion. A preliminaisv account of this work has been given by
dium expressed as a relation between the shock speed D and Callen et tit. 11990b1.
the postshock particle speed ul to obtain a first-order
ordinary differential equation that describes the motion of 2 MODEL
the shock front. We show that solutions of this equation of
motion can be expressed in terms of simple analytical In this section we first present the fundamental assump-
functions when the D versus ut relation is piecewise linear. tions of the model and derive the resulting equation of
Since an arbitrary D versus u I relation can be represented to motion for the shock front. We then solve this equation of
any desired accuracy b, an appropriate piecewise-linear motion and discuss the scalings allowed by the shock front
relation, the raidiiis %er,-i, time predictions of the model (or radius versus time curve predicted by the model.
An arhiliarv hlugonol t ;in alwas be expressed is i sitiii iof
simple analytical functions Alternativelv. the equation of A ttnptu at
motion can he integrated numerically to find the model The model assumes that the shock wave is purely hydro-
predictions for an% prescribed Hugomot In practice, the dynamic, that is. that transport of energy via radiation islatter approach is often more convement. rhe model also negligible and that the stress produced by the shock wave is
gives the shock speed. posishock densits. postshock particle much larger than the critical stress at which the medium
speed, and post.hok pressure as functions of the shock becomes plastic. The model assumes further that the me-
front radius or the elapsed tine. the ,teld of the explosion. drum in which the shock wave is propagating is homoge-
ind the Hugomont of the imbient medium neous and that the shock wave is spherically symmetric at
23
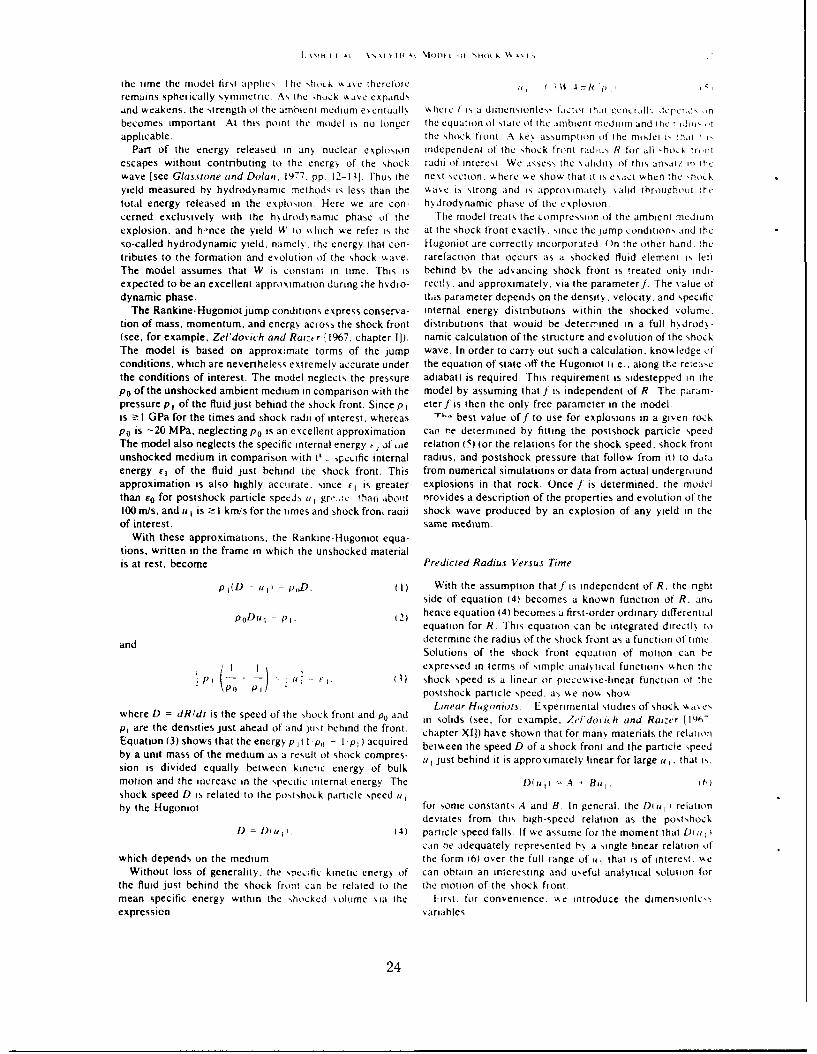
\.\*IH I I At \N•* At NT1( At MOM) I si t It •H iK Vý A\ I I
the time the model first applies I lie Nhhi.k w as e therefore R p 4, ', >remains spherically symmetric. Aý the ,hiuck wave expand,,and weakens, the strength of the arnhient medium esentualls w, herc I Is a dtmcnsionle,,s factor that cenicnilk. Jcpr,;, ,,nbecomes important. At this point the model is no longer the equation of state o (thc ambient medium and the i.••jtapplicable, the shock front A ke>, assumption of the model I, !hat r I,
Part of the energy released in aný nuclear explosion independent of the shock front radtis R for all ýhoIA tri,nescapes without contributing to the energy of the shock radii of interest We assess the validity of this ansat/ in thewave [see Glassione and Dolan,. 1977. pp. 12-13). thus the next section, \&here wke show that it is e\act when the -hoA.kyield measured by hydrodynamic methods is less than the wka,,e i,, strong and is approxinatelý sahd throughout !hetotal energy released in the explosion. Here we are con- hydrodynamic phase of the explosion.cerned exclusively with the h\drocdsnamic phase of the the model treats the compression of the ambient mediuniexplosion, and hnce the yield W to ss hich wAe refer i,, the at the shock front exactly. since the jump conditions and theso-called hydrodynamic yield, namely, the energy that con- Hugoniot are correctly incorporated ()n the other hand. thetributes to the formation and evolution of the shock wave. rarefaction that occurs as a shocked fluid element is leltThe model assumes that W is constant in time. This is behind bý the advancing shock front is treated onls mndi-expected to be an excellent approximation during the hydro- rectlx,. and approximately, via the parameterf. The value ofdynamic phase. t'is parameter depends on the density. velocity, and specific
The Rankine-Hugoniot jump conditions express conserva- internal energy distnbutions within the shocked volume.tion of mass, momentum, and energy across the shock front distributions that would be determined in a full h',drod -(see, for example, Zel'dovich and Rauie'r [1967, chapter I). namic calculation of the structure and evolution of the shockThe model is based on approximate lorms of the jump wave. In order to carry out such a calculation, know ledge otconditions, which are nevertheless extremely accurate under the equation of state off the Hugoniot t i e., along the releaethe conditions of interest. The model neglects the pressure adiabat) is required. [his requirement is sidestepped in thePo of the unshocked ambient medium in comparison with the model by assuming that f is independent of R The param-pressure p 1 of the fluid just behind the shock front. Since p I eterf is then the only free parameter in the model.is z I GPa for the times and shock radii of interest, whereas Tri,• best value off to use for explosions in a given rockPo is -20 MPa, neglecting Po is an excellent approximation can tne determined by fitting the postshock particle speedThe model also neglects the specific internal energy, of I*e relation IS) (or the relations for the shock speed, shock frontunshocked medium in comparison with t- s ,p,.cific internal radius, and postshock pressure that follow from it) to dataenergy 4F of the fluid just behind the shock front. This from numerical simulations or data from actual undergroundapproximation is also highly accurate, since El is greater explosions in that rock. Once f is determined, the modelthan r0 for postshock particle specds at grei.,c than abouit nrovides a description of the properties and evolution of the100 m/s, and u I is > I km/s for the times and shock fron, rauii shock wave produced by an explosion of any yield in theof interest, same medium.
With these approximations, the Rankine-Hugoniot equa-tions, written in the frame in which the unshocked materialis at rest, become Predicted Radius Versus Time
p I (D - u I = p,,D. 1) With the assumption that f is independent of R. the rightside of equation 141 becomes a known function of R. anc,
poDu = P 1. 12) hence equation (41 becomes a first-order ordinary differentialequation for R. This equation can be integrated directly to
and determine the radius of the shock front as a function of time.Solutions of the shock front equation of motion can he
SI expressed in terms of simple analtical functions when the2 p , -- . (31 shock speed is a linear or piecewise-linear function ol the
\P0 pt.I postshock particle speed, as we now show'.Linear Hugoniots. Experimental studies of shock w, a\ es
where D dR/dt is the speed of the shock front and p, and in solids (see, for example. Zl'dotiwh and Rai:er 1 19f.pt are the densities just ahead of and just behind the front. chapter Xl1) have shown that for maný matenals the relationEquation (3) shows that the energy pI I Ip - Ip; ) acquired between the speed D of a shock front and the particle ;peedby a unit mass of the medium as a result of shock compres- , 1 just behind it is approximately linear for large . that is.sion is divided equally between ktnetc energy of bulkmotion and the increase in the specific internal energy The DIu t) - A- Bt. I.shock speed DI)is related to the postshock particle speed uI
by the Hugoniot for some constants A and B In general. the Diui relationdeviates from this high-speed relation as the posishock
D = DIi 1. (4) particle speed falls. If we assume for the moment that Du IIcan he adequately represented bý a single linear relation of
which depends on the medium, the form (6) over the full range of it that is of interest, wAeWithout loss of generality, the ,pecific kinetic energy of can obtain an interesting and useful analytical solution for
the fluid just behind the shock front can he related to the the motion of the shock front.mean specific energy within the shocked %olume via the First. for convenience, we introduce the dimensionlcsexpression variables
24

~tiI ý''H F I A -NN %Ii u I t o I, urrm t lo(t' v
/' / 1 J - tre radius '[ter:il' rlrithe cU r e Ior eI'p0 irtflo i I IN I-lnowin. thenthe radius v ersus tif•e curve for a se• ond espl-Io I I can Je
wherc generated. pros.idcd that p,, A. It. t. and ti, .rc knmmon ho
both cxplo,ion,,s aid the initial radii rnd tinmes , . /,,, I i,,and I/, sa'tsl,
The characoteristic, length L and the characteristc tine I, 117)depend on the medium throu:h the constants p, . 4 B. andf and scale as the cube toot of the ,ield W, Making ire of ('rnder these conditions. the radius %ersus time curve AR itrelation isi and the haiat.ei;,tic length I. equation if) for explosion j Is given in termn, of the curve R,(ti forbecomes explosior, i by the similarity transtormaino,-
I) /? (it 4 1A II L R 'j 1 9,) R, i 1 1 V RI,., 1lSI
I'his equation shows that the length I. is the radius that The required scaling (17) is satisfied tris ,als it hoth cxplo-
separates the strong 5hock regime, where 1) R ' ', from sions are point explosions. [he similarity transformation (I1)the low-pressure plastc wave cgime. where 1) V const. In can be used to shed light on the physical origin of thenondimensional form. equation 19) is so-called "insensitive interval" and to develop optimal
weighting schemes for radius versus time data (F. K. I-amb1012) et al. (manuscript in preparation. 1991), for preliminary ac-
The general solution of equation i10) is counts, see Lamb et al. [19891 or Callen et al. I 19 9 0a1).A special case of (18) that we use in the next sections is the
7 . I h I -. h ý. - II) case of explosions in identical ambient media. According to(18), the radius versus time curve-, of two .uch exploions
wherer0 = I, T and t,' = R, L HereR 0 is the radius ofthe satisfyshock front at tl, the time at Ahich the evolution of theshock wae is first described b, the model. The function RUt) = I W,!V,l) R,i(1 V • ', ' . I 19)huto in equation I IIis given by provided that
hrx ) = - r I n 1 . . R o = W , , ti• 1 RWIW , i W 7 , . .2 0 )
In other words, the radius versus time curves scale %itth the2 I "cube root of the yield if the initial radii and times scale with
- tan '1 ( 2) the cube root of the yield. This result illustrates the more-6 general point that cube root scaling does not follow from the
For a point explosion. = 0 at 0 = 0. For such hydrodynamic equations and the jump conditions alone; inexplosions the function rt t,. r T) defined implicitlv by addition, the relevant properties of the hydrodynamic sourceequation ; 11) becomes, at small radii ( .x . must scale [Lamb et al.. 1991]. The required scaling of the
source is again -.atisfied trivially if both explosions are pointX( r I ý 15 2) r -5 (13) explosions. This is consistent with the known validity of
cube root scaling during the hydrodynamic phase for pointwhich is the well-known temporal behavior of a strongepoininufrmedaKngta..18;BW.Cln
self-similar shock w.ave produced by a point explosion explosions in uniform media lKing etal.. 1989. B. W. Callen
[Sedov. 19591. At large radii ( r >> Ii this function becomes et a)., manuscript in preparation, J991).So far, we have discussed the predictions of the model for
07 - const - 7, f 14) the postshock particle speed a I as a function of R (equationOf)). shock speed D as a function of R (equation 19)f. and
which describes a constant-speed plastic wave (this is some- shock front radius R as a function of time (equation (15t1.
times referred to as a bulk wave). Equation (U1) thus The model also predicts the evolution of other quantities ofprovides an interpolation between the strong shock wave interest, including the mass density, specific internal energy.and the low-pressure plastic wave regimes and pressure immediately behind the shock front. Expres-
Within the assumptions of the model an explosion is sions for these quantities can be obtained from the jumpcompletely defined by its yield W and the ambient medium, conditions (1), (2), and (3) by substituting expressions 5(s andwhich in turn is completely defined by the quantities p,, A. (9) for ui and D.B. and f The shock front radius versus time curve for an The predicted postshock mas! - ty isexplosion of any ,ield in an, medium can be generated from 1;2
the function o x , . - i h- b using the relation I 3 , - P 0.
RIt -i .L R,, L. tiT. Irl. i lS)where .r = RIL is the dimensionless shock front radius. For
For a point explosion. this simplifies to r -"< I., p, [BI(B - I )lpo, which is the limiting value forR At, tL TI) 16) a strong shock wave. For large radii, p, approaches Po. as it
must. The predicted postshock specific internal energy isThe radius ,er,,us time curve (Is) satisfies a scaling I
involving 'he sield Vý and the properties A. B. and P0 of the A- Iambient medium In parlicular. relation (15) implies that if 2B-
25

a.htle the predicted post,,hock pressure/,' i , ,.ondition that a ,hock .k .t c se , it nlo is not the same as the, conditoWI that the h,,hok prrduec ,- ridial stress greater than
[r i),,.4
-B-' the critic.l stress it ,•tr.k tie foAk beh,omeN-, plati I lihe
I o r smaill radii x4 I p I. A..i.heica, lot eittý its the hb drodnarr . ondltt ion. ,.hich IN -uL dtl\ stall-
re adi. - or ome time ater the hock , is no longer strong
.irhtiirrr llgii ,ot.s. Although 1or mans malter-Ils the -,ce se.tilon 4I1 •rL .iR s,,horA n tr ,, he constant \&hen the
Hlugoniot at high particle speeds , or. Cqtilvalenl,, at high s ho.k %aase is strong. a.c then ck'pl,.ic the ,alidit ,t relation
pressures) i,, well descrtbed bv a sinile linear relation of the wih f constant when the Iho.k is no longer strong. b%
form 6). the Hugoniot at lower particle speeds uualls comparing predictions of the model a.ith numerical simula-
desiates from the high-speed relation If the linear relation troll Of underground nuclear esploskons in quartz and ket
that is valid at high particle speed,, could he extrapolated to tut].
small itI the constant A would corre-,pond to the lov.-pressure plastic wave speed ( How cer, such an extrapo- -xpre'3ionjor ILoiton Uisually is rot (alid. In granite, for e\sample, A is about
Skmr,, whereas ( is about 4 ktn., In order to evaluate the acuracot of the ansatz that t is
Even i the Hugoniot is not linear oser the range of , tI of coistant. we make use of the assumption that the hydrody-
interest. it can still be represented to an, desired accuraci namic energy of the matter Interior to the shock froi:
by a sequence of piecewise-linear Segments. In this case. conserved, that is.
equation (10) still describes the motion of the shock front R,\A tthin each segment of the Hugoniot. but at each break in W 4 7r p or. I[l]. rir. t i siT. tI]r dr = const.DBlu). new Hugoniot parameters A and B must be intro- Loduced. While it is possible to write the radius versus time 1241curve for a piecewise-linear Hugoniot with an arbitrari,number of segments as a sum of standard functions, in To turn (24) into a relationship between ut and 9'. we first
practice it is more convenient to treat this case by integrating introduce me time-dependent dimensionless radius 6 =
the shock front equation of motion 19) numerically. rlRUt). Then, the distmbutions plr. t). ulr, t), and ttr. ti
In integrating equation (9), we handled the transitions inside the shocked volume may be rewritten, without loss of
between different linear segments of the Hugoniot as fol- generality, as
lows. The transitions occur at a sequence of fixed points iniI. which. for2: gi' en yield, are related to a sequence ofradii i051
by equation (5). Atier each time step. we computed the new rt. It = ei. tir it.value of the particle speed from equation (5) and compared itw.ith the particle speed ito at the junction of the it - I )st where i). lit, iri. and f I M are the mass density, particlesegment of the Hugoniot and the ith segment. When the speed, and specific internal energy just behind the shocknewly computed value of aI dropped below ai. in the next front (where k -- I). It will be convenient to express theintegration step, we replaced the constants A, I and B, I postshock mass density pt in terms of the preshock densitythat described the previous segment of the Hugoniot with the pit via the dimensionless factorconstants A, and B, that described the current segment. Thetransition points between the different linear segments of the K t P 26)Hugontot are not readily apparent in the resulting radius (251 and (261. equation (24t can be rewntten asversus time curve, because steps occur only in the second Usingderivative of the shock front radius with respect to timeý Wboth RI ) and its first derivative are continuous. 10 = t Ig)J . 1)it it oft. t l
The radius versus time curve predicted ho the model for 4 PitrR ps
an arbitrary H-ugoniot satisfies the cube root scaling relation(19). provided that the initial conditions satisfy equation (20t. "If -tei . t i Ld
3. COMPARISONS WITH AN AI"t TitAt. MODELS 2 Uti IK]
AND NUMERICAL SISIL.A AiONS =
In this section we assess the accuracy of the model. Wefirst derive a general expression for the dimensionless factor e(t, toI : if. (27J1 and show that the constancy of I is e\act for a pointexplosion in a homogeneous medium when the shock wake where i the final expression we have used 13). Compansonis strong. (A strong shock wae is one in which the speed of of 127) with the ansatz (5) gives a useful expression for thethe shock front is much larger than the speed oif sound in the dimensionless factor /. namelo,.undisturbed rock, the pressure behind the shock front is Ipredominantly thermal, and the ratio of the densit, mimedi- K I (KIt) gC. [tIff. t I k. I 1 df 128)ately behind the shock front to the density ahead of the front ,t'is close to its limiting value. Such shock 4a',es have specialproperties. In particular, the shock wake produced by a Equation 128) is merely a reexpression of (24) and thereforepoint explosion is self-similar while it remains strong [see is completely genetai. It showos that flot depends on theZel''dovwh and Raioer. 1967. chapters I and XIIJ. The density, velocity, and specific internal energy disinbutions
26

ý10 [.%\ iH I I . \ , A . [ ) I n , A ,t 1)l 1i ', 1 O at K A .\% I,
within the shocked \,olume at time i. Ae no. inme,,tIlate the ___
salue of] if ) and its .ariation s, ith time
Strong Shot k. InI'ri•i•
Consider for simplicity a point explosion during Ih inter-val when the shock wave is strong. As noted above, during 1 2
this interval the ratio of the density p, behind the shock frontto the density P, ahead of the shock front approaches alimiting value [see Ze/'dorith and Ratzer, 1967. p. 7081. to0
Thus K is independent of time and independent of W in this "interval. Moreoer, during the strong shock interval theshock wave produced by a point explosion is self-similar. 08Therefore the profiles g. w, and e are also independent oftime and independent of W. Thus f is independent of timeand independent of 4' -n the strong shock interval. 0.6-
For a medium that is adequately described by a Mie-Gruneisen equation of state with a constant Grunetsencoefficient, the value off in the strong shock intersal can he OA4-calculated by comparison vkith the ,olution tor a self-similarshock wave produced by a strong point explo,, in [Sedov.1946, 1959: Taylor, 1950al as follows. 021 1 1 1
The Mie-Gruneisen equation of state assumes, that the 0 1 2 3 4 5 6
total pressure p is the sum of twvo parts: a thermal pressure Grtineisen rPT. which depends on the temperature and density. and a Fig I Dimensionless energy partition factor] as a function ofcold pressure p, . which depends only on the density, that is, Gruneisen coefficient F for a strong point explosion in a medium
p = p 4 p, T- p i = p Fe T - pp, (29) obeying a Mic-Gruneisen equation of state.
where ET is the thermal component of the internal energy
and r is the Gruneisen coefficient (see, for example. Zel'dov- (5) with shock wave data from actual and simulated nuclearich and Raizer [1967. p. 6971). The thermal pressure Pr explosions.increases with the strength of the shock, whereas the cold Lamb [1987] showed that the radius versus time curvespressure p, is bounded, since p approaches a limiting value, predicted by (4) and (5) agree fairly well with radius versusThus, in the strong shock interval the cold pressure term in time data from a numerical simulation of a nuclear explosion(29) can be neglected [see Zel'dovich and Raizer, 1967, pp. in wet tuff by the P-15 CORRTEX Group at Los Alamos708-7091. If in addition the Gruneisen coefficient is constant, National Laboratory and with field data from the Piledriverthis equation of state has the form considered by Sedov and and Cannikin nuclear tests, which were conducted in granite
Taylor in their solutions, and basalt, respectively. A more detailed comparison of theThe dependence of] on r in the strong shock interval can radius versus time curves predicted by the model with data
be calculated from (28) using Sedov's solution for the from numerical simulations is presented at the end of thisfunctions K, g(f), w'(4), and e(f) (see, for example, Landau section. The predictions of the model are compared withand Lifshitz [1987. pp. 403-406] for explicit expressions for field data from underground nuclear tests in section 4.K, g. w, and e). The result is shown in Figure 1. When the A more direct test of the ansatz (5) can be made byshock wave is no longer strong, or when it never was strong, comparing the postshock particle speed that it predicts witha value off different from that given by Figure I may give a postshock particle speed data from nuclear tests and numer-more accurate description of the shock wave evolution. ical simulations. Perret and Bass [19751 have summarized a
Actual nuclear tests are not point explosions but are large collection of particle speed data obtained from under-generated by aspherical sources of finite size. In part to give ground nuclear explosions. Moss [19881 has shown thatthe shock wave time to become more spherically symmetric, these data agree fairly well with the scaling uI R- 3•2
radius versus time measurements are usually made at scaled predicted by relation (5), for particle speeds z I km/s. Theseradii - 1-5 m/kt (3 for tests with yields -150 kt (at larger data appear roughly consistent with this scaling even forradii, the hydrodynamic approximation is no longer valid), particle speeds as low as _10-4 km/s. Moss [19881 alsoAt these scaled radii, the strong shock expression for f compared the ansatz (5) with postshock particle speeds fromshown in Figure I is no longer accurate. As we now showf his numerical simulations of 125-kt nuclear explosions in- 0.53 appears to give a relatively accurate description of quartz and wet tuff. He found that for particle speedsthe evolution of shock waves in granite and wet tuff over the between I and 30 km/s, both the radius and the densityinterval in radius where measurements are usually made. dependence of his granite and wet tuff data are accurately
described by relation (5) withf = 0.53.
Assessment of Particle Speed Predictions To assess the ansatz (5) further, we compare it withpostshock particle speed data obtained from simulations of
The behavior of f when the shock wave is not strong can 100-kt nuclear explosions in quartz and wet tuff. Thesebe investigated by comparing the predictions of the ansatz simulations were performed by the Los Alamos CORRTEX
27

I0 "i ""/" IN S, \1 " "oot I/ .,I "t-NA
40 C/
S jo, SiO,
30 28 P, 15SGP3
*o 20
7
200 6-10X Q14I
0 2 .3,0 5 10 15 20 25 300 1 2 3 4 5Postshock particle speed u, (km/s) Postshock particle speed ul (kin/s)
Fig. 2. Hugoniot data for SiO, (dots) and two of the represen- Fig. 3. Expanded view of SiO, Hugoniot data at low pressurestations used in calculations described in the text. The solid line (dots) and three representations used in calculations described in theshows the piecewise-linear approximation to the full Hugoniot. text. The solid line shows the piecewise-linear approximation to :hewhile the dashed line shows a simple linear approximation to the full Hugoniot while the dashed line shows a simple linear approxi.high-pressure portion of the Hugoniot mation to the high-pressure portion of the Hugoniot. The latter is
clearly inaccurate at low particle speeds. The dash-do'ted segmentat low u I is similar to the approximate Hugoniot used by Kine er al
g gthe radiation hydrocode described by Cox et a. [1989] and replaces the corresponding section of the piecewise-group using linear Hugoniot when comparisons are made with the numenm:l[1966]. In order to compare relation (51 with the simulations, simulations of D. Eilers et al. (pn% ate communication. 1987). Alsowe have had to reconstruct the postshock particle speeds shown is the isobar at 15 GPa. the pressure we have adopted asusing appropriate Hugoniots and the radius versus time marking the end of the hydrodynamic phase.curves obtained from the simulations. The radius versustime curves were kindly provided to us by D. Eilers (privatecommunication, 1987). from -30 down to -0.6 knms. Figure 6 shows that relation
The reconstruction process can distort the particle speed (5) with f = 0.53 also provides an excellent description ofcurve if the Hugoniot used in the reconstruction differs from the postshock particle speed data from the simulated explo-the Hugoniot used in the simulation. Throughout this paper, sion in wet tuff, for particle speeds from -40 dow n to -Iwhen modeling shock waves in quartz ve use the Hugoniot kmjs.data compiled by King et al. [19891 frmrn several sources On the basis of these comparisons. we conclude thatWChiung and Simmons, 1969; Al't.shuler et al.. 1977; Wark- relation (5) withf = 0.53 provides a good descnption of theerie. 1962; McQueen el al., 1977; Ragan, 1984]. These data relation between the yield, the mass density of the ambientare shown in Figure 2. An expanded view of the low-uI medium, the radius of the shock front, and the postshocksection of the data is shown in Figure 3. When comparing particle speed during the hydrodynamic phase of the explo-with the quartz simulations of the Los Alamos CORRTEX sion. including times when the shock wave is no longergroup, we use a piecewise-linear representation of the data strong.compiled by King et al.. using their interpolation at lowpostshock particle speeds (indicated by the dash-dotted linein Figure 3). In modeling shock waves in wet tuff. we use the ssessment of Radius Versu.s Time Predictionspiecewise-linear Hugoniot given by King et al. [1989], which In order to assess further the accuracy of the model. w eis shown in Figure 4. The light solid curves in Figures 3 and compare the radius versus time curves that it predicts with4 show where the postshock pressure calculated from the the corresponding curves predicted by numerical simula-jump condition (2) is 15 GPa. For the reasons discussed in tions of underground nuclear explosions in quartz and wetsection 4. we adopt this pressure as marking the end of the tuff. We set f equal to 0.53 and use point source boundarshydrodynamic phase. We believe these Hugoniots are very conditions when solving equation (10i here and throughoutclose to the Hugoniots used in the numerical simulations, but this paper.we cannot rule out the possibility of some distortion. Quartz. We compared the present model with the simu-
Figure 5 shows that relation (5) withf = 0.53 provides an lation of a 100-kt nuclear explosion in quartz by the Losexcellent description of the postshock particle speed data Alamos CORRTEX Group. using both a linear description offrom the simulated explosion in quartz, for particle speeds the quartz Hugoniot and the more complete piecewise-linear
28

AItITA I SO, 1 1 I ~ 1 1 ,%
Wet Tuf SO,
to -
p. = i5(;Pa
V) 4 .4
2 0
000,! . 1" 3'1 7 191
Postshock particle speed u, (kmIs) Shock front radius R (m)
Fig. 4. Hugoniot data idoisi for wet tuff from Kinm, at a/ 11981 fig Peak particle speed u i versus shock front radius R for aand two representations used in calculations decribed in the text Il(l-kL explosion in SiO, idols). from a numerical simulation b, 1)The solid line shows our piecewise-hlnear approximation io the lull Eilers el al, priate communication. 1987). compared with the peakHugoniot. while the dashed line shows ihe simple linear approxima- particle speed predicted by the analytical model (solid line) Thetion to the high-pressure portion of the Hugoniot Also shown is the analý,tcal model describes the data quite well over two decades ofisobar at 15 GPa. the pressure we have adopted as marking the end particle speed, showing that the energy partition ansatz (equationof the hydrodynamic phase. Is) is relatliely accurate.
model was the same as that used in the simulation, namel%.description discussed above. These Hugoniozs are indicated 1950 kg/m'.by the dashed and dash-dotted lines, respectively, in Figures Figure 8 compares the radii predicted by the analytical2 and 3. The mass density used in the model was the same as model with the radii predicted by the simulation. When thethat used in the simulation, namely. 2650 kg/in . linear approximation to the Hugoniot is used, the absolute
Figure 7 compares the radii predicted by the model with value of 6 is always less than 9%. Again, as expected fromthe radii predicted by the simulation. The left-hand side of the behavior of the actual Hugoniot. the radii predicted byFigure 7 shows these radii as functions of time, whereas the the linear approximation are systematically too small at lateright-hand side displays the relative difference times. When the more accurate piecewise-linear Hugoniot is
IRsimWt - Rused, the relative difference is never more than 6% and is6 .= (3- tless than 2% after 0.6 Ins.
R-,ml t)0 Discussion. These comparisons of the radius versus timecurves predicted by the model with the radius versus timebetween these radii. The dashed curve is the value of 6 that curves predicted by numerical simulations confirm the ear-
results from using the linear description of the Hugoniot in lier assessment. which was based on comparison of peakthe analytical model, whereas the dash-dotted curve is the particle velocities, that the model with f set equal to 0.53result given by using the piecewise-linear Hugoniot. When provides an excellent description of spherically symmetricthe linear approximation to the Hugoniot is used. the abso- shock waves from underground nuclear explosions in granitelute value of 6 is less than 5% before 0.7 ms but rises to and wet tuff, during much of the hydrodynamic phase.-12% by -5 ms. As expected from the behavior of the Therefore we shall adopt this value forf when comparing theactual Hugoniot, the radii predicted by the linear approxi- model with field data from underground nuclear explosions.mation are systematically too large at late times. When themore accurate piece%& ise-linear Hugoniot is used. 6 is nevermore than 18%. 4. COMPARISONS WITH FIELD DATA
Wet tuff. We compared the present model with the In this section we use radius versus time data from foursimulation of a 100-kt nuclear explosion in saturated wet tuff underground nuclear tests conducted by the United States toby the Los Alamos CORRTEX Group, again using both a assess the usefulness of the analytical model. The four datalinear description of the wet tuff Hugoniot and the more sets we consider are from the nuclear tests code-namedcomplete piecewise-linear descnption of King et al. [19891. Piledriver, Cannikin, and Chiberta, and from a test that weThese Hugoniots are indicated respectively by the dashed call NTS-X. since its official name remains classified. Theand solid lines in Figure 4. The mass density used in the radius versus time data from the first three tests were
29

llcu,mkir .Id I 1)")I. the mneaisurement techniquie used 'obtain these data was~ not reported I o our knossledge: no~
Wet Tuff radius sers;us time meaisuremtents made using the mlaC2 1 rcenlls deseloped ( C IRR-IF N technique (tor-P.- x
~)19Kl are publiclN as atlahle
A n *ittempt to compare models or simulation,nl I pneri-
10 1 callS s5 mmetrtc explosiiins in unitfirm media with datai tromrundlerground nuclear tests must coinfront at the out~et heý,lact that the shock %kase prridik~ed h\ such a test e s~
triin an asphcrical soutce it finite tic into a medlium that tI at least siomewhat inhomrogeneous 1 see Lam,,i l9tS Lamb'
al . 1991). In comparing the predictions of' the model ,
section 2 with data friim nuclear Tests. wec adopt the parti,* I ular solution that corresponds to a point explosion I oi this
solution, cube root scaling is exact- We also assume cube
root scaling is valid when companng the results, of thenumerical simulations with data from nuclear tests, Suincethese simulations follow the shock vkave produced ts azn
7. initial source of finite size, cube root scaling is at best onisapproximately valid for these simulations.
In using cube root scaling, we are tacitly assuming that the
10i finite size of the source, the asphenicity of the explosion, and
Shoc frnt adis R(m)any inhomogeneities in the ambient medium base a neglici-Shoc frnt adiu R in)ble effect, both in the simulations and in the actual test. b%
Fig 6. Peak particle speed u, sersus shock front radius R for a the time the shock front has expanded to the radii at whbich10O-kt explosion in wet tuff (dotsi. from a numenical simulation by the comparison is made. Although shock %xa% es produced l-%D. Eilers et al. (private communication. 19877). compared with the underground explosions in uniform media do tend to becomepeak particle speed predicted bs the analytical model (solid line IAgain, the analytical model descnbes the .data quite well over tw more spherical with time, the properties of the source candecades of particle speed. showing that t he energy partition ansati sometimes have a significant effect during the hydrod% narriý(equation Off) is relatively accurate phase (Moran and Goldtiire, 1990: Rý A. Fiedler et sif
manuscript in preparation. 1991). Unfortunatels. wse areunable to assess directly the validity of our assumptions.
obtained using the SLIFER technique lileiiinkicld and because we lack deitailed knowledge of the sources, used inII iker. 19641. These data were kindly pros ided to its h) the numerical simulations, the conditions under vwhich theI1eidsiniltveld 11986: also private cimumrhnicaition. 19X71 [he nuclear tests were conducted, and the wav in which the heldradius versus time data from N-rs-x were taken from data were collected.
40 0.05
Sio 2 Sio2
~ 20 ."08005
20- 0.0t5
1) 2 3 4 5 u 2 1 4
Time (ins) Time (m%)
Fig 7 Comparison it shock front radius versus time curses predicted bs the analytical moidel kith radius %ersus,time data from the numerical simulation of a tflO-kt explosion in SiO, by D. Eilers ei al (prisate communi~jtion. l's-.(Lefti Predicted radii as functions ot time (Right) Relative ditfference between radii predicted from the SiiJ. stmuiationand from the analytical model The dots in the left panel show the results of the simulation, the dash-dotted lines showkthe results when the piecewise linear representation of the full H'ugoniot (see Figures ' and It is used in the analsti~almodel, the dashed line, show the result', when the simple linear approximation to the high-pressure piortion oit theHugoniot (again see Figures 'and 1i is used
30

L A21 f~'i iT ki 5 o I~ 1 1 loiNii ',0) I SiOt, cKý N~5\ I
Sit)-
VWet Tuff . m, et ruff .
004 4
/ 5002 .
00') .1
IiiI
-0 04
2 • 4 5 1 2 ) 4 S
Time Ims) Time (ms)
Fig X (ompirison of shorik front radius sersus time curves predicted b, the analytical model with radius versus
time data from the numerical simulation of a 100-kt explosion in .,et tuff by D. Eilers et al. (private communication.
1987, iLetti Predicted radii as functions of time (Right) Relative difference between radii predicted from the SiOnsimulation and from the analytical model The dots in the left panel show the results from the simulation, the solid linessho',. the results w.hen the piece%'ie linear representation of the full Hugoniot (see Figure 4) is used in the analyticalmodel, the dashed line', ho. the results ,hen the simple linear approximation to the high-pressure portion of theHu~oniot 'again see Figure 4) i1 used
We also lack detailed know, ledge of how the official yields by fitting it to radius versus time data from these tests,were determined for these four events. In using the official treating the yield as the only adjustable parameter.yields to assess hydrodynamic methods. we are implicitlyassuming that the. are accurate and independent of hydro-dynamic methods, Howvser. the procedure by w hich official Radiu.s Versus lmtc Curies
yields are determined is known to be complex and is not In comparing the radius versus time predictions with hieldpublicly available. It is possible in some cases that the data. we generally used either the subset of the availableofficial yield is actually less accurate than the hydrodynamic data that fell within the hydrodynamic interval definedyield estimate. Moreover, tne official yield determination below, or. where stated, certain larger data sets. However.procedure may make use of information derived from hydro- for NTS-X we followed the recommendation of tteusink, elddynamic methods, as well as radiochemical and other meth- [19791 and omitted the first nine data points from ourods If so, the official yield obviously is not independent of analysis. For Chiberta the first seven points were inconsis-the hydrodynamic ,.ield. Furthermore. in some cases the tent with each other and with the remaining points, andmaterial properties used to obtain hydrodynamic yield esti- hence these seven points were also omitted from our analy-mates may have been adjusted to give better agreement with sis. We now discuss the analysis of each event in turn.estimates obtained using other methods. The comparisons in Pilcdriver. The Piledriver event was an explosion con-this section show that despite the complexity of underground ducted in granite at the Nevada Test Site on June 2. 1966.nuclear explosions, both the analytical model and the nu- and had an announced yield of 62 kt [U.S. Department ofmerical simulations accurately describe the shock waves Energy, 19871. In modeling this explosion we considered theproduced by the nuclear tests considered here, when the simp!e linear ar i piecewise-linear approximations to theofficial yields are used. quartz Hugoniot shown by the dashed and solid lines in
A solution of the analytical model is determined by Figures 2 and 3, respectively. We assumed that the granitespecifying the Hugoniot. the value of the parameter f, and surrounding the nuclear device had a density equal to thethe yield. The Hugoniot can in principle be determined from standard density of quartz, namely. 2650 kg/mi. and that thelaboratory measurements made on samples taken from the yield of the explosion was 62 kt. We then integrated theemplacement and satellite holes. Unfortunately, if such differential equation (10) as described in section 2.measurements were made for the four events analyzed here. Figure 9 compares the predictions of the analytical modelthey are not publicly available. Therefore we used generic with the data from Piledriver. The left-hand side of Figure 9Hugoniot data characteristic of the ambient medium of each shows the radius as a function of time. whereas the right-explosion. For the reasons discussed in section 3. we used hand side displays the relative differencef = 0.53 throughout the present analysis.
We first assess the accuracy of the analytical model in RdaIA(tW - Rm,.de(t)predicting the radius of the shock front by comparing the Rtl-radius versus time curves it gives with radius versus timedata from the four nuclear tests cited above. We then between the measured and predicted radii to allow a moreinvestigate the usefulness of the model for yield estimation detailed assessment of the accuracy of the model. The
31

3-Pilednver ,. 0)5 Piledriver3• , Piledriver
S25 "'0"%
S20
-0!0S 15 -
Sto | :"'" -0 10 •
0 1 . 3 4 5 0 1 2 3 4 5
Time (ms) Time (ms)Fig. 9. Comparison of shock front radius versus time curves predicted by the analytical model .sth radius .ersu,
time data from Piledriver. a h2-kt explosion in granite. The arrow in each panel marks the radius at ,hi,:h the peakpressuredropsto 15GPa. which we have adopted as the end of the hydrodynamic phase iLefti Predicted and measuredradii as functions of time iRightl Relatise difference between measured and predicted radii. The dots in the left panelshow the field data. the solid lines show the results when the piecewise-linear representation of the full Hugnio, f seeFigures 2 and 3) is used in the analytical model, the dashed lines show the results when the simple linear approximationto the high-pressure portion of the Hugoniot (again see Figures 2 and 31 is used. When the piecewise-linear Hugoniotis used. the radii predicted by the analtical model differ from the measured radii by no more than 7% over the A holerange of the data.
dashed curve is the result given by the simple linear approx- therefore treated the data from Cannikin as though it hauimation to the Hugoniot. whereas the solid curve is the result been produced by a l-kt explosiongiven by the ,iecewise-linear description of the full Hugo- To construct a Hugoniot for Cannikin. we used the data onniot. Vacaville basalt obtained by JoneN et al 119681 and Ahr• i,
As expected, the radii given by the simple linear and the and Gregson )19641. These data and the piecewise-inear andpiecewise-linear Hugoniots are very similar at early times simple linear Hugoniots that we constructed from them arebut deviate significantly from one another at later times, shown in Figure 10. We assumed the rock surrounding theWhen the full Hugoniot is used. the relative difference 5 explosion had a density of 2860 kg/mi, equal to the den,-itsbetween the measured and predicted radii is never more than of the samples measured by Jones et al.7% and is less than 4% after 0.6 ms. When the simple linear Figure I I compares the radii predicted by the ,nalyltclHugoniot is used for all particle speeds, the absolute value of model with the radii measured dunng Cannikin. Again. the5 is less than 7% before 0.6 ms but rises to -11% after 1.2 left-hand side shows the radius as a function of time.ms. The radii predicted by the simple linear Hugoniot are whereas the right-hand side displays the relatixe differen,.xsystematicalt y too large after 0.6 ms because this approxi- between the predicted and measured radii. When the piece-mation gives shock speeds that are systematically too high wise-linear approximation to the full Hugoniot is used. thewhen the particle speed is low Isee Figure 3). For reference, magnitude of the relative difference between the radii -the peak pressure drops to 15 GPa at about 2.8 ms. As always less than 37. When the simple linear Hugoniot i-discussed below, we adopted this pressure as marking the used for all particle speeds, the magnitude of 6 is aiso le-,end of the hydrodynamic phase. than 3% for the entire data set. As in Pilednrer. the radii
Cannikin. The Cannikin event was an explosion con- predicted by the simple linear Hugoniot are systematicalisducted in basalt at Amchitka Island, Alaska, on November too large after 0.4 msbecause this approximation gives shock6, 1971. Theofficial yield of this event remains classified; the speeds that are systematically too high when the partictcU.S. Department of Energy [19871 has said only that it was speed is low. For reference, the peak pressure falls to 15(Ili-less than 5 Mt. The data from Cannikin that were given to us at about 0.7 scaled ms. Thus all the radius versus time d,tihad been scaled by dividing both the radius and the time from Cannikin lie within the hydrodynamic regionmeasurements by the cube root of the official yield in Chiberta. The Chiberta explosion w.as conducted in A etkilotons. If cube root scaling were exact, this would make tuff at the Nevada Test Site on December 20. 1975. Thethe radius versus time curve appear identical to the curve official yteld of this test remains classified. the ( I)Sp,irtthat would result from detonation of a 1-kt device in the ment of Energy 119871 has said only that it was heteen "'osame medium. As noted above, cube root scaling may not and 200 kt. Using seismic data. )aliliai, uid Isr•ic,,f"always be accurate for underground nuclear explosions. 11977. p. 3981 estimated that the yield of Chiberia v,,is :However, since the analytical model we are exploring ex- Like the data from Cannikin, the radius versus time dat.ihibits exact cube root scaling, comparisons of this model from Chiberta available to us were scaled by the cube toot ,Iwith scaled and unsealed data will give the same result. We the official yield. For the reason explained above in connoe.
32

%114 1 1i s1 xs II I' vi t , i % I, I III ,I'~,1. \% %%I N
- ~dashed and -N'lid line,,. rcsp~c.Aiv ,l iii [igiiic 4 %kc IN
i2 I sumcd that t he [OL 'vkurrou nding !he dc ice citiplficerneni
B5asat had a dcnsits oft l9`0i kg mli' t mol
1 ~ ~ ~ ~ ~ ~ ~ ~ i nAt h ~jni Cic~.A~n h da~istd curse Is theresult giv en hv (he sirrple linear lfuconiot. ýhercas thie solid
cuive is the result oiven hs the pic~cvv se-lifiear .ipproximai
tion to the full Ilugoniot \-s before. the radii gisen ls thetwo appronimations are Lery similar at earl% times. hut
z deviate signihicafiitl from one another at late times Whenthe piece" ise-linear Flugoniot is used, the magnitude of therelative difference Si hetsveen the measured and predicted
-)9 ~~radii is never more than 4' ý and is 1%ýlc between 0. 3s and0 ~1.6 ins. When the simple linear Hugoniot is used for all
= IS G~aparticle speeds. the absolute valtie of i6 is less than Y3; before4 : (1 6 Ins hot Increases after this time. ieaching 14% at( 1.6 ms,
near the end of the data set [ he radii predicted hy the simplelinear Hugoniot are sstemnaticalls too small alter 0) 4 ins
2ýbecause this aipproximatioin gives shock \peeds thatarsy stematically too low, for low particle speeds isee Figure 4)
___________________________________For this event. the peak pressure falls below I S (11"a at abviii0 2 4 6 8 0.5 scaled ins. Thus a large fraction of the radius measure-
Post shock particle speed u, (krnls) ments were made outside the hydrodynamic region.VT.S-XV. The event we call NTS-X was an explosion
Fig 10 Hugonmio data 'doisi for basalt from JIn-i ct al I 19fi8l conducted at the Nevada Test Site. Radius versus time dataand Aihrens and Gre-vim 11l1041 and two representatiiins used III
,acltodescribed inthe tetThe solid line shows the pee from thi xlso were reported by Ifi'osintivelJ 119-,91.wise-linear representation of the full Hugoniot. while the dashed line who stated that the offical yield was 54.2 kt. Heusinkveldshows the simple linear approximation to the high-pressure portion surmised that the ambient medium was saturated w-et tulf.of the Hugoniot Also shown is, the isobar at 15 GPa. the pressure we teabetmdu fms et odce tteNvdhave adopted as, marking ýhe end of the hs~drodsnamic phase teabetmdu fms et odce tteNvd
Test Site.In modeling N FS-X we asstumed that the explosion did
lion with Cannikin. wve treated the data from Chiberia as occur in wet tutlt. We followed the same procedure used inthough it had been produced by a I-k: explosion, modeling Chiberta. except that we assumed the yield was
In modeling Chiherta. we used the linear and piecewise- 54.2 kt. Figure I Icompares the predictions of the analyticallinear approximations to the wet tuff Hugoniot shown by the model with the data from NTS-X_ As before. the radii given
Cannikin Canrukcin
S4-
-000 -1
b- O Ot 0,20,3 0 4 0 5 0 6 0t 01 t1 0 03 04 0.5 061
Fig. It Iomparison of shock front radius versus time curves predicted b% the analytical model with radius %ersustime data from Cannikin. an explosion in basalt with a yield of several megatons The measurements have been scaledto %how an apparent yield of I kti see text)itleft), Predicted and measured radii as functions of time. iRighti Relativedifference between measured and predicted radii The dots in the left panel show the field data, the solid lines show theresults when the piecew Ise -linear representation of the full Hugoniot (see Figure ti0l is used in the .injlvtical model, thedashed lines show the results when the simple linear approximation to the high-pressure portion of the Hugoniot lagainsee Figure 1i)i is used The anal 'ytical model with the piecewise-linear Hugoniot predicts shock front raidii that are within31' of the measured radii over the full range of the data
33

[.i, 11 AL. AN•SI SiM AL MODEL ofl SH,)( K I',•'
T 1 1oo ."II
w0.1
ChibertaChiberta
7 - 0.10
-0.05 0,
3
2 -o.o502 0' 00.60 1.0 11.2 1.4 1,6 0.2 0.4 0.6 0.8 1.0 12 14 16
Time (ms) Time (ms)
Fig. 12. Comparison of shock front radius versus ume curves predicted by the analytical model with radius versustime data from Chiberta. an explosion in wet tuff with a yield in the range 20-200 kt. The measurements have beenscaled to show an apparent yield of I kt (see text). T•,e atrow in each panel marks the radius at which the peak pressuredrops to 15 GPa. which we have adopted as the end of the hydrodynamic phase. (Left) Predicted and measured radiias functions of time. (Right) Relative difference between measured and predicted radii. The dots in the left panel showthe field data; the solid lines show the results when the piecewise-linear representation of the full Hugomot (see Figure4) is used in the analytical model, the dashed lines show the results when the simple linear approximation to thehigh-pressure portion of the Hugomot (again see Figure 4) is used. The analytical model with the piecewise-linearHugoniot predicts sh(e-k front radii that are within 3• of the measured radii over the full range of the data.
by the simple ,'i-"., Hugoniot and by the piecewise-linear linear Hugoniot is used for all particle speeds. 6 is less thanapproximation,, the full Hugoniot are very similar at early 5% before 2 ms but increases after this time. reaching 17% attimes but deviate significantly from one another at later 6 ms, near the end of the data set. As in Chiberta. the radiitimes. The relative difference 6 is never more than 5% when predicted by the simple linear Hugoniot are systematicall%the piecewise-linear Hugoniot is used. When the simple too small after 0.1 ms because this approximation gives
30- NTS-X 0.15 NTS-X .
2k 25
0.102
S20 /
,.X 0.05-
I0 /0.00
1 2 3 4 5 6 1 2 3 4 5 6
Time (ms) Time (ms)
Fig. 13. Companson of shock front radius versus time curves predicted by the analytical model with radius ,ersustime data from NTS-X. assumed to be an explosion in wet tuff with a yield of 54.2 kt The measurements have beenscaled to show an apparent yield of I kt (see text). The arrow in each panel marks the radius at which the peak pressuredrops to 15 GPa. which we hase adopted as the end of the hydrodynamic phase (Left) Predicted and measured radiias functions of time, (Right) Relative difference between measured and predicted radii The dots in the left panel showthe field data; the solid lines show the results when the piecewise-linear representation of the full Hugoniot see Figure4) is used in the analytical model, the dashed lines show the results when the simple linear approximation to thehigh-pressure portion of the Hugoniot iagain see Figure 4) 1s used. The analytical model with the piecewise-linearHugonmot predicts shock front radii that are within 5"• of the measured radii over the full range of the data
34
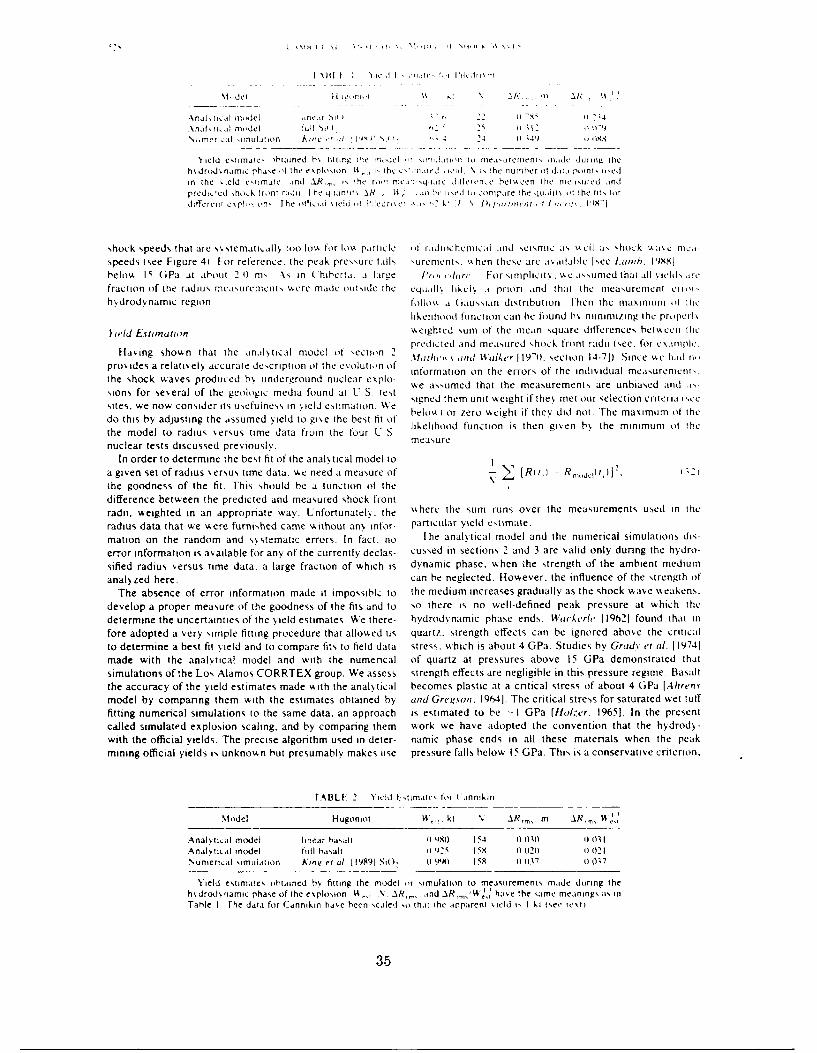
I1 \fit I I 'I Ci i I '' 1, 11 ,1 -I R ., i A
\,.mertial unulmiton Awe ic'i. 4~ I t4' Ii
'ield .!xnmtate, obtained bs tttinQ ilie iirl 'I ilri I, it) iea'irerlient' iii-Ic dmiing tile
hsdlrodsnaimi, pha,le of the explosiiin it _I he icd \u c i] !he rutITIl1Cr 0It C1,11 iintý iuedin the sieid estimate intl AR_ I, i!hie rooi quar2 iie itiewn, ie heien hI,:re nicisied andpredi,led ~hoik rwnt ridi I he quantitý AR__ i -l ',t l-ued to ,.intrare the quaiit ot the tits tlot
differeni cfl-ioin, Pihe otioi stelit "t P edriser * , , it s 1 ) pw / I m,'lrui 11 -fI I, ýi . 198-1
shock speeds that are ss stemnat ically too loy, for 1,,,A partiiclec ) Itaditc hcrnicai and seisnic as, sscil i, shiock ,As isc ricai
speeds (see Figure 4) For reference, the peak pressure tills sureenictt. Ashen these arc .isaiiahle Isee IiLamb. I19X8J
heloy, IS G (Pa at abolut 2 1) nis -\N in Chiherla. .a large I', duhrv For sitnplicitsý .t c aisiumed that all .kicls I!~c
fraction of the radius measuremtents we re made outside thec quills likely ti priori and that the Imeasuretmenit cimihvdirodivnarnic region 10llov a (jausNiati distribution. [hen the maximuni 4 :hc
likelihood function can be fiund ls nminimizing ihc propctIlv
)ield Estimation wf eighted sumn of the mecan square difference,, hestwe ciilic
Havig sostntha theana~ticl mdel f sctiln 2 predicied and measured shock front radii (Nee, for cstnipitc,Havig shwn hat he nal~icalmodl ofýecion 1 %itheti\ and11 "'alkr 119-0. section 14-71). Since "te hid it,,
provides a relatively accurate description ot the evoluttion of inomto-nteerr fteidvda esrmn-the shock waves produced b) underground nuclear explo- %keassumed that the measurements, are unbiased and Isions for several of the geologic media found at I) S test siened them unit weight if they met ouir selection criteria sleesites, we novi, consider its usefulness in tield estinmation. Wike bel")ozrowihiftyddnt.Temxuml*tedo this by adjusting the assumed yield to give the best fir of' likelihood function is then 'given bs the minimum of thethe model to radius sersus time data from the four U. Snuclear rests discussed previtously. measure
In order to determine the best fit of the analytical model toa given set of radius versus time data. we need a measure of R i [R,) - R _,,1 r,the goodness of the fit. This should he a function of thedifference between the predicted and measured shock frontradii, w4eighted in an appropriate way. Lnfortunatel%. the "here the sumn runs over the measurements used in the
radius data that ste w~ere furnished came without any infor. Particulaur Yield estimate.marion on the random and si~stematic errors. In fact. no The analytical model and the nuimerical simulations dis-error information is available for any of the currently dleclas- cussed in sections 2 and 3 are valid only dlurng the hydro-sified radius versus time data, a large fraction of which is dynamic phase, sshen the strength of the ambient mediumanalyzed here. can he neglected. However, the influence of the strength of
The absence of error information made it impossibk.ý to the medium increases gradually as the shock wive weakens,develop a proper measure of the goodness of the fits and to so there is no well-defined peak pressure at which thedetermine the uncertainties of the y ield estimates We there- hydrods namic phase ends. Wackerli' 119621 found that infore adopted a very simple fitting procedure that allowed tus quartz. strength effects can be ignored above the criticalto determine a best fir yield and to compare fits to field data stress, which is about 4 GPa. Studies by Grad% I'! a/. 119741made with the analytical model and with the numenical of quartz at pressures above 15 GPa demonstrated thatsimulations of the Los Alamos CORIRTEX group. We assess strength effects, are negligible in this pressure regime. Basaltthe accuracy of the yield estimates made stith the analytical becomes plastic at a critical stress of about 4 (iPa [A/teenvmodel by comparing them with the estimates obtained by and Greigsoit. 19641. The critical stress for saturated wet tufffitting numerical simulations to the same data, an approach is estimated to he -- I (iPa [Holze'r. 19651. In the presentcalled simulated explosion scaling, and by comparing them work we have adopted the convention that the hydrody -
with the official yields. The precise algorithm used in deter- namic phase ends in all these materials when the peakmining official yields is unknown but presumably makes use pressure falls below IS (iPa. This is a conservative criterion.
r-ABLE 2 'tield I- stmates fo~r I Innikin
Modet Hugornot W,,. t N A/?,, m A R,_, V
Anahtitel model linear basalt 01 9904 1 54 0 ) i10i ooll
Anils teal model full hasalt 0 91s IS5( 0 0)20 o 1(2lNumerical simuladtion Am5'! et at 119891 Sit), i ( Ig 1) i 01-1 1)01
Yteld estimates ohiained hs fitting the model or simulation to measurements mriiie during thehs~drodsnamac phase of the exptosion 15,,,, \ AR_,.. and AR,,'~ have the same mneanings ;is inTahte t The data for Cannikin have been scaled ýo that the apparent 'aIed is I ki isee test
35
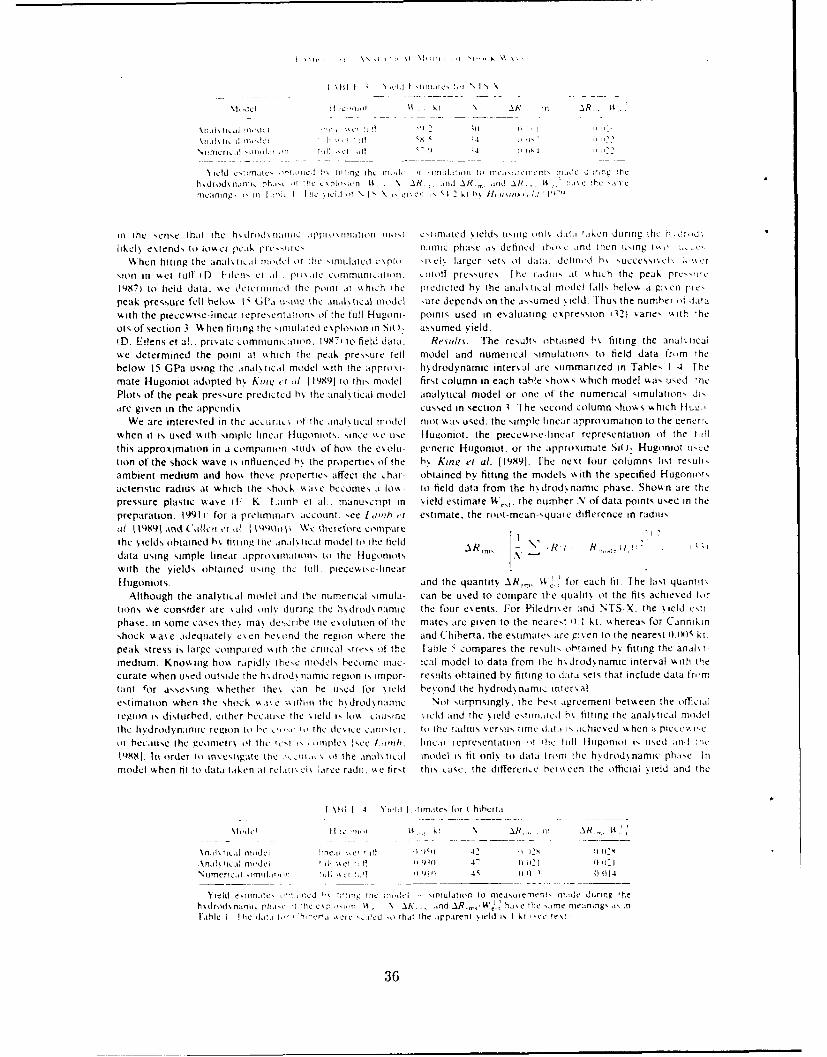
In~~~ ~~ ih es httel hadrnaida o,Ini ,Ilctprx illng tiaa m-x0 cxtimiii,itd ioln uxn otis r,lidca liken duIneth d
likely e'.tends it) lower peak pic-uiaacx na-mlc phase as dlefined thokca and then using lxx'
\&rhen tilting the anala-ic a. dc 1 idt [t ic 'inIuLaLOd Cx ph' xix e% larger setx, ot data defined hx sticccssi elý 'a'xxk.r
,,on in wct (till' 1) I ilens t pi rix ate coniMUni-mt on. itlltf pressures. I he r aditi it 55 hich the peak prcxxlI'c
1 987) to field data. wke x'tcetniincd (he point .it w hia.h the predicted hn the anal tical m-odel falls belowA a gi en rrexpeak pressure tell below\A I UI'a usiwng the afalaitical model sure depend-, on the assu med % eld T'hus the number oft data
with the piecewkise-linear teprexcntaitoflx of- the full Hugoni- points used in evaluating expression Ii2) 'arieN sAlt *.heo1% of'section 3. When fitting the simulated esplosion int Sio, assumed yield.ID. Eilens et al.. private comniuunýaaiton. 1987) to field data. Resaa/r.s. The results obtained f's fitting the analxicalwe determined the point at wkhich the peak pressure tell model and numerical simulations, to field data frim the
below I5 GPa using the anafsieal Model ýxsth the approm~- hydrodynamic intersal are summarized in Tablex 1--I Ihemate Hugoniot adopted b,, Kamneta' al. 119891 to this model first column in each table shosts which model wax uxed 'hePlot,, of the peak pressure predicted In the anal% tical model analytical model or one of the numerical simulations dix
are given in the appendix cussed in section 1. '1he second column shows I&hich Huo-.We are interested in the at.xurais if the manas ical model iolo Awas used: the simple linear approximation to the iCener!,
when it is, used with siniple linear Ilugoniots. sin:e %ke use Hiuatoniot. the piece% ise-linear representation of the tilllthis approximation in a companion xduid\ of' ho%\ the cx olti- generic Hugoniot. or the approximate SiO, Hugoniot axecd
(ion of (he shock wave is influenced In t he proper-ties of the In Kunt: et al. [19991. 1Vhe next four cnlumns list result,ambient medium and howk these properties affect the char- obtained In fitting the models with the specified Hugoniotxat.teristie radius at which the shock xsaae becomes a low%- to field data from the hsdrod',namtc phase. Shown are thepressure plastic wase if: K Lamb eli al.. manuscript in 'ajeld estimate VV_. the number A! of data points, uxed in thepreparation. 19911: for a preliminar\ account. xee Loan/ et estimate, the root-mean-square diflerence in radius(11 l14989 ansd ('ola ti -f Id lqII'I II We thertfssee compare
[he relds obtained In flitting the anus ticaf model to the field
with the yields obtained Uxingtma fuctill. piecewise linearj
Hlugoniots. and the quantity ARrI,, 4 1, for each tit The last quanntitAlthough the analytical miodel and the niumerical simula- can be used to compare tie qualits of the fits achieved tor
(ions we consider are salid onl\ during the ha~droda~namic the four events. For Piledrixer and NTS-X. the %reld esti-
phase, in some cases the% ma\ describe the esolution ot the mates are given to the nearext 11 1 kt. Ahereas for Cannikinshock wxaxe Jdequ~atelh cexer be'ondl the region wkhere the and Chiherta. the estimates are gisen to the nearest 0.111)5 ki,
peak stress is large compared wkith the critical stress of the Fable 5 compares the resultx obtained by fitting the anak xmedium. Knowking how% rapidls thexe models become inac- teal model to data from the hxdrod~namic interval with thecurate when used outside the h-.d crods namic region is, impor- results obtained by fitting to data sets that include data from,tant for assessing whether thes can be used for Nield be~ond the hydrods namic intersal.estimation when the shock wise %kithtin the hxdrodanilmic Not surprisingly, the best aigreement between the otfflcia!region is; disturbed, either bee,uiiie the 'aecld is lowA. cmjiisnjz x eld and the tield ext intate hs fitting the anal stical modelthe fis',drodvn,amic reuzion it, be i~'at, the afexix caitet , to he radiiix versus itte daloit, isfuxhesed wAhen a iee..xori bec~ause the veonietrýi 'f thme extI I is aritafe ýsee i ,mb. littemi tpresentattin 'at lie hill Ilmuguaniami ix Used AItt 'IC
198SJ1 Ii order to inxmzxttgate the ol~i ,a.a the ,inailiti:al model is fit only to data fromt the haýdrods namic phas~e Inmodel when fit to data taken at relatixelx arc-e radii, we first this case, the difference betwkeen the official ýield and the
11111 1I 4 '1 ei I inrimitex foi I habherti,
\n~lki-Iaa miode;- ''rca' ý,c oft II <o 42 1a )2s' i'
Numnerica.l rnaiul.oiwi' itkl -e ~ 1910 45 1111 111
Yield exi nit,ix ''-t.inedlh - rigtic ri, i mulatwan to measua emeinix md.:c durine the
h'.drodsnaanaaa. phi,axe t: esi '~ III_ \ AR__ aind AR,,, ,,e !iche -me eLminafg'- axin
table I thle dalaia !,'; a hi:"er' ... krc '_d.a d oa thai the appairent ýield a-s I to ,cce ics
36

\F N \IlI IM i I II ,i I, a
-I 5 F41 It i'ii 1,1_ (1' F 144 1.
T he ICiU sll ý ,rw, IT -ite hcr Iit, 'it the 2.. t Mode ldC To' dLt,1 t'SI 2.o 1W .ic i ,1- 1!.hlhF hte pii k pi..c.uic F'Ci~l,,cd is the lný11l1... iok'i
tlFF hels. 'le inilicatd ,lr t ,: -!iic \-o.'diriie IT h , 'l i T; ",'- 1''S L '.ý i ii', .0,w ihc lhsFrodsimi~iii pi.-c -ni~k .Ihcr Thc rs,ý-s.F in- ifall, 1eis (P,,' F he', he tilý 'i~h uli'lt I'ic--i C' "011 '!)1N' 1 OIC n1,1Ije .ý1!. trp 'Cond Ii.e h~ddr .n.'. irniýt. phaNc .. N .AR.,ind AR _ it 'I ' has e~ 'h e -"c11~iiier ,nc " 1 it'le F I 'c- eIld , I F'i I I cien cri 4 kIi- t1 lcij~w, \ ii.c d ,Fr ' 1, Fu Iii!(hitheria ha, c een -ded ,i 1r,0! i irhe cvi'! , id
1, 1 1 -e 1C'\(
,,eld obtained h,, Filling Ti 1r1.1M5 -T1. Modll' i '. F tor fs (t 11115r tit, on I ici other hanld.ý in.. Fudii g dila ,til i' pc;jk
Priedris er. X' ;tic ( annikin . and. - I lor (hibertai The pjNl~e c- ir t of -1 aind 4 t). j ITi..in'.t i lile :tjnlii.iicd %elil
Jflierence hci A cen the , eld quoted h\ IHiu siTki ,1d I 19-91! .'ik slghtlv, fron ()9( ;0i ito 1) 7Find Ii )'i ki I tic slIifi
for N 1 1) X and the r eld Oibtained hv fittingi the aii.dlsticaiF cric, hetssecn the laitter relcds and the sifiiciai icld otlI F N)
model is S' For conlparl,,in. the dillerncriN, hetween (he kt are V3; and ii 5"', rlepecticFSofficial or quoted * elds of Ih~ he% en ftN and the v ieldN I he large difference in the Nensiliv siT of the (liberia andohltainfed bs hittiniz the numerical ýinlmsatInsn, to data trolm the N I S-X I eld estimlateN, .1 inclui 'i of data fromn out sde t hehý drody namic phase are 2'; F' a nd 9', respclis~els hvdrods namie iniers al IN soml1esIhAt sUrprislnht. inivc bothThtjs the yeld esuimaleN ofitaincd l'.ý lilting the anailytcal esent-. NUppo"Cdlv toolk place tin vkctluTol and the dal,, Trontmoldel Aith picecN'w ic-linear ;ftepleentatisons of the 11uco2ni- hoth ces em. extend to :ippioxmniitels the same Nc!Icki ((1W
otN to data fromn the hisdrods nianlc phasceN are nearlýis s F t fi msr kt 'it fiovssc~c. is expIliined ahosc %. s do ni'!accurate as the sýic~d eNTjimtes ob-taiinesi bs tilting the numter- knoss either tile medium or the 'oelid of N FS-X lor cerTain.ical simulations to these Name d-ata. Furthermore. we have Ito knoss eidge oft anis Npecial . iidli-
-the agreement between the official rield and '.c rield tions that mas have affected the evsplo'oion or the shock %kaveestimated by fittIng the analytical model with simple Finear radius measurements. [here does, appear to he a NsstematicHugornots to data from the hsdrodv .namic phases IN not as difference between the hits oi ihe analytical model to these,:lose hut is, still remarkablis good. For the events in wet tuff. two, events at late times. Without more information. Ace arcthe estimated yields differ from the official or quoted ýieldls unable to determine whether this difference is due to someclby only 9%ý for N [S-X and 5'; for Chiherta. [his is not difference in the events themselves. to systematic error in
surprisIng. since the simple linear approximation to the one oi the set, oif radius measurements. to sy .stematic errorHugoniot is neariv identical to the full, piecewise-linear in the Hugoniot we h-ave used, or to inaccuracy of therepresentation of the Hugoniot for the particle speeds en- analytical model vshen it is used so tar outside the hvsdrod%countered during the hvdrodxnamic phase in this mediumn namic region.isee Figure 4i. For the same reason, the yiteld of the Cannikinevent obtained by .using the analistical model with the simple 5. SUM.RY -,SND ('iINCtLUSTONSlinear approximation to the basalt Hugoniot differs from theofficial yield his only 22%7 Although the relative difference We have explored an approximate analytical model of theA~ W'VW obtained using this approximation to the Hugoniot is, evolution, during the hsdcrods niamic phase, of the shocksmaller than the relative difference obtained using the piece- wAave produced hb' a sphericallis sy .mmetric explosion in atwise-linear represýentaition of the full Hugoniot - the quality of homogeneous medium. The equation of motion for the shockthe fit is somewhat poorer, as shown his the size of _%R_, front (reals the Compression of material at the front exacil\ .seeC fable 2), H-owever. for the Piledriv-er event the ditler- using the Rankine- H ugoniol jimp conditions, and the Hugo-
ence between the official yield and the yield obtained using mot of the ambient medium. ['he rarefaction behind thethe simple linear Htigoniot is --40"(, much greater than the shock front is treated onl\s approamiately throughi a parati-difference when the paecew ise -1inear HIgonioT is us~ed. ]-his eter f that describes the disti ibuaion of the fluid variables,is not surprtsrng. since the simple linear approximation to the within the shocked volume. A key assumption of the modelSrO, Hugoniot is inaccurate for the particle speeds encoun- is that Jf remains constant throughout the evolution of- thetered during most of the hydrody ,namic phase (see Figures 2 shock wave, The model predicts the evolution of the particleand 1) speed, shock speed, mass density, pressure. and specific
Consider now the effect on the yield estimates when idata internal energy immediately behind the shock front, as wellfronm outside the hydrody narniic phase ire included. A mean- as the shock front radius as a function of time. For a pointingful stuil of thts, effect is sinly possible for Chiberia and explosion the model exhibits Cube root scaling, in accor-N FS-X. since all or almnost ill ot the ivailable data from dlance with the conservation lawks for spherically symmetric(annikin and Pieleriver lie %rlhin the hy~drodynarmc region. point explosions, in uniform media Isee KinR et al., 1989, B,.\s shown in Table the estimated ,ieidi of NT S-X obtained W. Callen et al.. manuscript in preparation. 19911us~ing the ainalyticail model increaseCs from ý8 'i to 61s 4 and We have showkn that the paraireter /-. which relates the
51 kt when data out ito peak pressures of 7 '; and 4.6 (iPa specific ktnctic energy of the fluid just behind the shock frontare included The differences betAcen the latter 'odlds and to the mean spea-fic energy within the shocked volume. is
the quoted yield of 54 2 kt are 2V;4 and 1,2`. respectively. constant when the shock wkave is strong and self-similar. B\
37

comparing the relation inm olving I with results from numer- AlIm .,Ix (.Om C i't , " •g Ii It sI "IK I k) Il I ,I
ical simulations of underground nuclear explosions, in quartzand wet tuff, we have shown that it is also remarkabl nconstant even when the shock vwave is no longer strong. for model of sh the iprrosinle model pror-ed h\Ileitsinki(Id [l9"9. IY821 loth models, negleLt the -,pecificexplosions in these media. Furthermore. vwe find that thec
value off is relatively independent of the ambient medium internal energy and pressure of the amhient medium Bothand that f = 0.53 adequately reproduces the particle speed also predict radius versUs time curies tht exhihit theandtemporal behasior characteristic of a ,,trong. 'e-It-simlarcurve extracted from the numerical simulations. in aigree- shok aehat caratesthc knt a graul simila
ment with the previous results of Miv [19881.
The radius sersus ttme curves predicted h.i the model for period, and finalls chhibit the temporal behas or ot ,I l0w-
a point explosion are in excellent agreement with the shock pressure plastic ave Howeer. Heusnkveld-, model dii-fer,, from .he model of section 2 in several importaJnt
front radii measured during underground nuclear tests in
granite, wet tuff, and basalt, when the official yields are respects.
assumed andfis set equal to 0.53. If the model is used with First, Heusmkield assumed that the internal energx per
a piecewise-linear approximation to the Hugoniot. the larg- unit volume just behind the shock front. namele P
est differences between the predicted and measured radii is a constant fraction I, of the total energy per unit volume
range from 3% to 7% for the different events. Even when the within the shock front, that is.
model is used with a simple linear approximation to the e, = 11tW4R (.-AllHugoniot, the shock front radii that it predicts agree ex-tremely well with the measured radii for the events in wet In contrast, the model of section 2 assumes that the specifictuff (Chiberta and NTS-X), where the differences are less kinetic energy of the fluid just behind the shock front is athan 3% and 6%, respectively, during the hydrodynamic constant fraction I of the "otal specific energy within the
phase. For the events in basalt (Cannikin) and granite shock front (see equation O5wl. the specific internal energy
(Piledriver) the high-pressure approximation works less just behind the shock front is equal to the specific kineticwell, but the differences in the predicted and measured radii energy there (see equation (3)).are still less than 14% during the hydrodynamic phase. The Second. Heusinkveld's model satisfies only the momen-average differences are substantially less in all cases. tum jump condition (2). whereas the model of section 2
We have shown that the model can also be used to satisfies all three jump conditions (1), (2). and (31. In place ofestimate the yields of underground nuclear explosions, with the specific internal energy jump condition (3). Heusinkveldgood results. When the analytical model is used with point assumed that the pressure just behind the shock front is
source boundary conditions and a piecewise-linear represen- proportional to a constant coefficient r times the energy pertation of the Hugoniot. the yields obtained by fitting the unit volume there, that is.radius versus time data from the hydrodynamic phase of theexplosions are within 8% of the official yields. For compar- Pt = lIe. iA2
ison. the yields obtained by fitting numerical simulations As noted in section 3. this is the strong shock limit of thecarried out by the Los Alamos CORRTEX group to the same Mie-Gruneisen equation of state when the Gruneisen [ doesdata are within 9% of the official yields. Thus the yield not depend on the density. It may be an adequate descriptionestimates obtained using the analytical model are nearly as of the equation of state of the shocked medium, providedaccurate as the yield estimates obtained using the numerical that the Gruneisen F is independent of density and the shocksimulations. wave is strong. However. the shock waves produced b.,
More generally, the U.S. Department of State has claimed underground nuclear explosions are relatively weak duringthat hydrodynamic methods are accurate to within 15'r (at much of their hydrodynamic phase [see Lamb. 1988: L.amhthe 95% confidence level) of radiochemical yield estimates et al.. 19911.for tests with yields greater than 50 kt in the geologic media Heusinkveld also assumed a simple linear relation be-in which tests have been conducted at the Nevada Test Site tween D and a, of the form (6). However. the jump
(U.S. Department of State [1986a, b[; see also U.S. conditions I), (21). and (3). the equation ofstate(A2D. and theCongress, Office of Technology Assessment [19881 and D versus ul relation (6i are matually inconsistent. ForLamb [1988]). Thus the analytical model appears to be example, if one accepts the mass flux jump condition (1). thecompetitive with existing models for estimating the yields of momentum jump condition f2). and the ansatz tAl). oneunderground nuclear tests conducted in relatively uniform finds that the energ, jump condition (3) is inconsistent withmedia. a linear I) versus ul relation. Alternatively, if one accepts
In a future paper iF. K. lamb et al . manuscript in the D versus u relation (6). one is led to the Hugoniot [seepreparation, 1991), we will use the analytical model studied Zel'dovih and Raier. 1967. p. 7101here to investigate hydrodynamic yield estimation algo-rithms more fully, including optimal weighting of radius A 2( v" - V)versus time data (a preliminary account of this work has P/' 1' [B I B - ]- (A
beeii given by Lamb etal. a 19891 and Callen et al. II 990a [t.
In a subsequent paper (B. W. Callen et al.. manuscript in which is inconsistent with the jump conditions (1). 2). andpreparation, 1991). we will anall, 7e the validity of cube-root (3) and the equation of state (A2).scaling for spherically symmetric underground nuclear ex- Heusinkveld's model gives expressions for the -hockplosions, using similarity transformation methods and nu- speed. the radius versus time curse. and the postshockmerical simulations to explore the effects of source iaze and pressure, postshock particle speed, and postshock internalcomposition. energy that are qualitatively different from the expression,
38
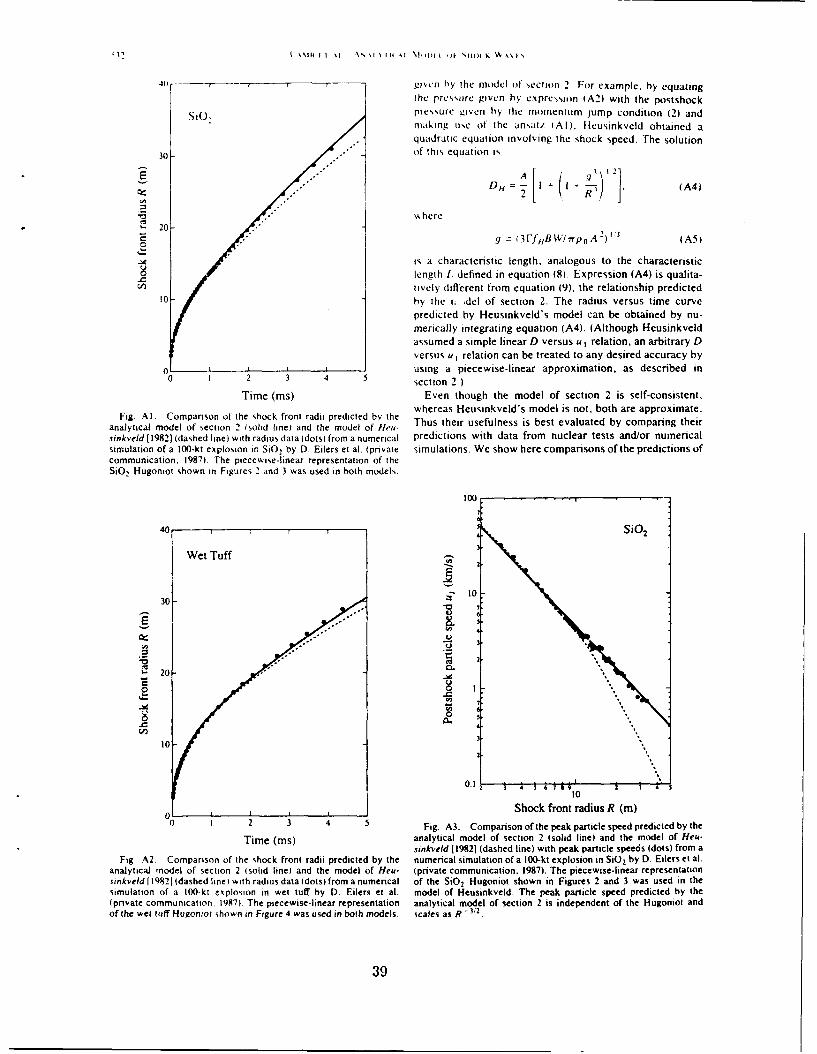
SIH ii -Si A'moil Ks Ain "\ f105 5
41 r - ------ g'ivn by the model of' section 2. For example, by equatingthe prs,,sure given hy expre,,sion (A2) with the postshock
l(.), pressure given by the momentum jump condition (2) andS .making ue of the ansart IAl). Heusinkveld obtained a
quadratic equation involving the shock speed. The solution
30 of this equation is
S.'" ~ D H = - - I +(A 4)
0 here20.
g (3FfjBW irWpoAI (A5)
is a characteristic length, analogous to the characteristiclength 1. defined in equation (8). Expression (A4) is qualita-tively different from equation (9). the relationship predicted
10 by the t. del of section 2. The radius versus time curve
predicted by Heusinkveld's model can be obtained by nu-merically integrating equation (A4). (Although Heusinkveldassumed a simple linear D versus u I relation, an arbitrary D
versus u I relation can be treated to any desired accuracy by0 using a piecewise-linear approximation, as described in0 t 2 3 4 section 2.)
Time (ms) Even though the model of section 2 is self-consistent,whereas Heusinkveld's model is not, both are approximate.
Fig. Al. Comparison of the shock front radii predicted by the Thus heusefulnes is b s elte by ar ingtei
analytical model of section 2 (solid line and the model of Heu- Thus their usefulness is best evaluated by comparing theirsinkveld (19821 (dashed line) with radius data (dots) from a numerical predictions with data from nuclear tests and/or numericalsimulation of a 100-kt explosion in SiO, by D. Eilers e al. (private simulations. We show here comparisons of the predictions ofcommunication, 1987) The pieceise-linear representation of theSiO2 Hugontot shown in Figures 2 and 3 was used in both models.
100 -
40 , I , SiO2
Wet Tuff
10730.
-~7
*.. 20 _
C4,20 s
El
to7%
0l
o _• I I Shock front radius R (m)0 1 2 3 4 5Fig. A3. Comparison of the peak particle speed predicted by the
Time (ms) analytical model of section 2 (solid line) and the model of Heu.sinkveld [19821 (dashed line) with peak particle speeds (dots) from a
Fig A2. Comparison of the shock front radii predicted by the numerical simulation of a 100-kt explosion in SiOz by D. Eflers et al.analytical model of section 2 (solid line) and the model of Heu- (private communication. 1987). The piecewise-linear representationsinki'eld [19821 (dashed line)with radius data (dots)from a numerical of the SiO 2 Hugoniot shown in Figures 2 and 3 was used in thesimulation of a 100-kt explosion in wet tuff by D. Eilers et al. model of Heusinkveld. The peak particle speed predicted by the(private communication. 1997) The piecewise-linear representation analytical model of section 2 is independent of the Hugoniot andof the wet tuff Hugoniot shown in Figure 4 was used in both models, scales as R - 12.
39

IA t k IH [ I \1u Ii XI \tODi I )I SIUJ K W 4% 1.
100 1n/1 1) 299. For comparison. Hi-usinkveld obtained IIII) 78 for explosions in alluvium and wet tuff and 1.0; for
' Wet Tuff explosions in granite h, fitting his model to the particle speedWe Tuff data of Perret and Ba i ( 197s 1 at relatiselý late time,,. had we
used these values in the comparisons, the discrepancies-• between Heusinkveld's model and the simulation,, would
have been much greater. Although the radius versus timeto curves are integrals of the shock speeds predicted hK the
models and hence tend to smooth out differences, the ,urc(U predicted by the analytical model of section 2 agrees better
with the simulations than does the curve predicted h%".Lj Heusinkveld's model.•-- Additional and more decisive comparisons can be made
Ct. between the postshock pressures and particle speeds gisen, the models. On substituting equation (A4) into the D
1ersus 1 relation t6). one finds that Heusinkvelds model0 predicts the postshock particle speed
'H= (II oAR) i ] . AKI
At small radii, (As) becomes00 4(3FfW/41rpoBR 'I R 9. (Ag91
Shock front radius R (m) Thus. u t has the same R dependence at small radii as thatFig. A4. Comparison of the peak particle speed predicted b% the
analytical model of section 2 (solid line) and the model of Hew given by the ansatz (5) of section 2. once rfq has been setsinkveld 119821 (dashed line) with peak particle speeds (dots) from a equal tofB. However, at large radii the pcstshock particlenumerical simulation of a 100-kt explosion in wet tuff by D. Eilers et speed predicted by Heusinkveld's model scales with radiusat. (private communication. 1987). The piecewise-linear representa- according totion of the wet tuff Hugoniot shown in Figure 4 was used in themodel of Heusinkveld. The peak particle speed predicted by theanalytical model of section 2 is independent of the Hugoniot
10t o
the two models with data from numencal simulations forthree reasons. First, the initial conditions of these simula- Si0 2tions approach that of point explosions, a simple case thatthe two models each describe. Second, we lack detailedknowledge of the conditions under which the nuclear test 1, tOo 0'data were obtained (see section 4). Third. the simulationshave reportedly been validated by extensive comparison --
with data from underground nuclear tests.In comparing the two models with the results of simula- l
tions, we wish to make a consistent choice of model param- . to2
eters. We do this by forcing agreement between the twomodels at the beginning of the explosion, as follows. At earlytimes, the radius versus time curve given by Heusinkveld'smodel displays the t2/5 dependence characteristic of astrong, self-similar shock wave, that is. CL
RH) = (75rIfHBW/16Arpi 6p , . (A6)
On comparing this curve with the early time curve given bythe model of section 2. namely.
R) (75fBW;16.7p,) A" . 4AT)
we see that if Ifl, is set equal tofB. the two models will give Shock front radius R (m)identical results at the beginning of the explosion. In the Fig. A5. Comparison of the peak pressure predicted b% thecomparisons that follow, we do this. analytical model of section 2 (solid minel and the model mf H,.!,-
Figures AI and A2 compare the radius versus time curves Ninkveld [19821 (dashed line) with peak pressures dot• Irom .predicted by the two models for explosions in quartz and wet numerical simulation of a 100-kt explosion in SiO 2 by D. Eiers e! al
Iipnvate communication. 1987). The numerical results are moretuff with the data from the simulated explosions in these consistent with the R- 3': variation at large R predicted bI themedia that were described in section 2. For the explosion in model of section 2 than with the R -anaiion predicted It, thequartz, we used rfH = 0. 325, w hereas for wet tuff we used model of Heusinkveld.
40

- ~ ~ ~ ~ ~ ~ ~ ~~~~"OL4 d.- Al '--~--- --- *----~i ~ cieici 11N di-nces predisýted h-slesikcd
Wet Tutff lhe dicti'~L~oNs ' thc somdl ilrsgltcnl slhhlicr ;icl -,ijii ptiin, of hle modlel discussed in sect:ion2
1 heoiti inslidAs tliciissed in seCt11on 4. the hi\drids nariiic1 ~pha-.e cmteis -it least out to the radius at wshich the~ IO[ post shock pres~we has l~illcrn to Ii 6P& Oh imoisi the
7 nin pesreo ) .1,1 can he neglected throughout the
1 115drod~ faminc phasec As noted in section 2. the amhicni'pecific internail energs can be neglected for partiLcl speeds,te11ler than k.1Im s. Fieures, A3 and A4 show that the
10 t4 r ostshkick particle Teced is actually I K-m,' or greaterthiouuhotit the h sdrodi namic phase Figures Al -A6 ~h,%
F that the difierences between the two models are tlread%signiticant at Ill it and increase dratmatically at larger rnidii.vi.hereas the piist~hock pressure Iiills to Is (il'i at 2S in it
quart, arnd 22 m in wet tuff. At 25 in in quartz, the peak
on the curve predicted by the runuerical simnulation and is 2stimes larger than the peak particle speed predicted bsHeustinkseld'smodel, which ts far below the curse predicted
I hy the simulation.i104 tO' These comparisons show that the model of section 2.
Shock front radius R (in) which fully incorporates the Rankine- Hugoniot jump condi-tions and doe', not assume any particular equation of state.
Fig. A6. Comparison ifi he peak pressure piedioied hithe also agrees better with the radius versus time curves and theanalvtical model of sctiiin 2 oilid lie) and the model it Heni- posishock particle speed and pressure data derived from theuititeld [19821 (dashed lie) with peak pressures idot-i trim a simulated explosions than does the model proposed bvnumerical simulation of a III-ki esplosion in ettuffb% 1) Eilers eral. iprivate communication. 1997i. Again, the numerical resuli, ire Heusinkield.more consistent with the R variation at large R predicted h% ihemodel of section 2 than tith t he R % ariation p'redicted hithe
model of Heusinkveld 4iA(ii, Ii'i/ien,'io we are especialls grateful to M. leu-stnkveld for discussions of %hock wave propagation in geologicmedia and for pro% iding SLI FER data from a variety of undergroundnuclear explosions We w&ish to thank W. Moss for detailed discus-
It ~ 4~i R R>'q ~ll ions of the analytical model investigated here and D. D Filers andii, R R the other members of the P-I5 CORRTEX group at Los Alamois
National Laboratoi% for kindly providing us %kith copies of theFigures A3 and A4 compare the postshock particle speeds SESAME equations of state for quariz and wet tuff and fur sharingpredicted by the two mtodels with those derived from the with us the results of their numerical simulations of nuclear explo-
simuale e~ plstos i qurtzandwettuf. Te R~i stony in quartz and wet tutT. It is a pleasure to thank 1 I Ahrens.simuate exlosons n qart an we tuf. Te R- '' DD. Eiers. R G. Geil. R. E. Hill. W, S. Leiih. and 6 S. Miller tor
dependence predicted h% the model of section 2 agrees much helpful discussions of shock wave propagation in geologic mediahetter with the particle speed data at late times than does the This research was supported in part by DARPA through the PhillipsR - 'dependence predicted b% Heusinkseld's model. In Laborator% tinder contract F- 19628-88-K-O)MOparticular. there is no evidence of the hreak in the slope ofthe ul versus R curve at R q that is predicted bi, REFERENCESHeusinkveld's model.
The postshock pressure predicted by Heusinkveld's Ahrens. T. J.. and %V 6 (regson. Jr., Shock compression iofcrustalmodel is given by (A I I and (A2) and is rocks- Data for quartz. calcite, and plagioclase rocks. J (;eoph i
Res.. W9 4919-4874. 19hi4.
p 3 rf",'W4 7,R~' (All) Al'ishuler. L. V.. N' N. Kalitkin. L. V. Kuz~mi'ia. and B. SChekan. Shock adiabats for ultrahigh pressures. .Soi. Pii.N. JETI'.
In contrast, the model of section 2 predicts that the post- Engl. Transl.. 45. 167-171, 1977.shok pessrefals of a R-' for R <c< L but is propor- Bass. R. C.. and G. E Larsen. Shock propagation in several
shoc prssue fals ff s Rgeologic materials of interest in hydrodynamic yield determina-tional to R for R ý-' L (see equation (23)1. Figures AS tions. Siaidiia Naiil La Tint I. Rep. SAND77-0402. March 1977and A6 show, that the pressure data derived from the Callen. B. W . F. K. Lamb, and J. D. Sullivan. Insensitive interval
- simulations show such a break at about the right radius, in the esolution of shock waves from explosions, in Shi,'demonstrating that the model of section 2 is in better Ciinpotiiiiiw if Condense'd .1 4,iiiep-1
9 8 9 . edited h% S Cwit th siulaios tan s - moel Schmidi. 1. N Johnson. and L.. W. Dav~ison. pp '41-244.
agreement wihtesmltosta sHeusinkvield's moe. Elsevier Science. New York. 1990a.Pt'rret and fluvt (19-51 show that pressure data from Callen. B. W.. F K. Lamb. and I D Sullivlan, Hydrodivnamic
*explosions in several geologic media are well fit by R - '11 determination of the yield of underground nuclear exploisions, inout to distances of (1 m W4' at w hich point a clear break Piii i'idintri ,I iOi 12thi .nnutil I)ARI'.461 C el.sit, Rcuiii Ii
occurs.~~~~~~~~~~~~ At ditneneodti rak h aaaebte ip ,..iiiiii. pp 241-250 Air Force Geophysics I Jboraitoiroccrs A ditace, h~dThis largeak th beh aio ismre inte Hanscom Air Force Base. Mass.. 1990h (Als(, R, p, /' JO' Ilet.described by Ti age R-eairi oein Dep oif Ph~s.. knis oif Ill . Urbana. Sepi 1990 1keeping with the anals tical model of section 2 than the R - (hung. D. H . aind Gi Simmons Pressure derivatives of :he claisii
41

properties of polycry stall inc quartz and iutifle. Laoth Planer 8it v uckolls. J H ,A computer calculation of Rainier 'the first l(~iLeti.. 6, 134-138. 1969 milliseconds). in Proceedings of Second Plowshare Sympos,um.
Cox. A. N_. R. R. Brownlee. and D) 1) Filers. Time-dependent May 13-15. 1959. San Francisco. California, part 1. Phenomenoi-method for computation of radiation diffusion and ldadn,- og, of Underground Nuclear Esplosion,,. Lac-ri',i r Ioirmortrics. Astrophys J.. 144, 1024-1037. 1966b Vi.a/ Lab Rep. L'CRL-5675. 1-20-134. 1959.
Dahlman. 0.. and H Israelson. .t1cniairoi I ridcri~'r,,nd \ uilear Perret. \V R , and R. C. B~ass. Freeietld ground motion induced b\Explos ions. Elsevier. New York. 1477 underground explosions, Sandia Nii,! Lab Tech, Rep SA4 N\D74-
Glasstone. S., and P J. Dolan. Effe it I/ \. lear Vtiaponi. Ird ed . 0252. Feb 1975.U.S. Government Printing Office. Washington. D. C . 1977, Ragan. C E.. Ill. Shock-xave experiments at threefold zompre'-
Grady. D E., W. J. Mumr. and G. R Fowlecs. Quartz to stishoxite N.ion. Ph %s Rev. A G;en Phi . 21. 1391-1402. 1984Wave propagation in the mixed phase region. J Giophi% Rei Sediiv. L L.. The motion of air in a strong explosion -in Russiizn 1,79. 312-338. 1974 1),,k/ .44ad. .auI. SSSR. 12. 1" -21). 194h
lleusinkveld. M , Analysis ol SLIF ER dlati froint underground Sedos . L I.,irnilarir'. and 1)iortiiwnal Alethodi in Al,, harni .nuclear explosions. Litwrence Lit ernor,' \arll Lab. Rep UCRL- Academic. San Diego. Calif . 195952648. 1979 Taylor. G. I.. The formation of a blast wave by a verN intense
Heusinkveld. M.. Analysis of shock waxe arrival times from under- explosion. 1. Theoretical discussion. Pro(,- R, Soc Londion. Sc'rground explosions. J. Geophvs. Rei . X7. 11)91-1898. 19X2. A. 201. 159-174, 1950a.
H-eusinkveld, .. Shock amval times in granite. Alem 0004A. Taylor. G. I.. The formation of a blast wave by a very intenseLawrence Livermore Nail. Lab . Earth Sc, Dep , Oct 30. explosion. It. The atomic explosion of 1945. Priic R So,)Livermore. Calif.. 1986. Lo~ndon, Ser. A. 20/. 175-180. 1950h
Heusinkveld. M.. and F. Holzer. Method of coiitinuous shock front U.S. Arms Control and Disarmament Agency. Arms Con"'oi .. ndposition measurement. Rev. Sci lnmtrumn .35. 1105-1107, 1964. Disarmament Agreements, Washington. D. C., 1990a.
Holzer. F.. Measurements and calculations of peak shock wave U.S. Arns Control and Disarmament Agency. Treaty Between theparameters from underground nuclear detonations. J. Geophvs. United States of America and the Union (if Soviet SocialistRes.. 70, 893-905. 1965. Republics on the Limitation of Underground Nuclear Wrapcini
Johnson. G. W., G. H. Higgins. and C F. Violet. Underground Tests and Trerat) Between the United Statres of Amerirauand :ht-nuclear detonations. J. Geophvs. Re% . 64. 1457-1470. 19S9. Union of Soviet Socialist Republics on Underground Nu, lear
Jones. A. H., W. M. Isbell. F. H. Shipman. R. D. Perkins. S. J. Explosions for Peaceful Purposes Textof Treaties and Preiooi.s.Green. and C. J. Maiden. Matenial properties measurements for Washington. D. C.. 1990b.selected materials. interim report, contract NAS2-3427. Gen. U.S. Congress, Office of Technology Assessment. Seismic Verifi-Motors Tech. Cent., Warren. Mich.. April 1968. cation of Nuclear Testing Treaties, OTA-ISC-361, U.S. Govern-
King. D. S., B. E. Freeman. D. D. Eilers, and J. D. Johnson. The ment Printing Office. Washington, D. C.. May 1988.effectiv'e yield of a nuclear explosion in a small cavity in geologic U.S. Department of Energy. Announced United States Nuclearmaterial, J. Geophys. Res.. 94, 12.375-12,385. 1989. Tests. July 1945 through December 1986. NVO-209 (Rev71
Lamb, F. K.. An approximate solution for ground shock propaga- Nevada Operations Office. Las Vegas. Jan. 1987.tion, Rep. WP-2-87-2. Univ. of Ill.. Program in Arms Control. U.S. Department of State, Bureau of Public Affairs. U.S. policy,Disarmament, and Int. Secur.. Urbana. Feb. 1987. regarding limitations on nuclear testing. Spec Rep 150. Wash.
Lamb, F. K.. Monitoring yields of underground nuclear tests using ingion. D. C.. Aug. 1986ahydrodynamic methods, in Nuclear Arnis Technologies in the U.S. Department of State. Bureau of Public Affairs. Verifying1990s. edited by D. Schroeer and D. Hafemneister, pp. 109-148. nuclear testing limitations: possible U.S.-Soviet cooperation.American Institute of Physics. New York. 1988. Spec. Rep. 152. Washington. D. C.. Aug. 1986b.
Lamb. F. K.. B. W. Callen, and J. D. Sullivan. Insensitive interval U.S. Department of State. Agreement Between the United States ofin the evolution of shock waves from underground nuclear explo- America and the Union of Soviet Socialist Republics on thesions, in Proceedings of the I11th Annual DARPAIA FGL Seismic Conduct of a Joint Verificatian Experiment, Washington. D C.Research Symposium. Air Force Geophysics Laboratory. May 1988.Hanscom Air Force Base. Mass.. 1989. (Also Rep. P18915177, Virchow. C. F.. G. E. Conrad. D. M Holt, and E. K. Hodson.Dep. of Phys.. Univ. of Ill.. Urbana, May 1989.) Microprocessor-controlled time domain reflectometer for dy-
Lansb, F. K.. B. W. Callen. and 1. D. Sullivan. Yield estimation namic shock position measurements. Rev. Sci. Instrum.. 51.using shock wave methods, in Explosion Source Phenomenology, 642-646. 1980.Geophys. Monogir. Ser.. vol. 65. edited by S. R. Taylor, P. G. Wackerle, J., Shock-wave compression of quartz. J. Appi Ph, %Richards. and H. 1. Patton. pp. 73-89. AGU. Washington. D. C.. 33. 922-937, 1962.1991. Zei'dovich, Ya. B.. and Yu. P Raizer. Phvsic., oifShock Wakes and
L~andau, L. D.. and E. MI. Lifshitz. Fluid Mechanics. 2nd ed.. High- Temperature 11idrodinarnic Phenomena, Academic. SanPergamon. New York, 1987. Diego. Calif., 1967
Mathews. J., and R. L. Walker. Mfathematical Methods of Phvsics. ______
2nd ed., W. A. Benjamin. New York. 1970. B. W. Callen. Department of Ph.%sics Drury College. Springfield.McQueen. R., J. N. Fritz. and J. W. Hopson. High-pressure MO 65802.
equation of state of Si0 2. M-6 Prog. Rep. MI-6-200, pp. 78-136, F. K. Lamb and J. D. Sullivan. Department of Physics. Univer-Los Alamos Nati. Lab., Los Alamos, N M . Jan.-March 1977. sity of Illinois, Urbana-Champaign, Loomis Laboratory of Phvsics.
Moran, B.. and H. C. Goldwire. Jr. Effect of source modelling on I 110 W. Green Street. U~rbana. II. 61801the inferred yield from an underground ntuclear explosion, inShock Compresstion of Condensed Matter-) 989. edited by S. C.Schmidt. 1. N. Johnson. and L. W Davison. pp. 645-648,North-Holland. New York, 1990. tReceived JanuarN ', 1991,
Moss. W. C.. A method to estimate ihe yield of an underground revised Juily 301. 1991.ýnuclear explosion. J. App! Phvr.. 63, 4771-4773, 1988. accepted September 10. 1991
42
SlIi()X'K (C(MPR! SS1[()N (WF ('0)NI)l NSII1) MA 'I'IER I')XI)S" C 'IIMIl)1. J.N Jol)IINS()N. 1. W, DAVI SO)N (editins)
,. I ,,w Sclcfi1c ,11P,11h srn Ii V I, '99 241
The U.S. Government Is authorized to reproduce and sell this report.Permission for further reproduction by others must be obtained fromthe copyright owner.
INSENSITIVE INTERVAL IN TIlE EVOLUTION OF SHOCK WAVES FROM EXPLOSIONS*
B. W. CALLEN, F. K. LAMB, and J. D. SULLIVAN
Department of Physics, University of Illinois at Urbana-Champaign, 1110 West Green Street, Urbana,IL 61801, U.S.A.
There is empirical evidence that the radius of the expanding shock front produced by an explosionin silicate rocks is relatively insensitive to the particular rock but fairly sensitive to the yield duringpart of the hydrodynamic phase. By using an approximate but relatively accurate analytical model forshock wave propagation, we show that the existence of this insensitive intesrval is likely a coSnisquenceof correlations between certain properties of silicate rocks.
1. INTRODUCTION Despite widespread use of algorithms that useThe initial speed of the shock wave generated by data in the insensitive interval, the physical rea-an underground explosion increases with the yield son for the existence of such an interval and theof the explosion, other things being equal. As a extent to which it would persist for shock wavesresult, the radius of the shock front at a given time in a more diverse collection of geologic media hasis greater for explosions of greater yield. Hence, been unclear. We show that the existence of anmeasurements of the radius of the shock front us- insensitive interval is most likely a consequenceing CORRTEX' or other techniques can be used of correlations between certain properties of theto estimate the yield, provided the dependence of rocks in question. To demonstrate this we usethe radius vs. time curve on the properties of the an approximate, analytical model for the propa-ambient geologic medium is understood. In prac- gation of the shock wave.tice, the yield of an explosion is estimated usingan algorithm, by which we mean a particular pro- 2. ANALYTICAL MODELcedure for comparing radius vs. time data with a We consider here a simple model of the sphericalmodel of the motion of the shock front. If there shock wave produced by release of a very largeexists an interval in time during which the radii amount of energy in an infinitesimal volume (aof shock waves in all media of interest are similar point explosion) in homogeneous rock. For manyfor explosions of a given yield, it is advantageous materials, the relation between the speed D of ato use the data in such an insensitive interval. shock front and the particle speed u just behind
In fact, there is empirical evidence that the ra- it is approximately linear for large u, that isdius of the shock front is relatively insensitive to dRithe ambient medium toward the end of the hydro- i- = Ai + B1iu, (1)dynamic phase of shock wave evolution, for the dtrocks within U.S. nuclear test experience, which where Ai and Bi are constants.2 Hlere the sub-are mostly silicates. This is illustrated in Figure 1, script i denotes the material. We shall assumewhich shows typical radius vs. time curves for ex- that D(u) can be adequately represented by a sin-plosions of the same yield in two such rocks. The gle linear relation of the form (1) over the rangecurves approach each other gradually, cross, and of u that is of interest.then separate gradually. Because the curves in- We shall also assume that the particle speedtersect at a small angle, the insensitive interval is just behind the shock front is related to the yieldnot sharply defined. Wi of the explosion by the expression 3 ,4
"Supported in part by DARPA through AFGL un-der Contract F-19628-88-K-0040. -Lpo R,(t) u2 (t) = fiW (2)
43

242 B.W. Callen et al.
25 1 i I The solution of equation (5) is3
r(x) = xz+ Inxx- + _I
S0 + tan- (2V- .(6)
"At small radii (x < 1), this solution reduces to
x•(r) ;z:(5/2)2s (7)S15 which is the behavior of a strong, self-similar
shock wave.s At large radii (z > 1), the solutionbecomes
x(r) : const. + r, (8)
10 which describes a constant-speed plastic wave.
0.5 1.0 1.5 2.0 2.5 Equation (6) agrees quite well with field data and
Time (ms) numerical simulations.3 ',' 6'7
Within the assumptions of the present model,HGURE 1 any explosion is completely defined by its yield W,
Radius vs. time curves for simulated explosions of the and the four parameters characterizing the am-same yield in two different silicate rocks. bient medium: poj, A,, B,, and fi. The radius
vs. time curve for any explosion can be generatedwhere tp(t) is the radius of the shock front at from the function (6) by applying the similaritytime t, poi is the mass density of the rock in its transformationunshocked state, and fI is a dimensionless factorthat describes how the energy of the explosion is R.(t) = L, -(t/T). (9)partitioned between kinetic energy of bulk motionand internal energy, and depends upon the varia- Equation (9) also implies that if the radius
tion with position of the velocity, density, and in- vs. time curve for explosion i is known, then the
ternal energy of the shocked material. In general, radius vs. time curve for any other explosion j can
fi is a constant when the shock wave is strong, but be generated, provided that p, A, B, f, and W are
changes somewhat as the shock wave weakens.3 ,4 known for both explosions. The radius vs. time
In this analysis, we shall assume that fi can be curve Ri(t) for any explosion j is given in terms
treated as constant for the times of interest, of the radius vs. time curve R,(t) for explosion i
Given these assumptions, equation (1) with u by the similarity transformation
given by equation (2) can be integrated analyti-cally. First we rewrite equation (1) in terms of the R,(t) = (L/L,)R.(Tt/T). (10)dimensionless variables3 The approach outlined below depends only on
X = RI/Li and T = tlTi, (3) the existence of a similarity transformation of theform (10), and not on the particular values of the
where characteristic scales L and T, or the particular
131iWiB? 113 Li form of the function x(r).Li and 7=- (4)
= 4poiA ) A-"3. INSENSITIVE INTERVALIn terms of the non-dimensional variables (3), To formulate a more precise definition of the in-equation (1) becomes sensitive interval, consider the shock waves pro-
dx 1 duced by an explosion of the same yield in two dif-
dr =1+x312 (5) ferent media i and j. The difference between the
44
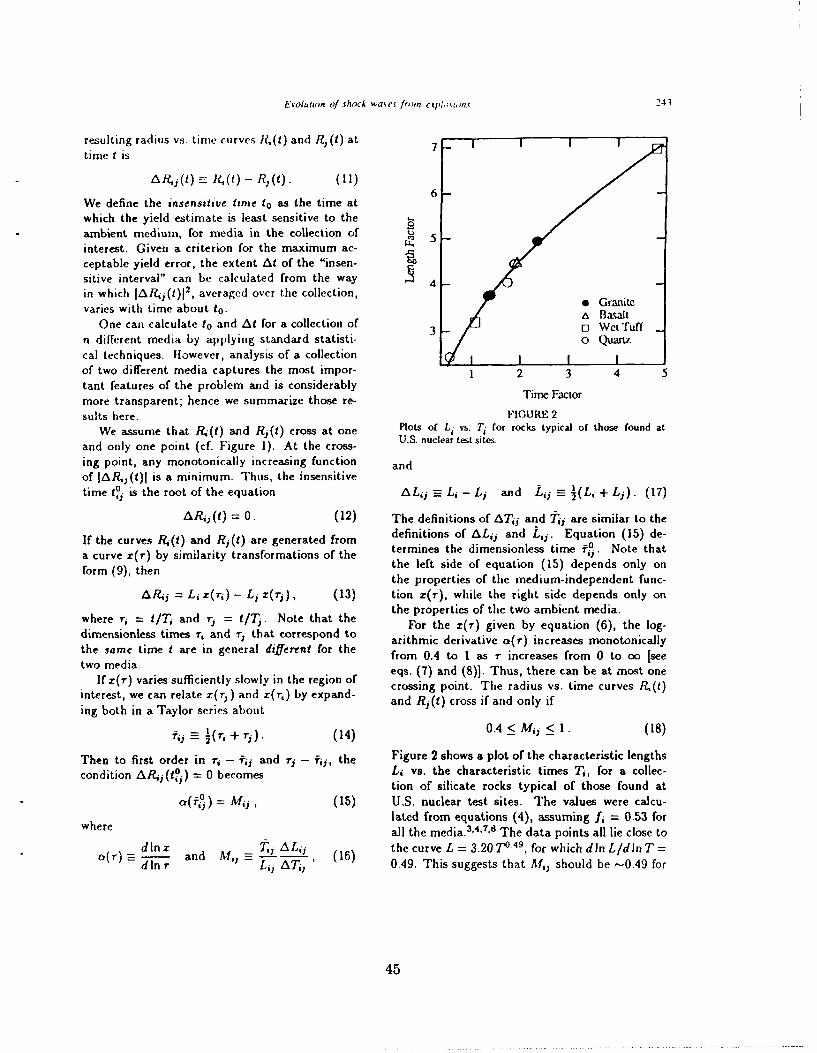
Evolution of shock wale from ctpl,'! ons 241
resulting radius vs. time curves 14(t) and Rj(t) at 7 itime t is
AR (t) = 1?4(t) - R,(t). (11)6
We define the insensitive time to as the time atwhich the yield estimate is least sensitive to theambient medium, for media in the collection of Uinterest. Given a criterion for the maximum ac-ceptable yield error, the extent At of the "insen-sitive interval" can be calculated from the way 4in which 1A/4 1(t) j2, averaged over the collection,varies with time about to. e Granite
A BasaltOne can calculate t o and At for a collection of 3o Wet Tuff
n different media by applying standard statisti- o Quartzcal techniques. However, analysis of a collection Iof two different media captures the most impor- 1 2 3 4 5tant features of the problem and is considerablymore transparent; hence we summarize those re- Time Factor
sults here. FIGURE 2We assume that F4.(t) and Ri(t) cross at one Plots of Li vs. Ti for rocks typical of those found at
and only one point (cf. Figure 1). At the cross- U.S. nuclear testsites.
ing point, any monotonically increasing function andof IAR•i(t)I is a minimum. Thus, the insensitivetime to is the root of the equation ALi =-Li - Li and Lii -(L.+Li). (17)
ARkj(1) = 0. (12) The definitions of AT., and T',i are similar to the
If the curves R,(t) and Rj(t) are generated from definitions of ALj and Lij. Equation (15) de-
a curve r(r) by similarity transformations of the termines the dimensionless time r1g. Note thatform (9), then the left side of equation (15) depends only on
the properties of the medium-independent func-A/•j = L, -(r,) - Lj z(rj), (13) tion z(r), while the right side depends only on
where ri = tiTj and r2 = t/7;- Note that the the properties of the two ambient media.For the x(T) given by equation (6), the log-dimensionless times r, and 1rj that correspond to aihi eiaieor nrae oooial
the same time t are in general different for the from 0.4 vtov1 as r increases fom0tonisaltwo mdia.from 0.4 to I as r increases from 0 to oo [see
two media.eqs. (7) and (8)]. Thus, there can be at most one
If n (r) varies sufficiently slowly in the region of crossing point. The radius vs. time curves 1,(t)interest, we can relate z(r)) and z(r,) by expand- and Rj(t) cross if and only ifing both in a Taylor series about
(14)0.4 < Mij . (18)
Then to first order in r, - f,, and ri - fi,, the Figure 2 shows a plot of the characteristic lengths
condition ARi.(t0-) = 0 becomes Li vs. the characteristic times Ti, for a collec-' " tion of silicate rocks typical of those found ata(i) = M~,, (15) U.S. nuclear test sites. The values were calcu-
lated from equations (4), assuming 1. = 0.53 forwhere all the media.3,4',7 8 The data points all lie close to
o lnz and AL, ( the curve L = 3.20 TO49, for which din L/dIn T =a(r) andr M L, ATij 0.49. This suggests that Mfi should be -.049 for
45

244 8. W. Callen et al.
all pairs of media in this sample. In fact, the wave is not self-similar during the insensitive in-mean value of M,j for the media in Figure 2 is terval, for current test geometries and the yields0.53; most of the Mii cluster near this value and permitted by the Threshold Test Ban Treaty.all lie in the range 0.3-0.7. Moreover, the second- In fact, the shock wave is not even strong dur-order correction to a(fii) is 0.05 or less for these ing this interval.8 If the shock wave were strong,media. Thus, for a point explosion in homoge- a In R/9 In t during the insensitive interval wouldneous rock, the above analysis predicts an insen- be' 0.4, rather than the value - 0.48 that is ob-sitive interval near the time when a(fij) z 0.53. served.) We expect that the analytical approachThis result is in good agreement with the empiri- described here can be used to predict whether ancal observation8 that there is an insensitive inter- insensitive interval exists for collections that in-val where a : 0.48. clude media outside U.S. test experience.
REFERENCES4. DISCUSSION AND CONCLUSIONS 1. C.F. Virchow, G.E. Conrad, D.M. Holt, andThe analysis presented here is approximate in sev- E.K. Ilodson, Rev. Sci. Inst. 51 (1980) 642.eral respects. First, the solution (6) for a point ex-plosion in a homogeneous medium is only approx- 2. Ya.B. Zel'dovich and Yu.P. Raizer, Physics ofimate, although it agrees well with both particle Shock Waves and High-Temperature llydro-speed data and with radius vs. time data over a dynamic Phenomena (Academic Press, Newbroad interval in time. Second, in computing the York, 1967).values of Li and T. plotted in Figure 2 we haveassumed that fi = 0.53 for all these media. While 3. F.K. Lamb, ACDIS IVP-2-87-2 (Univ. of Illi-the actual values of fi may be similar for these nois Program in Arms Control, Disarmament,rocks, 4 they are not expected to be identical. The and International Security, Urbana, IL, 1987).values of Li and T, can easily be corrected fordifferences in fI once the best values of fI have 4. W.C. Moss, J. Appl. Phys. 63 (1988) 4771.been determined. Third, actual shock waves arenot produced by spherically symmetric point ex- 5. L.I. Sedov, Similarity and Dimensional Meth-plosvhns. Although the shock wave produced by ods in AMechanics (Academic Press, New York,an aspherical source of finite size will evolve to- 1959).ward a spherically-symmetric, self-simnilar wave ifthe shock front envelops a mass much greater than 6. F.K. Lamb, An Independent Assessment of
that of the nuclear charge while the shock wave is CORRTEX, Report prepared for the Congres-still strong, 9 even the shock waves produced by a sional Office of Technology Assessment (1987).
150 kt explosion weaken too quickly for this to oc-cur, given current U.S. testing practices.8 Finally, 7. F.K. Lamb, B.W. Callen, and J.D. Sullivan,
the geologic media in which tests are conducted of- "Insensitive Interval in the Evolution of Shock
ten are not homogeneous, but have layers, voids, Waves from Underground Nuclear Explosions",
and other structures that can affect the propaga. Rep. P/89/5/77 (UIUC Physics Dept., Ur-
tion of the shock wave. bana, IL, 1989).
Despite these complications, we think that the 8. F.K. Lamb, Nuclear Arms Technologies inanalysis presented here points to the physical rea- the 1990s, eds. D. Schroeer and D. Ilafemeis-son for the existence of an insensitive interval t er ( r stitu e o n h i Ne r k,
for the rocks within U.S. nuclear test experience, 1988) p. 109.
namely, a correlation between the basic proper-
ties of these rocks (cf. Fig. 2). (Note that the 9. GI. Barenblatt, Similarity, Self-Similarity, andexistence of an insensitive interval cannot be at- Intermediate Asymptotics (Consultants Bu-tributed to strong, self-similar motion of the shockwave. For the reasons mentioned above, the shock
46

v oa
4r
Insensitive Interval in the Evolution of Shock Wavesfrom Underground Nuclear Explosions
F. K. Lamb, B. W. Callen, and J. D. Sullivan
UNIVERSITY OF ILLINOIS AT URBANA-CHAMPAIGN
DEPARTMENT OF PHYSICS
LOOMIS LABORATORY OF PHYSICS
1110 W. GREEN STREET
URBANA, ILLINOIS 61801
47P/89/5/77

INSENSITIVE INTERVAL IN THE EVOLUTION OF SHOCK WAVES
FROM UNDERGROUND NUCLEAR EXPLOSIONS*
F. K. Lamb, B. W. Callen, and J. D. Sullivan
University of Illinois at Urbana- Champaign
Department of Physicsand
Program in Arms Control, Disarmament, and International Security1110 West Green Street, Urbana, IL 61801, U.S.A.
ABSTRACT
The initial speed of the shock wave produced by an underground nuclear explosion increaseswith the yield of the explosion. Thus, techniques that measure the radius of the shock frontas a function of time, such as CORRTEX, can be used to estimate the yield, provided thedependence of the radius vs. time curve on the properties of the ambient geologic mediumis understood. For silicate rocks, there is empirical evidence that the radius of the shockfront is relatively insensitive to the particular rock but fairly sensitive to the yield of theexplosion during part of the hydrodynamic phase. This insensitive interval lies outsidethe strong shock region. The physical origin of this insensitivity and whether it wouldpersist for a more diverse collection of geologic media has been unclear. We show thatthe existence of an insensitive interval is probably a consequence of correlations betweencertain properties of the rocks at U.S. test sites. We relate the radius of the shock frontto these rock properties using an approximate solution for the propagation of the shockwave that assumes a linear relation between shock speed and particle speed and a scalingrelation for the particle speed. This solution agrees well with particle speed and radiusvs. time data. Given this solution, the radius vs. time curve for one rock can be generatedby applying a similarity transformation to the radius vs. time curve for a different rock.When the relevant rock properties are correlated in a certain way, an insensitive intervalappears. The relevant properties of the rocks found at U.S. test sites correlate in just thisway. Remarkably, similar correlations exist among the relevant properties of other, quitedifferent media.
"Presented at the 11th Annual AFGL/DARPA Seismic Research Symposium, San Antonio,TX, 2-4 May 1989. Work supported in part by DARPA through the Air Force GeophysicsResearch Laboratory under Contract F-19628-88-K-0040.
48
I
INSENSITIVE INTERVAL IN THE EVOLUTION OF SHOCK WAVES
FROM UNDERGROUND NUCLEAR EXPLOSIONS
F. 1K. Lamb, B. W. Callen, and J. D. SullivanUniversity of Illinois at Urbana-ChampaignDepartment of Physics andProgram in Arms Control, Disarmament, and International Security1110 West Green Street, Urbana, IL 61801
Contmrct: F19628-88-K-0040
OBJECTIVE
The overall objective of this project is to improve analysis and interpretation of shockwave data that have been and may be gathered to help monitor agreed limitations onunderground nuclear testing. Specific objectives are to explore the effects of the ambientgeologic medium on yield estimates made using shock wave methods, to investigate theeffects of different test geometries, and to explore the possibility of using shock wavemethods to monitor yield limitations well below the current yield limit of 150 kt.
SUMMARY
During the six months since this project began, (1) equation of state data have beenassembled for a variety of geologic media relevant to U.S. and Soviet test sites, (2) theusefulness and limitations of various simple high-pressure equations of state for geologicmedia have been explored, (3) the requirements for self-similar and intermediate asymptoticbehavior of shock waves produced by underground nuclear explosions have been analyzed,and (4) the conditions under which so-called 'insensitive interval scaling' can be used toestimate reliably the yield of an underground nuclear explosion have been investigated. Inthis report we describe our results thus far on insensitive interval scaling.
Insensitive Interval Scaling
The initial speed of the shock wave generated by an underground nuclear explosion in-creases with the yield of the explosion, all other things being equal. As a result, theradius of the shock front at a given time is greater for explosions of greater yield. Hencemeasurements of the radius of the shock front using CORRTEX (Virchow et al. 1980) orother techniques can be used to estimate the yield, provided the dependence of the radiusvs. time curve on the properties of the ambient geologic medium is understood. In practice,
the yield of an explosion is estimated using an algorithm, by which we mean a particularprocedure for comparing radius vs. time data with a model of the motion of the shockfront. One of the most commonly used algorithms, and the one that the United States hasproposed to use in monitoring Soviet compliance with the Threshold Test Ban Treaty, isinsensitive interval scaling.
49

Ai "insensitive interval" exists if, for explosions of a given yield, there is an intervalin tnine during which the radii of shock waves in all media of interest are similar. In fact,there is empirical evidence that the radius of the shock front is relatively insensitive tothe ambient medium toward the end of the hydrodyxiamic phase of shock wave evolution.For the rocks within U.S. test ,xperieince, which are mostly silicates. This is illustrated in
the left planel of Figure 1, which shows typical radius vs. time curves for explosions of thesame yield in two such rocks. The curves approach each other grad.ally, cross, and thenseparate gradually from one another. Because the curves intersect at a small angle, theinsensitive interval is not sharply defined.
The insensitive interval scaling algorithm is based on this empirical evidence. itassumes that, during a certain interval in time and radius called the "algorithmic interval",the radius of the shock front produced by an explosion of a given yield is the same for allambient media of interest. The algorithm asslumes further that if the yield is varied, thelocation and extent of the algorithmic interval scale as the cube root of the yield. Stateddifferently, the insensitive interval scaling algorithm assumes that there is an interval inscaled elapsed time since the beginning of the explosion t= t/W 1 3 and scaled radius ofthe shock front 1? = R/W 113 during which )(i) is the same for all rocks of interest.
In using insensitive interval scaling, yield estimates are made by comparing a simpleempirical formula, often called the Los Alamos Formula, to radius vs. time data collectedin the algorithmic interval. This formula is (Bass and Larsen 1977)
R(t) =ajb, (1)
where a and b are constants, and R an( t are in units of m/kt 1/3 and ms/kt /3, respectively.
This simple power law expression does not accurately describe the position of the shockfront as a function of time in any medium. However, it may approximate the radius ofthe shock front over a certain time interval, if a and b are chosen appropriately. This isillustrated in the right panel of Figure 1, which compares the radius vs. time curve givenby the Los Alamos Formula for a = 6.29 and b = 0.475 (Bass and Larsen 1977) with theradius vs. time curve from a model of the evolution of the shock wave produced in graniteby a spherically-symmetric point explosion with a yield of 62 kt.
The values of a and b used in equation (1) are usually determined by fitting it toa collection of R(t) data obtained from many nuclear explosions in the different rocks ofinterest, over a selected interval of i. In general, Rý(i) depends on the ambient medium,even within this interval. The resulting values of a and b, therefore, do not represent thebest fit of equation (1) to the R(t) curve for any single medium, but rather the best fitto the pooled R(t) curves for all the media of interest, over the chosen interval in i. Notsurprisingly, different individuals and groups have found different best-fit values of a andb from different collections of explosions on different dates. The values of a and b used inthis report are those noted above.
Within the assumptions of the insensitive interval scaling algorithm, a sequence ofyield estimates Wq can be obtained for any explosion without regard to the particularmedium in which it occurred by adjusting W in equation (1) so that it agrees with theshock front radii Rq measured at a sequence of times t q in some prescribed "algorithmicinterval" Ai. A best estimate of the yield is then formed by combining the individual yield
50

3
-- Granite Model
... Los Alamos "1111!1
E 100
20"L.....
01o.-• 10
o 05.~~0
15
10 .1 -."
05 10 1.5 2.0 2.5 .00 001 .01 1 1 10 100 1000
Time (ms) Time (ms)
Fig. 1.-Left: Typical radius vs. time curves for two explosions of the same yield in twodifferent silicate rocks, showing how the curves gradually approach each other, cross, and thengradually deviate from one another. Right: Comparison of the radius vs. time curve given bythe Los Alamos Formula (1), for a = 6.29 and b = 0.475, with ihe radius vs. time curve froma model of the evolution of the shock wave produced in granite by a spherically-symmetric pointexplosion with a yield of 62 kt. The radius given by the Formula is close to the radius of the shockfront for t ; 1 Ims, but deviates from the shock front radius at both earlier and later times.
estimates Wq in some way, for example by averaging them. Since the data to be combinedare to be chosen from a prescribed interval in t but the yield is unknown a priori, the yieldestimates Wq must be constructed by an iterative process.
Any discrepancy A/R between the value of R(i) given by equation (1) and the truevalue of R(t) introduces an error
AW (2)
in the yield. The extent in t of the data that can be used in estimating the yield (i.e., theextent of the so-called "algorithmic interval") depends on how large an error in the yieldcan be tolerated and the diversity of materials that need to be considered. If a relativelylarge error is acceptable, the algorithmic interval can be relatively large. On the otherhand, if only a very small error in the yield is acceptable, there may be no interval in tthat gives a yield estimate with the required accuracy.
From this discussion it is apparent that a critical requirement for successful use ofthe i•nsensitive interval algorithm is that there exist an interval in i during which /R(i)depends weakly or not at all on the medium surrounding the explosion, for the media ofinterest. Despite widespread use of this algorithm, the physizal reason for the existence ofsuch an insensitive interval and the extent to which it would persist for shock waves in amore. diverse collection of geologic media has been unclear. In this report we show thatthe existence of an insensitive interval is most likely a consequence of correlations between
51

4
certain properties of the rocks at the U.S. test sites. To demonstrate this we relate thescaled radius R of the shock front at a given scaled time i to these rock properties, usingan approximate, analytical model for the propagation of the shock wave. This model isdescribed in the next section. It agrees well with both particle speed and radius vs. timedata from nuclear tests and numerical simulations. Within the assumptions of this model,the radius vs. time curve for an explosion in one rock can be used to generate the radiusvs. time curve for an explosion of any yield in any rock by applying a certain similaritytransformation. By studying these transformations, we show that an insensitive intervalappears when the relevant rock properties are correlated in a certain way. We then showthat the relevant properties of the rocks found at U.S. test sites correlate in just this way.However, this correlation does not extend to all rocks.
Analytical Model
In order to focus on the effect of the ambient medium on shock wave evolution, we considerhere the spherical shock wave produced by release of a very large amount of energy inan infinitesimal volume (a so-called point explosion) in homogeneous rock. Some of thecomplications that can arise when the hydrodynamic source is of finite size and asphericaland the medium is inhomogeneous are mentioned at the end of this report. Our analysisassumes that the evolution of the shock wave is adequately described by the followingmodel.
Studies of shock waves in solids (see Zel'dovich and Raizer 1967) have shown that formany materials, the relation between the speed D of a shock front and the particle speedu just behind it is approximately linear for large u, that is
dR,Di - dt = Ai + Biu, (3)
where Ai and B, are constants. The subscript i denotes the material. In general, D(u)will deviate from this relation as u decreases. In the present analysis we shall assume thatD(u) can be adequately represented by a single linear relation of the form (3) over therange of u that is of interest.
We shall also assume that the particle speed just behind the shock front is related tothe yield Wi of the explosion by the expression (Lamb 1987a; Moss 1988)
FPo0 R,?(t) u2 (t) = fiW,, (4)
where R,(t) is the radius of the shock front at time t, poi is the mass density of the rock inits unshocked state, and fi is a dimensionless factor that describes how the energy of theexplosion is partitioned between kinetic energy of bulk motion and internal energy, andhow the velocity, density, and internal energy of the shocked material vary with position.In general, fi is a constant when the shock wave is strong, but changes somewhat as theshock wave weakens (Lamb 1987a). Expression (4) with f, constant agrees relatively wellwith particle speed data over a broad interval in time (Moss 1988). In the present analysis,we shall assume that f, can be treated as constant for the times of interest.
52

5
Given tGese assumptions, equation (3) with u given by equation (4) can be integratedan;dytically to yield a simple, closed expression for Ri(t). First we rewrite equation (3) interms of the di. iensionless variables (Lamb 198 7a)
x = R,/L, and r=t/T= , (5)
where /3f, W,B2')'/ 3 L
Li 'IV,) and T, =--- (6)\4irpo,A, A,
The properties of the medium enter the characteristic length Li and the characteristictime T, through the constants P0,, A,, Bi, and fi, while the yield enters through Wi. Theconstants Ai and B, are determined by the shock adiabat while fi reflects the releaseadiabat.
In terms of the non-dimensional variables (5), equation (3) becomes
dx 1-= 1 +- (7)
The solution of equation (7) is (Lamb 1987a)
7-(X) = X + I In x +r 2_,'-7 + 1)_ -7r + tan-' ( 2,/fx - . (8)1 ( X+2 /i±1 2F 6i -1(2f3-1\
At small radii (x <K 1), this solution reduces to
x(,r) ;z: (5/2)2/5,r2/5, (9)
which is the behavior of a strong, self-similar shock wave (Sedov 1959). At large radii(x > 1), the solution becomes
x(r) - const. + T, (10)
which describes a constant-speed plastic wave. In the transition interval between theseregimes, equation (8) provides a simple interpolation between the strong shock wave andthe plastic wave that agrees quite well with field data and numerical simulations (Lamb1987a,b; Moss 1988).
Within the assumptions of the present model, any explosion is completely defined byits yield WI and the ambient medium. The ambient medium is completely specified by thequantities poi, A,, B,, and fi. The radius vs. time curve for any explosion can be generatedfrom the function (8) by applying the similarity transformation
Ri(t) = Li x(t/Tj). (11)
Conversely, this result implies that the yield of any explosion can be determined by com-paring measured values of R(t) with the values given by equation (11), if the quantitiespoi, A,, Bi, and f, are known.
53

6
The result (11) also implies that if the radius vs. time curve for explosion i is known,then the radius vs. time curve for any other explosion j can be generated, provided that p.A, B, f, and W are known for both explosions. More precisely, the radius vs. time curveR,(t) for any explosion j is given in terms of the radius vs. time curve R,(t) for explosioni by the similarity transformation
R,(t) = (Lj/L,) Ri(Tit/T,). (12)
Before proceeding further, we note that the approach outlined in the following sectionsdepends only on the existence of a similarity transformation of the form (12), and not onthe values of the characteristic scales L and T, or the particular form of the function x(r).Thus, even if the actual values of Li and Ti differ somewhat from the values given byexpression (6), or the actual functional form of x(r) differs from that of equation (8), theapproach outlined below is still valid.
Existence of an Insensitive Interval
In the present section we use the analytical model described in the previous section toexplore the conditions under which an insensitive interval exists.
According to our earlier definition, an insensitive interval exists if, for explosions of thesame yield, there is an interval in time At about some time to during which the radii Ri ofthe shock waves in all the media in the collection of interest are nearly equal. When this istrue, the yield of any explosion can be estimated approximately by applying equation (1),or an alternate formula, to the R(t) data in this interval, without regard to the particularmedium in which the explosion occurred.
To formulate a more precise definition of the insensitive interval, coriside, the shockwaves produced by an explosion of the same yield in two different media i and j. Thedifference between the resulting radius vs. time curves R,(t) and Rj(t) at time t is
ARij(t) =- R,(t) - Rj(t). (13)
We define the insensitive time to as the time at which the yield estimate is least sensitiveto the ambient medium, for media in the collection of interest. If the yield is estimatedby adjusting the value of W in formula (1) so that the radius given by this formula agreeswith the measured radius, then the inscasitive time to is the time at which the averageover the collection of media of some appropriate function of AR,,, such as IAR,,(t)V , isa minimum. The size of (IARij(to) 1
2 ) is then a measure of the sensitivity to the ambientmedium of yield estimates made at to, and in general will not be zero. The extent At ofthe "insensitive interval" can be calculated from the way in which (IAR& (t) 2 ) varies withtime about to, given a criterion for the maximum acceptable yield error.
With these definitions, one can calculate to and At for a collection of n different mediaby applying standard statistical techniques (Lamb, Callen, and Sullivan 1989). However,analysis of a collection of two different media captures the most important features of theproblem and is considerably more transparent. Therefore, for pedagogical purposes weshall treat a collection of just two different media in the present report. A collection of nZmedia can be treated by a straightforward extension of the methods described here.
54

7
The radius vs. time curves for two different geologic media typically cross, as illustratedhy the sainple curves shown in the left panel of Figure 1. We first assume that R,(t) andlt(t) cross at on01 ;inl only one point, and then discuss what happens if they do not crossat all (the case of more than one crossing, if relevant, can be treated by a generalizationof the following analysis).
Any monotonically increasing function of IARj(t)I is a minimum when R3 (t) andR-(t) cross. Thus, the insensitive time t(0 is the root of the equation
ARij(t) = 0. (14)Now suppose the curves R,(t) and R1(t) are generated from a curve x(r) by similarity
transformations of the form (11). Then
ARE, = L, x(r,) - Lj x(r,), (15)
where r, = t/T, and 7) = tlTj. Note that the dimensionless times 7i and rT that correspondto the same time t are in general different for the two media.
In order to make further progress, we need to relate x(ri) and x(r,). If x(r) variessufficiently slowly in the region of interest, we can relate x(Tj) and x(ri) by expandingboth in a Taylor series about
i 2 1(r, + rj). (16)
Keeping only the three leading terms, the result is
x(,) = + (7i - fi) X'(r,,) + 1(7i - j) 2 X"(i,), (17)
with a similar expression for x(Tr). The primes indicate differentiation with respect to T.
Substituting these expansions into equation (15), one finds
=L ( -T Ti / x'(ji) + L(ALi k, i) (fij)2 X"(-ij), (18)
whereAL, =- Li - L, and ATj =- T, - T, (19)
are the differences in the characteristic lengths and times of the two explosions, and
,j -= 1(Lj + Li) and Tji =(T, + Tj) (20)
are their averages. Note that expression (18) is not an expansion of ARi in powers ofALj or AT,, [the coefficients of f,,x'(fj) and (fj) 2x"(fi,) are exact].
The left side of equation (18) vanishes at the insensitive time tP, [cf. eq. (14)]. Thus,the zero of the right side of this equation gives an estimate, accurate to second order in7, - r,, and r1 - rj, of the corresponding dimensionless time f, from which one can
calculate ti, using the expression
= i (21)
55

8
As we show below, for the rock collections of interest to us the third term on the right sideof equation (18) is typically quite small compared to the first two terms, and we thereforeiieglhct it in estimating f,°. With this approximation, r9 is determined implicitly by thecondition
AL,j X(r,j) = L,--IJ T ,j x,(?i) (22)
or, ini a more compact form,
a(if,) = ,1 , (23)
wheredlnx adi AL£,
a(r) n dinr dLi ATM i (24)
Note that the left side depends only on the properties of the medium-independent functionx(r), while the right side of equation (23) depends only on the properties of the two ambientmedia. The radius vs. time curves cross, if at all, when the logarithmic derivative a(f,,)equals Alij.
The development to this point requires only that one be able to generate the radiusvs. time curves R(t) of different explosions from some function x(r) by applying a similaritytransformation of the form (11) to this x(r). If x(r) is given by equation (8), we can bemore specific about the existence and location of a crossing point. For this x(r), thelogarithmic derivative a(r) increases monotonically from 0.4 to 1 as r increases from 0to o0 [see eqs. (9) and (10)1. Thus, there can be at most one crossing point. The radiusvs. time curves Ri(t) and Rj(t) cross if
0.4< Mj • 1. (25)
They do not cross if Mj lies outside this interval. To summarize these results for twomedia, we have shown that whether the radius vs. time curves for two different mediacross, and the time of crossing if they do, is determined by the characteristic lengths andtimes defined by the properties of the two media.
To apply these results to explosions in a collection of many media, we first note thatif two media are very similar, then AR,, will be small over a broad interval in time. Inthis case the time of intersection is very sensitive to differences in the properties of the twomedia, but is of little interest, because the radius vs. time curves are almost the same overan extended interval in time. The crossing points of most interest are those for dissimilarmedia. In considering a collection of many media, we can say that the radius vs. timecurves for the various media will all cross each other at about the same time if (1) Mjhas approximately the same value for all explosions i and j in the collection and (2) thisvalue lies in the interval [0.4,1]. The optimal insensitive time to for the collection of mediais then detennined implicitly by the appropriate generalization of equation (23) (Lamb,Callen, and Sullivan 1989). Even if the time of intersection for a pair of media in thecollection is significantly different from to, the difference in the radii of the shock fronts atto may still be small, if the two media have properties near the averag, properties of thecollection.
56
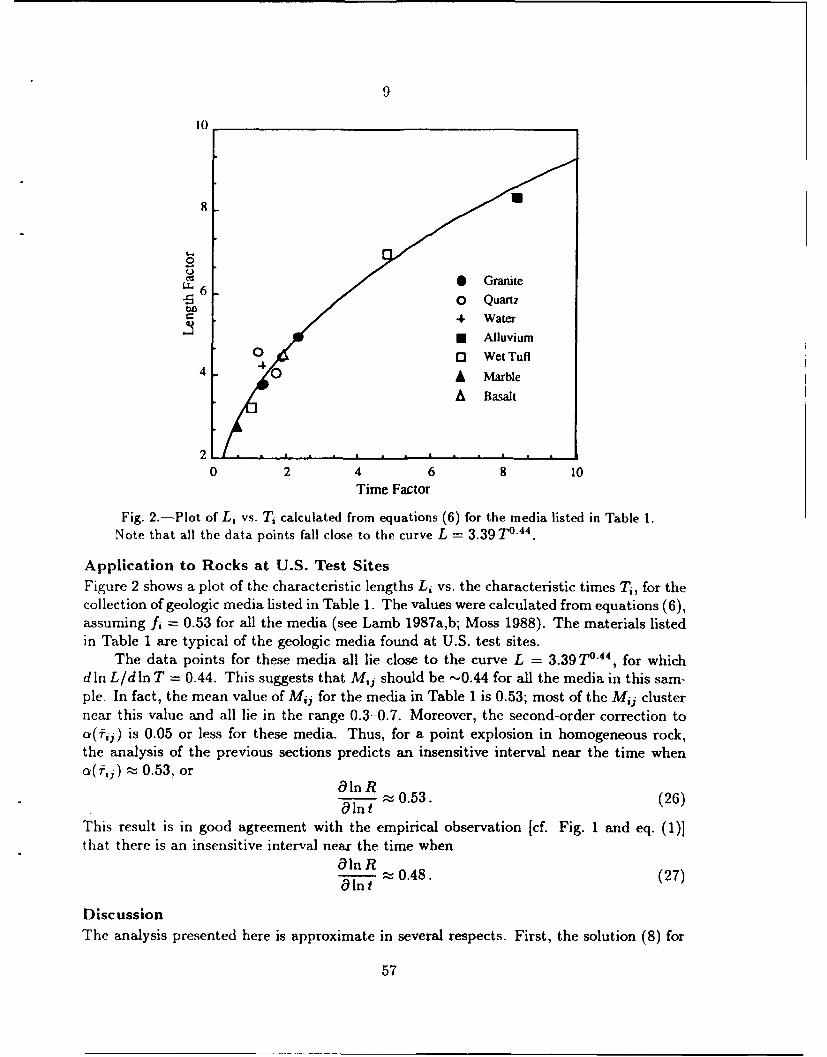
10
8/
0 0 Granitet6 O Quart2
"4 WaterSAlluvium
0l 0 Wet Tuf4 A Marble
A Basalt
20 2 4 6 8 10
Time Factor
Fig. 2.-Plot of Li vs. T, calculated from equations (6) for the media listed in Table 1.Note that all the data points fall close to the curve L = 3.39 To
Application to Rocks at U.S. Test SitesFigure 2 shows a plot of the characteristic lengths Li vs. the characteristic times Ti, for thecollection of geologic media listed in Table 1. The values were calculated from equations (6),assuming fi = 0.53 for all the media (see Lamb 1987a,b; Moss 1988). The materials listedin Table 1 are typical of the geologic media found at U.S. test sites.
The data points for these media all lie close to the curve L = 3.39To44 , for whichdin Ld InT = 0.44. This suggests that M,, should be -"0.44 for all the media in this sam-ple. In fact, the mean value of Mij for the media in Table 1 is 0.53; most of the Mij clusternear this value and all lie in the range 0.3-0.7. Moreover, the second-order correction tooz(fij) is 0.05 or less for these media. Thus, for a point explosion in homogeneous rock,the analysis of the previous sections predicts an insensitive interval near the time whena(f,j) - 0.53, or
8ln R9 0.53. (26)Olnt
This result is in good agreement with the empirical observation [cf. Fig. 1 and eq. (1)]that there is an insensitive interval near the time when
Oln R -t 0.48. (27)alnt
DiscussionThe analysis presented here is approximate in several respects. First, the solution (8) for
57

10
TABLE 1Equations of Statea
Rock po (g cm- 3) A (kms-') B Ref.
Westerly Granite 2.62 2.103 1.629 1Granite 2.65 2.7 1.4 1Granite 2.67 2.8 1.45 2
Quartz Crystal 2.65 2.35 1.56 1Quartz Sand 1.6 2.32 1.04 1Quartz (high u) 2.65 4.56 1.25 7Vacaville Basalt 2.86 2.31 1.62 4Dolomite 2.7 4.01 1.3 6Wet Tuff 1.95 1.45 1.62 2Wet Tuff 2.2 3.0 1.11 3Dry Alluvium 1.78 1 1.4 5Water 0.998 3.09 1.16 1
'The quantities P0, A, and •3 are the unshocked density and the parameters in theHugoniot (3). 1M. van Thiel (1977). 2W. C. Moss (1988), from fitting a Mie-Grfineisenequation of state to tabalated equations of state for granite (J. D. Johnson and S. P. Lyon1985) and wet tuff (J. D. Johnson, unpublished). 3 R. C. Bass (1966). 4 A. H. Joneset al. (1968) and LLNL Equation-of-State File, S-Division (1964). 5W. R. Perret andR. C. Bass (1975). 6 A. N. Dremin and G. A. Adadurov (1959). 7j. D. Johnson andS. P. Lyon (1985).
a point explosion in a homogeneous medium is only approximate, although it agrees wellwith both particle speed data and with radius vs. time data over a broad interval in time.Second, in computing the values of L, and T, for the media in Table 1 we have assumedthat f, = 0.53 for all these media. While the actual values of fi may be similar for theserocks (Moss 1988), they are not expected to be identical. The values of L, and T, caneasily be corrected for differences in f, once the best values of f, have been determined.
Third, actual shock waves are not produced by spherically symmetric point explosions.The emplacement holes currently used in U.S. tests have radii as large as 1.5m and em-placement holes with larger radii are planned for the future. Moreover, the nuclear chargeand diagnostic canisters may be many meters in length. As a result, the source of theshock wave is vapor and radiation filling a volume with a dimension of meters. Also, nu-clear explosions are usually not spherically symmetric, causing the expanding shock waveto be aspherical initially. Although the shock wave produced by an aspherical source offinite size will evolve toward a spherically-symmetric, self-similar wave if the shock frontenvelops a mass much greater than that of the nuclear charge while the shock wave is stillstrong (Barenblatt 1979), even the shock waves produced by a 150 kt explosion weakentoo quickly for this to occur, given current U.S. testing practices (Lamb 1988). Finally, thegeologic media in which tests are conducted often are not homogeneous, but have layers,voids, and other structures that can affect the propagation of the shock wave.
58
11
Despite these complications, we think that the analysis presented here points to the41 v1i,\t1 '[C5a! n r f• fiCr hexistence of ati insensitive interval for the rocks within U.S. test,
,.E.ince, naiiely, a correlation between the basic properties of these rocks (cf. Fig. 2)."The existtice of an insensitive interval cannot be attributed to strong, self-similar
motion of the shock wave. For the reasons tren'ioned above, the shock wave is not self-similar during the insensitive interval, for current test geoInetries and the yields permittedby the Threshold Test Ban Treaty. In fact, the shock wave is not even strong duringthis interval (Lamb 1988). If the shock wave were strong, the logarithmic derivative ofthe radius with res-pect to time during the insensitive interval would be 0.4 (Sedov 1959),utl her than the value'---0.48 that is observed.
CONCLUSIONS AND RECOMMENDATIONS
Using an approximate but relatively accurate analytical model of shock wave propagation,we have shown that the "insensitive interval" observed in nuclear explosions in the rockswithin U.S. test experience is most likely due to correlations among certain properties ofthese rocks. We expect that the analytical approach described here can be used to predictwhether an insensitive interval exists for collections of rocks that include media outside1'.S. test experience.
We recommend that efforts be made to (1) improve the analytical model used here,(2) investigate the underlying physical basis for the observed correlation among the rel-evant properties of the rocks listed in Table 1, and (3) explore the evidence that similarcorrelations exist among other classes of media.
REFERENCES
Barenblatt, G.I. 1979, Similarity, Self-Similarity, and Intermediate Asymptotics (New York:Consultants Bureau).
Bass, R. C. 1966, Rep. SC-RR-66-548, (Albuquerque, NM: Sandia Corp.).Bass, R. C. and G. E. Larsen. 1977, Rep. SAND 77-0402 (Albuquerque, NM: Sandia
National Laboratories).Dremin, A. N. and G. A. .dadurov. 1959, Soviet Physics-Doklady 4, 972.Johnson, J. D. and S. P. Lyon. 1985, Rep. LA--9391-MS (Los Alamos, NM: Los Alamos
National Laboratory).Jones, A. H., et al. 1968, Interim Report, Contract NAS2-3427 (Warren, MI: General
Motors Tech. Center).Lamb, F. K. 1987a, ACDIS WP-2-87-2 (Urbana, IL: University of Illinois Program in Arms
Control, Disarmament, and International Security, February, 1987).Lamb, F. K. 1987b, An Independent Assessment of CORRTEX, Report prepared for the
Congressional Office of Technology Assessment (April, 1987).Lamb, F. K. 1988, in Nuclear Arms Technologies in the 1990s, edited by D. Schroeer and
D. Hafemeister (New York: American Institute of Physics), p. 109.Lamb, F. K., B. W. Callen, and J. D. Sullivan. 1989, in preparation.Moss, W. C. 1988, J. Appl. Phys. 63, 4771.Perret, W. R. and R. C. Bass. 1975, Rep. SAND 74-0252 (Albuquerque, NM: Sandia
Corp.).
59
12
Scdov, L. I. 1959, Similarity and Dimensional Methods in Mechanics (New York: AcademicPress).
\-;m Tliiel, M. 1977, Rep. UCRL-50108 (Livermore, CA: Lawrence Livermore NationalLaboratory).
\'irchow, C. F., G. E. Conrad, D.M. Holt, and E.K. Hodson. 1980, Rev. Sci. Inst. 51, 642.Zel'dovich, Ya. B. and Yu. P. Raizer. 1967, Physics of Shock Waves and High-Temperature
H1ydrodynamic Phenomena (New York: Academic Press).
60
Hydrodynamic Determination of the Yieldof Underground Nuclear Explosions
B. W. Callen, F. K. Lamb, and J. D. Sullivan
Presented at the 12th Annual DARPA/GL Seismic Research Symposium,Key West, Florida, 18-20 September 1990
UNIVERSITY OF ILLINOIS AT URBANA-CHAMPAIGN
DEPARTMENT OF PHYSICS
LOOMIS LABORATORY OF PHYSICS
1110 W. GREEN STREET
URBANA, ILLINOIS 61801
61P/90/9/116

HYDRODYNAMIC DETERMINATION OF THE YIELD OFUNDERGROUND NUCLEAR EXPLOSIONS
B. W. Callen, F. K. Lamb, and .1. D. SullivanUniver'sity of Illimc is at. U iJllii ('hIiaIIaigil
Depirtietint of Physics andPrograni iii Arms C;ontr.ol, Disairnatiieint, and Intdernational SecuIi ty
1110 West (Creen Streett, Urbanwi, IL 61801
Contract: F19628-88-K-0040
OBJECTIVE
The overall objective of this project is to improve analysis and interpretation of shockwave data that have been and will be gathered to help monitor agreed limitations onunderground nuclear testing. Specific objectives are to explore the effects of the ambientgeologic medium on yield estimates made using shock wave methods, to investigate theeffects of different test geometries, and to explore the possibility of using shock wavemethods to monitor yield limitations well below the current yield limit of 150 kt.
SUMMARY
During the past year, we have (1) used an approximate analytical model for the evolution ofthe shock wave from an underground nuclear explosion, together with previously collectedequation of state data for geologic media relevant to U. S. and Soviet test sites, to developa method for estimating the yield of underground nuclear tests, (2) explored the usefulnessand limitations of various simple high-pressure equations of state for geologic media, and(3) analyzed the requirements for scaling of shock waves produced by underground nuclearexplosions and numerical simulations of such explosions. In this report we describe how asimple analytical model of the evolution of the shock wave can be used to produce relativelyaccurate estimates of the yield of underground nuclear explosions.
Hydrodynamic Methods for Yield Estimation
The strength of the shock wave generated by an underground nuclear explosion increaseswith the yield of the explosion, all other things being equal. As a result, the peak pressure,peak density, and shock speed at a given radius all increase monotonically with the yield.Hence, the yield of the explosion can be estimated by comparing measurements of thesequantities with the values predicted by a model of the shock wave in the relevant geologicmedium. Recently, the United States and the Soviet Union have signed new verification
protocols (The White House 1990) that allow measurements of the radius of the shockfront using tLhe CORRTEX technique (Virchow, et al 1980) for treaty monitoring undersome circumstances.
Most shock wave based algorithms for estimating the yield of underground nuclearexplosions have focused on the so-called hydrodynamic phase, because the evolution of
62

9
the s•oick wayv diirli•g• thi., phlase' is r.lttively simp,'le. The hydrodynamlic phase of the(xpl(,-hI 11 begi us wli, iel thi ()itward flow of .nergy via radiation becomes Unimportant."This ,,c,',rs abouit 10 100( pjs after (h't )it1(111. depiending on tle yield and the coomposition
)f th. iii iaterial iirnur,,iliIMlie the uiclear 1,'}irg,. The explosion catn then he describedi using
the e'q, Iatins (,f hvdr,,ylli;,ii,'is allone. I), -infg th1e hydrodynamic tphase, the radial stress
lOdi ice(d b y the shock ww.vc greatly ,.xcceeds tle critical stress at which the surrounding rockheroines ,la.stic', auill t fI,-' ",1,,ck4d r,,'k (all ho, tI watcd as a fluid. Tie shock wave weakens asit \.pJha;1dls, and (evl.t uiallv t.lc st reungth of t li u,,ck cain n, longcr be mieghectd. This markstle endt (,f the hydrodyianiic phase. Yield estimation methods that use nieasurementstakt.ii luring the hydrodyiiamic phase are called hydrodynamic methods.
Analytical Model
All hydrodynamnic yield e-stimation methods require a model of the evolution of the shockwave. Models in recent or current use range in sophistication from an empirical power-lawfornmula that assumes the evolution is completely independent of the medium (Bass andLarsen 1977; see also Heusinkveld 1982; Lamb 1988) to numerical simulations based ondetailed equations of state (see Moss 1988; King, ei al. 1989; Moran and Goldwire 1989).Although state-of-the-art numerical simulations are expected to be highly accurate forspherically symmetric, tarmped explosions in homogeneous media, the detailed equation ofstate data needed for such calculations are only available for a few geologic media. Thus,a simpIle analytical niodel of the shock wave produced by such explosions cant be quitel1s5f(l4, as it allows one to analyze how the evolution depends on the medium and the yieldin a convenient mannler. The particular analytical model we utilize in this paper has theadditional virtue that it produces very good estimates of the yields of actual undergroundnuclear tests as we show below.
We summarize here an ap)proximate analytical model of the hydrodynamic evolutionof the shock wave produced by a point explosion in a homogeneous medium. Such a shockwave is necessarily spherically symmetric. In the model, the compression of the mediumat the shock front is treated exactly, using the Rankine-Hugoniot jump conditions andthe Hugoniot of the ambient medium. The rarefaction that occurs in material behind theadvancing shock front is treated approximately, via an ansatz relating the specific kineticenergy of the fluid just behind the shock front to the mean specific energy within theshocked volume. This model was originally proposed by Lamb (1987), who showed that itis exact for strong, self-similar shock waves. The model was later proposed independentlyby Moss (1988). A detailed description and assessment of the model is given in Lamb,Callen., and Sullivan (1990).
We assume that the speed D of the shock front in a frame at rest with respect tothe unshocked medium may be expressed in terms of the particle speed u just behind theshock front, that is,
D _= dR/dt = H(u), (1)
where the Hugoniot H(u) depends on the medium.The specific kinetic energy of the fluid just behind the shock front can be related to
63

3
the inean specific energy withlin the shocked volume via the expression
"" fk~r- -0 '(2)of th3s1k4ro tp)s h
where It is the yield of the explosion. R is the radius of tile shck front, P0 is the massdensity of the rock in its iiiisliockcd state, and f is a dimensionless factor that dependsupon the velocity, density, and specific internal energy distributions within the shockedvolume. In general, f is independent of R when the shock wave is strong, but it may varyas the shock wave weakens (Lamb 1987; Lamb, Callen, and Sullivan 1990).
In the model, f is assumed to be independent of the shock front radius R for allshock front radii of interest, including those for which the shock is no longer strong (Lamb1987; Moss 1988; Lamb, Callen, and Sullivan 1990). Expression (2) with f = 0.53 agreesrelatively well with particle speed data over a broad interval in time (Moss 1988; Lamb,Callen, and Sullivan 1990). In the present report, we shall use this value and assume thatf can be treated as constant for the times of interest.
The assumption that f is independent of R leads to a simple approximate equation ofmotion for the shock front. With this assumption, the right side of equation (1) becomesa known function of R, and equation (1) becomes a first-order differential equation for R.namely
dR/dt = F(R). (3)
This equation can be integrated directly to determine the radius of the shock front as afunction of time, as pointed out by Lamb (1987) and Moss (1988).
Studies of shock waves in solids (see Zel'dovich and Raizer 1967) have shown that formany materials, the relation between the speed D of a shock front and the particle speedu just behind it is approximately linear for large u, that is
dRD- =- = A + Bu, (4)
dt
where A and B are constants. In general, D(u) will deviate from this relation as u de-creases. If we assume for the moment that D(u) can be adequately represented by a singlelinear relation of the form (4) over the range of interest, we obtain an interesting and usefulanalytical solution to the differential equation (3).
Linear Hugoniots--First, we rewrite equation (4) in terms of the dimensionless vari-ables (Lamb 1987; Lamb, Callen, and Sullivan 1990)
x =R/L and r =t/T, (5)
where
L= (3fBA 2 ) / and T= L (6)\~47rp0 A2 A=. 6
The characteristic length L and the characteristic time T depend on the medium throughthe constants p0, A, B, and f, and ilso scale as the cube-root of the yield W. The
64

4
cI(ligtlh 1. is tlhe radlill tliit .-. l(ardtcs tli( s-tioii Shock regiiic, where D (x J-3/2' from
thew m( I rc.i) I&li plw-l.t wave mrcgili(., where I) •owt. Ill t.eriiis of the noli-diieilsionalvarial)les (5). equation (4) becoines
d(I)
The solution )f equatio n (7) is (Lamb 1987; Lamb, Callen, and Sullivan 1990)
1 x + -V 1 + -1 2 7r2 1)]
7,) = X(8)3 ( X - V17+ 1 ,F3 96V3
At small radii (x K< 1), this solution reduces to
IT) ; (5/2)2/" r2/5, (9)
which is the behavior of a strong, elf-.similar shock wave (Sedov 1959). At large radii(x >> 1), the solution becoeiis
x(T) -_ const. + T, (10)
which describes a constant-speed plastic wave. In the transition interval between theseregimes, equation (8) provides A simple interpolation between the strong shock wave andthe plastic wave that agrees quite well with field data and numerical simulations (Lamb1987; Moss 1988; Lamb, Callen, and Sullivan 1990).
Within the assumptions of the present model, any explosion is completely defined byits yield W and the ambient medium, which in turn is completely defined by the quantitiespo, A, B, and f. The shock front radius vs. time curve for any explosion can be generatedfrom the function x(r) by applying the similarity transformation
R(t) = L x(t/T). (11)
Conversely, this result implies that the yield of any explosion can be determined by com-paring measured values of R(t) with the values given by equation (11), if the quantitiesp0, A, B, and f are known. In particular, since the characteristic length and time L andT scale as the cube-root of the yield, the radius vs. time curve (11) automatically satisfiescube-root scaling. That is, if R = g(t) is the radius vs. time curve for an explosion with ayield of 1 kt, then the curve for an explosion with a yield of W kt in the same medium isgiven by
R = W'/ 3g(tlW1 1 3 ). (12)
Radius vs. time curves for various yields are generated by using the cube-root scalingexhibited by the model.
The curve (11) also satisfies a more general scaling that involves the material prop-erties, as shown by equations (6). The result (11) also implies that if the radius vs. timecurve for explosion i is known, then the radius vs. time curve for any other explosion jcan be generated. provided that p0, A, B, f, and W are known for both explosions. More
65

precisely, the radius vs. time curve R,(t) for any explosion j is given in terms of the radiusvs. time curve R,(t) for explosion i by the similarity transformation
Rt(t) = (L/L,) R,(Tzt/T,) . (13)
This similarity transformation was previously exploited to show that the existence of ;I'insensitive interval' in the evolution of shock waves in materials at U. S. test sites is mostlikely the result of correlations between the properties of those materials (Lamb, Callen,and Sillivan 1989).
Arbitrary Hugoniots. Although for imany materials the Hugoniot at high particl(speeds (or equivalently, at high pressures) is well-described by a single linear relation ofthe form (4). the Hugoinot at lower particle speeds usually deviates from the high-speedrelation. Even if the Hugoniot. is not linear over the range of u of interest, it can alwaysbe represented to any desired accuracy by a sequence of piecewise-linear segimmenits. In thiscase, the differential equation (7) still describes the motion of the shock front within each
gment of the Hugoniot, but at each break in D(u) new Hugoniot parameters A and Bmust be introduced. It is possible to write the radius vs. time curve for a piecewise-linearHugoniot as a sum of standard functions; however, in practice it is more convenient tointegrate the differential equation numerically. The radius vs. time curve predicted by themodel for any physically allowed Hugoniot obeys the cube-root scaling (12).
Yield Estimation
We now use the model discussed above to estimate yields by comparing the radius vs.time curve it predicts with data from four underground nuclear tests conducted by theUnited States. The four tests -afe Pilcdrivcr, Cannikin, Chiberta, and a test that we callNTS-X, since its name has not been reported in the open literature. (A more detaileddiscussion of these four events, and of the utility of this model in yield estimation, canbe found in Lamb, Callen, and Sullivan [1990]). The radius vs. time data from the firstthree events were obtained using the so-called SLIFER technique (Heusinkveld and Holzer1964). These data were kindly provided to us by M. Heusinkveld (1987, private commu-nication); see also Heusinkveld (1986). The radius vs. time data from the event NTS-Xwere taken from Heusinkveld (1979); the technique used to obtain it was not reported. Toour knowledge, no radius vs. time measurements made using the more recently developedCORRTEX technique (Virchow, et aL. 1980) are publicly available. We first briefly describeeach event.
Piledriver.---The Piledriver event was an explosion conducted in granite at the NevadaTest Site on 1966 June 2 and had a yield of 62 kt (U. S. Department of Energy 1987).
Cannikin.-The Cannikin event was an explosion conducted in basalt at AmchitkaIsland, Alaska, on 1971 November 6. The official yield of this event remains classified; theU. S. Department of Energy (1987) has said only that it was less than 5 megatons. Thedata from Cannikin that were given to us had been scaled by dividing both the radiusand the time measurements by the cube-root of the official yield. If cube-ioot scaling wereexact, this would make the radius vs. time curve appear identical to the curve that wouldresult from detonation of a 1 kt device in the same medium. As explained in Lamb, Callen.and Sullivan (1990), the validity of cube-root scaling for underground nuclear explosions
66

6
I1(1e(,Is to be iiivestigiited morI , care'filly. HO, wevri, since the simiple analytical miodel wear1. exi lorinig exhibilts exact cube-root scaling, comparisons of this model with scaled andIIIsa( lle, data will give. tle samie result. We therefore treat the data from this explosionias thoiugh it had be'en protlled by a 1 kt (explosionI.
('i brrta. The Chlhcrta event was ;a exp losion conducted in wet tuff at the Nevada
"Test Site ,i, 1975 Deeeiii•ier 20. The official yielI of this explosion remains classified; thetI. S. [)'a•tit ,iiit. 'f ]"rier•" ( 1987) has saint i yily that it. was Ietweeii 2(0 andl 200 kilotons.
Using seismic data, Dahlmiai and Israelson (1977) estimate that the yield of Chiberta was160 kt. Like the data from Cannikin, the radius vs. time data from Chiberta that were
given to mis had been scaled by the ciihe-root of the official yield. We therefore treat thedata from Chlberta as though it had been produced by a 1 kt explosion.
NTS-X. The event we call NTS-X was an explosion conducted at the Nevada TestSite. Radius Vs. time data from this explosion were reported by Heusinkveld (1979), whostates that the official yield was 54.2 kt. Heusinkveld surmises that the ambient medium is
saturated wet tuff, the ambient medium of most tests conducted at the Nevada Test Site.In modeling NTS-X. we assumed that the explosion did occur in wet tuff.
The analytical model outlined in the previous section describes a point explosion ina homogeneous medium, which necessarily produces a spherically symmetric shock wave.In reality, the shock wave produced by an underground nuclear test evolves from an as-pherical source of finite size surrounded by a medium that is inhomogeneous, at least tosome extent. We have investigated the conditions under which cube-root scaling is likelyto be valid for shock waves produced by spherically synimetric sources of finite size (Lamb,Callen, and Sullivan 1990) and find that the requirements for cube-root scaling are un-likely to be satisfied for underground nuclear tests conducted according to current U. S.testing practices. Thus. cube-root scaling is at best only approximately valid during thehydrodynamic phase. Despite our lack of detailed knowledge of the conditions under whichthe above tests were conducted and the data collected, we find that the model provides aremarkably good description of the field data considered here.
In comparing the model with the data, we assumed that the sensing cable from whichthe radius vs. time data were obtained was crushed by the shock wave, and not by anelastic precursor (Lamb 1988).
The inputs to the model are the Hugoniot, the density and the parameter f for theambient medium in which the event occured. The Hugoniot can be determined fromlaboratory measurements made on samples removed from the emplacement and satelliteholes. If such measurements were made for the four events analyzed here, they were notmade available to us. Therefore, we used generic Hugoniot data for the ambient mediaof each explosion (see Fig. 1). For Piledriver, we used a piecewise-linear representation ofthe data on polycrystalline quartz compiled by King, et al. (1989). We assumed that thegranite surrounding the nuclear device emplacement had a den.:",, equal to the standarddensity of quartz, namely 2.65 gm/cm3 . For Cannikin, we useu the data on Vacavillebasalt obtained by Jones, et al. (1968) and Ahrens and Gregson (1964). We assumed thatthe density was 2.86 gm/cm3 , equal to that of the samples measured by Jones, et al. ForChiberta and NTS-X, we used the wet tuff Hugoniot data of King, et al. (1989), and thedensity of 1.95 gm/cm3 given by these authors.
67
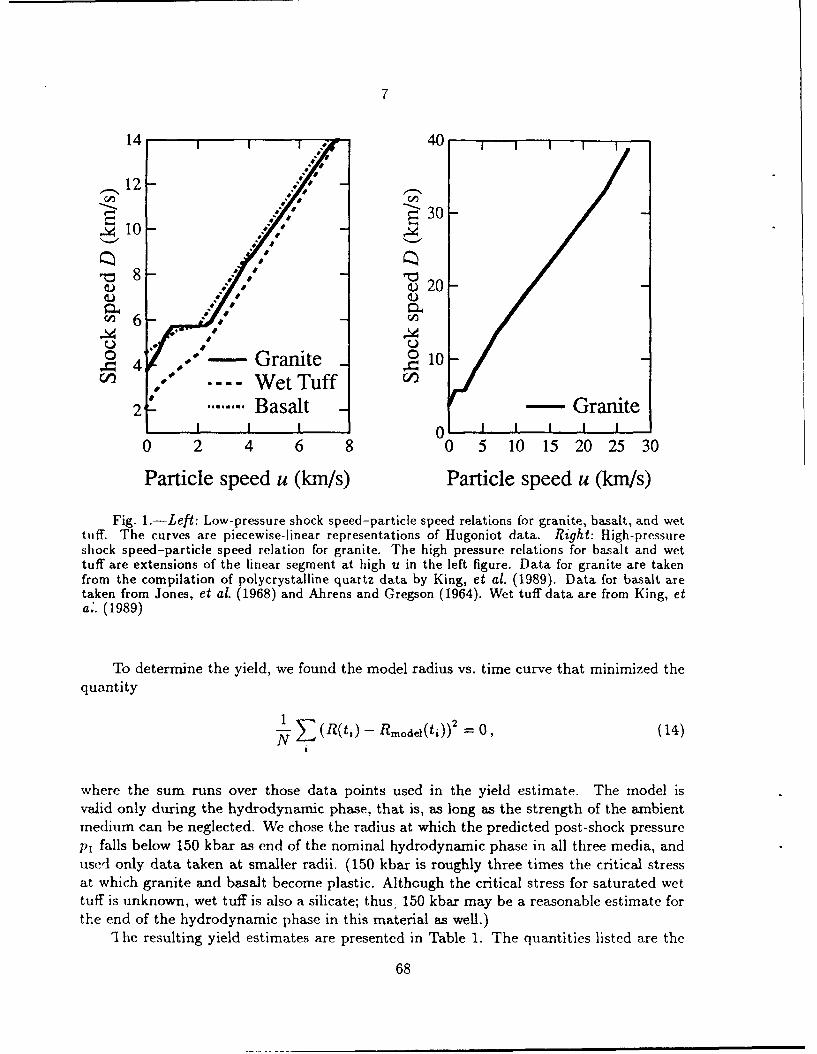
7
14 * 40 40
12
- 104* _. _ 30-10 4'
8 -, -8 /'/,"o •20 -
6 -
SGranite - , 10=~ 4 .C*I s .. Wet Tuff
2 ........ Basalt - GraniteI I I 0 I I I I I
0 2 4 6 8 0 5 10 15 20 25 30
Particle speed u (km/s) Particle speed u (km/s)
Fig. 1.-Left: Low-pressure shock speed-particle speed relations for granite, basalt, and wettuff. The curves are piecewise-linear representations of Hugoniot data. Right: High-pressureshock speed-particle speed relation for granite. The high pressure relations for basalt and wettuff are extensions of the linear segment at high u in the left figure. Data for granite are takenfrom the compilation of polycrystalline quartz data by King, et al. (1989). Data for basalt aretaken from Jones, et al. (1968) and Ahrens and Gregson (1964). Wet tuff data are from King, eta,. (1989)
To determine the yield, we found the model radius vs. time curve that minimized the
quantity
+ S (R(t,) - Rmodel(ti)) 2 = 0, (14)
where the sum runs over those data points used in the yield estimate. The model isvalid only during the hydrodynamic phase, that is, as long as the strength of the ambientmedium can be neglected. We chose the radius at which the predicted post-shock pressurep, falls below 150 kbar as end of the nominal hydrodynamic phase in all three media, andused only data taken at smaller radii. (150 kbar is roughly three times the critical stressat which granite and basalt become plastic. Although the critical stress for saturated wettuff is unknown, wet tuff is also a silicate; thus; 150 kbar may be a reasonable estimate forthe end of the hydrodynamic phase in this material as well.)
TIhe resulting yield estimates are presented in Table 1. The quantities listed are the
68
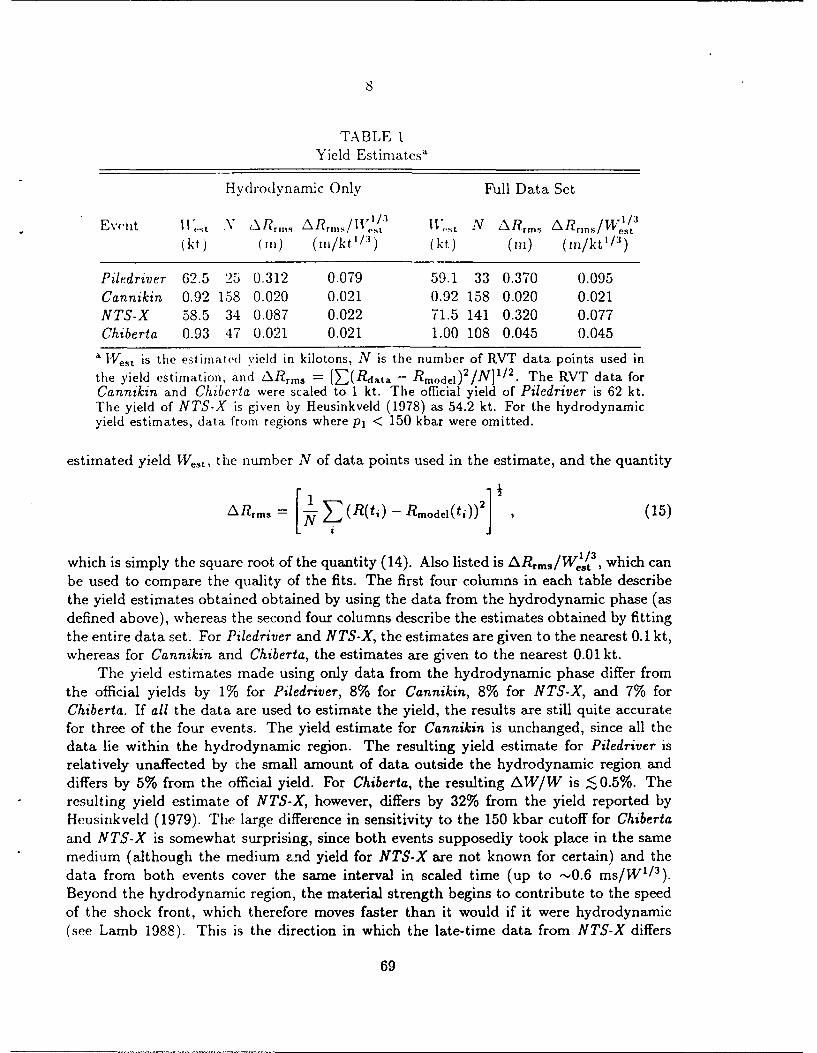
TABLE 1Yield Estimates'
Hydrodynamic Only Full Data Set
Event 11It IV,N AlR"",~rn/cQ I> N A\Rrms, ARrin /3~
(kt) (mi) (mi/kt'/ý) (kt) (in) (111/kt'1P)
Piledriver 62.5 25 0.312 0.079 59.1 33 0.370 0.095Cannikin 0.92 158 0.020 0.021 0.92 158 0.020 0.021NTS-X 58.5 34 0.087 0.022 71.5 141 0.320 0.077Chiberta 0.93 47 0.021 0.021 1.00 108 0.045 0.045
aIVest is the estimated yield in kilotons, N is the number of RVT data points used inthe yield estimation, and A-Rrms = [=(Rdata - Rmodel) 2 /N] 1
/2 . The RVT data for
Cannikin and Chiberta were scaled to 1 kt. The official yield of Piledriver is 62 kt.The yield of NTS-X is given by Heusinkveld (1978) as 54.2 kt. For the hydrodynamicyield estimates, data from regions where P, < 150 kbar were omitted.
estimated yield WVest, the number N of data points used in the estimate, and the quantity
AR..[. Z(R(tt) -Rmodel(ti))2](5= .m- = (15)
which is simply the square root of the quantity (14). Also listed is ARrm,/W{, / which canbe used to compare the quality of the fits. The first four columns in each table describethe yield estimates obtained obtained by using the data from the hydrodynamic phase (asdefined above), whereas the second four columns describe the estimates obtained by fittingthe entire data set. For Piledriver and NTS-X, the estimates are given to the nearest 0.1 kt,whereas for Cannikin and Chiberta, the estimates are given to the nearest 0.01 kt.
The yield estimates made using only data from the hydrodynamic phase differ fromthe official yields by 1% for Piledriver, 8% for Cannikin, 8% for NTS-X, and 7% forChiberta. If all the data are used to estimate the yield, the results are still quite accuratefor three of the four events. The yield estimate for Cannikin is unchanged, since all thedata lie within the hydrodynamic region. The resulting yield estimate for Piledriver isrelatively unaffected by the small amount of data outside the hydrodynamic region anddiffers by 5% from the official yield. For Chiberta, the resulting AW/W is •<0.5%. Theresulting yield estimate of NTS-X, however, differs by 32% from the yield reported byHeusinkveld (1979). The large difference in sensitivity to the 150 kbar cutoff for Chibertaand NTS-X is somewhat surprising, since both events supposedly took place in the samemedium (although the medium and yield for NTS-X are not known for certain) and thedata from both events cover the same interval in scaled time (up to -'-0.6 ms/W"/3 ).Beyond the hydrodynamic region, the material strength begins to contribute to the speedof the shock front, which therefore moves faster than it would if it were hydrodynamic(see Lamb 1988). This is the direction in which the late-time data from NTS-X differs
69
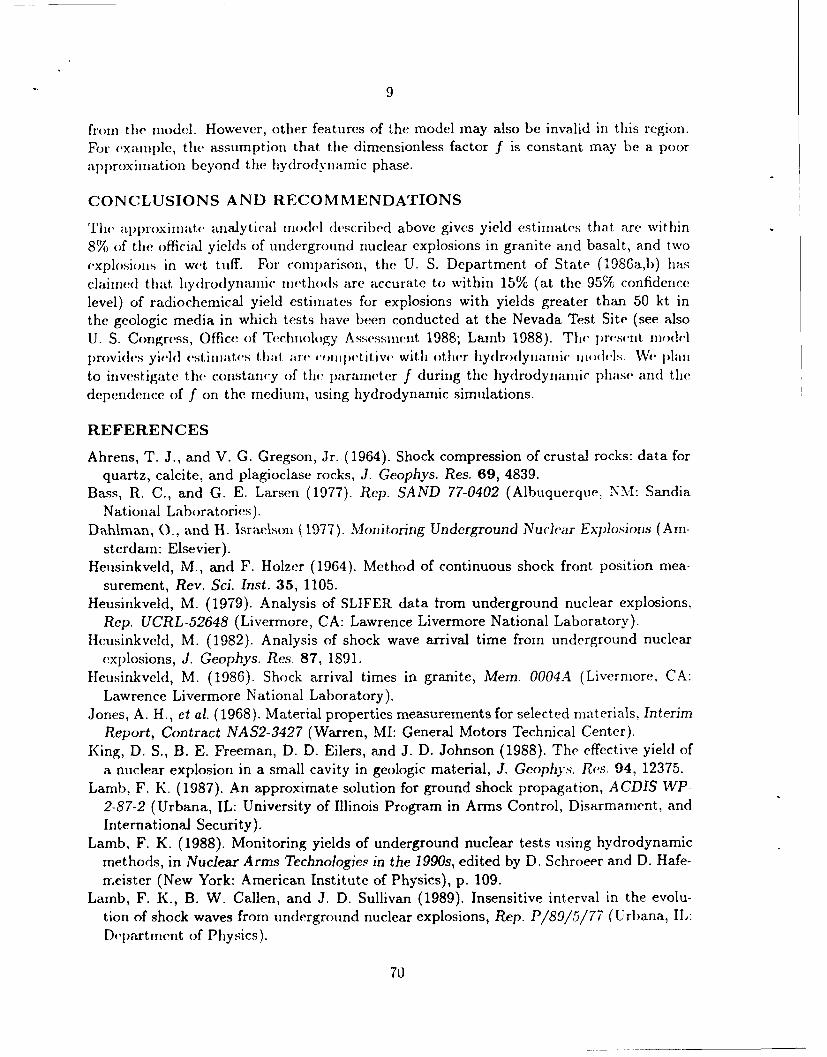
9
from the model. However, other features of the model may also be invalid in this region.For example, the assumption that the dimensionless factor f is constant may be a poorapproximation beyond the hydrodynamic phase.
CONCLUSIONS AND RECOMMENDATIONS
The app)roxiiiiate analytical 1o1(M( described above gives yield estimates that are within8% of the official yields of underground nuclear explosions in granite and basalt, and twoexplosions in wet tuff. For comparison, the U. S. Department of State (1986a,b) has
claimed that hydrodynamic methods are accurate to within 15% (at the 95% confidencelevel) of radiochemical yield estimates for explosions with yields greater than 50 kt inthe geologic media in which tests have been conducted at the Nevada Test Site (see alsoU. S. Congress, Office of Technology Assessment 1988; Lamb 1988). Tlh pre'se'nt nmodelprovides yield estimates th;,t airc c,•,n,•petitive with other hydrodynaIImic mdl",mlei. We ijl,;amto investigate the constancy of thile parancter f during the hydrodynamic phase and thedependence of f on the medium, using hydrodynamic simulations.
REFERENCES
Ahrens, T. J., and V. G. Gregson, Jr. (1964). Shock compression of crustal rocks: data forquartz, calcite, and plagioclase rocks, J. Geophys. Res. 69, 4839.
Bass, R. C., and G. E. Larsen (1977). Rep. SAND 77-0402 (Albuquerque, NM: SandiaNational Laboratories).
Dahlman, 0., and H. Isravlson (1977). Monitoring Underground Nuclear Explosions (Am-sterdam: Elsevier).
Heusinkveld, M., and F. Holzer (1964). Method of continuous shock front position mea-surement, Rev. Sci. Inst. 35, 1105.
Heusinkveld, M. (1979). Analysis of SLIFER data trom underground nuclear explosions,Rep. UCRL-52648 (Livermore, CA: Lawrence Livermore National Laboratory).
Heusinkveld, M. (1982). Analysis of shock wave arrival time from underground nuclearexplosions, J. Geophys. Res. 87, 1891.
tIeusinkveld, M. (1986). Shock arrival times inl granite, Mem. 0004A (Livermore, CA:Lawrence Livermore National Laboratory).
Jones, A. H., et al. (1968). Material properties measurements for selected materials, InterimReport, Contract NAS2-3427 (Warren, MI: General Motors Technical Center).
King, D. S., B. E. Freeman, D. D. Eilers, and J. D. Johnson (1988). The effective yield ofa nuclear explosion in a small cavity in geologic material, J. Geophys. Res. 94, 12375.
Lamb, F. K. (1987). An approximate solution for ground shock propagation, ACDIS WP-2-87-2 (Urbana, IL: University of Illinois Program in Arms Control, Disarmament, andInternational Security).
Lamb, F. K. (1988). Monitoring yields of underground nuclear tests using hydrodynamicmethods, in Nuclear Arms Technologies in the 1990s, edited by D. Schroeer and D. Hafe-meister (New York: American Institute of Physics), p. 109.
Lamb, F. K., B. W. Callen, and J. D. Sullivan (1989). Insensitive interval in the evolu-tion of shock waves from underground nuclear explosions, Rep. P/89/5/77 (Urbana, IL:Department of Physics).
70
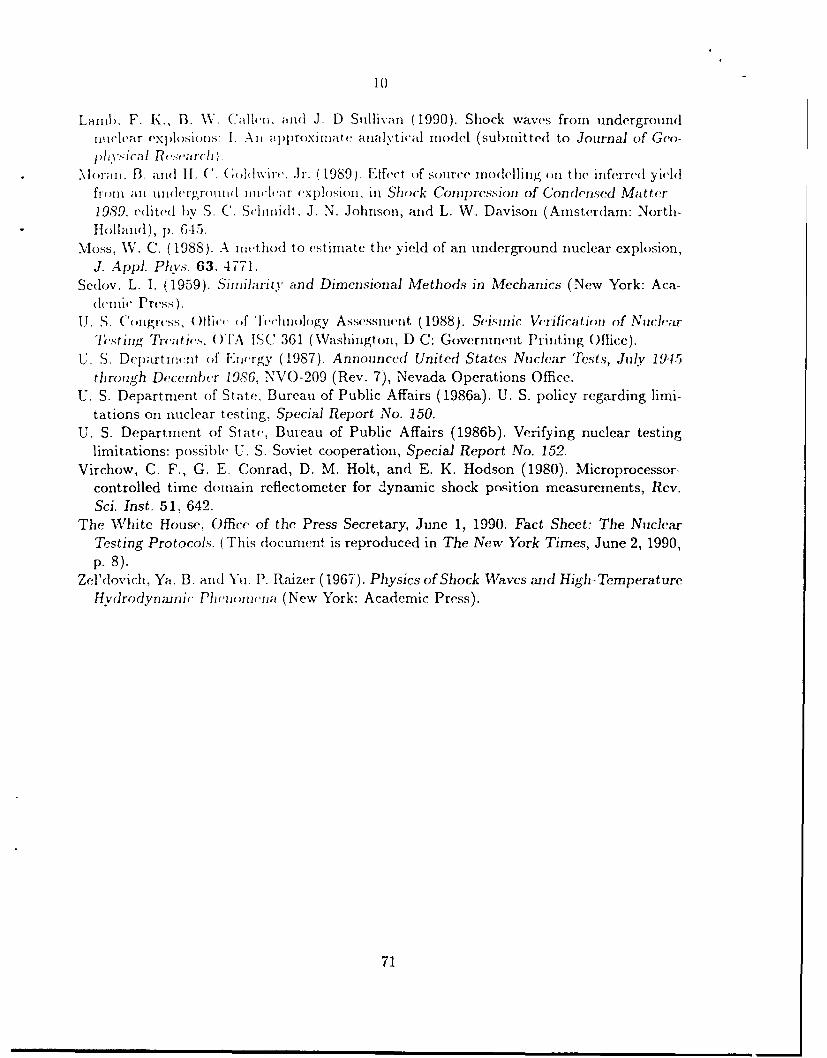
10
Lamb,. F. K., B. %V. (alelu,. and .J. D Sullivan (1990). Shock waves from undergroundwiclear explosi(ons: I. Ali •it)proxinlate anaytical model (submitted to Journal of Geo-)fhy.<ical R's..'ca',h).
.hora1. 3B. a~ndI I. C. (;,hlkvire. Jr. (1989). Etfect of source modellilng on the inferred yieldfoi,,I all u1Ill'lgrwulldl lll(l'ier explosion. in Shock Compression of Condonsed Matter1989. edited by S. C. Schmidt. J. N. Johnson, and L. W. Davison (Amsterdam: North-
Holland), p. 645.Moss, W. C. (1988). A im,,hod to estimate the yield of an underground nuclear explosion,
J. Appi. Phys. 63, 4771.Sedov. L. I. (1959). Similarity and Dimensional Methods in Mechanics (New York: Aca-
(eliic Press).U. S. (Cogr',s, (0)tic,' of lec'hnology Assessinent (1988). Seinmic Vrificatiori of Nciil;tr
"Te;sting Treaties, (O)I'A ISC 361 (W ashinigton, D C: Government Printing Office).U. S. Departirarit oIf Energy (1987). Announced United States Nuclear Tests, July 194.5
through December 1986, NVO-209 (Rev. 7), Nevada Operations Office.U. S. Department of State, Bureau of Public Affairs (1986a). U. S. policy regarding limi-
tations on nuclear testing, Special Report No. 150.U. S. Department of State, Bureau of Public Affairs (1986b). Verifying nuclear testing
limitations: possible U. S.-Soviet cooperation, Special Report No. 152.Virchow, C. F., G. E. Conrad, D. M. Holt, and E. K. Hodson (1980). Microprocessor-
controlled time domain reflectometer for dynamic shock position measurements, Rev.Sci. Inst. 51, 642.
The White House., Office of the Press Secretary, June 1, 1990. Fact Sheet: The NuclearTesting Protocols. (This document is reproduced in The New York Times, June 2, 1990,p. 8).
Zel'dovich, Ya. B. and Yu. P. Raizer (1967). Physics of Shock Waves and High-TemperatureHydrodynwmic Ph'lmnem,ca (New York: Academic Press).
71
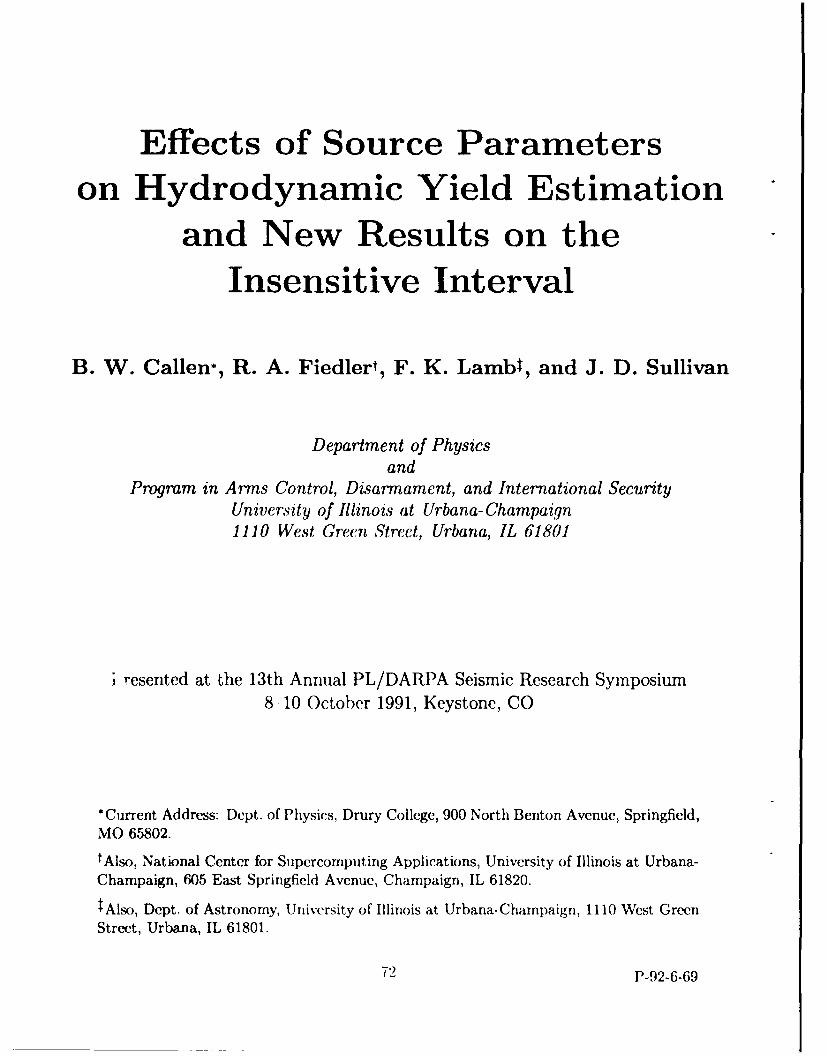
Effects of Source Parameterson Hydrodynamic Yield Estimation
and New Results on theInsensitive Interval
B. W. Callen-, R. A. Fiedlert, F. K. Lambt, and J. D. Sullivan
Department of Physicsand
Program in Arms Control, Disarmament, and International SecurityUniversity of Illinois at Urbana-Champaign1110 West Green Street, Urbana, IL 61801
i resented at the 13th Annual PL/DARPA Seismic Research Symposium8 10 October 1991, Keystone, CO
*Current Address: Dept. of Physics, Drury College, 900 North Benton Avenue, Springfield,MO 65802.
tAlso. National Center for Supercomputing Applications, University of Illinois at Urbana-
Champaign, 605 East Springfield Avenue, Champaign, IL 61820.
tAlso, Dept. of Astronomy, University of Illinois at Urbana-Champaign, 1110 West Green
Street, Urbana, IL 61801.
72 P-92-6-69

EFFECTS OF SOURCE PARAMETERS
ON HYDRODYNAMIC YIELD ESTIMATION
AND NEW RESULTS ON THE INSENSITIVE INTERVAL
B. W. Callen, R. A. Fiedler, F. K. Lamb, and J. D. Sullivan
Department of Physicsand
Program in Arms Control, Disarmament, and International SecurityUniversity of Illinois at Urbana-Champaign1110 West Green Street, Urbana, IL 61801
Contract No. F19628-88-K-0040
ABSTRACT
We explore the accuracy of yield estimation algorithms based on cube-root scaling by
computing the apparent yields of a collection of simulated underground nuclear explosions
with the same yield but different source parameters. We find that the yield inferred using
cube-root scaling can vary by as much as 25% at 0.1 scaled ms for reasonable source
parameters. This variation in the inferred yield a-pears to be due to variation in the
fraction of the initial source energy that is transformed into hydrodynamic motion by the
time the yield is estimated. Using the empirical result that the pressure in the source region
is insensitive to the source parameters at late times, we obtain a simple expression for the
energy remaining in the source region. We show that the variation in the energy remaining
in the source given by this expression accurately accounts for the dependence of the inferred
yield on the initial radius and on the effective adiabatic index of the source material. We
also present new results on the location and extent of the "insensitive interval" (that part
of the hydrodynamic phase during which the shock front location is relatively insensitive
to the ambient medium but is sensitive to the yield) for silicate and carbonate geologic
media.
OBJECTIVES
The initial speed of the shock front produced by an underground nuclear explosion
increases with the yield (see Lamb, Callen, & Sullivan, 1991). Therefore, measurements
of the front radius R as a function of time t can be used to estimate the yield, provided
the dependence of the radius vs. time (RVT) curve on the ambient geologic medium is
known. The overall objective of this project is to improve the analysis and interpretation
of shock wave data that have been and will be gathered to help monitor agreed limitations
on underground nuclear testing. Specific objectives are to investigate the effects of different
73

test geometries and different ambient geologic media. In this paper, we examine the effectof source parameters on the accuracy of yield estimates made using algorithms based on
cube-root scaling. We also explore how the interval in the shock front RVT data thatminimizes the uncertainties of yield estimates for silicate and carbonate geologic media
may be determined.
RESEARCH ACCOMPLISHED
1. Source Effects
1.1. The Zeus hydrodynamics code
The work described here extends the work of Moran & Goldwire (1990), who studied
the effect of varying the source parameters on yield estimates for a series of simulatedexplosions in rhyolite. In their computations, the yield was fixed while the source mass,initial radius, and equation of state (EOS) were independently varied. The source material
was taken to be either an ideal gas or iron gas, and EOS tables were utilized for the ambient
medium and for iron gas.
In this study, EOS tables based on the SESAME Library and obtained from S-Cubed
Corporation were used for granite, wet tuff, and aluminum. We solved the ideal fluidequations appropriate for the hydrodynamic regime using the Zeus code developed by
M. L. Norman and J. M. Stone at the National Center for Supercomputing Applications
at the University of Illinois at Urbana-Champaign. Details of the methods used andnumerical tests of the basic Zeus code are described in Norman (1980), Norman, Wilson,
& Barton (1980), Norman & Winkler (1986), and Stone & Norman (1992).
The Zeus code uses the method of finite differences and a two-step, operator-split,
explicit time-integration scheme. The computational meshes for the momentum compo-nents are staggered (offset) with respect to the mesh for the density and energy density in
order to reduce the amount of interpolation needed to compute fluxes through the sides
of mesh cells. The conservative, monotonicity-preserving advection scheme of van Leer
(1977) is employed, and shocks are spread over several cells by introducing an artificialviscosity tcrm (von Neumann & Richtmeyer, 1950). Truncation error terms in this method
are second order in time and space. Interfaces between different media are handled in Zeusby the first-order-accurate method of J. M. LeBlanc (private communication, 1974).
For the work reported here, it was necessary to modify the original Zeus program to
conserve exactly the total (kinetic plus internal) energy of the system. This was done by
choosing the total energy density (rather than the internal energy density) as one of thedependent variables, and rewriting the term representing the work done by pressure forcesas a surface integral over each mesh cell. We also modified the Zeus code in order to use
EOS data in tabulated form.
All simulations presented here employ a fixed mesh with 200 spherical cells within a
74
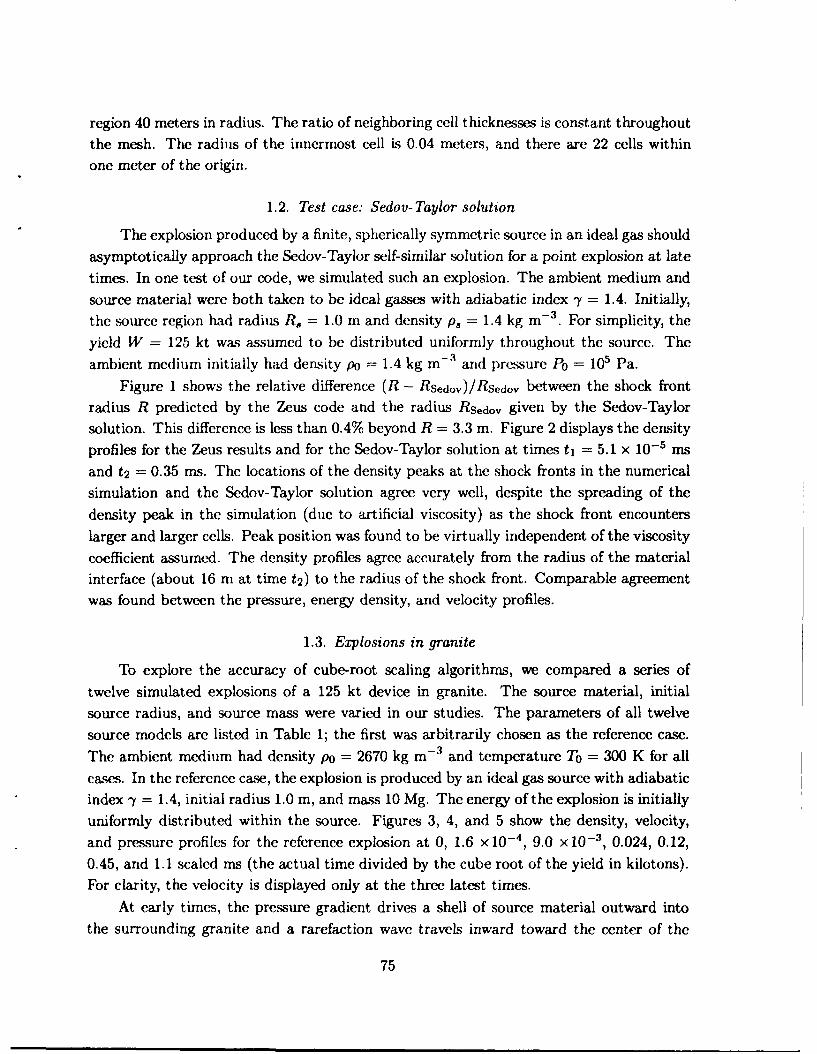
region 40 meters in radius. The ratio of neighboring cell thicknesses is constant throughout
the mesh. The radius of the innermost cell is 0.04 meters, and there are 22 cells within
one meter of the origin.
1.2. Test case: Sedov-Taylor solution
The explosion produced by a finite, spherically symmetric source in an ideal gas should
asymptotically approach the Sedov-Taylor self-similar solution for a point explosion at late
times. In one test of our code, we simulated such an explosion. The ambient medium and
source material were both taken to be ideal gasses with adiabatic index -y = 1.4. Initially,
the source region had radius R, = 1.0 m and density p, = 1.4 kg m-3. For simplicity, the
yield W = 125 kt was assumed to be distributed uniformly throughout the source. The
ambient medium initially had density p0 = 1.4 kg rn- and pressure Po = 105 Pa.
Figure 1 shows the relative difference (R - RSedov)/RSedov between the shock frontradius R predicted by the Zeus code and the radius Rsedov given by the Sedov-Taylor
solution. This difference is less than 0.4% beyond R = 3.3 m. Figure 2 displays the density
profiles for the Zeus results and for the Sedov-Taylor solution at times t1 = 5.1 x 10⁻⁵ ms
and t2 = 0.35 ms. The locations of the density peaks at the shock fronts in the numerical
simulation and the Sedov-Taylor solution agree very well, despite the spreading of the
density peak in the simulation (due to artificial viscosity) as the shock front encounters
larger and larger cells. Peak position was found to be virtually independent of the viscosity
coefficient assumed. The density profiles agree accurately from the radius of the material
interface (about 16 m at time t 2) to the radius of the shock front. Comparable agreement
was found between the pressure, energy density, and velocity profiles.
1.3. Explosions in granite
To explore the accuracy of cube-root scaling algorithms, we compared a series of
twelve simulated explosions of a 125 kt device in granite. The source material, initial
source radius, and source mass were varied in our studies. The parameters of all twelve
source models are listed in Table 1; the first was arbitrarily chosen as the reference case.
The ambient medium had density p0 = 2670 kg m- 3 and temperature To = 300 K for all
cases. In the reference case, the explosion is produced by an ideal gas source with adiabatic
index -y = 1.4, initial radius 1.0 m, and mass 10 Mg. The energy of the explosion is initially
uniformly distributed within the source. Figures 3, 4, and 5 show the density, velocity,
and pressure profiles for the reference explosion at 0, 1.6 x 10⁻⁴, 9.0 X 10- 3 , 0.024, 0.12,
0.45, and 1.1 scaled ms (the actual time divided by the cube root of the yield in kilotons).
For clarity, the velocity is displayed only at the three latest times.
At early times, the pressure gradient drives a shell of source material outward into
the surrounding granite and a rarefaction wave travels inward toward the center of the
75

explosion. The rarefaction wave eventually reflects from the origin. At late times, there is
a steep rise in the density at the interface between the source and the ambient medium.
In time the pressure and density in the source region become nearly uniform, whereas the
velocity profile in the source region remains jagged due to the presence of trapped waves.
At late times, the results for runs with different source parameters are very similar (but
not identical) to those for the reference case.
Figures 6, 7, and 8 show the relative inferred yield W/Wref, computed by cube-root
scaling the radius vs. time data (typically 75 different values) of the reference explosion
so that they agree with the RVT data of the explosion of interest. Note that the scale
along the vertical axis is different in each figure. These figures show that the inferred yield
is quite sensitive to the effective adiabatic index y of the source material (see Table 1).
For example, the inferred yield is only 74% of the actual yield at 0.1 scaled ms when -y is
reduced from 1.4 to 1.2. For ideal gas sources, the inferred yield is nearly independent of
source mass. This result is expected since, for such a source, the pressure is independent
of the mass density. We obtain similar results for explosions in wet tuff.
For an aluminum source, changing the source mass from 10 to 1 Mg increases the
inferred yield by nearly 6%. Similar results were obtained by Moran & Goldwire (1990)
for explosions with an iron gas source in rhyolite.
1.4. Energy remaining in the source region
RVT data are sensitive only to the fraction of the yield that has been converted from
internal energy of the source, where it resides initially, into the shock wave at the time
the radius measurements are made. We therefore expect that variations in the internal
energy E. remaining in the source region, which are caused by differences in the initial
source radius and the equation of state of the source material, will produce variations in
the inferred yield. (The kinetic energy remaining in the source region at late times is
negligible compared to the internal energy. For example, we find that the internal energy
in the source region of the reference explosion is 7 kt at 1 scaled ms, whereas the kinetic
energy in the source region is less than 4 x 10⁻⁴ kt.)
To test this hypothesis, wc compute(d E8 at 1 scaled ms for each explosion by numer-
ically integrating the internal energy 1) ove(r the source volume V.. These computations
show that the dependence of the inferred yield on the properties of the source is well ac-
counted for by thý variation in the energy remaining in the source region at the time of
the yield measurement. For example, E., = 7 kt at 1 scaled ms for the reference explo-
sion, whereas for the explosion with source parameters identical to the reference explosion
except that -y = 1.2, E, = 26 kt. We therefore expect the ratio of the apparent yields at
1 scaled ms to be (125 kt - 26 kt)/(125 kt - 7 kt) = 0.84, which is close to the value 0.82
found from cube-root scaling (see Table 1). Similarly, for the explosion with M , = 10 Mg,
76
"y = 1.2, and R. = 0.5 m, we find E, = 18 kt at 1 scaled ms. We therefore expect the
apparent yield of this explosion at 1 scaled ms to be a fraction 107 kt/118 kt = 0.91 of the
yield of the reference explosion; the fraction found by cube-root scaling is 0.87 (again, see
Table 1).
An approximate expression for the dependence of the inferred yield on the properties
of an ideal-gas source can be derived by considering tile adiabatic expansion of the source
from its initially uniform state with volume V,,i and pressure P.,,. At sufficiently late
times in our simulations, the source pressure and density are again nearly uniform, and it
is then meaningful to refer to the source pressure P,. At these times
PIV.t = P, V". b=( - 1) W V ,(-Y (1)
and henceP8 P8 [ -1)W V, -1)E-, =-F P(2)
X- -1) (V-Y - 1) P8
Moreover, we find empirically that at late times P, is insensitive to the initial properties
of the source. Using the appropriate value of P. in equation (2) therefore allows us to
estimate the dependence of E., and hence the inferred yield, on the adiabatic index -y of
the source material and the initial source volume V,,i. The values of E. at 1 scaled ms
(when P8 is approximately 2.2 x 10' Pa) predicted by equation (2) agree with the results
from direct numerical integration to within 1%.
2. Insensitive Interval
In using RVT data to estimate the yield of an underground nuclear explosion, one
must combine an accurate model of shock wave propagation in the ambient medium with
knowledge of the parameters that characterize the response of the medium to the shock
wave. Since uncertainties in the parameters describing the ambient medium lead to errors
in the estimated yield, it is of interest to find the interval in time (or, equivalently, in
radius) that minimizes the error in the yield due to incomplete or inaccurate knowledge of
the medium.
Empirical evidence from nuclear explosions in silicate rocks at the Nevada Test Site
has shown that the shock front RVT curves from several geologic media are relatively
insensitive to the particular ambient medium, yet fairly sensitive to the yield, during a cer-
tain interval in time. Using a simple model and a limited set of media, we have previously
shown in a first-order analysis (Lamb, Callen, & Sullivan 1989) that this insensitivity is
likely a result of correlations among media properties, particularly the initial density p0
and the parameters A and B that describe the high-pressure Hugoniot of a given medium.
These three parameters can be combined to form a characteristic length L and a charac-
teristic time T for each medium. When the logarithmic derivative of L with respect to T
77

is a constant (i.e., when L varies with T according to a power law), an insensitive intervalis predicted by tie model within the accuracy of the first-order analysis. In actual appli-cations of hydrodynamic methods of verification, if such an insensitive interval exists, data
from that interval should be given higher weight in any yield estimation algorithm, sinceerrors resulting from improper characterization of the medium are thereby minimized.
The above analysis suggested a method for predicting the existence of an insensitive
interval for any collection of media: from equation-of-state information, calculate the char-
acteristic length L and characteristic time T for each member of the collection, and checkfor a power law relation between L and T. Table 2 lists equation-of-state information foran improved collection of silicates. As Figure 9 shows, for these media L and T are welldescribed by the power law relation L = 3.31 2 0 -44, confirming our previous results. Simi-lar equation-of-state information for a collection of carbonate materials is listed in Table 3.The characteristic times and lengths for these materials are also well fit by a power lawrelation, as Figure 10 shows. These latter results suggest that an insensitive interval may
also exist for explosions in carbonate materials.
Our previous work (Lamb, Callen, & Sullivan 1989) showed how to find the crossing
point for a pair of RVT curves, and suggested a process for determining an interval inwhich the variation in shock front radius would be minimized for explosions of equal yield
in a collection of three or more media. Stated differently, this latter problem consists offinding the particular interval that minimizes the variation in yield estimates for explosions
of equal yield in a given collection of ambient media. To solve this problem, we must gobeyond the first-order approximation used in our earlier work.
To proceed, we use the analytical model of Lamb (1987), combined with the simplelinear Hugoniots listed in Tables 2 and 3, to generate shock front RVT curves for 100 kt
explosions in each material in the collections of silicates and carbonates. A more completc
analysis would use piecewise linear approxiriations to the Hugoniots (see Lamb, Callen, &
Sullivan 1992). The resulting RVT curves are shown in Figures 11 and 12. The curves ineach collection follow each othcr relatively closely for a limited interval in time, but diverge
at later times. For silicate materials, this similarity is greatest for times near 0.5 ins; for
the carbonates, the corresponding similarity occurs near 0.8 ins. This convergence of theRVT curves suggests the optimal interval for yield estimation is near these times.
To determine the optimal interval, we employed the following procedure. We examinedall np = flm(n,m - 1) ordered pairs of RVT curves in a given collection of nm media atequally spaced times during the overall interval froai 0 to 2.32 ms (corresponding to a
scaled time interval of 0.0 to 0.5 scaled mis). The first curve of the pair was assumed to be
a standard with a yield of 100 kt, and cube-root scaling was used to find the yield of thesecond explosion. Next, the square (AW) 2 of the difference in yields was computed foreach ordered pair of curves. The differences were then summed over all ordered pairs in
78

the collection. This process was repeated for each time point in the overall interval from
0 to 2.32 ms.We then used these individual sums to evaluate all possible candidate intervals t, !5
t < t2 . For each candidate interval, 1Z(AW) 2 /N was calculated, where the sum was over
all N titn' points within the candidlat.e interval. If N is lrCateld asa a, djustatle parameter,
this sum is minimized for N = 1, namely that tine for which IAWI was smallest. If instead
the length N of the measurement interval is regarded as fixed, the optimal location of the
interval can be determined. Figures 13 and 14 show the optimal location of the interval as
a function of N. For silicates, these intervals are roughly centered about 0.5 ms, whereas
for c(arhonatA's, the optirnal intervals are centered near 0.8 iris. These results are consistent
with the locations of the niccks in the lRVI' curv's shown in lFigures II and 12, and suggest
that merely identifying the ambient medium as a silicate or a carbonate can be used to
estimate the optimal interval for yield estimation.The procedure just described does not determine a unique optimal interval because
the RVT curves used were generated from a model, and thus do not include the errors
and uncertainties that would b' present in experimental shock-front RVT data. If such
uncertainties were part of the RVT record, the procedure described above would allow
the determination of the optimal length N as well as the optimal location of the interval
ft)r .vicld c:;tinat 121 in a givenr collection of mcdia. To illustrate the procedure, we modelexperimental error by including a second term n( (h W) 2/N in the quantity to be minimized,
where 6W is a characteristic fractional error in the yield. Incorporating this term does not
change the location of the best interval for a given interval length, i.e., the intervals shown
in Figures 13 and 14 remain the best choices. It does, however, allow a determination of
the optimal interval length, and hence the overall best interval.
We examine the results for several values of the fractional yield error 6W. For each
value of 6W, the optimal interval is determined by minimizing the quantity
' [Z AW )2 4. n, (6W ) 2]
The results for 6W = 0, 10, 20, 30, 50, 80, and 100 kt are shown for silicates in Figure 15
and for carbonates in Figure 16. For 6W = 0, the optimal interval has length 0 (N = 1);
that is, the minimum occurs for a single point in time and not an extended interval, as
expected. For 6W > 0, there is an optirmal interval of non-zero length, whose size depends
on 6W. For explosi, 4s in silicates, for example, the optimal interval for 6W = 30 kt has
length • 0.46 irLs, and begins at ti -_ 0.33 ms.
CONCLUSIONS
We find that variations in the effective adiabatic index of the source material can
cause the inferred yield of spherically symmetric explosions to vary by as much as 26%
79
at 0.1 scaled ms. These variations may be a significant source of uncertainty in hydro-
dynamic yield estimates when the hydrodynamic method is used in a treaty-verification
context, 'rnce detailed properties of the source are not expected to be available to the
treaty monitoring party. Our results for explosions in granite agree generally with those
of Morar & Goldwire (1990) for explosions in rhyolite. The pressure profiles within the
source region of all the explosions we simulated are very similar at late times. Using this
empirical result, we constructed a simple formula for the dependence of the inferred yield
on the effective adiabatic index and the initial radius of an ideal-gas source by considering
the energy that remains trapped in the source region at the time the yield is estimated.
In studying further the issue of an optimal interval for yield estimation, we find that a
simple examination of equation-of-state data can help to determine what interval of shock
front RVT data should be used to minimize the uncertainty in a given hydrodynamic yield
estimate. For the collections of silicates and carbonates examined here, there is an interval
during which yield estimates are relatively insensitive to the medium, yet still sensitive
to the yield. The procedure described in this paper could be improved by replacing the
simple linear Hugoniots used to generate the RVT curves for each medium with more
accurate piecewise-linear Hugoniots. A more accurate statistical analysis would require
detailed simulation of the errors present in experimental RVT curves, the uncertainties in
the properties of the ambient media and the source, and the correlations present in the
radius vs. time data.
ACKNOWLEDGEMENTS
We thank Steve Peyton arid Jim Baker of S-CUBED Corporation for kindly providing
the modified SESAME equation of Atate tables used in our simulations. We also thank Bill
Moran for helpful discussions regarding iumerical equations of state, source parameters,
and yield estimation and Tom Ahrens for helpful discussion of Hugoniots and the equations
of state of geologic media.
ISO
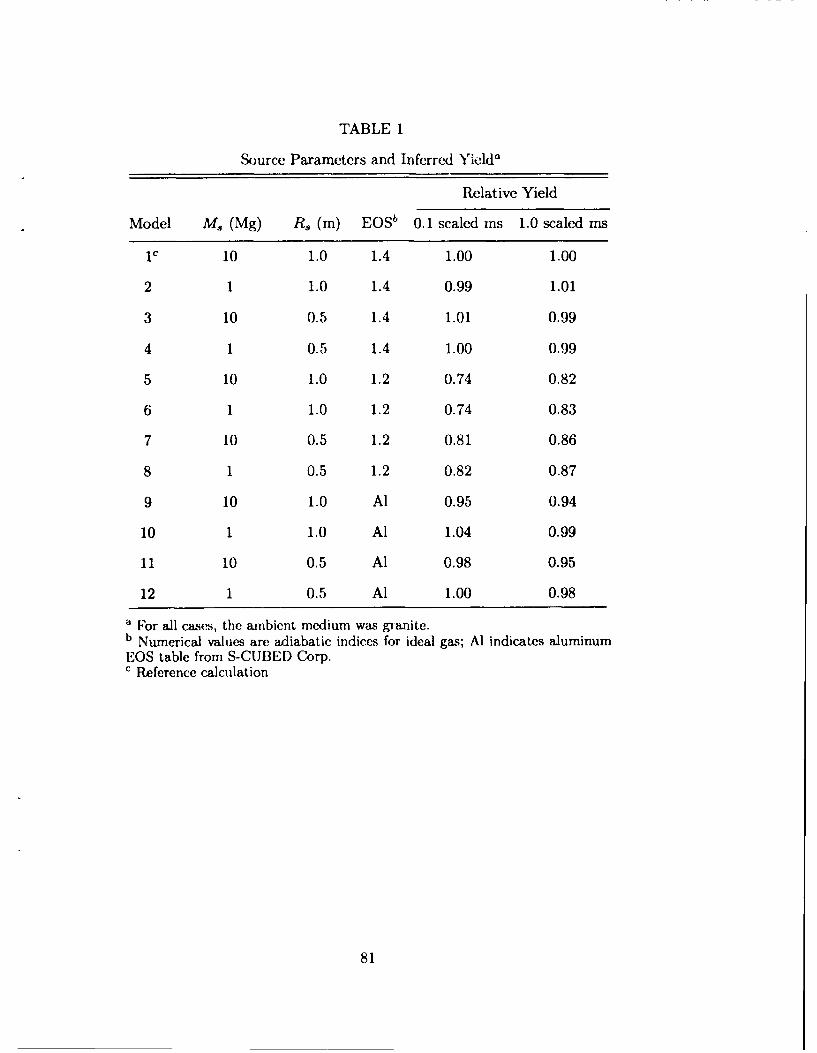
TABLE 1
Source Parameters and Inferred Yielda
Relative Yield
Model M, (Mg) R, (m) EOSb 0.1 scaled ms 1.0 scaled ms
1C 10 1.0 1.4 1.00 1.00
2 1 1.0 1.4 0.99 1.01
3 10 0.5 1.4 1.01 0.99
4 1 0.5 1.4 1.00 0.99
5 10 1.0 1.2 0.74 0.82
6 1 1.0 1.2 0.74 0.83
7 10 0.5 1.2 0.81 0.86
8 1 0.5 1.2 0.82 0.87
9 10 1.0 Al 0.95 0.94
10 1 1.0 Al 1.04 0.99
11 10 0.5 Al 0.98 0.95
12 1 0.5 Al 1.00 0.98
a For all cases, the ambient medium was granite.b Numerical values are adiabatic indices for ideal gas; Al indicates aluminum
EOS table from S-CU13ED Corp.Reference calculation
81

TABLE 2
Silicate Equations of State'
Rock p0 (kg m- 3) A (kms-') B Reference
Westerly granite 2627 2.103 1.629 McQueen et al. [1967]
Weathered granite 2631 2.66 1.49 Ahrcns et a]. [1991]
Granite 2600 3.75 1.28 Trunin et al. [1988]
Biotite-chlorite granite 2680 2.22 1.63 van Thiel [1977]
Quartz (high u) 2650 4.659 1.226 Trunin et al. [1971a],
Al'tshuler et al. [1977]
Fused quartz 2200 1.143 1.603 Wackerle [1962],
Jones et al. [1968],
Trunin et al. [1971b]
Vacaville basalt 2860 2.31 1.615 Jones ct al. [1968]
Tuff 2740 2.69 1.556 Trunin et al. [1988]
Wet tuff 2200 3.0 1.11 Bass [1966]
Dry tuff 1600 0.4 1.3 Bass [1966]
Dry alluvium 1780 1 1.4 Pcrrct and Bass [1975]
'The quantities Po, A, and B are the unshocked density and the parameters in the flugoniotD= A+Bu.
82
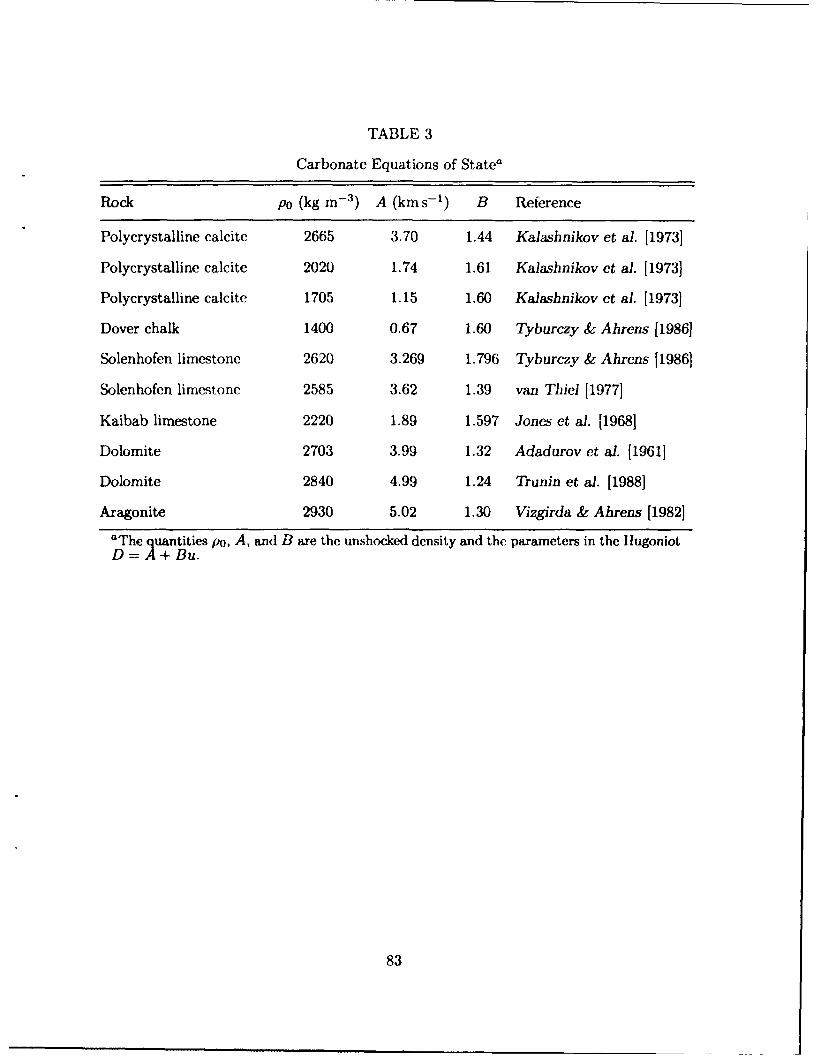
TABLE 3
Carbonate Equations of State'
Rock P0 (kg m- 3) A (kms-1 ) B Reference
Polycrystalline calcite 2665 3.70 1.44 Kalashnikov et a]. [1973]
Polycrystalline calcite 2020 1.74 1.61 Kalashnikov ct a]. [1973]
Polycrystalline calcite 1705 1.15 1.60 Kalashnikov et a]. [19731
Dover chalk 1400 0.67 1.60 Tyburczy &- Ahrens [1986]
Solenhofen limestone 2620 3.269 1.796 Tyburczy & Ahrens [1986]
Solenhofen limestone 2585 3.62 1.39 van Thiel [1977]
Kaibab limestone 2220 1.89 1.597 Jones et a). [1968]
Dolomite 2703 3.99 1.32 Adadurov et al. [1961]
Dolomite 2840 4.99 1.24 Trunin et al. [1988]
Aragonite 2930 5.02 1.30 Vizgirda & Ahrens [1982]
a The quantities p0, A, and B are the unshocked density and the parameters in the lHugoniotD=A+Bu.
83
REFERENCES
Adadurov, G. A., D. B. Balashov, and A. N. Dremin, A study of the volumetric
compressibility of marble at high pressures, Bull. Acad. Sei. USSR Geophys. Ser., 5,
463-466, 1961.
Ahrens, T. J., A. M. Rubin, T. S. Duffy, and T. Sekine, Shock propagation in crustal
rock. Chapter I: compression and isentropic release of granite, Final Technical Report,
Contract F19628-88-K-0034, Geophysics Laboratory, Hanscom Air Force Base, April
1991. PL-TR-91-2096, ADA239548
Al'tshuler, L. V., N. N. Kalitikin, L. V. Kuzmina, and B. S. Chekin, Shock adiabats for
ultrahigh pressures, Soy. Phys.-JETP 45, 167-171, 1977.
Bass, R. C., Rep. SC-RR-66-548, Sandia Corp., Albuquerque, N. M., 1966.
Jones, A. H., W. M. Isbell, F. H. Shipman, R. D. Perkins, S. J. Green, and C. J. Maiden,
Material properties measurements for selected materials, Interim report, Contract
NAS2-3427, General Motors Technical Center, Warren, Mich., April 1968.
Kalashnikov, N. G., M. N. Pavlovskiy, G. V. Simakov, and R. F. Trunin, Dynamic
compressibility of calcite-group minerals, Izv. Acad. Sci. USSR Phys. Solid Earth, 2,
23-29, 1973.
Lamb, F. K., An approximate solution for ground shock propagation, University of Illinois
Program in Arms Control, Disarmament, and International Security, Rep. WP-2-87-2,
February 1987.
Lamb, F. K., B. W. Callen, and J. D. Sullivan, Insensitive interval in the evolution of shockwaves from underground nuclear explosions, Dept. of Physics, University of Illinois at
Urbana-Champaign, Rep. P/89/5/77, May 1989.
Lamb, F. K., B. W. Callen, and J. D. Sullivan, An approximate analytical model of shockwaves from underground nuclear explosions, J. Geophys. Res., 97, 515-535, 1992.
McQueen, R. G., S. P. Marsh, and J. N. Fritz, Hugoniot equation of state for twelve rocks,
J. Geophys. Res., 72, 4999-5036, 1967.
Moran, B., and H. C. Goldwire, Jr., Effect of source modeling on the inferred yield from
an underground nuclear explosion, in Shock Compression of Condensed Matter--1989,
edited by S. C. Schmidt, J. N. Johnson, and L. W. Davison, pp. 645 648, North Holland,
New York, 1990.
Norman, M. L., Ph.D. thesis, University of California at Davis, Lawrence Livermore Natl.
Lab. Report UCRL-52946, 1980.
Norman, M. L., J. Wilson, and R. Barton, A new calculation on rotating protostar collapse,
Astrophys. J., 239, 968- 981, 1980.
Norman, M. L., and K.-H. Winkler, in Astrophysical Radiation Hydrodynamics, edited by
K.-H. Winkler and M. Norman, Reidel, Dordrccht, 1986.
84

Perret, W. R., and R. C. Bass, Free-field ground motion induced by undergroundexplosions, Sandia National Laboratory, Rep. SAND74-0252, February 1975.
Stone, J. M., and M. L. Norman, ZEUS-2D: A radiation hydrodynamics code forastrophysical flows in two spatial dimensions. I. the hydrodynamics algorithms andtests, Astrophys. J. Suppl., 80, no. 2, June 1992.
Trunin, R. F., G. V. Simakov, I. P. Dudoladov, G. S. Telegin, and I. P. Trusov, Rockcompressibility in shock waves, Izv. Acad. Sci. USSR Phys. Solid Earth, 24, 38-42,1988.
Trunin, R. F., G. V. Simakov, and M. A. Podurets, Compression of porous quartz by strongshock waves, Izv. Acad. Sci. USSR Phys. Solid Earth, 7,102-106, 1971b.
rnRin, R. F., G. V. Sitnakov, M. A. Podurets, B. N. Moiscyev, and L. V. Popov, Dynamriic
compressibility of quartz and quartzite at high pressures, Izv. Acad. Sci. USSR Phys.Solid Earth, 7, 8-12, 1971a.
Tyburczy, J. A., and T. J. Ahrens, Dynamic compression and volatile release of carbonates,
J. Gcophys. Res., 91, 4730 4744, 1986.van Leer, B., Towards the ultimate conservative difference scheme. IV. A new approach to
numerical convection, J. Comp. Phys., 23, 276-299, 1977.van Thiel, M., J. Shaner, and E. Salinas, Rep. UCRL-50108, vol. 3, Lawrence Livermore
National Laboratory; Livermore, Calif., 1977.Vizgirda, J., and T. J. Ahrens, Shock compression of aragonite and implications for the
equation of state of carbonates, J. Geophyb. Res., 87, 4747-4758, 1982.von Neumann, J., and R. D. Richtmeyer, A method for the numerical calculation of
hydrodynamic shocks, J. Appl. Phys., 21, 232-237, 1950.Wackerle, J., Shock-wave compression of quartz, J. Appl. Phys. 33, 922 937, 1962.
85

0.20
0.15
> 0.10
0
0.05
0.00 -
-0.050 10 20 30 40
Rsedov (M)
Figure 1
86

Radius (m, for t,)0 1 2 3 4 5
10I
II
' i'II I
---- A-
10-
10°
- I .DI-
3° /t ZeustI Sedov
.... ./ . t2 Zeus' "'"2 Sedov
10 -41 1/
0 10 20 30 40
Radius (m, for t2)
Figure 2
87
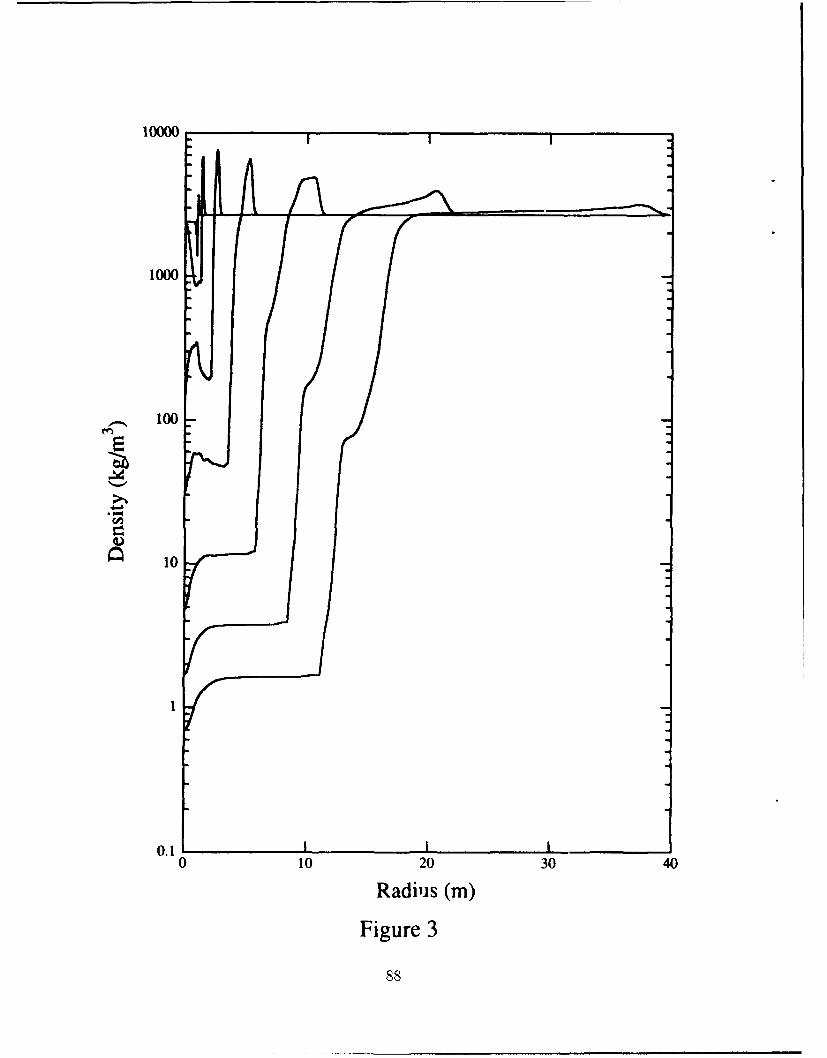
10000
1000
•, 100
CO)
10
0.1 i0 10 20 30 40
Radius (m)
Figure 3
88

5000
4000
.'• 2000
0
1000
0
-1000 I I0 10 20 30 40
Radius (m)
Figure 4
89

io'4
1o3
104
1012
S111
10
10
10 I I
0 10 20 30 40
Radius (m)
Figure 5
90

1.15
Source: '= 1.4- Ms= 10 Mg, Rs = 1.0m
- MS. = 10 Mg, Rs = 0.5 m
-•MS= 1Mg,Rs=1.OmIl1.10 .... Ms = 1 Mg,Rs =0.5 m-
CI
S1.00
|191
II i
IqL
SII p1.05 . . .. . .
0.95 I I III
0.0 0.2 0.4 0.6 0.8 1.0 1.2
Time (scaled ins)
Figure 6
91

1.0 I
Source: 'y= 1 .2M- M= 10OMg, RS= 1.0Om
Ms ---M= 10OMg, R =O0.5 m
M l Mg,RS=1.Om0.9- .- MS= 1Mg,RS=O.5m
10
0.7
0.60.0 0.2 0.4 0.6 0.8 1.0 1.2
Time (scaled ins)
Figure 7
92

1.20
Source: aluminum
- Ms= 10 Mg, Rs= 1.Om
1.15 .Ms = 10 Mg, Rs = 0.5 m
Ms= lMg,Rs=1.Om
Ms= 1Mg, Rs=0.5 m
1.10
1.05 IA
ItIItI A o
0.9 I1 .00020406 . . .
*I%
-------------------------.
0.95
0.(K)o'0.0) 0.2 0.4 0.6 0.8 H) .01.2
Figure 8
93

Silicates8
L=3.31 T 0.4
4) 4
* Westerly granite [McQueen et al. 1967]* Granite [Trunin 1988]o Weathered granite [Ahrens et al. 1991 ]* Biotite-chlorite granite [van Thiel 1977]x Vacaville basalt [Jones et al. 1968]* Tuff [Trunin 1988]
2 * Wet tuff [Bass 19661+ Dry alluvium [Perret and Bass 1975]* a-quartz [Trunin et al. 197 1a,
AI'tshuler et al. 1977]o Fused quartz [Wackerle 1962,
Jones et al. 1968, Trunin et al. 1971 b]
! I II2 4 6 8
Characteristic Time T (s)
Figure 9
94

14
Carbonates
12 -
L =3.40 T0.45
10
- -
U 6
o Dolomite [Adadurov et al., 19611* Dolomite [Trunin et al., 19881
4 - x Kaibab Limestone [Jones et al., 1968]* Aragonite [Vizgirda and Ahrens, 1982]o Solenhofen Limestone [van Thiel, 1977]* Solehofen Limestone [Tyburczy and Ahrens, 19861* Dover Chalk [Tyburczy and Ahrens, 1986]o Polycrystalline calcite [Kalashnikov et al., 1973]
2 1 I0 5 10 15 20
Characteristic Time T (ms)
Figure 10
95

9*1 * S* ' S
* % S* *% * S
* ' S9'. 4.)
* 9% 5 -
'St 4.)'SI
II !. �
'I N c�¶I.% S�
%% S
Y C4��9. C.. � 4.) 0�9. 5
9. f*' � 0 ri�
9. '� �St S
I.. *9. 5-
9. '.� �9. ' S
9. S 4.)-9.
9. I�"9. �1S �
9. *5 �4.)'��%i..S -
9. '� �
9. '.
9. '.�.'9., '.9 *
9. "9.'.5
9. "..lh.� II:K� 29. "vS 9 '.-9.
9.9. '.5
9. .. 5 E9.'.. .5-r�-4
'9
'9
'99.5.5
.5S.S.
S.S.S.S..S.S.II S tr�
9S* 0
S
9
I-
o A5-
Ct)
0 05- 5-
(w) SflW�>J
96

0 t
%- %* *-SZ -
~'1.'-%%1~
S5 o%)C 000~ -
%z *n
%4>~ ~
0t
4--
u6
0C
(wn) snip1uj
97
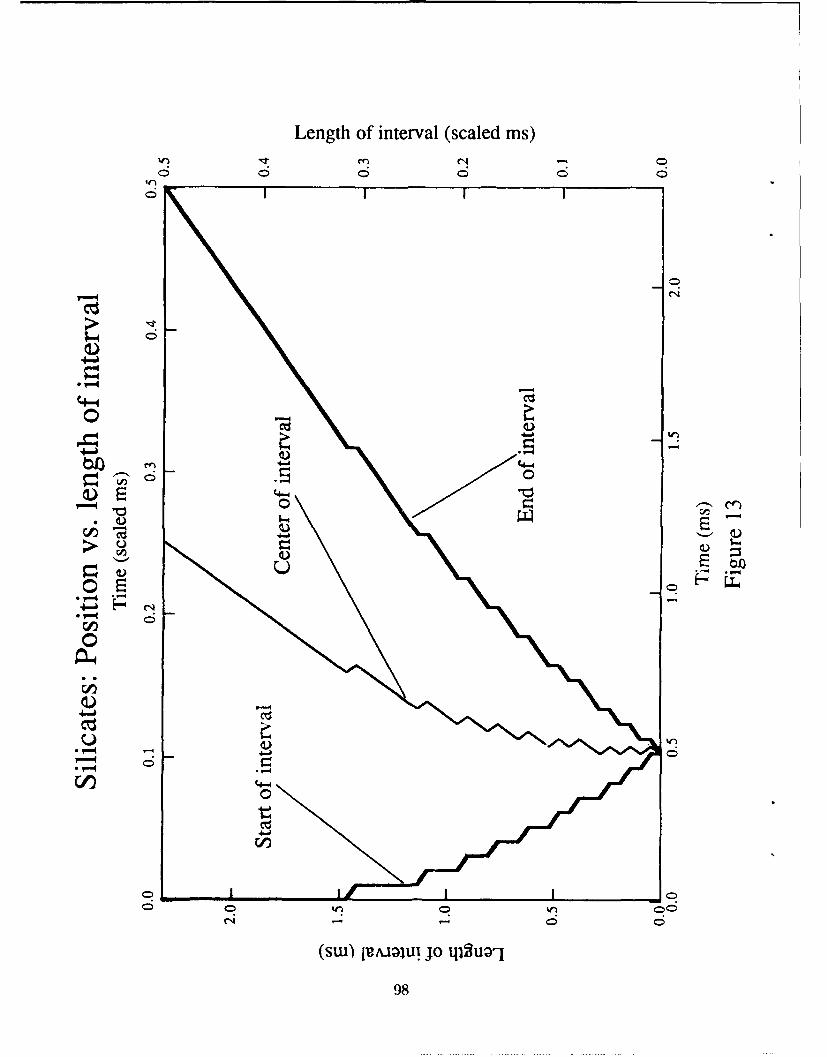
Length of interval (scaled ins)
0
Cz 0
00
-4-00 ci,0
_ ' -ý
(SW)j'9A~jUIJO q2'Q4
O98

Length of interval (scaled ms)
Cli
o4-4
o1 0
026 I
-4-
00
ou
M.
6
40
0ý 1 00
(SuW) IRA1Ju! JO qj2uO-9
99

00
6 o
00
00
0 0
-• 0
4-J
r:3: 000
II
N/[•(• d)u + (z V5:
100

00
000
00
000
101)
DISTRIBUTION LIST
Prof. Thomas Ahrens Dr. T.J. BennettSeismological Lab, 252-21 S-CUBEDDivision of Geological & Planetary Sciences A Division of Maxwell LaboratoriesCalifornia Institute of Technology 11800 Sunrise Valley Drive, Suite 1212Pasadena, CA 91125 Reston, VA 22091
Prof. Keiiti Aid Dr. Robert BlandfordCenter for Earth Sciences AFTAC1Tr, Center for Seismic StudiesUniversity of Southern California 1300 North 17th StreetUniversity Park Suite 1450Los Angeles, CA 90089-0741 Arlington, VA 22209-2308
Prof. Shelton Alexander Dr. G.A. BollingerGeosciences Department Department of Geological Sciences403 Deike Building Virginia Polytechnical InstituteThe Pennsylvania State University 21044 Derring HallUniversity Park, PA 16802 Blacksburg, VA 24061
Dr. Ralph Alewine, IEl Dr. Stephen BrattDARPA/NMRO Center for Seismic Studies3701 North Fairfax Drive 1300 North 17th StreetArlington, VA 22203-1714 Suite 1450
Arlington, VA 22209-2308
Prof. Charles B. Archambeau Dr. Lawrence BurdickCIRES Woodward-Clyde ConsultantsUniversity of Colorado 566 El Dorado StreetBoulder, CO 80309 Pasadena, CA 91109-3245
Dr. Thomas C. Bache, Jr. Dr. Robert BurridgeScience Applications Int'l Corp. Schlumberger-Doll Research Center10260 Campus Point Drive Old Quarry RoadSan Diego, CA 92121 (2 copies) Ridgefield, CT '06877
Prof. Muawia Barazangi Dr. Jerry CarterInstitute for the Study of the Continent Center for Seismic StudiesCornell University 1300 North 17th StreetIthaca, NY 14853 Suite 1450
Arlington, VA 22209-2308
Dr. Jeff Barker Dr. Eric ChaelDepartment of Geological Sciences Division 9241State University of New York Sandia Laboratoryat Binghamton Albuquerque, NM 87185
Vestal, NY 13901
Dr. Douglas R. Baumgardt Prof. Vernon F. CormierENSCO, Inc Department of Geology & Geophysics5400 Port Royal Road U-45, Room 207Springfield, VA 22151-2388 University of Connecticut
Storrs, CT 06268
Dr. Susan Beck Prof. Steven DayDepartment of Geosciences Department of Geological SciencesBuilding #77 San Diego State UniversityUniversity of Arizona San Diego, CA 92182Tuscon, AZ 85721

darvin Denny Dr. Cliff FrolichJ.S. Department of Energy Institute of Geophysics)ffice of Arms Control 8701 North Mopac/Vashington, DC 20585 Austin, TX 78759
)r. Zoltan Der Dr. Holly Given.NSCO, Inc. IGPP, A-025i400 Port Royal Road Scripps Institute of Oceanographypringfield, VA 2215 1-2388 University of California, San DiegoLa Jolla, CA 92093
"hrof. Adam Dziewonski Dr. Jeffrey W. Given-Ioffman Laboratory, Harvard University SAIC)ept. of Earth Atmos. & Planetary Sciences 10260 Campus Point Drive!0 Oxford Street San Diego, CA 92121-ambridge, MA 02138
3rof. John Ebel Dr. Dale GloverDepartment of Geology & Geophysics Defense Intelligence Agency3oston College ATTN: ODT- 1B"Thesmut Hill, MA 02167 Washington, DC 20301
ý_:ric Fielding Dr. Indra Gupta3NEE Hall Teledyne GeotechNSTOC 314 Montgomery Street-ormell University Alexanderia, VA 22314[thaca, NY 14853
Dr. Mark D. Fisk Dan N. Hagedonq4ission Research Corporation Pacific Northwest Laboratories735 State Street Battelle Boulevard?.O. Drawer 719 Richland, WA 99352Santa Barbara, CA 93102
Prof Stanley Flatte Dr. James HannonApplied Sciences Building Lawrence Livermore National LaboratoryUniversity of California, Santa Cruz P.O. Box 808Santa Cruz, CA 95064 L-205
Livermore, CA 94550
Dr. John Foley Dr. Roger Hansen•4ER-Geo Sciences HQ AFTAC[ITR1100 Crown Colony Drive Patrick AFB, FL 32925-6001ýuincy, MA 02169
Prof. Donald Forsyth Prof. David G. HarkriderDepartment of Geological Sciences Seismological LaboratoryBrown University Division of Geological & Planetary SciencesProvidence, RI 02912 Califonia Institute of Technology
Pasadena, CA 91125
Dr. Art Frankel Prof. Danny HarveyU.S. Geological Survey CIRES)22 National Center University of ColoradoReston, VA 22092 Boulder, CO 80309
Prof. Donald V. Heimberger Prof. Charles A. LangstonSeismological Laboratory Geosciences DepartmentDivision of Geological & Planetary Sciences 403 Deike BuildingCalifornia Institute of Technology The Pennsylvania State UniversityPasadena, CA 91125 University Park, PA 16802
Prof. Eugene Herrin Jim Lawson, Chief GeophysicistInstitute for the Study of Earth and Man Oklahoma Geological SurveyGeophysical Laboratory Oklahoma Geophysical ObservatorySouthern Methodist University P.O. Box 8Dallas, TX 75275 Leonard, OK 74043-0008
Prof. Robert B. Herrmann Prof. Thorne LayDepartment of Earth & Atmospheric Sciences Institute of TectonicsSt. Louis University Earth Science BoardSt. Louis, MO 63156 University of California, Santa Cruz
Santa Cruz, CA 95064
Prof. Lane R. Johnson Dr. William LeithSeismographic Station U.S. Geological SurveyUniversity of California Mail Stop 928Berkeley, CA 94720 Reston, VA 22092
Prof. Thomas H. Jordan Mr. James F. LewkowiczDepartment of Earth, Atmospheric & Phillips Laboratory/GPEHPlanetary Sciences Hanscom AFB, MA 01731-5000( 2 copies)
Massachusetts Institute of TechnologyCambridge, MA 02139
Prof. Alan Kafka Mr. Alfred LiebermanDepartment of Geology & Geophysics ACDA/VI-OA State Department BuildingBoston College Room 5726Chestnut Hill, MA 02167 320-21st Street, NW
Washington, DC 20451
Robert C. Kemerait Prof. L. Timothy LongENSCO, Inc. School of Geophysical Sciences445 Pineda Court Georgia Institute of TechnologyMelbourne, FL 32940 Atlanta, GA 30332
Dr. Max Koontz Dr. Randolph Martin, IIIU.S. Dept. of Energy/DP 5 New England Research, Inc.Forrestal Building 76 Olcott DriveL000 Independence Avenue White River Junction, VT 05001Washington, DC 20585
)r. Richard LaCoss Dr. Robert MasseilT Lincoln Laboratory, M-200B Denver Federal Building
1.O. Box 73 Box 25046, Mail Stop 967.xington, MA 02173-0073 Denver, CO 80225
)r. Fred K. Lamb Dr. Gary McCartorJniversity of Illinois at Urbana-Champaign Department of Physics)epartment of Physics Southern Methodist University110 West Green Street Dallas, TX 75275Trbana, IL 61801
3

hrof. Thomas V. McEvilly Prof. John A. Orcutt;eismographic Station IGPP, A-025Jniversity of California Scripps Institute of Oceanographylerkeley, CA 94720 University of California, San Diego
La Jolla, CA 92093
)r. Art McGarr Prof. Jeffrey ParkJ.S. Ge logical Survey Kline Geology Laboratoryvlail Stop 977 P.O. Box 6666J.S. Geological Survey New Haven, CT 06511-8130vienlo Park, CA 94025
)r. Keith L. McLaughlin Dr. Howard Patton3-CUBED Lawrence Livermore National LaboratoryN Division of Maxwell Laboratory L-025?.O. Box 1620 P.O. Box 808L.a Jolla, CA 92038-1620 Livermore, CA 94550
3tephen Miller & Dr. Alexander Florence Dr. Frank Pilotte3RI International HQ AFTAC/IT7333 Ravenswood Avenue Patrick AFB, FL 32925-6001Box AF 116Menlo Park, CA 94025-3e.93
Prof. Bernard Minster Dr. Jay J. Pulli[GPP, A-025 Radix Systems, Inc.Scripps Institute of Oceanography 2 Taft Court, Suite 203University of California, San Diego Rockville, MD 20850La Jolla, CA 92093
Prof. Brian J. Mitchell Dr. Robert ReinkeDepartment of Earth & Atmospheric Sciences ATN: FCTVTDSt. Louis University Field CommandSt. Louis, MO 63156 Defense Nuclear Agency
Kirtland AFB, NM 87115
Mr. Jack Murphy Prof. Paul G. RichardsS-CUBED Lamont-Doherty Geological ObservatoryA Division of Maxwell Laboratory of Columbia University11800 Sunrise Valley Drive, Suite 1212 Palisades, NY 10964Reston, VA 22091 (2 Copies)
Dr. Keith K. Nakanishi Mr. Wilmer RiversLawrence Livermore National Laboratory Teledyne GeotechL-025 314 Montgomery StreetP.O. Box 808 Alexandria, VA 22314Livermore, CA 94550
Dr. Carl Newton Dr. George RotheLos Alamos National Laboratory HQ AFTACl"TRP.O. Box 1663 Patrick AFB, FL 32925-6001Mail Stop C335, Group ESS-3Los Alamos, NM 87545
Dr. Bao Nguyen Dr. Alan S. Ryall, Jr.HQ AFTACfTlR DARPA/NMROPatrick AFB, FL 32925-6001 3701 North Fairfax Drive
Arlington, VA 22209-1714
4

Dr. Richard Sailor Donald L. SpringerTASC, Inc. Lawrence Livermore National Laboratory55 Walkers Brook Drive L-025Reading, MA 01867 P.O. Box 808Livermore, CA 94550
Prof. Charles G. Sammis Dr. Jeffrey StevensCenter for Earth Sciences S-CUBEDUniversity of Southern California A Division of Maxwell LaboratoryUniversity Park P.O. Box 1620Los Angeles, CA 90089-0741 La Jolla, CA 92038-1620
Prof. Christopher H. Scholz Lt. Col. Jim StobieLamont-Doherty Geological Observatory ATIN: AFOSR/NLof Columbia University Boiling AFBPalisades, CA 10964 Washington, DC 20332-6448
Dr. Susan Schwartz Prof. Brian StumpInstitute of Tectonics Institute for the Study of Earth & Man1156 High Street Geophysical LaboratorySanta Cruz, CA 95064 Southern Methodist UniversityDallas, TX 75275
Secretary of the Air Force Prof. Jeremiah Sullivan(SAFRD) University of Illinois at Urbana-ChampaignWashington, DC 20330 Department of Physics1110 West Green StreetUrbana, IL 61801
Office of the Secretary of Defense Prof. L. SykesDDR&E Lamont-Doherty Geological ObservatoryWashington, DC 20330 of Columbia UniversityPalisades, NY 10964
Thomas J. Sereno, Jr. Dr. David TaylorScience Application Int'l Corp. ENSCO, Inc.10260 Campus Point Drive 445 Pineda CourtSan Diego, CA 92121 Melbourne, FL, 32940
Dr. Michael Shore Dr. Steven R. TaylorDefense Nuclear Agency/SPSS Los Alamos National Laboratory6801 Teiegraph Road P.O. Box 1663Alexandria, VA 22310 Mail Stop C335Los Alamos, NM 87545
Dr. Matthew Sibol Prof. Clifford ThurberVirginia Tech University of Wisconsin-MadisonSeismological Observatory Department of Geology & Geophysics4044 Derring Hall 1215 West Dayton StreetBlacksburg, VA 24061-0420 Madison, WS 53706
Prof. David G. Simpson Prof. M. Nafi ToksozIRIS, Inc. Earth Resources Lab1616 North Fort Myer Drive Massachusetts Institute of TechnologySuite 1440 42 Carleton StreetArlington, VA 22209 Cambridge, MA 02142

Dr. Larry Turnbull DARPA/RMO/SECURITY OFFICECIA-OSWR/NED 3701 North Fairfax DriveWashington, DC 20505 Arlington, VA 22203-1714
Dr. Gregory van der Vink HQ DNAIRIS, Inc. ATM: Technical Library1616 North Fort Myer Drive Washington, DC 20305Suite 1440Arlington, VA 22209
Dr. Karl Veith Defense Intelligence AgencyEG&G Directorate for Scientific & Technical Intelligence5211 Auth Road ATTN: DTIBSuite 240 Washington, DC 20340-6158Suitland, MD 20746
Prof. Terry C. Wallace Defense Technical Information CenterDepartment of Geosciences Cameron StationBuilding #77 Alexandria, VA 22314 (2 Copies)University of ArizonaTuscon, AZ 85721
Dr. Thomas Weaver "ACTECLos Alamos National Laboratory Battelle Memorial InstituteP.O. Box 1663 505 King AvenueMail Stop C335 Columbus, OH 43201 (Final Report)Los Alamos, NM 87545
Dr. William Wortman Phillips LaboratoryMission Research Corporation ATTN: XPG8560 Cinderbed Road Hanscom AFB, MA 01731-5000Suite 700Newington, VA 22122
Prof. Francis T. Wu Phillips LaboratoryDepartment of Geological Sciences ATTN: GPEState University of New York Hanscom AFB, MA 01731-5000at Binghamton
Vestal, NY 13901
AFTAC/CA Phillips Laboratory(STINFO) ATTN: TSMLPatrick AFB, FL 32925-6001 Hanscom AFB, MA 01731-5000
DARPA/PM Phillips Laboratory3701 North Fairfax Drive ATTN: SULArlington, VA 22203-1714 Kirtland, NM 87117 (2 copies)
DARPA/RMO/RETRIEVAL Dr. Michel Bouchon3701 North Fairfax Drive I.R.I.G.M.-B.P. 68Arlington, VA 22203-1714 38402 St. Martin D'Heres
Cedex, FRANCE
6

Dr. Michel Campillo Dr. Jorg SchlittenhardtObservatoire de Grenoble Federal nsdtute for Geosciences & Nat'l Res.I.R.I.G.M.-B.P. 53 Postfach 51015338041 Grenoble, FRANCE D-3000 Hannover 51, GERMANY
Dr. Kin Yip Chun Dr. Johannes SchweitzerGeophysics Division Institute of GeophysicsPhysics Department Ruhr University/B1ochumUniversity of Toronto P.O. Box 1102148Ontario, CANADA 4360 Bochum 1, GERMANY
Prof. Hans-Peter HarjesInstitute for GeophysicRuhr University/BochumP.O. Box 1021484630 Bochum 1, GERMANY
Prof. Eystein HusebyeNTNF/NORSARP.O. Box 51N-2007 Kjeller, NORWAY
David JepsenActing Head, Nuclear Monitoring SectionBureau of Mineral ResourcesGeology and GeophysicsG.P.O. Box 378, Canberra, AUSTRALIA
Ms. Eva JohannissonSenior Research OfficerNational Defense Research Inst.P.O. Box 27322S-102 54 Stockholm, SWEDEN
Dr. Peter MarshallProcurement ExecutiveMinistry of DefenseBlacknest, BrimiptonReading FG7-FRS, UNITED KINGDOM
Dr. Bernard Massinon, Dr. Pierre MechlerSociete Radiomana27 rue Claude Bernard75005 Paris, FRANCE (2 Copies)
Dr. Svein MykkeltveitNTNT/NORSARP.O. Box 51N-2007 Kjeller, NORWAY (3 Copies)
Prof. Keith PriestleyUniversity of CambridgeBullard Labs, Dept. of Earth SciencesMadingley Rise, Madingley RoadCambridge CB3 OEZ, ENGLAND