D-shuttle project - arxiv.org · PDF fileMidori-ku, Yokohama, Kanagawa 226-0014, Japan 26ZS Nr...
21
Measurement and comparison of individual external doses of high-school students living in Japan, France, Poland and Belarus – the “D-shuttle” project – Adachi, N., 1 Adamovitch, V., 2 Adjovi, Y., 3 Aida, K., 4 Akamatsu, H., 5 Akiyama, S., 6 Akli, A., 7 Ando, A., 8 Andrault, T., 9 Antonietti, H., 3 Anzai, S., 10 Arkoun, G., 3 Avenoso, C., 11 Ayrault, D., 9 Banasiewicz, M., 12 Bana´ skiewicz, M., 13 Bernardini, L., 11 Bernard, E., 7 Berthet, E., 11 Blanchard, M., 3 Boreyko, D., 14 Boros, K., 15 Charron, S., 16 Cornette, P., 9 Czerkas, K., 15 Dameron, M., 11 Date, I., 17 De Pontbriand, M., 3 Demangeau, F., 9 Dobaczewski, L., 18 Dobrzy´ nski, L., 19 Ducouret, A., 3 Dziedzic, M., 20 Ecalle, A., 9 Edon, V., 9 Endo, K., 21 Endo, T., 21 Endo, Y., 21 Etryk, D., 12 Fabiszewska, M., 18 Fang, S., 4 Fauchier, D., 9 Felici, F., 7 Fujiwara, Y., 10 Gardais, C., 9 Gaul, W., 20 Gurin, L., 9 Hakoda, R., 22 Hamamatsu, I., 6 Handa, K., 10 Haneda, H., 10 Hara, T., 10 Hashimoto, M., 1 Hashimoto, T., 8 Hashimoto, K., 21 Hata, D., 1 Hattori, M., 10 Hayano, R., 23, * Hayashi, R., 22 Higasi, H., 5 Hiruta, M., 6 Honda, A., 6 Horikawa, Y., 8 Horiuchi, H., 24 Hozumi, Y., 17 Ide, M., 25 Ihara, S., 8 Ikoma, T., 24 Inohara, Y., 22 Itazu, M., 24 Ito, A., 8 Janvrin, J., 9 Jout, I., 11 Kanda, H., 5 Kanemori, G., 5 Kanno, M., 10 Kanomata, N., 10 Kato, T., 24 Kato, S., 24 Katsu, J., 5 Kawasaki, Y., 21 Kikuchi, K., 4 Kilian, P., 26 Kimura, N., 25 Kiya, M., 10 Klepuszewski, M., 15 Kluchnikov, E., 14 Kodama, Y., 5 Kokubun, R., 10 Konishi, F., 22 Konno, A., 6 Kontsevoy, V., 2 Koori, A., 6 Koutaka, A., 6 Kowol, A., 27 Koyama, Y., 4 Kozio l, M., 13 Kozue, M., 1 Kravtchenko, O., 14 Krucza la, W., 12 Kud la, M., 28 Kudo, H., 29 Kumagai, R., 24 Kurogome, K., 25 Kurosu, A., 29 Kuse, M., 25 Lacombe, A., 3 Lefaillet, E., 3 Magara, M., 17 Malinowska, J., 26 Malinowski, M., 18 Maroselli, V., 7 Masui, Y., 29 Matsukawa, K., 29 Matsuya, K., 17 Matusik, B., 20 Maulny, M., 9 Mazur, P., 27 Miyake, C., 29 Miyamoto, Y., 4 Miyata, K., 1 Miyata, K., 5 Miyazaki, M., 30 Mol¸eda,M., 20 Morioka, T., 1 Morita, E., 24 Muto, K., 1 Nadamoto, H., 5 Nadzikiewicz, M., 28 Nagashima, K., 29 Nakade, M., 22 Nakayama, C., 25 Nakazawa, H., 17 Nihei, Y., 4 Nikul, R., 2 Niwa, S., 8 Niwa, O., 30 Nogi, M., 6 Nomura, K., 29 Ogata, D., 8 Ohguchi, H., 31 Ohno, J., 24 Okabe, M., 17 Okada, M., 22 Okada, Y., 6 Omi, N., 25 Onodera, H., 10 Onodera, K., 25 Ooki, S., 21 Oonishi, K., 29 Oonuma, H., 10 Ooshima, H., 8 Oouchi, H., 1 Orsucci, M., 11 Paoli, M., 11 Penaud, M., 9 Perdrisot, C., 9 Petit, M., 9 Piskowski, A., 15 P locharski, A., 15 Polis, A., 13 Polti, L., 3 Potsepnia, T., 14 Przybylski, D., 12 Pytel, M., 28 Quillet, W., 9 Remy, A., 3 Robert, C., 9 Sadowski, M., 19 Saito, M., 10 Sakuma, D., 1 Sano, K., 5 arXiv:1506.06364v3 [physics.med-ph] 18 Nov 2015
Transcript of D-shuttle project - arxiv.org · PDF fileMidori-ku, Yokohama, Kanagawa 226-0014, Japan 26ZS Nr...

Measurement and comparison of individual external doses of high-school
students
living in Japan, France, Poland and Belarus
– the “D-shuttle” project –
Adachi, N.,1 Adamovitch, V.,2 Adjovi, Y.,3 Aida, K.,4 Akamatsu, H.,5 Akiyama, S.,6 Akli, A.,7
Ando, A.,8 Andrault, T.,9 Antonietti, H.,3 Anzai, S.,10 Arkoun, G.,3 Avenoso, C.,11 Ayrault, D.,9
Banasiewicz, M.,12 Banaskiewicz, M.,13 Bernardini, L.,11 Bernard, E.,7 Berthet, E.,11
Blanchard, M.,3 Boreyko, D.,14 Boros, K.,15 Charron, S.,16 Cornette, P.,9 Czerkas, K.,15
Dameron, M.,11 Date, I.,17 De Pontbriand, M.,3 Demangeau, F.,9 Dobaczewski, L.,18
Dobrzynski, L.,19 Ducouret, A.,3 Dziedzic, M.,20 Ecalle, A.,9 Edon, V.,9 Endo, K.,21 Endo, T.,21
Endo, Y.,21 Etryk, D.,12 Fabiszewska, M.,18 Fang, S.,4 Fauchier, D.,9 Felici, F.,7 Fujiwara, Y.,10
Gardais, C.,9 Gaul, W.,20 Gurin, L.,9 Hakoda, R.,22 Hamamatsu, I.,6 Handa, K.,10 Haneda, H.,10
Hara, T.,10 Hashimoto, M.,1 Hashimoto, T.,8 Hashimoto, K.,21 Hata, D.,1 Hattori, M.,10
Hayano, R.,23, ∗ Hayashi, R.,22 Higasi, H.,5 Hiruta, M.,6 Honda, A.,6 Horikawa, Y.,8
Horiuchi, H.,24 Hozumi, Y.,17 Ide, M.,25 Ihara, S.,8 Ikoma, T.,24 Inohara, Y.,22 Itazu, M.,24
Ito, A.,8 Janvrin, J.,9 Jout, I.,11 Kanda, H.,5 Kanemori, G.,5 Kanno, M.,10 Kanomata, N.,10
Kato, T.,24 Kato, S.,24 Katsu, J.,5 Kawasaki, Y.,21 Kikuchi, K.,4 Kilian, P.,26 Kimura, N.,25
Kiya, M.,10 Klepuszewski, M.,15 Kluchnikov, E.,14 Kodama, Y.,5 Kokubun, R.,10 Konishi, F.,22
Konno, A.,6 Kontsevoy, V.,2 Koori, A.,6 Koutaka, A.,6 Kowol, A.,27 Koyama, Y.,4 Kozio l, M.,13
Kozue, M.,1 Kravtchenko, O.,14 Krucza la, W.,12 Kud la, M.,28 Kudo, H.,29 Kumagai, R.,24
Kurogome, K.,25 Kurosu, A.,29 Kuse, M.,25 Lacombe, A.,3 Lefaillet, E.,3 Magara, M.,17
Malinowska, J.,26 Malinowski, M.,18 Maroselli, V.,7 Masui, Y.,29 Matsukawa, K.,29
Matsuya, K.,17 Matusik, B.,20 Maulny, M.,9 Mazur, P.,27 Miyake, C.,29 Miyamoto, Y.,4
Miyata, K.,1 Miyata, K.,5 Miyazaki, M.,30 Moleda, M.,20 Morioka, T.,1 Morita, E.,24 Muto, K.,1
Nadamoto, H.,5 Nadzikiewicz, M.,28 Nagashima, K.,29 Nakade, M.,22 Nakayama, C.,25
Nakazawa, H.,17 Nihei, Y.,4 Nikul, R.,2 Niwa, S.,8 Niwa, O.,30 Nogi, M.,6 Nomura, K.,29
Ogata, D.,8 Ohguchi, H.,31 Ohno, J.,24 Okabe, M.,17 Okada, M.,22 Okada, Y.,6 Omi, N.,25
Onodera, H.,10 Onodera, K.,25 Ooki, S.,21 Oonishi, K.,29 Oonuma, H.,10 Ooshima, H.,8
Oouchi, H.,1 Orsucci, M.,11 Paoli, M.,11 Penaud, M.,9 Perdrisot, C.,9 Petit, M.,9 Piskowski, A.,15
P locharski, A.,15 Polis, A.,13 Polti, L.,3 Potsepnia, T.,14 Przybylski, D.,12 Pytel, M.,28
Quillet, W.,9 Remy, A.,3 Robert, C.,9 Sadowski, M.,19 Saito, M.,10 Sakuma, D.,1 Sano, K.,5
arX
iv:1
506.
0636
4v3
[ph
ysic
s.m
ed-p
h] 1
8 N
ov 2
015
2
Sasaki, Y.,24 Sato, N.,4 Schneider, T.,32 Schneider, C.,3 Schwartzman, K.,2 Selivanov, E.,14
Sezaki, M.,25 Shiroishi, K.,21 Shustava, I.,14 Sniecinska, A.,28 Stalchenko, E.,14 Staron, A.,27
Stromboni, M.,7 Studzinska, W.,26 Sugisaki, H.,17 Sukegawa, T.,21 Sumida, M.,22 Suzuki, Y.,17
Suzuki, K.,10 Suzuki, R.,10 Suzuki, H.,10 Suzuki, K.,6 Swiderski, W.,18 Szudejko, M.,33
Szymaszek, M.,27 Tada, J.,34 Taguchi, H.,22 Takahashi, K.,4 Tanaka, D.,5 Tanaka, G.,29
Tanaka, S.,24 Tanino, K.,4 Tazbir, K.,13 Tcesnokova, N.,14 Tgawa, N.,5 Toda, N.,6 Tsuchiya, H.,17
Tsukamoto, H.,8 Tsushima, T.,1 Tsutsumi, K.,25 Umemura, H.,8 Uno, M.,24 Usui, A.,25
Utsumi, H.,29 Vaucelle, M.,9 Wada, Y.,17 Watanabe, K.,4 Watanabe, S.,22 Watase, K.,29
Witkowski, M.,26 Yamaki, T.,21 Yamamoto, J.,4 Yamamoto, T.,17 Yamashita, M.,22 Yanai, M.,21
Yasuda, K.,22 Yoshida, Y.,1 Yoshida, A.,21 Yoshimura, K.,25 Zmijewska, M.,15 and Zuclarelli, E.7
1Adachi High School, 2-347 Kakunai, Nihonmatsu, Fukushima 964-0904, Japan
2Bragin High School, Bragin, Gomel region, Belarus
3Notre Dame High School, 1 Avenue Charles de Gaulle, 92100 Boulogne-Billancourt, France
4Aizu Gakuho High School, Ikkimachi Oaza Yahata,
Yahata-1-1, Aizuwakamatsu, Fukushima 965-0003, Japan
5Nada High Shool, 8-5-1 Uozakikitamachi,
Higashinada-ku, Kobe, Hyogo 658-0082, Japan
6Iwaki High School, Taira Aza Takatsuki 7, Iwaki, Fukushima 970-8026, Japan
7Giocante de Casabianca High School, Avenue Jean Zuccarelli, 20200 Bastia, France
8Ena High School, 1023-1 Ohi-cho, Ena, Gifu 509-7201, Japan
9Bois d’Amour High School, 9 Rue de la Garenne, 86000 Poitiers, France
10Fukushima High School, 5-72 Moriaicho, Fukushima, Fukushima 960-8002, Japan
11Paul Vincensini High School, Rue de la Quatrieme Division Marocaine de Montagne, 20600 Bastia, France
12ZS nr 2 im. Marii Sk lodowskiej-Curie, Otwock, Poland
13I LO im. J. S lowackiego, Czestochowa, Poland
14Blaise Pascal High School n◦46, 14, rue de Clermont-Ferrand, 246027 Gomel, Belarus
15ZS nr 5 im. Unii Europejskiej, III LO, Ostroleka, Poland
16Institute for Radiation Protection and Nuclear Safety (IRSN),
BP17, 92262 Fontenay-aux-Roses Cedex, France
17Asaka High School, 5-25-63 Kaisei, Koriyama, Fukushima 963-8851, Japan
18ZS Centrum Edukacji im. Ignacego lukasiewicza, Plock, Poland
19National Centre for Nuclear Research, 05-400 Otwock, A.So ltana 7, Poland
20Publiczne Gimnazjum nr 1 im. Jana Paw la II, Zabki, Poland
21Tamura High School, Mochiaibata 8,Tamuragun Miharumachi, Fukushima 963-7763, Japan

3
22Fukuyama High School Attached to Hiroshima University,
5-14-1 Kasugacho, Fukuyama, Hiroshima 721-0907, Japan
23The University of Tokyo, 7-3-1 Hongo, Bunkyo-ku, Tokyo 113-0033, Japan
24Tajimi-Kita High School, 2-49 Kamiyamacho, Tajimi, Gifu 507-0022, Japan
25Kanagawa-University High School, Daimuracho 800,
Midori-ku, Yokohama, Kanagawa 226-0014, Japan
26ZS Nr 36 im. M. Kasprzaka, Warsaw and LXX LO im. A. Kaminskiego, Warsaw, Poland
27XII LO, ZS Sportowych im. Janusza Kusocinskiego, Zabrze, Poland
28ZS Nr 26, Warsaw, Poland
29Nara-Gakuen High School, 430 Yamada-cho,
Yamato-Koriyama, Nara 639-1093, Japan
30Fukushima Medical University, 1 Hikariga-oka, Fukushima, 960-1295, Japan
31Chiyoda Technol Corporation, 1-7-12 Yushima, Bunkyo-ku, Tokyo 113-8681, Japan
32Centre d’etude sur l’Evaluation de la Protection dans le
domaine Nucleaire (CEPN), 92260 Fontenay-aux-Roses, France
33ZS Nr 36 im. M. Kasprzaka, Warsaw and LXX LO im. A. Kamnskiego, Warsaw, Poland
34NPO Radiation Safety Forum (RSF), 4-3-1 Toranomon, Minato-ku, Tokyo 105-6027, Japan
Abstract
Twelve high schools in Japan (of which six are in Fukushima Prefecture), four in France,
eight in Poland and two in Belarus cooperated in the measurement and comparison of in-
dividual external doses in 2014. In total 216 high-school students and teachers participated
in the study. Each participant wore an electronic personal dosimeter “D-shuttle” for two
weeks, and kept a journal of his/her whereabouts and activities. The distributions of an-
nual external doses estimated for each region overlap with each other, demonstrating that
the personal external individual doses in locations where residence is currently allowed in
Fukushima Prefecture and in Belarus are well within the range of estimated annual doses
due to the terrestrial background radiation level of other regions/countries.
Keywords: Fukushima Dai-ichi accident, personal dosimetry, international comparison, radiation
education
∗ [email protected]; Corresponding author

4
I. INTRODUCTION
The Fukushima Dai-ichi nuclear power plant accident, which began in March 2011, released a
significant amount of radioactive substances, contaminating Fukushima and surrounding prefec-
tures [1]. It is therefore essential to clarify the extent of this fallout and to assess its impact on
the environment, foodstuffs, and on the residents in the affected areas. In Fukushima Prefecture,
various studies of external as well as internal exposures have been conducted since 2011 [2, 3].
Particularly important in assessing the effect of radiation on the residents is to conduct personal
dosimetry: One of the earliest reports was by Yoshida et al. [4], who measured the individual doses
of the medical staff dispatched from Nagasaki to Fukushima City from March to July 2011. They
reported that the personal dose equivalent HP(10) ranged from 0.08 to 1.63 µSv/h, significantly
lower than the ambient dose equivalent rate H∗(10) recorded by a monitoring station in Fukushima
city which ranged from 0.86 to 12.34 µSv/h.
Large-scale individual dose monitorings have been conducted by most municipalities in Fukushima
Prefecture since 2011. For example, Fukushima City started to distribute radio-photoluminescence
glass dosimeters (Glass Badge R©) to school children and pregnant women in the fall of 2011, and
the monitorings have been repeated every year. The percentage of the subjects whose measured
“additional” dose was below 1 mSv/y was 51% in 2011, 89% in 2012, and 93% in 2013. In 2014,
95.57% of the 46,436 subjects were found to be below 1 mSv/y [5]1.
Such individual dose monitoring using passive dosimeters report a cumulative dose over a period
of time, typically three months, to the participant; it is not possible to tell when and where the
major contribution to the cumulative dose was received. In the present study, we therefore used
active (solid-state) personal dosimeters called “D-shuttle”, which can record the integrated dose for
each hour (hourly dose). The D-shuttles had already been used successfully in some studies. For
example, Hayano et al. [6] demonstrated the effectiveness of using D-shuttles to communicate the
exposure situation to residents, and Naito et al. [7] used D-shuttles together with global-positioning
system (GPS) receivers to compare individual versus ambient dose equivalent rates.
In the present study, 216 high-school students and teachers wore D-shuttles and kept journals
of their behaviour for two weeks in 2014, and the external individual doses thus obtained were
compared across the regions. This study was motivated and initiated by the high-school students
living in Fukushima who wished to compare their own individual doses with those of people living
in other parts of Japan, and also in other countries.
1 The reduction in the external dose is due partly to the decay of 134Cs, having a half life of 2 years, and also to the
decontamination efforts.
5
Air dose rate (µSv/h)
Japan
FukushimaPrefecture
Fukushima Dai-ichi NPP
20 km
20 km
Boundary of the restricted zone
12 (Fukushima 0.36 µSv/h)
7 (Asaka 0.24 µSv/h) 8 (Iwaki 0.13 µSv/h)
9 (Aizu <0.1 µSv/h)
10 (Tamura 0.30 µSv/h)
11 (Adachi 0.38 µSv/h)80 km
80 km
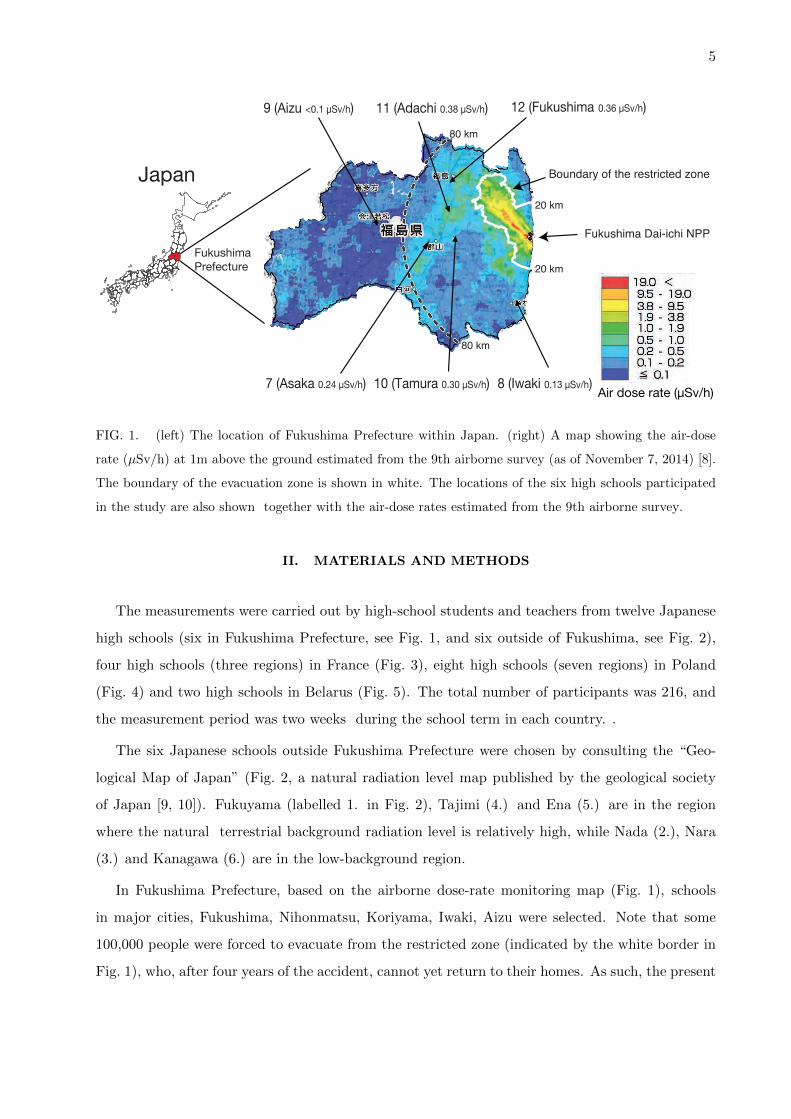
FIG. 1. (left) The location of Fukushima Prefecture within Japan. (right) A map showing the air-dose
rate (µSv/h) at 1m above the ground estimated from the 9th airborne survey (as of November 7, 2014) [8].
The boundary of the evacuation zone is shown in white. The locations of the six high schools participated
in the study are also shown together with the air-dose rates estimated from the 9th airborne survey.
II. MATERIALS AND METHODS
The measurements were carried out by high-school students and teachers from twelve Japanese
high schools (six in Fukushima Prefecture, see Fig. 1, and six outside of Fukushima, see Fig. 2),
four high schools (three regions) in France (Fig. 3), eight high schools (seven regions) in Poland
(Fig. 4) and two high schools in Belarus (Fig. 5). The total number of participants was 216, and
the measurement period was two weeks during the school term in each country. .
The six Japanese schools outside Fukushima Prefecture were chosen by consulting the “Geo-
logical Map of Japan” (Fig. 2, a natural radiation level map published by the geological society
of Japan [9, 10]). Fukuyama (labelled 1. in Fig. 2), Tajimi (4.) and Ena (5.) are in the region
where the natural terrestrial background radiation level is relatively high, while Nada (2.), Nara
(3.) and Kanagawa (6.) are in the low-background region.
In Fukushima Prefecture, based on the airborne dose-rate monitoring map (Fig. 1), schools
in major cities, Fukushima, Nihonmatsu, Koriyama, Iwaki, Aizu were selected. Note that some
100,000 people were forced to evacuate from the restricted zone (indicated by the white border in
Fig. 1), who, after four years of the accident, cannot yet return to their homes. As such, the present

6
6 (Kanagawa)
5 (Ena)
4 (Tajimi)3 (Nara)
2 (Nada)
1 (Fukuyama)
Fukushima (see Fig. 1)
Natural Radiation (µGy/h)0.127 <0.109 - 0.1270.0907 - 0.1090.0725 - 0.09070.0543 - 0.07250.036 - 0.05430.0178 - 0.0360.00571 - 0.0178
FIG. 2. The natural radiation level map of Japan (in nGy/h) calculated from the chemical analyses of the
soil samples by adding contributions from uranium, thorium and potassium-40 [10]. The map was adopted
from Ref. [9]. Note that the colour coding schemes are different between this figure and that in Fig 1.
study does not include high schools in the restricted zones. When choosing the participants from
Fukushima Prefecture high schools, care were taken so as to choose students living in various areas,
house types (wooden vs concrete), and in their extracurricular activities.
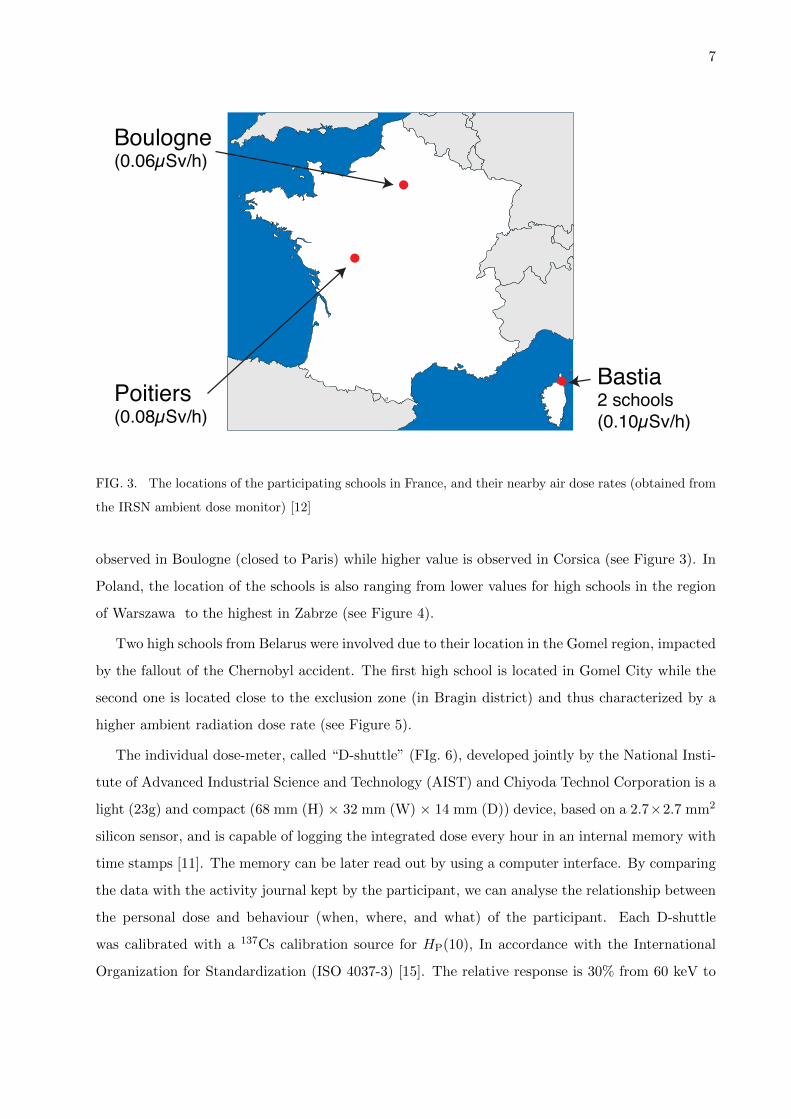
In France and Poland, the high schools involved in the study participated on a voluntary basis
without specific selection. In France, the four high schools are located in three different regions
characterized by a range of natural terrestrial radiation background level, the lowest level being
7
Poitiers(0.08µSv/h)
Boulogne(0.06µSv/h)
Bastia2 schools(0.10µSv/h)
FIG. 3. The locations of the participating schools in France, and their nearby air dose rates (obtained from
the IRSN ambient dose monitor) [12]
observed in Boulogne (closed to Paris) while higher value is observed in Corsica (see Figure 3). In
Poland, the location of the schools is also ranging from lower values for high schools in the region
of Warszawa to the highest in Zabrze (see Figure 4).
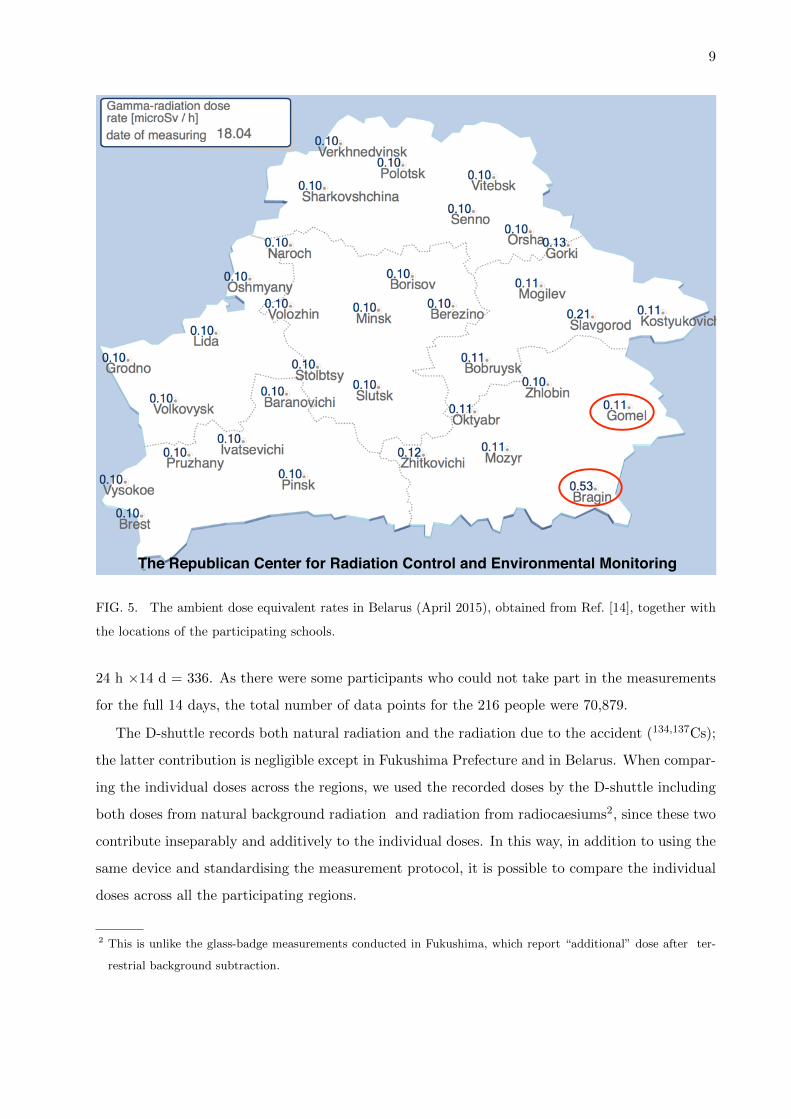
Two high schools from Belarus were involved due to their location in the Gomel region, impacted
by the fallout of the Chernobyl accident. The first high school is located in Gomel City while the
second one is located close to the exclusion zone (in Bragin district) and thus characterized by a
higher ambient radiation dose rate (see Figure 5).
The individual dose-meter, called “D-shuttle” (FIg. 6), developed jointly by the National Insti-
tute of Advanced Industrial Science and Technology (AIST) and Chiyoda Technol Corporation is a
light (23g) and compact (68 mm (H) × 32 mm (W) × 14 mm (D)) device, based on a 2.7×2.7 mm2
silicon sensor, and is capable of logging the integrated dose every hour in an internal memory with
time stamps [11]. The memory can be later read out by using a computer interface. By comparing
the data with the activity journal kept by the participant, we can analyse the relationship between
the personal dose and behaviour (when, where, and what) of the participant. Each D-shuttle
was calibrated with a 137Cs calibration source for HP(10), In accordance with the International
Organization for Standardization (ISO 4037-3) [15]. The relative response is 30% from 60 keV to
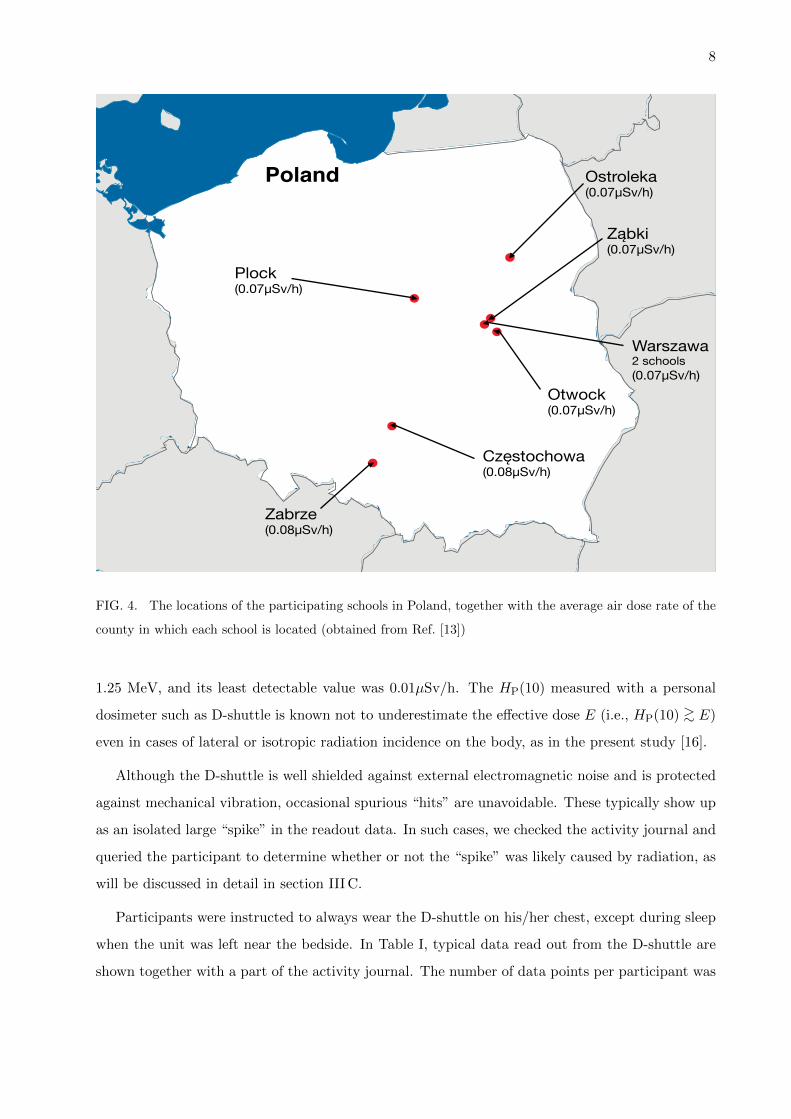
8!"#$"%$&'()%*"+(&,(-&*"'#(./0112Ostroleka(0.07µSv/h)
Plock(0.07µSv/h)
Zabrze(0.08µSv/h)
Częstochowa(0.08µSv/h)
Otwock(0.07µSv/h)
Warszawa2 schools(0.07µSv/h)
Ząbki(0.07µSv/h)
Poland
FIG. 4. The locations of the participating schools in Poland, together with the average air dose rate of the
county in which each school is located (obtained from Ref. [13])
1.25 MeV, and its least detectable value was 0.01µSv/h. The HP(10) measured with a personal
dosimeter such as D-shuttle is known not to underestimate the effective dose E (i.e., HP(10) >∼ E)
even in cases of lateral or isotropic radiation incidence on the body, as in the present study [16].
Although the D-shuttle is well shielded against external electromagnetic noise and is protected
against mechanical vibration, occasional spurious “hits” are unavoidable. These typically show up
as an isolated large “spike” in the readout data. In such cases, we checked the activity journal and
queried the participant to determine whether or not the “spike” was likely caused by radiation, as
will be discussed in detail in section III C.
Participants were instructed to always wear the D-shuttle on his/her chest, except during sleep
when the unit was left near the bedside. In Table I, typical data read out from the D-shuttle are
shown together with a part of the activity journal. The number of data points per participant was
9
The Republican Center for Radiation Control and Environmental Monitoring
FIG. 5. The ambient dose equivalent rates in Belarus (April 2015), obtained from Ref. [14], together with
the locations of the participating schools.
24 h ×14 d = 336. As there were some participants who could not take part in the measurements
for the full 14 days, the total number of data points for the 216 people were 70,879.
The D-shuttle records both natural radiation and the radiation due to the accident (134,137Cs);
the latter contribution is negligible except in Fukushima Prefecture and in Belarus. When compar-
ing the individual doses across the regions, we used the recorded doses by the D-shuttle including
both doses from natural background radiation and radiation from radiocaesiums2, since these two
contribute inseparably and additively to the individual doses. In this way, in addition to using the
same device and standardising the measurement protocol, it is possible to compare the individual
doses across all the participating regions.
2 This is unlike the glass-badge measurements conducted in Fukushima, which report “additional” dose after ter-
restrial background subtraction.

10
TABLE I. A typical example of a D-shuttle data.
Date and time Hourly dose (µSv) Location
2014/06/27 15h 0.12 school
2014/06/27 16h 0.07 school
2014/06/27 17h 0.10 school
2014/06/27 18h 0.10 school
2014/06/27 19h 0.14 school
2014/06/27 20h 0.04 home
2014/06/27 21h 0.06 home
2014/06/27 22h 0.12 home
2014/06/27 23h 0.13 home
2014/06/28 00h 0.07 home
FIG. 6. A semiconductor-type personal dosimeter “D-shuttle”, developed jointly by AIST and Chiyoda
Technol Corporation. Each participant was instructed to wear the dosimeter on their chest, using the
provided strap.

11
III. RESULTS
A. Comparison of the hourly dose across regions
For each school or region, the number of participants ranged from 10-33, and the number of
data points were from ∼ 3300 − 9800, as summarised in Table II. Fig. 7 shows the individual
hourly dose (µSv/h) distributions for 12 Japanese schools and 5 European regions in the form of
a box-and-whisker plot. Note that the vertical axis is in logarithmic scale. The bottom of the
box represents the first quartile, top of the box represents the third quantile and the centre line
represents the median. The length of the whisker is 1.5 times the height of the box (when the
lower end of the whisker falls below 0.01µSv/h it is set to 0.01µSv/h). The outliers (data points
larger than the top end of the upper whisker) are indicated by crosses. The percentage of outliers
was 1.5% and the percentage of outliers exceeding 1µSv/h was 0.045%. Most of the extreme
outliers (≥ 1µSv/h) are not accident related, as they are found in all the regions, and, as will be
discussed in Sec. III C, they are due to noise. We did not however exclude them in subsequent
analyses, as i) it was not possible, by consulting the journals and sometimes conducting interviews,
to determine what caused the outlier in every case, and, ii) including them did not change the
median annualised dose values (Sec. III B). The numerical values of the first quartile, the median,
and the third quartile are provided in Table II.
Median hourly individual doses for participants from six high schools in Fukushima Prefecture
are 0.07 − 0.10µSv/h, while those for participants from outside Fukushima Prefecture are 0.06 −
0.09µSv/h. The median hourly individual doses for participants from France, Poland and Belarus
are 0.06 − 0.11µSv/h.
Within Japan, the hourly dose distribution for Asaka in Fukushima and that for Ena (outside
of Fukushima) are almost the same. The hourly dose distribution for Aizu in Fukushima is close to
that of the low-dose regions outside of Fukushima, e.g., Nara and Kanagawa. These show that the
hourly individual dose distributions of these regions in Fukushima Prefecture are not significantly
higher than in those of other parts of Japan.
Within Europe, the hourly dose distribution of Bastia (Corsica, France) is similar to or even
slightly higher than those in Fukushima Prefecture. This is consistent with the known fact that
Bastia is in a region where the natural radiation dose is relatively high.
12
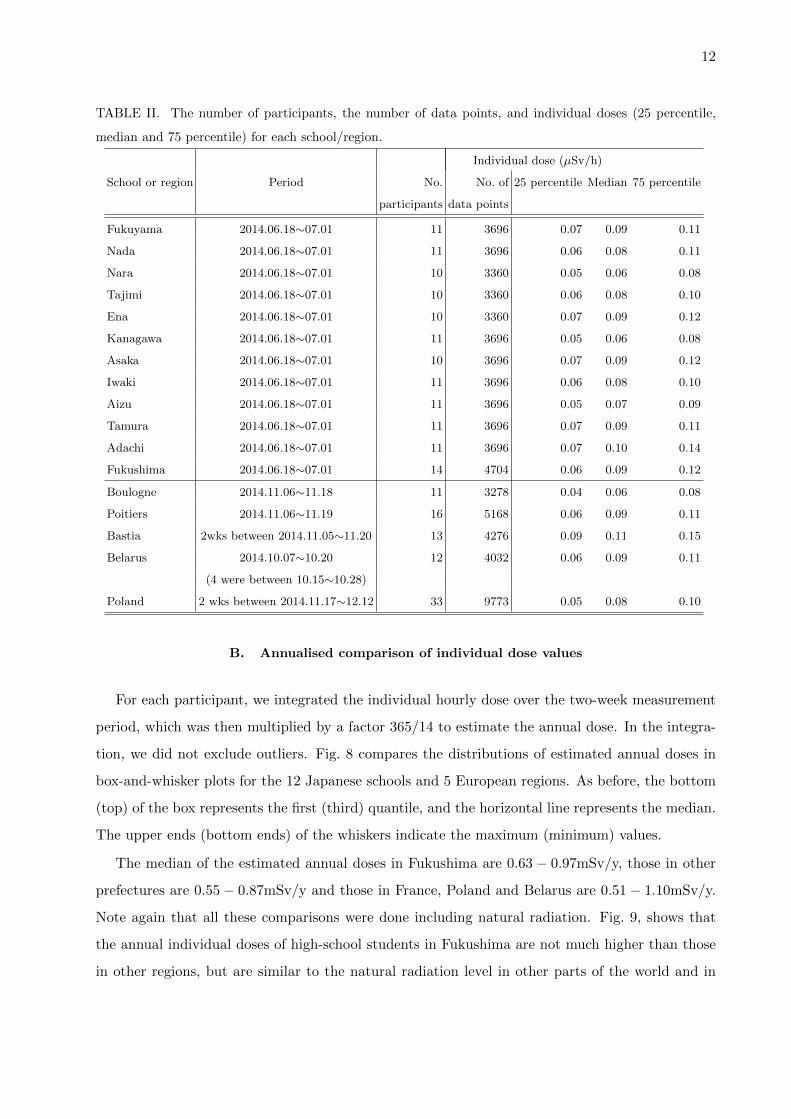
TABLE II. The number of participants, the number of data points, and individual doses (25 percentile,
median and 75 percentile) for each school/region.
Individual dose (µSv/h)
School or region Period No. No. of 25 percentile Median 75 percentile
participants data points
Fukuyama 2014.06.18∼07.01 11 3696 0.07 0.09 0.11
Nada 2014.06.18∼07.01 11 3696 0.06 0.08 0.11
Nara 2014.06.18∼07.01 10 3360 0.05 0.06 0.08
Tajimi 2014.06.18∼07.01 10 3360 0.06 0.08 0.10
Ena 2014.06.18∼07.01 10 3360 0.07 0.09 0.12
Kanagawa 2014.06.18∼07.01 11 3696 0.05 0.06 0.08
Asaka 2014.06.18∼07.01 10 3696 0.07 0.09 0.12
Iwaki 2014.06.18∼07.01 11 3696 0.06 0.08 0.10
Aizu 2014.06.18∼07.01 11 3696 0.05 0.07 0.09
Tamura 2014.06.18∼07.01 11 3696 0.07 0.09 0.11
Adachi 2014.06.18∼07.01 11 3696 0.07 0.10 0.14
Fukushima 2014.06.18∼07.01 14 4704 0.06 0.09 0.12
Boulogne 2014.11.06∼11.18 11 3278 0.04 0.06 0.08
Poitiers 2014.11.06∼11.19 16 5168 0.06 0.09 0.11
Bastia 2wks between 2014.11.05∼11.20 13 4276 0.09 0.11 0.15
Belarus 2014.10.07∼10.20 12 4032 0.06 0.09 0.11
(4 were between 10.15∼10.28)
Poland 2 wks between 2014.11.17∼12.12 33 9773 0.05 0.08 0.10
B. Annualised comparison of individual dose values
For each participant, we integrated the individual hourly dose over the two-week measurement
period, which was then multiplied by a factor 365/14 to estimate the annual dose. In the integra-
tion, we did not exclude outliers. Fig. 8 compares the distributions of estimated annual doses in
box-and-whisker plots for the 12 Japanese schools and 5 European regions. As before, the bottom
(top) of the box represents the first (third) quantile, and the horizontal line represents the median.
The upper ends (bottom ends) of the whiskers indicate the maximum (minimum) values.
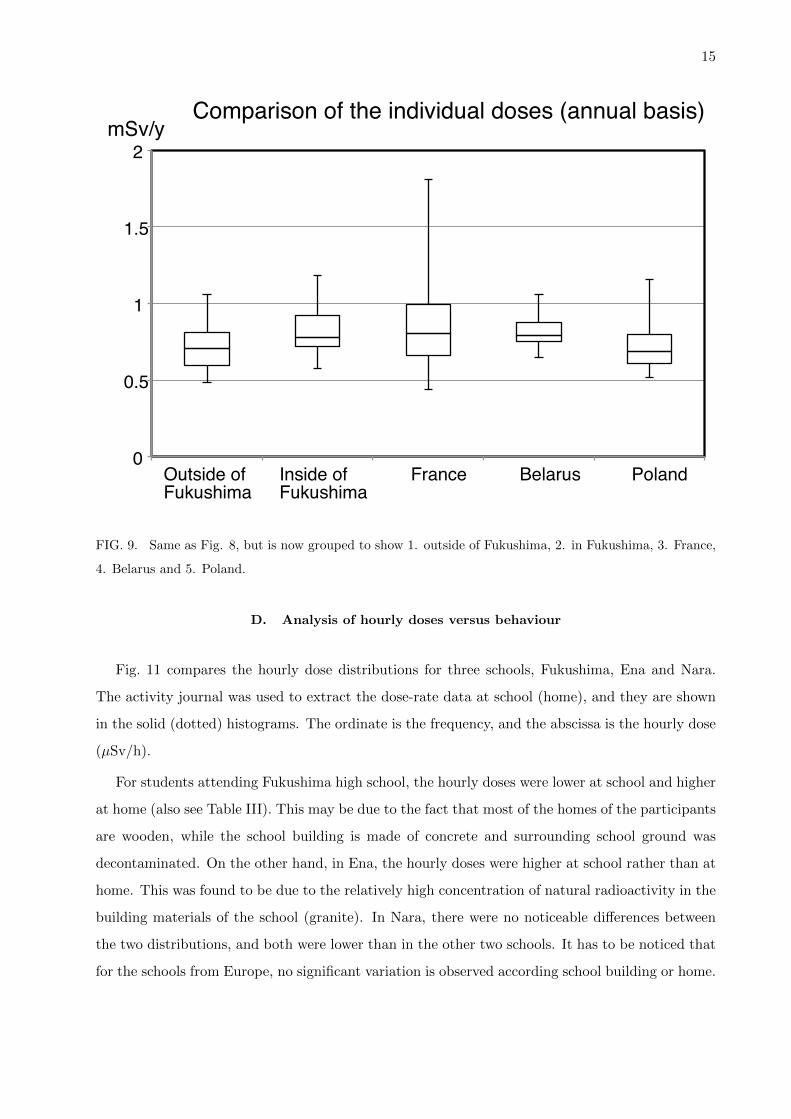
The median of the estimated annual doses in Fukushima are 0.63 − 0.97mSv/y, those in other
prefectures are 0.55 − 0.87mSv/y and those in France, Poland and Belarus are 0.51 − 1.10mSv/y.
Note again that all these comparisons were done including natural radiation. Fig. 9, shows that
the annual individual doses of high-school students in Fukushima are not much higher than those
in other regions, but are similar to the natural radiation level in other parts of the world and in

13
0.01
0.1
1
10
100µSv/h Comparison of the individual hourly doses
Inside ofFukushima
Outside ofFukushima
Europe
1 (Fukuyama)
2 (Nada)
3 (Nara)
4 (Tajimi)
5 (Ena)
6 (Kanagawa)
7 (Asaka)
8 (Iwaki)
9 (Aizu)
10 (Tamura)
11 (Adachi)
12 (Fukushima)
Poitiers (France)
Boulogne (France)
Bastia (France)
Belarus
Poland
FIG. 7. Box-and-whisker diagrams of the individual hourly dose (µSv/h) for 6 schools outside Fukushima,
6 schools in Fukushima, and five European regions. The ordinate is in logarithmic scale. For the definitions
of the boxes, whiskers and outliers (×), see the main text.
the same range of those observed in Gomel region 28 years after the Chernobyl accident.
C. Analysis of the “outliers”
We here discuss what may have caused the “outliers” found in Fig. 7. Some are due to high
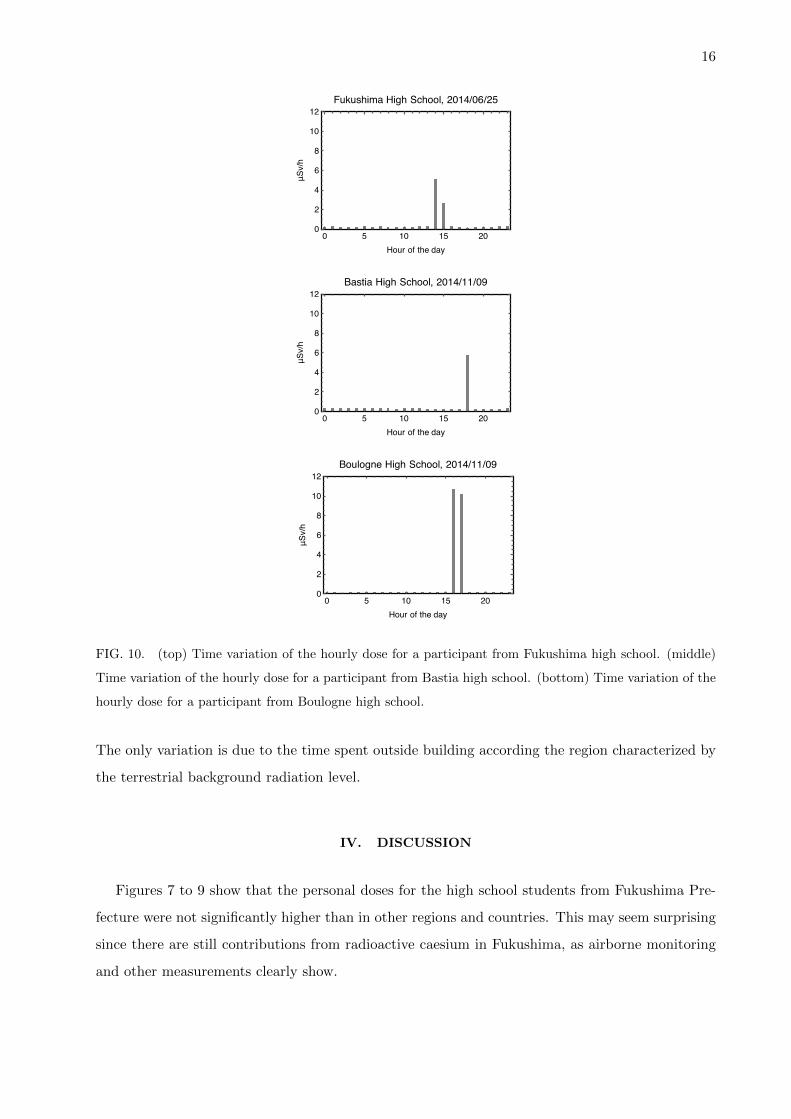
radiation level, and others are due to noise. In Fig. 10, we show three typical examples from
Fukushima (top), Bastia (middle) and Boulogne (bottom).
A large value of 5µSv/h was recorded for one participant from Fukushima high school (Fig. 10
(top)). This was when this person (teacher) visited Okuma town in the restricted zone, close to
the Fukushima Dai-ichi Nuclear Power Plant (Fig. 1) for research purposes. For two hours, 15:00

14
0
0.5
1
1.5
2
1 (Fukuyama)
2 (Nada)
3 (Nara)
4 (Tajimi)
5 (Ena)
6 (Kanagawa)
7 (Asaka)
8 (Iwaki)
9 (Aizu)
10 (Tamura)
11 (Adachi)
12 (Fukushima)
Poitiers (France)
Boulogne (France)
Bastia (France)
Belarus
Poland
mSv/y
Outside of Fukushima
EuropeInside of Fukushima
Comparison of the individual doses (annual basis)
FIG. 8. The two-week integrated individual dose was converted to annual dose (mSv/y), presented in
box-and-whisker diagrams. For the definitions of the boxes and whiskers, see the main text.
and 16:00, high hourly doses were recorded, and this coincided with the activity journal entry of
this person.
The large values found in the data of participants from Bastia and Boulogne are due to noise,
since interviews revealed no reasons for high radiation exposures. As was discussed above, occa-
sional malfunction of the D-shuttle device due to electromagnetic/mechanical noise is unavoidable,
which usually shows up as a single isolated event as shown in Fig. 10 (middle). Large values were
recorded for two consecutive hours, however, in the case of a participant from Boulogne (Fig. 10
(bottom), 16:00-17:00). Interview of this person revealed nothing notable, and we concluded that
this reading also must have been noise, although having noise for two consecutive data points is
quite rare (this is the only such case in > 70, 000 data points).
15
0
0.5
1
1.5
2
Outside of Fukushima
Inside of Fukushima
France Belarus Poland
mSv/yComparison of the individual doses (annual basis)
FIG. 9. Same as Fig. 8, but is now grouped to show 1. outside of Fukushima, 2. in Fukushima, 3. France,
4. Belarus and 5. Poland.
D. Analysis of hourly doses versus behaviour
Fig. 11 compares the hourly dose distributions for three schools, Fukushima, Ena and Nara.
The activity journal was used to extract the dose-rate data at school (home), and they are shown
in the solid (dotted) histograms. The ordinate is the frequency, and the abscissa is the hourly dose
(µSv/h).
For students attending Fukushima high school, the hourly doses were lower at school and higher
at home (also see Table III). This may be due to the fact that most of the homes of the participants
are wooden, while the school building is made of concrete and surrounding school ground was
decontaminated. On the other hand, in Ena, the hourly doses were higher at school rather than at
home. This was found to be due to the relatively high concentration of natural radioactivity in the
building materials of the school (granite). In Nara, there were no noticeable differences between
the two distributions, and both were lower than in the other two schools. It has to be noticed that
for the schools from Europe, no significant variation is observed according school building or home.
16
0 5 10 15 200
2
4
6
8
10
12
Hour of the day
Fukushima High School, 2014/06/25
μSv/h
0 5 10 15 200
2
4
6
8
10
12
Hour of the day
μSv/h
Bastia High School, 2014/11/09
0 5 10 15 200
2
4
6
8
10
12
Hour of the day
Boulogne High School, 2014/11/09
μSv/h
FIG. 10. (top) Time variation of the hourly dose for a participant from Fukushima high school. (middle)
Time variation of the hourly dose for a participant from Bastia high school. (bottom) Time variation of the
hourly dose for a participant from Boulogne high school.
The only variation is due to the time spent outside building according the region characterized by
the terrestrial background radiation level.
IV. DISCUSSION
Figures 7 to 9 show that the personal doses for the high school students from Fukushima Pre-
fecture were not significantly higher than in other regions and countries. This may seem surprising
since there are still contributions from radioactive caesium in Fukushima, as airborne monitoring
and other measurements clearly show.

17
0
50
100
150
200
250
300
0
50
100
150
200
250
300
homeschool
5 (Ena)
3 (Nara)
0 0 0.05Dose rate [µSv/h]
Dose rate [µSv/h]
Dose rate [µSv/h]
0.10 0.15 0.20 0.25 0.30
0 0.05 0.10 0.15 0.20 0.25 0.30
0 0.05 0.10 0.15 0.20 0.25 0.30
50
100
150
200
250
300
homeschoolhomeschool
homeschool
12 (Fukushima)
FIG. 11. The activity journal entries were used to extract the dose-rate data at home and in the school
building, and the dose-rate histograms are plotted separately (home: solid, school: dotted). The ordinate
is the frequency and abscissa is the hourly dose (µSv/h).
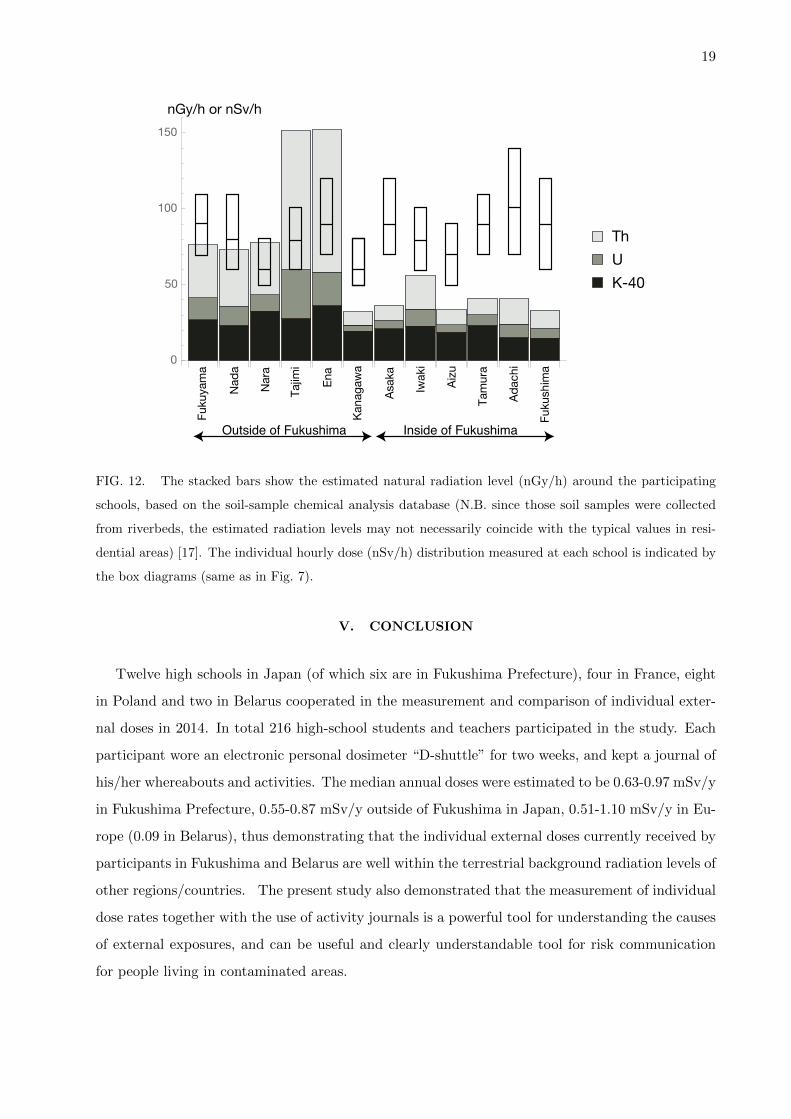
In order to better understand the situation, we show in Fig. 12 the estimated air kerma for the
12 participating schools in Japan, using the database of chemical analysis of soil samples [17]. We
selected the soil-sample data within 5 km of participating schools from the database (when there
were multiple sampling points, we took their average), and used the equationK = 13.0CK+5.4CU+
2.7CTh to estimate the air kerma K (nGy/h), with CK being the 40K concentration (in %), CU
being the uranium concentration (in ppm) and CTh being the thorium concentration (in ppm) [18].
The relation between the air kerma and the effective dose varies depending on the irradiation
angle to the body (c.f., ICRP Publication 74 (1996)[19], figure 9). As people almost evenly receive
terrestrial background radiation from all sides, rotational irradiation geometry is adequate for the
relation. Although effective dose per unit air kerma (Sv/Gy) at rotational geometry is around 0.9

18
TABLE III. The mean hourly dose at school (indoor) and home (indoor) for students attending Fukushima,
Ena and Nara high schools.
School School (µSv/h) Home (µSv/h)
Fukushima 0.080 0.102
Ena 0.111 0.091
Nara 0.064 0.066
in the energy region of terrestrial background radiation (c.f., ibid. two-dot chain line of figure 8),
it can be treated as unity without losing the rationality of our argument, since the difference lies
within the uncertainty of the measurement.
As shown, outside of Fukushima, the estimated effective dose rates from the terrestrial radi-
ation air kerma rates and measured individual dose rates are correlated and have similar values.
However, in Fukushima, the individual dose rates are higher than the estimated effective dose rates
of terrestrial radiation. In fact, the terrestrial radiation background is low in Fukushima; the radi-
ation due to the distributed radio-caesium was added on top of the terrestrial radiation, but that
increment is not high as might be expected. Thus, although the dose rate in most of Fukushima
Prefecture was elevated by the nuclear accident, the total external individual dose rates observed
for the Fukushima high school students involved in this study are not significantly different from
those in other regions.
The natural radiation levels vary from region to region. In Japan, the nation-wide average of the
terrestrial gamma-ray contribution to the effective dose is evaluated to be 0.33 mSv/y [20], lower
than the world average of 0.48 mSv/y [21]. In France, the average value is 0.47 mSv/y, similar to
the world average but with variation from a factor 5 according the regions, ranging from about 0.2
to 1 mSv/y [22]. In the present study, the D-Shuttle measured the sum of the natural radiation
dose and the additional dose due to the nuclear accident, if any was detectable. Nevertheless, in
Fukushima as well as in Belarus, the individual annual dose including natural radiation was below
1 mSv/y for most of the participating high-school students. It is interesting to mention that ICRP
stated in Publication 111 that “Past experience has demonstrated that a typical value used for
constraining the optimisation process in long-term post-accident situations is 1 mSv/year” [23].
19
Fuku
yam
a
Nad
a
Nar
a
Tajim
i
Ena
Kana
gaw
a
Asak
a
Iwak
i
Aizu
Tam
ura
Adac
hi
Fuku
shim
a
0
50
100
150
ThUK-40
nGy/h or nSv/h
Outside of Fukushima Inside of Fukushima
FIG. 12. The stacked bars show the estimated natural radiation level (nGy/h) around the participating
schools, based on the soil-sample chemical analysis database (N.B. since those soil samples were collected
from riverbeds, the estimated radiation levels may not necessarily coincide with the typical values in resi-
dential areas) [17]. The individual hourly dose (nSv/h) distribution measured at each school is indicated by
the box diagrams (same as in Fig. 7).
V. CONCLUSION
Twelve high schools in Japan (of which six are in Fukushima Prefecture), four in France, eight
in Poland and two in Belarus cooperated in the measurement and comparison of individual exter-
nal doses in 2014. In total 216 high-school students and teachers participated in the study. Each
participant wore an electronic personal dosimeter “D-shuttle” for two weeks, and kept a journal of
his/her whereabouts and activities. The median annual doses were estimated to be 0.63-0.97 mSv/y
in Fukushima Prefecture, 0.55-0.87 mSv/y outside of Fukushima in Japan, 0.51-1.10 mSv/y in Eu-
rope (0.09 in Belarus), thus demonstrating that the individual external doses currently received by
participants in Fukushima and Belarus are well within the terrestrial background radiation levels of
other regions/countries. The present study also demonstrated that the measurement of individual
dose rates together with the use of activity journals is a powerful tool for understanding the causes
of external exposures, and can be useful and clearly understandable tool for risk communication
for people living in contaminated areas.

20
VI. AUTHOR CONTRIBUTIONS
This study was conceived by students of Fukushima high school, and was designed by Hara T.,
Niwa O., Miyazaki M., Tada J., Schneider T., Charron S., and Hayano R. Data were analysed by
Onodera H., Kiya M., Suzuki K., Suzuki R., and Saito M. Onodera H., Suzuki R., Saito M., Anzai
S., and Fujiwara Y. wrote the manuscript in Japanese, and Hayano R., Niwa O., Schneider T., and
Tada J. finalised the English version. Technical details regarding the D-shuttle were provided by
Ohguchi H. All the students and teachers in the author list participated in the measurement, and
contributed comments on the data analysis and the manuscript. This work was in part supported
by the Super Science High School (SSH) programme of Japan Science and Technology Agency
(JST).
[1] S. TANAKA, “Accident at the Fukushima dai-ichi nuclear power stations of TEPCO Outline & lessons
learned”, Proceedings of the Japan Academy, Series B 88, 471-484 (2012).
[2] S. Nagataki, N. Takamura, K. Kamiya, and M. Akashi, “Measurements of Individual Radiation Doses
in Residents Living Around the Fukushima Nuclear Power Plant”, RADIATION RESEARCH 180,
439-447 (2013).
[3] R.S. Hayano, M. Tsubokura, M. Miyazaki, H. Satou, K. Sato, S. Masaki, and Y. Sakuma, Internal
radiocesium contamination of adults and children in fukushima 7 to 20 months after the Fukushima NPP
accident as measured by extensive whole-body- counter surveys”, Proceedings of the Japan Academy,
Series B 89, 157-163 (2013).
[4] Kohji Yoshida, Kanami Hashiguchi, Yasuyuki Taira, Naoki Matsuda, Shunichi Yamashita, and Noboru
Takamura, “Importance of personal dose equivalent evaluation in fukushima in overcoming social
panic”, Radiation protection dosimetry 151 (2012), 10.1093/rpd/ncr466.
[5] Result of the Fukushima-city glass badge survey, available in Japanese at http://www.city.
fukushima.fukushima.jp/uploaded/attachment/39637.pdf, last accessed May 10, 2015.
[6] Hayano R S and Miyazaki M 2014 Internal and external doses in Fukushima: measuring and com-
municating personal doses FBNews No.447. 15 (in Japanese) http://www.c-technol.co.jp/cms/wp-
content/uploads/2014/04/447fbn.pdf
[7] W. Naito, M. Uesaka, C. Yamada, and H. Ishii, “Evaluation of dose from external irradiation for indi-
viduals living in areas affected by the Fukushima daiichi nuclear plant accident”, Radiation Protection
Dosimetry 163 (2015), 10.1093/rpd/ncu201.
[8] Airborne Monitoring Survey Results are published on the Nuclear Regulation Authority web site http:
//radioactivity.nsr.go.jp/en/list/307/list-1.html, last accessed May 10, 2015.

21
[9] The geological society of Japan web site (in Japanese) http://www.geosociety.jp/hazard/
content0058.html, last accessed May 10, 2015.
[10] S. Minato,“Terrestrial gamma ray dose rate map of the Japanese islands in relation to geological
systems”, RADIOISOTOPES 55, 543-548 (2010).
[11] The technical specifications for D-shuttle are available at http://www.c-technol.co.jp/eng/
e-dshuttle, last accessed May 10, 2015.
[12] IRSN ambient dose monitor, available at http://sws.irsn.fr/sws/mesure/index, last accessed May
10, 2015. (Bastia = 102, Poitiers 84, Boulogne 64)
[13] Isajenko K,Piotrowska B, Fujak M and Karda M 2011 Radia-
tion atlas of Poland, central laboratory for radiological protection
http://www.gios.gov.pl/images/dokumenty/pms/monitoring promieniowania jonizujscego/Atlas Radiologiczny Polski 2011.pdf.
[14] Radiation situation in Belarus, online data available at http://rad.org.by/radiation-belarus.
html, last accessed May 10, 2015.
[15] ISO 4037-3: “X and gamma reference radiation for calibrating dosemeters and doserate meters and for
determining their response as a function of photon energy - Part3: Calibration of area and personal
dosemeters and the measurement of their response as a function of energy and angle of incidence”.
[16] ICRP, 2007. The 2007 Recommendations of the International Commission on Radiological Protection.
ICRP Publication 103. Ann. ICRP 37 (2-4).
[17] Data can be downloaded from the web site: Geochemical map of sea and land of Japan, https:
//gbank.gsj.jp/geochemmap/data/data.htm, last accessed May 10, 2015.
[18] H.L. Beck, J. DeCampo, and C. Gogolak, “In situ Ge(Li) and NaI(Tl) gamma-ray spectrometry”.
USAEC Report HASL-258, New York, N.Y. 10014 (1972).
[19] ICRP, 1996. Conversion Coefficients for use in Radiological Protection against External Radiation.
ICRP Publication 74. Ann. ICRP 26 (3-4).
[20] R. Ichikawa, “Estimate of National Dose of Radiation due to the Living Environment in Japan” (in
Japanese), RADIOISOTOPES 62 (2013) 927-938, and references therein.
[21] UNSCEAR 2000 REPORT: Sources and Effects of Ionizing Radiation, United Nations Publication,
ISBN 92-1-142238-8.
[22] Rannou A, Aubert B and Scanff P 2006 Exposition de la population franaise aux rayonnements ionisants
Rapport IRSN DRPH/SER 200602.
[23] ICRP, 2009. Application of the Commission’s Recommendations to the Protection of People Living in
Long-term Contaminated Areas After a Nuclear Accident or a Radiation Emergency. ICRP Publication
111. Ann. ICRP 39 (3).