D-I ~t ~ cR l t11...constructed wetlands and infiltration basins are providing additional...
349
D- I io '6'1 cR -e l t11 I\ILe-vJ r{ny I f I'll J"" ct q <?ADlCoO/.
Transcript of D-I ~t ~ cR l t11...constructed wetlands and infiltration basins are providing additional...

D- I io '6'1 ~t ~ cR ~ -e l t11
~rocurd~--kv I\ILe-vJ r{ny I ~ f I'll J"" ct
q <?ADlCoO/.

City ofYelm Groundwater Monitoring Project
Centennial Clean Water Fund Grant Number G0100206, FY 2001 Funding Cycle
December 28,2004 FINAL

•
•
•
City of Yelm Groundwater Monitoring Project
Centennial Clean Water Fund Grant Number G0100206, FY 2001 Funding Cycle
December 28, 2004
FINAL
Prepared for:
City ofYelm 105 Yelm Avenue West
Y elm, W A 98597
(]SKILLINGS COHHOLLY
ErtVIROrtMErtTfiL
PROPERTY OF STATE OF WASHINGTON DEPARTMENT OF ECOLOGY UBRARY

~· ....... . . .. "' ., .. r>••r·-. .... ~ . ....,~~-- ... ,~ ....... q
\ ....... J : .... :_, __ .... _. -.~... ' I - ' .. J
• \L -· '--' T CF r-"' -. '- - L ~
i _ _. ,_ L l• - "r,
'04 DEC 29 p 4 :Z7 •
•
•

•
•
•
This Report has been prepared by Patrick Skillings under the direction of Thomas E. Skillings, P.E. The work is in conformance with the Washington State Department of Ecology approved Quality Assurance Project Plan (QAPP). The testing results for this project have been reported to the Washington State Department of Ecology Environmental Information Management (ElM) database. This project has been completed under Grant Number G01 00206 as part of the Centennial Clean Water Fund for the Fiscal Year 2001 Funding Cycle.
City of Yelm 2 Groundwater Monitoring Project
Date: December 28, 2004
Centennial Clean Water Fund Grant No. G01 00206

•
•
•
Abbreviations and Acronyms .....•...••••.....•••....••..••..••.••........•.•••..•...............•..................•.... 5
Executive Summary ...........••......•...•.......•••••....•.......•.......•....•..•.............•....•................••...•. 6
1. 0 Introduction .........•...•••....•.••••••..........••••.....••......•...........••..•................••••••.................... 7
2. 0 Study Area Hydrogeology .............••.••••.....••.....•••...•..•........................•••..................... 12
2.1 Recessional Outwash Aquifer .•............•......•........•...•..•..•...•.........................•.........•..•..•.... 12
2.2 Upper Aquitard ..................•....•.............•............•..•............•.........................•..•......•.......... 12
2.3 Advance Outwash Aquifer ..................•..............•.••..•.........•...•......................................•..• 14
2.4 Lower Aquitard ......••..................................•........•.•......•..•...................................••..•.....•... 14
3.0 Groundwater Monitoring .............................•...•.••......•••.••..••......••.............................. I?
3.1 Yelm Groundwater Baseline Comparison .......•.........•......•..•..•........•.......•..•......•..•.....•... 17 3.1.1 Nitrate+Nitrite-N ........................................................................................................................ 18 3.1.2 Total Dissolved Solids (TDS) ..................................................................................................... 18 3.1.3 Chloride ...................................................................................................................................... 19 3.1.4 Fecal Coliform Bacteria .............................................................................................................. 19 3.1.5 Ammania-N ................................................................................................................................ 19
4.0 Constructed Treatment Wetlands ............•..••....••.•••......•.......•...•..•.••.......................... 20
4.1 Constructed Treatment Wetlands .............•............•...•..•............................•..•..............•... 21 4.1.1 Nickel. ......................................................................................................................................... 22 4.1.2 Temperature ................................................................................................................................ 22 4.1.3 Chromium ................................................................................................................................... 22 4.1.4 Manganese .................................................................................................................................. 22 4.1.5 Dissolved Organic Carbon .......................................................................................................... 22
5.0 Summary Discussion .................................................................................................. 23
5.1 Baseline Comparison ......................................................................................................... 23 5.1.1 Nitrate+Nitrite-N ........................................................................................................................ 24 5.1.2 Total Dissolved Solids (TDS) ..................................................................................................... 24 5.1.3 Chloride ........................................................................... , .......................................................... 25 5.1.4 Fecal Coliform Bacteria .............................................................................................................. 25 5.1.5 Ammania-N ................................................................................................................................ 25
5.2 Constructed Treatment Wetlands .................................................................................... 25 5.2.1 Chromium ................................................................................................................................... 27 5.2.2 Iron .............................................................................................................................................. 27 5.2.3 Manganese .................................................................................................................................. 27 5.2.4 Nickel .......................................................................................................................................... 28 5.2.5 Fecal Coliform Bacteria .............................................................................................................. 28 5.2.6 Temperature ................................................................................................................................ 29 5.2.7 pH ............................................................................................................................................... 29 5.2.8 Dissolved Oxygen ....................................................................................................................... 29 5.2.9 Non-Detectable Analytes ............................................................................................................ 29
5.3 Seasonal Variation in Field Parameters .......................................................................... 29
5.4 Reverse Osmosis Treatment ............................................................................................. 30
6. 0 Conclusion .................................................................................................................. 32
6.1 Baseline Conclusion ........................................................................................................... 32
6.2 Constructed Treatment Wetland Conclusion ................................................................. 32
City ofYelm Groundwater Monitoring Project
3 Centennial Clean Water Fund Grant No. G01 00206

•
•
•
6.3 Reverse Osmosis Conclusion .......•..•••...........•..•......•..•......••••••.••.•......•.•..•................•......•. 33
7. 0 References ............•.•.................•.•.••..••....•••••.••..........••.••.........••..•.......•....••................. 34
List of Tables Table 1.1: Primary and Secondary MCLs ....................................................................... 11 Table 3.1: Groundwater Monitoring Project - Baseline Comparison ............................... 17 Table 4.1: Groundwater Monitoring Project Testing Results ........................................... 21 Table 5.1: Groundwater Water Quality ............................................................................ 24 Table 5.2: Constructed Treatment Wetlands Water Quality ............................................ 26 Table 5.3: Seasonal Variations in Field Parameters ....................................................... 30 Table 5.4: Treatment Capacity of Reverse Osmosis Unit.. ............................................. 31 Table C.1: Sampling Point Locations ............................................................... Appendix C Table C.2: Seasonal Variations on Select Parameters .................................... Appendix C Table 0.1: Quality Assurance .......................................................................... Appendix D
List of Figures Figure 1.1: Vicinity Map ..................................................................................................... 8 Figure 1.2: Sampling Locations ......................................................................................... 9 Figure 2.1: Monitoring Well Hydrographs .............. : ......................................................... 13 Figure 2.2: December Potentiometric Map ..................................................................... 15 Figure 2.3: March Potentiometric Map ............................................................................ 16
Appendices
Appendix A: Yelm Groundwater Baseline Sampling Appendix B: Quality Assurance Project Plan Appendix C: Yelm Groundwater Monitoring Project Sampling Results Appendix D: Quality Assurance Appendix E: Well Logs and As-Builts Appendix F: Hydrogeologic Cross-Sections
City ofYelm Groundwater Monitoring Project
4 Centennial Clean Water Fund Grant No. G01 00206

•
•
•
Abbreviations and Acronyms
BOD5 - Five Day Biochemical Oxygen Demand CFU/100ml- Colony Forming Unit per 100 milliliters CTW- Constructed Treatment Wetland DOC - Dissolved Organic Carbon DOE - Washington State Department of Ecology DOH -Washington State Department of Health EPA- United States Environmental Protection Agency FP - Fish Pond GMP- Groundwater Monitoring Project gpd - gallons per day IS- Inflow Structure NOMA- n-Nitrosodimethlamine MBAS- Methylene Blue Active Substances method, used to test for anionic surfactants MCL- Maximum Contaminant Level mg/L- milligrams per liter (1 mg/L= 1 ppm) ppm - parts per million QAPP- Quality Assurance Project Plan RIB- Rapid Infiltration Basin RO - Reverse Osmosis RW- Reclaimed Water SSF- Subsurface Flow wetland TDS- Total Dissolved Solids TKN -Total Kjeldahl Nitrogen TTHM- Total Trihalomethane ug/L- micrograms per liter umhos/cm - micromhos per centimeter WAC- Washington Administrative Code
City ofYelm Groundwater Monitoring Project
5 Centennial Clean Water Fund Grant No. G01 00206

•
•
•
Executive Summary The City of Yelm, Washington, as part of the City's water reclamation project, recharges a local aquifer with Class A reclaimed water after conveyance through Constructed Treatment Wetlands (CTWs) at Cochrane Park. The City also withdraws its drinking water from a local aquifer and, therefore, has a vested interest in assuring their drinking water source is protected. The aquifer being recharged with Class A reclaimed water is the Recessional Outwash Aquifer. The City withdraws its drinking water from the deeper Advanced Outwash Aquifer. These two aquifers are separated by an aquitard, which restricts direct movement of water between the two aquifers.
The City of Yelm has completed this Groundwater Monitoring Project (GMP) to determine if recharging the Recessional Outwash Aquifer with Class A reclaimed water is identifiable in the water quality of the aquifer used by the City and to determine if the constructed wetlands and infiltration basins are providing additional "polishing" of the reclaimed water before it is applied to groundwater for aquifer recharge.
The results from this project have been compared to a previous baseline report completed by the Washington State Department of Ecology (DOE 1998). A qualitative analysis between this Groundwater Monitoring Project and the baseline, indicates that nitrate+nitrite-N levels have not changed since the City has begun the discharge of Class A reclaimed water into the aquifer, maintaining a mean concentration level of 3.2 mg/L. Other analytes sampled have increased slightly; however, except for chloride, the increases in concentration levels of the baseline analytes can be attributed to the natural background levels of the constructed treatment wetlands. In addition, the changes from the baseline analytes are minimal and well below Drinking Water Standards .
This project also analyzed the impacts on water quality from the use of CTWs for secondary polishing of the Class A reclaimed water. Water quality levels for twenty-nine (29) analytes and four (4) parameters were analyzed at different locations within the treatment chain in an effort to identify any potential trends in treatment capability of CTWs. Many of the analytes sampled showed an improvement in water quality between the inflow structure and the rapid infiltration basins (RIBs). There were other analytes that showed a degradation in water quality moving through the wetland treatment chain. Overall, more of the analytes sampled experienced an improvement, rather than a degradation, in water quality. Changes in parameters sampled for did not indicate either an improvement or degradation in water quality.
Testing of the Constructed Treatment Wetlands indicated that the water flowing out of the fish pond is of lower quality than that of other sampling points in the wetlands. Contamination due to use by waterfowl and fish, including the use of fish food within part of the CTWs, is believed to be a large contributor to water quality degradation. However, the sub-surface flow wetland plays a significant role in improving the water quality after the fish pond.
A pilot Reverse Osmosis (RO) system was also sampled as part of this project. Class A reclaimed water was treated through the use of the RO unit and the results were compared to analyte levels in the Class A reclaimed water and drinking water Maximum Contaminant Level (MCL) thresholds. Testing of the treated water from the RO unit indicates an increased water quality through the use of the reverse osmosis treatment system. RO treatment will produce concentrations well below State Drinking Water Standards MCL levels.
City of Yelm Groundwater Monitoring Project
6 Centennial Clean Water Fund Grant No. G01 00206
•
•
•
1.0 Introduction The City ofYelm completed a water reclamation project in 1999, which utilizes groundwater recharge as one of the final components of its municipal reuse facility. Currently, 50,000 gallons per day (35 gallons per minute) of Class A reclaimed water is used to recharge the same aquifer from which the City withdraws its drinking water supplies. The City wants to be assured their water supply continues to meet the State's Drinking Water Standards. To that end, the City has undertaken a Groundwater Monitoring Project to measure the impacts, if any, that recharging the groundwater with reclaimed water may be having on the aquifer, as well as to determine the effect on water quality within CTWs.
Class A reclaimed water is produced at the City's Reclamation Facility. Reclaimed water is defined as "effluent derived in any part from sewage from a wastewater treatment system that has been adequately and reliably treated, so that as a result of that treatment, it is suitable for beneficial use or a controlled use that would not otherwise occur, and is no longer considered wastewater" (Chapter 246-290-010 WAC). Prior to recharge, the reclaimed water undergoes additional polishing in a constructed treatment wetland composed of several wetland cells. The constructed treatment wetlands are located at the Cochrane Park facility in the City of Yelm (Figure 1.1 ).
In 1998, the Washington State Department of Ecology (DOE) Water Quality Program requested that the Environmental Investigations and Laboratory Services Program conduct sampling of the Advance Outwash Aquifer in order to define the extent of nitrate contamination in the aquifer. The request was based on previously identified nitrate contamination in the groundwater east of the City of Yelm (DOE 1998). The findings of the sampling were detailed in the report titled Ye/m Groundwater Baseline Sampling (DOE 1998), herein after referred to as the Baseline, which is included in Appendix A.
The City of Yelm has completed this GMP, which consisted of quarterly testing over a two-year period, to determine if recharging the aquifer with Class A reclaimed water can be traced to the water quality of the aquifer used by the City. Quarters 1 through 4 were completed during the first year, while quarters 5 through 8 were completed during the second year. The results of the GMP were also used to evaluate if the constructed wetlands and infiltration basins are providing additional "polishing" of the reclaimed water before it is applied to groundwater I aquifer recharge. This project has been completed under Grant Number G0100206 as part of the Centennial Clean Water Fund for the Fiscal Year 2001 Funding Cycle.
Testing procedures for this project followed the Quality Assurance Project Plan for the City of Yelm (Skillings-Connolly 2001) (QAPP) that was approved by the Washington State Department of Ecology (Appendix B). The QAPP outlined testing procedures as well as Quality Control/Quality Assurance measures.
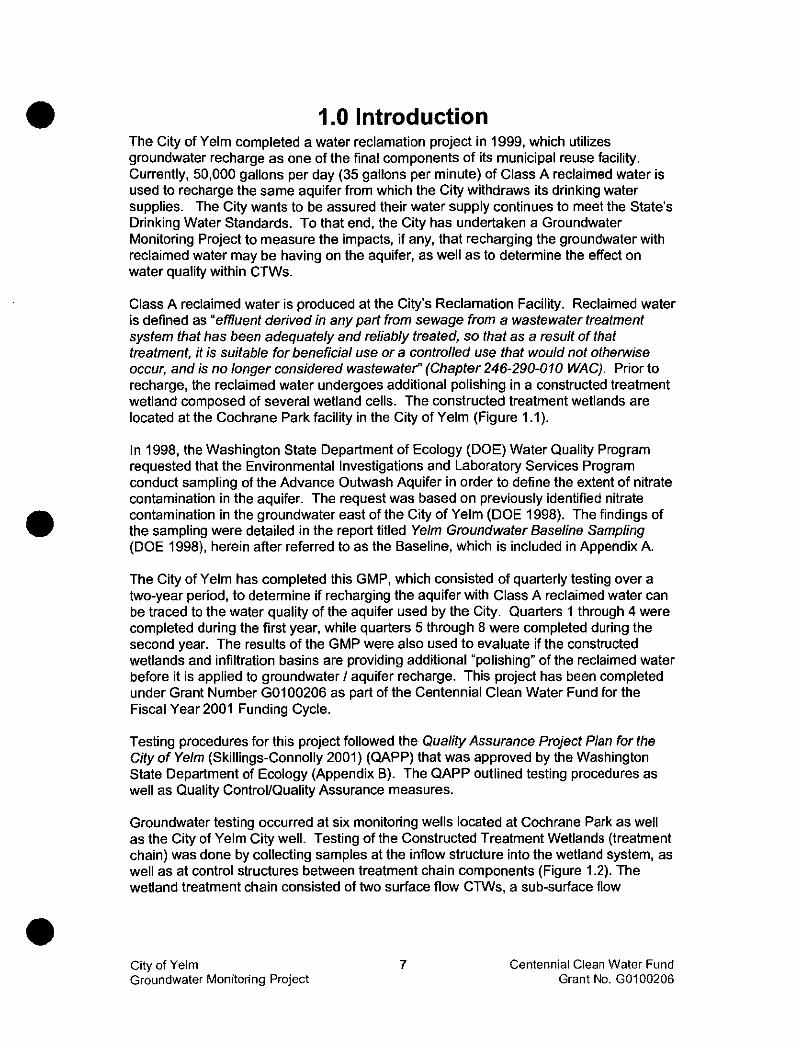
Groundwater testing occurred at six monitoring wells located at Cochrane Park as well as the City of Yelm City well. Testing of the Constructed Treatment Wetlands (treatment chain) was done by collecting samples at the inflow structure into the wetland system, as well as at control structures between treatment chain components (Figure 1.2). The wetland treatment chain consisted of two surface flow CTWs, a sub-surface flow
City o!Yelm Groundwater Monitoring Project
7 Centennial Clean Water Fund Grant No. G0100206

93rd AVE
CITY OF YELM
PUGET SOUND
0
"' ;;:: w 5
_J _J
;:,
0
"' " "' <( -' u
CITY WELLS
COCHRANE PARK WETLAND SITE
I i SKILLIHGS COHHOLLY
5016 Lacey Boulevard SE, Lacey, Washington 98503 (360) 491·3399 (800) 454-7545 Fax (360) 491-3857
FIGURE 1.1 VICINITY MAP

• • ----------------- -·~·..~.....-----=---------------- .... ...~ ... ,,~
POINT 6 SAMPLE POINT
SAMPLE POINT 5
TO SAMPLE POINT APPROX. 1/z MILE
7~TYWELLS
,/
SA"P~ POINT 2
SAMPLE POINT 1
I ,; 1 L
Wi<IQ W(fi:R
0 COI<fRQ. '"""'"liE • C-$
I'I.OW COI<TIIQ._ ,..._..,
lkJTI[IIF<T V0/,.\'1:
·~· ll«UST -..00<
t/1: ("S""G TAU
"'Q CCIITWII/OR- r!ATURI<
c p-11(-
)--( ~~
~ STIWCMT D<l'lf< CI!ADE II(T>IU~ w...s il TOWARO lUST. CIIO.HI
,.._ "'£At«""'G O'IERf'I.OW OOAMI«EC
TR[[GI>O'oii:DRIO'UI<E
A[CLAIIII[0 ... 1[0 ~ "00 NCT -· (I JICQLIIIII[D)~
• FIGURE 1.2
•
COCHRANE PARK SAMPLING LOCA llONS
2

•
•
•
CTW, an open water fish pond, and three rapid infiltration basins. This provided testing results for each separate component of the treatment chain.
It should be noted that the sample locations for the Baseline report are not the same as the sample locations for the GMP.
This report is separated into two sections. The first section compares the results of the 1998 Ye/m Groundwater Baseline Sampling (Baseline) with the results of this Yelm Groundwater Monitoring Project. The Baseline details sampling results for the following five analytes: nitrate+nitrite-N, total dissolved solids (TDS), chloride, fecal coliform bacteria, and ammonium-N. In the first section of this report, a comparison is made between the Baseline results and the levels for the same five analytes in the Class A reclaimed water and in the groundwater. Groundwater was sampled at the City well #2 and the six monitoring wells at Cochrane Park.
The second section of this report details the results from additional analytes sampled for in the reclaimed water, the treatment chain, and the groundwater. Reclaimed water was sampled at the City's reclamation facility.
In addition to the sampling completed as part of the GMP, testing of a pilot reverse osmosis unit was completed in an effort to evaluate the treatment capability of reverse osmosis on Class A reclaimed water.
The Washington State Department of Health (DOH) and the United States Environmental Protection Agency (EPA) have established standards for water quality within the State of Washington. Water quality standards are measured based on a maximum contaminant level (MCL) which is a "trigger" level at which if water quality exceeds the MCL, the purveyor must take corrective action in accordance with WAC 246-290-310. DOH has created three levels of water quality standards: primary MCLs, secondary MCLs, and "action levels". A primary MCL is a water quality standard that is based on chronic, non-acute, or acute human health effects of a specific analyte. A secondary MCL is a water quality standard that is based on factors other than health effects (aesthetics, color, smell, etc.) of a specific analyte. An "action level" is a water quality threshold value. If an "action level" is exceeded by the results of sampling within the water distribution system, corrosion control must be considered. The only analytes sampled for as part of this GMP that have an "action level" were copper and lead.
Historically, the water withdrawn from the aquifer has met the water quality standards of the state and has not exhibited any poor water quality characteristics. However, because the aquifer is shallow, and may be influenced by surface water, the City does chlorinate its drinking water supply. The flow direction of the City's aquifer is to the northeast, passing by Cochrane Park as it flows toward the City's potable wells. The site of Cochrane Park, where the reclaimed water is polished and infiltrated, was previously undeveloped with light, native vegetation .
City of Yelm Groundwater Monitoring Project
10 Centennial Clean Water Fund Grant No. G01 00206

•
•
•
Table 1.1 details primary and secondary MCLs as listed in WAC 246-290-310 for all of the analytes sampled as part of the GMP. This table does not reflect results of the GMP sampling.
Table 1.1: Primary and Secondary MCLs
Analyte Primary MCL • Nitr<l_te-N . _ . __ . 10.0rT19Ll__ Total Dissolved Solids Chloride - · - --
Ammania-N " -Fecal coliform bacteria----- 1 CFU/100m[
-Biocilemicaloxyge;n-Dem1iu1d b ··- · -- -
_DTsl;giVe~ OrganJ~Qarbon b~- ::-_ ---~-Nitrite-N _ __ _1.0 mg/L _ _ __ _
-Surfacfants b Sulfate
- --- -- b-_!loron_ Chromium
·copper· Iron
0.1_ mg/L .. q_mg[b_ ----
Secondary MCL •
- -----.
500 mg/L ?5QITig!C - -- -
250 mg/L
__ 0.3mg/L_ _ __
.
l\.1_aQQ11QeSt;l _ Nickel
Q.Qg _mg/L (!2_0_1Jg/L)_ _
Zinc - - -_Total Trihalo_methanes (TTHM) Fegal StreptocoCC!Jl? _
0.1 mg/L __ _
0. 1 mg/L _ _ . _ 1 Pt:l! 1 OQ_11JI§_
_5.0mg/L
Total Kjeldahl Nitrogen (TKN)b T~mperature d - - - __ _ _·::- - · · ·
pHd CQJ1ductivity _if _ _ Dissolved Oxygen d
···- . b" . . . . _Bromide Silver
·Arsenic Cadmium Fluoride
··Lead c
Mercu.V a) WAC 246-290-310
. _ JOQ iJmhgsf~m
_________ 0.1mg/L 0.05 mg/L_(5Q1Jg/L) 0.005 mg/L (5 IJg/L) _ 4,0 _mg/l,_ . _ 2.0 mg/1 0.015 mg/L
b~gcf2g~~/L (2 iJg/[)- ---
b) Presently, no MCL has been established for these analytes. c) "Action level" d) Parameter; of the four parameters measured, only conductivity has an
established MCL.
City ofYelm Groundwater Monitoring Project
11 Centennial Clean Water Fund Grant No. G0100206

•
•
•
2.0 Study Area Hydrogeology Four hydrogeologic units, two aquifers and two aquitards, are identified beneath the area sampled as part of the GMPc The aquifers consist of gravel and sandy gravel which readily transmit water and are designated as the Recessional Outwash Aquifer and the Advance Outwash Aquifer.
Aquitards generally have a substantial silt or clay component and do not transmit water as well as an aquifer, acting as an impervious or semi-impervious layer between aquifers. In most instances, the aquitard is only semi-impervious, allowing partial flow between water bearing zones (DOE 1998). In the Baseline report, the two aquitards are designated as the Upper and Lower Aquitards; therefore, for consistency, they will be referred to as such in this report. The subsurface relationships of the hydrogeologic units are shown in hydrogeologic profiles contained in Appendix F (Robinson-Noble 2001 ). The location and properties of the hydrogeologic units are described below.
2.1 Recessional Outwash Aquifer The Recessional Outwash Aquifer is the uppermost aquifer in the sampling area. It represents the saturated portion of the Vashon Recessional Outwash deposits mapped by Drost, Turney, Dian, and Jones (1998). Recessional Outwash was deposited by glacier meltwater as the Vashon Glacier retreated and consists of loose mixtures of sand and gravel. The deposits are nearly continuous beneath the sampling area and range up to 38 feet thick. All six of the monitoring wells extend into the Recessional Outwash Aquifer. The aquifer is recharged primarily by infiltrated precipitation (DOE 1998) . Generally, the groundwater flow direction is in an easterly direction, however localized flow patterns will develop as a result in variations in infiltration and recharge. Figure 2.1 (Monitoring Well Hydrographs) shows water level fluctuations in the six monitoring wells during sampling for the GMP. Water levels were highest in the spring (March) and lowest during winter (December).
Figure 2.2 (December Potentiometric Map) shows the groundwater-flow pattern for the Recessional Outwash Aquifer. The map was constructed from water-level elevations measured in the six monitoring wells in December 2002. Figure 2.3 (March Potentiometric Map) also shows the groundwater-flow pattern for the Recessional Outwash Aquifer; however, the map was constructed from water-level elevations measured in the six monitoring wells in March 2003. It should be noted that the potentiometric maps were created to show the approximate groundwater contours in the sampling area, but were not part of a formal hydrogeological survey.
2.2 Upper Aquitard The Upper Aquitard acts as a partial hydraulic barrier between the Recessional Outwash Aquifer and the underlying Advance Outwash Aquifer. Drillers refer to this unit as "clay and gravel", "hardpan", or "cemented gravel". The Upper Aquifer is mapped as Vashon Till by Robinson-Noble (2001 ). Vashon Till was deposited directly and overridden by
City of Yelm Groundwater Monitoring Project
12 Centennial Clean Water Fund Grant No. G0100206

• • • Figure 2.1: Monitoring Well Hydrographs
~0.-------------------------------------------------------------,
335
-Gi > " .... .. 330 " U)
--Monitoring Well #1 " ..
-+-Monitoring Well #2 " :!l. "
-+-Monitoring Well #3 0 325 ;;:; --Monitoring Well #4 .. > -llf- Monitoring Well #5 " iii
--+-Monitoring Well #6 Gi > " 320 .... ~
" -~ 315
310+-------~--------.--------.--------,-------~-------.--------.-~
Mar-02 Jun-02 Sep-02 Dec-02 Mar-03 Jun-03 Sep-03 Dec-03

•
•
•
advancing glacial ice. Typically, Vashon Till consists of a compacted, concrete-like mixture of clay, silt, sand, and gravel that transmits water poorly {DOE 1998). The unit ranges in thickness from 10 to 30 feet and likely underlies much of the sampling area. None of the monitoring wells tapped into the Upper Aquitard.
2.3 Advance Outwash Aquifer The Advance Outwash Aquifer is the principal aquifer used in the Yelm area. The only well sampled for the GMP that tapped the Advance Outwash Aquifer was City well #2. This aquifer underlies the sampling area and consists of sand and gravel deposited by glacial meltwater, ahead to of the advancing glacier. The top of the aquifer occurs approximately at a depth 50 feet below the ground surface. None of the monitoring wells tested tap into the Advance Outwash Aquifer.
The aquifer is recharged primarily from infiltrated precipitation and leakage from the overlying Recessional Outwash Aquifer.
2.4 Lower Aquitard The Lower Aquitard separates the Advance Outwash Aquifer from an even deeper aquifer. None of the wells sampled for the GMP tapped into the Lower Aquitard or the deeper aquifer. Information on the Lower Aquitard was gained from mapping completed for the City of Yelm Wellhead Protection Plan {Robinson-Noble 2001) and the Baseline report. The aquitard consists of hardpacked silty or clayey sandy gravel and is composed of the Kitsap Formation. Due to the fact that none of the wells sampled tapped this aquitard, the depth, location, or existence of this aquitard below the sampling area is not confirmed .
City of Yelm Groundwater Monitoring Project
14 Centennial Clean Water Fund Grant No. G01 00206

MONITORING"""\.~,/ v.£LL I ..
[, - - - - - - :.-:.~- - - - - - - - - f
CONTROL STRUCTURE .3
I
~-- ---- ---- --------~-- ~-- ---- --'~~·-·--- -------- ---- -------- -------~
--••~ APPROXIMATE DIRECTION OF FLOW
' j SKILLIHGS COM HOLLY
5016 Lacey Boulevard SE, Lacey, Washington 98503 (360) 491-3399 (800) 454-7545 Fax (360) 491 -3857
01090 COCHRANE PARK POTENTIOMETRIC MAP f--::-:::5H[[::-, -1
FIGURE 2.2

'-AONITORING-...._ ">'~-.,_'!. WELL 1 ~
[, -- - -- - ~~-- ------ -
'-AONITORING WELL 3
CONTROL STRUCTURE 3
I
~----- ------------~-- ~-- ---- --'~~--·--- --------------------------- --l
----~-~ APPROXIMATE DIRECTION OF FLOW
I i SKILLINGS CON"OLLY
5016 Lacey Boulevard SE, Lacey, Washington 98503 (360) 491 -3399 (800) 454-7545 Fax (360) 491-3857
D"M;t- 1090- A.dw<j Xset. YSTDOCilD, X50558AS. 12/26/01 10:58 corilo
COCHRANE PARK MARCH POTENTIOMETRIC MAP
FIGURE 2.3
01090
SHEET
SHEETS

•
•
•
3.0 Groundwater Monitoring As discussed previously, the GMP was completed in an effort to identify potential impacts of discharging Class A reclaimed water into the aquifer. The majority of wells tested for the Baseline report (DOE 1998) were located in the northeast quadrant, approximately 1-mile to the northeast of Cochrane Park. Sampling locations for the Baseline were down-gradient from GMP sample sites. The Baseline report details sampling results for five analytes (nitrate-nitrite-N, total dissolved solids, chloride, fecal coliform bacteria, and ammonium-N). The GMP sampled concentration levels for the same five analytes in both the reclaimed water and in the groundwater. The GMP sampled for ammania-N, instead of ammonium-N. Comparisons of these three sampling areas (reclaimed water, Baseline, and GMP groundwater sampling sites) can potentially show what effect recharge with reclaimed water is having on the aquifer.
Table 3.1 details the results from the Baseline report and the Yelm Groundwater Monitoring Project, comparing the Baseline report to the Class A reclaimed water and to the current groundwater from City well #2 and the six monitoring wells located at Cochrane Park.
Table 3.1: Groundwater Monitoring Project- Baseline Comparison
Analyte Baseline (DOE 1998) Reclaimed Water
Groundwater Monitoring Project
- - -- -. Nitrate-Nitrite-N (mg/L)
. T olaf Dissolve SoiTds -
. (mg/LL .
Min 0.13 67
. ~19ride (f!lg/L) _ 1.2 Fecal coliform bacteria NO a·
.to..1~x. _ f!.olepn 10.1 3.2 158" ·--110 ___ _
17.3 ND
4.9 ··No ·
_(CF_U/1001)1~}: _ Ll _ Ammania-N lmo/L 0 0.014 0.015 NA
a) N D = analyte non-detectable
3.37 302
59.8 ND-
ND
__ Min 1.0
--54
3 1
0.03
Max 7.4 315
62 34
0.56
b) Ammonium-N was only detected twice during sampling for the Baseline report, therefore, no mean has been calculated. See Section 3.1.5 for discussion.
3.1 Yelm Groundwater Baseline Comparison The Yelm Groundwater Baseline Sampling report was completed in order to define the extent of nitrate contamination in the aquifer. For the Baseline, twenty-three private water-supply wells were sampled bi-monthly for one year to define nitrate concentrations in groundwater in a seven square mile area east of the City of Yelm. Twenty-two of the sampled wells tapped the principal aquifer, the Advance Outwash Aquifer that occurs at a depth of 70 to 100 feet below the ground surface. One sampled well tapped the uppermost aquifer that is rarely used for drinking water due to the high risk of contamination from surface water. Well samples were tested for nitrate+ nitrite-N, total dissolved solids, chloride, fecal coliform bacteria, and ammonium-N .
City ofYelm Groundwater Monitoring Project
17 Centennial Clean Water Fund Grant No. G01 00206
Mean 3.23 125.
19.3 6
0.13

•
•
•
The City of Yelm produces Class A reclaimed water at the City's water reclamation facility. The City consistently and reliably produces Class A reclaimed water consistent with their National Pollutant Discharge Elimination System (NPDES) Permit (No. WA0040762). Results from sampling of the reclaimed water are beneficial when comparing results from the Baseline report to results from groundwater sampling to see if there is any correlation between recharge of the aquifer with reclaimed water and analyte levels within the groundwater.
Class A reclaimed water was sampled at the reclamation facility. Table 3.1 compares concentration levels for the Baseline report with analytes levels in the reclaimed water. Testing results for analyte levels within the groundwater, sampled as part of the GMP, are also detailed in Table 3.1. Comparison of concentration levels at these three areas gives a good representation as to what the quality of the aquifer was like prior to recharge, the quality of the water being used for recharge {Class A reclaimed water), and the quality of the aquifer after recharge with Class A reclaimed water.
To determine analyte concentration levels in the groundwater, a total of seven test wells were sampled quarterly for a period of two years as part of the GMP. The test points include six monitoring wells situated in close proximity to the CTWs at Cochrane Park and a final well {City well #2), which is used by the City of Yelm to withdraw drinking water from the aquifer. Please refer to Table C.1, Appendix C for the precise locations of these sampling points. Results from the GMP are detailed in Table 3.1. These results can be compared to results in the Baseline report and to analyte concentration levels in the reclaimed water.
3.1.1 Nitrate+Nitrite-N In general, for the Baseline, up-gradient concentrations were less than 1 mg/L with concentrations increasing down-gradient. The observed elevated nitrate concentrations in the down-gradient direction confirm that nitrogen loading occurred between the upgradient and down-gradient test wells. According to the Baseline report approximately half of the Advance Outwash Aquifer within the baseline sampling area has nitrate+nitrite-N concentrations exceeding 3 mg/L and approximately 10% of the aquifer has concentrations exceeding 5 mg/L {DOE 1998).
Nitrate-N and nitrite-N were tested for separately for the Groundwater Monitoring Project. Due to the fact that the groundwater baseline report listed nitrogen levels as nitrate+nitrite-N, nitrate-N and nitrite-N results from the GMP have been combined for a more accurate comparison between the GMP and the Baseline. The mean concentration of nitrate+nitrite-N in the reclaimed water sampled for the GMP was 3.37 mg/L. The mean concentration of nitrate+nitrite-N in groundwater {City well #2 and six monitoring wells) sampled for the GMP was 3.23 mg/L.
3.1.2 Total Dissolved Solids (TDS) Baseline levels represent relatively low concentrations for groundwater and are probably a function of rapid groundwater movement in the Yelm area and the proximity to recharge sources {DOE 1998). The mean concentration for the Baseline report was 110 mg/L.
The mean concentration level for TDS in the reclaimed water was 302 mg/L, which is higher than that in the groundwater. The mean concentration level of TDS in the groundwater was 125 mg/L.
City o!Yelm Groundwater Monitoring Project
18 Centennial Clean Water Fund Grant No. G01 00206

•
•
•
3.1.3 Chloride Chloride is considered a good tracer in groundwater because it is.readily soluble in water and does not absorb to soil particles. It is naturally occurring, but is also present in human and animal wastes. The mean concentration in the Baseline report was 4.9 mg/L.
Sampling of the reclaimed water for chloride resulted in a mean concentration level of 59.8 mg/L. Sampling of the groundwater, as part of the GMP, resulted in a mean concentration level of 19.3 mg/L.
3.1.4 Fecal Coliform Bacteria Fecal coliform bacteria were not detected in any of the Baseline samples during the study period. The presence of fecal coliform bacteria in groundwater usually indicates proximity to a potential contaminant source area (DOE 1998). The presence of fecal coliform bacteria can also indicate the presence of groundwater under the influence of surface water.
While no fecal coliform bacteria were detected in the City's reclaimed water, fecal coliform bacteria were detected in all seven wells during at least one sampling event. Fecal coliform bacteria were detected during two sampling events in Monitoring Well #1. Fecal coliform bacteria counts ranged from 1 CFU/1 OOmL to 34 CFU/1 OOmL with the majority of fecal coliform bacteria detection occurring during the 71
• quarter of testing (10/22/2003). A large storm event occurred during this quarter of testing. Fecal coliform bacteria were not present at any of the wells during repeat testing (subsequent quarter).
3.1.5 Ammon ia-N The test methods (EPA 350.3) for ammania-N for the Baseline study and the GMP convert all NH; to NH3taq) and report the results as NH3-N. Based on chemical equilibrium equations for the conditions in groundwater at Yelm, the predominate form of ammonia in aqueous solution is NH;. This means that the number of NH/ ions in solution in the groundwater outnumber the NH3taq) molecules by orders of magnitude. Therefore, the results in the Baseline study were reported as NH4 • (ammonium-N) concentrations. The ammonia results for the GMP are also dominated by NH4 •. even though the results were reported by the laboratory as NH3-N (ammania-N) (Erickson 2004a). Therefore, the results from both studies can be directly compared (Erickson, per. comm. 2004b).
Ammonium-N was detected in two wells for one sampling event per well in the Baseline report. Both detections, 0.014 and 0.015 mg/L, were only slightly above the method detection limit (0.010 mg/L). Ammonium is an indicator of animal and human waste loading. Ammonium-N does not readily move through groundwater, so its presence in groundwater usually indicates proximity to a source area (DOE 1998).
Ammania-N is the most common form of nitrogen in effluent from biological treatment. It is toxic to fish at relatively low concentrations and can exert a significant oxygen demand.
Ammon ia-N was not detected during sampling of the reclaimed water. Sampling of the groundwater for ammania-N, as part of the GMP, resulted in a mean concentration level of 0.13 mg/L.
City of Yelm Groundwater Monitoring Project
19 Centennial Clean Water Fund Grant No. G01 00206

•
•
•
4.0 Constructed Treatment Wetlands In addition to the five (5) analytes sampled for comparison to the Baseline, twenty-four (24) other analytes and four (4) parameters were sampled for as part of the GMP. Table 4.11ists all of the analytes and parameters sampled for as part of the GMP. Results from sampling of reclaimed water can be compared to the results from sampling of the constructed treatment wetlands and to the groundwater.
Sampling results of reclaimed water did not vary significantly from quarter to quarter. This is due to the consistent reliable treatment capability of the Reclamation Facility. Results from sampling of the reclaimed water serve as a concentration level baseline for analytes sampled for within the GMP. By comparing concentration levels within the reclaimed water to concentration levels within the CTWs and the surrounding groundwater, the ability of CTWs to provide effective additional treatment to the reclaimed water prior to recharge to the aquifer can be determined.
The intent of the CTW treatment chain is to provide additional polishing of the Class A reclaimed water prior to discharge to the City's aquifer. Reclaimed water, which is produced at the reclamation facility, enters the treatment chain via the inflow structure (at an average rate of 50,000 gallons per day), where it is conveyed into Wetland Cell #1, which is a surface flow wetland. From Wetland Cell #1, the water flows into a fish pond, then into Wetland Cell #2. Wetland Cell #2 is a subsurface flow wetland. The water is then conveyed into Wetland Cell #3, which is a surface flow wetland, prior to being discharged into the aquifer via RIBs (Figure 1.2).
Table 4.1 also details the results of testing for the GMP. For each analyte sampled for, and each parameter measured, the minimum level detected, the maximum level detected, and the sample mean is listed. Results are listed for sampling of the reclaimed water, CTWs, and for the groundwater, showing the water quality trend as reclaimed water goes from the reclamation facility, through the CTW treatment chain, and finally into the aquifer.
Analysis of the seasonal variation of analyte concentration levels may provide insight into the processes occurring within the CTW chain. Table C.2 (Appendix C) details concentration levels for nitrate-nitrite-N, ammania-N, total dissolved solids, dissolved organic carbon, iron, manganese, fecal coliform bacteria, and chloride.
Water within the CTWs is not regulated under state drinking water standards and is not required to meet primary and secondary MCLs. Please refer to Section 5.0 Summary Discussion for a discussion on where water is required to me·et the primary and secondary MCLs .
City of Yelm Groundwater Monitoring Project
20 Centennial Clean Water Fund Grant No. GO 100206

•
•
•
Table 4.1: Groundwater Monitoring Project Testing Results
Analyte
Chloride (mg/L) Ammania-N ([i]QtJ,)_ _ : __ Nitrate-N
·Nitrite-N-_ _______ _ Total Dissolved Solids
_(mg!!,) - - ---- -Biochemical Oxygen
_l;lemang 5-<!~Y (ll)g/!,) Bromide (mg/L) biSSoive Or98nic Carbon (!!}gi!,) _ _ _ _ Fluoride (mg/l)
-.§yifat!> {mgt(,)_ _ Surfactants (mg/l) fulrQn <~9lC) -_ --Chromium (~gil) coppe[(~gt(.) - _ )!:on_(~g/l)__ _ __ ~!!Yer (~gil-)
__ Manga~.e~~-(~g/~) __ _ Le'!_CI_ (~gil) Zinc (~gil) Total tntialomeiluines
_(ITHJA) (~g/!,) Fecal coliform bacteria Fecal Strep!oco~g _- -Total Kjeldahl Nitrogen (TKN) (mg/L)
--NliMA --Caffeine -~[£U!Y (~g)[,)_- _:_-Cadmium (~gil)
_ Arseri~ (~gl!,) · N1ckel (~gil) ---a--
- I~rnperature _ ('C) pHd -- __ d ______ _
Conductivity (~mhQsi~m) Dissolved Oxygen d
(mg/L)
Class A Reclaimed
Water
Constructed Treatment Wetlands
Min
59.8 5 _:_ N__Q •--=-=: -~ Q,oa -_:_::
3.37 0.'!__ --__ NO___ 0"9_1
302 220
0.2 7.7
"2
Max Mean
111 67.1 ~x ::_ __ o.82--_ 12.8 3.5 OJiL --_:_ 0.02~-392 300
0.1 12.4
Min
0.1 2
Groundwater
Max Mean
0.2
~ ------
19.3 Q;t]_ -3.23
0._91_3 125
0.15 7.62
NO 0.02 0.19 0.052 0.01 0.06 0.034 ?JT _:om_ ~ll - _g4:<f_ 1.:0:. -g_a.o -~- ·aJ>C 0.09 0.028 0.35 0.159 0.03 0.07 0.047 -21<L. -- - o.4 §5Q -_ ~14 -- Q:Q2 _ ~~~ -- 81.7 NO 8 12 9.67 8 13 10.5
_ ?~~o_ __ 6_ 36- -Hl.3 _ o,ooy _ _ §Q_ 2L99 48.0 29 600 171 0.16 5400 442.7
- .f.J~ _-_ -_- ~: 7]> - io.o·- : n~- -- 9:"_ j_ -- !I 70 2 280 70.6 0.023 7900 297.3
-®--::-----NQ __ --ND =NO- 1 ----~i-- --_J&t--::-46 6 64 30.5 0.28 47 12.75 32.0------1 ----85 ____ 13.o2 -1' f __ f __ _
NO 2 2000 r-· ··-- -- § - - 4QQO 0.95 1.1 10
i'JQ _ _ __ _NO - NQ NO NO NO
__ NO----=-_ ·No- - Ni5 -NO NO NO I'J_Q- - - - Nl;l - l'l!J -NO 16 19
1Y65 - --- 5.2-- - -22.7 7.4 6.87 9.46
533.5 416 aos
11.18 0.32 14.45
249 1 49§ - - 1 -
3.3 1.1
6.57 6.05 533· · - 112
6.63 3.66
34 5 - 34QQ_ 12£
2.8 1.7
6.54
10.62 7.41
a) NO - analyte non-detectable. b) Single occurrence. c) Outlier value of 913 mg/L removed from data range (sample occurred during fifth quarter at
Monitoring Well #1 ). d) Parameters; these four parameters were measured during analyte sampling. Parameters are
measurable factors that help define the sampled medium, in this case water, and are useful when comparing analyte levels.
4.1 Constructed Treatment Wetlands Some of the ana lyles detected during the eight quarters of testing are not easily described in the same format as the rest of the analytes. Some analytes (nickel, chromium, manganese, and dissolved organic carbon) were detected only once or twice during sampling, while one parameter (temperature) exhibited temporal trends that were
City of Yelm Groundwater Monitoring Project
21 Centennial Clean Water Fund Grant No. G01 00206

•
•
•
not apparent in Table 4.1. Below is a discussion of those analytes and parameters that do not follow the normal data trends.
4.1.1 Nickel Nickel was detected two times in the CTWs during the sampling rounds. During the 2nd
quarter, nickel was recorded at 16 IJg/L at Wetland Cell #1. Nickel was also detected at Wetland Cell #3 with a level of 19 IJg/L.
4.1.2 Temperature Temperature levels within the CTWs varied depending on the ambient air temperature. Temperature levels during the cooler months (November through April} averaged 6.62 ·c (43.9 "F) while during the warmer months (May through October), temperature levels averaged 19.4 ·c (66.9 "F).
On average, temperature levels within the groundwater were lower during the cooler winter months and higher during the warmer summer months. The mean temperature during the cooler months was 10.49 •c (50.9 "F), while the mean temperature during the warmer months was 14.61 ·c (58.3 "F).
4.1.3 Chromium A detectable level of Chromium was measured in three CTW samples over the course of two sampling events with a mean of 9.67 mg/L. Chromium was detected once during the third quarter at Wetland Cell #2 (subsurface flow wetland) with a level of 8 IJg/L. Chromium was also detected at two different locations during the fourth quarter; once with a level of 12 11g/L at the Inflow Structure and once with a level of 9 IJg/L at the Fish Pond .
Chromium was detected in the groundwater during two separate quarterly sampling events at two different locations. Chromium was detected at Monitoring Well #1 during the 2nd quarter with a value of 8 IJg/L. Chromium was also detected during the 41
"
quarter at City well #2 with a concentration of 13 IJg/L.
4.1.4 Manganese The mean concentration level of manganese in the reclaimed water was 70 IJg/L. The mean concentration level in the CTWs was 70.6 IJg/L, with a maximum concentration level of 280 IJg/L recorded at the fish pond. Manganese levels were greatest during the 3'd quarter and 6'" quarter of testing in the fish pond. Manganese levels remained elevated in subsequent portions of the treatment chain.
Manganese concentration levels in the groundwater varied greatly among the wells tested. Monitoring Well #6 experienced the highest detection levels with a mean concentration of 1937 IJg/L, while Monitoring Well #1 had the second highest detection levels with a mean of 71.62 IJg/L. The remaining wells sampled had a mean of 14.4 IJg/L. Please refer to Section 5.2.3 for a discussion on potential reasons for these elevated levels.
4.1.5 Dissolved Organic Carbon A single sample level of 913 mg/L was detected in the groundwater during the 5'" quarter at Monitoring Well #1. The next highest level detected was 25 mg/L. The sample level
City ofYelm Groundwater Monitoring Project
22 Centennial Clean Water Fund Grant No. G0100206

•
•
•
of 913 mg/L is being considered a statistical outlier and has been excluded from data range.
5.0 Summary Discussion Analyte levels in the Baseline, reclaimed water, and groundwater for nitrate-nitrite-N, TDS, chloride, fecal coliform bacteria, and ammania-N are detailed in Section 3.0 of this report. The effects of using Class A reclaimed water for aquifer recharge are summarized in Section 5.1, Baseline Comparison.
Analyte and parameter levels in the reclaimed water, when compared to levels in the CTWs and within the groundwater (sampled at City well #2 and the six monitoring wells) demonstrate the affect of using CTWs to provide Class A reclaimed water secondary polishing. In addition, comparison of analyte and parameter levels from the CTWs inflow to levels from the CTW prior to discharge to the RIBs demonstrates the treatment capacity of the CTW treatment chain. These comparisons are summarized in Section 5.2, Constructed Treatment Wetlands.
A pilot reverse osmosis unit was also tested, to demonstrate the treatment capacity of reverse osmosis on Class A reclaimed water (Section 5.4, Reverse Osmosis Treatment).
Primary and secondary MCLs were discussed within the Introduction (Section 1.0) of this report. These MCLs only apply to water regulated under state drinking water standards. Due to the fact that the City of Yelm currently utilizes a treatment system for its potable water, drinking water quality standards apply to the water withdrawn from the aquifer after receiving the required treatment. Therefore, none of the groundwater samples are regulated under state drinking water standards. In addition, water sampled within the CTWs is not required to meet state drinking water standards. However, comparison of sampling results to the state drinking water standards has been included to show, based on these results, that the recharge of the aquifer with Class A reclaimed water is not affecting the water quality of the aquifer, which is the City's only current source of drinking water. However, it should noted that groundwater, tested within the monitoring wells, is required to meet the water quality standards detailed in the City of Yelm's NPDES permit for the reclamation facility.
5.1 Baseline Comparison In the report titled Yelm Groundwater Baseline Sampling, sampling for five analytes was conducted to determine the extent of nitrate contamination to the aquifer and to establish a "baseline" to compare future water quality tests. Testing results for nitrate+nitrite-N, TDS, chloride, fecal coliform bacteria, and ammonium-N are detailed in that report. The City of Yelm Groundwater Monitoring Project included sampling these same analytes in the reclaimed water and in the localized aquifer at Cochrane Park. The groundwater sampling was also conducted at the City of Yelm's drinking water well (City well), downgradient from the infiltration basins.
The analyte concentration levels in the GMP were compared to the Baseline report in an effort to determine if any impacts resulting from groundwater recharge using reclaimed water could be detected. The results of the current testing and the Baseline test results are captured in Table 5. 1 .
City of Yelm Groundwater Monitoring Project
23 Centennial Clean Water Fund Grant No. G01 00206

•
•
•
Table 5.1: Groundwater Water Quality
Reclaimed Analyte Baseline Water
3.2 110
nL 302
_ Nitr!IIEtNitrite-~ (mg/1..) Total Dissolved Solids (mg/L)
. clilo[iCie_(f:DgLL,L ~ ~~-- _ ~ 4.
•
•
•
It was also observed that TDS levels were higher at the monitoring wells that are adjacent to the RIBs. TDS concentration levels for the City well had a mean of 85 mg/L, which is below the Baseline, indicating that the small increase in TDS levels is occurring only in the vicinity of the RIBs and that TDS is not migrating from the Recessional Outwash Aquifer to the Advance Outwash Aquifer. This is expected due to the aquitard which separates the two aquifers, restricting the direct movement of water between the two.
5.1.3 Chloride Chlorine plays a large role in the disinfection of wastewater. A large portion of chlorine remains in solution as chloride and chloramines, while the rest is lost to the atmosphere as chlorine gas. Because of the low biological demand for chloride, chloride levels do not change through the treatment chain. Chlorides are not a by-product of wetland processes; however, increases in chloride concentration levels can occur due to evapotranspiration. Groundwater sampling in the GMP indicates that chloride levels have increased in comparison to the Baseline report. Due to the fact that chloride levels are higher within the reclaimed water, it is possible that this increase is related to recharge of the aquifer with reclaimed water. It should be noted that although chloride levels have increased in the groundwater, the concentration level of 19.3 mg/L is still significantly lower than the secondary MCL (250 mg/L).
5.1.4 Fecal Coliform Bacteria Sampling of the reclaimed water did not indicate the presence of fecal coliform bacteria; therefore, it is reasonable to assume that changes in water quality between the Baseline and the GMP are not due to concentration levels in the reclaimed water. Fecal coliform bacteria levels did increase though the constructed treatment wetlands. It is assumed the increased levels of fecal coliform bacteria in the groundwater have resulted from the degradation through the CTW process. The current primary MCL for fecal coliform bacteria is 1 CFU/1 OOmL.
5.1.5 Ammon ia-N The level of ammonia-N in the reclaimed water was non-detectable. Therefore, an increase in ammonia-N in the groundwater does not indicate that the discharge of reclaimed water is causing a degradation of water quality within the aquifer, but is most likely caused by the CTW process. Currently, no MCL has been established for ammonia-N.
5.2 Constructed Treatment Wetlands In the QAPP, it is stated that if sampling results show that water quality decreases as the water travels through the treatment chain from the inflow structure to the RIBs, then the constructed treatment wetlands can be considered to be degrading the water quality of the reclaimed water before it is discharged into the aquifer. Comparison of analyte concentration levels in the reclaimed water with concentration levels in the CTW and in the groundwater will indicate the ability of CTWs to provide secondary polishing to Class A reclaimed water. While reclaimed water enters the CTW treatment chain at the inflow structure, concentration levels at the inflow structure will vary from those in the reclaimed water. This can be attributed to the fact that 40% of the water coming into the CTWs is being re-circulated from Cell #1 of the CTWs. Table 5.2 details analyte concentration levels for the reclaimed water and within the CTW Treatment Chain. Changes to parameter levels (temperature, pH, DO, and conductivity) are expected within the CTWs due to the natural biological processes that occur in wetlands.
City of Yelm 25 Centennial Clean Water Fund Groundwater Monitoring Project Grant No. G01 00206

•
•
•
Table 5.2: Constructed Treatment Wetlands Water Quality
Ana lyle Reclaimed Water
_Chloride (mg/l,}___ __ __ 59.8 Ammonia (mgil} -- -ND'-
Biochemicall6xygen- ND
7.7
Inflow RIB • Structure
__ 61.51L __ 66.22 1.8 0.18 ND ___ -- 5.17
11.88 11.38 _Demand !1:day (mgib} Dissolved Organic Carbon (J!!gfb)__ - ~--.
.Fluoride (mg/l,} _ Nitrate-N (mgil)
-Nifrit8~~f(IT]Qf1}~~~- ~ __
-No::- __ - -o.os _: __ §])4 3.37 5.79 2.06
:· HD- ::- ~-: Q,QL- - Q,_94_ Surfactants (mgil) __ _ 0.09 0.19 0.14
_Sulfate (mgib)_: -- 27.3- 285:·-- . 2~Q--Total Dissolved Solids 302 300 297
. (mglb) - --- -.§oroll_(~gib} ______ 210J -_--Chromium (~gil) _ _ ND
·capJi•'' (~giLL - _ _ _ _ .1.3.Q_ _
-_~C 12 ...
1~~ ND -~?-
Iron (~gil) 48 _Manga_r1_e~~{~g/!:.) - ___ _ 7Q_ _____ _
.Jn.-126
;10.25_ 16
177 10_0 19
Ground water
Primary MCl
1~!.~~-~---0.13 -
- 3] - - --:
7.62
Q_,(l:).4 -~- 4.0 --3.23 10.0 o.9f3 _ -= ·i.o 0.047 8,!34 125
l)LJ -10.5 100
Secondary MCl
- :!1"~9. 442.7
1~_QQ -- -300
~jj ~-:__ - - - _5Q- ----
ND 100 Nickel c (~gil) ND Zinc (~gib} - -: . -- _ 4§ --- · . - _39.75 ~ _}~(-~~- -:12.?9 Total Trihalomethanes 32 41.54 1.33 1 100 _(~gil) --Fecal coliform bacteria -- Nb-- -(gEUi1 OOm_l,L __ . __ Fecal streptococcus (per 4 100mls) T o-tBI Kjeldahl Nitrogeri - - 0.95 (l]'lgil,) _B~omide d (mgil)_ _ _ 0.2 Silv~r (~gil,} . _ _ ]\ID NOMA ND
: Qllf!eLne _. _ ___ _ ___ NI> Mercury (~gil} ND
L_e<'!<! (~gil)-- - N.P_ Cadmium (~gil} _ ND
· Ar§enig_(~g/b) : = _ _ N_Q_ Dissolved oxygen • (mg/l) 11.18 pH_0_ - - ____ - - ·_ - 7.4
Conductivity • (~mhos/em) ··Temperature • ·-c- · ·-a) Rapid Infiltration Bas1n.
533.5
ND
3
4.45
0.1
8"33 ND
-~- NO __ _ ND N_Q_ ND
- -- --
~1:) -8.32
291
570
1.85
ND
-
Nj)_ ND
_ND ND
_ ND ND
__ NO 6.80
-ni-- -- 7.57 - -
546 523 -- --13.85 13.5
5
122
1.7
0.15
~ ND Nb _ _ _
1
ND 2
--- 1Q -.
- 1_,_[7 : 1~- - -~ - -_ . ND 5
____ NO ____ _____ sQ_ -~-~~ --~: 7.41 6.54 212
12.68
b) ND = analyte non-detectable. c) Nickel was only detected twice within the CTWs. once at the inflow structure (2"d quarter) and
once prior to RIBs (3"' quarter}. d) A single detection during sampling occurred once at Inflow Structure. e) Parameter.
While primary and secondary MCLs have been included for comparison, as stated above, water within the CTWs is not regulated under state drinking water standards. It should also be noted that CTWs, while an engineered form of treatment, are still utilizing biological systems. Treatment capacities of CTWs are attributed to the biological process occurring within the wetland system, including: nutrient uptake, photosynthesis, respiration, and the nitrogen cycle. Due to these varied biological processes, analyte
City of Yelm Groundwater Monitoring Project
26 Centennial Clean Water Fund Grant No. G0100206

•
•
•
concentrations within the CTWs can also fluctuate greatly and elevated analyte levels are not uncommon.
Some of the analytes, which include: chromium, iron, manganese, nickel, and fecal coliform bacteria, were either not consistently detected during sampling or exhibited unexpected detection level. These analytes are discussed further below. In addition, some of the parameters sampled for, including: temperature, pH, and dissolved oxygen are also discussed in further detail below.
5.2.1 Chromium Detectable levels of chromium were measured in three sampling instances within the CTWs. Chromium was detected once during the 3'• quarter at wetland cell #2 (subsurface flow wetland) with a level of 8 IJg/L. Chromium was also detected at two different locations during the fourth quarter; once with a level of 12 IJg/L at the inflow structure and once with a level of 9 IJg/L at the fish pond. Chromium was non-detectable prior to the RIBs during all of the sampling quarters, indicating a possible increase in water quality. The primary MCL for chromium is 100 IJg/L (0.1 mg/L), significantly higher than detected levels.
5.2.21ron Sampling of the reclaimed water for iron resulted in a mean concentration level of 48 IJg/L. The mean concentration level for iron at the inflow structure of the CTWs was 126 IJg/L, rising to 177 IJg/L prior to the RIBs. Sampling of the groundwater for iron resulted in a mean concentration level of 442.7 IJg/L. The secondary MCL for iron is 300 IJg/L. Additional testing is necessary to determine possible reasons for this elevated concentration level of iron within the local groundwater. It should be noted that the mean concentration level at the City well was 84.5 mg/L, significantly below the secondary MCL, indicating that any elevated iron levels are occurring only in close proximity to the CTWs.
5.2.3 Manganese Manganese concentration levels in Monitoring Well #6 are extremely high. The average concentration of manganese in Class A reclaimed water was 70 ug/L, while the average concentration at the inflow structure was 20.25 ug/L. This shows that the increased levels of manganese must be occurring within the wetlands treatment chain.
Manganese is an essential element that is vital to photosynthesis. Manganese is used for respiration and nitrogen metabolism by plants and animals (Kadlec and Knight1996). Wetland reduction of manganese concentrations has been studied at a variety of natural and constructed treatment wetlands. Manganese removal efficiency is 68 percent at inflow concentrations up to 100 ug/L, indicating that the CTWs should be reducing manganese levels rather than increasing them. Removal efficiency is reduced to 40 percent at inflow concentrations between 210 and 5250 ug/L. Inflow concentrations for the sampled treatment chain averaged 20.25 ug/L with a range between 3 ug/L and 40 ug/L.
Given the relative removal efficiencies of constructed treatment wetlands and the basic biological processes of wetland vegetation, it can be deduced that manganese is being either concentrated within the treatment chain or is being introduced by a source other than the inflow of Class A reclaimed water .
City ofYelm Groundwater Monitoring Project
27 Centennial Clean Water Fund Grant No. G01 00206

•
•
•
The highest concentrations of manganese were detected in Monitoring Well #6 which is the farthest monitoring well from the rapid infiltration basins. If manganese concentrations in the groundwater were being caused by discharge from the treatment chain into the groundwater, high manganese concentrations would be expected in those monitoring wells adjacent to the discharge basins (Monitoring Wells #2, #3, and #4). These three wells combined had an average manganese concentration of 17.17 ug/L. There is the possibility that one of the treatment cells has a leak in its impervious liner, causing localized manganese concentrations in Monitoring Well #6. If this was the case, elevated levels of other analytes would be expected in the same well. This has not been observed however. Therefore it is possible that manganese is being introduced to the groundwater via another source.
Discussion with City of Yelm staff has indicated that the feed used in the fish pond (for the fish) contains manganese. Manganese is a common ingredient in commercial fish food. It has also been observed that a large population of waterfowl, mostly mallards, use the constructed treatment wetlands as habitat. The local waterfowl population has been observed feeding on the fish food, prior to moving into the surrounding areas of the treatment cells. It is likely that the elevated levels of manganese are being caused by the waste product of waterfowl in the vicinity of both Monitoring Well #6 and #1. Due to the shallow aquifer in this area, it is possible that manganese is being introduced to the localized groundwater due to influence by surface water. This would also explain why manganese levels are lowest during the summer months, as this is when fish are most active and consuming a larger percentage of feed. In the colder months, fish are less active, leaving more feed for consumption by waterfowl populations.
Another possible reason for elevated manganese levels may be due to naturally occurring manganese present in glacial sediment. Elevated manganese levels could occur if manganese is being mobilized within the groundwater due to a change in redox (reduction-oxidation) potential. The low dissolved oxygen levels in the vicinity of Monitoring Well #2 suggest that this may be occurring (Erickson 2004c).
It should be noted that the mean concentration level of manganese at the City well was 8.5 ~g/L, significantly below the secondary MCL (50 ~g/L), indicating that any elevated manganese levels are occurring only in close proximity to the CTWs.
5.2.4 Nickel Nickel was detected two times during testing. During the 2"d quarter, nickel was recorded at 16 ~g/L at Wetland Cell #1. Nickel was also detected at Wetland Cell #3 with a level of 19 ~g/L. The fact that nickel occurred at only two sample locations indicates that further testing over a longer duration will need to be conducted to achieve more conclusive results. While the primary MCL for nickel is 100 ~g/L (0.1 mg/L), and water within the CTW is not regulated under state drinking water standards, concentration levels were significantly lower than the MCL.
5.2.5 Fecal Coliform Bacteria Fecal coliform bacteria levels at the inflow structure were zero or non-detectable. Fecal coliform bacteria levels increased to a mean of 276 CFU/1 OOmL at the fish pond and 291 CFU/100ml prior to the RIBs. It should be observed that the fecal coliform bacteria levels dropped at the sub-surface flow wetland to 56 CFU/100ml. Overall, the CTW treatment chain results in higher concentrations of fecal coliform bacteria as the water flows through the wetland cells. This is most likely due to the presence of water fowl and other birds as well as the fish pond. However, it appears that the sub-surface flow
City of Yelm Groundwater Monitoring Project
28 Centennial Clean Water Fund Grant No. G01 00206

•
•
•
(SSF) wetland is effective in reducing fecal coliform bacteria counts and does improve the water quality. While the primary MCL is 1 CFU/100ml, water within the CTWs is not regulated under state drinking water standards.
5.2.6 Temperature Temperature levels ranged from 5.2 'C (42 °F) to 22.7 'C (73 °F) with a mean of 16.7 'C (62.06 'F). Temperature levels varied depending on the ambient air temperature. Temperature levels did not fluctuate significantly through the treatment chain, indicating neither an increase nor degradation of water quality. Currently, there is no MCL set for temperature.
5.2.7 pH Acidity levels ranged from a pH of 6.87 to 9.46 with a mean pH of 7.66. Changes in pH through the treatment chain were fairly consistent from quarter to quarter with a few exceptions. The pH levels fluctuated from 7.47 at the Inflow Structure to 7.57 prior to the RIBs. pH levels were the highest in the fish pond. This pH is higher than in the groundwater. Currently, there is no MCL set for pH.
5.2.8 Dissolved Oxygen Dissolved oxygen (DO) levels ranged from 0.32 mg/L to 14.45 mg/L with a mean of 6.63 mg/L. The mean concentration of DO at the inflow structure was 8.3 mg/L, dropping to 6.6 mg/L at wetland cell #1, increasing to 7.9 mg/L at the fish pond, decreasing to 3.45 at wetland cell #2 (subsurface flow), and finally increasing to 6.8 mg/L prior to the RIB's. This fluctuation has not been interpreted as an increase or degradation of water quality. Currently, there is no MCL set for dissolved oxygen .
5.2.9 Non-Detectable Analytes A number of analy1es that were tested for during monitoring did not register at or above detectable levels. This indicates that the treatment chain is not causing a degradation of water quality for these analy1es. However, there is insufficient data to determine if the CTW treatment chain would provide additional treatment. The following analy1es were not detected during any of the sampling events:
o NOMA (n-nitrodisodimethlamine) o Lead o Caffeine· o Cadmium o Mercury o Arsenic
5.3 Seasonal Variation in Field Parameters As discussed previously. four field parameters were measured and analyzed at all of the sampling locations. While changes in field parameters do not always indicate a degradation or improvement in water quality, they should be considered when analyzing other analy1es sampled. In depth analysis of measured field parameters was not completed as part of the GMP; however, analysis of the seasonal variation in the measured field parameters may provide insight into dissolution and mobility of other analy1es sampled for the GMP. Table 5.3 details variations in measured field parameters at each sampling location over the course of sampling for the GMP. As discussed previously, additional analytes are included in Table C.2, Appendix C, which details seasonal variations in these selected ana lyles.
City ofYelm Groundwater Monitoring Project
29 Centennial Clean Water Fund Grant No. G01 00206

•
•
•
Table 5.3: Seasonal Variations in Field Parameters
Sample Quarter
CW" MW6" MW1 MW2 MW3 MW4 MWS IS' CS1" CS2 CS3 CS4
_ _ __ Ptl_ · f'' Quarter 6.38 6:22 6.37- 6.47 6.05 6.64
-2 .. Quarter 6.46 -6j7- 6.52 .. 6-:-51 6:17- 6:67 3"' Quarter 6.38 - -7.38 ___ 6-:-64 6.29 6.43 6.58 4"'-0uarter--6.67 --7.33 -6]4- 629--6.56- 6:9
-5"' Quarter 6.5- -- 6:-35--6.67-- 6.33 6.22 6.85 6"'ciu~-sA6--- 6.14 -- s:s---6.53-- a.14 6~64
6.34 7.5 8.69 7.78 7.48 -6:38 7.53 7:55 - 7.91 - -7 29-
----
6.26 7.25 6.87 7.7 7.09
8.2 7.96-7.08
6.52---7.43 -7.56 -8.15. -7.49-- 7.45--- - ·- --- . ~- ---- --------
6.49 7.39 7.44 9.4 7.21 7.93 6.31 7.39 - 7.09- --i.-74-- . 7.04 -1.27
-:;th Quarter 6.53 - 1~·r --- 6.65-- 6.48- -6_5~ s.sr e.s 7.64 --7-.2- - ·-r.-a3 -- 1.2 7.24 -!!"'-Q-uart-er- ~§.~~- _-_6_,1~-.:_ -6.-9!-_ -_-6,_-6_ -::s.:35- 6-.:!1-~- · 6.4_(-:_ :_7.5!!_:_-_ 7,67_ To2- T62 · -7J2
· --~ ~- ~--=~-----:- :~-~:__~-~ __ T.imJ1erature('gJ~: ---- ---------~-:_:_-:_~~ _------1 ' 1 Quarter_ _1_Q,8 ___ !02.__ _ !_Ct_6 __ _1_1.:.2_ --~.!Jl_ 9:: _ 10.5 6.1 6.2 6.0 5.8 6.0 znd Quarter 12.8 14.7 12.9 12.9 13.7 14.5 15.6 20.8 -- 22.2- - -22:2 - 227 -22.3
·3"'ouarter---i1.2 -'i2.3--12~3--f2:5 ·1i4 ___ i2.4 ·15_9 ____ 2o.1 -17:5- 21f4- 1a.2 17.5 4"'ciuarter- -1o.S ____ 1o.1- -- -1o.4 -1o.4- ff.9 --12.1 __ 1o:6 --g:o- --7.9- -6:9--u- 1.2 _th ______ - ----------------- ------- - - ----- ------ ---- ------5 Quarter 9.7 8.8 8.9 9.4 11.2 10.1 10.0 7.9 8.1 7.3 6.2 6.2
-6., Quarter - 16.? -- 15.2-- -;16.8- 16:0-- f6.i · 18.9 11l.t- 19.a··--·-2a:s-- 21.3- 22.6- 2fs 7th-Qu;!rter- -13.7 - 15-:1 -12.1 · 15.1 15:6-- -16.7- --1s.1 1a.1 1a:a - 19:r ---fa:9- 19.o a"'ou~rt&r- 9.4 ____ 1Q,5_ ~9:1_--w)-::_-:12.2125 11.1 6.a:_- __ 5.4--5.2- 5,6:_--:_-5.4
------- -----J>ls!!~llv~ci9~yierl:!rrig7b) ·--- --1''Quarte-,--- 7.59 5.94 7.43 8.23 4.97 7.17 8.02 7.78 11.37 z"• Quiu'ier 4.86 -5:37 - 6.39- 6.95----s.39 --4.65 5.99-- -6.43 6.94-3"'6uartE!r - 4.2 3.66 7.a3- 6.47-- 5.33 5.44--6.96 - 7.81- o.91
-4"' auarte-r- --8.2a -- 4)6- 826- 8.61- -7.24- 7.36 ·a:e i6.5a - 1o:43 5th ouarter- -9.61- -il-:-26 10.52 9.a6 9.oa a.a2 9.43 1o.66 11.13 6"'-0uarter- 9.02 -7.12--826 i.76 9.0 7:52---9.47 7.11 ·s.24-7th Quarter- 9.64 5.o - 8.41 7.27 6.25 7.06 7.86 7.28 2.6
-§"' Qtgirter ::_ 4.48 -7.1_- ::_-9_:4§:_--- 9:6 -: 1o~62 ·- 10.44 1o.3a-- 9:ar - a.65
- -------~ -=-_ coric!ticlivLty il'm.h9~1clliL:__::__
--
-1'.-auarter ---- -
136 167 134 113 336 357 163 604 529 z"d Quarter ---h3 -- 15i- - . - . -115 ----
323 -161----- 529 ---.
120 287 513 · 3•• ouaiter
-- -------- -332 156 112 122 134 152 368 560 585
4"'-oi.larter -133 -- f2a -- ------ 195--- 360 467 - 177 --- -·--·
143 546 546 -5th-Quarter --------- -
137 186 129 228 398 286 156 549 537 6"'-Quarter 137 163- 127-- 288 306 247 fa7- 531 539 ?tnouarter
-----------254 208 137 134 137 265 425 552 571
8"'-Quarter 145 172 136 340 404 249 250 539 --
534
a) CW = City well b) MWx =Monitoring Well #x c) IS = Inflow Structure d) CSx = Control Structure #x
5.4 Reverse Osmosis Treatment
9.03 4.45 -5:23 1.77 5.33 7.09
-16.67. 4.52 14.45 6.13 4.71
--9.82
3.08 u
0.32 ---5.72
7.78 7.1 7.08 6.02-. 11.87 9.88-4.15 4.38
595 -529-.
521 501 5:fo- · sfr
597 52ii
593 601 533 ___ 525-
461 451 427 526 . 515 516-.
- --- --------591 594 605 495 - 416 472
A pilot reverse osmosis (RO) unit was installed as part of the original construction of the City of Yelm Water Reclamation Facility. The RO unit, an EPR0-250, is made by Environmental Products USA Inc. and can treat up to 250 gallons per day (gpd) of water . An RO system uses a semi-permeable membrane to separate a high percentage of
City ofYelm Groundwater Monitoring Project
30 Centennial Clean Water Fund Grant No. G0100206
•
•
•
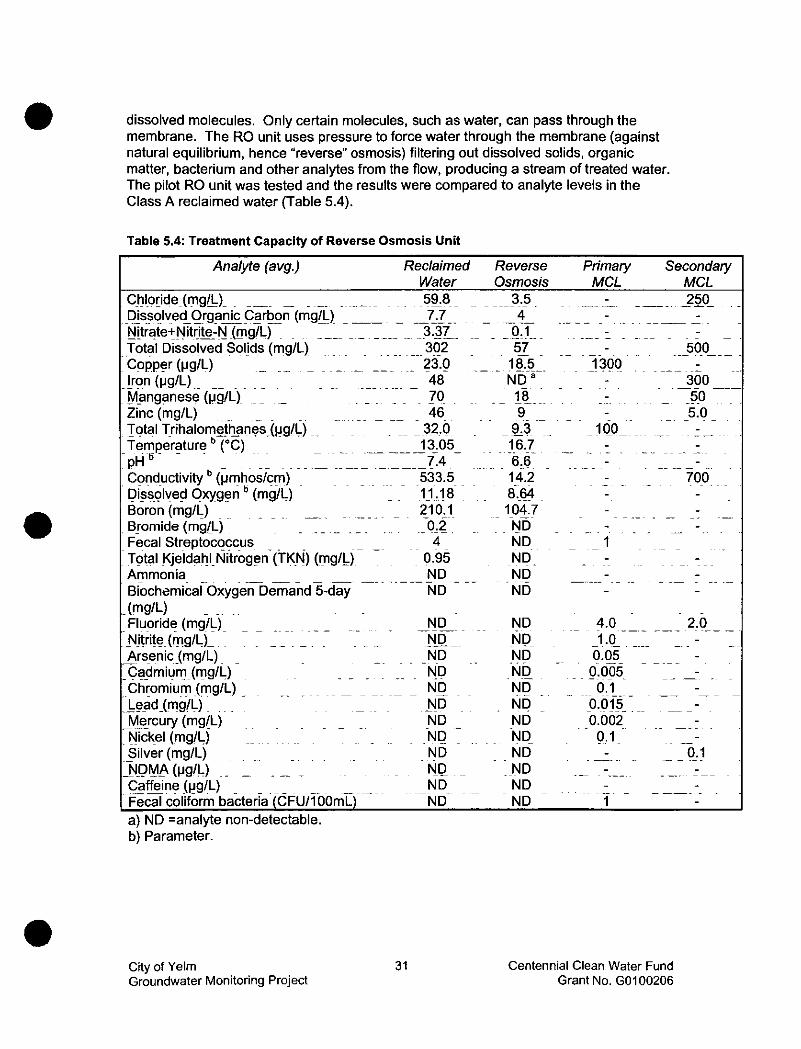
dissolved molecules. Only certain molecules, such as water, can pass through the membrane. The RO unit uses pressure to force water through the membrane (against natural equilibrium, hence "reverse" osmosis) filtering out dissolved solids, organic matter, bacterium and other analytes from the flow, producing a stream of treated water. The pilot RO unit was tested and the results were compared to analyte levels in the Class A reclaimed water (Table 5.4).
Table 5.4: Treatment Capacity of Reverse Osmosis Unit
Analyte (avg.) Reclaimed Water
Chlo[ide (ITigi!o)_ _ __ ~ _ __ _ 5!!.8 _ Dissolved Organic Carbon (mg/L) _ 7.7
· -~itrate+NTtiiie:i'i ([lig/L)- =-~- --~-=----- -T3i _Total Dissolved SoUds (mg/L) _ _ _ __ 3()2 Copp~r (j..ig/L) _ _ __ _ 23.9 Iron (IJg/L) 48
-f.i.!'Jnganese (~g/L) -~ -- - 70 Zinc (mg/L) _ _ _ _ __ _ 46 Tqtal Trihalom~JO?nE:lS(j.Jg/L) 32.0 Temperature • (°C) 13.05
- "1:)-- - - -~------ -pH _ _ __ __ _ ____ ?,4 Conductivity • (IJmhos/cm) 533.5 Df~s_c;llved Oxyg!ln • (mg/1.,) - 11.18 Boron (mg/L) 210.1 Bromide (mgLL) _ 0.?_ . Fecal Streptoc(lccus _ _ _ 4 Total Kjeldai)I_Nitrog!ln (TK_N) (mg/!,) 0.95 Ammonia ND - -- ---~- ------------Biochemical Oxygen Demand 5-day ND
_ (mg/L) Fluoride (mg/L) _ _ _ _ _ NitritE:l (ITigiL,L Arsenic (mg/L) _
_ CajJmiufT, (mg/L) Chromium (mg/L)
ND --~--
I'!Q_ ND ND ND
:1!!ad Jmg/I..J • ·· -- -- -- -
Mercury (mg/L) :-Nickel (mg/L) §ilver (mg/L) ~-QMl\ (IJg/!.,J -- -
-~:::~i~bl~~l bacteria ·ccFulfobmCl ~-a) ND =analyte non-detectable. b) Parameter .
City ofYelm Groundwater Monitoring Project
31
]'JD ND ND ND @ ND ND
Reverse Osmosis
3.5 -- ------- -4 - ---
0.1 ·-- - --------
57 18.5 . - - . ---·---ND"
-- 1_ ~-9
_9.3 16.7
- . - -- --_ ~ _ 6c6
14.2 8.64 104.7 ND ND ND ND ND
ND NQ _ ND ND ND ND ND ND ND ND ND ND
Primary MCL
Secondary MCL
--- __?§_0_
- -
500 _1300
300 --- -- --
50 5.0
100
700
1
4.0 2.0 ---- ---J.Q_. ---0.05
-. 9.005 0.1
0.015 - -- ---- . 0.002
9,1 0.1
- -- --- - --- -1
Centennial Clean Water Fund Grant No. G01 00206

•
•
•
Testing of the treated water from the RO unit indicates an increased water quality through the use of the reverse osmosis treatment system. RO treatment will produce concentrations well below State Drinking Water Standards MCL levels.
6.0 Conclusion
6.1 Baseline Conclusion When looking at the comparison between the Baseline report and the GMP (Table 5.1), it is seen that the increase in chloride and TDS concentration levels can potentially be attributed to the discharge of Class A reclaimed water in the City of Yelm's aquifer; however, chloride and TDS levels are still significantly lower than the secondary MCLs. This conclusion is based on the fact that while four of the five Baseline analytes sampled during the GMP actually increased, only chloride and TDS showed a higher concentration level within the reclaimed water. Increases in both ammania-N and in fecal coliform bacteria can be attributed to the CTWs. For both of these analytes, concentration levels increased prior to discharge to the RIBs.
The recharge with Class A reclaimed water has had no effect on nitrate levels within the aquifer, having remained the same at 3.2 mg/L in both the Baseline report and in the results from the sampling for the GMP. The Baseline report was completed in an effort to define the extent of nitrate contamination within the aquifer before the water reuse project started. Because nitrate contamination had been previously identified in groundwater east of Yelm (Tayne, 1996} the City wanted to ensure that the use of Class A reclaimed water to recharge the aquifer would not cause additional nitrate contamination within the aquifer. Sampling of groundwater at City well #2 and the six monitoring wells has shown that nitrate levels within the groundwater have not changed, indicating that recharge of the aquifer with Class A reclaimed water is not causing an increase in nitrate contamination.
As discussed in Section 2.0 Study Area Hydrogeology, there are two aquifers within the study area, the shallow Recessional Outwash Aquifer and the deeper Advanced Outwash Aquifer. These two aquifers are separated by an aquitard composed of Vashon Till, which restrict the direct movement of water between these two aquifers (Appendix F). The presence of the aquitard also limits the movement of analytes within the Recessional Outwash Aquifer into the Advance Outwash Aquifer. Therefore, it can be concluded that this is why the water quality of City well #2 is not being effected by the recharge of groundwater with Class A reclaimed water.
6.2 Constructed Treatment Wetland Conclusion Secondary polishing of Class A reclaimed water with constructed treatment wetlands in some cases improves the water quality, while in other cases, contributes to the degradation of the water quality prior to discharge to the aquifer. Of the tested analytes (excluding temperature, pH, DO, and conductivity}, seven (7} showed increased concentration levels from the inflow structure to the RIBs, indicating an overall degradation in water quality caused by the treatment chain. Of the tested ana lyles, sixteen ( 16} showed decreased concentration levels from the inflow structure to the RIBs, indicating an overall increase in water quality caused by the treatment chain.
City of Yelm Groundwater Monitoring Project
32 Centennial Clean Water Fund Grant No. G0100206

•
•
•
Seven (7) of the tested analytes did not show any changes in concentration levels (including non-detected analytes), indicating either the tests are inconclusive or the CTWs are ineffective in treating those constituents.
It can be concluded that the CTWs, rather than the reclaimed water, are contributing to changes in the aquifer related to analytes other than TDS and chloride. As discussed previously, this can be attributed to the elevated analyte concentration levels that occur with CTWs due to wetland biological processes. Many of analytes sampled for can have concentration levels that fluctuate widely within the natural system. Because of these fluctuations, elevated analyte levels can be expected.
One trend that was observed is that different parts of the treatment chain provided better treatment for certain analytes, while other portions of the treatment chain caused degradation to water quality. Specifically, the sub-surface flow component of the CTW treatment chain appears to be providing the highest level of treatment The fish pond component of the CTW treatment chain appears to be causing the highest levels of increased analyte concentrations. These trends should be further evaluated to help determine future treatment chain design for better overall reclaimed water quality polishing.
Analysis of data collected for this GMP has shown the affects of using Constructed Treatment Wetlands on Class A reclaimed water. While the sub-surface flow component of the CWT treatment chain has been shown to be providing treatment, the majority of analytes have higher levels coming out of the CTWs than were detected within the reclaimed water. This indicates that further analysis of the existing data, collected as part of this GMP, should support the feasibility of using RIBs for direct recharge of the aquifer with Class A reclaimed water.
6.3 Reverse Osmosis Conclusion Testing of the treated water from the RO unit indicates an increase in water quality through the use of the reverse osmosis treatment system. It can also be concluded that the RO unit was effective at reducing chloride and TDS levels within the reclaimed water. RO treatment will produce concentrations significantly below State Drinking Water Standards MCL levels .
City ofYelm Groundwater Monitoring Project
33 Centennial Clean Water Fund Grant No. G0100206

•
•
•
7.0 References
Driscoll, F.G. 1986. Groundwater and Well, second edition. Johnson Division, St. Paul, Minnesota.
Drost, B.W., G.L. Turney, N.P. Dion, and M.A. Jones. 1998. Hydrology and Quality of Groundwater in Northern Thurston County, Washington. US Geological Survey, Water Resource Investigations Report 92-4109 [Revised]. Prepared in cooperation with Thurston County Department of Health.
Erickson, Dennis 1998. Yelm Groundwater Baseline Sampling. Washington State Department of Ecology Publication # 98-30.
Erickson, Dennis September 28, 2004a. Technical Memorandum to Cindy James, Grant Administrator. Washington State Department of Ecology.
Erickson, Dennis October 5, 2004b. Personal communication with Patrick Skillings, Staff Scientist, Skillings-Connolly.
Erickson, Dennis December 15, 2004c. Technical Memorandum to Cindy James, Grant Administrator. Washington State Department of Ecology.
Kadlec, R.H.,R. Knight. 1996. Treatment Wetlands. Lewis Publishers, CRC Press, Inc .
Moshiri, G.A. 1993. Constructed Wetlands for Water Quality Improvement. Lewis Publishers, CRC Press, Inc.
Robinson-Noble. 2001. draft City of Yelm Wellhead Protection Plan. Prepared by Krista Hitz and Burt Clothier.
Skillings-Connolly, Inc. 1995. City of Yelm Water Reuse Facilities Plan. Volumes I and II.
Skillings-Connolly, Inc, 2001. Quality Assurance Project Plan for the City of Yelm Groundwater Monitoring Project.
Tayne, T., 1996. Letter to Denis Erickson, Washington State Department of Ecology, March 13, 1996, and accompanying well logs and data sheets.
Washington State Administrative Code, Chapters 246-290 and 291. Washington State Department of Health, 1994. Group A and B Public Water Systems, July 1994.
Washington State Department of Ecology, 1999. National Pollutant Discharge Elimination System and State Reclaimed Water Discharge Permit No. WA0040762. NPDES permit for the City of Yelm Reclamation Facility .
City of Yelm Groundwater Monitoring Project
34 Centennial Clean Water Fund Grant No. G01 00206

' • •
\
4
•
' •
•
• -
•
•
• •

•
•
•
WASHINGTON STATE D E ·p A R T M E N T 0 F
E C 0 L 0 G Y
Yelm Groundwater Baseline Sampling
by Denis Erickson
Environmental Investigations and Laboratory Services Program Olympia, Washington 98504-7710
January 1998
Water Body No. WA-ll-1010GW
Publication No. 98-301 printed on recycled paper

• Table of Contents
Page
List of Figures and Tables ................................................................................................ ii
Summary ........................................................................................................................ iii
Recommendations .......................................................................................................... iv
Acknowledgments ........................................................................................................... v
-Introduction .................................................................................................................... I
Site Description ............................................................................................................... 3 Location ................................................................................................................... 3 Regional Geology and Hydrogeology ......................... ~ ............................................. 3
Methods .......................................................................................................................... 5 Monitoring Network ................................................................................................. 5 Hydrogeologic Characterization ................................................................................ 5
Results L Study Area Hydrogeology ................................................................................ 7 General ..................................................................................................................... 7 Recessional Outwash Aquifer ................................................................................... 7 Upper Aquitard ........................................................................................................ 7
• Advance Outwash Aquifer ................................................ : ..................................... I 0 Lower Aquitard ...................................................................................................... I 0 Deep Aquifer .......................................................................................................... II Groundwater Velocity ............................................................................................ 14
Results IL Water Quality . .. .. . .. . .. .. .. .. .. .. .. .. .. . .. .. .. .. . .. .. .. .. .. .. .. .. .. . .. .. .. . .. .. .. .. .. .. . .. .. .. .. .. . .. .. .. .. 17 Quality Assurance ............................................................ , ...................................... l7 Nitrate+Nitrite-N .................................................................................................... 17 Total Dissolved Solids (IDS) ................................................................................. 21 Chloride ........................................... ~ ..................................................................... 21 Amrnonium-N ......................................................................................................... 21 Fecal Coliform Bacteria .......................................................................................... 21
References ..................................................................................................................... 25
Appendices
• Page i

List of Figures and Tables • Figures Figure 1. Well Locations .................................................................................................. 4
Figure 2. South-North Hydrogeologic Profile .................................................................. 8
Figure 3. East-West Hydrogeologic Profile ...................................................................... 9
Figure 4. Selected Well Hydrographs, Advance Outwash Aquifer, April1996 ................ 12
Figure 5. Potentiometric Map, Advance Outwash Aquifer, April 1996 . . . .. .. . ... . . . . . . . . .. .. . . . I-3
Figure 6. Areas with Elevated Nitrate+Nitrite-N Concentrations .................................... 19
Figure 7. Nitrate+Nitrite-N Concentrations for Selected Wells ....................................... 20
Tables Table 1. Summary ofHydraulic Conductivity Results ..................................................... 14
Table 2. Nitrate+Nitrite-N Results, April1996 through February 1997 ......................... 18
•
• Page ii

•
•
•
Summary
Twenty-three private water-supply wells were sampled bimonthly for one year to define nitrate concentrations in groundwater in a seven square mile area east of the city of Y elm. Twenty-two of the sampled wells tapped the principal aquifer, the Advance Outwash Aquifer that occurs at a depth of 70 to 100 feet below the ground surface. One sampled well tapped the uppermost aquifer that is little used for drinking water because it is considered susceptible to contamination from surface activities. Well samples were tested for nitrate+nitrite-N, chloride, total dissolved solids, ammonium and fecal coliform. Nitrate has migrated to the Advance Outwash Aquifer. Areas where mean nitrate+nitrite-N concentrations exceed 3 mg/L and 5 mg/L are identified. Concentrations are not at alarming levels but are high enough that additional nitrogen loading should be prevented. Potential nitrate sources up gradient of the study area are identified. Wells should be resampled in a few years to ensure that conditions have not deteriorated. Long-term monitoring is recommended at Crystal Springs, a natural spring located one mile north ofYelm. Water quality samples at Crystal Springs could be a useful indicator for changes in groundwater quality for a portion of the area north of Y elm .
Page iii

Recommendations
1. Ecology should resample the same wells for nitrate in four to five years. Wells should be sampled bimonthly or more frequently for one year. The data should be evaluated relative to the baseline results of this study to determine ifthere is a trend in nitrate concentrations.
2. A sampling program should be designed and implemented at Crystal Springs as part of the monitoring for the wastewater reuse project. The discharge at Crystal Springs appears to be a convenient sampling point that could indicate changes in groundwater quality for a portion of the groundwater between the city ofYelrn and Crystal Springs.
3. Potential sources of nitrate upgradient of the areas· of elevated nitrate concentrations include:
• onsite sewage systems
• the poultry farm south of Bald Hill Road and west of the intersection ofBald Hill Road and Harris Road
• the poultry farm north of Bald Hill Road and north of the intersection ofBald Hill Road and !lOth Avenue
• the abandoned poultry farm on Bald Hill Road and southeast.ofthe intersection of Bald Hill Road and Harris Road
• the livestock auction yard north of Highway 507
The Ecology Southwest Regional Office (SWRO) should follow up with site inspections and provide technical assistance to the poultry farms.
4. If better resolution of the nitrogen source locations is desired by the SWRO, Ecology should establish a water-level monitoring program to define the groundwater flow direction more accurately including seasonal variability. This program would require identifying additional wells for water level measurements, surveying wellhead :::~- .: :·.
••
•
elevations to 0.1 feet, and monitoring water levels monthly for at least one year. ·::r -::.;--.. ...
• Pageiv

•
•
•
Acknowledgments
I thank the many people who helped with this project.
0 Dave Garland, Water Quality Program hydrogeologist, conceived the need for the project and reviewed the Quality Assurance Project Plan and the draft report.
0 Kathy Cupps, Water Quality Program SWRO, reviewed the Quality Assurance Project Plan and draft report.
0 Melanie Kimsey and Bob Duffy, Water Quality Program SWRO, reviewed the draft report.
0 Pam Covey, Manchester Environmental Laboratory, monitored sample flow and testing.
0 Manchester Environmental Laboratory chemists Becky Bogaczyk, Nancy Jensen, Debbie Lacroix and Casey Maggart conducted testing and provided quality assurance reVIews.
0 Ken Garmann, City ofYelm, provided well information and reviewed the draft report.
0 Joan LeTourneau formatted and edited the report.
0 The well owners allowed us to sample their wells; without their help this project would not have been possible .
Pagev

•
•
•
Introduction
The City ofYelm is proposing to treat its wastewater to a high level and "reuse" the water for irrigation at schools, parks and a proposed golf course; for recharge to groundwater via infiltration ponds; and for constructed wetlands. The susceptibility of groundwater in the Yelm vicinity to contamination is well established. In 1994, in response to elevated nitrate concentrations in groundwater, the City of Y elm constructed a Septic Tank Effluent Pump system, which pumps the primary treated effluent from septic systems in the city to a central treatment plant (Skillings and Lewis, 1995). Because nitrate contamination had been previously identified in groundwater east ofYelm (Tayne, 1996), the Ecology Water Quality Program requested that the Environmental Investigations and Laboratory Services Program conduct sampling to help define the extent of nitrate contamination before the water reuse project starts. This report describes the methods and findings of this baseline assessment .
Page I

•
•
' .
•
Site Description
Location
Y elm is located in southwestern Thurston County, Washington about 20 miles southeast of Olympia. The city is situated on a northwest-southeast trending, flat-lying, glacial outwash plain called the Yelm Prairie. The study area is located east ofYelm and occupies about seven square miles (Figure 1 ). Within the study area, the City of Y elm proposes to reuse treated wastewater on fields at two elementary schools, a park, and a constructed wetland (Skillings-Connolly, 1995). However, most of the treated wastewater will be applied to a future golf course, a part of the Thurston Highland development in the upland about 2.5 miles southwest of Yelm, which is not in the study area.
Regional Geology and Hydrogeology
Geology provides the framework within which groundwater moves. The vicinity geology is characterized by a thick sequence of unconsolidated glacial deposits overlying sedimentary bedrock (Mundorff; Weigle and Holmberg, 195 5). Multiple glacial advances and retreats laid down the unconsolidated deposits. Most of the deposits in the Y elm vicinity are a product of the most recent glaciation, the Vashon. Regionally Dion, Tumey, and Jones (1994) identified eight principal geologic units in northern Thurston County (listed in order of increasing age): alluvium, Vashon recessional outwash and end moraine, Vashon Till, Vashon advance outwash, Kitsap Formation, "penultimate" glacial deposits, undifferentiated unconsolidated deposits, and bedrock.
The principal aquifers in the region occur as saturated layers of sand and sandy gravel in unconsolidated deposits. These layers readily transmit water and are sandwiched between silty layers of relatively low permeability. As a result, the study area hydrogeology is characterized by multiple water-bearing zones with depth. Dion, Tumey and Jones (1994). identified the following three principal regional aquifers:
• alluvial and recessional outwash deposits
• advance outwash deposits
• "penultimate" glaciation deposits
The study area geology and hydrogeology are discussed in Results I.
Page 3

Explanation
32G03 WeiiiD 0 Well Location
Proposed Treated Wastewater Application Area
YelmCreek
32G03
0
,? Q:-0 Q
$' 33008 ~
q;'li
33805 0
33804
r--n----------I I
I City .: 30E04
:of , I ' 1 Yelm ,'
Yelm Creek
Crystal Springs
One Mile
Figure 1. Yelm Groundwater Baseline Sampling Well Locations •
Page4
•
•
•

• Methods
Monitoring Network
A groundwater-monitoring network was established using existing private water-supply wells. Wells were inventoried from the following sources: US Geological Survey Groundwater Information System, US Geological Survey Water Resource Division files, well logs on file at the Ecology Southwest Regional Office, and Thurston County Environmental Health well information.
Twenty-three wells were identified and selected for sampling. The locations of sampled wells are shown in Figure 1. Well construction data for each of the sampled wells are listed in Appendix A, Table A-1. The depth of sampled wells ranged from 21 to 119 feet with a mean depth of about 90 feet. Wells were sampled for nitrate+nitrite-N, ammonium, chloride, total dissolved solids, and fecal coliform bacteria. Sampling procedures are described in Appendix B. Wells were sampled bimonthly (every other month) for one year from April1996 through February 1997. Static water levels were measured at 16 wells. The wellhead elevations were estimated from I :24,000 topographic maps with 20-foot contour intervals.
• Hydrogeologic Characterization
•
The stratigraphy of the study area was defined using drillers' logs for 55 wells with verified locations. Elevations of the tops and bottoms ofhydrogeolgic units were determined based on lithologies described on the drill logs and are shown in Appendix A, Table A-2. Because conditions are inferred by extrapolating between well locations, actual conditions may vary from those portrayed. Also, the density of wells varies spatially and drillers' logs vary in quality, therefore the hydrogeology of some areas is better defined than others. Lithology data were managed and hydrogeolgic profiles were prepared using ROCKW ARE UTILITIESTM software,
PageS
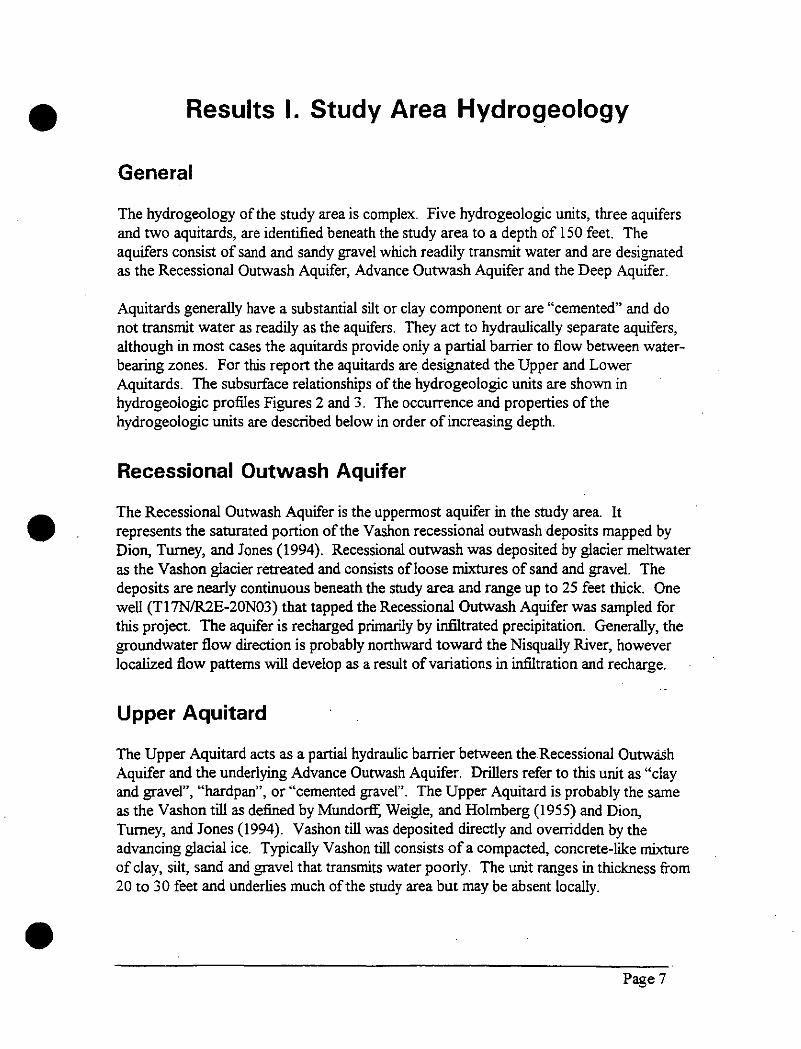
•
•
•
Results I. Study Area Hydrogeology
General
The hydrogeology of the study area is complex. Five hydrogeologic units, tlrree aquifers and two aquitards, are identified beneath the study area to a depth of 150 feet. The aquifers consist of sand and sandy gravel which readily transmit water and are designated as the Recessional Outwash Aquifer, Advance Outwash Aquifer and the Deep Aquifer.
Aquitards generally have a substantial silt or clay component or are "cemented" and do not transmit water as readily as the aquifers. They act to hydraulically separate aquifers, although in most cases the aquitards provide only a partial barrier to flow between waterbearing zones. For this report the aquitards are designated the Upper and Lower Aquitards. The subsurface relationships of the hydrogeologic units are shown in hydrogeologic profiles Figures 2 and 3. The occurrence and properties of the hydrogeologic units are described below in order of increasing depth.
Recessional Outwash Aquifer
The Recessional Outwash Aquifer is the uppermost aquifer in the study area. It represents the saturated portion of the Vashon recessional outwash deposits mapped by Dion, Tumey, and Jones (1994). Recessional outwash was deposited by glacier meltwater as the Vashon glacier retreated and consists ofloose mixtures of sand and gravel. The deposits are nearly continuous beneath the study area and range up to 25 feet thick. One well (T17N/R2E-20N03} that tapped the Recessional Outwash Aquifer was sampled for this project. The aquifer is recharged primarily by infiltrated precipitation. Generally, the groundwater flow direction is probably northward toward the Nisqually River, however localized flow patterns will develop as a result of variations in infiltration and recharge.
Upper Aquitard
The Upper Aquitard acts as a partial hydraulic barrier between the.Recessional Outwash Aquifer and the underlying Advance Outwash Aquifer. Drillers refer to this unit as "clay and gravel", "hardpan", or "cemented gravel". The Upper Aquitard is probably the same as the Vashon till as defined by Mundorff; Weigle, and Holmberg (1955) and Dion, Tumey, and Jones (1994). Vashon till was deposited directly and overridden by the advancing glacial ice. Typically Vashon till consists of a compacted, concrete-like mixture of clay, silt, sand and gravel that transmits water poorly. The unit ranges in thickness from 20 to 30 feet and underlies much of the study area but may be absent locally .
Page?

South North
17N/02E-32P01 17NI02E-32G04 17N/02E-29R08
350
17N/02E-32G03 HN/02E-32A03 17N/02E-29J04 17N/02E-28E03 17NJ02E·29AOB
Rece anal twaah qulfer
17NI02E-20003 17N102E·29B01 tJNJ02E-20KOS 17N/02E-20C04 35Q
17N/02E·20F03
300 Aqult r
300
250 250
lower Aqultard
200 ·-----------l:t-' Deep Aquifer 200
0 2,000 4,000 6,000 8,000 10,000 12,000 14,000 16,000 18,000
Figure 2. South-North Hydrogeologic Profile in the Vicinity of Yelm, Washington .
• • •

•
West
17N/02E-30N02
17N/02E-30M02
17N/02E-30K04
17N/02E-30K06
•
17N/02E-29J04
East
17N/02E-28R02
17N/02E-33B04
'lr-rn--------------------~·~'~::'·~-,~~~'n 17NJ02r~-":"~"~-------1Rn~
350 350
Upper Aqulterd Upper Aqultard
300 300
Advance Outwash Aquifer Advance Outwash Aquifer
250L-~L-------------------------------=---------------------~250
0 2,000 4,000 6,000 8,000 10,000 12,000 14,000 16,000 18,000
Figure 3. West-East Hydrogeologic Profile in the Vicinity of Yelm.
•

Discontinuous, water-bearing lenses of sand and sandy gravel occur within the till which can provide enough water for a domestic well. These lenses have limited lateral extent • and typically are less than five feet thick. No wells sampled for this project were completed in these discontinuous lenses.
Advance Outwash Aquifer
The Advance Outwash Aquifer is the principal aquifer in terms of use in the Y elm area. Twenty-two of the 23 wells sampled for this project obtain water from this aquifer. This aquifer continuously underlies the study area and consists of sand and gravel deposited by glacial meltwater ahead of the advancing glacier. The deposits typically range from 10 to 50 feet thick. The top of the aquifer usually occurs at depth of about 70 to 100 feet below the ground surface.
The aquifer is recharged primarily from infiltrated precipitation and leakage from the overlying Recessional Outwash Aquifer. Figure 4 shows water level fluctuations in five wells completed in the Advance Outwash Aquifer over the study period. The seasonal water-level fluctuation ranged from about six to 13 feet. Water levels were highest in the late winter and spring and lowest in late summer and fall.
Figure 5 shows the groundwater-flow pattern for the Advance Outwash Aquifer. The map was constructed from water-level elevations measured in 16 wells in Apri11996. The groundwater-flow pattern is strongly influenced by the Nisqually River. In the • southern portion of the study area groundwater flows northwestward but swings westerly as it approaches the river.
Lower Aquitard
The properties and the distribution of the Lower Aquitard are not well defined. Only five of the wells used to define stratigraphy penetrate the entire thickness of the Lower Aquitard. The Lower Aquitard separates the Advance Outwash Aquifer from the Deep Aquifer. The Lower Aquitard was identified only in the north-central•portion of the study area. Its thickness is variable ranging from less than 5 feet to greater than 60 feet. The aquitard consists of hardpacked silty or clayey sandy gravel and may be equivalent to the Kitsap Formation. However, there is disagreement about the presence and distribution of the Kitsap Formation in the Yelm area. Noble and Wallace (1966) did not identify the Kitsap Formation in well logs near Yelm but Dion, Tumey and Jones (1994) indicate that the unit continuously underlies the study area. Also, because the Kitsap Formation represents lake, swamp and floodplain deposits it should consist predominately of silt and clay. ·
Page 10 •

• Deep Aquifer
•
•
Little is known about the occurrence and distribution of the Deep Aquifer in the study area; only five of the 55 well logs used for stratigraphy reached the Deep Aquifer. The Deep Aquifer consists mostly of sand and gravel. The Deep Aquifer may be equivalent to the outwash deposits of an older glacial advance, called the "penultimate" glaciation (Dion, Tumey and Jones, 1994). No wells tapping the Deep Aquifer were sampled for this project .
Page 11

't:l 370 ~
C1> -N
* 360 ~- -·--~ ~
-~ 350 -~ .
~ c ~ 340
c YE29R04 0
E iii 330
~ YE30E04
~
~ 320
310 --
300 ~--------~----------~----------~----------~----------~--------~ 3/26/96 5/15/96 7/4/96 B/23/96 10/12/96 12/1/96 1/20/97
Figure 4. Selected Well Hydrographs, Yelm Groundwater Baseline Sampling .
• • •

•
•
•
Explanation •
...
• 362
Wall Location
Potentiometric
Contour
(1 [).foot interval)
Groundwater Flaw Direction
•
Springs 0
Scale One IIIIa
Figure 5. Potentiometric Map, Advance Outwash Aquifer, April1996 .
Page 13

Hydraulic Conductivity
Hydraulic conductivity is a measure of the ease that water moves through an aquifer. Under most circumstances, it is one of the most important factors that affects the rate that groundwater moves. Typical hydraulic conductivities for coarse glacial sediments such as the deposits that occur in Yelm range from 2.8 to 2,800 feet/day (Fetter, 1980).
For this study we estimated hydraulic conductivity from 76 well-yield tests using the method described by Bradbury and Rothschild (1985). This method is an iterative solution to the Theis equation with modifications for partial penetration and well loss. Well construction information and test data for the hydraulic conductivity estimates are listed in Appendix A, Table A-3. The hydraulic conductivity results are summarized in Table 1. The results show that hydraulic conductivity varies substantially vertically and horizontally. For each aquifer the geometric mean is considered the best estimate of central tendency for hydraulic conductivity results (Freeze, 1975). The geometric means for each aquifer are listed in Table 1.
Table 1. Summary of Hydraulic Conductivity Results. (Units = feet/day)
Geometric Aguifer Name Minimum Maximum Mean
Recessional Outwash 4,800 66,000 18,000
Lenses in Vashon Till 47 6,800 370
Advance Outwash 10 12,000 87
Deep 22 380 72
Groundwater Velocity
Groundwater velocity can be estimated using Darcy's Law:
. v =- K (dhldL)/n.
where, v = the average linear groundwater velocity (feet/ day) K = hydraulic conductivity (feet/ day) dhldL = .hydraulic gradient (dimensionless) n. = effective porosity (dimensionless)
Page 14
Number of Tests/Wells
211
16/15
42/42
16/11
•
•
•

•
•
•
From Darcy's Law the average groundwater velocity for the Advance Outwash Aquifer is expected to range between 0.2 and 200 feet/day. This is based on:
• a hydraulic gradient of0.004 (from Figure 4, 50 feet/12,300feet)
• an effective porosity of 0.25, and
• the hydraulic conductivities listed in Table 5.
The best estimate for the average groundwater velocity of the Advance Outwash Aquifer is about one to two feet/day using the geometric mean of the .hydraulic conductivity (87 feet/day).
Wert (1989) reported a dye test conducted in the 1960s by Milt Johnson, retired water master for the City ofYelm, that had some remarkable results. Two gallons of dye were placed in a city well and dye was observed in Crystal Springs, about 6600 feet north of the well location, less than 12 hours later. This corresponds to a groundwater flow velocity of 13,200 feet/day. This velocity is substantially greater than the average velocity of one to two feet/day estimated using Darcy's Law.
Assuming that results of the dye test are described accurately, a possible explanation for the difference in the velocities obtained from the dye test and from the Darcy's Law calculation is that there is a preferred groundwater flowpath that connects the city well to Crystal Springs .. Considering the meltwater origin of the deposits in Y elm, this pathway could be a buried stream channel that might consist of coarse gravel with little or no sandy matrix material. Such a deposit would have very high hydraulic conductivity. The lateral extent of this zone is not known but based on the hydraulic conductivity results from well-yield tests, it appears to have limited extent .
Page 15

•
•
•
Results II. Water Quality
Quality Assurance
Quality assurance results are shown and summarized in Appendix C. Accuracy and precision oflaboratory results were estimated using matrix spikes, laboratory duplicates and calibration standards. Blind field duplicates were used to estimate overall sampling and laboratory precision. Based on the quality assurance sample, all water quality data are considered acceptable for use.
Nitrate+ Nitrite-N
All water quality results for this project are listed in Appendix D, Table D-1. Nitrite+nitrate-N results are summarized in Table 2. Nitrite+nitrate-N concentrations for all wells over the study period ranged from a minimum of0.13 mg!L to a maximum of 10.1 mg!L. The mean concentration for all wells was 3.2 mg/L.
The Drinking Water Standard (Maximum Contaminant Level, MCL) for nitrate is 10 mg!L for public water-supply systems (Chapter246-290,-291 WAC). Only one well (YE28R04) had a concentration exceeding 10 mg/L (10.1 mg!L) and this occurred for one sampling event. The mean concentration over the study period for well YE28R04 was 8.6 mg!L.
The distribution of mean nitrate+nitrite-N concentrations is shown in Figure 6 .. In general, upgradient concentrations are less than about one mg!L and concentrations increase downgradient. The observed elevated nitrate concentrations in the downgradient direction confirm that nitrogen loading is occurring between the upgradient and downgradient wells. Hachured areas on Figure 6 approximate where mean concentrations exceed 3 mg!L and 5 mg/L. Nearly half of the Advance Outwash Aquifer within the.study area has nitrate+nitrite-N concentrations exceeding 3 mg/L and about 10% of the aquifer concentrations exceed 5 mWI;-.
Figure 7 shows nitrate+nitrite-N concentrations for six wells over the study period. With the exception of well YE20R04 the data show little seasonal variability. At well YE20R04 the concentrations were highest in late winter/early spring (at the beginning and end of the study) and lowest in the fall .
Page 17

Table 2. Nitrate+Nitrite-N Results Summary, Aprill996 through February 1997. ---
Site ID Mean Minimum Maximum Difference Delltii_!~L_Depth Bottom Aquifer YE20A02 4.73 3.49 6.30 2.81 55 55 RO/AO • --· ~------
YE20F03 · 2.97 2.76 3.16 0.40 115.3 115.3 AO -~-
YE20K05 5.34 5.00. 6.44 1.44 119 119 AO -------- - -·--------·-- --
YE20N03 3.5 2.56: 4.48 1.92 21 2l'RO ---
YE20QOI 5.98 4.24 8.15 3.91 70 90:AO - ----------
YE20Q04 5.95 4.89• 7.65 2.76 58 58 AO YE28M04 0.47 0.43 0.50 0.07' 96 96 AO
-YE29A05 0.37 0.28 0.70 0.41 106 106 AO YE29A07 6.22 4.94 7.34 2.40 101 101 AO -----------YE29B04 2.86 1.74: 4.47 2.73 85 85 AO YE29C04 6.16 4.57 9.79- 5.22 100 100 RO/AO YE29J03 0.76 0.69' 0.86 0.17 96 96.AO -------YE29R04 8.63 6.77 10.10 3.33 100 IOO.AO
YE29R05 3.41 3.14 3.61 0.47' 85 85•AO YE30E04 0.47 0.41' 0.54: 0.13 97· 97 AO YE30H05 2.00· 1.10! 2.58: - 1.48: 42 49iAO
YE32A03 0.53, 0.50. 0.57 0.08 80 80'AO
YE32G03 0.15: 0.13. O.J9i 0.05 83 93'AO ---YE32H02 1.02 0.94' 1.20 1 0.26 80 80'AO
-YE33B04 5.21 i 4.11 6.14: 2.03: 118 118'AO YE33B05 2.50i 2.30· 2.63 0.33l 118 118'A0 YE33D08 3.24: 2.44. 3.95 1.51: 105 105 AO YE33N03 0.62. 0.49 0.70' 0.22' 109 109 AO Mean- 3.18' 1.48' 89• 90 • Minimum- 0.13.
Maximum- 10.10; RO= Recessional Outwash Aquifer
-~- ----AO=Advance Outwash Aquifer
• Page 18

•
•
•
Explanation
0.47 N03+N02-Hcancentntion
Q Well location
~ Concentnltlons g...,.. than 5 mg/L
YelmCreek
Scale One Mile
Figure 6. Mean Nitrate+Nitrite-N Concentrations for the Advance Outwash Aquifer •
Page 19

:::r 0, §. c 0 :::; I! .. c "' u c 0 0
•
11 ------------------------~---------------------
10
9
8
7
6
5
4
3
--20K05
-II-29A07 ----.- 29C04
~29R04
..,-lll-33804
-+-20001
2 ~------+-------r-~-------~-----------~--------1 4/9/96 6/12/96 8/21/96 10/8/96 12/10/96 -2/11/97
Figure 7. Nitrate+Nitrite-N at Selected Wells, Yelm Groundwater Baseline Sampling .
• •

• Total Dissolved Solids (TDS)
•
•
Total dissolved solids (IDS) concentrations ranged from 67 to !58 mg!L with a mean of 110 mg!L. For groundwater these represent fairly low concentrations and are probably a function of rapid groundwater movement in the Y elm area and the proximity to recharge sources. The Drinking Water Standard for IDS is a Secondary MCL and is 500 mg!L (Chapter 246-290 and -291WAC). A Secondary MCL is not health based but instead is based on aesthetics such as taste, odor or staining.
Chloride
Chloride concentrations ranged from 1.2 to 17.3 mg!L with a mean of 4.9 mg!L. Chloride is considered a good tracer in groundwater because it is readily soluble in water and does not adsorb to soil particles. It is naturally occurring but is also present in human and animal wastes. The Secondary Drinking Water Standard for chloride is 250 mg!L (Chapter 246-290 and -291WAC).
Ammonium-N
Amrnonium-N was detected in two wells for one sampling event for each well. Both detections, 0.014 and 0.015 mg!L, were only slightly above the method detection limit, 0.01 mg!L. Ammonium is an indicator of animal and human waste loading. Because ammonium does not readily move through groundwater, its presence in groundwater usually indicates proximity to a source area.
Fecal Coliform Bacteria
Fecal coliform bacteria were not detected in any samples during the study period. The presence of fecal coliform bacteria in groundwater usually indicates proximity to the source area .
Page 21

•
•
•
Discussion
Groundwater quality in the study area is generally good. The susceptibility of the Recessional Outwash Aquifer to contamination is widely recognized by local well drillers and the public. Only one active well was found that obtained water from this aquifer. This well was used for irrigation and not drinking water. Most new.wells in the area are completed in the Advance Outwash Aquifer or deeper aquifers. The nitrate concentrations in the Recessional Outwash Aquifer are largely unknown but because the aquifer is so shallow they are probably high locally. The one well sampled for this study that tapped the Recessional Outwash Aquifer had a mean nitrate+nitrite-N concentration of3.5 mg!L.
Nitrate has migrated to the Advance Outwash Aquifer that occurs at a depth of70 to I 00 feet below the ground surface. Areas where nitrate+nitrite-N concentrations exceed 3 mg!L and 5 mg!L in the Advance Outwash Aquifer are shown in Figure 6. Using the potentiometric map (Figure 5) to define flow direction it is possible to identifY the general area, up gradient of the elevated nitrate, where the nitrogen sources are located. Potential nitrogen sources within this area include:
• onsite sewage systems
• the poultry farm south ofBaldHill Road and west of the intersection of Bald Hill Road and Harris Road
• the poultry farm north of Bald Hill Road and north of the intersection ofBald Hill Road and llOth Avenue
• the abandoned poultry farm on Bald Hill Road and southeast of the intersection of Bald Hill Road and Harris Road,
• the livestock auction yard north ofHighway 507
The presence of a preferred groundwater flowpath in the area north ofYelm is significant from a water quality perspective. A zone of hydraulically connected groundwater flows toward the preferred flowpath and eventually discharges at Crystal Springs. Water quality samples at Crystal Springs could be a convenient and cost-effective means to indicate changes in groundwater quality from this zone. However, because the areal extent drained by the preferred flow zone is not known, possible ·correlations of changes in groundwater quality with source activities are limited .
Page23

•
• Page24·
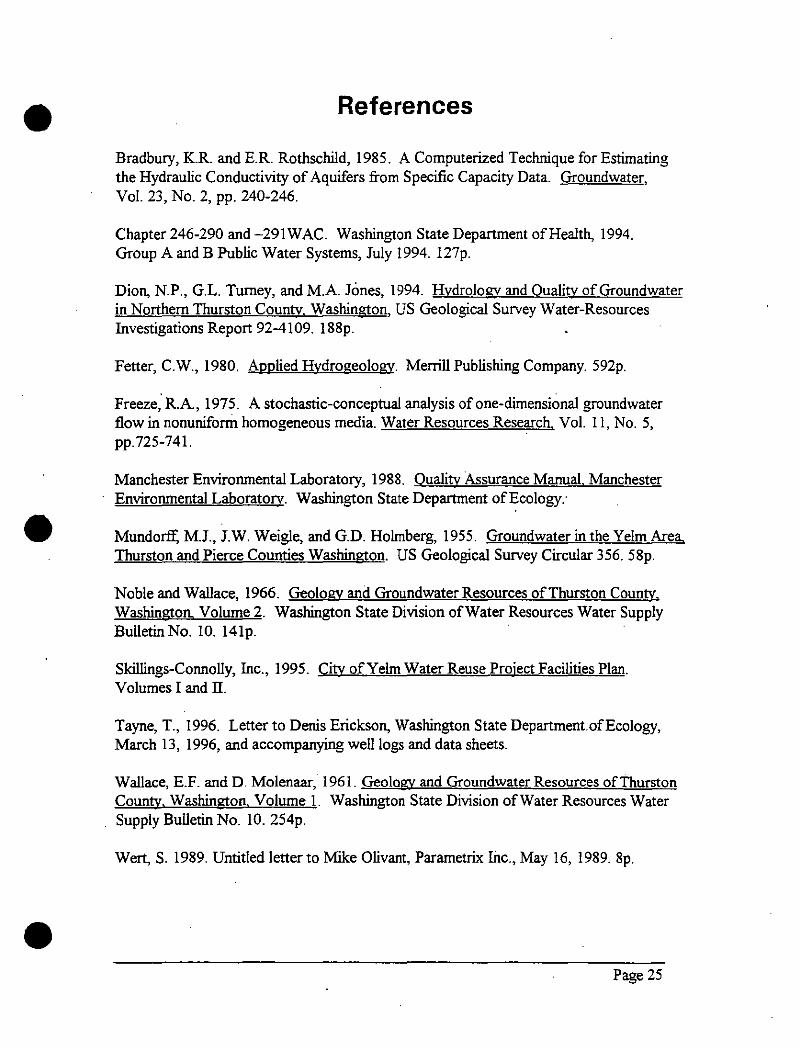
•
•
•
References
Bradbury, K.R. and E.R. Rothschild, 1985. A Computerized Teclmique for Estimating the Hydraulic Conductivity of Aquifers from Specific Capacity Data. Groundwater, VoL 23, No.2, pp. 240-246.
Chapter 246-290 and -291 WAC. Washington State Department of Health, 1994. Group A and B Public Water Systems, July 1994. 127p.
Dion, N.P., G.L. Turney, and M.A. Jones, 1994. Hydrology and Oualitv of Groundwater in Northern Thurston County, Washington, US Geological Survey Water-Resources Investigations Report 92-4109. 188p.
Fetter, C.W., 1980. Applied Hydrogeology. Merrill Publishing Company. 592p.
Freeze;R.A, 1975. A stochastic-conceptual analysis of one-dimensional groundwater flow in nonuniform homogeneous media. Water Resources Research, VoL 11, No. 5, pp. 725-741.
Manchester Environmental Laboratory, 1988. Quality Assurance Manual. Manchester Environmental Laboratory. Washington State Department of Ecology:
Mundorff; M.J., J.W. Weigle, and G.D. Holmberg, 1955. Groundwater in the Yelm Area, Thurston and Pierce Counties Washington. US Geological Survey Circular 356. 58p.
Noble and Wallace, 1966. Geology and Groundwater Resources of Thurston County, Washington, Volume 2. Washington State Division ofWater Resources Water Supply Bulletin No. 10. 14lp.
Skillings-Connolly, Inc., 1995. City ofYelm Water Reuse Project Facilities Plan. Volumes I and II.
Tayne, T., 1996. Letter to Denis Erickson, Washington State Department.ofEcology, March 13, 1996, and accompanying well logs and data sheets.
Wallace, E.F. and D. Molenaar, 1961. Geology and Groundwater Resources of Thurston County, Washington, Volume L Washington State Division of Water Resources Water Supply Bulletin No. 10. 254p.
Wert, S. 1989. Untitled letter to Mike Olivant, Parametrix lite., May 16, 1989. 8p .
Page 25

•
• Appendices
•

•
•
•
APPENDIX A
Table A-1. Well Construction Data for Sampled Wells.
Table A-2. Elevation of the Top of Hydrogeologic Units.
Table A-3. Yelm Wells Specific Capacity Tests and Hydraulic Conductivity Results.
Table A-4. Water-Level Elevations, Aprill996 .

WELLDATA.XLS
Table A-1. Well Construction Data for Sampled Yelm Wells. ---~--------- ----~ - -----,-- ------ ----~- ------ -··----- -~-------~
_ Altitude -----~ ~a tic Water----------------- ---------- ---~~- -------- ------·--·
State Plane State Plane MSL Date _ Open Water Bearing __ --------- ---- ----- -· ··----;- . -~---·-
LocaiiD X y (Feet) Drilled Interval Level Zone Remarks
T17NIR2E-20A02 1478588 596152 340 12/23/92 55 30 AO Unconfined
Tl7NIR2E-20F03 1480866 - 595961 335 04/24/89 115.3 32 AO Unconfined Tl7N/R2E-20J02 1482642 593977 340 10/1/89 53-58 36 TILL Water level only.
TI7N/R2E-20K05 1480245 594357 345 03/10/83 119 44 AO
TI7N/R2E-20N03 1479470 592765 343 1960's 21 13 RO Unconfined
Tl7N/R2E-20QO I 1481838 593172 340 11125178 90 40 AO Tl7N/R2E-20Q04 1480202 593991 350 09125173 58 39 AO
TI7N/R2E-28M04 1483648 589043 360 07/06/93 96 59 AO
Tl7N/R2E-29A05 1483465 591308 350 06/30/95 106 56 AO Tl7N/R2E-29A07 1482347 591980 350 04/23/85 101 40 AO Tl7N/R2E-29B04 1482532 590351 350 611105 85 --- AO · Depth reported.
Tl7N/R2E-29C03 1479974 591704 348 07119/84 40-80 31 AO Sampled once. Tl7NIR2E-29C04 1480929 591605 348 9/17179 100 38 AO TI7N/R2E-29J03 1482502 588640 357 08/06/86 96 36 AO TI7N/R2E-29R04 1483135 587912 365 04123/94 100 38 AO Tl7N/R2E-29R05 1482006 581996 362 01/11195 85 25.8 AO Tl7N/R2E-30E04 1472870 589934 362 04/15/92 97 29 AO Tl7N!R2E-30H05 1475196 588855 362 06/22/87 49 27 AO TI7NIR2E-32A03 1482263 586412 360 3/28/75 80 42 AO TI7N/R2E-32G03 1480739 583955 362 09/02/92 93 32 AO TI7N/R2E-32H02 1483167 585260 360 04/20/84 80 28 AO TI7N/R2E-33B04 1487842 586405 385 10/04/94 118 59 AO TI7N/R2E-33B05 1486512 584862 390 06/10/86 118 48 AO Tl7N/R2E-33D08 1484463 585684 370 12/14/88 105 43 AO TI7N/R2E-33N03 1486079 580520 430 05/19/92 109 75 AO RO- Recessional Outwash Aquifer ____
---- ----- --~--- ---·· ··- .. ---- ···---- -------·-·· ------------AO= Advance Outwash Aquifer
• • •

WELLZONE
Table A-2. Elevation of the Top of Hydrogeologic Units. - ·· wcifio ____ -.AiJitirer -- · · x.- ~ -v -~ -n.o-~ nL1.~ tilier-Ti LL ~tiLC
·------L.AQTRD o.AQTRD -----~----
AO DEEP BOTTOM 17N/02E-19NO I AO 1473978 593307.8 345 334 - - 310 283 - - 282 17N/02E-20A02 AO 1478588 596151.6- - - - 340 ._ - - 285 17N/02E-20C04 DEEP 1480660 597072.3 331 - - 310 264 226- 213 17N/02E-20F03 AO 1480866 595966.6 335 - - 313 - - - 291 17N/02E-20J02 TILL 1482642 593977.4 340 301 289- - - - - 282 17N/02E-20J04 DEEP 1482642 593977.4 340 300 289 282 246 190 173 - 145 17N/02E-20J05 AO 1482792 593611.3 340 324 263 259 254 - - - 223 17N/02E-20K05 AO 1480245 594357.3 345 319- - 267 - - - 226 17N/02E-20L05 AO 1482565 593433.1 355 315 295 264- - -17N/02E-20N03 RO 1479470 592765.1 343 - - - - - - - 322 17N/02E-20P03 AO 1479471 5922(1.4 345 332 - - 304 - - - 247 17N/02E-20QO I AO 1481838 593172.4 340 333 298 295 248- - - 237 17N/02E-20Q03 AO 1480693 593295.1 350 332- - 266 238 - - 235 17N/02E-20Q04 AO 1480202 593990.9 - 350 - - 294- - - 288 17N/02E-28E03 AO 1483620 589389.1 . 362 330 - - 270- - - 247 17N/02E-28M04 AO 1483648 589043.4 360 341 - - 282 - - - 264 17N/02E"28R02 AO 1488184 586996.3 380 - - 368 357 - - - 266 17N/02E-29A05 AO 1483465 591308.5 350 316 - - 278 242- - 230 17N/02E-29A06 AO 1482806 590831.8 - 360 - - 265 - - - 252 17N/02E-29A07 AO 1482347 591980.5 - 350 - - 260- - - 249
17N/02E-29A08 DEEP 1483185 591328 360 319 303 298 250 239 202 197
17N/02E-29BO I DEEP 1481718 591938.6 348 343 - - 268 248 223 214 208
17N/02E-29B02 DEEP 1482450 590467.4 350 336 315 245 235 - - - 212
17N/02E-29B05 AO 1481178 591967.2 348 334 - - 318 295 - - 288
17N/02E-29C04 AO 1480929 591604.9 - - - - 348 - - - 248
17N/02E-29C02 AO 1479788 592048.6 348 339 - - 272- - - 265
17N/02E-29C03 AO 1479974 591703.8- 348 - - 308 - - - 260
17N/02E-29HO I D I DEEP 1483714 590870.2 360 330 - - 270 266 - - 202
17N/02E-29J03 AO 1482502 588640.4 - 357 289 282 272- - - 261
17N/02E-29J04 AO 1482785 588548.6 360 336 323 318 283 - - - 253
17N/02E-29R04 AO 1483135 587911.6 - 365 - - 301 .. - - 265 17N/02E-29R05 i\0 1482006 587995.9 362 362 - - 284 277- - 278
17N/02E-29R06 AO 1482495 587659.3 358 330 307 294 286 - - - 264
Page I
• • •

• • Table A-2. Elevation of the Top of Hydrogeologic Units. - ---------------- --·.- --- ... - - --- ------------------- --·.- ---------- -- ----------- ~--~- -- --------- -L.AQTRti ---~--- ------------ ----~- ------
WeiiiD Aquifer X Y RO TILL Inter-TILL TILL AO DEEP D.AQTRD BOTTOM 17N/02E-30E04 AO 1472870 589934.2 - 362 307 298 272 265 - - 262 17N/02E-30H05 AO 1475196 588855.3 - 362- - 325- - - 313 17N/02E-30K04 AO 1475593 588323.8 362 315 - - 308 - - - 286 17N/02E-30K06 AO 1476373 588665.8 - 362 - - 315 - - - 304 17N/02E-30N02 AO t473567 588228.9 390 365 - - 265- - - 250 17N/02E-30M02 AO 1472977 588892.6 - 360 341 337 284 - - - 257 17N/02E-31 G03 DEEP 1475312 586188.2- 455 - - 420 325 317 - 275 17N/02E-32A03 AO 1482263 586411.6 360 337 - - 288 - - - 275 17N/02E-32G02 AO 1480374 584000.4 - 360 - - 337 - - - 288 17N/02E-32G03 AO 1480739 583955.1 - 362 - - 342- - - 269
17N/02E-32G04 AO 1481673 585267.3 - 368 - - 315 - - - 295
17N/02E-32H02 AO 1483167 585260.2 - 360- - 292- - - 280 17N/02E-32JO 10 I AO 1483545 583446.8 374 358 346 329 314 - - - 274 17N/02E-32PO I AO 1479373 582330.3 375 310 - - 275 - - - 243
17N/02E,33B04 AO 1487842 586405 385 380 - - 287 - - - 265 17N/02E-33B05 AO 14865t2 584861.8 390 383 333 327 280 - - - 272
17N/02E-33D08 AO 1484463 585684.4 370 364 319 308 292 265- - 262
17N/02E-33GOI AO 1486479 584966.8 390 378 311 304 280 270- - 267
17N/02E-33K05 AO 1487453 583414.6 371 343 - - 316 301 - - 291
17N/02E-33L03 AO 1485566 583276.9 - 368 - - 323 - - - 308
t 7N/02E-33N03 AO 1486079 580519.8 - 430- - 343 321 - - 313
17N/02E-33N06 AO 1486294 580316.9- 440- - 362 348 - - 344
RO- Re~essional Outwash_t\_quif_er ------------ --- ----- ------- --------- ----- ~ --- - ------- ---------- -- ----AO= Advanced Outwash Aquifer ------- ------ ---- ----- -~ -------- ----------- ----f--- -- ------DEEP=Deep Aquifer-J ----- --------------------------------- r-------c------ ----------- ----------L.AQTRD= Lower Aquitard. .
Page2

App~ndix A~:_~~ll-Yield Tests and Hydraulic C~n~uctivity R:esults. -r----J---- -----:~ ----- ---
------------~"'!__§tat!~- ')'e~_t _Test __________ ~quifer _ Open ___ ~~~~- !'l'en _ Dia. DTW DTW Duration Q Thickness Interva Storage Well Conductivity· Interval
weliT'o ______ (InT (Feet) --- (Feet)' (Hour.) (GPM)(F.e-t)-- {Feet) Coeff. Loss (Mi~--; Depth--,- Zoiie l7N/2E-l9 8 22 30 18 30 14 0.67 0.001 l 255 93 AO 17Nt2E-t9c _____ s ______ 2o ____ 4o---~--5s _____ iil 10 o.oot ,------58.24s:ss--Tii:L--17Nii'E:i9c --- -6 -- 30 40 ------ 4 -- --:20- - -- 5 ---0:5 - o.oof l - ---T69 - -60 TILL -----------~- --.---- ---· ------· ----- -~-- ---- ------ --- -----~ --- . ----------17N/2E-19H 6 60 100 I 60 6 0.5 0.001 I I 18 140 DEEP ----------- --- ------- -- -- -- -----· ···-- ---------------- ---- ---------l7N/2E-19H05 6 19 20 2 37 II 5 0.25 I 886 29-34 TILL 17N/2E-l9JOI 6-----19- 32 I 40 ------4Jr--- 0.5 0.25 I ------431 -----:60 TILL !iNi2E:19Jo2 ____ 6----23 -31- -~ 12f----- 22-0.5 --o.ooit--i -----168----45 nCC-17N/2E;i9Jo7- 12 --l-8r- -i68 --- i~o 15 ----~-5 0.001 --~ --- 22:4 233-243; olillr i7Ni2E:i9N'o-l 12 25.5 25.62::---__::_ 1 540 --- 21 1o o.25~ oNe---- s0-6o--- Ao 17Nt2E-19Nol 12--- 25.5r-2s.62' -454o-- 21 --~o -o:zsr-f oNe-- - Ao i7Nt2E='i9Nol 12--- -27:2t-ru6r----4 550 --~ 21 10 o.25 1 oN'c "so~~ Ao ---r7N't2E::i9No2- 12- 25.02 30.22 ---1 1250--- -3fio:65 - 0.25~ DNC ___ 52-(;j ___ AO T7Nt2E::19No2 -- 12 --·-zs.oz 30.22 -----;f125o 31 10.65 o.25~ oNe- ---- 52-61 Ao ---17Nt2E='i9Qol-r--- 6 6~1 24 15 5- 0.5 0.25 I -- -227.r--33 fiii.-f7Nt2E-19Qo)- 6----6 14 -~-1 ----24 --- 5 0.5 0.25 I r---- --- l91 33 Tii.i.--17N/2E-20B 6- 40 90 --1'~60 19 0.5 0.001 lr-------]27 --Jjlj AO 17N/2E-20B ~6 58 86 I 20 10 0.5 0.001 I r-----···--59:9 120 AO ·-17N/2E-20C 6 ---- ----u-- 56 1.5 10 1.5 0.5 0.001 I -- -- 43.2 -- 70.5 AO l7N/2E:20C - 6 26 26.5 I 20 11.5 0.5 0.001 l r--- ----3740-53.5 TiLL--l7N/2E-20C04 6r-- - 6o ~63 -~-, 3 13 -- o.5 o.oo1 1 r--~--91.7 -- 118 t-.o --17Nt2E-2oo- 6 ---Is 35 ------~ ---~sr--------~o --o:s-o:ool t - -- 74.3 ---64 xo--17Nt2E-2oo-· 6 ---96 101-- ~---4----~3 -o.s o.oot ~- --32.9··---·ii<i/\()" i7N't2E:--=2oa-- 6 --- 6o 85 -----~ t5 -- 56 --o.s o.oot r--~------- 94~7- ii6 Ao uN't2E-2oa~ 8 ---2o 46-----~~---,i----J'i-o~67 .. o:ool ~--· 4i.9--6sAo 17Nt2E~20<:l- 6 .... ---52 81 ______ 1 15 ___ --12 -o~5--o:OOTI--f'- ---45.7 ____ ji)j A.-o-
T7N/2E~2oo ____ 6 35 10 , 10 ___ s7r--o:s--o~OOI ,-··· -- 4s:3~-,-o4 Ao i7NfiE-2oJ02-- .. 6- . --)6- 41 ---- i 12 ------, 5 0.001 I --- - ---77.8 s):ss - TILL
17N/2E-20J04 --6 ------;u-- 53 l 20 28 5 ----o:ootr--1----43:4190-195 DEEP l7N-/2E~ZOJ05 _____ 6 Sl--69---~--15 31 0.5 0.001-- I l06 ____ mAO. l1NtiE~20KOS- 6-----«r---- 56 --~----w ----4i __ ~ 0.00_1_ I 236 li9AO--:_ t7N.ii&2ol:05 6r-------zz 80 -----~ 7 31 0.5 0.001 l 15.3 91 AO
• • •

• • Appendix A-3. Well-Yield Tests and Hydraulic Conductivity Results. ·---· ---------------·---- ------------------------ --· ---·-----
Well Static Test Test Aqulrer Open Hydraulic Open --·--------- Di~-;-- DTW-- DTW Duration- -Q--Tilickness Jnterva StOrage Well conductivt~v-IDiervai -------weiiln (in.) {Fe"ei)-- (Fe.ij (HOilfS) (GPM) (Feet_) __ (Feet) Coerr. --LoiS (rliiiijj" --- Depih- Zone 17N/2E-20N 6 23 25 I - 30 10 0.5 0.001 I 1330 40 TILL 17N/2E-20N03 8
! 7Nj2f::20QO l ---~
~?~~.E:-2~90~- --- --~ ---17N/2E-21LOI 6 17N/2E-28D 6
13 15 24 110 3 0.67 0.25 4800 21 RO
40 65 15 II II 0.001 10 70-90. AO . ---------- ··--·· ----- . --------- . -- -----· ------ -·-· ... ---------- .. --------- --------39 47 20 4 0.5 0.001 212 58 AO
--·---- - -----------·-- ----··--··--------·-·-----------· ·-· ------ -·-----· 0 68 10 7 0.5 0.001 10.9 79 AO ----- ---···
41 56 30 97 0.5 0.25 376 138 DEEP -···- ---- .. --·-- . ~- -· ---- - --- ------- .. --- ... ·- ---- --- --------- - ---- ----17N/2E-28D 6 40 49 8 7 · 0.5 0.25 I 58.3 63 TILL - --- - -- --- --- . -------------------- ----- ·- ---- -- ... -----17N/2E-28E02 6 80 110 I 40 25 0.5 0.001 I 157 161 DEEP 17-NtiE--iSEtn -- ---6- --6~5 --~ iO ------~ ------ro -----23 -- ·-----o.s ---- 0.001 -. --------- -25 ---·-·us· AO ------ ---- --- . ----· --------- ---- ------- ------ ----------· --------- --------------~------- -
----- --~-- ~-·--~-- --·--- --·-- ----- ··---· -- -·-·- -·--17N/2E-29C03 8 31 45 I 30 48 40 0.001 9.6 40-80 AO
•

• • Appendix A-3. Well-Yield Tests and H.ydraulic Conductivity Results. -·-----··· ·-··· ---·-· .. - - --=- ....... ---- -- -- ·-· ·-·-·- ----· ----
- ___ . . ..... \V_~I __ ~tatic __ Test -~~-b-- Aqu_ife_!'_ Qpen _____________ .l!r~~aul!~ __ ()P•!I _____ _ --··· . ~- l)i~~- I)T\V ___ DT~ l)uration g __ Thickness lnterva ~tor!'!!!' ~~119>~~111!t!v_it~. ln!•rv&_l . __ _
WeiiiD (ln.) (Feet) (Feel) (Hours) (GPM) (Feel) (Feel) Coeff. Loss (fl/day) Depth Zone
1?~12E:~9~0~------~ __ }~ __ ____11 _ _ ~-~f- 62 0.5 0.25 ___ I ______ 7~ 06 ·--~~g:'-_2 __ I 7N/2E-29HOI 8 26 33 3 40 4 0.67 0.001 I 438 94 AO 17J.it2E:29J- .. --6----55 -85 _____ - 20 ·7 -- o.5~ol~ -----51.6 ---loo :.\6 -i7N/2E-29!01 ___ 6 ----Jo-60 _______ 20 6 0~5--o:OOt--1 -------50.91-~ AO __ _
17N/2E-29J04 6 26 69 I 30 41 0.5 0.001 98.6 107 AO ~------ -- ----- . 6-17 ---·45 ---~ -is 12 o.5 -o.om -· -··------47.4 --58 TILL-!~!'i/~~~9Q --·-17N/2E-29RO I
.----·------ ------- --------- ------ --------------------- --
6 12 67 2 8 12 0.5 0.001 12.8 76 AO . -- --------·-- ---· .. -- ------------- ---------- ------------ ---- ------
I 7N/2E-30F03 6 80 101 I 40 6 0.5 0.001 I 151 138 DEEP s .. ---4o ----96---2 --30-----~~ --- 0.67 --o.oot_l ____ ----3o-:5- 136 DEEP-6 · ·--9s -- lo4 · - i ---~5 · - :z---o.5+-o:ool-1 -- - ':ioo ils Ao
17N/2E-30H02 17N/2E-30ROI - . ------------ - --17N/2E-31H03 6 55 75 I 20 6 0.5 0.001 I 77.4 · 99 AO ------- - --- -- --· ... - -- ----------- --- -----·-·· ---- ------· ---- - ---- ----- -- -- ---- ----------
17_1-!/2E-~IJ:!Q~-----~ --~~-----_).~------~I-0.5_Q:!J~! --~- _3600 60TILL 17N/2E-32KOI 6 90 90.5 I 60 5 0.5 0.001 I 11600 105 AO - - ------- . - ---- ------- ---- -··-- ---------------- ------ ---- -·- ------------- ---···- -· --. 17N/2E-33A02 6 55 65 30 4 0.5 0.001 I 256 127 AO 17N/2E-33NOI 6 54 70 I 8 12 0.5 0.001 44.2 80 AO i 7N/2E:34Fo2 · ·- ·c; ---43 ····· 48 ·---~~-- 2o ·-- 4 o.5 o.2s -~ --- - - ·257 ----58 TILL 17N't2E~34ao2- --6 ----Jo ·-3o:S ----- 1 3o 3 o.5 o.oo1 -,~---- ·-· 677o ----so i'ii:c--I7N/2E-34•m2 · · · 6---28 ----3o --- 16 s ---o-:-5 -o.oo1 -~ ---676t-- -4o 1-ILL--- -· ------------- ···-··- ----- ----· ·-- ----- --·- -·- ·--------·--- --··--··---- ··-·-··-· ·--··-··- ·-··--·-·---------- ---17N/2E-34NOI 8 43 59 45 II 0.67 0.001 171 97 AO DNC= Did not converge, no solution.
•

calcul
T~ A-4. Water-Level Elevations, April~ ! I
Yl::2oo
IYE33N03
; ! i i
. '
'
:
i ' Point ! Depth_t() .r,evel I ! Water .
:>rare naoe "'~ :>rate nau< I (M:>L;Feet) I IL""!L '~ 340· )_0' , 1 ~-~j
14711 5~'596~ 335 2! !3 JUb.l" 'i943571 345: 21 13 )18.37 1480245~·----~5~~n~7~;~,------~343·~--~~~8,,---~~~,~~2
148:11: I
147519 I I
~:~· 350: 21 )31 323.9'1 "'~•L_ ____ ~3~6o:: ____ ~2:'M~4~'-----~if;'~-~~
5\ i9: 3501 3 .27• 313.73 2[7996i 362: 1 i87' . 345.13 5:!7912i~n2gL!--------;3~6511----,_---'*!7'f-, _ _sf,, ------~JJJy;T.5j-,_~ __2!99141 362! .18! 5888551 362! 1.42: j~ /.)l! 5R6412 360, 1.79: ~-21 586405 385 .£ '.37: j~/.b.J
5 ~~~. J6ll'_ ____ ----.,u,n 3611.,.,-19 ~~:------~~9~39TI~·-------~·~~~~~--~~~------~~"'~'"~
Page 1
•
•

•
•
•
APPENDIX 8
Sampling and Testing Procedures
Samples were obtained using standard groundwater sampling procedures for the parameters to be tested.
Water levels were measured in each accessible well prior to sampling using a commercial electric probe. Measurements were recorded to 0.01 feet and were accurate to 0.03 feet. Well volumes were calculated using the height of water in the well casing above the bottom of the well.
Wells were purged a minimum of three well volumes and until specific conductance, pH, temperature measurements stabilized (changes of 10% or less between well volumes). Meters and precision for field parameters are listed in Table B-1. Samples were placed in bottles·obtained from Manchester Environmental Laboratory. Bottle materials and preservatives for the target analytes are listed in Table B-2. Table B-1. Field parameters, meters, and measurement precision.
Parameters Meter Precision
Specific Conductance Beckman 10 micromhos/cm Conductivity Bridge
pH Orion Model9107 0.1 Std Unit
Temperature Orion Model9107 0.1 oc
Table B-2. Bottles, holding times and preservatives for Yelm target analytes.
Parameter Bottle Holding Preservative Time
Nitrate+Nitrite-N 125 mL clear, w/m 28 days Sulfuric acid to polyethylene pH<2, Cool to 4°C
Chloride 1000 rnL 28 days Cool to 4°C polyethylene
Fecal Coliform 250 mL sterile glass 30 hours Cool to 4°C
Total Dissolved Solids IOOOmL 28 days Cool to 4°C polyethylene

All samples were immediately placed in coolers with ice and transported to the Ecology • Headquarters building in Lacey at the end of each day of sampling. Samples were left in the walk-in cooler until picked up by the laboratory courier to Ecology/EPA Manchester Environmental Laboratory in Manchester, Washington.
Samples were tested for the target parameters at the Ecology/EPA Manchester Environmental Laboratory The target parameters, test methods and method detection limits are lis.ted in Table B-3.
Table B-3. Target parameters, test methods and method detection limits.
Method Detection
Target Test Method Limit (mg!L) Parameter EPA Method/Standard Methods
Nitrate+Nitrite-N EPA 353.2/4500 N03 F 0.01
Chloride EPA 330.0/4110B 0.1
Fecal Coliform Bacteria Membrane Filter 92220 ICFU/IOOmL
Total Dissolved Solids EPA !60.1/2540C I
CFU= Colony fonrung urut. •
•

•
•
•
Field
APPENDIXC Quality Assurance
Field quality assurance samples consisted of one duplicate sample per ten well samples. Duplicate samples for this project are defined as two sequential samples obtained from the same well using identical sampling procedures. The duplicate sample results are used to estimate combined sampling and analytical precision. The relative percent difference (RPD) of the mean, the ratio of the difference and mean of duplicate results expressed as a percentage, is used to describe the precision of duplicate results. Low RPD's indicate high precision and high RPD's indicate poor precision. RPDs for nitrite+nitrate-N, total dissolved solids, and chloride calculated for each of the duplicate samples are shown in Table C-1. The precision for field duplicates was very good with RPDs ranging from 0 to 8% for nitrate+nitrite-N, 0 to 3% for total dissolved solids, and 0.1 to I. 7% for chloride
Laboratory
Copies of quality assurance reviews by Manchester Laboratory for each sampling event are shown in Appendix C. All analyses were performed within established EPA holding times. All initial and continuing calibration verification standards and blanks were within USEP A Contract Laboratory Program control limits Laboratory quality control tests are done on each set of 20 or fewer samples and consisted of duplicate blanks, duplicate samples, a spiked sample, ~d a check (control) standard. Manchester Laboratory's quality control samples and procedures are discussed in Quality Assurance Manual. Manchester Environmental Laboratory (1988). All spike recoveries were within the acceptance limit of ± 25%. Laboratory duplicate results were within the ± 20% acceptarice window. Procedural blaltks showed no analytical significant levels of analytes. Laboratory control sample analyses were within their acceptance windows-of ± 20%. ·. \.! ••. <

Quality Assurance Results. •
•
•

• April30, 1996
Washington State Department of Ecology Manchester Laboratory
TO: Denis Erickson v
FROM: Becky Bogaczyk, Chemist ~ '
SUBJECT: General Chemistry Quality Assurance memo for Yelm Groundwater, week 16
SUMMARY
The data generated by the analysis of these samples can be used noting the qualifications discussed in this memo. All analyses requested were evaluated by established regulatory quality assurance guidelines
SAMPLE INFORMATION
• Samples for Y elm Groundwater week 16 project were received by Manchester Laboratory · on 04117/96 in good condition.
•
HOLDING TIMES
All analyses were performed within established EPA holding times:
ANALYSIS PERFORMANCE
Instrument Calibration
Where applicable, instrument calibration was performed before each analytical run and checked by initial calibration verification standards and blanks. All initial and continuing calibration verification standards were within USEP A Contract Laboratory Program (CLP) control limits. A correlation coefficient of 0.995 or greater was met as stated in CLP calibration requirements.
Procedural Blanks
The procedural blanks associated with these samples showed no analytical significant levels of analytes .

Spiked Sample Analysis
Spike samples were performed where applicable with all spike recoveries within acceptance limits of± 25%.
Precision Data
Spike sample results, where applicable, and duplicate sample results were used to evaluate precision on this sample set. Relative Percent Difference (RPD) for all parameters was within the 20% acceptance window for all duplicate analysis. Laboratory duplication is performed at a frequency of at least I 0%.
Laboratory Control Sample (LCS) Analyses
LCS analyses were within the windows established for each parameter.
Other Oualitv Assurance Measures and Issues
Please call Becky Bogaczyk at SCAN (360) 871-8830 to further discuss this project.
cc: Bill Kammin Project File
•
•
•

•
•
•
July 18, 1996
Washington State Department of Ecology Manchester Laboratory
TO: Denis Erickson
FROM: Nancy Jensen, Microbiologistf.(f-
SUBJECT: General Chemistry Quality Assurance memo for Yelrn Groundwater-24 ..
SUMMARY
The data generated by the analysis of these Satnp!es can be used noting the data qualifications discussed in this memo.
SAMPLE INFORMATION
These Satnples were received by the Manchester Laboratory on 06/11196 in good condition.
HOLDING TIMES
Analysis of all parameters was performed within all applicable EPA holding times.
ANALYSIS PERFORMANCE
Instrument Calibration
Where applicable, instrument calibration was performed before each analytical run and checked by initial cahl>ration verification standards and blanks. All initial and continuing cahl>ration verification standards were within the relevant USEP A (CLP) control limits. A correlation coefficient of 0.995 or greater was met as stated in CLP calibration requirements.
Spiked Sample Analysis
All spiked Satnples were within acceptable limits.
Procedural Blanks
All procedural blanks were within acceptable limits .

Precision Data
Spike sample results and duplicate sample results were used to evaluate precision on this • sample set. Relative Percent Difference (RPD) for all analytes were within the 20% acceptance window for duplicate analysis. Fecal coliforms RPD acceptance window is 40%. Laboratory duplication is done at a frequency of at least 10%.
Laboratory Control Samole ILCS) Analyses
LCS analyses were within the established windows.
Other Quality Assurance Measures and Issues
Please call Becky Bogaczyk at SCAN (360) 871-8830 to further discuss this project.
cc: Project File
•
. ,
•

•
•
•
Washington State Department of Ecology Manchester Laboratory
September 18, 1996
TO: Denis Erickson ...,/
FROM: Becky Bogaczyk, Chemist ~
SUBJECT: General Chemistry Quality Assurance memo for Yelm Groundwater, week 34
SUMMARY
The data generated by the analysis of these samples can be used noting the qualifications discussed in this memo. All analyses requested were evaluated by established regulatory quality assurance guidelines.
SAMPLE JNFORMATION
Samples for Yelm Groundwater week 34 project were receivec1 ' 08/21-23/96 in good condition.
HOLDING TIMES
All analyses were performed within established EPA holding times.
ANALYSIS PERFORMANCE
Instrument Calibration
... cnester Laboratory on
Instrument calibration was performed before each analytical run and checked by initial calibration verification standards and blanks. All initial and continuing cahoration verification standards were within USEPA Contract Laboratory Program (CLP) control limits. A correlation coefficient of 0.995 or greater was met as stated in CLP calibration requirements.
Procedural Blanks
The procedural blanks associated with these samples showed no analytical significant levels of analytes. ·
Spiked Sample Analysis
Spike samples were performed with all spike recoveries within acceptance limits of:!: 25%.

Precision Data
Results from duplicate analysis were used to evaluate precision. Duplicate analyses of all parameters were within acceptable limits.
Laboratory Control Sample ILCS) Analysis
All laboratory controls were within acceptance windows.
Other Quality Assurance Measures and Issues
All nutrient samples with a "U'' qualifier have a result less than the detection limit of 0.01 mg/L.
All fecal samples with a "U'' qualifier have a result less than the detection limit of 1/IOOmL.
Call Nancy Jensen at (360) 871-8810 if you have any questions.
cc: Bill Kammin Project File.
•
•
•

•
•
•
November 5, 1996
Washington State Department of Ecology Manchester Laboratory
TO: Denis Erickson
FROM: Debbie Lacroix, Chemist Vl' SUBJECT: General Chemistry Quality Assurance memo for the Y elm Groundwater Project
SUMMARY
The data generated by the analysis of these samples can be used without qualifications.
SAMPLE INFORMATION
Samples 96418070-95 from the Yelm Groundwater Project were received by the Manchester Laboratory on 10/8 and 10/9~96 in good condition .
HOLDING TIMES
All analyses were performed within applicable EPA holding times.
ANALYSIS PERFORMANCE
Instrument Calibration
Where applicable, instrument calibration was performed before each analysis and verified by initial and verification standards and blanks. All initial and continuing calibration verification standards were within the relevant EPA control limits. A correlation of0.995 or greater was met as stated in CLP calibration requirements. All balances are calibrated yearly with calibration verification performed monthly.
Procedural Blanks
All procedural blanks were within acceptable limits.
Spiked Sample Analysis
All spikes were within the acceptance windows of ±25% .

Precision Data
The results of the duplicate analysis of samples were used to evaluate the precision on this sample · set. The Relative Percent Differences (RPD) were within their acceptance windows of+/- 20 %.
Laboratory Control Sample (LCS) Analyses
LCS analyses were within their acceptance windows of+/- 20 %.
Please call Debbie Lacroix at SCAN 871-8812 with any questions or concerns about this project.
cc: Project File
•
•
•

•
•
•
January 16,1997
Washington State Department of Ecology Manchester Laboratory
TO: Denis Erickson
FROM: Casey Maggart, Chemist t- \
SUBJECT: General Chemistry Quality Assurance memo for Yelm Groundwater
SUMMARY
The data generated by the analysis of these samples can be used noting the data qualifications· discussed in this memo. All analyses requested were evaluated usmg USEP A Contract Laboratory Program (CLP) quality assurance requirements.
Sample Infonnation
These samples from the Yelm Groundwater project were received by the Manchester Laboratory on 12/10/96 through 12/12/96 in good condition.
Holding Times
Analysis of all parameters was performed within USEP A established holding times.
ANALYSIS PERFORMANCE
Instrument Calibration
Where applicable, instrument calibration was performed before each analytical run and checked by initial calibration verification standards and blanks. All initial and continuing calibration verification standards were within the relevant USEPA (CLP) control limits. A correlation coefficient of 0.995 or greater was met as stated in CLP calibration requirements. The turbidimeter is calibrated bi-annually as stated in the manufacturer's recommendations. All balances are calibrated yearly with calibration verification occurring monthly. Oven temperatures are recorded before and after analyses to insure control.
Procedural Blanks
The procedural blanks associated with these samples showed no analytically significant levels of analytes. ·

Spiked Sample Analvsis •
Spike sample analyses were performed on the nutrients on this data set. All spike recoveries were within the CLP acceptance limits of+/- 25%.
Precision Data
The Relative Percent Difference (RPD) for all parameters were within their acceptance windows except for IDS sample 508230 which was qualified with a "f'. The sample is qualified as an estimate because the replicate falls outside of the acceptance windows.
Laboratory Control Sample Analyses
LCS analyses were withiri the windows established for each parameter.
Other Oualitv Assurance Measures and Issues
All nutrient samples with a "U'' qualifier have a result less than the detection limit of 0. 01 mg!L.
All Fecal samples with a "U'' qualifier have a result less than the detection limit of !0/100rnL.
Please call Casey Maggart at SCAN 871-8824 to further discuss this project.
cc: Bill Kamrnin
.. . ' .. .......
•
•

• Washington State Department of Ecology Manchester Laboratory
March 12, 1997
TO: Denis Erickson
FROM: Becky Bogaczyk, Chemist ~
SUBJECT: General Chemistry Quality Assurance memo for Y elm Groundwater, week 07
SUMMARY
The data generated by the analysis of these samples can be used noting the qualifications discussed in this memo. All analyses requested were evaJuated by established regulatory quality assurance guidelines
SAMPLE INFORMATION
Samples for Y elm Groundwater week 07 project were received by Manchester Laboratory on • 02/ll/97 in good condition. ·
HOLDING TIMES
All analyses were performed within established EPA holding times.
ANALYSIS PERFORMANCE
Instrument Calibration
Where applicable, instrument calibration was performed before each analytical run and checked by initial calibration verification standards and blanks. All initial and continuing calibration verification standards were within control limits. A correlation coefficient of 0.995 or greater was met.
Procedural Blanks
The procedural blanks associated with these samples showed no significant analytical levels of analytes.
Sgiked Sample Analvsis
• Spike samples were performed where applicable with all spike recoveries within acceptance limits of"' 25%.

Precision Data
Spike sample results, where applicable, and duplicate sample results were used to evaluate precision on this sample set. Relative Percent Difference (RPD) for all parameters was within the 20% acceptance window for all duplicate analysis. Laboratory duplication is performed at a frequency of at least I 0%.
Laboratory Control Sample <LCS) Analyses
LCS analyses were within the windows established for each parameter.
Other Oualitv Assurance Measures and Issues
The "U" qualification indicates the analyte was not detected at or above the reported result.
Please call Becky Bogaczyk at (360) 871-8830 to further discuss this project.
cc: Project File
•
•
•

• APPENDIXD
Table D-1. Yelm Groundwater Quality Results, April1996 through February 1997 .
•
------·-
•

Table D-1. Yelm Groundwater Ou,.IHv Jlp•nlk. April1996 th1 ... ugh February 1997. Total
Yl ?OAO: i/961 3.4\ 103 5.01 l Yl I 1/961 _5. 98 5. 7: J l ~~~~-r--~~~~~~~~7~----~~4·r-----~~co~s. _____ 7s . .3~!--------~~~~Jr---------+17Hl ~~ l/961 3.1• I• 4.1: II I l ~ 96 i.( 4.2~ II J l_
~~~3---r~~s:~~~~*~~~----~~----~I~C~----;T:.:!~~------~~~:~~T··r---------~ ~ 12/11196 104.5 ... ( .01 u
1 0/R/'11 · 3.89 ll I YE2~l3 2/19/91 2. I
'E201 101 ll
20004
YE20004
y
IYF?'I.o\05
~7
2/111971 I 58 4/9/961 I· 7.
6111/961 I 6. :1/961 6.76
4.24 1: 0/961 5. 2/11/971 4.
1/9/961 7.
t/~
1/9 .. 1119
5.95 5.0~
12: 14<
.18 :.96
6 1: 6.
I. 6.9 2~ 6.82
II II
0.01 u .O.OU.J
II
I I
I l _U IU
I
6/U/96 R. 1/1
( ·.<:; ..M . 1.25 io----~--+~..~~-----~--~~r-~------~
i/961 12. 1/961
9~
41 '96 61: '96 8121/96 I 0/8/96
12/10/96 2111/9~
(1.463 .... 0.43" 0.498 0.494 0.301 0.353 0.332 0.281 0.695 0.281
7.34 6.81
5 5 80:
.81 4.935
71 I. 96.
13! 121 128 13C 107
118.5
I I I 1.49 1.61 .6: .8:
'.5! S.ll:
>.46 .24
0.01 u O.ot U O.ot U 0.01 u 0.01 u 0.01 u
. 0.01 u 0.01 u 0.01 u 0.01 u 0.01 u 0.01 u
ll u II U JIU II U
I l. I l_
I l_
I l_
I l_ ll_
I l_
I l_ l_
l_
l_
l_ l_
I l_
•
•
•

•
• ! . i
•
Table D-1. Yelm Groundwater- .n ..... t«,Aprill996 ~i.uuu~;i. F"'u'u"'J' 1997. Total
Nitrate+ Dissolved Fecal
Site ID Date ~~~r i'r::bt> ~~~e Am~:~{"-N (c~tliforms,'
-
~ ~ 1ilOr 'i 10111 1U . 6/11/961 2.44 3.19 1.01 u 1 u
IVF.~~--+-~lf!T~n~l~--~~,~------~~--~i~~~------~~O~IIT~l~I---------I~U~ IVF29EiQ; 10/R/0~1 2.43 2.91 1.01 u 1 u ~~~~~-+--1~?/i~n0/Q,~~----~~~74~------~~----~i~1· ________ ~101~11~l~I--------~I~U~ ~ 2/11/9' 3.3' 1 4.0' 1.01 u 1 u
IV
K' 15
4:16/QI 414 ~ '(41' i0111 lU 110/0o · 6.4 12: 6.90 1.01 U 1
h W <; Q!i 6'io 001 [J 1
• " 6.41: 116. 0.01 u 0/RP 4 ]7q 0.01 u
IM .'i' 110 O.OIU i1T97l T o.o1 iiiiQIJ 11
11/961
1.55 .
1 l I 1U Ill IU
!W~---~~~6, _______ ~01~011~1~11+-------~~ T? 1 6 O.QJ U
~~--~~2~-------~~11~---------+~' 1 11 . l
1.53 1 1r 7/cW &. ll 1
~110/0~1 3.61 10! 1, u
4/10/9i 0. 3.1'
- Tt?17i . 7; q, T1
~~~~)5--~-~~~~~~·,·~~----~4~~------9~~8.~----~~~-------*~~-*~~:~~~---------~:~~ i> 4 OS 0.01 ll 1 1J
~~ 'iiiQI 0 0.01 U I U ili' '0/91 15 0 01 IJ 1 IJ 'i'iii7JQI I 4 :-;;; 0. 0 I U I U 12/9/91 15 . 7' 0.01 IJ 1 1J
~ o. 1.77' 0.01 U I U 4/&/91 C_! . 1 i.O' 0.011J 1 1J
&f'0/0' 10t7iiii
7/0/0,
0 17? 0.01 U I U (_] 1 3 0.01 IJ 1 1J ~ I 11 0.01 U I U
0.13 1 3.24 0.01 u 1 u

Table D-1. Yelm Groundwater~ Results, AprJ 1996 thruu~ Fe!;, uA•.r 1997.
Site ID
Total Dissolved Fecal Nitrate+
Nitrite-N (mg/L) Date r:::) ~~~~e Amr,:~~-N (C~}~~~'!", ,
2110/9~ 118 3.26 II I L!_ 4/8/96 94 3.1 II I U
_6110/96 0. 101 _I 8120196 1.9 104 3. 0. I
tlQ; 1017/96 1.9 101 0 I ~~-+--~1~2.9/~96----~~~~----~~98----~~-------~00.~~--------~~~
y
04 n4 04 04
804 05 05
DOS YE33 J08
)08 )08
_y_~ ~:~.
2.J 119~ o 89 I 8/l6 99 0. I
101 0 )6 ;.4 14: ( I
7/961 .I 157.5 I u · 10: S 0 I
5.24 99 6.72 u 1 u
8/20/961 l/"1/961
•/961
/961 6/ /96l
7/' 1: 16
2.58 119 3.79 U_ I J 2.55 I !0 3.98 0.01 U 1 U 2.41 3.9~ 0.01 lJ 1 u
I 2. 2. 3.2 3.9
.41 :.&<
I 4.92 6.8"
5.64 k9
105 6.36
.0
.o: l!U
0 15
I
u u
:/961 0. 142 3.6 6, •1961 0. 141 3.74
0.662 '.77 0.0 J 10nt96 0.519 -.8 0.0 lJ
~~----~~~~:.4.7~oo86~1----~1~38----~~~------~~~:::~~ll:~~~--------~~~ Mean- 3.I9 110 4.92~------~~~......_--------...,I!...U~
Min= O.I3 67 I.25 O.OI U I U !Max= IO.I I58 I7.3 O.OI5 I U
U= Analyte not detected above listed value.
•
•
• •
•
•
•
•
,
..
•
•
> "1:1 "1:1
"' = Q. )<'
=

•
••• .I.
•
Title
FEB ', - 200~ Ski!lmgs<:onnohy. 1no Consulting Engineer~
Quality Assurance Project ·Plan For the City ofYelm
Groundwater Quality Monitoring Project
Prepared by
.·Skillings-Connolly, Inc.
Revised on
December 31, 2001
Project Information
Centennial Clean Water Fund Grant No. G0100206, FY 2001 Funding Cycle
;
Brian K Matthews, P.E. (Project Manager)
~ney Lilliq1iist, E.I.T (Design Engineer)
.adger dministrator)
~-~)
Steve Hibb'i' (Laboratory Representative)

• Table of Contents
DISTRIBUTION LIST .................................................................................................................. !
ORGANIZATION AND SCHEDULE ......................................................................................... 2
PROJECT ORGANIZATION ..............................................................•.............................•................................ 2
Project Team ........................................................................................................................................... 2 Decision Makers ...................................................................................................................................... 2 Stakeholders ............................................................................................................................................ 2 Participant Communication .................................................................................................................... 3
PROJECT SCHEDULE .....................................................................................................•............................... 4
Project Start Date .................................................................................................................................... 4 Reconnaissance Visits ............................................................................................................................. 4 FieldActivities ....................................................... : ....... .......................................................................... 4 Dfl!very of Samples to the Laboratory .................................................................................................... 4. Reporting Laboratory Results ................................................................................................................. 4 Data Entry to the ElM Database ............................................................................................................. 4 Progress, Draft and Final Reports .......................................................................................................... 4 Disposal of Samples ................................................................................................................................ 4 Schedule Limitations ............................................................................................................................... 4
PROJECT BUDGET AND FINANCIAL SUPPORT CREDIT ................................................................................... 6
KEY CONTACT lNFORMA TION ...................................................................................................................... 6
BACKGROUND AND PROBLEM STATEMENT ................................................................... 8
PROJECT BACKGROUND ............................................................................................................................... 8
• Site Description and Use ......................................................................................................................... 8 Project Map ............................................................................................................................................. 8 Site History .............................................................................................................................................. 8 Previous Water Quality Information ....................................................................................................... 8 Applicable Regulatory Requirements and Criteria ................................................................................. 8 Anticipated Site Logistical Problems ...................................................................................................... 8
PROBLEM STATEMENT ................................................................................................................................. 9
PROJECT DESCRIPTION ........................................................................................................ ! 0
GOALS AND DECISION STA TEMENT ............................................................................................................ l 0
OBJECTIVES ............................................................................................................................................... I 0
Information needed to meet objective .................................................................................................... / 0 Information Source(s) ............................................................. ............................................................... / 0 Target Population Identification ........................................................................................................... / 0 Study Boundaries in time and space ...................................................................................................... / 0 Decision Rule ........................................................................................................................................ I 0 Anticipated Study Constraints ............................................................................................................... 11
DATA QUALITY OBJECTIVES .............................................................................................. 12
SAMPLING DESIGN ................................................................................................................. 13
FIELD PROCEDURES ............................................................................................................... 16
City Wells 1 and 2 .................................................................................................................... .............. 16 Monitoring Wells ................................................................................................................ ................... 16 Control Structures ................................................................................................................................. 17
• LABORATORY PROCEDURES .............................................................................................. 19
City ofYelm Groumlwatcr Monitoring Project Quality Assurance Project Plan

QUALITY CONTROL .........................•...................•.......•.........••..........•..•..••...........•.............•.. 20
FIELDQC ................................................................................................................................................... 20
LABORATORY QC ...................................................................................................•.................................. 21
DATA MANAGEMENT PROCEDURES ................................................................................ 22
FIELD ........................................................................................................................•................................ 22
LABORATORY ............................................................................................................................................ 22
DATA BASE ............................................................................................................ -................................... 22
EXISTINGDATA ......................................................................................................................................... 22
AUDITS AND REPORTS ........................................................................................................... 23
DATA REVIEW, VERIFICATION AND VALIDATION ...................................................... 24
DATA REVIEW ........................................................................................................•.•................•................ 24
DATA VERIFICATION .......................................................................•..•...................•.•.•.............•................. 24
DATA VALIDATION ..................................................................................................••.............•.................. 24
DATA QUALITY ASSESSMENT .•..............•............................•.•.•...........•..•.•.............••.....••.•.. 24
BffiLIOGRAPHY ........................................................................................................................ 25
SAMPLE FORMS AND EQUIPMENT SPECIFICATIONS ................................................. 27
CityofYelm Groundwater Monitoring Project Quality Assurance Project Plan
•
•
•

• Distribution List
•
•
Copies of the Quality Assurance Project Plan will be distributed to the following parties:
Washington State Department of Ecology Water Quality Program Southwest Regional Office c/o Christine Hempleman PO Box 47775 Olympia, WA 98504-7775 Tel. (360) 407-6329
City ofYelm c/o Shelly Badger POBox.479 Yelin,.:WA 98597 Tel. (360) 458-8405
Skillings-Connolly, Inc. c/o Brian Matthews, PE P.O. Box 5080 Lacey, W A 98509-5080 Tel. (360) 491-3399
Washington State Department of Health Division of Drinking Water SOUTHWEST DRINKING WATER OPERATIONS c/o Mark Toy P0Box47823 Olympia, W A 98504-7823 Tel. (360) 586-5209
Spectra Laboratories c/o Steve Hibbs 2221 Ross Way Tacoma, WA 98421 Tel. (253) 272-4850
City ofYelm Groundwater .i'v1onitoring_ Projt~Ct Quality .-\ssurant~e Project Plan

Organization and Schedule
Project Organization
Project T earn The City proposes using the same management structure that successfully implemented the recently completed water reclamation project. The project team has been working together on the Yelm reuse project over the last 12 years. They each understand the project and have been responsible for this successful implementation of the reuse project. This team includes:
Mayor Adam Rivas, chief elected official for the City. Mr. Rivas along with the aid of the City Council will make decisions for the project pertaining to the City's involvement.
Shelly Badger, City Administrator and the reuse project program manager for the City was responsible for the fiscal management of the reuse project and will serve in that capacity for the water quality monitoring project. Shelly works directly under the Mayor and reports to the Mayor and Council who are ultimately responsible for the quality of the drinking water supplied to their customers;
Thomas Skillings, PE, principal of Skillings-Connolly, Inc. will supervise the management of the project. He has worked on the City's reuse project from its conception in 1993, and was responsible for the planning, design and construction of all of the City's reuse fucilities. He also has been the project manager for all of the City's potable drinking water treatment, storage and supply, planning and design services for the last 15 years. He is very familiar with the City's system needs and what this water quality monitoring effort is trying to accomplish.
Brian Matthews, PE will manage the project for Skillings-Connolly, Inc .. He is very familiar with the needs and dynamics of the City of Yelm stemming from his management of the construction of the reclamation facility at the City as well as working on various infrastructure improvements within the City.
This team, along with staff engineers and operators will work together to successfully complete this project on time and within the budget as they did with the $9.6m water reuse construction project in 1999.
A new and invaluable member has been added to this team. Steve Hibbs, the Laboratory Manager for Spectra Laboratories will manage the water quality testing of the water samples taken for the project. Spectra Laboratories is located in Tacoma, Washington and specializes in water quality analysis.
A list of key personnel, their responsibilities and contact information is iocluded at the end of this section.
Decision Makers At the agency level, the Mayor and City Council will make decisions regarding the project based on the information provided to them by Shelly Badger and Skillings-Connolly. At the consultant level, Brian Matthews under the supervision of Thomas Skillings will make decisions pertaining to the portions of the project that directly involve the activities of Skillings-Connolly, Inc ..
Stakeholders The intent of this project is to examine the water quality impacts, if any, of recharging Yelm's aquifer with Class A reclaimed water. The construction of the reclamation facility was a pilot project for the State of Washington and the first of its kind io the state to recharge its own aquifer with Class A reclaimed water. The key stakeholders and those directly affected by the outcome of this project include the following: The State Deparnnent of Ecology who helped to fund portions of the project and has an interest in the standards of reclaimed water use as well as the use of constructed wetlands for additional polishing of reclaimed water. The State Department of Health regulates the water quality standards for water systems
City ofYelm Ground .. vater l\lonitoring Project Quality Assurance Project Plan
2
•
•
•

•
•
•
within the state and will be faced with additional proposals for the use and implementation of water reclamation facilities in the future. The City ofYelm is directly responsibly for providing their customers with water of the highest quality. All of the parties mentioned above will benefit from the results of the this project which will provide insight to the impacts on groundwater quality of aquifers that are recharged with Class A reclaimed water.
Participant Communication
Spectra Laboratories: Steve Hibbs
...
•
~ .·.
Tom Brian Kenney Skillings .... Matthews ~ Lilliquist
Washington ,. ... State DOH
Skillings- .-----Connolly,
~ Inc. Staff
~ Washington State DOE
City Council City ofYelm &Mayor ~ • Staff
'
Tim Peterson ... Shelly Stephanie Badger ~ Conners
The staff of Skillings-Connolly, Inc. will communicate with the DOH and DOE as necessary to meet the requirement of both departments and produce a product that will be beneficial to all. The staff of SkillingsConnolly, Inc. will keep in close communication with Shelly Badger and the City staff to complete the project with the utmost efficiency. Together the staffs of the City and Skillings-Connolly, Inc. will communicate closely with Yelm' s Mayor and City Council to provide them with information that will
City or\' elm Groundwater l\-lonitoring: Proje-ct QuJlity Assmance Project Plan
3

allow them to make citywide decisions and provide the necessary feedback for the City and SkillingsConnolly, Inc. staff to proceed successfully with the project.
Project Schedule
Project Start Date This project will consist of taking water samples from monitoring wells and control structures located throughout Cochrane Park. Constructed in 1999, Cochrane Park is a public access facility that uses constructed wetlands to "polish" Class A reclaimed water (generated by Yelm's water reclamation facility) before it is discharged into the groundwater aquifer via rapid infiltration basins located at the park. Samples from the park and aquifer will be taken quarterly over a two-year period. It is anticipated that monitoring will start in February, 2002 following approval offmal Quality Assurance Project Plan that is to be subntitted to the DOE by December 31, 2001.
Reconnaissance Visits Two reconnaissance visits to the site are expected. These visits will be to verify the condition of the wells and deterntine which monitoring wells will provide the most comprehensive and reliable results.
Field Activities Monitoring and sampling of the wells is expected to take place once every three months beginning in February, 2002.
Delivery of Samples to the Laboratory The samples taken from the wells will be subntitted to the testing laboratory within the time frames specified for each constituent.
Reporting Laboratory Results Laboratory results will be returned to Skillings-Connolly, Inc., for review and filing. The results will then be integrated into the project report.
Data Entry to the ElM Database Data will be entered into the ElM database shortly after the results of the water quality testing are received from the testing laboratory.
Progress, Draft and Final Reports A short progress report will be made quarterly following the receipt of the results from the lab. It is anticipated that the report will be a living document for the two-year life of the project with a draft report beconting available at the end of the two-year project life. The final report will be subntitted shortly after all parties have reviewed the draft report.
Disposal of Samples Unless otherwise specified by the City or state departments, the testing laboratory will dispose of the samples accordingly.
Schedule Limitations At this time, primary lirttitations of the schedule are !inti ted to the tum around time of the testing laboratory and their procedures. Depending on the constituents being tested for, results can take anywhere from couple days to several months to return. A second possible schedule lintitation for the project is review of the documents by any agencies for an extended period of time. If results should take several months to obtain or if any review should take exceptional time, then the project will be delayed accordingly.
City of Yelm Groundwater Monitoring Project Quality Assurance Project Plan
4
•
•
•

,---J·t-------------C-ITYft--Y-E-LM--------------~~--~-·--- -
GROUNDWATER MONITORING SCHEDULE Task Name
Project Management
Develop Draft QAPP
Draft QAPP due to DOE
DOE Review of Draft QAPP
Develop Final QAPP
Final QAPP due to DOE
DOE Review of Final QAPP
Sampling and Analysis
Draft Report Development
Draft Report Due 1o DOE
DOE Review of Draft Report
Final Report Development
Final Report due to DOE
l Duration l 701 days:
16 days
0 days 1
20 days I :
40 days,
0 days
20 days
470 days
' ' '
i I
100 days 1
20 days,
i 38 days'
I
0 days,
Start ~
Tue101161011
I Mon 10/8101 I
I
Wed 101311011
Wed 10131101
I Tue 1116/011
I Mon 12131101 I
I I
Tue 111102 i I I
Tue 1129102 i i
Tue111111031
i Wed 31311041
Wed 3131/041
Wed 515104
I Wed 61301041
'
Finish Qtr 1, 2001jQtr 3, 2001[Qtr 1, 2002[Qtr 3, 2002/Qir 1, 2003[Qtr 3, 2003[!ltc 1;2oo41mr3.2oii4 -
Tue 6122104 Ill) 111111: II II I I II I Ill: II II I II I mTl:
Mbn 1 0/29f01
Wed 10131101
Tue 11127101
Mon 12131101
Mon 12131101
. Mon 1126/02
Mon 11117/03
Mon 3129104
Wed 3131104
Tue 4127104
Frl 6125104
Wed 6/30104
1111 : ·H •. - "
+J0/31
lliJl: "
wrn1 ~t/31 'i]·• . ;. ';: ' . " " :: n :: tlli
"
" "
" "
[J : II [J
1~(:' 1 ""
• 6/30
G:\Project\2001 \01 090\Conlract\schedule.mpp 5
'--------------------------'-- ·--------

Project Budget and Financial Support Credit Y elm Groundwater Qualitv Monitoring Project Budget Elements Total Eligible Cost (TEC)
Task !-Project Management $15,000 Task 2- Quality Assurance Project Plan (QAPP) $10,000 Task 3- Data Collection & Laboratory Testing $131,000 Task 4- Report Preparation $19,000 TOTAL $175,000 The DOE's Fiscal Office will track to the Total Eligible Project Cost.
Matching Requirements Wash. DOE share FY 01 (75% ofTEC) City ofYelm share (25% ofTEC)
Key Contact Information City of Yelm Billing Contact:
Telephone Number: Fax Number: E-Mail Address:
Engineering Consultant ProJect Supervisor:
Telephone Number: Fax Number: E-Mail Address:
Engineering Consultant Project Manager:
Telephone Number: Fax Number: E-Mail Address:
Engineering Consultant Design Engineer:
Telephone Number: Fax Number: E-Mail Address:
Washington State DOH Contact:
City ofYelm Groundwater ~1onitoring Project Quality Asswanct Project Pb.n
Shelly Badger City Administrator City ofYelm P0Box479 Yelm, W A 98597 (360) 458-8405 (360) 458-4348 [email protected]
Thomas E. Skillings, PE Skillings-Connolly, Inc. P.O. Box 5080 Lacey, W A 98509-5080 (360) 491-3399 (360) 491-3857 [email protected]
Brian Matthews, PE Skillings-Connolly, Inc. P.O. Box 5080 Lacey, W A 98509-5080 (360) 491-3399 (360) 491-3857 bmatthewsi7Vski1lings.com
Kenney Lilliquist, EIT Skillings-Connolly, Inc. P.O. Box 5080 Lacey, W A 98509-5080 (360) 491-3399 (360) 491-3857 klilliguist!iiJskillings.com
Mark Toy
$131,250 $43,750
Washington State Department of Health Division of Drinking Water SOUTHWEST DRINKING WATER OPERATIONS
•
•
• 6

•
- .,., .
•
•
Telephone Number: Fax Number: E-Mail Address:
Washington State DOE Financial Manager:
Telephone Number: Fax Number: E-Mail Address:
Washington State DOE Project Manager:
Telephone Number: Fax Number: E-Mail Address:
Spectra Laboratories Laboratory Manager:
Telephone Number: Fax Number: E-Mail Address:
City ofYelm Groundwater ~-lonitoring Project Quality Assurance Project Pbn
2411 Pacific A venue PO Box 47823, Olympia, WA 98504-7823 (360) 586-5209 (360) 664-8058 [email protected] A. GOY
Dan Filip Financial Manager Water Quality Program Washington State Department of Ecology PO Box47600 Olympia, WA 98504-7600 (360) 407-6509 (360) 407-6574 dfil461 @ecy.wa.gov . ·'·
Christine Hempleman Project Manager Water Quality Program Southwest Regional Office Washingron State Department of Ecology PO Box47775 Olympia, W A 98504-7775 (360) 407-6329 (360) 407-6305 chem461 @ecy. wa.gov
Steve Hibbs Laboratory Manager Spectra Laboratories 2221 Ross Way Tacoma, WA 98421 (253) 272-4850 (253) 572-9838 info@)spectra-lab.com
7

Background and Problem Statement
Project Background
Site Description and Use
"The City's water reclamation project, completed in 1999, utilizes groundwater recharge as one of the final components of the municipal reuse facility. Reclaimed water is used to recharge the same aquifer from which the City pumps its drinking water supplies. While no contamination has been detected to date, the new water reuse infiltration basins have the potential to pose a threat to the water supply. The City is undertaking a groundwater monitoring study to assure the groundwater is not adversely impacted by the recharge component.
Constructed wetlands;_at the Cochrane Park facility are designed-.to provide additional polishing of reclaimed water. The project will also determine the ability of constructed wetlands and specially designed rapid infiltration basins to provide effective additional treatment of reclaimed water prior to groundwater recharge.
The City will undertake tltis monitoring project by comparing the groundwater quality for the next two years to the baseline monitoring results completed in 1998 by the Department of Ecology (WSDOE publication 98-301 ). These monitoring efforts will test for pollutants as well as indicator parameters in the constructed wetlands, groundwater under the infiltration basins and the drinking water supplies." The above description was taken from the Centennial Clean Water Fund Grant Agreement between the DOE and the City of Yelm.
Project Map A layout of the area from which the samples will be taken is included on page 17. The diagram also indicates the approximate location from which several of the samples will be taken. The samples will be taken at locations along the treatment chain as water flows through the park and on to the City's potable wells. Sample point I is located approximately Y, mile away from Cochrane Park at the City's wells 1 and 2. The last sampling point, point number 12, is located at the control structure between the last treatment cell and the rapid infiltration basins.
Site History Historically, the water withdrawn from the aquifer has met the water quality standards of the state and has not exhibited any poor water quality characteristics. The site of Cochrane Park, where the water is polished and infiltrated was previously undeveloped with light, native vegetation. The subsurface flow of the City's aquifer is to the northeast passing by Cochrane Park as it flows toward the City's potable wells.
Previous Water Quality Information Previous sampling results of groundwater baseline sampling in Yelm will be used for comparison of results from tltis monitoring project. Results of the baseline testing are available in the Washington State Departroent of Ecology's publication 98-301.
Applicable Regulatory Requirements and Criteria
Anticipated Site Logistical Problems There are no anticipated site logistical problems.
City ofYelm Groundwater .iV1onitoring Project Qu~dity Assurance Project Plan
8
•
•
•

•
•
•
Problem Statement Determine if recharging the aquifer with Class A reclaimed water is degrading the water quality of the aquifer used by the City. Detennine if the constrUcted wetlands and infiltration basins are providing additional "polishing'' of the reclaimed water before it is applied to groundwater I aquifer recharge .
.. ~
City ofY~lm Groundo,,·at~r ~-1onitoring_ Project Quality Assurance- Project Pbn
9

Project Description
Goals and Decision Statement Yelrn withdraws their potable water from a shallow aquifer. This project will detemrine whether the water within the aquifer is being degraded as a result of recharging the aquifer with Class A reclaimed water. The project will also examine the polishing effects of constructed wetlands and rapid infiltration basins on Class A reclaimed water.
Objectives The objectives of tltis project are to determine the extent of polishing accomplished with constructed wetlands and verify that recharging the aquifer with Class A reclaimed water is not degrading the groundwater quality of the aquifer.
Information needed to meet objective . . Because of the seasonal variations in water use, sewer production, rainfall and groundwater levels, · sampling for a prolonged period of time will have to be implemented to determine the overall affects on the water quality over time. The mortitoriog will span a period of 2 years to account for these variations. Also, by examining the groundwater quality over a two-year period, constituents that may have entered the aquifer by a means other than reclaimed water will be less likely to sigrtificantly alter the comprehensive results. The samples will be taken along the travel path of the reclaimed water. Essentially this will include sample points when it leaves the reclamation plant, as it travels through the wetland treatment cells of Cochrane Park and is fmally withdrawn by the City's wells for use in the potable water system. The results of these water quality samples will be compared to the results ofbackground samples of the aquifer taken before Cochrane Park and the reclamation facility were built.
Information Source(s) The source of information will be the result of the water quality tests taken over the next two years and the background test results published in the Washington State Department of Health's publication 98-301.
Target Population Identification To identify what aspects this mortitoriog project will focus on, target populations need to be established and defmed. For this document, we have considered a "target population" to be the focus point of the study. There are two target populations for tltis project. The first target population is the Class A reclaimed water that is being treated at Cochrane Park. The amount of polishing tltis population receives, as a result of passing through the wetland park will be determined by tltis project. The second target population for tltis project is the ground water of the aquifer into which the reclaimed water is discharged. This project will determine if the groundwater quality ofthe aquifer is being degraded as a result of the infiltration of reclaimed water.
Study Boundaries in time and space Effectively the study will begin at the inflow structure located at Cochrane Park and end at the City's potable wells located approximately Y, mile down gradient from the park. Samples will be taken at the control structures between the wetland cells, the fishpond and the rapid infiltration basins at the park. Samples will also be taken from sampling wells located at the park, the inflow structure of the park and City water supply wells.
Decision Rule This project examines the water quality of two populations: the water along the treatment chain of the constructed wetlands and water of the aquifer being recharged with Class A reclaimed water. The locations selected as sampling sites are representative stages of the target populations travel paths. The two-year
City ofYelm Groundwater Monitoring Project Qwt1ity Assurance Project Pbn
10
•
•
•

•
•
•
project will provide repeated water quality results for each of the sample sites. These results will be compared with the downstream sites to determine if a trend in water quality exists .
Constructed Wetlands If sampling results show that water quality decreases· as the water travels through the treatment chain from the inflow structure to the rapid infiltration basins, then the constructed wetlands can be considered to be degrading the water quality of the Class A reclaimed water before it is discharged into the aquifer.
If sampling results show that water quality increases· as the water travels through the treatment chain from the inflow structure to the rapid infiltration basins, then the constructed wetlands can be considered to be polishing the Class A reclaimed water before it is discharged into the aquifer.
Groundwater Aquifer If samples taken along the groundwater flow path indicate an increasing' or neutral trend in water quality; aquifer recharge with Class A reclaimed water may not be adversely affecting the water quality of the aquifer.
If san;les taken along the groundwater flow path indicate a decreasing' trend in water quality, aquifer recharge with Class A reclaimed water may be degrading the water quality of the aquifer.
In addition if !he concentration of any constituents at the groundwater sampling sites are in excess of !he state trigger level, it is recommended that more rigorous tests be performed including inunediate testing of City wells I and 2.
Anticipated Study Constraints At this time !here are no anticipated constraints associated wiih this project.
• Lower concentrations of analytes are considered to indicate an increase in water quality. Higher concentrations of analytes are considered to indicate a decrease in water quality.
City ofYelm Groundwater Monitoring Project Quality Assurance Project Plan
II

Data Quality Objectives Spectra Laboratories, located in Tacoma Washington, have been contacted as the testing laboratory for this project. The laboratory has prepared the following table of Measurement Quality Objectives for the project:
Measurement Quality Objectives Yelm Groundwater Monitoring Project
ANALYTE ACCURACY PRECISION BIAS
(bias+2xRSD) (RSD= sdev"100/avg) ((avg-T)fT)x100
Ammonia ... 11.03 5.46 0.10
BOD (5-day) 27.80 8.72 10.37
Bromide N/A N/A N/A.
Chloride 4.51 2.18 0.15
Dissolved-Organic Carbon 31.99 14.29 3.41
Fluoride 12.57 5.05 2.46
Surfactants (MBAS) 19.60 9.10 1.40
Nitrate 10.04 4.69 0.65
Nitrite 30.48 6.80 16.89
Sulfate 32.08 12.94 6.19
Total Dissolved Solids N/A N/A NIA
Arsenic 27.61 13.03 1.54
Boron 1.95 0.62 0.71
Cadmium 7.09 2.86 1.37
Chromium 5.72 2.63 0.46
Copper 8.14 2.86 2.41
Iron 17.60 5.56 6.47
Lead 29.11 9.24 10.64
Manganese 6.73 2.80 1.14
Mercury 9.12 3.85 1.41
Nickel 5.87 2.58 0.71
Silver 11.35 4.80 1.74
Zinc 4.15 1.92 0.31
Caffeine 68.71 18.54 31.64
Total Trihatomethanes 25.52 8.29 8.94
Fecal Coliform N/A N/A N/A
Fecal Strep. N/A N/A N/A
TKN 25.14 8.95 7.25
Notes:
Precision and accuracy data for caffeine, bromide, and surfactants (MBAS) not available at this time.
Caffeine data based upon recoveries of nitrobenzene d5.
Surfactant (MBAS) data based on published values (Standard Methods).
City ofYelm Groundwater Monitoring Project Quality Assurance Project Plan
LABORATORY
REPORTING
LIMIT
02mg/L
2mg/L
0.1 mg/L
0.5 mg/L • •
5m9fl
0.5 mg/L
0.02 mg/L
0.5 mg/L
0.1 mg/L
5mg/L
1 mg/L
0.005mg/L
0.008mg/L
0.003 mg/L
0.007 mg/L
0.006mg/L
0.015 mg/L
0.001 mg/L
0.002 mg/L
0.0005 m_g/L
0.015 mg/L
0.007 mg/L
0.006 mg/L
10 ug/L
2 ug/L
N/A
N/A
1.0 mg/L
12
•
. ~ ·, '.'·
•
.. 0
..
•

•
•
•
Sampling Design The intent of this groundwater monitoring project is to determine two things. First the project will determine how the quality of the Class A reclaimed water produced by the City ofYelm is affected by its flow through the constructed wetland of Cochrane Park. This will be accomplished by analyzing the quality of water samples taken along the constructed wetland treatment chain. The second goal of the program is to determine if recharge of the Class A reclaimed water is degrading the water quality of the aquifer from which the City ofYelm relies. The results of this project will be compared to the water quality results of the Department of Ecology's January 1998 publication Yelin Groundwater Baseline Sampling. (Publication no. 98-301) to help determine if degradation of the aquifer is resulting from recharge ofthe aquifer with Class A reclaimed water.
The frequency of sampling and water quality analysis for this monitoring project will be quarterly with samples being taken at the locations shown on the attached site plan. The following diagram shows the locations and identification numbers for sarnpling.sites·ofthe groundwater monitoring plan. The locations
·.are numbered·in order of sampling sequence, Sample point I acting as the frrstpoint from which a sample is to be taken. Sampling procedures are designed to minimize contamination with thorough cleaning of the sampling equipment between sample sites, however; the possibility of cross contamination with tainted equipment still exists. Sampling points have been sequenced so those sites with the highest expected quality will be obtained frrst. This ordering will reduce the chance of samples being contaminated from previous sites with poor water quality.
Wells I and 2 are located approximately Y, mile northeast of the sampling sites. Ideally the water being withdrawn from these wells will have the highest quality and this site was selected as the first sampling point.
The subsurface flow of the aquifer serving the City ofYelin flows in a northeast direction passing by Cochrane Park and the recharge basins as it travels in the direction of the City's potable wells. It is assumed that groundwater entering the study boundary will have higher water quality than that which is being recharged to the basin. Therefore sampling sites 2 and 3 are expected to have the next highest quality and were prioritized accordingly. As groundwater passes under the park, polished Class A reclaimed water will be added to the aquifer's flow. Because the reclaimed water is assumed to have lower quality, sampling points 4 through 7 are expected to exhibit lower water quality than sections of the aquifer up gradient from these wells.
It is expected that the quality of reclaimed water introduced into the constructed wetlands will degrade as it travels from the beginning of the wetland cycle to the recharge basins 1• For this reason the inflow structure has been selected as sampling point 8 because it is expected to have the highest quality of water within the wetland cycle. The point at which water will be released in to the recharge basins has been selected as the last sampling point, sampling point 12. The water quality of sample point 12 and it is expected to have degraded as a result of traveling through the wetland treatment chain and having the lowest expected water quality was selected as the last sampling point.
Before sampling begins a reconnaissance visit will be performed to ensure that appropriate sampling sites have been selected. The monitoring project has been designed to span a period of2 years with testing to occur quarterly (every three months). It is expected that this combination of frequency and duration will result in a comprehensive account ofany seasonal variability affecting outcomes of the project.
1 When the water reclamation project was developed, the community suggested that a catch and release fish pond would demonstrated the benign characteristics of Class A reclaimed water and that constructed wetlands would provide a transitional area around the pond as well as a natural way to "polish" the reclaimed water before it is discharged into the aquifer. However, it is suspected that the quality of the reclaimed water will actually decrease as a result of passing through the treatment chain of the constructed wetlands. City ofYelm Groundwater l\-1onitoring_ Project Quality Assuram.·t: Project Pbn
13

Constituents that will be analyzed by the testing laboratory are listed in the Data Quality Objectives section. In addition to these constituents, the following parameters will be measured in the field during sampling procedures with a Thermo Orion dissolved oxygen meter. • PH • Temperature • Dissolved Oxygen
Conductivity
City ofYelm Groundwater I\,1onitoring Project Quality Asslll·ance Project Plan
14
•
•
•

3
4
I I I I·
• • ·~.·~---------------------------L'B'3{..L...------~------------------- '
SAMPLE POINT 5
TO SAM"YJ POINT 1 _/ APPROX. Vo MILE '! !
SAMPLE POINT 7--,,,'-r:tTY WEllS , . . .
• SAMJ. POINT ~ \
CIITCI'..._. WAliR - I'IIOo1I!CT
15
I
LIJlllll • ~~
• IXJ<fll<l_ ll!llleNnt • C.!l.
n.,.'"""'n_v ... ~ • IUI1mt~ VIII.\(
~~
,,. .... , .. ,... '/!/; ""''"'0 non:
0:£ COim.JII/IM.otefC rr~NN:
= ,_.,""' )-< ~~·
- -- ,,, ·-· -- pn~ ('!><.,... <H
_.....,__ .lliMJll ~ 01« ltl.:D< au...•. """Mtl "'"!. CI'OOM:I
,..._ ll(.oto:l(,.; tM>Ifl.OW <J!NO"l.
•
•
wnwtD8 COCIIIME PARK
BITE PLAN

Field Procedures The following information will be determined and recorded at each sample site. The information and measurements will be recorded in a notebook resistant to adverse weather conditions and dedicated for use on this project. • Date and rime • Sample location and identification
• Location, identification and description for each sample
• Identity of field personnel • Field measurements • Sequence of Events • Changes to the plan • Site and atmospheric conditions
• •
Identity of Quality Control samples Unusual circumstances that may affect data interpolation
• Number of samples collected • For Mortitoring wells: static water lever
TertiPerature, pH, conductivity and dissolved oxygen will be determined in the field with a Thermo Orion Dissolved Oxygen Meter model No. 123003 and then recorded in the dedicated notebook. A copy of the technical specifications for this multi-parameter meter, (obtained from Thermo Orion's website) is included at the end of this plan. ·
For all sample sites, the procedures outlined in Recommended Protocols for Measuring Conventional Water Oualitv Variables and Metals in Fresh Water of the Puget Sound Regio!l, February 1990. (Obtained from the Puget Sound Water Quality Action Team's web site at htto://www.wa.gov/puget sound/) should be used as general guidelines. For constituents not identified in the document, use the recommended methods for metals as general grtidelines.
There are three different types of sampling sites. Slightly different procedures will be followed for the different types of sample sites. *Clean rubber gloves shall be used while obtaining all samples.
City Wells1 and 2 Samples from these wells will be taken at faucets located inside the pumphouse of well #I. The City staff currently uses these faucets to take water samples from the wells as part of their water system operation. The fuucets are dedicated for sampling purposes and draw from the City's dedicated supply line to their storage tanks. The samples will be taken after the City pumps have operated for a minimum of 2 minutes to ensure that a sample representative of water within the aquifer is obtained. Staff will coordinate with the City Water System Operator to determine when the pumps will be in operation and determine the static water level of the well according to the standard operation procedures of the City.
I. Remove aerator (if attached) and place rubber hose on faucet. 2. Slowly fill, from bottom, the sample containers provided by laboratory. 3. Fill dissolved oxygen sample slowly from the bottom of the container and allowed it to overflow in
order to prevent any introduction of additional dissolved oxygen. 4. For samples that do not require preservatives, allow container to overflow a minimum of one bottle
volume. 5. When sampling is complete, pack the labeled samples in coolers with Blue Ice for transport to the
testing laboratory.
Monitoring Wells To obtain samples that are representative of water within the aquifer and not within the mortitoring well bore, the monitoring wells must be purged prior to sampling.
Sanmling Equipment
City of Y elm Ground ... vater :"v1onitoring Project Quality Assurance Project Plan
16
•
•
•

•
' • ~ :· ! • -. ·-- •.•
•
•
The purge pump that will be used is the same type of pump that is currently used by the City's sewer department for sampling of the monitoring wells. The pump is a purge pump by Enviro-Tech model No . ES-40. A copy of the technical specifications is included at the end of this plan.
Static water level measurements will be made with an Olympic Electronic Well probe Model500. The probe has color-coded markers every five feet to aid in water level determination.
Decontamination Procedures Between sample sites, clean pump and multi-parameter meter with diluted hydrochloric acid and flush with de-ionized water.
Sampling Procedures I. Place a drop cloth around the well to prevent introduction of any foreign material. 2. Lower electronic well probe into well until static water level is indicated, record measurement and
repeat. 3. Lower purge pump into well and submerse.approximately 6 inches below water surface. 4. Use a clamp to secure the hose to side of well casing taking care not to block discharge line. 5. A:ctivate pump and discharge purge water away from well. Do not allow purged water to re-enter the
6.
7.
well. Purge well ofbetween I and 5 bore volumes. Monitor and record temperature, pH and dissolved oxygen periodically. Well is considered to be adequately purged of stale water temperature, pH and dissolved oxygen measurements are within 5%. Label sample containers to be filled.
8. Use a clean sample bottle to measure and record conductivity of discharged water per manufacturer's instructions.
9. 10.
II.
12.
Fill sample containers provided by laboratory directly from pump discharge line. Fill dissolve oxygen sample slowly from the bottom of the container and allowed it to overflow in order to prevent any introduction of additional dissolved oxygen . For samples that do not require preservatives, allow container to overflow a minimum of one bottle volume. Pack samples in cooler with Blue Ice for transport to the testing laboratory.
Control Structures The control structures at the park regulate flows from one treatment cell to the next. The structures are watertight basins with volumes of approximately I 0 cubic feet. The inlet and outlet pipes have different elevations to regulate flow. Samples taken from these shallow basins will consist of water from the preceding treatment cell (or fishpond).
Decontamination Procedures Between sample sites, clean multi-parameter meter with diluted hydrochloric acid and flush with deionized water. (Or as recommended by manufacturer if diluted hydrochloric acid is determined to be detrimental to the meter.)
Samnling Procedures I. Clean all foreign debris from cover and sweep sides of ground clear of material that rna enter the
control structure. Use screwdriver or pliers, if needed, to remove debris from crevice surrounding lid before detaching lid
2. Place a drop cloth around the control structure to prevent introduction of any foreign material. 3. Detach and remove the lid 4. Label sample containers to be filled. 5. Record conductivity, temperature, pH and dissolved oxygen per meter manufacturer instructions. 6. To fill containers, submerge them upside down, remove lid and slowly rotate bottle until full.
City ofYelm Groundwater !\·1onitoring Project Quality Assurance Project Phn
17
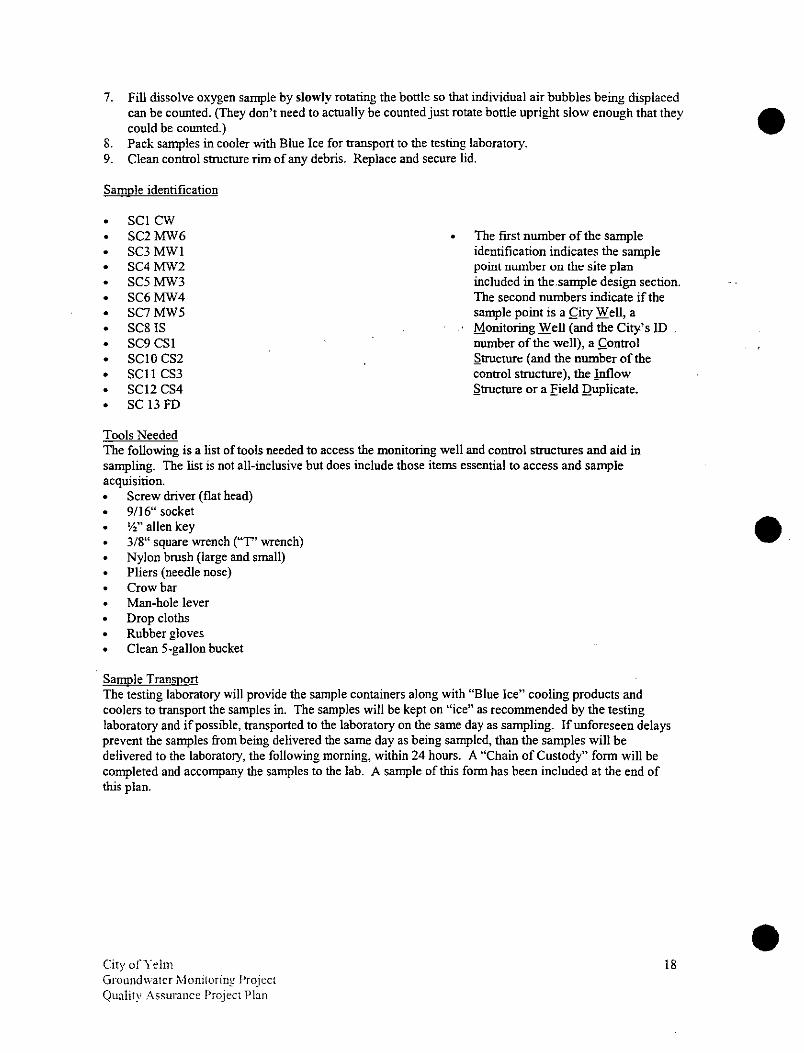
7. Fill dissolve oxygen sample by slowly rotating the bottle so that individual air bubbles being displaced can be counted. (They don't need to actually be counted just rotate bottle upright slow enough that they could be counted.)
8. Pack samples in cooler with Blue Ice for transport to the testing laboratory. 9. Clean control strucrure rim of any debris. Replace and secure lid.
Sample identification
• SCI CW • SC2MW6 • SC3 MWI • SC4MW2 • SC5MW3 • SC6MW4 • SC7MW5
• SC8 IS • SC9 CSI • SCIO CS2 • SCll CS3 • SCI2 CS4 • SC 13 FD
Tools Needed
• The ftrst number of the sample identification indicates the sample point nwnber on the site plan included in the.sample design section. The second numbers indicate if the sample point is a ,hity Well, a Monitoring Well (and the City-'s lD number of the well), a ,Control ,Strucrure (and the number of the control strucrure), the .Inflow ,Strucrure or a Eield :Quplicate.
The following is a list of tools needed to access the monitoring well and control strucrures and aid in sampling. The list is not all-inclusive but does include those items essential to access and sample acquisition. • Screw driver (flat head) • 9116" socket • Yz" allen key
• 3/8" square wrench ("T'' wrench)
• Nylon brush (large and small) • Pliers (needle nose) • Crowbar • Man-hole lever
• Drop cloths • Rubber gloves
• Clean 5-gallon bucket
Sample Transport The testing laboratory will provide the sample containers along with "Blue Ice" cooling products and coolers to transport the samples in. The samples will be kept on "ice" as recommended by the testing laboratory and if possible, transported to the laboratory on the same day as sampling. If unforeseen delays prevent the samples from being delivered the same day as being sampled, than the samples will be delivered to the laboratory, the following morning, within 24 hours. A "Chain of Custody" form will be completed and accompany the samples to the lab. A sample of this form has been included at the end of this plan.
City ofYelm Groundwater .l'v1onitoring Project Quality Assurance Project Pbn
18
•
•
•

• • Laboratory Procedures Spectra Laboratories have prepared the following table oflaboratory procedures:
Laboratory & Field Procedures Skillings/Connolly Yelm Groundwater Monitoring
ANALYTE MATRIX
Ammool• w ... , BOO <5-4>'1 w'"'
Bromldo --"'-ChloMdo --"'-
Ol,.olwd w ... , I
--"'-NilfCIIe w ... , Nitrite w ... ,
'"""' w"" I :l Solids w'"'
I
~
--"'-Coppo< -"""" I ~
'""' '"'" Wotoc
Mo~ocy w''" Nickel w ... ,
_w,w C.ffoloo w""
I
,~,,
~
BOD: Biochemical OJ<:ygen Demand
ISE elan Selective Electrude
PREPARATION
METHOD
~ NIA
~ NIA
I
~ ~
-"~ NIA
;
I
I I
~ ~ ~ ~
_Ntt,.
3015 Oi'i}eslion
;
~ _3510C Sop. FflOool
NIA
~
Color. " Colorimetric Procedure (Spectrophotometric)
ICP : Inductively Coupled Plasma Emission
GFAA" Graphite Furnace Alomic Absorption
MfF • Membrane Fittra!ion
'Sterilized Container
METHOD ·;:~· CONTAINER
EPA I 250ml I
EPA 405.1 0 0. P"'be 1L 1L HOPE
,,. Co~<. I
I ) Tlln>floo '= EPA 415.1 Comb.IIR 50ml 50(}<11llitl~ I 250ml 500mlHOPE
EPA
liSE ~ ~ ,. ~ .soom= EPA 375.4. ; 250ml 500m~
II 500ml 500ml HOPE
EPA 200. 71CP ~ ~ EPA20071CP ~ ~
"0071CP
EPA 200. 71CP ~ ~ EPA 200.71CP ~
EF "39.2 AA _].l<Jml
~ ~ EPA
EPA 200.71CP ~ EPA 200 71CP 250ml 250m! HOPE
EPA 2L I
I ~ I ~
SM ~Filtration 500ml 500ml HOPE'
•
PRES. H;~~
''" 48h""~
"' 28
''"'"' 28 ''"'
'""' """"" '""' """"" ~· 28dol"
61
8""' 8MQ•
' 8 Mo•. 8M<>•
8M"
6M,.
14 ""' 6 "'""
'TA 6 "'""
• Spectra Laboratories will be notified by phone of when sampling is anticipated to take place. After receiving notification, the laboratory will prepare the sample containers and schedule to accommodate the expected samples.
19

Quality Control
Field QC Calibration • The electronic water level probe will be checked with a steel tape for calibration before it is taken into
the field for use. • The multi-parameter meter will be calibrated per manufacturers recommendations; once before being
taken into the field for use, once after half of the samples have been collected and once before the meter is brought back from the field.
Decontamination Several measures will be used to reduce the possibility of contamination from external sources. • Sample sites have been ordered so that sites expected to have the lowest concentrations of constituents
will be sampled first and:sites expected to have the highest concentrations of constituents will be sampled last.
• Clean rubber gloves will be used while collectiog samples. • Equipment will be cleaned with diluted hydrochloric acid and rinsed with de-ionized water between
each sample site.
Precision One duplicate field sample will be taken for every twelve sites that are sampled.
City ofYclm Groundwater Monitoring Project Qunlity AssurJIKe Project Plan
20
•
•
•

• • • Laboratory QC Spectra Laboratories have been contacted as the testing laboratory for this project. The following table describes the laboratory quality control measure for each analyte as identified by the laboratory.
ANAL YTE
Ammonia BOD (5-day)
Bromide Chloride
Dissolved Or anic Carbon Fluoride
Surfactanls MBAS Nitrate Nitrite Sulfate
Total Dissolved Solids Arsenic Boron
Cadmium Chromium
Copper
Iron Lead
Manganese Mercury Nickel Silver Zinc
Caffeine Total Trihalomethanes
Fecal Coliform Fecal Strep.
Laboratory Quality Control Samples Skillings/Connolly Yelm Groundwater Monitoring
CHECK METHOD MATRIX MATRIX SPIKE STANDARDS BLANKS SPIKES DUPLICATES
1/Batch 1/Batch 1/Batch 1/Batch 1 selfBatch 1/Batch NIA NIA
1/Batch 1/Batch 1/Batch 1/Batch 11Batch 1/Batch 1/Batch 1/Batch 2/Batch 1/Batch 1/Batch 1/Batch 1/Batch 1/Batch 1/Batch 1/Batch 1/Batch 1/Batch 1/Batch 1/Balch 1/Batch 1/Batch 1/Batch 1/Batch 1/Batch 1/Batch 1/Batch 1/Batch 1/Balch 1/Batch 1/Batch 1/Batch
N/A 1/Batch NIA NIA 1110 Sam les 1/Batch 1/Batch 1/Batch 1/10 Samples 1/Batch 1/Batch 1/Batch 1/10 Sam pies 1/Batch 1/Batch 1/Batch 1110 Sam pies 1/Batch 1/Batch 1/Batch 1110 Samples 1/Batch 1/Batch 1/Batch 1/10 Samples 1/Batch 1/Batch 1/Batch 1/10 Sam les 1/Batch 11Batch 1/Batch 1/10 Samples 1/Batch 1/Batch 1/Batch 1/10 Samples 1/Batch 1/Batch 1/Batch 1110 Samples 1/Batch 1/Batch 1/Batch 1/10 Samples 1/Batch 1/Batch 1/Batch 1/10Sam las 1/Batch 1/Batch 1/Batch
1/day 1/Batch 1/Batch 1/Batch 1/day 1/Batch 1/Batch 1/Batch NIA 1/Batch NIA NIA NIA 1/Batch NIA NIA
SAMPLE DUPLICATES
None dilutions in triplicate
None None None None None
.
None None None
1fBatCh None ..
None None None None None None None
None None
None None None None NIA NIA
• A "batch" is a cycle of sampling. As part of this project the laboratory will be presented with 13 samples for analysis. Analysis of these 13 samples is considered a "batch". Check Standards are a second source standard, of a known value that is run at the end of a batch to check that the equipment was calibrated throughout the duration the analysis.
21

Data Management Procedures
Field Data from field measurements will be recorded at the time of measurement in an all weather field notebook dedicated for use on the project. Before proceeding to the next sampling point the data will be compared to the historical data of the sampling point to identify any gross discrepancies. The field data obtained during sampling will be entered into the data spreadsheets upon returning from the field.
Laboratory The data package provided by the lab shall include a case narrative discussing any problems with the analysis, corrective actions taken, changes to the referenced method, an explanation of data qualifiers and all quality control results associated with the data including: method blanks, check standards, analytical duplicates and matrix spikes.
Data Base ... Results from the laboratory will be entered into Microsoft Excel spreadsheets formatted by the Dep.frtment of Ecology. The spreadsheets will be submitted to the Depattment of Ecology for entry into Ecology's Environmental Information Management (ElM) system on a quarterly basis once all of the results ltave been obtained from the lab and entered into the spreadsheets for that testing period. Submission of data to the department on a quarterly basis will reduce the chances for data rejection by the departments system and allow data acquisition and recording methods to adjust smoothly and efficiently if needed. The data will be entered into the spreadsheets following the ElM Data Submittal Guide obtained from the web site: http://www.ecy.wa.gov/services/as/iip/eim/eirndsg.html
Existing Data Management of existing data will not be necessary for this project. The results ofthis monitoring project will be compared to the water quality results of the Department of Ecology's January 1998 publication Yelm Groundwater Baseline Sampling. (Publication no. 98-301) as part of the final report.
City ofYelm Groundwater o\Ionltoring Project Quality Assurance Project Plan
22
•
•
•

•
' .. ~. _._-. ...
•
•
Audits and Reports A Technical Systems Audit (TSA) will be performed shortly after the sampling and testing has begun. Personnel from both Skillings-Connolly, Inc. and Spectra Laboratories will perform the audit together. The audit will examine how the project team is adhering to the intentions and guidelines established by this Project Plan. Coordination of the audit will serve to economize the work effort and quickly implement comprehensive corrective measures if needed. The successful audit will identifY deviations from the quality assurance plan and will result in project team working together to address the fmdings of the audit. Findings of the audit and any corrective measures will be documented and summarized in the fmal project report. In addition the testing lab will be subject to national standards of quality and performance for testing laboratories.
Sampling, cleaning and maintenance procedures of field equipment and use will be evaluated on a quarterly basis for the first four quarters of the testing and sampling period. This frequency of field procedure
-"''·'···:evaluation will ensure that field procedures are acceptable and minimize the potential for obtaiiting filed . ·,-. ' ' data and samples of questionable quality .. Following the first four quarters of the sampling and testing period, the use and care of field equipment will be evaluated every second quarter. The field equipment will be maintained as recommended by the manufacturer or more frequently if required.
A quarterly report will be prepared by the staff of Skillings-Connolly and submitted to the manager of the project for Skillings-Connolly. The report will be prepared with input from the testing laboratory and serve to assess the accuracy and completeness of data, review the results of system audits.and identify any significant quality assurance problems and corrective actions taken .
CityofYelm Grounctwatt:r S1oni!Oring Proje..::t Quality Assurance Project Plan
23

Data Review, Verification and Validation
Data Review Data obtained in the field will be examined thoroughly for completeness. The Data obtained will be reviewed for consistency, correctness and completeness to ensure that no errors or omissions were made. The person collecting the samples will ensure that the intent of the sampling design was met and review the data collection procedures before leaving the site.
Data Verification The testing laboratory staff will review subntitted samples for completeness and proper collection protocols. The testing laboratory shall provide a case narrative along with the testing results. The case narrative will include review and verification of the quality control results by the laboratory staff for .compliance with acceptable criteria.
Data Validation The comPlete data package obtained from the iesting laboratory will be exantined in detail by the SJilllingsConnolly, Project Manager. The methods, standard operating procedures and results will be examined to determine if the Quality Assurance Project Plan has been followed.
Following validation of the data, the testing laboratory will be consulted to determine if the measurement quality objectives for the project have been met.
Data Quality Assessment If contaminants are not found in the samples taken and the testing lab is confident with their testing results, then the data will be considered suitable for archiving in the ElM data base for comparison with funrre data. The testing methods and sampling procedures that will be followed by this monitoring project will not deviate significantly from acceptable standard practices. It is reasonable to assume that funrre data, obtain in a sintilar manner, can be reliably compared with the results of this project if the samples are examined by a qualified testing laboratory.
An electronic file of this document is located at the Skillings-Connolly, Inc. office under the following: G:\project\2001101090 Yehn Groundwater Monitoring\ Work Product\Quality Assurance Project Plan (QAPP).doc
City ofYelm Groundwater .Monitoring Project Quality Assurance Project Plan
24
•
•
•

•
•
•
BIBLIOGRAPHY
Carey, Barbera, Quality Assurance Interim Guidelines for Water Quality Sampling Analysis: Ground Water Management Areas, December 1986.
Environmental Information Management (ElM) Data Submittal Guide, Washington Sate Deparrment of Ecology, Online, Internet, October 23, 200!. Available: http://v.'V.'V,'.ecv. wa. 2:ov/services/as/iip/eimleimdsg.html
Erickson, Denis, Yelm Groundwater Baseline Sampling, D.O.£ Publication No. 98-30, Washington State Department of Ecology, January !998.
Lombard, Stewart.M., Kirchmer, Cliff.J., Guidelines for Preparing Quality Assurance Project Plans for Environmental Studies D.O.E. Publication.No. 0/"03-003,.Washington Stated Department of Ecology, February 200!.
Recommended Protocols for Measuring Conventional Water Quality Variables and Metals in Fresh Water of the Puget Sound Region, Prepared for the U.S. Environmental Protection Agency and the Puget Sound Water Quality Authority, February 1990 .
City ofYdrn Grouno~,·atrr ~lonitoring Project Quality Assurance Project Pbn
25

City ofYelm Groundwater Monitoring Project Quality Assurance Project Plan
26
•
•
•

•
. -
•
•
SAMPLE FORMS AND EQUIPMENT SPECIFICATIONS
Ciry ofYehn Groundwater Monitoring Project Quality Assurance Project Plan
27

( (_:·) CHAIN of CUS. ODY SPECTRA Laboratories PAGE _____ of _____ _
2221 Russ Way • cnlcunm, WA 98421 • (253) 272-4850 • Fax (253) 572-9838 • www.speclra-lab.cum STANDARD I=] RUSH r:-· I I I I I
- -----~-----
I CLIENT: HYDROCARBONS ORGANICS METALS Oil-IER -------------
PROJECT: r- r- --· - - --- -
"' it it CONTACT: n: !!? " w irl " z z <! .. G PI-lONE: ~
w Q. w :l '-' n:
~ !!! '-' Q. --- n: !!! 0 <;> 0 "' ~ ~ a: n. i.i FAX: e-MAIL: '-' ::; "' 0 R "' "' LU f-0 J: w n: ::: ~ "' -' -' m ~ "' z "' u. G
I J: ~
'" ~ ~ I ~ Q. LL
0 9 g g 0 0 Y.! PURCHASE ORDER#: ~ <;> >-' iii <3 iii l! "' " " ~ Q. - ffi J: J: "' " " -' " " X 0 "' "' Q.
~ ~ "' J: :> '-' "' ~ Q_ -'
~ V> J: a
" ~ ~ ;z ;z ~ g 0 N 10 "'
~ ~ m '-' "' :J SAMPLE ID DATE TIME MATRIX ::> ~ 11: " 12 0 ~ ~ J: 0 ~ 0
SAMPLED SAMPLED z z :'! :'! " !:j :;! r- a. f- "' - - ::..= -=-'--- -·
r- - -.
-- - - - t- - - - - -- - -- ··-
t- ~ ~ ~ ~ -- - ·- - -· - -
- ~ - ~ ~ ~ ~ -- - --- - -
- ~ ~ ·- - -- ·--· - -
~ ~ i- ~ -- --- ·-· - - - ·-- . -.
1-~ :-~ :-- ~ ~ - - -- - -- -- -·-
- - ~ - ~ - ~-
1- ~ :- ~ :- - t- - -- - - -· - --
t- ~ 1- ·- - ~ ~ -- --
--· ... - ·- --- -- --·- ..
SPECIAL INSTRUCTIONS/COMMENTS:
---SIGNATURE PAINTED NAME COMPAfH' DAlE Hf.1E ·- --RELINQUISHED BY
)
-- -----·- ·-.
RECEIVED BY
----RELINQUISHED BY
RECEIVED BY
' RETURN ;[ J DISPOSE SAMPLES [
Payment Terms: Net 30 days. Past due a.s subject to 11h% per month inleresl. Customer agrees to pay all cos Is of collecli.uding rertsorrnbi<J allorney's fees and all other associated co colleclion regardless of whether suit is filed. Spectra Analytical, Inc.
(Fee Applies)

Thermo Orion
~ Model1230 Waterproof Dissolved Oxygen Meter
- Simultaneous Monitoring of Dissolved Oxygen and pH -Fully Waterproof to IP67 and NEMA 6 - i 20 Po1nt Oataloggtng, RS23:Z and GLPdoc ~""
Thermo Orion's Model 1230 allows monitoring of pH and DO or pH and Condue1ivity .. simultaneously with,temperature date'and time. The' Model1230 offers Auto-Buffer
Recognition, DirectC_aJTM and AUTO-CAL TM to make calibration and accurate measurements of mUltiple parameters simple. The datalogQing and printing options make data collection easy. The GLPdoc "Good Laboratory Practices" feature ensures proper documentation of calibrations and results. Meter warranty is three (3) years.
~~ 9107WP electrode, 013010 conductivity cell, 083010 DO Probe, ~red meter case, and solutions.
Starter Kit includes field case and annored meter case.
• Specifications: Range. % Saturation Resolution. % Saturation Temperature Range Temperature Accuracy Auto Barometnc Pressure Measurement
Outnuts Datalogging (pomts) Battery Power Range. mg/L (ppml Resolution. mg/L (ppm)
Relative Accuracy Temoerature Resolution Salinity Correcnon Other Modes Oisolay
lnouts Pnnting Caoability Agency Aoprovals 'Naterorooi Ranng
.:.11 ::nee~ .snown are m US co11ars
•c.cooo
23001
·::oo:z
~iOVw11h oH Prc::::e
:2!JV Wllh orl P~::::;e
Oto 199.9%. o to600% 0.01 .s to so· c 0.1 = 1 digit Yes
RS232
120
Rechargeable NiCd. AC Line. 110/220 0.00 to 19.99 mg/L. 0.0 to 90.0 mg/L 0.01
= 0.5'%.::: 1 digit
0.1
0.0 to 70.0 ppt
pH. mV. ORP. Temperature. Conduct:viry
LCD
8 p1n WP DIN. DIN (with BNC Adacter). Single Banana Yes
UUCS..VCE/1EC301. TUV IP67
91 07WP ana buffers
91 07WP and buTters
6·· Thermo Elec!ron
.. •?&t*-f"*'§ ~& ujpn~: ·::tc¥§f®~i-@7a:~_p/
(

Dec 25 Ol 03;38p Env1ro-Tecn l925l370-8037 p. 1
• A. Quality Environmental Products .t..
DIRECTIONS AND SPECIFICATIONS FOR MODELS ES-60 AND ES-40 DC PUMPS
USES: !)Purging wells to 60 feet ;7 2) Dedicated Pump ~i1 0 }-' 3) Draw down and recharge tests ' :-\I \L lf 4) Disposable pump for retrieving submerged product \ 5) Disposable well development pump \
DIRECTIONS: The purge pwilp is very easy. to use, Simply Connect the required length of tubing to the pump and .,;;mpletely submerge the pump in water. There is no controi box or on"off switch. The pump will begin pumping when the connection is made to the 12 volt battery. The pump has an outlet to take a 3/8" hose, but can quickly be adapti:d to take a 1/2" hose by pushing on the 112" adaptor suppiied with the pump. Recommended tubiri.g.is )/2" nylon ~inforced PVC.
MAINTENANGE: Both the ES-40 and ES-60 are fitted with a slo~d ~to :filter large particles of sand and rock. If particles are Visible·in the slots they. should be removed: Other than that no maintenance ;~.required. No attempt should be made to open the purilps. They. ari,.not rebuildable, · · · ·
ES-60 MODEL; Tius model Will ~ump ~to 60 feetofhead using 112~ ID hose. :rh~ length of the lead line supplied with this pump is 62 feet On one end of the leali line are the battery.clips, on the otherend.isthe pump, ES-40 MODEL: This tmitwill PumP up tu 40 feet of head, so feet on lead line·is supplied.
HELPFUL HlNTS: . .
60'
:o·
•o·
:;o·
20'
I) lJse a fully charged barterYc Do not operate the pump from a battery that is ~9nn"9ted·t0 :in op~rating vehicle engine. 2) Do not run the pump dry,· · · · :;) Use the tubing tO suppon the weight of the pump in the well rather than :the lead ljne. 'f!!is protects the waterproof connection·wherethelead line goes into the top ofthe pump. · .. .!) To prevent air cavitation· in the pump, start up in thefollowing manner: On for 4 seconds, off for 4, on for 4, off for 4, one more rune and the air should. be out of the pump and up the tubing; . 5) Do not pump from silt trap, . • . '6) Do not dismantle the pump. 7) After each uSe pump clean water through the pump.
) -l '1 "' "' .,vu:x.; 00
.:r:z.rr ['c.-f) I 0 C( -ES-6C• and ES-40 Pump Curve
ES-BO SPECIFICATIONS ES:-40 SPECIFICATIONS
~ I
""' I
""' /'\_ I Es..QO I v ~ '\J I
! :::s-w / ~ I
VOLTAGE. ...................... 12 VOLT DC DIAMETER. ...................... 1.5 INCHES
'LENGTH ........................ : ... 131NCHES OUTPUT ............. : .................. 2.8 GPM FUSE RATING ............ - ........ 10 AMPS OISCHARGE ..................... 1/2 OR 3/8 I MPELLEK. ....................... ST AINL!::SS CASING ......................... ABS PlASTIC SE.-"LS ......................... SYN RUBBER
VOLTAGE ...................... 12 VOLT DC DIAMETER. ..................... 1.5 INCHES LENGTH ............................. 6 INCHES OUTPUT .................................. 3 GPM FUSE RATING ....................... 5 AMPS DISCHARGE: .................... 1/2 OR 3/8 IMPELLEK.. ..................... STAINLESS CASING ....................... ABS PLASTIC SE-"LS ........................ SYN RUBEE:,.,,
J' '------"--------"-1 -~~~ 0 ~pm 1 g;:m :;pm 3qpm
....:..~=: ~:..:mise Orrve. Suire i01 . .\'.amnez.. •.:;.. 94553 · 92:.:70.:5-:i . ~25.370.3037 'ax
•
•

•
•
• •
•

Table C.l Sampling Point Locations
• Sampling Latitude Longitude Locations SC1 CW 46"56'24. 73" 122"36'23.06" .. SC2MW6 46"56'14.48" 122"36'32.64" SC3MW1 46"56'12.66" 122"36'39.20" SC4MW2 46"56'13. 75" 122"36'39.67"
~
SC5MW3 46"56'15.51" 122"36'38.94" SC6MW4 46"56'16. 73" 122"36'39.92" SC7MW5 46"5616.87" 122'36'34.69" - -SC81S 46"56'14.18" 122"36'38.98" SC9 CS1 46"56'13.47'' 122"36'36.71" SC10 CS2 46"56'15.69" 122"36'33.38" SC11 CS3 46"56'13.47" 122"36'34.24" SC12 CS4 46"56'13.21" 122"36'35.82"
•
•

•
•
•
Table C.2 Seasonal Variation on Select Parameters
Sample Quarter
-1st Quarter 2nd Quarter 3rd Quarter 4th Quarter
I 5th Quarter
!1
7th Quarter 8th Quarter
6th Quarter
I .. :
1
' 1st quarter 2nd quarter
II 3rd quarter 4th quarter
i 5th quarter I 6th quarter ' 7th quarter
8th quarter
I' 1st q.uarter
2nd quarter :
1
_3rd quarter 4th quarter
i 5th quarter I 6th quarter
il. 7th qua. rter 8th quarter
I
CIN"
3.46 2.4 2.54 3.2 3.1 3.8 2.5 2.4
0.08 0.11 0.21 <0.1 <0.1 <0.1 <0.1 <0.2
89 64 86 68 95 85 82 113
i 1st quarter <6 I 2nd quarter 2 II 3rd quarter 4
4th quarter 7 I 5th quarter 6 I 6th quarter <2
1
7th quarter 5 8th quarter 2
a) CW =City well
MWB" MW1 MW2 Nitrate+Nitrite-N (mg/L)
5.05 2.12 2.25 5.5 3.1 3.2
2.34 4.33 4.29 2.3 3.8 4.4 3.5 2.4 4.02 4.6 2.3 2.3 1.11 3 1.28
4 2.4 1.5
Ammonia-N (mg/L) 0.04 0.04 0.03 0.11 0.1 0.08 0.21 0.2 0.18 <0.1 <0.1 <0.1 <0.1 <0.1 <0.1 <0.1 <0.1 <0.1 <0.1 <0.1 <0.1 <0.2 <0.2 <0.2
Total Dissolved Solids (mg/L) 100 75 61 96 73 62 86 90 100 80 71 114 128 101 164 110 76 147 54 62 106 119 87 169
Dissolved Organic Carbon (mg/L) 7 7 7
<2 25 11 9 4 4 5
<2 9 9
913 7 4 8
<2 7 9 11 <2 7 4
b) MW =Monitoring Well #x
MW3
6.05 5.4 3.38 2.8 7.4 4
2.91 3.6
0.03 0.08 0.18 <0.1 <0.1 <0.1 <0.1 <0.1
240 180 230 195 315 218 81 184
7 <2 9 9 9 8 <2 <2
MW4
1.81 2.2 3.13
1 3
2.4 3.28 1.6
0.03 0.08 0.18 <0.1 <0.1 <0.1 <0.1 <0.1
100 170 180 242 175 138 149 114
10 2 8 12 11 10 8
<2
MWS
4.88
I 4.8 4.22 3.4 3.4 3.6 1.64 2.4
0.56 0.08 0.15 <0.1 <0.1 <0.1 <0.1 <0.1
140 100 110 99 114
I
I
I
'I 119
255 . 11
,1
114
10 <2 7 9 10 2 10 <2
I

•

.'-------"' SPECTRA Laboratories 2221 Ross Way
04/08/2002
Skillings-Connolly, Inc. PO Box 5080 Lacey, W A 98509 Attn: Kenney Lilliquist
0 Tacoma, W A 98421 o
P.O.#: (253) 272-4850
1-186164-01090
Client ID: Sample Matrix:
Date Sampled: Date Received: Spectra Project:
SCI CW Water 03/07/2002 03/08/2002 2002030066
. Spectra Number: I
Analyte Result Units.:. .. · Method Analyte Result Units Method Arsenic <5 ug/L EPA 206.2
Boron 84 ug/L EPA 200.7
Cadmium <3 ug/L EPA200.7
Chromium <7 ug/L EPA200.7
Copper 16 ug/L EPA200.7
Iron 140 ug/L EPA200.7
Lead <I ug/L EPA 239.2
~-ese 4 ug/L EPA200.7
<0.5 ug/L EPA 245.1
Nickel < 15 ug/L EPA200.7
Silver <7 ug/L EPA200.7
Zinc 13 ug/L EPA 200.7
Bromodichloromethane <I ug/L SW846 8260B
Bromoform <I ug/L SW846 8260B
Caffeine <10 ug/L EPA 625
Chlorodibromomethane <I ug/L SW846 8260B
Chloroform <I ug/L SW846 8260B
N-Nitrosodimethylamine <10 ug/L EPA 625
TKN 1.1 mg/L SM 4500-N-B
Ammonia 0.08 mg/L-N EPA 350.3
Anionic Surfactants in <0.05 mg/L
·BOD
•
4 mg/L
Surrogate Recovery
2·Fluorophenol 140
Phenol-d6 Ill
Nitrobenzene-dS 52
2-Fluorobiphenyl 53
SPECTRA LABORATORIES
Steve Hibbs, Labotatory Manager al4/sgh
SM5540C
SM 5210
Method
SW846 8270C
SW846 8270C
SW846 8270C
SW846 8270C
Bromide <0.50 ug/L SM4500-Br-B
Chloride 4.5 mg/L SM4500CL-C
Dissolved Organic Carbon <6 mg/L EPA 415.1
Fluoride 0.03 mg/L EPA 340.2
Nitrate 3.46 mg/L-N SM4500N03D
Nitrite <0.01 mg/L-N SM4500N02B
Sulfate <I mg/L EPA 375.4
Total Dissolved Solids 89 mg/L EPA 160.1
Surrogate Recovery Method
2,4,6-Tribromophenol 98 SW846 8270C
p-Terphenyl-dl4 72 SW846 8270C
Dibromofluoromethane 94 SW846 82608
Toluene-dB 101 SW846 82608
Page 1 of 13

SPECTRA Laboratories 2221 Ross Way
04/08/2002
Skillings-Connolly, Inc. PO Box 5080 Lacey, W A 98509 Attn: Kenney Lilliquist
• Tacoma, WA 98421 • (253) 272-4850 P.O.#: 1-186164-01090
Client ID: SC2MW6 Sample Matrix: Water
Date Sampled: 03/07/2002 Date Received: Spectra Project:
03/08/2002 2002030066
Spectra Number: 2
•
· 'Amilyte Result Units Method., :Analyte Result Units Method Arsenic <:5 ug!L EPA 206.2
Boron 87 ug!L EPA 200.7
Cadmium <3 ug!L EPA 200.7
Chromium <7 ug!L EPA200.7
Copper 8 ug!L EPA200.7
Iron 550 ug!L EPA 200.7
Lead < I ug!L EPA 239.2
Manganese !50 ug!L EPA200.7
Mercury <0.5 ug!L EPA 245.1
Nickel < 15 ug!L EPA 200.7
Silver 9 ug!L EPA200.7
Zinc 33 ug!L EPA 200.7
Bromodichloromethane <1 ug!L SW846 8260B
Bromoform <1 ug!L SW846 8260B
Caffeine <10 ug!L EPA 625
Chlorodibromomethane <I ug!L SW846 8260B
Chloroform <I ug!L SW846 8260B
N-Nitrosodimethylamine <10 ug!L EPA625
TKN 1.7 mg!L SM4500-N-B
Ammonia 0.04 mg!L-N EPA 350.3
Anionic Surfactants in <0.05 mg!L
BOD 2 mg!L
Surrogate Recovery
2-Fiuorophenol 132
Phenol-d6 102
Nitrobcnzene..JS 50
2-Fluorobiphenyl 58
SPECTRA LABORATORIES
Steve Hibbs, Labiillitory Manager al4/sgb
SM5540C
SM 5210
Method
SW846 8270C
SW846 8270C
SW846 8270C
SW846 8270C
Bromide <0.50 ug!L SM4500-Br-B
Chloride 4.7 mg!L SM4500CL-C
Dissolved Organic Carbon 7 mg!L EPA415.1
Fluoride 0.05 mg!L EPA 340.2
Nitrate 5.05 mg!L-N SM4500N03D
Nitrite <0.01 mg!L-N SM4500N02B
Sulfate < 1 mg!L EPA 375.4
Total Dissolved Solids 100 mg!L EPA 160 .•
Surrogate Recovery Method
2,4,6-Tribromophcnol 74 SW846 8270C
p-Terphenyl-dl4 76 SW846 8270C
Dibromofluoromethane 92 SWS46 82608
Toluene-dB 100 SW846 82608 • Page 2 of 13

·--" SPECTRA Laboratories 2221 Ross Way • Tacoma, W A 98421 • (253) 272-4850
04/08/2002
Skillings-Connolly, Inc. POBox 5080 Lacey, W A 98509 Attn: Kenney Lilliquist
Analyte Result Units Method . - --
ug!L EPA206.2 Arsenic <5
Boron 70 ug!L EPA200.7
Cadmium <3 ug!L EPA 200.7
Chromium <7 ug!L EPA200.7
Copper 9 ug!L EPA200.7
Iron 720 ug!L EPA 200.7
Lead <I ug!L EPA 239.2
~~ese 76 ug!L EPA200.7
<0.5 ug!L EPA245.1
Nickel < 15 ug!L EPA 200.7
Silver <7 ug!L EPA 200.7
Zinc <6 ug!L EPA200.7
Bromodichloromethane <I ug!L SW846 82608
Bromoform <I ug!L SW846 8260B
Caffeine <10 ug!L EPA 625
Chlorodibromomethane <I ug!L SW846 82608
Chloroform <I ug!L SW846 82608
N-Nitrosodimethylarnine <10 ug!L EPA 625
TKN 2.8 mg!L SM 4500-N-B
Ammonia 0.04 mg!L-N EPA 350.3
Anionic Surfactants in <0.05 mg!L
BOD 4 mg!L
Surrogate Recovery
2-Fiuorophenol 176
Phenol-d6 Ill
Nitrobenzme-<15 66
2-Fiuoroiriphenyl 67
• SPECTRA LABORATORIES
Steve Hibbs, Laboratory Manager al4/sgh
SM5540C
SM 5210
Method
SW846 8270C
SW846 8270C
SW8468270C
SW846 8270C
P.O.#: 1-186164-01090
Client ID: SC3 MWl Sample Matrix: Water
Date Sampled: 03/07/2002 Date Received: 03/08/2002 Spectra Project: 2002030066 Spectra Number: 3
Analyte "~,-. - Result Units Bromide <0.50 ug!L
Chloride 6.5 mg!L
Dissolved Organic Carbon 7 mg!L
Fluoride 0.03 mg!L
Nitrate 2.12 mg!L-N
Nitrite <0.01 mg!L-N
Sulfate <I mg!L
Total Dissolved Solids 75 mg!L
Surrogate Recovery Method
2,4,6-Tribromopbcnol 96 SW846 8270C
p-Terpbenyl-dl4 70 SW846 8270C
Dibromofluoromethane 92 SW846 82608
Toluene-dB 99 SW846 82608
Page 3 of 13
Method SM4500-Br-B
SM4500CL-C
EPA415.1
EPA 340.2
SM4500N03D
SM4500N02B
EPA 375.4
EPA 160.1

SPECTRA Laboratories 2221 Ross Way
04/08/2002
Skillings-Connolly, Inc. PO Box 5080 Lacey, W A 98509 Attn: Kenney Lilliquist
• Tacoma, W A 98421 • (253) 272-4850 P.O.#: 1-186164-01090
Client ID: SC4MW2 Sample Matrix: Water Date Sampled: 03/07/2002 Date Received: 03/08/2002 Spectra Project: 2002030066 Spectra Number: 4
•
Analyte .u• Result Units Method · Analyte Result Units Method ---
Arsenic <5 ug/L EPA206.2
Boron 91 ug!L EPA 200.7
Cadmium <3 ug/L EPA 200.7
Chromium <7 ug/L EPA 200.7
Copper <6 ug/L EPA200.7
Iron 430 ug/L EPA200.7
Lead <I ug/L EPA239.2
· Manganese 6 ug/L EPA200.7
Mercury <0.5 ug/L EPA 245.1
Nickel < 15 ug/L EPA 200.7
Silver <7 ug/L EPA200.7
Zinc 10 ug!L EPA 200.7
Bromodichloromethane <1 ug/L SW846 8260B
Bromoform <1 ug/L SW846 8260B
Caffeine <10 ug/L EPA 625
Chlorodibromomethane <1 ug/L SW846 8260B
Chloroform <1 ug!L SW846 8260B
N-Nitrosodimethylarnine <10 ug/L EPA 625
TKN <1.0 mg/L SM 4500-N-B
Ammonia 0.03 mg!L-N EPA 350.3
Anionic Surfactants in <0.05 mg!L
BOD 4 mg!L
Surrogate Recovery
2-Fiuorophenol 196
Phenol-d6 154
Nitrobenzene-dS 73
2-F\uorobiphenyl 75
SPECTRA LABORATORIES
Steve Hibbs, Laboi'litory Manager al4/sgh
SM5540C
SM 5210
Molhod
SW846 8270C
SW846 8270C
SWS46 8270C
SW846 8270C
Bromide·-
Chloride
Dissolved Organic Carbon
Fluoride
Nitrate
Nitrite
Sulfate
Total Dissolved Solids
Surrogate
2,4,6-Tribromopbenol
p-Tcrpbenyl-d\4
Dibromofluoromethane
Toluene-dB
<0.50 ug/L
3.5 mg/L
7 mg!L
0.03 mg/L
2.25 mg/L-N
<0.01 mg!L-N
<I mg!L
61 mg/L
Recovery Method
116 SW846 8270C
82 SW846 8270C
92
100
SW846 826GB
SW846 82608
Page 4 of13
SM4500-Br-B
SM4500CL-C
EPA415.1
EPA 340.2
SM4500N03D
SM4500N02B
EPA 375.4
EPA 160.1.
•

·--- SPECTRA Laboratories 2221 Ross Way o Tacoma, W A 98421 o (253) 272-4850
04/08/2002 P.O.#: 1-186164-01090
Client ID: SC5 MW3 Sample Matrix: Water
Skillings-Connolly, Inc. Date Sampled: 03/07/2002 PO Box 5080 Date Received: 03/08/2002 Lacey, W A 98509 Spectra Project: 2002030066 Attn: Kenney Lilliquist Spectra Number: 5
Analyte ':··- Result Units Method Analyte Result Units Method· ..
Arsenic <5 ug/L EPA 206.2 Bromide <0.50 ug/L SM4500-Br-B
Boron 59 ug/L EPA 200.7 Chloride 37 mg/L SM4500CL-C
Cadmium <3 ug/L EPA 200.7 Dissolved Organic Carbon 7 mg/L EPA 415.1
Chromium <7 ug/L EPA 200.7 Fluoride 0.03 mg/L EPA 340.2
Copper <6 ug/L EPA200.7 Nitrate 6.05 mg/L-N SM4500N03D
Iron 300 ug/L EPA200.7 Nitrite <0.01 mg/L-N SM4500N02B
Lead < l ug/L EPA239.2 Sulfate 14 mg/L EPA 375.4
-~ese 5 ug/L EPA 200.7 Total Dissolved Solids 240 mg/L EPA 160.1
<0.5 ug/L EPA 245.1
Nickel < 15 ug/L EPA 200.7
Silver <7 ug/L EPA 200.7
Zinc 8 ug/L EPA 200.7
Bromodichloromethane <I ug/L SW846 8260B
Bromoform <I ug/L SW846 8260B
Caffeine <10 ug/L EPA625
Chlorodibromomethane <I ug/L SW846 8260B
Chloroform <I ug/L SW846 8260B
N-Nitrosodimethylamine <10 ug/L EPA625
TKN <1.0 mg/L SM 4500-N-B
Anunonia 0.03 mg/L-N EPA 350.3
Anionic Surfactants in <0.05 mg/L SM5540C
BOD 4 mg/L SM 5210
Sunogate Recovery Method Surrogate Recovery Method
2·fluorophenol 220 SW8468270C 2,4,6-Tribromophenol 122 SW846 8270C
Phcnol-d6 175 SWS46 8270C p-Terphc:nyl-dl4 80 SW846 8270C
Nitrobenzcne-d5 79 SW846 8270C Dibromofluoromethane 93 SW846 82608
84 2-Fiuorobiphenyl
• SPECTRA LAB ORA TORIES
SW8468270C Toluene-dB 100 SW846 82608
Stev~ Hibbs, Labo"i'lltory Manager Page 5 of 13 ai4/sgh

SPECTRA Laboratories 2221 Ross Way
04/08/2002
Skillings-Connolly, Inc. PO Box5080 Lacey, WA 98509 Attn: Kenney Lilliquist
• Tacoma, WA 98421 • (253) 272-4850 P.O.#: 1-186164-01090
Client ID: Sample Matrix:
Date Sampled: Date Received: Spectra Project:
SC6MW4 Water 03/07/2002 03/08/2002 2002030066
Spectra Number: 6
•
Analyte 1. 1·~: .. Result Units Method Analyte Result Units Method. .. Arsenic <5 ug!L EPA 206.2
Boron 240 ug!L EPA 200.7
Cadmium <3 ug!L EPA 200.7
Chromium <7 ug!L EPA 200.7
Copper 13 ug!L EPA 200.7
Iron 500 ug/L EPA 200.7
Lead < I ug!L EPA 239.2
Manganese 4 ug!L EPA 200.7
Mercury <0.5 ug/L EPA 245.1
Nickel < 15 ug!L EPA 200.7
Silver <7 ug!L EPA 200.7
Zinc <6 ug!L EPA 200.7
Bromodichloromethane <I ug!L SW846 8260B
Bromoform <I ug/L SW846 8260B
Caffeine <10 ug!L EPA 625
Chlorodibromomethane <I ug!L SW846 8260B
Chloroform <I ug!L SW846 8260B
N-Nitrosodimethylamine <10 ug/L EPA 625
TKN 1.4 mg!L SM 4500-N-B
Ammonia 0.03 mg!L-N EPA 350.3
Anionic Surfactants in <0.05 mg!L
BOD 3 mg!L
Surrogate Recovery
2-Fluorophenol \64
Pbenol-<16 \30
Nitrobenzene-d5 60
2-Fluorobiphenyl 63
SPECTRA LABORATORIES
Steve Hibbs, Laboratory Manager al4/sgh
SM5540C
SM 5210
Method
SW846 8270C
SW846 8270C
SW846 8270C
SW846 8270C
---· Bromide <0.50 ug/L SM4500-Br-B
Chloride 40 mg/L SM4500CL-C
Dissolved Organic Carbon 10 mg/L EPA 415.1
Fluoride 0.04 mg/L EPA 340.2
Nitrate 1.81 mg/L-N SM4500N03D
Nitrite <0.01 mg/L-N SM4500N02B
Sulfate 21 mg/L EPA 375.4
Total Dissolved Solids 100 mg!L EPA 160.1.
Surrogate Recovery Method
1,4,6-Tribromophenol 102 SW846 8270C
p-Terphenyl-dl4 65 SW846 8270C
Dibrumofluoromethane 94 SW846 82608
Toluene-dB 98 SW846 82608 • Page 6 of 13

.-.--/ SPECTRA Laboratories 2221 Ross Way • Tacoma, WA 98421 • (253) 272-4850
04/08/2002 P.O.#: 1-186164-01090
Client ID: SC7MW5 Sample Matrix: Water
Skillings-Connolly, Inc. Date Sampled: 03/07/2002 PO Box 5080 Date Received: 03/08/2002 Lacey, W A 98509 Spectra Project: 2002030066 Attn: Kenney Lilliquist Spectra Number: 7
Analyte Result Units Method ·Analyte Result Units Method Arsenic <5 ug/L EPA 206.2
Boron 100 ug/L EPA 200.7
Cadmium <3 ug/L EPA200.7
Chromium <7 ug/L EPA 200.7
Copper <6 ug/L EPA 200.7
Iron 270 ug/L EPA 200.7
Lead <I ug/L EPA 239.2
xese 5 ug/L EPA200.7
<0.5 ug/L EPA 245.1
Nickel < 15 ug/L EPA 200.7
Silver <7 ug/L EPA 200.7
Zinc 47 ug/L EPA 200.7
Bromodichloromethane <I ug/L SW846 8260B
Bromoform <I ug/L SW846 8260B
Caffeine <10 ug/L EPA 625
Cblorodibromomethane <I ug/L SW846 8260B
Chloroform <I ug/L SW846 8260B
N-Nitrosodimethylarnine <10 ug/L EPA 625
TKN <1.0 mg/L SM 4500-N-B
Ammonia 0.56 mg/L-N EPA 350.3
Anionic Surfactants in <0.05 mg/L
BOD 5 mg/L
Surrogate Recovery
2-Fiuorophenol 194
Phenol-d6 144
Nitrobenzene-d5 69
1-Fiuorobiphenyl 70
• SPECTRA LABORATORIES
Steve Hibbs, Laboratory Manager al4/sgh
SM5540C
SM 5210
Mothod
SW846 8270C
SWS46 8270C
SW846 8270C
SW846 8270C
--Bromide <0.50 ug/L SM4500-Br-B
Chloride 5.0 mg/L SM4500CL-C
Dissolved Organic Carbon 10 mg/L EPA 415.1
Fluoride 0.06 mg/L EPA 340.2
Nitrate 4.88 mg/L-N SM4500N03D
Nitrite <0.01 mg/L-N SM4500N02B
Sulfate 8 mg/L EPA 375.4
Total Dissolved Solids 140 mg/L EPA 160.1
Surrogate Recovery Method
2,4,6-Tribromopbenol 90 SW846 8270C
p-Terphenyl-d14 62 SW846 8270C
Dibromofluoromethane 93 SW846 82608
Toluene-dB 100 SW846 82608
Page 7 of 13

SPECTRA Laboratories 2221 Ross Way •
04/08/2002
Skillings-Connolly, Inc. PO Box 5080 Lacey, WA 98509 Attn: Kenney Li11iquist
Tacoma, W A 98421 • (253) 272-4850 P.O.#: 1-186164-01090
Client ID: SC81S Sample Matrix: Water Date Sampled: 03/07/2002 Date Received: 03/08/2002 Spectra Project: 2002030066 Spectra Number: 8
•
Analyte Result ·Units '· Method Ana1yte Result Units Method Arsenic <5 ug!L EPA 206.2
Boron 450 ug!L EPA 200.7
Cadmium <3 ug!L EPA 200.7
Chromium <7 ug!L EPA 200.7
Copper 8 ug!L EPA 200.7
Iron 600 ug!L EPA 200.7
Lead <1 ug!L EPA 239.2
Manganese 28 ug!L EPA 200.7
Mercury <0.5 ug!L EPA 245.1
Nickel < 15 ug!L EPA 200.7
Silver 10 ug!L EPA 200.7
Zinc 50 ug!L EPA 200.7
Bromodichloromethane ug!L SW846 8260B
Bromoform <1 ug!L SW846 8260B
Caffeine <10 ug!L EPA625
Chlorodibromomethane <1 ug!L SW846 8260B
Chloroform 6 ug!L SW846 8260B
N-Nitrosodimethylamine <10 ug!L EPA 625
TKN 7.7 mg!L SM 4500-N-B
Ammonia 5.30 mg!L-N EPA 350.3
Anionic Surfactants in 0.30 mg!L SM5540C
BOD <2 mg/L SM 5210
Surrogate Recovery Method
2-F\uoropbeno\ 249 SW846 8270C
PhenoJ-d6 187 SW846 8270C
Nitrobenzene-d5 94 SW846 8270C
2-Fiuorobipheny\ 84 SW846 8270C
SPECTRA LABORATORIES
Steve a14/sgh
Manager
Bromide <0.50 ug!L SM4500-Br-B
Chloride 57 mg!L SM4500CL-C
Dissolved Organic Carbon 13 mg!L EPA 415.1
Fluoride 0.07 mg!L EPA 340.2
Nitrate 7.96 mg!L-N SM4500N03D
Nitrite 0.02 mg!L-N SM4500N02B
Sulfate 29 mg!L EPA 375.4
Total Dissolved Solids 340 mg!L EPA 160.1 •
Surrogate Recovery Method
2,4,6-Tribromophenol 138 SW846 8270C
p-T erphenyl-d 14 77 SW846 8270C
Dibromofluoromethane 95 SW846 82608
Toluene-dB I OJ SW846 82608 • Page 8 of13

.__.; SPECTRA Laboratories 2221 Ross WaY • Tacoma, W A 98421 • (253) 272-4850
04/08/2002
Skillings-Connolly, Inc. PO Box 5080 Lacey, WA 98509 Attn: Kenney Lilliquist
Analyte Result Units Method Arsenic <5 ug/L EPA 206.2
Boron 430 ug/L EPA 200.7
Cadmium <3 ug/L EPA 200.7
Chromium <7 ug/L EPA 200.7
Copper 10 ug/L EPA 200.7
Iron 160 ug/L EPA 200.7
Lead <I ug/L EPA 239.2
•:ese 29 ug/L EPA 200.7
<0.5 ug/L EPA 245.1
Nickel < 15 ug/L EPA 200.7
Silver <7 ug/L EPA 200.7
Zinc 43 ug/L EPA 200.7
Bromodich1oromethane ug/L SW846 8260B
Bromoform <1 ug/L SW846 8260B
Caffeine <10 ug/L EPA 625
Chlorodibromomethane <I ug/L SW846 8260B
Chloroform 4 ug/L SW846 8260B
N-Nitrosodimethylarnine <10 ug/L EPA 625
TKN 5.9 mg/L SM 4500-N-B
Ammonia 5.40 mg/L-N EPA350.3
Anionic Surfactants in 0.28 mg/L
BOD
•
3 mg/L
Surrogau: Recovery
2-Fiuorophenol 229
Phenol-d6 177
Nitrobenzene.&i 86
2-Fiuorobiphenyl 84
SPECTRA LABORATORIES
Steve Hibbs, Labor<ltory Manager a 14/sgh
SM5540C
SM 5210
Method
SW846 8270C
SW846 8270C
SW846 8170C
SW846 8270C
P.O.#: 1-186164-01090
Client ID: SC9 CS1 Sample Matrix: Water
Date Sampled: 03/08/2002 Date Received: 03/08/2002 Spectra Project: 2002030066 Spectra Number: 9
· ·• Analyte· Result Units Bromide <0.50 ug/L
Chloride 57 mg/L
Dissolved Organic Carbon 13 mg!L
Fluoride 0.07 mg!L
Nitrate 8.03 mg/L-N
Nitrite O.ol mg!L-N
Sulfate 33 mg/L
Total Dissolved Solids 220 mg/L
Surrogate Recovery Method
2,4,6-Tribromophenol 127 SW846 8270C
p-Terpbenyl-dl4 78 SW846 8270C
Dibromofluoromethane 86 SW846 82608
Toluene-dB 103 SW846 82608
Page 9 of 13
Method SM4500-Br-B
SM4500CL-C
EPA415.1
EPA 340.2
SM4500N03D
SM4500N02B
EPA 375.4
EPA 160.1

SPECTRA Laboratories 2221 Ross Wav •
04/08/2002
Skillings-Connolly, Inc. PO Box 5080 Lacey, W A 98509 Attn: Kenney Lilliquist
Analyte Result ---
Arsenic <5
Boron 400
Cadmium <3
Chromium <7
Copper 11
Iron 140
Lead <I
Manganese 29
Mercury <0.5
Nickel < 15
Silver 8
Zinc 44
Bromodichloromethane <I
Bromoform <I
Caffeine <10
Chlorodibromomethane <I
Chloroform
N-Nitrosodimethylamine <10
TKN 1.6
Ammonia 0.91
Anionic Surfactants in 0.28
BOD 9
Units ug/L
ug/L
ug/L
ug/L
ug/L
ug/L
ug/L
ug/L
ug/L
ug/L
ug/L
ug/L
ug/L
ug/L
ug/L
ug/L
ug/L
ug/L
mg/L
mg/L-N
mg/L
mg/L
Surrogate Recovery
Tacoma, W A 98421 • (253) 272-4850
·Method EPA 206.2
EPA 200.7
EPA 200.7
EPA200.7
EPA200.7
EPA200.7
EPA 239.2
EPA 200.7
EPA 245.1
EPA200.7
EPA 200.7
EPA 200.7
SW846 8260B
SW846 8260B
EPA625
SW846 8260B
SW846 8260B
EPA 625
SM 4500-N-B
EPA 350.3
SM5540C
SM 5210
Method
P.O.#: 1-186164-01090
Client ID: Sample Matrix:
Date Sampled: Date Received: Spectra Project:
SCIO CS2 Water 03/08/2002 03/08/2002 2002030066
Spectra Number: I 0
Analyte Result Units Bromide <0.50 ug/L
Chloride 55 mg/L
Dissolved Organic Carbon 12 mg/L
Fluoride 0.07 mg/L
Nitrate 5.46 mg!L-N
Nitrite 0.03 mg/L-N
Sulfate 30 mg/L
Total Dissolved Solids 340 mg/L
Surrogate Recovery Method
•
Method SM4500-Br-B
SM4500CL-C
EPA 415.1
EPA 340.2
SM4500N03D
SM4500N02B
EPA 375.4
EPA 160.1.
2-Fiuorophenol 176 SW846 8270C 2,4,6-Tribromophenol 114 SW846 8270C
Phenol-d6 144
Nitrobenzene-d5 67
2-Fiuorobiphenyl 68
SPECTRA LABORATORIES
Steve Hibbs, Laboratory Manager a14/sgh
SW846 8270C
SW846 8270C
SW846 8270C
p-Terphenyl-d14 70 SW846 8270C
Dibromofluoromethane 86 SW84682608
Toluene-dB 102 SW846 82608 • Page 10 of 13

• SPECTRA Laboratories 2221 Ross Way • Tacoma, WA 98421 • (253) 272-4850
04/08/2002
Skillings-Connolly, Inc. PO Box 5080 Lacey, W A 98509 Attn: Kenney Lilliquist
Analyte Result ·Units Method ---
Arsenic <5 ug!L EPA 206.2
Boron 450 ug!L EPA200.7
Cadmium <3 ug!L EPA200.7
Chromium 8 ug!L EPA200.7
Copper 10 ug!L EPA200.7
Iron 100 ug!L EPA200.7
Lead <1 ug!L EPA239.2
-~ese 4 ug!L EPA200.7
<0.5 ug!L EPA 245.1
Nickel < 15 ug!L EPA 200.7
Silver <7 ug!L EPA 200.7
Zinc 28 ug!L EPA200.7
Bromodichloromethane <I ug!L SW846 8260B
Bromoform <I ug!L SW846 8260B
Caffeine <10 ug!L EPA 625
Chlorodibromomethane <I ug!L SW846 8260B
Chloroform <I ug!L SW846 8260B
N-Nitrosodimethylamine <10 ug!L EPA 625
TKN <1.0 mg/L SM4500-N-B
Ammonia 0.24 mg!L-N EPA 350.3
Anionic Surfactants in 0.27 mg/L
BOD 3 mg/L
Surrogate Recovery
2-Fiuorophenol 216
Pheno1-d6 172
Nitrobenzene..<JS 79
79 2-Fiuorobiphenyl
• SPECTRA LABORATORIES
Steve Hibbs, Labodtory Manager al4/sgh
SM5540C
SM 5210
Method
SW846 8270C
SW846 8270C
SW846 8270C
SW846 8270C
P.O.#: 1-186164-01090
Client ID: SCJJ CS3 Sample Matrix: Water
Date Sampled: 03/08/2002 Date Received: 03/08/2002 Spectra Project: 2002030066 Spectra Number: 11
Analyte Result Units Bromide <0.50 ug!L
Chloride 55 mg!L
Dissolved Organic Carbon 10 mg!L
Fluoride 0.19 mg!L
Nitrate 5.55 mg!L-N
Nitrite <0.01 mg!L-N
Sulfate 27 mg!L
Total Dissolved Solids 320 mg!L
Surrogate Reetn·ery Method
2,4,6-Tribromophenol 124 SW846 8270C
p--Terphenyl-dl4 75 SW846 8270C
Oibromofluoromethane 88 SW846 82608
Toluene-dB 100 SW846 82608
Page 11 of13
Method SM4500-Br-B
SM4500CL-C
EPA415.1
EPA 340.2
SM4500N03D
SM4500N02B
EPA 375.4
EPA 160.1

SPECTRA Laboratories 2221 Ross Way
04/08/2002
Skillings-Connolly, Inc.
PO Box 5080 Lacey, W A 98509
Attn: Kenney Lilliquist
• Tacoma, WA 98421 • (253) 272-4850 P.O.#: 1-186164-01090
Client ID:
Sample Matrix:
Date Sampled:
Date Received:
Spectra Project:
SC12 CS4
Water
03/08/2002
03/08/2002
2002030066
Spectra Number: 12
•
· ·Alialyte Result Units Method Analyte Result Units' -Method
Arsenic <5 ug/L EPA 206.2
Boron 400 ug/L EPA200.7
Cadmium <3 ug/L EPA200.7
Chromium <7 ug/L EPA200.7
Copper <6 ug/L EPA 200.7
Iron 130 ug/L EPA200.7
Lead <I ug/L EPA239.2
Manganese 15 ug/L EPA200.7
Mercury <0.5 ug/L EPA 245.1
Nickel < 15 ug/L EPA200.7
Silver <7 ug/L EPA200.7
Zinc 25 ug/L EPA200.7
Bromodichloromethane <I ug/L SW846 8260B
Bromoform <I ug/L SW846 8260B
Caffeine <10 ug/L EPA 625
Chlorodibromomethane <I ug/L SW846 8260B
Chloroform <I ug/L SW846 8260B
N-Nitrosodimethylamine <10 ug/L EPA 625
TKN <1.0 mg/L SM 4500-N-B
Ammonia 0.21 mg!L-N EPA 350.3
Anionic Surfactants in 0.18 mg/L
BOD 10 mg/L
Surrogate Recovery
2-Fluorophenol 256
Phenol-d6 196
Nitrobenzene-d5 94
2-Fiuorobiphenyl 82
SPECTRA LABORATORIES
Steve Hibbs, Laboratory Manager al4/sgh
SM5540C
SM 5210
Method
SW846 8270C
SWS468270C
SWS468270C
SWB46 8270C
Bromide <0.50 ug/L SM4500-Br-B
Chloride 53 mg/L SM4500CL-C
Dissolved Organic Carbon II mg/L EPA 415.1
Fluoride 0.05 mg/L EPA 340.2
Nitrate 2.99 mg/L-N SM4500N03D
Nitrite 0.01 mg/L-N SM4500N02B
Sulfate 27 mg/L EPA 375.4
Total Dissolved Solids 320 mg/L EPA 160.1.
Surrogate Recovery Mo>hod
2,4,6-Tribromophenol 139 SW846 8270C
p-T crphenyl-d 14 77 SW846 8270C
Dibromofluoromethane 93 SW846 82608
Toluene-dB 101 SW846 82608 • Page 12of13

._._/ SPECTRA Laboratories 2221 Ross Way • Tacoma, W A 98421 • (253) 272-4850
04/08/2002
Skillings-Connolly, Inc. PO Box 5080 Lacey, WA 98509 Attn: Kenney Lilliquist
Analyte Result Units Method Arsenic <5 ug!L EPA206.2
Boron 520 ug!L EPA200.7
Cadmium <3 ug!L EPA200.7
Chromium <7 ug!L EPA200.7
Copper l3 ug!L EPA 200.7
Iron 47 ug!L EPA 200.7
Lead < l ug!L EPA 239.2
-~ese 3 ug!L EPA200.7
<0.5 ug!L EPA 245.1
Nickel < 15 ug!L EPA200.7
Silver <7 ug!L EPA 200.7
Zinc 19 ug!L EPA 200.7
Bromodichloromethane <l ug!L SW846 8260B
Bromoform <l ug!L SW846 8260B
Caffeine <10 ug!L EPA625
Chlorodibromomethane <l ug!L SW846 8260B
Chloroform <l ug/L SW846 8260B
N-Nitrosodimethylamine <10 ug/L EPA625
TKN <l.O mg!L SM 4500-N-B
Ammonia 0.20 mg!L-N EPA 350.3
Anionic Surfactants in 0.16 mg/L SM5540C
BOD 3 mg/L SM 5210
Surrogate Recovery Melhod
2-Fiuorophenol 228 SW846 8270C
P.O.#: 1-186164-01090
Client ID: Sample Matrix:
Date Sampled: Date Received: Spectra Project:
SC13 FD Water 03/08/2002 03/08/2002 2002030066
Spectra Number: 13
Analyte Result Units Bromide <0.50 ug!L
Chloride 55 mg!L
Dissolved Organic Carbon 10 mg!L
Fluoride 0.05 mg!L
Nitrate 5.53 mg/L-N
Nitrite <0.01 mg/L-N
Sulfate 27 mg/L
Total Dissolved Solids 320 mg/L
Surrogate Recovery Method
2,4,6-Tribromophenol 127 SW846 8270C
Method SM4500-Br-B
SM4500CL-C
EPA 415.1
EPA 340.2
SM4500N03D
SM4500N02B
EPA 375.4
EPA 160.1
Phenol-d6 173 SW846 8270C p-Terphenyl-d14 73 SW846 8270C
Nitrobenzene-d5 83
2-Fluorobiphenyl 77
• SPECTRA LABORATORIES
Steve Hibbs, Laboratory Manager al4/sgh
SW846 8270C
SW846 8270C
Dibromofluoromethane 92 SW846 82608
Toluene-dB 102 SW846 82608
Page 13 of 13

SPECTRA Laboratories • 2221 Ross Way • Tacoma, WA 98421 • (253) 272-4850
03/29/2002
Skillings-Connolly, Inc. PO Box 5080 Lacey, WA 98509 Attn: Kenney Lilliquist
Spectra# Client ID
SCI CW
SCI CW
2 SC2MW6
2 SC2MW6
3 SC3 MWI
3 SC3 MWI
4 SC4MW2
4 SC4MW2
5 SC5 MW3
5 SC5 MW3
6 SC6MW4
6 SC6MW4
7 SC7MW5
7 SC7MW5
8 SC8IS
8 SC8IS
9 SC9 CSl
9 SC9 CSI
10 SCIO CS2
10 SCIO CS2
11 SCI! CS3
II SCII CS3
12 SC12 CS4
Analyte
Fecal Coliform
Fecal Strep.
Fecal Coliform
Fecal Strep.
Fecal Coliform
Fecal Strep.
Fecal Coliform
Fecal Strep.
Fecal Coliform
Fecal Strep.
Fecal Coliform
Fecal Strep.
Fecal Coliform
Fecal Strep.
Fecal Coliform
Fecal Strep.
Fecal Coliform
Fecal Strep.
Fecal Coliform
Fecal Strep.
Fecal Coliform
Fecal Strep.
Fecal Coliform
Project: Sample Matrix:
Date Sampled: Date Received: Spectra Project:
Result ---
<2
<2
<2
<2
<2
<2
<2
<2
<2
<2
<2
<2
<2
6
<2
4
<2
<2
2
8
<2
<2
<2
Y elm Groundwater Water 03/20/2002 03/20/2002 2002030185
Units Method
per lOOmis Membrane Filtration
per lOOmis Membrane Filtration
per lOOmis Membrane Filtration
per lOOmis Membrane Filtration
per lOOmis Membrane Filtration
per lOOmis Membrane Filtrati~·
per lOOmis Membrane Filtratio
per lOOmis Membrane Filtration
per lOOmis Membrane Filtration
per lOOmis Membrane Filtration
per lOOmis Membrane Filtration
per lOOmis Membrane Filtration
per lOOmis Membrane Filtration
per lOOmis Membrane Filtration
per lOOmis Membrane Filtration
per lOOmis Membrane Filtration
per lOOmis Membrane Filtration
per lOOmis Membrane Filtration
per lOOmis Membrane Filtration
per 1 OOmls Membrane Filtration
per I OOmls Membrane Filtration
per lOOmis Membrane Filtration
per lOOmis Membrane Filtration
Fecal Coliform and Fecal Streptococcus were subcontracted to Water Management Laboratories, Inc.
SPECTRA LABORATORIES • Steve ~bratory Manager a7/mlh

.__./ SPECTRA Laboratories 2221 Ross Way • Tacoma, WA 98421 • (253) 272-4850
,_
03/29/2002
Skillings-Connolly, Inc. PO Box 5080 Lacey, W A 98509 Attn: Kenney Lilliquist
--:;.;: >
Spectra# Client lD
12 SC12 CS4
13 SC13 FD
13 SC13 FD
14 Split Sample (SC7 MW5) Spectra #7
14 Split Sample (SC7 MW5) Spectra #7 •
Analyte
Fecal Strep.
Fecal Coliform
Fecal Strep.
Fecal Coliform
Fecal Strep.
Project: Sample Matrix:
Date Sampled: Date Received: Spectra Project:
Result
6
2
<2
<2
10
Y elm Groundwater Water 03/20/2002
03/20/2002 2002030185
Units Method
per lOOmis Membrane Filtration
per lOOmis Membrane Filtration
per lOOmis Membrane Filtration
per lOOmis Membrane Filtration
per lOOmis Membrane Filtration
Fecal Colifonn and Fecal Streptococcus were subcontracted to Water Management Laboratories, Inc .
• SPECTRA LABORATORIES
Steve Hibbs, LabOratory Manager a7/mlh

SPECTRA Laboratories • 2221 Ross Way • Tacoma, WA 98421 • (253) 272-4850
07110/2002
Skillings-Connolly, Inc. PO Box 5080 Lacey, W A 98509 Attn: Patrick Skillings
Analyte Result Units Method Arsenic <5 ug/L EPA 206.2
Boron 22 ug/L EPA 200.7
Cadmium <3 ug/L EPA 200.7
Chromium <7 ug/L EPA 200.7
Copper <6 ug/L EPA 200.7
Iron < 10 ug/L EPA200.7
Lead <I ug/L EPA239.2
Manganese <2 ug/L EPA200.7
Mercury <0.5 ug/L EPA 245.1
Nickel < 15 ug/L EPA 200.7
Silver <7 ug/L EPA 200.7
Zinc 10 ug/L EPA 200.7
Bromodichloromethane <I ug/L SW846 8260B
Bromoform <I ug/L SW846 8260B
Caffeine <10 ug/L EPA 625
Chlorodibromomethane <I ug/L SW846 8260B
Chloroform <I ug/L SW846 8260B
N-Nitrosodimethylamine <10 ug/L EPA 625
TKN < 1.0 mg/L SM 4500-N-B
Ammonia 0.11 mg/L-N EPA 350.3
Anionic Surfactants in <0.05 mg/L
BOD <2 mg/L
Surrogate Recovery
Nitrobenzene-d5 77
2-Fluorobipbenyl 90
p-Terphenyl-dl4 102
Dibromofluoromethane 101
SPECTRA LABORATORIES
Steve Hibbs, Laboratory Manager al4/scj
SM5540C
SM 5210
Method
SW846 8270C
SW846 8270C
SWS46 8270C
SW846 82608
Project: Client ID: Sample Matrix:
Date Sampled: Date Received:
Y elm Groundwater Monitoring SCI CW Water
06112/2002
06112/2002 Spectra Project: 2002060 !56 Spectra Number: I
Analyte Result Units .. Method Bromide <0.1 mg/L SM4500-Br-B
Chloride 5.2 mg/L SM4500CL-C
Dissolved Organic Carbon 2 mg/L EPA 415.1
Fluoride 0.01 mg/L EPA 340.2
Nitrate 2.4 mg/L-N SM4500N03D
Nitrite <0.01 mg/L-N SM4500N02B
Sulfate <I mg/L EPA 375.4
Total Dissolved Solids 64 mg/L EPA 160.1.
Surrogate Recovery Method
Toluene-dB 104 SW846 82608
4-Bromofluorobenzene 101 SW846 82608
• Page 1 of 13

.___, SPECTRA Laboratories 2221 Ross Way • Tacoma, WA 98421 • (253) 272-4850
07110/2002
Skillings-Connolly, Inc. PO Box 5080 Lacey, W A 98509 Attn: Patrick Skillings
Analyte Result --
Arsenic <5
Boron 13
Cadmium <3
Chromium <7
Copper <6
Iron 64
Lead <1
x,ese 40
<0.5
Nickel < 15
Silver <7
Zinc 8
Bromodichloromethane <1
Bromoform <1
Caffeine <10
Chlorodibromomethane <1
Chloroform <1
N-Nitrosodimethylamine <10
TKN < 1.0
Units Method ug/L EPA 206.2
ug/L EPA200.7
ug/L EPA 200.7
ug!L EPA 200.7
ug/L EPA 200.7
ug/L EPA200.7
ug!L EPA239.2
ug/L EPA200.7
ug/L EPA245.1
ug/L EPA200.7
ug/L EPA200.7
ug/L EPA 200.7
ug/L SW846 8260B
ug/L SW846 8260B
ug/L EPA 625
ug/L SW846 8260B
ug/L SW846 8260B
ug/L EPA625
mg!L SM 4500-N-B
Ammonia 0.11 mg/L-N EPA 350.3
Anionic Surfactants in <0.05 mg/L
BOD
•
<2 mg!L
Surrogate Recovery
Nitrobenzene-d5 68
2-Fluorobiphcnyl 80
p-Terphenyl-dl4 92
Dibromofluoromethane 106
SPECTRA LABORATORIES
Steve ~a63l'atory Manager al4/scj
SM5540C
SM 5210
Method
SW846 8270C
SW846 8270C
SW846 8270C
SW846 81608
Project: Client ID:
Y elm Groundwater Monitoring SC2MW6
Sample Matrix: Water
Date Sampled: 06/12/2002 Date Received: Spectra Project:
06112/2002 2002060156
Spectra Number: 2
Analyte Result Units Bromide < 0.1 mg/L
Chloride 8.2 mg!L
Dissolved Organic Carbon <2 mg!L
Fluoride 0.04 mg!L
Nitrate 5.5 mg/L-N
Nitrite <0.01 mg!L-N
Sulfate < 1 mg!L
Total Dissolved Solids 96 mg!L
Surrogate Recovery Method
Toluene-dB 104 SWS46 82608
4-Bromofluorobenzene 99 SW846 82608
Page 2 of 13
Method SM4500-Br-B
SM4500CL-C
EPA 415.1
EPA 340.2
SM4500N03D
SM4500N02B
EPA 375.4
EPA 160.1

SPECTRA Laboratories • 2221 Ross Way • Tacoma, WA 98421 • (253) 272-4850
07110/2002
Skillings-Connolly, Inc. PO Box 5080 Lacey, WA 98509 Attn: Patrick Skillings
Analyte : Result Units Method
Arsenic
Boron
Cadmium
Chromium
Copper
Iron
Lead
Manganese
Mercury
Nickel
Silver
Zinc
Bromodichloromethane
Bromoform
Caffeine
Chlorodibromomethane
Chloroform
N-Nitrosodimethylamine
TKN
Ammonia Anionic Surfactants in
BOD
Surrogate
Nitrobenzene-d5
2-Fluorobiphenyl
p-Terphenyl-d\4
Dibromofluoromethane
<5
19
<3
8
<6
280
<I
20
<0.5
< 15
<7
9
<1
<1
<10
<1
<1
<10
< 1.0
0.10
<0.05
<2
ug/L EPA 206.2
ug/L EPA200.7
ug/L EPA200.7
ug/L EPA 200.7
ug/L EPA 200.7
ug/L EPA 200.7
ug/L EPA 239.2
ug/L EPA 200.7
ug/L EPA 245.1
ug/L EPA 200.7
ug/L EPA 200.7
ug/L EPA 200.7
ug/L SW846 8260B
ug/L SW846 8260B
ug/L EPA 625
ug/L SW846 8260B
ug/L SW846 8260B
ug/L EPA 625
mg!L SM 4500-N-B
mg!L-N EPA 350.3
mg!L SM5540C
mg!L SM 5210
Recovery Method
55 SW846 8270C
69 SW846 8270C
79
106
SW846 8270C
SW846 82608
SPECTRA LAB ORA TORIES
Steve Hibbi,LlibOTlltory Manager a14/scj
Project: Client ID: Sample Matrix:
Date Sampled: Date Received: Spectra Project:
Spectra Number:
Analyte Bromide
Chloride
Dissolved Organic Carbon
Fluoride
Nitrate
Nitrite
Sulfate
Total Dissolved Solids
Surrogate
Toluene-dB
4-Bromofluorobenzene
Y elm Groundwater Monitoring SC3 MW1 Water
06112/2002
06112/2002 2002060156 3
Result Units Method 0.1 mg!L SM4500-Br-B
6.7 mg!L SM4500CL-C
<2 mg!L EPA 415.1
0.06 mg!L EPA 340.2
3.1 mg/L-N SM4500N03D
<0.01 mg/L-N SM4500N02B
<I mg/L EPA 375.4
73 mg/L EPA 160.1.
Recovery Method
I 05 SW846 82608
I 02 SW846 82608
• Page 3 of 13

• SPECTRA Laboratories 2221 Ross Way • Tacoma, WA 98421 • (253) 272-4850
07110/2002
Skillings-Connolly, Inc. PO Box 5080 Lacey, W A 98509 Attn: Patrick Skillings
Analyte Result Units Method Arsenic ---;:-s ug!L EPA 206.2
Boron 16 ug!L EPA 200.7
Cadmium <3 ug!L EPA 200.7
Chromium <7 ug!L EPA200.7
Copper <6 ug!L EPA200.7
Iron 130 ug!L EPA200.7
Lead < 1 ug!L EPA 239.2
~ese 2 ug!L EPA200.7
e <0.5 ug!L EPA 245.1
Nickel < 15 ug!L EPA 200.7
Silver <7 ug!L EPA 200.7
Zinc <6 ug!L EPA 200.7
Bromodichloromethane <1 ug!L SW846 8260B
Bromoform <1 ug!L SW846 8260B
Caffeine <10 ug!L EPA625
Chlorodibromomethane <1 ug!L SW846 8260B
Chloroform <l ug!L SW846 8260B
N-Nitrosodimethylarnine <10 ug!L EPA 625
TKN < 1.0 mg!L SM 4500-N-B
Ammonia 0.08 mg!L-N EPA 350.3
Anionic Surfactants in <0.05 mg!L
BOD
•
<2 mg!L
Surrogate Recovery
Nitrobenzenc:-dS 64
2-Fluorobiphenyl 74
p-T erphenyl-d 14 85
Dibromofluoromethane lOS
SPECTRA LABORATORIES
Steve Hibbs, Laboratory Manager al4/scj
SM5540C
SM 5210
Method
SW846 8270C
SW846 8270C
SW846 8270C
SW846 82608
Project: Y elm Groundwater Monitoring Client ID: SC4MW2 Sample Matrix: Water
Date Sampled: 06/12/2002 Date Received: 06/12/2002 Spectra Project: 2002060156 Spectra Number: 4
Analyte Result Units Method Bromide < 0.1 mg!L SM4500-Br-B
Chloride 6.2 mg!L SM4500CL-C
Dissolved Organic Carbon <2 mg!L EPA 415.1
Fluoride 0.04 mg!L EPA340.2
Nitrate 3.2 mg!L-N SM4500N03D
Nitrite <0.01 mg!L-N SM4500N02B
Sulfate < 1 mg!L EPA375.4
Total Dissolved Solids 62 mg!L EPA 160.1
Surrogate Recovery Method
Toluene-dB 105 SW846 82608
4-BromQfluorobenzene 100 SW846 82608
Page 4 of 13

SPECTRA Laboratories • 2221 Ross Way • Tacoma, WA 98421 • (253) 272-4850
07/10/2002
Skillings-Connolly, Inc. PO Box 5080 Lacey, W A 98509 Attn: Patrick Skillings
Analyte · Result Units Method --Arsenic <5 ug!L EPA 206.2
Boron 10 ug!L EPA 200.7
Cadmium <3 ug!L EPA200.7
Chromium <7 ug!L EPA200.7
Copper <6 ug!L EPA 200.7
Iron 280 ug!L EPA200.7
Lead <1 ug!L EPA239.2
Manganese 7 ug!L EPA 200.7
Mercury <0.5 ug!L EPA 245.1
Nickel < 15 ug!L EPA 200.7
Silver <7 ug!L EPA 200.7
Zinc <6 ug!L EPA200.7
Bromodichloromethane <1 ug!L SW846 8260B
Bromoform <1 ug!L SW846 8260B
Caffeine <10 ug!L EPA 625
Chlorodibromomethane <1 ug!L SW846 8260B
Chloroform <1 ug!L SW846 8260B
N-N itrosodimethy !amine <10 ug!L EPA 625
TKN < 1.0 mg!L SM4500-N-B
Ammonia 0.08 mg!L-N EPA 350.3
Anionic Surfactants in <0.05 mg!L
BOD <2 mg!L
Surrogate Recovery
Nitrobcnzene-d5 52
2-Fiuorobipheny! 67
p-Terphenyl-d14 82
Dibromofluoromethane 101
SPECTRA LABORATORIES
Steve ~bonhory Manager a14/scj
SM5540C
SM 5210
Method
SW846 8270C
SW846 8270C
SW846 8270C
SW846 82608
Project: Client ID:
Y elm Groundwater Monitoring SC5 MW3
Sample Matrix: Water Date Sampled: 06/12/2002 Date Received: 06112/2002 Spectra Project: 2002060156 Spectra Number: 5
Ana!yte Result Units Method Bromide
Chloride
Dissolved Organic Carbon
Fluoride
Nitrate
Nitrite
Sulfate
Total Dissolved Solids
Surrogate
Toluene-d8
4-Bromofluorobenzene
0.2
40
<2
0.04
5.4
<0.01
14
180
Recovery
103
101
mg!L
mg!L
mg!L
mg!L
mg!L-N
mg!L-N
mg!L
mg!L
Method
SW846 82608
SW846 82608
Page 5 of 13
SM4500-Br-B
SM4500CL-C
EPA415.1
EPA 340.2
SM4500N03D
SM4500N02B
EPA 375.4
EPA 160.1.
•

SPECTRA Laboratories 2221 Ross Way • Tacoma, WA 98421 • (253) 272-4850
07/10/2002
Skillings-Connolly, Inc. POBox 5080 Lacey, W A 98509 Attn: Patrick Skillings
Analyte Result Arsenic <5
Boron 180
Cadmium <3
Chromium <7
Copper <6
Iron 110
Lead < 1
-~ese 2
<0.5
Nickel < 15
Silver <7
Zinc <6
Bromodichloromethane <I
Bromoform <I
Caffeine <10
Chlorodibromomethane <1
Chloroform <1
N-Nitrosodimethylarnine <10
TKN < 1.0
Units Method ug!L EPA 206.2
ug!L EPA 200.7
ug!L EPA 200.7
ug!L EPA 200.7
ug!L EPA200.7
ug/L EPA 200.7
ug/L EPA239.2
ug!L EPA 200.7
ug!L EPA 245.1
ug!L EPA 200.7
ug/L EPA 200.7
ug/L EPA 200.7
ug/L SW846 8260B
ug/L SW846 8260B
ug!L EPA625
ug!L SW846 8260B
ug!L SW846 8260B
ug!L EPA 625
mg!L . SM 4500-N-B
Ammonia 0.08 mg!L-N EPA 350.3
Anionic Surfactants in <0.05 mg!L
BOD
•
<2 mg!L
Surrogate Recovery
Nitrobenzene-d5 "' 2-Fluorobiphenyl 68
p-T erphenyl-d 14 79
Dibromo(Juoromethane 106
SPECTRA LABORATORIES
Steve ~orafury Manager a14/scj
SM5540C
SM 5210
Method
SW846 8270C
SW846 8270C
SW846 8270C
SWS46 82608
Project: Client ID:
Y elm Groundwater Monitoring SC6MW4
Sample Matrix: Water Date Sampled: 06/12/2002 Date Received: 06/12/2002 Spectra Project: 2002060156 Spectra Number: 6
Analyte Result Units Bromide 0.1 mg!L
Chloride 49 mg!L
Dissolved Organic Carbon 2 mg!L
Fluoride O.o3 mg!L
Nitrate 2.2 mg/L-N
Nitrite <0.01 mg/L-N
Sulfate 12 mg!L
Total Dissolved Solids 170 mg!L
Surrogate Recovery Method
Toluene-dB 105 SW846 82608
4-Bromofluorobenzene 100 SW846 82608
Page 6of13
Method SM4500-Br-B
SM4500CL-C
EPA 415.1
EPA 340.2
SM4500N03D
SM4500N02B
EPA 375.4
EPA 160.1

SPECTRA Laboratories • 2221 Ross Way • Tacoma, WA 98421 • (253)272-4850
07/10/2002
Skillings-Connolly, Inc. PO Box 5080 Lacey, W A 98509 Attn: Patrick Skillings
Analyte Result ·Units Method Arsenic <5 ug/L EPA 206.2
Boron 23 ug/L EPA200.7
Cadmium <3 ug/L EPA 200.7
Chromium <7 ug/L EPA 200.7
Copper <6 ug/L EPA200.7
Iron 99 ug/L EPA200.7
Lead <I ug/L EPA 239.2
Manganese <2 ug/L EPA 200.7
Mercury <0.5 ug/L EPA 245.1
Nickel <7 ug/L EPA 200.7
Silver <7 ug/L EPA 200.7
Zinc <6 ug/L EPA 200.7
Bromodichloromethane <I ug/L SW846 8260B
Bromoform <I ug/L SW846 8260B
Caffeine <10 ug/L EPA 625
Chlorodibromomethane <I ug/L SW846 8260B
Chloroform <I ug/L SW846 8260B
N-Nitrosodimethylamine <10 ug/L EPA 625
TKN < 1.0 mg/L SM 4500-N-B
Ammonia 0.08 mg/L-N EPA 350.3
Anionic Surfactants in <0.05 mg/L
BOD <2 mg/L
Surrogate Recovery
Nitrobenzene-d5 53
2-Fluorobiphenyl 67
p-Terphenyl-dl4 79
Dibromofluoromethane 105
SPECTRA LABORATORIES
Steve Hibbs, Laboratory Manager a14/scj
SM5540C
SM 5210
Method
SW846 8270C
SW846 8270C
SW846 8270C
SW846 82608
Project: Client ID: Sample Matrix:
Date Sampled: Date Received:
Y elm Groundwater Monitoring SC7MW5 Water 06/12/2002 06/12/2002
Spectra Project: 2002060156 Spectra Number: 7
Analyte Bromide
Chloride
Dissolved Organic Carbon
Fluoride
Nitrate
Nitrite
Sulfate
Total Dissolved Solids
Surrogate
Toluene-dB
4-Bromofluorobenzene
Result 0.1
9.0
<2
< 0.01
4.8
<0.01
<I
100
Recovery
105
99
Units Method mg/L
mg/L
mg/L
mg/L
mg/L-N
mg/L-N
mg/L
mg/L
Method
SW846 82608
SW846 82608
SM4500-Br-B
SM4500CL-C
EPA415.1
EPA 340.2
SM4500N03D
SM4500N02B
EPA 375.4
EPA 160.1.
• Page 7 of 13

SPECTRA Laboratories 2221 Ross Way • Tacoma, WA 98421 • (253) 272-4850
07/10/2002
Skillings-Connolly, Inc. PO Box 5080 Lacey, W A 98509 Attn: Patrick Skillings
Analyte Result Units Method Arsenic
Boron
Cadmium
Chromium
Copper
Iron
Lead
•:ese
Nickel
Silver
Zinc
Bromodichloromethane
Bromoform
Caffeine
Chlorodibromomethane
Chloroform
N-Nitrosodimethylamine
TKN
Ammonia
Anionic Surfactants in
BOD
Swrogate
Nitrobcnzene-d5
2-Fluorobiphenyl
p-Terphenyl.-d14
Dibromofluoromethane
<5
360
<3
<7
<6
120
<I
32
<0.5
< 15
<7
13
9.72
<I
<10
1.2
37.4
<10
< 1.0
0.08
0.26
<2
ug!L EPA 206.2
ug!L EPA 200.7
ug!L EPA 200.7
ug!L EPA 200.7
ug!L EPA200.7
ug!L EPA200.7
ug!L EPA 239.2
ug!L EPA 200.7
ug!L EPA 245.1
ug!L EPA 200.7
ug!L EPA 200.7
ug!L EPA 200.7
ug!L SW846 8260B
ug!L SW846 8260B
ug!L EPA 625
ug!L SW846 8260B
ug!L SW846 8260B
ug!L EPA 625
mg!L SM 4500-N-B
mg!L-N EPA 350.3
mg!L SM5540C
mg!L SM 5210
Recovery Method
31 SW846 8270C
36 SW846 8270C
60
107
SW846 8270C
SW846 82608 • SPECTRA LABORATORIES
Steve Hibbs, Laboratory Manager al4/scj
Project: Client ID: Sample Matrix:
Date Sampled: Date Received:
Y elm Groundwater Monitoring SC8 IS Water 06/12/2002 06/12/2002
Spectra Project: 2002060 !56 Spectra Number: 8
Analyte Bromide
Chloride
Dissolved Organic Carbon
Fluoride
Nitrate
Nitrite
Sulfate
Total Dissolved Solids
Surrogate
Toluene-dB
4-Bromofluorobenzene
Result Units Method < 0.1 mg!L SM4500-Br-B
77 mg!L SM4500CL-C
7 mg!L EPA415.1
<0.01 mg!L EPA 340.2
5.1 mg!L-N SM4500N03D
<0.01 mg!L-N SM4500N02B
36 mg!L EPA 375.4
280 mg!L EPA !60.1
Recovery Method
105 SW846 82608
100 SW846 8260B
Page 8of13

SPECTRA Laboratories • 2221 Ross Way • Tacoma, WA 98421 • (253) 272-4850
07110/2002
Skillings-Connolly, lnc. PO Box 5080 Lacey, W A 98509 Attn: Patrick Skillings
· Analyte Result
Arsenic ~
Boron 360
Cadmium <3
Chromium <7
Copper <6
Iron 250
Lead <I
Manganese 80
Mercury <0.5
Nickel 16
Silver <7
Zinc 8
Bromodichloromethane 1.3
Bromoform <I
Caffeine <10
Chlorodibromomethane <I
Chloroform 8.8
N-Nitrosodimethylamine <10
TKN < 1.0
Units Method ug/L EPA206.2
ug/L EPA200.7
ug/L EPA200.7
ug/L EPA 200.7
ug/L EPA 200.7
ug/L EPA 200.7
ug/L EPA 239.2
ug/L EPA 200.7
ug/L EPA 245.1
ug/L EPA200.7
ug/L EPA200.7
ug/L EPA 200.7
ug/L SW846 8260B
ug/L SW846 8260B
ug/L EPA 625
ug/L SW846 8260B
ug/L SW846 8260B
ug/L EPA 625
mg/L SM 4500-N-B
Ammonia 0.11 mg/L-N EPA 350.3
Anionic Surfactants in 0.22 mg/L
BOD 4 mg/L
Surrogate Recovery
Nitrobenzene-d5 47
2-Fluorobiphenyl 53
p-Terphenyl-dl4 85
Dibromofluoromethane 107
SPECTRA LABORATORIES
Steve al4/scj
Manager
SM5540C
SM 5210
Method
SW846 8270C
SW846 8270C
SW846 8270C
SW846 82608
Project: Client ID: Sample Matrix:
Date Sampled: Date Received:
Yelm Groundwater Monitoring SC9 CSJ Water 06/12/2002 06/12/2002
Spectra Project: 2002060156 Spectra Number: 9
Analyte Bromide
Chloride
Dissolved Organic Carbon
Fluoride
Nitrate
Nitrite
Sulfate
Total Dissolved Solids
Surrogate
Toluene-dB
4-Bromofluorobenzene
Result < 0.1
82
8
0.02
1.1
0.02
31
270
Recovery
105
101
Units · Method . mg!L
mg!L
mg!L
mg!L
mg/L-N
mg!L-N
mg/L
mg!L
Method
SW846 82608
SWS46 82608
SM4500-Br-B
SM4500CL-C
EPA415.1
EPA 340.2
SM4500N03D
SM4500N02B
EPA 375.4
EPA 160.1.
• Page 9 of 13

• SPECTRA Laboratories 2221 Ross Way • Tacoma, WA 98421 • (253) 272-4850
07110/2002
Skillings-Connolly, Inc.
PO Box 5080
Lacey, WA 98509
Attn: Patrick Skillings
Analyte Result Units Method
Arsenic <5 ug!L EPA 206.2
Boron 370 ug!L EPA 200.7
Cadmium <3 ug!L EPA200.7
Chromium <7 ug!L EPA 200.7
Copper <6 ug!L EPA200.7
Iron 200 ug!L EPA 200.7
Lead <I ug!L EPA 239.2 .anese 180 ug/L EPA 200.7
ury <0.5 ug/L EPA 245.1
Nickel < 15 ug/L EPA 200.7
Silver <7 ug/L EPA200.7
Zinc <6 ug/L EPA200.7
Bromodichloromethane <I ug/L SW846 8260B
Bromoform <I ug/L SW846 8260B
Caffeine <10 ug/L EPA 625
Chlorodibromomethane <I ug/L SW846 8260B
Chloroform 1.4 ug/L SW846 8260B
N-Nitrosodimethylamine <10 ug/L EPA 625
TKN < 1.0 mg/L SM4500-N-B
Ammonia 0.29 mg/L-N EPA 350.3
Anionic Surfactants in 0.18 mg/L
BOD
•
3 mg/L
Surrogate Recovery
Nittobenzene-d5 45
2-Fiuorobiphenyl 56
p-Terpbenyl-dl4 86
Dibromofluoromethane 105
SPECTRA LABORATORIES
Steve ~atbry Manager al4/scj
SM5540C
SM 5210
Method
SW846 8270C
SW846 8270C
SW846 8270C
SW846 82608
Project: Yelm Groundwater Monitoring
Client ID: SCIO CS2
Sample Matrix: Water
Date Sampled: 06/12/2002
Date Received: 06/12/2002
Spectra Project: 2002060156
Spectra Number: 10
Analyte Result Units Method --Bromide < 0.1 mg!L SM4500-Br-B
Chloride 83 mg!L SM4500CL-C
Dissolved Organic Carbon 9 mg/L EPA415.1
Fluoride 0.02 mg/L EPA 340.2
Nitrate 1.0 mg/L-N SM4500N03D
Nitrite 0.02 mg/L-N SM4500N02B
Sulfate 26 mg/L EPA 375.4
Total Dissolved Solids 290 mg/L EPA 160.1
Surrogate Recovery Method
Toluene-dB 104 SW8468260B
4-Bromofluorobenzene 102 SW8468260B
Page 10 of 13

SPECTRA Laboratories • 2221 Ross Way • Tacoma, W A 98421 • (253) 272-4850
07/10/2002
Skillings-Connolly, Inc. PO Box 5080 Lacey, W A 98509 Attn: Patrick Skillings
Analyte Result· Units Method Arsenic <5 ug/L EPA 206.2
Boron 360 ug/L EPA 200.7
Cadmium <3 ug/L EPA 200.7
Chromium <7 ug/L EPA 200.7
Copper <6 ug/L EPA200.7
Iron 250 ug/L EPA 200.7
Lead < I ug/L EPA 239.2
Manganese 76 ug/L EPA 200.7
Mercury <0.5 ug/L EPA 245.1
Nickel < 15 ug/L EPA 200.7
Silver <7 ug/L EPA 200.7
Zinc <6 ug/L EPA 200.7
Bromodichloromethane <I ug/L SW846 8260B
Bromoform <I ug/L SW846 8260B
Caffeine <10 ug/L EPA 625
Chlorodibromomethane <I ug/L SW846 8260B
Chloroform <I ug/L SW846 8260B
N-Nitrosodimethylarnine <10 ug/L EPA 625
TKN < 1.0 mg/L SM 4500-N-B
Ammonia 0.11 mg!L-N EPA 350.3
Anionic Surfactants in 0.10 mg/L
BOD 2 mg/L
Surrogate Recovery
Nitrobenzene-d5 52
2-Fiuorobiphenyl 60
p-Terphenyl..d14 85
Dibromofluoromethane 102
SPECTRA LABORATORIES
Steve Hibbs, Laborato'ry Manager ai4/scj
SM5540C
SM 5210
Method
SW846 8270C
SW846 8270C
SW846 8270C
SW846 82608
Project: Client ID: Sample Matrix:
Date Sampled: Date Received: Spectra Project:
Y elm Groundwater Monitoring SCll CS3 Water 06/12/2002 06/12/2002 2002060156
Spectra Number: II
Analyte Bromide
Chloride
Dissolved Organic Carbon
Fluoride
Nitrate
Nitrite
Sulfate
Total Dissolved Solids
Surrogate
Toluene-dB
4-Bromofluorobenzene
Result <0.1
81
7
0.03
1.0
<0.01
21
280
Recovery
104
101
Units mg!L
mg!L
mg!L
mg!L
mg!L-N
mg!L-N
mg!L
mg!L
Method
SW846 82608
SW846 82608
Page 11 of 13
Method SM4500-Br-B
SM4500CL-C
EPA 415.1
EPA 340.2
SM4500N03D
SM4500N02B
EPA 375.4
EPA 160.1.
•

• SPECTRA Laboratories 2221RossWay • Tacoma, WA 98421 • (253)272-4850
07/10/2002
Skillings-Connolly, Inc. PO Box 5080 Lacey, W A 98509 Attn: Patrick Skillings
Analyte . ··-"': Result Units Method --Arsenic <5 ug!L EPA 206.2
Boron 350 ug!L EPA 200.7
Cadmium <3 ug!L EPA 200.7
Chromium <7 ug!L EPA 200.7
Copper <6 ug!L EPA 200.7
Iron 300 ug!L EPA 200.7
Lead <1 ug!L EPA 239.2
~ese 55 ug!L EPA 200.7
<0.5 ug!L EPA 245.1
Nickel < 15 ug!L EPA 200.7
Silver <7 ug!L EPA200.7
Zinc 6 ug!L EPA200.7
Bromodichloromethane <1 ug!L SW846 8260B
Bromoform <1 ug!L SW846 8260B
Caffeine <20 ug!L EPA 625
Chlorodibromomethane <1 ug!L SW846 8260B
Chloroform <1 ug!L SW846 8260B
N-Nitrosodimethylamine <20 ug!L EPA 625
TKN < 1.0 mg!L SM 4500-N-B
Ammonia 0.08 mg!L-N EPA 350.3
Anionic Surfactants in 0.16 mg!L
BOD
•
3 mg!L
Surrogate Recovery
Nitrobenzene-d5 69
2-Ftuorobiphenyl 79
p-Tetpbeny1-dl4 79
Dibromofluoromethane 103
SPECTRA LABORATORIES
Steve ffibbs, Laboratory Manager al4/scj
SM5540C
SM 5210
Method
SW846 8270C
SW846 8270C
SW846 8270C
SW846 82608
Project: Client ID: Sample Matrix:
Date Sampled: Date Received:
Y elm Groundwater Monitoring SC12 CS4 Water
06/12/2002 06112/2002
Spectra Project: 2002060156 Spectra Number: 12
· Analyte Result Units Method Bromide ~ mg!L SM4500-Br-B
Chloride 68 mg!L SM4500CL-C
Dissolved Organic Carbon 8 mg!L EPA415.1
Fluoride 0.03 mg!L EPA 340.2
Nitrate 0.9 mg/L-N SM4500N03D
Nitrite <0.01 mg/L-N SM4500N02B
Sulfate 20 mg!L EPA 375.4
Total Dissolved Solids 260 mg!L EPA 160.1
Surrogate Recovery Method
Toluene-dB 102 SW846 82608
4-Bromofluorobenzene 100 SW846 82608
Page 12 of 13

SPECTRA Laboratories • 2221 Ross Way • Tacoma, WA 98421 • (253) 272-4850
0711012002
Skillings-Connolly, Inc. PO Box 5080 Lacey, W A 98509 Attn: Patrick Skillings
Analyte ···Result Units Method Arsenic ---zs ug!L EPA 206.2
Boron 350 ug!L EPA 200.7
Cadmium <3 ug!L EPA 200.7
Chromium <7 ug!L EPA 200.7
Copper <6 ug!L EPA 200.7
Iron 250 ug!L EPA 200.7
Lead < 1 ug!L EPA 239.2
Manganese 80 ug!L EPA 200.7
Mercury <0.5 ug!L EPA245.1
Nickel < 15 ug!L EPA 200.7
Silver <7 ug!L EPA 200.7
Zinc 9 ug!L EPA 200.7
Bromodichloromethane 1.3 ug!L SW846 8260B
Bromoform <1 ug!L SW846 8260B
Caffeine <10 ug!L EPA 625
Chlorodibromomethane <1 ug!L SW846 8260B
Chloroform 8.8 ug!L SW846 8260B
N-Nitrosodimethylamine <10 ug!L EPA 625
TKN < 1.0 mg!L SM4500-N-B
Ammonia 0.08 mg!L-N EPA 350.3
Anionic Surfactants in 0.23 mg!L SM5540C
BOD 3 mg!L SM 5210
Surrogate Recovery Method
Nitrobcnzene--<15 55 SW846 8270C
2-Fiuorobiphenyl 64 SW846 8270C
p-Terphenyl-d \4 8J SW846 8270C
108 SW846 82608
Project: Client ID: Sample Matrix: Date Sampled: Date Received: Spectra Project:
Yelm Groundwater Monitoring SC13 FD Water 06/12/2002 06/12/2002 2002060156
Spectra Number: 13
Analyte Result Units Method Bromide 0.1 mg!L SM4500-Br-B
Chloride 76 mg!L SM4500CL-C
Dissolved Organic Carbon 8 mg!L EPA 415.1
Fluoride 0.03 mg!L EPA 340.2
Nitrate 1.4 mg!L-N SM4500N03D
Nitrite 0.02 mg!L-N SM4500N02B
Sulfate 30 mg!L EPA 375.4
Total Dissolved Solids 280 mg!L EPA160 .•
Surrogate Recovery Method
Toluene-dB I OJ SW846 82608
4-Bromofluorobenzene I 00 SW846 82608
Dibromofluoromethane
SPECTRA LABORATORIES •
Steve Hibbs, Laborato Manager al4/scj
Page 13 of 13

.~WATER _..:.. MANAGEMENT e LABoRATORIEs INC.
1515 80th St. E. Tacoma. WA 98404 (253) 531-3121
•
•
June 14, 2002
Spectra Laboratories, Inc. 2221 Ross Way Tacoma, WA 98421 Attn: Steve Hibbs
Dear Sir:
Results of analysis of thirteen environmental water samples taken on 06-12-02 and received on 06-12-02 at 4:15p.m. are as follows:
Project: 2002060156- Skillings- Connolly
Fecal Fecal Sample Coliform Streptococcus
Identification (per 100 mls) (per 100 mls)
01- SCl CW 0 < 2* 10:30 split sample 0 < 2*
02-SC2 MW6 1 0 08:00
03- SC3 MW1 1 1 09:00
04-SC4 MW2 0 1 09:30
05- SC5 MW3 0 0 10:00
06-SC6 MW4 0 0 11:10
07-SC7 MW5 < 2* < 2* 12:00 split sample < 2* < 2*
08- SC8 1S 0 0 11:05

Spectra Laboratories, Inc. June 14, 2002 Page 2
Fecal Fecal Sample Coliform Streptococcus
Identification (:Rer 100 mls) (:Rer 100 mls)
09- SC9 CS1 2,000 54 12:30
10- SClO CS2 50 6 13:00
11- SCll CS3 11 10 13:55
12- SC12 CS4 100 43 14:05
13- SC13 FD 1,800 44 12:30 split sample 2,000
* < is less than
Lab Number: 08967389 through 08967401
Please note sample volume was insufficient to split for both tests on sample # 13.
Samples were analyzed by membrane filtration procedure according to Standard Methods for the Examination of Water and Wastewater, 19th Edition and EPA Microbiological Methods for Monitoring the Environment.
Chain of custody record is enclosed.
Sincerely,
~~~~'r'Vl~ Diane DuMond Microbiologist
DD:lcc enclosure
R:\COMM\SPECTRALABS6-12
•
•
•

• SPECTRA Laboratories 2221 Ross Way • Tacoma, WA 98421 • (253) 272-4850
10/01/2002
Skillings-Connolly, Inc, PO Box 5080 Lacey, WA 98509
Analyte Result Units Method Arsenic <5 ug!L EPA206,2
Boron <8 ug!L EPA200.7
Cadmium <3 ug/L EPA 200.7
Chromium <7 ug/L EPA 200.7
Copper <6 ug!L EPA 200.7
Iron < 10 ug/L EPA 200.7
Lead <I ug!L EPA 239.2
.anese <2 ug!L EPA 200.7
ury <0.5 ug!L EPA 245.1
Nickel < 15 ug/L EPA 200.7
Silver <7 ug/L EPA 200.7
Zinc <6 ug!L EPA 200.7
Bromodichloromethane <I ug!L SW846 8260B
Bromoform <I ug!L SW846 8260B
Caffeine <10 ug/L EPA 625
Chlorodibromomethane <I ug/L SW846 8260B
Chloroform <I ug/L SW846 8260B
N-Nitrosodimethylamine <10 ug/L EPA 625
TKN 1.1 mg/L SM 4500-N-B
Ammonia 0.21 mg/L-N EPA 350.3
Anionic Surfactants as <0.05 mg/L SM5540C
BOD <2 mg/L SM 5210
Surrogate Recovery Method
Dibromofluoromethane 103 SW846 82608
Toluene-dB 99 SW846 82608
4-Bromofluorobenzene 99 EPA 624
• Nitrobenzene-dS 75 SW846 8270C
SPECTRA LABORATORIES
Manager al4/sgh
Project: Client ID: Sample Matrix:
Date Sampled: Date Received: Spectra Project:
Yelm Groundwater Monitoring SCI CW Water 0910512002 09/05/2002 2002090031
Spectra Number: 1
Analyte Result Units Method Bromide <0.1 mg!L SM4500-Br-B
Chloride 5.5 mg/L SM4500CL-C
Dissolved Organic Carbon 4 mg!L EPA 415.1
Fluoride 0.03 mg!L EPA 340.2
Nitrate 2.54 mg!L-N SM4500N03D
Nitrite <0.01 mg/L-N SM4500N02B
Sulfate <I mg/L EPA 375.4
Total Dissolved Solids 86 mg/L EPA 160.1
Surrogate Recovery Method
2-Fiuorobiphenyl 96 SW846 8270C
p-Terphenyl-dl4 102 SW846 8270C
Page 1 of 13

SPECTRA Laboratories • 2221 Ross Way • Tacoma, WA 98421 • (253) 272-4850
10/0112002
Skillings-Connolly, Inc. PO Box 5080 Lacey, WA 98509
Analyte ~>-Result
Arsenic --:("5
Boron <8
Cadmium <3
Chromium <7
Copper <6
Iron 1900
Lead < I
Manganese 5100
Mercury <0.5
Nickel < 15
Silver <7
Zinc 9
Bromodichloromethane <I
Bromoform <I
Caffeine <10
Chlorodibromomethane <I
Chloroform <I
N-Nitrosodimethylamine <10
TKN <I
Units Method ug!L EPA 206.2
ug/L EPA200.7
ug/L EPA 200.7
ug/L EPA 200.7
ug!L EPA 200.7
ug/L EPA200.7
ug/L EPA 239.2
ug/L EPA 200.7
ug!L EPA 245.1
ug/L EPA200.7
ug/L EPA200.7
ug/L EPA 200.7
ug/L SW846 8260B
ug/L SW846 8260B
ug/L EPA 625
ug/L SW846 8260B
ug/L SW846 8260B
ug/L EPA 625
mg/L SM 4500-N-B
Ammonia 0.21 mg/L-N EPA 350.3
Anionic Surfactants as <0.05 mg/L SM5540C
BOD <2 mg/L SM 5210
Surrogate Recovery Method
Dibromofluoromethane 102 SW846 82608
Toluene-dB 100 SW846 82608
4-Bromofluorobenzene 101 EPA 624
Nitrobenzene-d5 62 SW846 8270C
SPECTRA LABORATORIES
Stevms;t:abofiit(]ry Manager al4/sgh
Project: Client ID:
Yelm Groundwater Monitoring SC2MW6
Sample Matrix: Water Date Sampled: 09/05/2002 Date Received: 09/05/2002 Spectra Project: 2002090031 Spectra Number: 2
Analytc Result Units Method Bromide
Chloride
Dissolved Organic Carbon
Fluoride
Nitrate
Nitrite
Sulfate
Total Dissolved Solids
Surrogate
2·Fiuorobiphcnyl
p-Terpheny\-d\4
0.1
6.5
25
0.05
2.34
< 0.01
<I
86
Recovery
79
98
mg/L
mg!L
mg/L
mg!L
mg/L-N
mg/L-N
mg!L
mg/L
Method
SW846 8270C
SW846 8270C
Page 2 of 13
SM4500-Br-B
SM4500CL-C
EPA 415.1
EPA 340.2
SM4500N03D
SM4500N02B
EPA 375.4
EPA 160.1.
•

•---' SPECTRA Laboratories 2221 Ross Way • Tacoma, WA 98421 • (253)272-4850
10/01/2002
Skillings-Connolly, Inc. PO Box 5080 Lacey, WA 98509
Analyte Result Units Method Arsenic <5 ug!L EPA 206.2
Boron <8 ug!L EPA 200.7
Cadmium <3 ug!L EPA 200.7
Chromium <7 ug!L EPA 200.7
Copper <6 ug!L EPA 200.7
Iron 380 ug!L EPA 200.7
Lead <I ug!L EPA 239.2
~~~ese 100 ug!L EPA 200.7
< 0.5 ug!L EPA 245.1
Nickel < 15 ug!L EPA 200.7
Silver <7 ug!L EPA 200.7
Zinc <6 ug!L EPA 200.7
Bromodichloromethane <I ug!L SW846 8260B
Bromoform <I ug!L SW846 8260B
Caffeine <10 ug!L EPA 625
Chlorodibromomethane <I ug!L SW846 8260B
Chloroform <I ug!L SW846 8260B
N-Nitrosodimethylamine <10 ug!L EPA625
TKN <I mg!L SM4500-N-B
Ammonia 0.20 mg!L-N EPA 350.3
Anionic Surfactants as <0.05 mg!L
BOD
•
<2 mg!L
Surroga1e Rtl:overy
Dibromonuoromethane 10<
Toluene-dB 100
4-Bromofluorobenze:ne 100
Nitrobenzene-d5 68
SPECTRA LABORATORIES
Steve Hibbs, Laboratory Manager al4/sgh
SM5540C
SM 5210
Method
SW846 82608
SW846 82608
EPA 624
SW846 8270C
Project: Client ID: Sample Matrix:
Date Sampled: Date Received: Spectra Project:
Spectra Number:
Analyte Bromide
Chloride
Dissolved Organic Carbon
Fluoride
Nitrate
Nitrite
Sulfate
Total Dissolved Solids
Surrogate
2-Fluorobipbenyl
p-Terphenyl-d 14
Yelm Groundwater Monitoring SC3 MW1 Water
09/05/2002
09/05/2002 2002090031 3
Result Units Method --o:z mg!L SM4500-Br-B
7.0 mg!L SM4500CL-C
9 mg!L EPA 415.1
0.03 mg!L EPA 340.2
4.33 mg!L-N SM4500N03D
<0.01 mg!L-N SM4500N02B
<I mg!L EPA 375.4
90 mg!L EPA 160.1
Recovery Method
87 SW846 8270C
88 SW846 8270C
Page 3 of 13

SPECTRA Laboratories • 2221 Ross Way • Tacoma, WA 98421 • (253) 272-4850
I 0/01/2002
Skillings-Connolly, Inc. PO Box 5080 Lacey, W A 98509
Analyte Result Units Method ---
Arsenic <5 ug!L EPA 206.2
Boron <8 ug!L EPA 200.7
Cadmium <3 ug!L EPA 200.7
Chromium <7 ug!L EPA 200.7
Copper <6 ug!L EPA 200.7
Iron 26 ug!L EPA 200.7
Lead <I ug!L EPA 239.2
Manganese <2 ug!L EPA 200.7
Mercury <0.5 ug!L EPA 245.1
Nickel < 15 ug!L EPA 200.7
Silver <7 ug!L EPA 200.7
Zinc <6 ug!L EPA 200.7
Bromodichlorometbane <I ug!L SW846 8260B
Bromoform <I ug!L SW846 8260B
Caffeine <10 ug!L EPA 625
Chlorodibromometbane <I ug!L SW846 8260B
Chloroform <I ug!L SW846 8260B
N-Nitrosodimetby I amine <10 ug!L EPA 625
TKN <I mg!L SM 4500-N-B
Ammonia 0.18 mg!L-N EPA 350.3
Anionic Surfactants as <0.05 mg!L SM5540C
BOD <2 mg!L SM 5210
Surrogate Recovery Method
Dibromofluoromethane 106 SW846 82608
Toluene-dB 99 SW&46 82608
4-Bromofluorobenzene 101 EPA 624
Project: Client ID: Sample Matrix:
Date Sampled: Date Received:
Yelm Groundwater Monitoring SC4MW2 Water
09/05/2002
0910512002 Spectra Project: 2002090031 Spectra Number: 4
Analyte Result Units Method Bromide < 0.1 mg!L SM4500-Br-B
Chloride 9.0 mg!L SM4500CL-C
Dissolved Organic Carbon 7 mg!L EPA 415.1
Fluoride 0.02 mg!L EPA 340.2
Nitrate 4.29 mg!L-N SM4500N03D
Nitrite < 0.01 mg!L-N SM4500N02B
Sulfate <I mg!L EPA 375.4
Total Dissolved Solids 100 mg!L EPA 160.1.
Surrogate Recovery Method
2-Fiuorobiphenyl 90 SW846 8270C
p-Terpheny1-dl4 95 SW846 8270C
Nitrobenzene-d5 71 SW&46 8270C
SPECTRA LAB ORA TORIES •
Steve al4/sgh
Manager Page 4 of 13

•~ SPECTRA Laboratories 2221 RossWay • Tacoma, WA 98421 • (253)272-4850
10/01/2002
Skillings-Connolly, Inc. PO Box 5080 Lacey, WA 98509
Analyte Result -units· Method ---
Arsenic <5 ug!L EPA 206.2
Boron 120 ug!L EPA 200.7
Cadmium <3 ug!L EPA 200.7
Chromium <7 ug!L EPA 200.7
Copper <6 ug!L EPA 200.7
Iron 260 ug!L EPA 200.7
Lead <I ug!L EPA 239.2
kese 18 ug!L EPA 200.7
< 0.5 ug!L EPA 245.1
Nickel < 15 ug!L EPA 200.7
Silver <7 ug!L EPA 200.7
Zinc 13 ug!L EPA 200.7
Bromodichloromethane <I ug!L SW846 8260B
Bromoform <I ug!L SW846 8260B
Caffeine <10 ug!L EPA 625
Chlorodibromomethane <I ug!L SW846 8260B
Chloroform <I ug!L SW846 8260B
N-Nitrosodimethylamine <10 ug!L EPA 625
TKN <I mg!L SM 4500-N-B
Ammonia 0.18 mg!L-N EPA 350.3
Anionic Surfactants as <0.05 mg!L
BOD <2 mg!L
Surrogate Recovery
Oibromofluoromethane 107
Toluene-dB 98
4-Bromofluorobenzene 100
N itrobenzene-d5 66
• SPECTRA LABORATORIES
Steve'Hibbs, Laboratory Manager al4/sgh
SM5540C
SM 5210
Method
SW846 82608
SW846 82608
EPA 624
SW846 8270C
Project: Client ID:
Yelm Groundwater Monitoring SC5 MW3
Sample Matrix: Water
Date Sampled: 09/05/2002 Date Received: Spectra Project:
09/05/2002 2002090031
Spectra Number: 5
Analyte· Result Units ---
Bromide 0.2 mg!L
Chloride 58 mg!L
Dissolved Organic Carbon 9 mg!L
Fluoride 0.02 mg!L
Nitrate 3.38 mg!L-N
Nitrite <0.01 mg!L-N
Sulfate 5 mg!L
Total Dissolved Solids 230 mg!L
Surrogate Recovery Method
2-Fiuorobiphenyl 82 SW846 8270C
p-Terphenyl-d14 95 SW846 8270C
Page 5 of 13
Method SM4500-Br-B
SM4500CL-C
EPA 415.1
EPA 340.2
SM4500N03D
SM4500N02B
EPA 375.4
EPA 160.1

SPECTRA Laboratories • 2221 Ross Way • Tacoma, WA 98421 • (253) 272-4850
10/01/2002
Skillings-Connolly, Inc. PO Box 5080 Lacey, WA 98509
Analyte ~ .. ;._. Result Units Method· Arsenic ---:(5 ug/L EPA 206.2
Boron 160 ug/L EPA 200.7
Cadmium <3 ug/L EPA 200.7
Chromium <7 ug/L EPA 200.7
Copper <6 ug/L EPA 200.7
Iron 130 ug/L EPA 200.7
Lead <I ug/L EPA 239.2
Manganese 7 ug/L EPA 200.7
Mercury <0.5 ug/L EPA 245.1
Nickel < 15 ug/L EPA 200.7
Silver <7 ug/L EPA 200.7
Zinc 16 ug/L EPA 200.7
Bromodichloromethane <I ug/L SW846 8260B
Bromoform <I ug/L SW846 8260B
Caffeine <10 ug/L EPA 625
Chlorodibromomethane <I ug/L SW846 8260B
Chloroform <I ug/L SW846 8260B
N-Nitrosodimethylamine <10 ug/L EPA 625
TKN <I mg/L SM 4500-N-B
Ammonia 0.18 mg/L-N EPA 350.3
Anionic Surfactants as <0.05 mg/L SM5540C
BOD <2 mg/L SM 5210
Surrogate Recovery Method
Dibromofluoromethane 108 SW84682608
Toluene-dB 99 SW846 82608
4-Bromofiuorobenzene 101 EPA 624
Nitrobenzene-d5 42 SWS46 8270C
SPECTRA LABORATORIES
Steve a14/sgh
anager
Project: Client ID:
Yelm Groundwater Monitoring SC6MW4
Sample Matrix: Water Date Sampled: 09/05/2002 Date Received: 09/05/2002 Spectra Project: 2002090031 Spectra Number: 6
Analyte Result Units Method Bromide 0.2 mg/L SM4500-Br-B
Chloride 52 mg/L SM4500CL-C
Dissolved Organic Carbon 8 mg/L EPA 415.1
Fluoride 0.02 mg/L EPA 340.2
Nitrate 3.13 mg/L-N SM4500N03D
Nitrite < 0.01 mg/L-N SM4500N02B
Sulfate 5 mg/L EPA 375.4
Total Dissolved Solids 180 mg/L EPA160 .•
Surrogate Recovery Method
2-Fluorobiphenyl 54 SW846 8270C
p-Terphenyl-d 14 71 SW846 8270C
• Page 6 of 13

• SPECTRA Laboratories 2221 Ross Way • Tacoma, WA 98421 • (253)272-4850
I 0/01/2002
Skillings-Connolly, Inc, PO Box 5080 Lacey, WA 98509
· Al}alyte .. · "' : ... Result
Arsenic <5 Boron <8
Cadmium <3
Chromium <7
Copper <6
Iron 270
Lead < I
~~~ese 14
<0.5
Nickel < 15
Silver <7
Zinc <6
Bromodichloromethane <I
Bromoform <I
Caffeine <10
Chlorodibromomethane <I
Chloroform <I
N-Nitrosodimethylamine <10
TKN <I
Units Method ug!L EPA 206.2
ug/L EPA200.7
ug/L EPA200.7
ug/L EPA200.7
ug/L EPA200.7
ug/L EPA 200.7
ug/L EPA239.2
ug/L EPA200.7
ug/L EPA 245.1
ug/L EPA200.7
ug/L EPA200.7
ug/L EPA200.7
ug/L SW846 8260B
ug/L SW846 8260B
ug/L EPA625
ug/L SW846 8260B
ug/L SW846 8260B
ug/L EPA 625
mg/L SM 4500-N-B
Ammonia 0.15 mg/L-N EPA 350.3
Anionic Surfactants as <0.05 mg/L SM5540C
BOD <2 mg/L SM 5210
Surrogate Recovery Method
Dibromofluoromethane 103 SW846 82608
Toluene-d8 99 SW846 82608
4-Bromofluorobenzene 99 EPA 624
Nitrobenzene-dS 78
• SPECTRA LABORATORIES
SW846 8270C
~
Project: Client ID: Sample Matrix:
Date Sampled: Date Received:
Y elm Groundwater Monitoring SC7 MWS Water 09/05/2002 09/05/2002
Spectra Project: 2002090031 Spectra Number: 7
Analyte Result Units Method --Bromide < 0.1 mg/L SM4500-Br-B
Chloride 14 mg/L SM4500CL-C
Dissolved Organic Carbon 7 mg!L EPA 415.1
Fluoride 0.02 mg!L EPA 340.2
Nitrate 4.22 mg!L-N SM4500N03D
Nitrite < 0.01 mg/L-N SM4500N02B
Sulfate <I mg/L EPA 375.4
Total Dissolved Solids 110 mg/L EPA 160.1
Surrogate Recovery Method
2-Fiu.orobiphenyl 95 SW846 8270C
p-Terphenyl-d14 98 SW846 8270C
Page 7 of 13

SPECTRA Laboratories • 2221 Ross Way • Tacoma, W A 98421 • (253) 272-4850
10/0112002
Skillings-Connolly, Inc. PO Box 5080 Lacey, W A 98509
Analyte Result·. ·Units Method Arsenic <5 ug!L EPA 206.2
Boron 320 ug!L EPA 200.7
Cadmium <3 ug!L EPA 200.7
Chromium <7 ug!L EPA 200.7
Copper <6 ug!L EPA 200.7
Iron 54 ug!L EPA200.7
Lead <I ug!L EPA 239.2
Manganese 5 ug!L EPA 200.7
Mercury <0.5 ug!L EPA 245.1
Nickel < 15 ug!L EPA 200.7
Silver 8 ug!L EPA 200.7
Zinc 41 ug!L EPA 200.7
Bromodichloromethane 13 ug!L SW846 8260B
Bromoform <I ug!L SW846 8260B
Caffeine <10 ug!L EPA 625
Chlorodibromomethane ug!L SW846 8260B
Chloroform 71 ug!L SW846 8260B
N-Nitrosodimethylamine <10 ug!L EPA 625
TKN <I mg!L SM 4500-N-B
Ammonia 0.10 mg/L-N EPA 350.3
Anionic Surfactants as 0.35 mg!L SM5540C
BOD <2 mg!L SM 5210
Surrogate Recovery Method
Dibromofluoromethane 110 SW846 82608
Toluene-dB .98 SW846 82608
4-Bromofluorobenzene 104 EPA 624
Nitrobenzene-d5 74 SW846 8270C
Project: Client ID: Sample Matrix:
Date Sampled: Date Received: Spectra Project: Spectra Number:
Analyte Bromide
Chloride
Dissolved Organic Carbon
Fluoride
Nitrate
Nitrite
Sulfate
Total Dissolved Solids
Surrogate
2-Fiuorobiphenyl
p-Terphenyl-dl4
Yelm Groundwater Monitoring SCS IS Water 0910512002 09/05/2002 2002090031 8
Result Units Method --< 0.1 mg/L . SM4500-Br-B
100 mg!L SM4500CL-C
14 mg!L EPA 415.1
0.03 mg/L EPA 340.2
6.98 mg/L-N SM4500N03D
< 0.01 mg/L-N SM4500N02B
25 mg/L EPA 375.4
320 mg/L EPA 160.1 •
Recovery Method
90 SW846 8270C
89 SW846 8270C
SPECTRA LABORATORIES •
/b. Steve Hibbs, Labora""tiilry Manager Page B of 13 al4/sgh

•~ SPECTRA Laboratories 2221 Ross Way • Tacoma, W A 98421 • (253) 272-4850
10/01/2002
Skillings-Connolly, Inc. PO Box 5080 Lacey, WA 98509
Aml!.yte-· ': · · Result Units. Method Ars~enic ---zs ug/L EPA 206.2
Boron 280 ug!L EPA 200.7
Cadmium <3 ug/L EPA 200.7
Chromium <7 ug/L EPA200.7
Copper <6 ug/L EPA200.7
Iron 100 ug/L EPA200.7
Lead <1 ug/L EPA239.2
wanese 42 ug/L EPA 200.7
ury <0.5 ug/L EPA 245.1
Nickel < 15 ug/L EPA 200.7
Silver <7 ug/L EPA 200.7
Zinc . 17 ug/L EPA200.7
Bromodichloromethane ug/L SW846 8260B
Bromoform <I ug/L SW846 8260B
Caffeine <10 ug/L EPA 625
Chlorodibromomethane <I ug/L SW846 8260B
Chloroform 11 ug/L SW846 8260B
N-Nitrosodimethylamine <10 ug/L EPA 625
TKN <1 mg/L SM 4500-N-B
Ammonia 0.12 mg/L-N EPA 350.3
Anionic Surfactants as 0.31 mg!L SM5540C
BOD 3 mg!L SM 52!0
Surrogate Recovery Method
Dibromofluoromethane 105 SW846 82608
Toluene-dB 99 SW846 82608
4-Bromofluorobenzene 102 EPA 624
Nitrobenzene-d5 64
• SPECTRA LABORATORIES
SW846 8270C
Project: Client ID: Sample Matrix:
Date Sampled: Date Received: Spectra Project:
Spectra Number:
Analyte Bromide
Chloride
Dissolved Organic Carbon
Fluoride
Nitrate
Nitrite
Sulfate
Total Dissolved Solids
Surrogate
2-Fluorobiphenyl
p-Terphenyl.d 14
Yelm Groundwater Monitoring SC9 CS1 Water
09/05/2002
09/05/2002 2002090031 9
Result Units M~t9od. < 0.1 mg!L SM4500-Br-B
100 mg!L SM4500CL-C
14 mg!L EPA 415.1
0.03 mg/L EPA 340.2
1.29 mg!L-N SM4500N03D
0.03 mg!L-N SM4500N02B
29 mg/L EPA 375.4
330 mg/L EPA 160.1
Recovery Method
87 SW846 8270C
8 I SW846 8270C
Page 9 of 13

SPECTRA Laboratories • 2221 Ross Way • Tacoma, WA 98421· • (253) 272-4850
10/01/2002
Skillings-Connolly, Inc. PO Box 5080 Lacey, WA 98509
Analyte . ~~.: ,:·Result Units Method" Arsenic ----zs ug/L EPA 206.2
Boron 310 ug/L EPA 200.7
Cadmium <3 ug/L EPA200.7
Chromium <7 ug/L EPA 200.7
Copper <6 ug/L EPA 200.7
Iron 150 ug/L EPA200.7
Lead <1 ug/L EPA239.2
Manganese 280 ug/L EPA 200.7
Mercury <0.5 ug/L EPA 245.1
Nickel < 15 ug/L EPA 200.7
Silver <7 ug/L EPA 200.7
Zinc <6 ug/L EPA 200.7
Bromodichloromethane <1 ug/L SW846 82608
Bromoform <1 ug/L SW846 82608
Caffeine <10 ug/L EPA 625
Chlorodibromomethane <1 ug/L SW846 8260B
Chloroform <1 ug/L SW846 8260B
N-Nitrosodimethylarnine <10 ug!L EPA 625
TKN 1.7 mg!L SM4500-N-B
Ammonia 0.13 mg/L-N EPA 350.3
Anionic Surfactants as 0.30 mg!L SM5540C
BOD 8 mg/L SM 5210
Surrogate Recovery Method
Dibromofluoromethane 109 SW846 82608
Toluene-dB 99 SW846 82608
4-Bromof\uorobenzene 101 EPA 624
Nitrobenzene-dS 70 SW846 8270C
SPECTRA LABORATORIES
Manager al4/sgh
Project: Client ID: Sample Matrix:
Date Sampled: Date Received:
Y elm Groundwater Monitoring SC10 CS2 Water 09/05/2002 09/05/2002
Spectra Project: 2002090031 Spectra Number: 10
Analyte Result Units Method Bromide < 0.1 mg/L SM4500-Br-B
Chloride 110 mg/L SM4500CL-C
Dissolved Organic Carbon 20 mg/L EPA 415.1
Fluoride 0.04 mg/L EPA 340.2
Nitrate 0.96 mg/L-N SM4500N03D
Nitrite <0.01 mg/L-N SM4500N02B
Sulfate 16 mg/L EPA 375.4
Total Dissolved Solids 320 mg/L EPA 160 .•
Surrogate Recovery Method
2-F\uorobipbenyl 87 SW846 8270C
p-Terphenyl-d\4 81 SW846 8270C
• Page 10 of 13

• SPECTRA Laboratories 2221 Ross Way • Tacoma, WA 98421 • (253) 272-4850
10/01/2002
Skillings-Connolly, Inc. PO Box 5080 Lacey, W A 98509
Analyte Result Units Method Arsenic <5 ug!L EPA 206.2
Boron 290 ug!L EPA 200.7
Cadmium <3 ug!L EPA200.7
Chromium <7 ug!L EPA 200.7
Copper 17 ug!L EPA200.7
Iron 290 ug!L EPA200.7
Lead <I ug!L EPA239.2
-anese 160 ug!L EPA 200.7
ury <0.5 ug!L EPA 245.1
Nickel < 15 ug!L EPA200.7
Silver <7 ug!L EPA 200.7
Zinc <6 ug!L EPA 200.7
Bromodichloromethane <I ug!L SW846 8260B
Bromoform <I ug!L SW846 8260B
Caffeine <10 ug!L EPA 625
Chlorodibromomethane <I ug!L SW846 8260B
Chloroform <I ug!L SW846 8260B
N-Nitrosodimethylamine <10 ug!L EPA 625
TKN 1.7 mg!L SM 4500-N-B
Ammonia 0.12 mg!L-N EPA 350.3
Anionic Surfactants as 0.14 mg!L
BOD
•
5 mg/L
Surrogate Recovery
Dibromofluoromethane 109
Toluene--dB 102
4-Bromofluorobenzene 102
Nitrobenzene-d5 73
SPECTRA LABORATORIES
Steve~ratbry Manager al4/sgh
SM5540C
SM 5210
Method
SW846 82608
SW846 82608
EPA 624
SW846 8270C
Project: Y elm Groundwater Monitoring Client ID: SCll CS3 Sample Matrix: Water
Date Sampled: 09/05/2002 Date Received: 09/05/2002 Spectra Project: 2002090031 Spectra Number: II
Analyte Result Units Method Bromide <OT mg!L SM4500-Br-B
Chloride Ill mg!L SM4500CL-C
Dissolved Organic Carbon 11 mg!L EPA 415.1
Fluoride 0.04 mg!L EPA 340.2
Nitrate 1.36 mg!L-N SM4500N03D
Nitrite < 0.01 mg!L-N SM4500N02B
Sulfate <I mg!L EPA 375.4
Total Dissolved Solids 320 mg!L EPA 160.1
Surrogate Recovery Method
2-Fluorobiphenyl 92 SW846 8270C
p-Terphenyl-d14 85 SW846 8270C
Page 11 of13

SPECTRA Laboratories • 2221 Ross Way • Tacoma, W A 98421 • (253) 272-4850
10/01/2002
Skillings-Connolly, Inc. PO Box 5080 Lacey, W A 98509
Analyte Result Units Method Arsenic <5 ug!L EPA 206.2
Boron 320 ug/L EPA 200.7
Cadmium <3 ug/L EPA 200.7
Chromium <7 ug/L EPA 200.7
Copper <6 ug/L EPA200.7
Iron 200 ug/L EPA200.7
Lead <I ug/L EPA 239.2
Manganese 100 ug/L EPA200.7
Mercury < 0.5 ug/L EPA 245.1
Nickel 19 ug/L EPA 200.7
Silver <7 ug/L EPA 200.7
Zinc <6 ug/L EPA 200.7
Bromodichloromethane <1 ug/L SW846 8260B
Bromoform <1 ug!L SW846 8260B
Caffeine <10 ug/L EPA 625
Chlorodibromomethane <I ug/L SW846 8260B
Chloroform <I ug/L SW846 8260B
N-Nitrosodimethylamine <10 ug/L EPA 625
TKN <I mg!L SM 4500-N-B
Ammonia 0.13 mg/L-N EPA 350.3
Anionic Surfactants as 0.15 mg!L SM5540C
BOD 4 mg/L SM 5210
Surrogate Recovery Method
Dibromofluoromethane 112 SW846 82608
Toluene-dB 100 SW846 82608
4-Bromofluorobenzene 103 EPA 624
Nitrobenzene-dS 79 SW846 8270C
SPECTRA LABORATORIES
Manager al4/sgh
Project: Client ID:
Yelm Groundwater Monitoring SC12 CS4
Sample Matrix: Water
Date Sampled: Date Received: Spectra Project:
09/05/2002 09/05/2002 2002090031
Spectra Number: 12
Analyte· Result Units Bromide < 0.1 mg!L
Chloride Ill mg/L
Dissolved Organic Carbon 14 mg!L
Fluoride 0.04 mg!L
Nitrate 1.03 mg!L-N
Nitrite <0.01 mg!L-N
Sulfate <I mg!L
Total Dissolved Solids 335 mg/L
Surrogate Recovery Method
2-Fiuorobiphenyl 96 SW846 8270C
p-Terphenyl-dl4 88 SW846 8270C
Page 12 of 13
Method SM4500-Br-B
SM4500CL-C
EPA415.1
EPA 340.2
SM4500N03D
SM4500N02B
EPA 375.4
EPA 160.1.
•

• SPECTRA Laboratories 2221 Ross Way • Tacoma, WA 98421 • (253) 272-4850
10/0112002
Skillings-Connolly, Inc. PO Box 5080 Lacey, W A 98509
Analyte Result Units Method ---
Arsenic <5 ug/L EPA 206.2
Boron 160 ug/L EPA200.7
Cadmium <3 ug/L EPA200.7
Chromium <7 ug/L EPA200.7
Copper <6 ug/L EPA200.7
Iron 100 ug/L EPA 200.7
Lead <I ug/L EPA239.2
•;ese 3 ug/L EPA 200.7
<0.5 ug/L EPA 245.1
Nickel < 15 ug/L EPA 200.7
Silver <7 ug/L EPA200.7
Zinc <6 ug/L EPA200.7
Bromodichloromethane <I ug/L SW846 8260B
Bromoform <I ug/L SW846 8260B
Caffeine <10 ug/L EPA625
Chlorodibromomethane <I ug/L SW846 8260B
Chloroform <I ug/L SW846 8260B
N-Nitrosodimethylarnine <10 ug/L EPA 625
TKN <I mg/L SM 4500-N-B
Ammonia 0.11 mg/L-N EPA 350.3
Anionic Surfactants as <0.05 mg/L
BOD
•
<2 mg/L
Surrogate Recovery
Dibromofluoromethane 105
Toluene-dB 101
4-Bromofluorobenzene !00
Nitrobenzene-d5 75
SPECTRA LABORATORIES
Steve Hibbs, LabOl'lltory Manager al4/sgh
SM5540C
SM 5210
Method
SW846 82608
SW846 82608
EPA 624
SW846 8270C
Project: Y elm Groundwater Monitoring Client ID: SC13 FD Sample Matrix: Water
Date Sampled: 09/05/2002 Date Received: 09/05/2002 Spectra Project: 2002090031 Spectra Number: 13
Analyte Result Units Method Bromide < 0.1 mg!L SM4500-Br-B
Chloride 49 mg/L SM4500CL-C
Dissolved Organic Carbon 10 mg/L EPA415.1
Fluoride 0.02 mg/L EPA 340.2
Nitrate 3.17 mg/L-N SM4500N03D
Nitrite < 0.01 mg/L-N SM4500N02B
Sulfate 6 mg/L EPA 375.4
Total Dissolved Solids 180 mg/L EPA !60.1
Surrogate Recovery Method
2·Fiuorobiphenyl 97 SW846 8270C
p-.Terphenyl-dl4 96 SW846 8270C
Page 13 of 13

.~TER ~ MANAGEMENT
- LABORATORIES INC.
September 9, 2002
Spectra Laboratories, Inc. 2221 Ross Way Tacoma, W A 98421 Attn: Steve Hibbs
Dear Sir:
1515 80th St. E. Tacoma. WA 98404 (253) 531-3121
Results of analysis of thirteen environmental water samples taken on 09-05-02 and received on 09-05-02 at 4:15p.m. are as follows:
Project: 2002090031- Skillings- Connolly
Fecal Fecal Sample Coliform Streptococcus
Identification (per 100 mls) (per 100 mls)
01, 10:20 < 2* 2
02,08:30 < 2* 140
03,09:15 < 2* < 2*
04,09:45 < 2* < 2*
05, 11:00, < 2* < 2*
06, 11:30 < 2* < 2*
07, 12:15. < 2* < 2*
08, 10:50- < 2* < 2*
09, 13:00 40 310
10, 13:15 40 32
•
•
•

•
•
•
Spectra Laboratories, Inc. September 9, 2002 Page 2
Sample Identification
11, 13:30
12, 13:45
13,09:15
* < is less than
Fecal Coliform
(per 100 mls)
< 2*
18
< 2*
Lab Number: 08974806 through 08974818
Fecal Streptococcus (per 100 mls)
< 2*
12
< 2*
Samples were analyzed by membrane f!ltration procedure according to Standard Methods for the Examination of Water and Wastewater, 19th Edition and EPA Microbiological Methods for Monitoring the Environment .
Chain of custody record is enclosed.
Sincerely,
~~ ~Al'V\_J Diane DuMond Microbiologist
DD:lcc enclosure
R:\COMM\SPECTRALABS9-5

SPECTRA Laboratories, Inc. • 2221 Ross Way • Tacoma, WA 98421
01115/2003
Skillings-Connolly, Inc. PO Box 5080 Lacey, W A 98509 Attn: Patrick Skillings
Analyte Result Units Method Arsenic <5 ug/L EPA 206.2
Boron 200 ug/L EPA 200.7
Cadmium <3 ug/L EPA 200.7
Chromium 13 ug/L EPA200.7
Copper 8 ug/L EPA 200.7
Iron < 15 ug/L EPA 200.7
Lead <I ug/L EPA 239.2
Manganese <2 ug/L EPA 200.7
Mercury <0.0005 ug/L EPA 245.1
Nickel < 15 ug/L EPA 200.7
Silver <7 ug/L EPA 200.7
Zinc 15 ug/L EPA 200.7
-Bromodichloromethane <I ug/L EPA 624
-Bromoform <I ug/L EPA 624
Caffeine <10 ug/L EPA 625
.Chlorodibromometbane <I ug/L EPA 624
'Chloroform <I ug/L EPA 624
N-Nitrosodimetbylamine <10 ug/L EPA 625
Fecal Coliform <2 1100 Membrane
Fecal Streptococcus <2 /100 Membrane
TKN <1.0 mg/L SM 4500-N-B
Anunonia < 0.1 mg/L-N EPA 350.3
Surrogate Recovery Method
Dibromofluoromethane 101 EPA 624
4-Bromofluorobenzene IOJ EPA 624
Nitrobenzene-d5 73 EPA 625
• (253) 272-4850 •
Project: Client ID: Sample Matrix:
Date Sampled: Date Received:
Fax(253)572-9838
Y elm Groundwater Monitoring SCI CW Water
12/05/2002
12/05/2002 Spectra Project: 2002120056 Spectra Number: 1
Analyte Result Units Method Anionic Surf. as MBAS <0.05 mg/L SM5540C
BOD <2 mg/L EPA 405.1
Bromide <0.1 mg/L SM4500-Br-B
Chloride 8 mg/L SM4500CL-C
Dissolved Organic Carbon 7 mg/L EPA415.1
Fluoride <0.2 mg!L EPA 340.2
Nitrate 3.2 mg/L-N SM4500N03D
Nitrite <0.01 mg/L-N SM4500NO. Sulfate 4 mg/L EPA 375.
Total Dissolved Solids 68 mg/L EPA 160.1
Surrogate Recovery Method
Toluene-d8 97 EPA 624
2-Fluorobiphenyl 69 EPA 625
p-Terphenyl-d14 91 EPA 625
SPECTRA LABORATORIES •
Manager Page 1 of 13 a14/scj
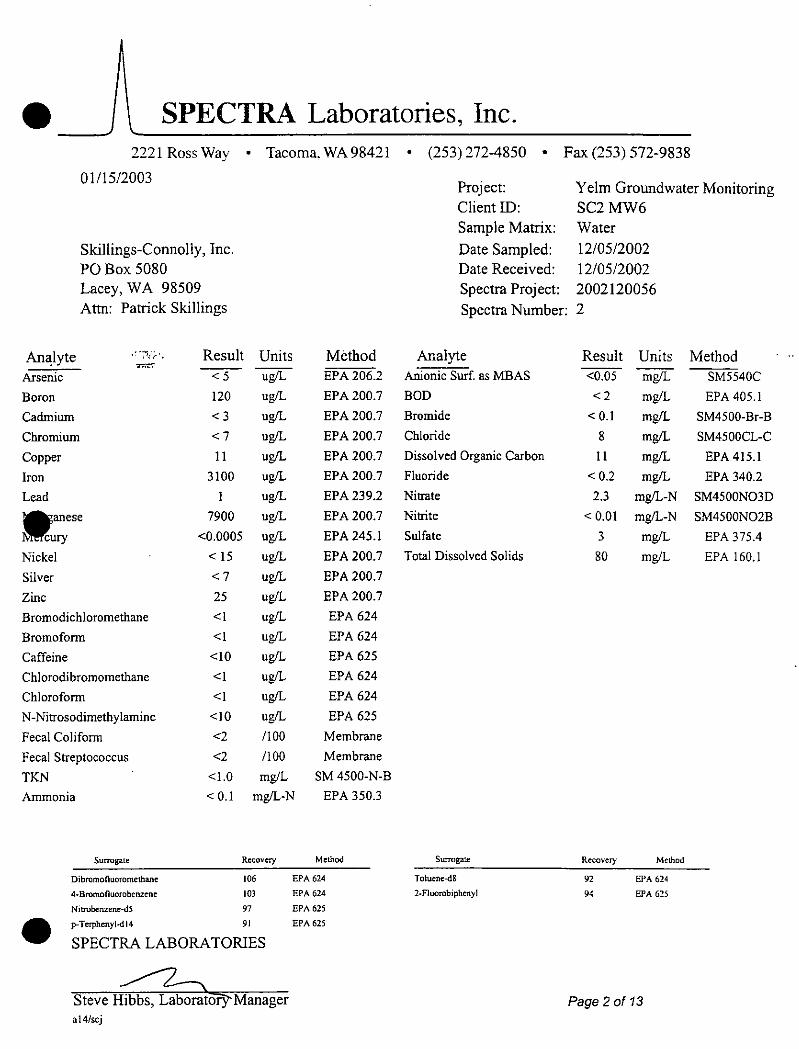
• SPECTRA Laboratories, Inc . ---'
2221 Ross Way • Tacoma. WA 98421 • (253) 272-4850 • Fax (253) 572-9838
01/15/2003
Skillings-Connolly, Inc. POBox 5080 Lacey, WA 98509 Attn: Patrick Skillings
Anl!lyte .· '';')/.~ .. Result = Arsenic <5
Boron 120
Cadmium <3
Chromium <7
Copper II
Iron 3100
Lead I
-anese 7900
ury <0.0005
Nickel < 15
Silver <7
Zinc 25
Bromodichloromethane <I
Bromoform <I
Caffeine <10
Chlorodibromomethane <I
Chloroform <I
N-Nitrosodimethylamine <10
Fecal Coliform <2
Fecal Streptococcus <2
TKN <1.0
Units Method ug/L EPA206.2
ug/L EPA 200.7
ug/L EPA 200.7
ug/L EPA200.7
ug/L EPA 200.7
ug!L EPA 200.7
ug/L EPA 239.2
ug/L EPA 200.7
ug!L EPA 245.1
ug/L EPA 200.7
ug/L EPA200.7
ug/L EPA 200.7
ug!L EPA 624
ug!L EPA 624
ug!L EPA 625
ug!L EPA 624
ug!L EPA 624
ug!L EPA 625
/100 Membrane
/100 Membrane
mg/L SM 4500-N-B
Ammonia < 0.1 mg/L-N EPA 350.3
Surrogate Recovery Method
Dibromofluoromethane 106 EPA 624
4·Bromofluorobenzene 103 EPA 624
Nitrobenzene-d5 97 EPA 625 • p-Terphcnyl-dl4 91 EPA 625
SPECTRA LABORATORIES
Manager al4/scj
Project: Client ID: Sample Matrix:
Date Sampled: Date Received:
Y elm Groundwater Monitoring SC2MW6 Water 12/05/2002 12/05/2002
Spectra Project: 2002120056 Spectra Number: 2
Analyte Result Units Method --
Anionic Surf. as MBAS <0.05 mg!L SM5540C
BOD <2 mg/L EPA 405.1
Bromide < 0.1 mg!L SM4500-Br-B
Chloride 8 mg!L SM4500CL-C
Dissolved Organic Carbon II mg!L EPA 415.1
Fluoride <0.2 mg!L EPA 340.2
Nitrate 2.3 mg!L-N SM4500N03D
Nitrite < 0.01 mg!L-N SM4500N02B
Sulfate 3 mg!L EPA 375.4
Total Dissolved Solids 80 mg!L EPA 160.1
Swrogate Recovery Method
Toluene-d8 92 EPA 624
2·Fiuorobiphenyl 94 EPA 625
Page 2 of 13

SPECTRA Laboratories, Inc. • 2221 Ross Way • Tacoma, WA 98421 • (253) 272-4850 • Fax (253) 572-9838
01115/2003
Skillings-Connolly, Inc. PO Box 5080 Lacey, W A 98509 Attn: Patrick Skillings
Analyte ·Result · Units Method Arsenic <5 ug/L EPA 206.2
Boron 95 ug/L EPA 200.7
Cadmium <3 ug/L EPA 200.7
Chromium <7 ug/L EPA200.7
Copper <6 ug/L EPA 200.7
Iron 1300 ug/L EPA 200.7
Lead <I ug/L EPA239.2
Manganese 170 ug/L EPA 200.7
Mercury <0.0005 ug/L EPA 245.1
Nickel < 15 ug/L EPA 200.7
Silver <7 ug!L EPA200.7
Zinc 15 ug/L EPA 200.7
Bromodichloromethane <I ug/L EPA 624
Bromoform <I ug/L EPA 624
Caffeine <10 ug/L EPA 625
Chlorodibromomethane <I ug/L EPA 624
Chloroform <I ug/L EPA624
N-Nitrosodimethylamine <10 ug!L EPA 625
Fecal Coliform 34 /100 Membrane
Fecal Streptococcus 6 /100 Membrane
TKN <1.0 mg/L SM 4500-N-B
Ammonia < 0.1 mg/L-N EPA 350.3
Surrogate Recovery Method
Dibromotluoromethane 104 EPA 624
4-Bromofluorobenzene 104 EPA 624
Nitrobenzem;:-d5 81 EPA 625
101 EPA 625
Project: Client ID: Sample Matrix:
Date Sampled: Date Received: Spectra Project:
Spectra Number:
Analyte Anionic Surf. as MBAS
BOD
Bromide
Chloride
Dissolved Organic Carbon
Fluoride
Nitrate
Nitrite
Sulfate
Total Dissolved Solids
Surrogate
Toluene-dB
2-Fluorobiphenyl
Y elm Groundwater Monitoring SC3 MWl Water
12/05/2002
12/05/2002 2002120056 3
Result Units Method <0.05 mg!L SM5540C
<2 mg!L EPA 405.1
<0.1 mg!L SM4500-Br-B
7 mg!L SM4500CL-C
9 mg!L EPA 415.1
<0.2 mg!L EPA 340.2
3.8 mg!L-N SM4500N03D
<0.01 mg!L-N SM4500N02. 2 mg!L EPA 375.4
71 mg!L EPA 160.1
Recovery Method
92 EPA 624
86 EPA 625
p-Terphenyl-dl4
SPECTRA LABORATORIES •
Steve Hibbs, Laboratory Manager a14/scj
Page 3 of 13

• SPECTRA Laboratories, Inc . 2221 Ross Way • Tacoma, WA98421 • (253) 272-4850 • Fax (253) 572-9838
01115/2003
Skillings-Connolly, Inc. PO Box 5080 Lacey, WA 98509 Attn: Patrick Skillings
Analyte ··:£::~ Result ·Units Method Arsenic <5 ug!L EPA 206.2
Boron 55 ug!L EPA200.7
Cadmium <3 ug!L EPA 200.7
Chromium <7 ug!L EPA 200.7
Copper <6 ug!L EPA 200.7
Iron 95 ug/L EPA200.7
Lead <I ug/L EPA 239.2
•;ese <2 ug/L EPA 200.7
<0.0005 ug/L EPA245.1
Nickel < 15 ug!L EPA200.7
Silver <7 ug!L EPA 200.7
Zinc 19 ug!L EPA 200.7
Bromodichloromethane <I ug/L EPA 624
Bromoform <I ug!L EPA 624
Caffeine <10 ug!L EPA 625
Chlorodibromomethane <I ug!L EPA 624
Chloroform <I ug!L EPA 624
N-Nitrosodirnethylamine <10 ug!L EPA 625
Fecal Colifonn <2 1100 Membrane
Fecal Streptococcus 4 /100 Membrane
TKN <1.0 mg!L SM 4500-N-B
Ammonia < 0.1 mg/L-N EPA 350.3
• Surrogate Recovery
Dibromofluoromethane 107
4-Bromofluorobenzene 102
Nirrobenzene-d5 86
p-Terphenyl-d\4 97
SPECTRA LABORATORIES
Steve Hibbs, Laboratory Manager al4/scj
Method
EPA 624
EPA 624
EPA 625
EPA 625
Project: Client ID: Sample Matrix:
Date Sampled: Date Received: Spectra Project:
Y elm Groundwater Monitoring SC4MW2 Water 12/05/2002 12/05/2002 2002120056
Spectra Number: 4
Analyte Result Units Method --
Anionic Surf. as MBAS <0.05 mg!L SM5540C
BOD <2 mg/L EPA 405.1
Bromide <0.1 mg!L SM4500-Br-B
Chloride 14 mg!L SM4500CL-C
Dissolved Organic Carbon 9 mg!L EPA415.1
Fluoride <0.2 mg!L EPA 340.2
Nitrate 4.4 mg!L-N SM4500N03D
Nitrite <0.01 mg/L-N SM4500N02B
Sulfate 9 mg/L EPA 375.4
Total Dissolved Solids 114 mg!L EPA 160.1
Surrogate Recovery Method
Tolume-d8 95 EPA 624
2-Fluorobiphenyl 85 EPA 625
Page 4 of13

SPECTRA Laboratories, Inc. • 2221 Ross Way • Tacoma, WA 98421
01115/2003
Skillings-Connolly, Inc. PO Box 5080 Lacey, W A 98509 Attn: Patrick Skillings
Analyte Result Units Method· Arsenic --zs ug/L EPA 206.2
Boron 210 ug/L EPA 200.7
Cadmium <3 ug/L EPA 200.7
Chromium <7 ug/L EPA 200.7
Copper <6 ug/L EPA200.7
iron 380 ug/L EPA200.7
Lead <I ug/L EPA 239.2
Manganese 16 ug/L EPA 200.7
Mercury <0.0005 ug/L EPA 245.1
Nickel < 15 ug/L EPA 200.7
Silver <7 ug/L EPA200.7
Zinc 15 ug/L EPA 200.7
Bromodichloromethane <I ug/L EPA 624
Bromoform <I ug/L EPA 624
Caffeine <10 ug/L EPA 625
Chlorodibromomethane <I ug/L EPA624
Chloroform <I ug/L EPA 624
N-Nitrosodimethylamine <10 ug/L EPA 625
Fecal Coliform <2 /100 Membrane
Fecal Streptococcus 2 1100 Membrane
TKN <1.0 mg/L SM 4500-N-B
Ammonia < 0.1 mg/L-N EPA 350.3
Surrogate Recovery Method
Dibromofluoromethane 106 EPA 624
4-Bromofluorobcnzene 103 EPA 624
Nitrobcllzene-d5 87 Ef'A 625
• (253) 272-4850 •
Project: Client ID: Sample Matrix:
Date Sampled: Date Received: Spectra Project:
Fax (253) 572-9838
Y elm Groundwater Monitoring SC5 MW3 Water
12/05/2002 12/05/2002 2002120056
Spectra Number: 5
Analyte Result Units Method Anionic Surf. as MBAS <0.05 mg/L SM5540C
BOD <2 mg/L EPA 405.1
Bromide 0.2 mg/L SM4500-Br-B
Chloride 43 mg/L SM4500CL-C
Dissolved Organic Carbon 9 mg/L EPA 415.1
Fluoride <0.2 mg/L EPA 340.2
Nitrate 2.8 mg/L-N SM4500N03D
Nitrite < 0.01 mg/L-N SM4500NOit Sulfate 9 mg/L EPA 375.
Total Dissolved Solids 195 mg/L EPA 160.1
Surrogate Recovery Method
Toluene-<18 94 EPA 624
2-Fluorobiphenyl 85 EPA 625
p-Terpbenyl-d14 95 EPA 625
SPECTRA LAB ORA TORIES •
Steve Hibbs, Laboratory Manager al4/scj
Page 5 of 13

•-_J SPECTRA Laboratories, Inc. 2221 Ross Way • Tacoma. WA 98421
01115/2003
Skillings-Connolly, Inc. PO Box 5080 Lacey, W A 98509 Attn: Patrick Skillings
Analyte Result Units Method· Arsenic
Boron
Cadmium
Chromium
Copper
Iron
Lead
xese
Nickel
Silver
Zinc
Bromodichloromethane
Bromoform
Caffeine
Chlorodibromomethane
Chloroform
N-Nitrosodimethylarnine
Fecal Coliform
Fecal Streptococcus
TKN
Ammonia
Surrogate
Dibromofluoromethane
4-Bromofluorobenzene
Nitrobenzene..dS
p-Terphenyl-dl4
< 0.005
280
<3
<7
<6
450
<I
15
<0.0005
< 15
<7
18
<I
<I
<10
<1
<10
<2
8
<1.0
< 0.1
ug!L EPA 206.2
ug!L EPA 200.7
ug!L EPA200.7
ug!L EPA200.7
ug!L EPA200.7
ug!L EPA200.7
ug!L EPA239.2
ug!L EPA 200.7
ug!L EPA 245.1
ug!L EPA200.7
ug!L EPA200.7
ug!L EPA200.7
ug!L EPA 624
ug!L EPA 624
ug!L EPA 625
ug!L EPA 624
ug!L EPA 624
ug!L EPA 625
1100 Membrane
/100 Membrane
mg!L SM 4500-N-B
mg!L-N EPA 350.3
Recovery Method
93 EPA 624
104 EPA 624
65
101
EPA 625
EPA 625 • SPECTRA LABORATORIES
Steve Hibbs, Laboratory Manager a14/scj
• (253)272-4850 •
Project: Client ID: Sample Matrix:
Date Sampled: Date Received:
Fax (253) 572-9838
Yelm Groundwater Monitoring SC6MW4 Water 12/05/2002 12/05/2002
Spectra Project: 2002120056 Spectra Number: 6
Analyte Anionic Surf. as MBAS
BOD
Bromide
Chloride
Dissolved Organic Carbon
Fluoride
Nitrate
Nitrite
Sulfate
Total Dissolved Solids
Surrogate
Toluene-d8
2-Fiuorobiphenyl
Result Units Method <0.05 mg!L SM5540C
<2 mg!L EPA 405.1
<0.1 mg!L SM4500-Br-B
62 mg!L SM4500CL-C
12 mg!L EPA415.1
<0.2 mg!L EPA340.2
1.0 mg!L-N SM4500N03D
< 0.01 mg!L-N SM4500N02B
20 mg!L EPA 375.4
242 mg!L EPA 160.1
Recovery Method
94 EPA 624
71 EPA 625
Page 6 of 13

SPECTRA Laboratories, Inc. • 2221 Ross Way • Tacoma, WA 98421
01115/2003
Skillings-Connolly, Inc. PO Box 5080 Lacey, WA 98509 Attn: Patrick Skillings
Analyte .. ; ·Result Units Method Arsenic ----:cs ug!L EPA 206.2
Boron 100 ug!L EPA200.7
Cadmium <3 ug!L EPA 200.7
Chromium <7 ug!L EPA 200.7
Copper <6 ug!L EPA 200.7
Iron 380 ug!L EPA200.7
Lead <I ug!L EPA 239.2
Manganese 13 ug!L EPA 200.7
Mercury <0.0005 ug!L EPA 245.1
Nickel < 15 ug!L EPA200.7
Silver <7 ug!L EPA 200.7
Zinc 18 ug!L EPA 200.7
Bromodichloromethane <I ug!L EPA 624
Bromoform <I ug!L EPA 624
Caffeine <10 ug!L EPA 625
Chlorodibromomethane <I ug!L EPA624
Chloroform <I ug!L EPA 624
N-Nitrosodimethylamine <10 ug!L EPA 625
Fecal Coliform <2 1100 Membrane
Fecal Streptococcus 2 /100 Membrane
TKN <1.0 mg!L SM4500-N-B
Ammonia < 0.1 mg!L-N EPA 350.3
Surrogate Recovery Method
Dibromofluoromethane 92 EPA 624
4-Bromofluorobenzene 105 EPA 624
Nitrobenzene-d5 90 EPA 625
p-Terpheny!-d 14 98 EPA 625
SPECTRA LABORATORIES
Manager al4/scj
• (253) 272-4850 •
Project: Client ID:
Fax (253) 572-9838
Y elm Groundwater Monitoring SC7MW5
Sample Matrix: Water
Date Sampled: 12/05/2002 Date Received: Spectra Project:
12/05/2002 2002120056
Spectra Number: 7
Analyte Result Units Anionic Surf. as MBAS <0.05 mg!L
BOD 2 mg!L
Bromide < 0.1 mg!L
Chloride 14 mg!L
Dissolved Organic Carbon 9 mg!L
Fluoride <0.2 mg!L
Nitrate 3.4 mg/L-N
Nitrite < 0.01 mg!L-N
Sulfate 5 mg!L
Total Dissolved Solids 99 mg!L
Surrogate Recovery Method
Toluene-dB 94 EPA 624
2-Fluorobiphenyl 91 EPA 625
Page 7 of 13
Method SM5540C
EPA405.1
SM4500-Br-B
SM4500CL-C
EPA415.1
EPA 340.2
SM4500N03D
SM4500NO~ EPA 375.
EPA 160.1
•

•---- SPECTRA Laboratories, Inc. 2221 Ross Way
01/15/2003
• Tacoma, WA98421
Skillings-Connolly, Inc. PO Box 5080 Lacey, W A 98509 Attn: Patrick Skillings
Analyte Result -- ---Arsenic <5
Boron 380
Cadmium <3
Chromium 8
Copper 6
Iron 29
Lead <I
-~ese 14
<0.0005
Nickel < 15
Silver <7
Zinc 64
Bromodichlorometbane 6
Bromoform <I
Caffeine <10
Chlorodibromomethane <I
Chloroform 24
N-Nitrosodimethylamine <10
Fecal Coliform <2
Fecal Streptococcus <2
TKN <1.0
Units Metbod ug!L EPA 206.2
ug/L EPA200.7
ug!L EPA200.7
ug!L EPA200.7
ug!L EPA200.7
ug!L EPA200.7
ug!L EPA239.2
ug!L EPA200.7
ug!L EPA245.1
ug!L EPA200.7
ug!L EPA 200.7
ug/L EPA 200.7
ug/L EPA 624
ug!L EPA 624
ug!L EPA 625
ug!L EPA 624
ug!L EPA 624
ug!L EPA 625
/100 Membrane
/100 Membrane
mg!L SM 4500-N-B
Ammonia <0.1 mg!L-N EPA 350.3
Surrogate Recovery Method
Dibromofluoromethane 88 EPA 624
4-Bromofluorobenzene 102 EPA 624
Nitrobenzene-d5 79 EPA 625
• p-Terphenyl-d 14 99 EPA 625
SPECTRA LABORATORIES
Manager al4/scj
• (253) 272-4850 •
Project: Client ID: Sample Matrix:
Date Sampled: Date Received: Spectra Project:
Fax (253) 572-9838
Yelm Groundwater Monitoring SC8 IS Water 12/05/2002 12/05/2002 2002120056
Spectra Number: 8
Analyte Result Units Method ---- ----
Anionic Surf. as MBAS 0.33 mg/L SM5540C
BOD <2 mg!L EPA 405.1
Bromide < 0.1 mg!L SM4500-Br-B
Chloride 57 mg/L SM4500CL-C
Dissolved Organic Carbon 15 mg/L EPA415.1
Fluoride < 0.2 mg!L EPA 340.2
Nitrate 12.8 mg!L-N SM4500N03D
Nitrite < 0.01 mg/L-N SM4500N02B
Sulfate 25 mg/L EPA 375.4
Total Dissolved Solids 305 mg/L EPA 160.1
Surrogate Recovery Method
Toluene-d8 91 EPA 624
2-Fluorobiphenyl 84 EPA 625
Page 8 of 13

SPECTRA Laboratories, Inc. • 2221 Ross Way • Tacoma, WA 98421
01/15/2003
Skillings-Connolly, Inc. PO Box 5080 Lacey, W A 98509 Attn: Patrick Skillings
An·alyte. Result Units Method Arsenic <5 ug/L EPA 206.2
Boron 350 ug/L EPA200.7
Cadmiwn <3 ug/L EPA 200.7
Chromiwn <7 ug/L EPA 200.7
Copper <6 ug/L EPA200.7
Iron 77 ug/L EPA 200.7
Lead <I ug/L EPA239.2
Manganese 21 ug/L EPA 200.7
Mercury <0.0005 ug/L EPA245.1
Nickel < 15 ug/L EPA200.7
Silver <7 ug/L EPA 200.7
Zinc 59 ug/L EPA200.7
Bromodichloromethane 5 ug/L EPA 624
Bromoform <I ug/L EPA 624
Caffeine <10 ug/L EPA 625
Chlorodibromomethane <I ug/L EPA624
Chloroform 21 ug/L EPA 624
N-Nitrosodimethylarnine <10 ug/L EPA 625
Fecal Coliform 24 /100 Membrane
Fecal Streptococcus 30 1100 Membrane
TKN <1.0 mg/L SM 4500-N-B
Ammonia 0.1 mg/L-N EPA 350.3
Surrogate Recovery Method
Dibromofluoromelhane 84 EPA 624
4-Bromofluorobenzene 104 EPA 624
Nitrobenzene -<iS 56 EPA 625
63 EPA 625
• (253) 272-4850 •
Project: Client ID: Sample Matrix:
Date Sampled: Date Received:
Fax(253)572-9838
Yelm Groundwater Monitoring SC9 CS1 Water 12/05/2002 12/05/2002
Spectra Project: 2002120056 Spectra Number: 9
Analyte Result Units .\.,Method Anionic Surf. as MBAS 0.25 mg/L SM5540C
BOD <2 mg/L EPA 405.1
Bromide < 0.1 mg/L SM4500-Br-B
Chloride 59 mg/L SM4500CL-C
Dissolved Organic Carbon 19 mg/L EPA 415.1
Fluoride <0.2 mg/L EPA 340.2
Nitrate 10.8 mg/L-N SM4500N03D
Nitrite 0.01 mg/L-N SM4500N02. Sulfate 27 mg/L EPA 375.4
Total Dissolved Solids 305 mg/L EPA 160.1
Surrogate Recovery Method
Toluene-dS 96 EPA 624
2-Fluorobipheny\ 59 EPA 625
p-Terpbenyl-d\4
SPECTRA LABORATORIES •
Page 9 of 13

• _ __, SPECTRA Laboratories, Inc . 2221 Ross Way • Tacoma, WA 98421
01/15/2003
Skillings-Connolly, Inc. PO Box 5080 Lacey, W A 98509 Attn: Patrick Skillings
Analyte Result Units· Method Arsenic <5 ug!L EPA 206.2
Boron 400 ug!L EPA 200.7
Cadmium <3 ug!L EPA200.7
Chromium 12 ug!L EPA200.7
Copper <6 ug!L EPA 200.7
Iron 100 ug!L EPA 200.7
Lead <I ug!L EPA 239.2
•;ese 29 ug!L EPA 200.7
<0.0005 ug!L EPA 245.1
Nickel < 15 ug!L EPA 200.7
Silver <7 ug!L EPA 200.7
Zinc 51 ug!L EPA 200.7
Bromodichloromethane ug!L EPA 624
Bromoform <I ug!L EPA 624
Caffeine <10 ug!L EPA 625
Chlorodibromomethane <I ug!L EPA 624
Chloroform 5 ug!L EPA 624
N-Nitrosodimethylamine <10 ug!L EPA 625
Fecal Coliform 12 /100 Membrane
Fecal Streptococcus 50 /100 Membrane
TKN <1.0 mg!L SM 4500-N-B
Ammonia 0.2 mg!L-N EPA 350.3
• Surrogate Recovery
Dibromofluoromethane 86
4-Bromofluorobenzene 102
Nitrobenzene-d5 72
p-Terphenyl-<114 77
SPECTRA LABORATORIES
Steve HibiJi,LlllJOfilt Manager a14/scj
Method
EPA 624
EPA 624
EPA 625
EPA 625
• (253) 272-4850 • Fax (253) 572-9838
Project: Client ID:
Y elm Groundwater Monitoring SC!O CS2
Sample Matrix: Water Date Sampled: I 2/05/2002 Date Received: I 2/05/2002 Spectra Project: 2002120056 Spectra Number: 1 0
Analyte Result Units Anionic Surf. as MBAS 0:29 mg!L
BOD 3 mg!L
Bromide <0.1 mg!L
Chloride 60 mg!L
Dissolved Organic Carbon 16 mg!L
Fluoride <0.2 mg!L
Nitrate 6.0 mg!L-N
Nitrite 0.01 mg!L-N
Sulfate 0.01 mg!L
Total Dissolved Solids 292 mg!L
Surrogate Recovery Method
Toluene-d8 94 EPA 624
2-Fiuorobiphenyl 72 EPA 625
Page 10 of 13
Method SM5540C
EPA 405.1
SM4500-Br-B
SM4500CL-C
EPA 415.1
EPA 340.2
SM4500N03D
SM4500N02B
EPA 375.4
EPA 160.1

SPECTRA Laboratories, Inc. • 2221 Ross Way o Tacoma, WA 98421
01/15/2003
Skillings-Connolly, lnc. PO Box 5080 Lacey, WA 98509 Attn: Patrick Skillings
Analyte ·Result Units Method Arsenic ----z-5 ug/L EPA206.2
Boron 460 ug/L EPA 200.7
Cadmium <3 ug/L EPA 200.7
Chromium <7 ug/L EPA 200.7
Copper <6 ug/L EPA 200.7
Iron < 15 ug/L EPA 200.7
Lead <I ug/L EPA 239.2
Manganese 2 ug/L EPA 200.7
Mercury 0.0006 ug/L EPA 245.1
Nickel < 15 ug!L EPA 200.7
Silver <7 ug/L EPA 200.7
Zinc 27 ug/L EPA200.7
Bromodichloromethane <I ug/L EPA 624
Bromoform <1 ug/L EPA 624
Caffeine <10 ug/L EPA 625
Chlorodibromometbane <I ug/L EPA 624
Chloroform 3 ug/L EPA 624
N-Nitrosodimethylamine <10 ug/L EPA 625
Fecal Coliform <2 /100 Membrane
Fecal Streptococcus <2 /100 Membrane
TKN <1.0 mg/L SM 4500-N-B
Ammonia < 0.1 mg/L-N EPA 350.3
Surrogate Recovery Method
Dibromofluoromethane 89 EPA 624
4-Bromofluorobenzene 108 EPA 624
Nitrobenzene-d5 50 EPA 625
0 (253) 272-4850 °
Project: Client ID:
Fax (253) 572-9838
Y elm Groundwater Monitoring SC11 CS3
Sample Matrix: Water
Date Sampled: Date Received:
12/05/2002 12/05/2002
Spectra Project: 2002120056 Spectra Number: 11
·Analyte Result Units Anionic Surf. as MBAS 0.18 mg!L
BOD <2 mg!L
Bromide < 0.1 mg/L
Chloride 61 mg!L
Dissolved Organic Carbon 20 mg/L
Fluoride <0.2 mg!L
Nitrate 5.3 mg/L-N
Nitrite < 0.01 mg/L-N
Sulfate 35 mg!L
Total Dissolved Solids 274 mg/L
Surrogate Recovery Method
Toluene-dB 97 EPA 624
2-Fluorob!phenyl 53 EPA 625
Method SM5540C
EPA 405.1
SM4500-Br-B
SM4500CL-C
EPA 415.1
EPA 340.2
SM4500N03D
SM4500NO. EPA 375.
EPA 160.1
p-Terphenyl..dl4 69 EPA 625
SPECTRA LABORATORIES •
Steve Hibbs, Laboratoiy Manager al4/scj
Page 11 of13

·-..-/ SPECTRA Laboratories, Inc. 2221 Ross Way • Tacoma, WA98421
01115/2003
Skillings-Connolly, Inc. PO Box 5080 Lacey, W A 98509 Attn: Patrick Skillings
Analyte •!·\: •. ·• -'. Result _JJ.:;,_ ___
---zs Arsenic
Boron 360
Cadmium <3
Chromium <7
Copper <6
Iron 75
Lead <I
~ese 49
<0.0005
Nickel < 15
Silver <7
Zinc 26
Bromodichloromethane <1
Bromoform <1
Caffeine <10
Chlorodibromomethane <1
Chloroform 2
N-Nitrosodimethylamine <10
Fecal Coliform 200
Fecal Streptococcus 550
Units Method ..
ug!L EPA 206.2
ug!L EPA 200.7
ug!L EPA 200.7
ug!L EPA 200.7
ug!L EPA 200.7
ug!L EPA200.7
ug!L EPA 239.2
ug!L EPA 200.7
ug!L EPA 245.1
ug!L EPA 200.7
ug!L EPA 200.7
ug!L EPA 200.7
ug!L EPA 624
ug!L EPA624
ug!L EPA 625
ug!L EPA624
ug!L EPA 624
ug!L EPA 625
1100 Membrane
1100 Membrane
TKN <1.0 mg!L SM 4500-N-B
Ammonia 0.2 mg/L-N EPA 350.3
Surrogate Recovery Method
Dibromofluoromethane " EPA 624
4-Bromofluorobenzene 106 EPA 624
Nitrobenzene-d5 72 EPA 625
p-.Terpbenyl-d14 74 EPA 625
• SPECTRA LABORATORIES
• (253) 272-4850 • Fax (253) 572-9838
Project: Client ID:
Y elm Groundwater Monitoring SC12 CS4
Sample Matrix: Water
Date Sampled: 12/05/2002 Date Received: 12/0512002 Spectra Project: 2002120056 Spectra Number: 12
·Ana1yte Result Units Anionic Surf. as MBAS .. 0.20 mg!L
BOD <2 mg!L
Bromide < 0.1 mg!L
Chloride 62 mg!L
Dissolved Organic Carbon 14 mg!L
Fluoride <0.2 mg!L
Nitrate 3.8 mg!L-N
Nitrite < 0.01 mg!L-N
Sulfate 34 mg!L
Total Dissolved Solids 286 mg!L
Surrogate Recovery Method
Toluene-dB 96 EPA 624
2-Fiuorobiphenyl 74 EPA 625
Page 12of13
Method SM5540C
EPA 405.1
SM4500-Br-B
SM4500CL-C
EPA 415.1
EPA 340.2
SM4500N03D
SM4500N02B
EPA 375.4
EPA 160.1

SPECTRA Laboratories, Inc. • 2221 Ross Way • Tacoma, WA 98421 • (253) 272-4850 • Fax (253) 572-9838
01/15/2003
Skillings-Connolly, Inc. PO Box 5080 Lacey, W A 98509 Attn: Patrick Skillings
Analyte Result Units Method Arsenic ---zs- ug/L EPA 206.2
Boron 240 ug/L EPA 200.7
Cadmium <3 ug/L EPA 200.7
Chromium 9 ug/L EPA 200.7
Copper 7 ug/L EPA 200.7
Iron < 15 ug/L EPA 200.7
Lead < 1 ug/L EPA 239.2
Manganese <2 ug/L EPA 200.7
Mercury <0.0005 ug/L EPA 245.1
Nickel < 15 ug/L EPA 200.7
Silver <7 ug/L EPA 200.7
Zinc 19 ug/L EPA 200.7
Bromodichloromethane <1 ug/L EPA 624
Bromoform <1 ug/L EPA 624
Caffeine <10 ug/L EPA 625
Chlorodibromomethane <1 ug/L EPA 624
Chloroform <1 ug/L EPA 624
N-Nitrosodimethylamine <10 ug/L EPA 625
Fecal Coliform <2 1100 Membrane
Fecal Streptococcus <2 /100 Membrane
TKN <1.0 mg/L SM 4500-N-B
Anunonia < 0.1 mg/L-N EPA 350.3
Surrogate Recovery
Dibromofluoromethane 95
4-Bromofluorobenzene 100
Nitrobenzene.d5 8J
p-Terphenyl-d14 78
SPECTRA LABORATORIES
Steve Hibbs, Laboratory Manager ai4/scj
Method
EPA 624
EPA 624
EPA 625
EPA 625
Project: Client ID: Sample Matrix:
Date Sampled: Date Received:
Yelm Groundwater Monitoring SC13 FD Water 12/05/2002 12/05/2002
Spectra Project: 2002120056 Spectra Number: 13
Analyte Anionic Surf. as MBAS
BOD
Bromide
Chloride
Dissolved Organic Carbon
Fluoride
Nitrate
Nitrite
Sulfate
Total Dissolved Solids
Surrogate
Toluene-dS
2-Fiuorobiphenyl
Result <0.05
<2
< 0.1
8
6
< 0.2
3.2
<0.01
5
75
Recovery
95
77
Units mg/L
mg/L
mg/L
mg/L
mg/L
mg/L
mg/L-N
mg/L-N
mg/L
mg/L
Method
EPA 624
EPA 625
Page 13 of 13
Method SM5540C
EPA 405.1
SM4500-Br-B
SM4500CL-C
EPA 415.1
EPA 340.2
SM4500N03D
SM4500N02B
EPA375 .•
EPA 160.1
•

A'WATER ~ MANAGEMENT
- LABORATORIES INC.
1515 80th St. E. Tacoma, ~A 98404 (253) 531-3121
•
•
December 13, 2002
Spectra Laboratories, Inc. 2221 Ross Way Tacoma, WA 98421 Attn: Steve Hibbs
Dear Sir:
Results of analysis of thirteen environmental water samples taken on 12-05-02 and received on 12-05-02.at 1:15 p.m. are as follows:
Project: 2002120056 - Skillings - Connolly
Fecal Fecal Sample Coliform Streptococcus
Identification (per 100 mls) (per 100 mls)
01, 10:10 < 2* < 2* split sample < 2* < 2*
02,08:00 < 2* < 2*
03, 08:35 34 6
04, 09:05 < 2* 4
05, 09:30 < 2* 2
06, 09:55 < 2* 8
07, 10:45 < 2* 2 split sample < 2* 2
08, 10:40 < 2* < 2*
09, 11:15 24 30 split sample 20 34
10, 11:30 12 50

Spectra Laboratories, Inc. December 11, 2002 Page 2
Sample Identification
11, 11:50
12, 12:05
13, 10:10
* < is less than
Fecal Coliform
(per 100 mls)
< 2*
200
< 2*
Lab Number: 08983078 through 08983090
Fecal Streptococcus (per 100 mls)
< 2*
550
< 2*
Samples were analyzed by membrane filtration procedure according to Standard Methods for the Examination of Water and Wastewater, 19th Edition and EPA Microbiological Methods for Monitoring the Environment.
Chain of custody record is enclosed.
Sincerely,
Diane DuMond Microbiologist
DD:lcc enclosure
R:\COMM\SPECTRALABS12-5
•
•
•

. ·---· ... ,, ________ _
• ./ SPECTRA Laboratories
;, ..
2221 Ross Way • Tacoma, WA98421 • . (253) 272-4850 • Fax (253) 572-9838
04108/2003 Project: Y elm GW Monitoring ClicntiD: SClCW Sample Matrix: Water
Slcillings-Counolly, Inc. Date Samplc:d: 03/0612003 POBoxSOSO Data Received: 03/0612003 Lacey, WA 98509 Spectra Project 2003030069 Attn: Patrick Slcillings Spectra Number: 1
Analyte Result Units Mctbod Analytc R.csult UDi.IS Mcdlod Tolal Diaolvecl. Salida 95 maiL BPA 160.1 N-N".tiOWlmtthyiamiDe <iO 1ii'L BPA625
BoJOD -45 us/L EPA200.7 Feoal Colifaral <l /100 Memhnne
Cadmium <3 oWL BPA200.7 .Pccal Stiepl C Q CCIII <2 /100 Membrllle Chromium <7 ~ BPA200.7 TKN 1.4 maiL SM45QO-N-B
Copper 10 uWL EPA200.7 BOD <:Z mg/L SM5210 • Iron <15 . uaiL BPA:Z00.7 Bromide <0.1 mg/L SMo4~Br-B
Mat1S"" '"" 6 ug/L BPA200.7 Chloride 8.5 ,.,;r. SM4SOOCL-C Nickel <15 usiL EPA200.7 . Nitrito <0.01 JDWL.N SM4500N02E Silver <7 uaiL EPA200.7 N"- 3.1 JDWL.N SM4500N03I
~ Zinc <6 uaiL I!PA200.7 .ADioaic ~ • MBAS 0.04 maiL SM$540C
' .•. AneDk: <S u&'L BPA206.2
Load <1 uaiL BPA239.2
. , Mercury .. <O.S uJIL I!PA245.1
I'l..Oride <0.2 maiL EPA340.2 . Ammonia <0.1 JDWL.N BPA3S0.3
i} Sullatc 3 mg/L EPA37$.~
•.: Dissolved OrpDic Carbon 6 m&'L I!PA41S.l ~-: . '·'
;:-:: Brm!Ocfjchlommefttme <1 u&'L BPA624
:~1 Blomofoiw <1 UWL BPA624
~ <1 uWL EPA624 ··-:..
Ollon>form ·,: <1 uaiL BPA624
~-:-Caffeine <10 oWL EPA62.S
·:·-
~---· - - - - - -I :Ill 111'.\614 ,_ 101 ....... .. , .. 111'.\614 UIL:uu I 0 2 yt ,. ....... • M"llll dS !II !PA6U
.. T-'"<!14 10 I!I'AW
SPECTRA LABORATORIES
s_,~d~'%~ Mnna~er Par/01of13 d m6SL9ZS9 'ON/0~: ~~ 'lS/IZ: II vOOZ Sl 8nV(I~d) wo~:

. ···-···-·· ···--
• SPECTRA Laboratories
2221 Ross Way • Tacoma, WA98421 • (253) 272-4850 • Fax (253) 572-9838
.. ~ i
~ .;
'
'• ·.:
..
Analyte
04/0812003
Skillings-Connolly, Inc. POBoxS080 Lacey, WA 98509 Attn: P~ck Sk:illinas
~ult
Total Dilcolved SolldJ "'128 Boron 23
Cadmium <~
Cbmmlmn <7
Copper 9 Iron 57
M•Dp"ese 48
Nickel <15
Silver <7
ZiDc: <6
Anenlc <5
Lead <I Memuy <0.5
Pluorlclo <0.2
Ammonia <0.1
Sul&te 3
Units JiiiiL
ug/L
uaiL uaiL ug/L ug/L
uaiL ug/L
uWL uaiL ug/L
aWL UWL lug/L
mafL-N lug/L
OlaoiYed Orpaic, Catboll -~::9.<'•'' mgiL.
B~ <I ug/L
Btomoform <I uaiL
Method EPA 160.1
BPA200.7
BPA200.7
EPA200.7
BPA200.7
BPA200.7
BPA200.7
EPA 200.7
BI'A200.7
BPA200.7
BPA206.l
EPA239.l
BPA245.1
BPA340.l
BPA3S0.3
BPA37S.4
EPA 415.1
BPA624
EPA624
·:'~ <I ug/L EPA624 ., Cbltm>ibnll <I qiL 8PA6l4
'· ' c.tJ'ellle <10 ug/L EPA62S
.. :~ - _, -.ad
o• Gull 112 BPA614 .... U n ' - 1113 BPA614 NiL . .. TJ BPAIW
p-Tw.....,l-414 7'1 ISPAW
Sl'BCTRA LABORATORIES ·
Stevc~~MSDBger ••' .
Project: Yelm GW MOIIitorin& Client ID: SC2 MW6 Sample Matrix: Water Dato Sampled: 03/06/2003 Dato Received: 03/0612003 Spectra Project; 2003030069 Spectra Nmnber: 2
Analyte Result Units N-Nilmoodimctbylamillc: <iO Ui'[" Fecal ColifoiDl <2 /100
FeCI! Slreptocoecul 44 /100 TICN <1.0 mwL BOD <2 llllfL BlOIIlide <0.1 msiL Chloride 10.7 mwL Nilri10 <0.01 mWLN Nllrllle 3.5 msfL-N Anionic Surf. 111 MBAS <0.02 mwL
~:;:·.; ~ ..
- - -- 101 ........ ~ 1>1 I!PAW
Pllge 2 Df 13
Method EPA 62S
MCII!braae
Mambnae SM 4.5()().N·B
SMS210
SM4S~ SM45 SM4500N02B
SM4500N03D SM5S40C
. ' .
• I d VGS69L9Z£9'0N/OZ:WlS/lZ:lliOOI 8l ~nV(I~J) WO~J

SPECTRA Laboratories 2221 Ross Way • Ta4:oma, WA98421 • (253) 272-4850 • Fax (253) 512·9838
Analyte
04/08/2003
Skillings-Comolly, Inc. POBoxS080 Lacey, W A 98509 Attn: Patridc Skillings
Result Tolal Dilaalvcd Solids 101 801011 22
Cadmium <~
Cbzomiwn <7
Copper <6
Units Method milL EPAI60.1
uWL BPA200.7 ug!L EPA 200.7
uWL BPA200.7
uWL EPA200.7 : Iron
.MI!J&IM"' 87 uWL BPA200.7 10 ug!L BPA200.7
Nickel <U ug!L BPA200.7
snver <7 uWL BPA200.7
ZiDo> <6 ug!L BPA200.7 ~ Arsenic <5 uWL EPA206.2. ?-
Lead <1 Uf'L EPA239.2
M=ary <0.5 uWL BPA24.5.1
Fluoride <0.2 mlfL BPA340.2
Ammonia <0,1 mWL-N BPA350.3
Sulflllc 3 msfL EPA37S.4
Disao1wd OrpDic Calbon . . 913 IJI8/L BPA41S.1
~ <1 ug!L EPA624
Bromoform <1 uWL I!PA624 . Chlorodlbromoml <I uWL I!PA624
Chloroform <I u&'L BPA624
.·; Caft'eille <10 uWL EPA62S
- - -DAIIaiiDfiDol• - Ill I!PA 6Zo
+aaa~r~ftuol I 1111 EPA6l4
H' .. 10 BPA62S • -·· u EPA62S
SPECTRA LABORATORIES
sdrio~ Manager £ d PZS6SL9G£9 ·oN/OZ: ll.lS/lZ: ll vOOZ Sl 80V(I~j)
Project: Y elm GW Monitoring Client ID: SC3 MWl Sample Matrix: Water Date Sampled: 03/06/2003 Date Received: 03/0612003 Spectra Project: 2003030069 Spectra Number: 3
Analyte Result Units N-NitrwodimmyW~~D~c <iO ugiL
Fecal Colifolm <2 /100 Fecal SlleptOCOCC\18 660 1100 TKN <1.0 maiL BOD <2 mg!L
Bromide <0.1 mr/L Chloride 7.7 m.gfL N"llritc <0.01 msfL.N Ninle 2.4 ma/L-N ADicmi<: Sud. IS MBAS <0.02 mg/L
.. .i ,.,_ ~· : • j .. ··.•·
- --T-..a 101) BPA6U
2ollluof t';' ljJ
Page 3of13
Method EPA625 Memb~~~~e
Memblll!e SM450Q.N•B
SMS210 SM45oo;.Br-B
SM4SOOCL-C
SM4SOON02B SM4500N03D
SM.S540C

SPECTRA Laboratories • 2221 Ross Way • Tacoma, WA 98421
04/08/2003
Skillings-Connolly, Inc. PO Box 5080 Lacey, W A 98509 Attn: Patrick Skillings
Ana1yte Result Units Method Total Dissolved Solids 164 mg/L EPA 160.1
Boron 89 ug!L EPA 200.7
Cadmium <3 ug!L EPA 200.7
Chromium <7 ug!L EPA 200.7
Copper 6 ug!L EPA 200.7
Iron 170 ug/L EPA 200.7
Manganese 11 ug!L EPA 200.7
Nickel < 15 ug/L EPA200.7
Silver <7 ug!L EPA 200.7
Zinc <6 ug!L EPA 200.7
Arsenic <5 ug!L EPA206.2
Lead < 1 ug!L EPA 239.2
Mercury <0.5 ug/L EPA 245.1
Fluoride <0.2 mg/L EPA 340.2
Ammonia < 0.1 mg!L-N EPA 350.3
Sulfate 12 mg!L EPA 375.4
Dissolved Organic Carbon II mg/L EPA 415.1
Bromodichloromethane <1 ug!L .. EPA 624<;
Bromoform <1 ug!L EPA624 .;
Chlorodibromomethane <I ug!L EPA 624
Chloroform <I ug!L EPA 624
Caffeine <10 ug!L EPA 625
Swrogate Recovery Method
Dibromofluoromethane 114 EPA 624
4-Bromofluorobenzenc 102 EPA 624
Nitrobenzene-tiS 46 EPA 625
• (253)272-4850 • Fax(253)572-9838
Project: Client ID: Sample Matrix:
Date Sampled: Date Received:
Yelm GW Monitoring SC4MW2 Water 03/06/2003 03/06/2003
Spectra Project: 2003030069 Spectra Number: 4
\. Analyte Result Units Method
N-Nitrosodimethylarnine <10 ug/L EPA 625
Fecal Coliform <2 /100 Membrane
Fecal Streptococcus 1400 /100 Membrane
TKN <1.0 mg/L SM 4500-N-B
BOD <2 mg/L SM 5210
Bromide < 0.1 mg/L SM4500-Br-B
Chloride 26.9 mg/L SM4500CL-C
Nitrite 0.02 mg/L-N SM4500N-Nitrate 4.0 mg/L-N SM4500N
Anionic Surf. as MBAS <0.02 mg/L SM5540C
:•.-- ·- .
Swroga~e Recovery Method
Tolucne-d8 100 EPA 624
2-AIWI'Obiphenyl 45 EPA 625
p-Terphenyl-<114 77 EPA 625
SPECTRA LABORATORIES •
/~\, Stevl Hibbs, Laboratory Manager Page 4 of 13
a14/scj

•---' SPECTRA Laboratories 2221 Ross Way • Tacoma, WA 98421
04/08/2003
Skillings-Connolly, Inc. PO Box 5080 Lacey, WA 98509 Attn: Patrick Skillings
Analyte Result Units Method Total Dissolved Solids 315 mg/L EPA 160.1
Boron 25 ug/L EPA 200.7
Cadmium <3 ug/L EPA 200.7
Chromium <7 ug/L EPA 200.7
Copper <6 ug/L EPA 200.7
Iron 110 ug/L EPA 200.7
Manganese 9 ug/L EPA 200.7 .I < 15 ug/L EPA 200.7
<7 ug/L EPA 200.7
Zinc <6 ug/L EPA 200.7
Arsenic <5 ug/L EPA 206.2
Lead <I ug/L EPA 239.2
Mercury <0.5 ug/L EPA 245.1
Fluoride <0.2 mg/L EPA 340.2
Ammonia < 0.1 mg/L-N EPA 350.3
Sulfate 26 mg/L
Dissolved Organic Carbon 9 mg/L
Bromodichloromethane <I . '•Ug/L
Bromoform <I ug/L
Chlorodibromomethane <I ug/L
Chloroform <I ug/L
Caffeine <10 ug/L
Sum>gal< Recovery
Dibromofluoromethane 114
4-Bromofluorobcnzenc \OJ
Nitrobenzcnc-d.S n p-Terphenyl-dl4 80
• SPECTRA LABORATORIES
~\__ Steve Hibbs, Laboratory Manager al4/scj
EPA 375.4
EPA 415.1
;:" ,': EPA624
EPA 624
EPA 624
EPA 624
EPA 625
Method
EPA 624
EPA 624
EPA 625
EPA 625
• (253) 272-4850 • Fax (253) 572-9838
Project: Client ID: Sample Matrix:
Date Sampled: Date Received: Spectra Project: Spectra Number:
Analyte N-Nitrosodimethylamine
Fecal Coliform
Fecal Streptococcus
TKN
BOD
Bromide
Chloride
Nitrite
Nitrate
Anionic Surf. as MBAS
Surrogate
Toluenc-dS
2-l'luorobiphenyl
Yelm GW Monitoring SCS MW3 Water 03/06/2003 03/06/2003 2003030069 5
Result Units <10 ug/L
<2 /100
148 /100
1.1 mg/L
<2 mg/L
< 0.1 mg/L
56.0 mg/L
< 0.01 mg/L-N
7.4 mg/L-N
<0.02 mg/L
Recovery Method
101 EPA 624
65 EPA 62.5
Page 5 of 13
Method EPA 625
Membrane
Membrane
SM 4500-N-B
SM 5210
SM4500-Br-B
SM4500CL-C
SM4500N02B
SM4500N03D
SM5540C

SPECTRA Laboratories • 2221 Ross Way • Tacoma, WA 98421
04/08/2003
Skillings-Connolly, Inc. PO Box 5080 Lacey, W A 98509 Attn: Patrick Skillings
Analyte Result Units Method Total Dissolved Solids 175 mg!L EPA 160.1
Boron 220 ug/L EPA 200.7
Cadmium <3 ug/L EPA 200.7
Chromium <7 ug/L EPA 200.7
Copper 10 ug/L EPA 200.7
Iron 69 ug/L EPA 200.7
Manganese 5 ug/L EPA 200.7
Nickel < 15 ug/L EPA 200.7
Silver <7 ug/L EPA 200.7
Zinc <6 ug/L EPA200.7
Arsenic <5 ug/L EPA 206.2
Lead <I ug/L EPA 239.2
Mercury <0.5 ug/L EPA 245.1
Fluoride <0.2 mg!L EPA 340.2
Ammonia <0.1 mg/L-N EPA 350.3
Sulfate 13 mg/L EPA 375.4
Dissolved Organic Carbon II mg/L EPA 415.1
Bromodichloromethane <f. .ug/L'c·. EPA 624 ·.
Bromoform <I ug/L EPA624
Chlorodibromomethane <I ug/L EPA624
Chloroform <I ug/L EPA 624
Caffeine <10 ug/L EPA 625
Surrogate Recovery Method
Dibromofluoromethanc Ill EPA 624
4-Bromotluorobenzene 101 EPA 624
Nitrober.:zene-d5 62 EPA 625
• (253) 272-4850 • Fax(253)572-9838
Project: Client ID: Sample Matrix:
Date Sampled: Date Received: Spectra Project: Spectra Number:
Analyte N-Nitrosodimethylamine
Fecal Coliform
Fecal Streptococcus
TKN
BOD
Bromide
Chloride
Nitrite
Nitrate
Anionic Surf. as MBAS
Sunogate
Toluenc-d8
2-Fluorobiphenyl
Yelm GW Monitoring SC6MW4 Water 03/06/2003 03/06/2003 2003030069 6
Result Units <10 ug/L
<2 /100
6 /100
2.3 mg/L
<2 mg!L
< 0.1 mg/L
37.6 mg/L
<0.01 mg/L-N
3.0 mg/L-N
<0.02 mg!L
Recovery Method
100 EPA624
61 EPA 625
Method EPA 625
Membrane
Membrane
SM4500-N-B
SM 5210
SM4500-Br-B
SM4500CL-C
SM4500:il SM4500
SM5540C
p-Terphenyl-dl4 87 EPA 625
SPECTRA LABORATORIES •
?d:J\_, Steve Hibbs, Laboratory Manager Page 6 of 13 al4/scj

·---- SPECTRA Laboratories 2221 Ross Way • Tacoma, WA 98421
04/08/2003
Analyte
Skillings-Connolly, Inc. PO Box 5080 Lacey, WA 98509 Attn: Patrick Skillings
Result Total Dissolved Solids 114
Boron 43
Cadmium <3
Chromium <7
Copper <6
[ron 74
Manganese 5
~l < 15
<7
Zinc <6
Arsenic <5
Lead <I
Mercury <0.5
Fluoride <0.2
Units Method mg!L EPA 160.1
ug!L EPA 200.7
ug!L EPA 200.7
ug!L EPA 200.7
ug!L EPA 200.7
ug!L EPA200.7
ug!L EPA 200.7
ug!L EPA 200.7
ug!L EPA 200.7
ug!L EPA 200.7
ug!L EPA206.2
ug!L EPA 239.2
ug!L EPA245.1
mg!L EPA 340.2
Ammonia < 0.1 mg/L-N EPA 350.3
Sulfate 6 mg!L
Dissolved Organic Carbon 10 mg!L
Bromodichloromethane <I ug!L
Bromoform <I ug!L
Chlorodibromomethane <I ug!L
Chloroform <I ug!L
Caffeine <10 ug!L
Surrogate Recovery
Dibromotluoromethane 118
4-Bromofluorobenzene 102
Nitrobenzcne-d5 72
p-Terphenyl-d14 90 • SPECTRA LABORATORIES
de~ Steve Hibbs, Laboratory Manager al4/scj
EPA 375.4
EPA 415.1
EPk624·
EPA 624
EPA 624
EPA 624
EPA 625
Method
EPA 624
EPA 624
EPA 625
EPA625
• (253) 272-4850 • Fax (253) 572-9838
Project: Client ID: Sample Matrix:
Date Sampled: Date Received: Spectra Project:
Yelm GW Monitoring SC7MW5 Water 03/06/2003 03/06/2003 2003030069
Spectra Number: 7
Analyte Result Units Method N-Nitrosodimethylamine <10 ug/L EPA 625
Fecal Coliform <2 /100 Membrane
Fecal Streptococcus 440 /100 Membrane
TKN <1.0 mg/L SM 4500-N-B
BOD <2 mg/L SM 5210
Bromide < 0.1 mg/L SM4500-Br-B
Chloride 9.4 mg/L SM4500CL-C
Nitrite <0.01 mg/L-N SM4500N02B
Nitrate 3.4 mg!L-N SM4500N03D
Anionic Surf. as MBAS <0.02 mg/L SM5540C
Surrogate Recovery Method
Toluene-J& 100 EPA624
2-Fluorobiphenyl 72 EPA 625
Page 7 of 13

SPECTRA Laboratories • 2221 Ross Way • Tacoma, WA 98421
04/08/2003
Analyte
Skillings-Connolly, Inc. PO Box 5080 Lacey, W A 98509 Attn: Patrick Skillings
Result Total Dissolved Solids 318
Boron 450
Cadmium <3
Chromium <7
Copper 17
Iron 30
Manganese 26
Nickel < 15
Silver 7
Zinc 37
Arsenic <5
Lead <I
Mercury <0.5
Fluoride <0.2
Units Method mg/L EPA 160.1
ug/L EPA 200.7
ug/L EPA 200.7
ug/L EPA 200.7
ug/L EPA 200.7
ug/L EPA 200.7
ug/L EPA 200.7
ug/L EPA 200.7
ug/L EPA 200.7
ug/L EPA 200.7
ug/L EPA 206.2
ug/L EPA 239.2
ug/L EPA 245.1
mg/L EPA 340.2
Anunonia < 0.1 mg/L-N EPA 350.3
Sulfate 27 mg/L EPA 375.4
Dissolved Organic Carbon 17 mg/L EPA 415.1..
Bromodichloromethane 7 ug/L EPA 624
Bromoform <I ug/L EPA 624
Chlorodibromomethane I ug/L EPA 624
Chloroform 32 ug/L EPA 624
Caffeine <10 ug/L EPA 625
Surrogate Recovery Method
Dibromolluoromethane 109 EPA 624
4-Bromolluorobenzene 102 EPA 624
Nittobenzenc:-d5 74 EPA 625
p-Terphc:nyl-dl4 83 EPA 625
SPECTRA LABORATORIES
~\,
• (253) 272-4850 • Fax (253) 572-9838
Project: Client ID: Sample Matrix:
Date Sampled: Date Received: Spectra Project:
Yelm GW Monitoring SC8 IS Water 03/06/2003 03/06/2003 2003030069
Spectra Number: 8
Analyte N-Nitrosodimethylamine
Fecal Coliform
Fecal Streptococcus
TKN
BOD
Bromide
Chloride
Nitrite
Nitrate
Anionic Surf. as MBAS
Surrogate
Toluene-d8
2~Fiuorobiphc:nyl
Result <10
<2
<2
<1.0
<2
< 0.1
72.6
< 0.01
4.5
0.12
Recovery
98
80
Units ug/L
/100
/100
mg/L
mg/L
mg/L
mg/L
mg/L-N
mg/L-N
mg/L
Method
EPA 624
EPA 625
Page 8 of 13
Method EPA 625
Membrane
Membrane
SM 4500-N-B
SM 5210
SM4500-Br-B
SM4500CL-C
SM4500N.
SM4500N
SM5540C
.. •
•

•----' SPECTRA Laboratories 2221 Ross Way • Tacoma, WA 98421 •
04/08/2003
(253) 272-4850 • Fax (253) 572-9838
Project: Yelm GW Monitoring SC9 CS1
Analyte
Skillings-Connolly, Inc. PO Box 5080 Lacey, W A 98509 Attn: Patrick Skillings
Result Total Dissolved Solids 308
Boron 460
Cadmium <3
Chromium <7
Copper 16
Iron 52
Manganese 23 .I < 15
7
Zinc 37
Arsenic <5
Lead <I
Mercury <0.5
Fluoride <0.2
Units Method mg/L EPA 160.1
ug/L EPA200.7
ug/L EPA 200.7
ug/L EPA 200.7
ug/L EPA 200.7
ug/L EPA 200.7
ug/L EPA 200.7
ug!L EPA 200.7
ug/L EPA 200.7
ug/L EPA 200.7
ug/L EPA 206.2
ug/L EPA 239.2
ug/L EPA 245.1
mg/L EPA 340.2
Ammonia <0.1 mg/L-N EPA 350.3
Sulfate 26 mg/L
Dissolved Organic Carbon 19 mg;L
Bromodichloromethane 5 ug/L
Bromoform <I ug/L
Chlorodibromomethane <I ug/L
Chloroform 23 ug/L
Caffeine <10 ug/L
Surrogate Recovery
Dibromofluoromethane 97
4.-Bromotluorobenzene 100
Nitrobenzene-d5 73
p-Tetphenyl-d14 84 • SPECTRA LABORA TORlES
A~" Steve Hibbs, Laboratory Manager al4/scj
EPA 375.4
EPA 415.1
EPA 624
EPA 624
EPA 624
EPA 624
EPA 625
Method
EPA 624
EPA 624
EPA 625
EPA 625
Client ID: Sample Matrix: Water Date Sampled: 03/06/2003 Date Received: 03/06/2003 Spectra Project: 2003030069 Spectra Number: 9
Analyte Result Units N-Nitrosodimethylamine <i(} ug/L
Fecal Coliform <2 /100
Fecal Streptococcus 32 /100
TKN <1.0 mg/L
BOD <2 mg/L
Bromide < 0.1 mg/L
Chloride 71.8 mg/L
Nitrite 0.02 mg/L-N
Nitrate 4.5 mg/L-N
Anionic Surf. as MBAS 0.16 mg/L
Surrogate R~v~ Method
Toluc:ne-d8 99 EPA 624
2-Fiuorobiphenyl i3 EPA 625
Page 9 of13
Method EPA 625
Membrane
Membrane
SM 4500-N-B
SM 5210
SM4500-Br-B
SM4500CL-C
SM4500N02B
SM4500N03D
SM5540C

SPECTRA Laboratories • 2221 Ross Way • Tacoma, WA 98421
04/08/2003
Skillings-Connolly, Inc. PO Box 5080 Lacey, W A 98509 Attn: Patrick Skillings
Analyte Result Units Method Total Dissolved Solids 270 mg!L EPA 160.1
Boron 400 ug!L EPA 200.7
Cadmium <3 ug!L EPA 200.7
Chromium <7 ug!L EPA 200.7
Copper 10 ug/L EPA 200.7
Iron 120 ug/L EPA 200.7
Manganese 43 ug/L EPA 200.7
Nickel < 15 ug/L EPA200.7
Silver <7 ug!L EPA 200.7
Zinc 22 ug/L EPA200.7
Arsenic <5 ug!L EPA206.2
Lead <I ug!L EPA239.2
Mercury <0.5 ug/L EPA245.1
Fluoride <0.2 mg/L EPA340.2
Ammonia 1.0 mg/L-N EPA 350.3
Sulfate 22 mg/L EPA 375.4
Dissolved Organic Carbon 14 mg/L EPA 415.1
Bromodichloromethane <;I· ug!L , .. EPA 624.
Bromoform <I ug!L EPA 624.
Chlorodibromomethane <I ug!L EPA 624
Chloroform 6 ug!L EPA624
Caffeine <10 ug/L EPA 625
Surrogate Recovery Mothod
Dibromofluoromethane 108 EPA 624
4-Bromofluorobenzc:ne 102 EPA 624
Nitrobcnzene-d5 69 EPA 625
• (253) 272-4850 • Fax(253)572-9838
Project: Client ID: Sample Matrix:
Date Sampled: Date Received: Spectra Project:
Yelm GW Monitoring SCIO CS2 Water 03/06/2003 03/06/2003 2003030069
Spectra Number: I 0
Analyte Result Units Method N-Nitrosodimethylamine <10 ug!L EPA625
Fecal Coliform 30 /100 Membrane
Fecal Streptococcus 1300 /100 Membrane
TKN 3.1 mg!L SM4500-N-B
BOD 8 mg!L SM 5210
Bromide < 0.1 mg/L SM4500-Br-B
Chloride 58.9 mg!L SM4500CL-C
Nitrite 0.16 mg!L-N SM4500N~~ Nitrate 3.1 mg!L-N SM4500N
Anionic Surf. as MBAS 0.15 mg!L SM5540C
Surrogate Recovery Method
Toluene-dB 100 EPA624
2-Fiuorobipbenyl 65 EPA 625
p-Tcrphenyl-dl4 77 EPA 62.!5
SPECTRA LABORATORIES •
Steve Hibbs, Laboratory Manager al4/scj
Page 10 of 13

•-.....J SPECTRA Laboratories 2221 Ross Way
04/08/2003
• Tacoma, WA98421
Analyte
Skillings-Connolly, Inc. PO Box 5080 Lacey, WA 98509 Attn: Patrick Skillings
Result Total Dissolved Solids 258
Boron 390
Cadmium <3
Chromium <7
Copper 10
Iron 69
Manganese 47
.l < 15
<7
Zinc 19
Arsenic <5
Lead < l
Mercury <0.5
Fluoride <0.2
Units Method mg/L EPA 160.1
ug/L EPA 200.7
ug/L EPA 200.7
ug/L EPA 200.7
ug/L EPA200.7
ug/L EPA 200.7
ug/L EPA 200.7
ug/L EPA 200.7
ug/L EPA 200.7
ug/L EPA 200.7
ug/L EPA 206.2
ug/L EPA 239.2
ug/L EPA 245.1
mg/L EPA 340.2
Ammonia 0.5 mg/L-N EPA 350.3
Sulfate 21 mg/L
Dissolved Organic Carbon 25 mg/L
Bromodichloromethane <I. ug/L
Bromoform <I ug/L
Chlorodibromomethane <I ug/L
Chloroform 2 ug/L
Caffeine <10 ug/L
Surrogate Recovery
Dibromofluoromethane ill
4-Bromotluorobenzenc 102
Nitrobcnzenc-d.S 67
p-Terphenyl-dl4 82 • SPECTRA LABORATORIES
/J'\," Steve Hibbs, Laboratory Manager al4/scj
EPA 375.4
EPA 415.1
EPA 624
EPA 624
EPA 624
EPA 624
EPA625
Method
EPA 624
EPA 624
EPA 625
EPA 625
• (253) 272-4850 • Fax (253) 572-9838
Project: Client ID: Sample Matrix:
Date Sampled: Date Received: Spectra Project:
Yelm GW Monitoring SCI! CS3 Water 03/06/2003 03/06/2003 2003030069
Spectra Number: 11
Analyte Result Units Method N-Nitrosodimethylamine <10 ug/L EPA625
Fecal Coliform 40 /100 Membrane
Fecal Streptococcus 390 /100 Membrane
TKN 1.4 mg/L SM 4500-N-B
BOD 9 mg/L SM 5210
Bromide < 0.1 mg/L SM4500-Br-B
Chloride 57.7 mg/L SM4500CL-C
Nitrite 0.02 mg/L-N SM4500N02B
Nitrate 5.3 mg/L-N SM4500N03D
Anionic Surf. as MBAS 0.07 mg/L SM5540C
SuJTOgate Recovery Method
Toluene...J8 99 EPA 624
2-Fiuorobiphenyl 66 EPA 625
Page 11 of 13

SPECTRA Laboratories • 2221 Ross Way • Tacoma, WA 98421
04/08/2003
Analyte
Skillings-Connolly, Inc. PO Box 5080 Lacey, W A 98509 Attn: Patrick Skillings
Result Total Dissolved Solids 251
Boron <8
Cadmium <3
Chromium <7
Copper 8
Iron 120
Manganese 61
Nickel < 15
Silver <7
Zinc 20
Arsenic <5
Lead <I
Mercury <0.5
Fluoride < 0.2
Units Method mg!L EPA 160.1
ug!L EPA 200.7
ug!L EPA 200.7
ug!L EPA 200.7
ug!L EPA 200.7
ug!L EPA 200.7
ug!L EPA 200.7
ug!L EPA 200.7
ug!L EPA200.7
ug!L EPA 200.7
ug!L EPA 206.2
ug!L EPA 239.2
ug!L EPA 245.1
mg!L EPA 340.2
Ammonia 0.3 mg!L-N EPA 350.3
Sulfate 23 mg!L
Dissolved Organic Carbon .. 20 mg!L
Bromodichloromethane <I ug!L
Bromofonn <1 ug!L
Chlorodibromomethane <1 ug!L
Chlorofonn ug!L
Caffeine <10 ug!L
Surrogate Recovery
Dibromofluoromethane 105
4--Bromofluorobenzene 99
Nitrobenzene-dS 81
IJ-T erphcnyl-d 14 88
SPECTRA LABORATORIES
4/l---Steve Hibbs, Laboratory Manager al4/scj
EPA 375.4
EPA 415.1
EPA624
EPA 624
EPA 624
EPA 624
EPA 625
Method
EPA 624
EPA 624
EPA 625
EPA 625
• (253) 272-4850 • Fax (253) 572-9838
Project: Client ID:
Yelm GW Monitoring SC12 CS4
Sample Matrix: Water Date Sampled: 03/06/2003 Date Received: 03/06/2003 Spectra Project: 2003030069 Spectra Number: 12
Analyte Result Units N-Nitrosodimethylamine <10 ug!L
Fecal Colifonn 60 1100
Fecal Streptococcus 2500 1100
TKN 2.6 mg!L
BOD 7 mg!L
Bromide < 0.1 mg!L
Chloride 54.2 mg!L
Nitrite O.Q7 mg!L-N
Nitrate 4.7 mg!L-N
Anionic Surf. as MBAS 0.09 mg!L
Surrogate Recovery Method
Toluene-d8 101 EPA624
2-Fiuorobiphenyl 78 EPA 625
Page 12 of 13
Method EPA 625
Membrane
Membrane
SM 4500-N-B
SM 5210
SM4500-Br-B
SM4500CL-C
SM4500N, SM4500NO
SM5540C
•

• SPECTRA Laboratories 2221 Ross Way • Tacoma, WA 98421
04/08/2003
Skillings-Connolly, Inc. PO Box 5080 Lacey, W A 98509 Attn: Patrick Skillings
Analyte Result Units Method Total Dissolved Solids 139 mg!L EPA 160.1
Boron <8 ug!L EPA200.7
Cadmium <3 ug!L EPA 200.7
Chromium <7 ug!L EPA 200.7
Copper <6 ug!L EPA 200.7
Iron 77 ug!L EPA 200.7
Manganese 55 ug!L EPA 200.7
11:1 < 15 ug!L EPA 200.7
<7 ug!L EPA 200.7
Zinc <6 ug!L EPA 200.7
Arsenic <5 ug!L EPA 206.2
Lead <1 ug!L EPA 239.2
Mercury <0.5 ug!L EPA 245.1
Fluoride <0.2 mg!L EPA 340.2
Ammonia < 0.1 mg!L-N EPA 350.3
Sulfate 6 mg/L
Dissolved Organic Carbon 12 mg/L
Bromodichloromethane <1 ug/L
Bromoform <I ug/L
Chlorodibromomethane <1 ug/L
Chloroform <1 ug/L
Caffeine <10 ug/L
Surrogate Recovery
Dibromotluoromethane 98
4-Bromofluorobenzene 102
Nitrobenzene-d5 77
p-Terphenyl-<114 87
• SPECTRA LABORATORIES
Steve ~or:fury Manager a14/scj
EPA 375.4
EPA 415.1
EPA624
EPA624
EPA 624
EPA 624
EPA 625
Molhod
EPA 624
EPA 624
EPA 625
EPA 625
• (253) 272-4850 • Fax (253) 572-9838
Project: Client ill: Sample Matrix:
Date Sampled: Date Received: Spectra Project:
Yelm GW Monitoring SC13 FD Water 03/06/2003 03/06/2003 2003030069
Spectra Number: 13
Analyte Result Units Method N-Nitrosodimethylamine <10 ug!L EPA 625
Fecal Coliform <2 /100 Membrane
Fecal Streptococcus 32 /100 Membrane
TKN <1.0 mg!L SM 4500-N-B
BOD <2 mg!L SM 5210
Bromide < 0.1 mg!L SM4500-Br-B
Chloride 16.6 mg!L SM4500CL-C
Nitrite < 0.01 mg!L-N SM4500N02B
Nitrate 5.4 mg!L-N SM4500N03D
Anionic Surf. as MBAS <0.02 mg!L SM5540C
s"""""' Recovery MetOOd
Toluene-dB 98 EPA 624
2-Fiuorobipbenyl 70 EPA 625
Page 13 of 13

SPECTRA Laboratories • 2221 Ross Way • Tacoma, WA98421
04/23/2003
Skillings-Connolly, Inc. PO Box 5080 Lacey, W A 98509 Attn: Patrick Skillings
Analyte Result Units Method Conductivity 8.8 urnhos/ EPA 120.1
Total Dissolved Solids 3 mg/L
" Barium <2 ug/L
/Beryllium <1 ug/L
Boron 17 ug/L
Cadmium <3 ug/L
Chromium <7 ug/L
Copper <6 ug/L
Iron < 15 ug/L
Manganese 15 ug/L
Nickel < 15 ug/L
Silver <7 ug/L
/sodium ~ ug/L
·/Total Hardness '!§!).- ug/L
Zinc <6 ug/L / .
ifThalhum < 1 ug/L
. /Antimony <5 ug/L
.. ~Arsenic· . < 5 ug/L
Lead < 1 ug/L
Mercury <0.5 ug/L
vSelenium <5 ug/L
Fluoride <0.2 mg/L
Surrogate Recovery
DibromoOuorometham: Ill
4-Bromofluorobenzene 100
Nitrobenzenc-<15 55
p-Terphenyl-dl4 59
SPECTRA LABORATORIES
Steve Hibbs, Laborat a 14/scj
Manager
EPA 160.1
EPA 200.7
EPA200.7
EPA 200.7
EPA 200.7
EPA 200.7
EPA 200.7
EPA 200.7
EPA 200.7
EPA 200.7
EPA 200.7
EPA200.7
EPA 200.7
EPA 200.7
EPA200.9
EPA 204.2
EPA 206.2
EPA 239.2
EPA 245.1
EPA 270.2
EPA 340.2
Method
SW846 82608
EPA 624
SW846 8270C
SW846 8270C
• (253) 272-4850 • Fax (253) 572-9838
Project: Yelm Groundwater Monitoring Client ID: RIO Sample Matrix: Water
Date Sampled: 03/31/2003 Date Received: 03/3112003 Spectra Project: 2003030396 Spectra Number: 1
Analyte Ammonia
Sulfate
Dissolved Organic Carbon
Caffeine
N-Nitrosodimethylamine
Fecal Colifonn
Fecal Streptococcus
/Color
vTurbidity 11(,"\j
BOD
Bromide
vChloride
vT otal Cyanide
Nitrite
Nitrate
Vf ota1 Organic Carbon
Anionic Surfactants as
Bromodichloromethane
Bromofonn
Chlorodibromomethane
Ch1orofonn
Surrogate
Toluenc-d!!
2-Fiuorobiphenyl
Result < 0.1
< 1
<5
<10
<10
0
0
~ < 0.1
<1.0
<2
< 0.1
~ < 0.02
<0.5
<0.5
__2j_
<0.02
<l
<l
<1
5
Recovery
89
67
Units Method mg/L-N EPA 350.3
mg/L EPA 375.4
mg/L EPA 415.1
ug!L EPA 625
ug/L EPA 625
1100 Membrane
/100 Membrane
Color SM212. ntu SM 2130
mg/L SM4500-N-B
mg/L SM 5210
mg/L SM4500-Br-B
mg/L SM4500CL-C
mg/L SM4500CN-E
mg/L-N SM4500N02B
mg/L-N SM4500N03D
mg!L SM5310 B
mg/L.' SM5540C
ug!L· . SW846 8260B'
ug!L
ug!L
ug!L
Method
SW846 82608
SW846 8270C
SW846 8260B
SW846 8260B
SW846 8260B
• Page 1 of 2

• SPECTRA Laboratories 2221 Ross Way • Tacoma, WA 98421
04/23/2003
Skillings-Connolly, Inc. PO Box 5080 Lacey, W A 98509 Attn: Patrick Skillings
Analyte Nitrate/Nitrite
Result Units <0.5 mg/L-N
Method Summation
•
Surrogate Recovery Method
Dibromolluoromethane Ill SW846 82608
4-Bromotluorobenzene 100 EPA 624
Nitrobenzene-d5 55 SW846 8270C • p-Tefllhenyl-d14 59 SW846 8270C
SPECTRA LABORATORIES
anager al4/scj
• (253) 272-4850 • Fax (253) 572-9838
Project: Client ID: Sample Matrix:
Date Sampled: Date Received: Spectra Project:
Yelm Groundwater Monitoring RIO Water 03/31/2003 03/31/2003 2003030396
Spectra Number: 1
Analyte Result Units Method
Surrogate Ret:overy Method
Toluene-dB 89 SW846 82608
2-Fiuorobiphenyl 67 SW846 8270C
Page 2 of2

A'VVATER ~ MANAGEMENT
- LABORA TORIESINC.
March 10, 2003
Spectra Laboratories, Inc. 2221 Ross Way Tacoma, WA 98421 Attn: Kerrie Nason
Dear Ms. Nason:
1515 80th St. E. Tacoma, ~A 98404 (253) 531-3121 •
Results of analysis of thirteen environmental water samples taken on 03-06-03 and received on 03-06-03 at 3:15p.m. are as follows:
Project: 2003030069 - Skillings and Connolly
Fecal Fecal Sample Coliform Streptococcus • Identification (per 100 mls) (per 100 mls)
01, 1010 < 2* < 2*
02,0820 < 2* 44
03,0900 < 2* 660
04,0930 < 2* 1,400
05,0955 < 2* 148
06, 1045 < 2* 6
07, 1115 < 2* 440
08, 1040 < 2* < 2* split sample < 2* < 2*
09, 1140 < 2* 32
10, 1155 30 1,300 • * < is less than

Spectra Laboratories, Inc. March 10, 2003
• Page2
•
•
Fecal Fecal Sample Coliform Streptococcus
Identification (per 100 mls) (per 100 mls)
11, 1210 40 390
12, 1230 60 2,500 split sample 100 2,800
13,0820 < 2* 32
* < is less than
Lab Number: 08990936 through 08990948
Samples were analyzed by membrane filtration procedure according to Standard Methods for the Examination of Water and Wastewater, 19th Edition and EPA Microbiological Methods for Monitoring the Environment .
Chain of custody record is enclosed.
Sincerely,
~~~'fV\J Diane DuMond Micro biologist
DD:klm enclosure
R:\COMM\SPECTRALABS3-6

SPECTRA Laboratories • 2221 Ross Way • Tacoma, WA 98421
07110/2003
Skillings-Connolly, Inc. PO Box 5080 Lacey, W A 98509 Attn: Patrick Skillings
Analyte Result Units Method Total Dissolved Solids 85.0 mg/L EPA 160.1
Boron 28 ug!L EPA200.7
Cadmium <3 ug!L EPA 200.7
Chromium <7 ug!L EPA 200.7
Copper 34 ug!L EPA 200.7
Iron < 15 ug!L EPA 200.7
Manganese 21 ug!L EPA 200.7
Nickel < 15 ug!L EPA 200.7
Silver <7 ug!L EPA 200.7
Zinc 12 ug!L EPA 200.7
Arsenic <5 ug!L EPA 206.2
Lead <I ug!L EPA 239.2
Mercury <0.5 ug!L EPA 245.1
Fluoride <0.2 mg!L EPA 340.2
Ammonia < 0.1 mg!L-N EPA 350.3
Sulfate 9 mg/L
Dissolved Organic Carbon <2 mg/L
Bromodichloromethane <I ug/L
Bromoform <I ug!L
Chlorodibromomethane <I ug!L
Chloroform <I ug!L
Caffeine <10 ug!L
Surrogate Recovery
2-Fiuorobiphenyl 66
Dibromofluoromethane 94
4-Bromolluorobenzene 101
Nitrobenzene-d5 47
SPECTRA LABORATORIES
Steve :~.14/sgh
Manager
EPA 375.4
EPA 415.1
EPA 624
EPA624
EPA 624
EPA624
EPA 625
Method
EPA 625
EPA 624
EPA 624
EPA 625
• (253) 272-4850 • Fax (253) 572-9838
Project: Client ID: Sample Matrix:
Date Sampled: Date Received: Spectra Project: Spectra Number:
Analyte N-Nitrosodimethylarnine
Fecal Coliform
Fecal Streptococcus
TKN
BOD
Bromide
Chloride
Nitrite
Nitrate
Anionic Surf. as MBAS
Surrogate
p-Terphenyl-dl4
Toluene-d8
Yelm Groundwater Monitoring SC1 CW Water 06/05/2003 06/05/2003 2003060069
Result Units Method <10 ug/L EPA 625
<2 /100 Membrane
<2 /!00 Membrane
ND mg/L SM 4500-N-B
<2 mg!L SM 5210
< 0.1 mg!L SM4500-Br-B
6.0 mg/L SM4500CL-C
< 0.01 mg!L-N SM4500N. 3.8 mg!L-N SM4500N
<0.02 mg/L SM5540C
'. ;_,_
Recovery Method
57 EPA 625
100 EPA624
• Page 1 of 15

• SPECTRA Laboratories 2221 Ross Way • Tacoma, WA98421
07/10/2003
Skillings-Connolly, Inc. PO Box 5080 Lacey, W A 98509 Attn: Patrick Skillings
Analyte Result Units Method Total Dissolved Solids
Boron
Cadmium
Chromium
Copper
Iron
Manganese
11:1 Zinc
Arsenic
Lead
Mercury
Fluoride
Ammonia
Sulfate
Dissolved Organic Carbon
Bromodichloromethane
Bromoform
Chlorodibromomethane
Chloroform
Caffeine
Sl1mlgatc
2~Fluorobiphmyl
D ibromolluoromethane
4-Bromotluorobenzene
NitrobenZcne-d5
110
13
<3
<7
33
190
400
< 15
<7
12
<5
< 1
<0.5
<0.2
< 0.1
8
4
<l
<I
<I
<I
<10
mg/L EPA 160.1
ug/L EPA 200.7
ug/L EPA 200.7
ug/L EPA 200.7
ug/L EPA 200.7
ug/L EPA 200.7
ug/L EPA200.7
ug/L EPA 200.7
ug/L EPA 200.7
ug/L EPA 200.7
ug/L EPA 206.2
ug/L EPA 239.2
ug/L EPA 245.1
mg/L EPA 340.2
mg/L-N EPA 350.3
mg/L EPA 375.4 mg/L· EPA 415.1 ug/L, EPA 624
ug/L EPA 624
ug/L EPA624
ug/L EPA 624
ug/L EPA 625
Recovery Method
64 EPA 625
107 EPA 624
105
53
EPA 624
EPA 625 • SPECTRA LABORATORIES
Ste.fe Hibbs, Laboratory Manager al4/sgh
• (253) 272-4850 •
Project: Client ID: Sample Matrix:
Date Sampled: Date Received: Spectra Project:
Fax (253) 572-9838
Yelm Groundwater Monitoring SC2MW6 Water 06/05/2003 06/05/2003 2003060069
Spectra Number: 2
Analyte N-Nitrosodimethy !amine
Fecal Coliform
Fecal Streptococcus
TKN
BOD
Bromide
Chloride
Nitrite
Nitrate
Anionic Surf. as MBAS
Surrogate
p-Terpbenyl-dl4
Toluene-dB
Result Units <10 ug/L
<2 /100
<2 /100
ND mg/L
<2 mg/L
<0.1 mg/L
7.5 mg/L
< 0.01 mg/L-N
4.6 mg/L-N
0.03 mg/L
Recovery Method
54 EPA 625
96 EPA 624
Page 2 of 15
Method EPA 625
Membrane
Membrane
SM 4500-N-B
SM 5210
SM4500-Br-B
SM4500CL-C
SM4500N02B
SM4500N03D
SM5540C

SPECTRA Laboratories 2221RossWay • Tacoma,WA98421 •
07/10/2003
(253)272-4850 •
Skillings-Connolly, Inc. PO Box 5080
Project: Client ID: Sample Matrix:
Date Sampled: Date Received:
• Fax (253) 572-9838
Yelm Groundwater Monitoring SC3 MWl Water 0610512003 06/05/2003
Lacey, W A 98509 Attn: Patrick Skillings
Spectra Project: 2003060069 Spectra Number: 3
Analyte Result Units Method --
Total Dissolved Solids 76.0 mg/L EPA 160.1
Boron 16 ug/L EPA200.7
Cadmium <3 ug/L EPA 200.7
Chromium <7 ug/L EPA 200.7
Copper 28 ug/L EPA 200.7
Iron 69 ug/L EPA 200.7
Manganese 31 ug/L EPA 200.7
Nickel < 15 ug/L EPA 200.7
Silver <7 ug/L EPA 200.7
Zinc 9 ug/L EPA 200.7
Arsenic <5 ug/L EPA 206.2
Lead <I ug/L EPA 239.2
Mercury <0.5 ug/L EPA 245.1
Fluoride < 0.2 mg/L EPA 340.2
Ammonia < 0.1 mg/L-N EPA 350.3
Sulfate < I mg/L
Dissolved Organic Carbon 7 mg/L
Bromodichloromethane <I ug/L
Bromoform <I ug/L
Chlorodibromomethane <I ug/L
Chloroform <I ug/L
Caffeine <10 ug/L
Surrogate Recovery
2-Fiuorobiphenyl 78
Dibromofluoromethanc 102
4-Bromofluorobenzene 103
Nitrobenzcnc-d5 48
SPECTRA LABORATORIES
Steve Hibbs, Laboratory Manager al4/sgh
EPA 375.4
EPA415.1
EPA 624
EPA 624
EPA 624
EPA 624
EPA 625
McthOO
EPA 625
EPA 624
EPA 624
EPA 625
Analyte N-Nitrosodimethylarnine
Fecal Coliform
Fecal Streptococcus
TKN
BOD
Bromide
Chloride
Nitrite
Nitrate
Anionic Surf. as MBAS
Surrogate
p.-Terphenyl-<ll4
Toluene-dB
Result <10
<2
<2
ND
<2
< 0.1
5.0
< O.QJ
2.3
<0.02
Recovery
59
96
Units ug/L
/100
/100
mg/L
mg/L
mg/L
mg/L
mg/L-N
mg/L-N
mg/L
Method
EPA 625
EPA 624
Page 3 of 15
Method EPA 625
Membrane
Membrane
SM 4500-N-B
SM 5210
SM4500-Br-B
SM4500CL-C
SM4500N.
SM4500N
SM5540C
•

•-~ SPECTRA Laboratories
2221 Ross Way • Tacoma, WA98421
07/10/2003
Skillings-Connolly, Inc. PO Box 5080 Lacey, W A 98509 Attn: Patrick Skillings
Analyte Result Units Method Total Dissolved Solids 147 mg!L EPA 160.1
Boron 220 ug/L EPA200.7
Cadmium <3 ug!L EPA 200.7
Chromium <7 ug!L EPA 200.7
Copper 31 ug!L EPA 200.7
Iron 25 ug!L EPA 200.7
Manganese 23 ug!L EPA 200.7
-I < 15 ug/L EPA 200.7
<7 ug/L EPA 200.7
Zinc 8 ug!L EPA 200.7
Arsenic <5 ug!L EPA 206.2
Lead <I ug!L EPA239.2
Mercury <0.5 ug!L EPA 245.1
Fluoride < 0.2 mg/L EPA 340.2
Ammonia < 0.1 mg!L-N EPA 350.3
Sulfate 9 mg!L
Dissolved Organic Carbon <2 mg/L
Bromodichloromethane . <I . ug!L
Bromoform <I ug!L
Chlorodibromomethane <I ug!L
Chloroform <I ug/L
Catfeine <10 ug/L
Surrogate Recovery
2-Fiuorobiphenyl 76
Dibmmofluoromcthane 103
4-Bmmotluorobenzenc 104
Nitrobcnzene-dS 53
• SPECTRA LABORATORIES
Steve Hibbs, Laboratory Manager al4/sgh
EPA 375.4
EPA415.1
EPA 624
EPA 624
EPA 624
EPA 624
EPA 625
Method
EPA 625
EPA 624
EPA 624
EPA 625
• (253) 272-4850 • Fax (253) 572-9838
Project: Client ID: Sample Matrix:
Date Sampled: Date Received: Spectra Project:
Y elm Groundwater Monitoring SC4MW2 Water 06/05/2003 06/05/2003 2003060069
Spectra Number: 4
Analyte Result Units Method N-Nitrosodimethylamine <10 ug!L EPA 625
Fecal Coliform <2 /100 Membrane
Fecal Streptococcus <2 /100 Membrane
TKN ND mg!L SM 4500-N-B
BOD <2 mg/L SM 5210
Bromide < 0.1 mg!L SM4500-Br-B
Chloride 32.5 mg!L SM4500CL-C
Nitrite < 0.01 mg!L-N SM4500N02B
Nitrate 2.3 mg!L-N SM4500N03D
Anionic Surf. as MBAS <0.02 mg/L SM5540C
Surrogate Recovery Method
p.Terphcnyl-d14 61 EPA 625
Toluene-d8 98 EPA 624
Page 4 of 15

SPECTRA Laboratories • 2221 Ross Way • Tacoma, WA98421 •
07/10/2003
(253)272-4850 • Fax(253)572-9838
Analyte
Skillings-Connolly, Inc. PO Box 5080 Lacey, W A 98509 Attn: Patrick Skillings
Result Total Dissolved Solids 218
Boron 23
Cadmium <3
Chromium <7
Copper 27
Iron 57
Manganese 25
Nickel < 15
Silver <7
Zinc <6
Arsenic <5
Lead < 1
Mercury <0.5
Fluoride <0.2
Units Method mg!L EPA 160.1
ug!L EPA 200.7
ug!L EPA 200.7
ug!L EPA 200.7
ug!L EPA 200.7
ug/L EPA 200.7
ug!L EPA 200.7
ug!L EPA 200.7
ug/L EPA 200.7
ug!L EPA200.7
ug!L EPA 206.2
ug/L EPA 239.2
ug/L EPA 245.1
mg!L EPA 340.2
Ammonia < 0.1 mg!L-N EPA 350.3
Sulfate 15 mg!L
Dissolved Organic Carbon 8 mg!L
Bromodichloromethane <1 . ug!L
Bromoform <I ug!L
Chlorodibromomethane <1 ug!L
Chloroform <1 ug!L
Caffeine <10 ug!L
Surrogate Recovery
2-Fluorobiphenyl 56
Dibromofluoromethane \05
~Bromofluorobenzene 104
:-litrobenzene.d5 45
SPECTRA LABORATORIES
Steve Hibbs, Labomtory Manager al4/sgh
EPA 375.4
EPA 415.1
EPA 624
EPA624
EPA624
EPA 624
EPA 625
Method
EPA 625
EPA 624
EPA 624
EPA 625
Project: Client ID: Sample Matrix:
Date Sampled: Date Received: Spectra Project: Spectra Number:
Analyte N-Nitrosodimethylamine
Fecal Coliform
Fecal Streptococcus
TKN
BOD
Bromide
Chloride
Nitrite
Nitrate
Anionic Surf. as MBAS
'·
Surrogate
p-Terphenyl-<114
Toluene-<18
Y elm Groundwater Monitoring SC5 MW3 Water 06/05/2003 06/05/2003 2003060069 5
Result <!0
<2
<2
ND
<2
< 0.1
34.5
< 0.01
4.0
<0.02
...
Recovny
55
98
Units ug/L
1100
1100
mg!L
mg/L
mg!L
mg/L
mg/L-N
mg/L-N
mg/L
Method
EPA 625
EPA 624
Page 5 of 15
Method EPA 625
Membrane
Membrane
SM 4500-N-B
SM 5210
SM4500-Br-B
SM4500CL-C
SM4500N.
SM4500N
SM5540C
•

• SPECTRA Laboratories 2221 Ross Way • Tacoma, WA98421
07110/2003
Skillings-Connolly, Inc. PO Box 5080 Lacey, W A 98509 Attn: Patrick Skillings
Analyte Result Units Method Total Dissolved Solids 138 mg!L EPA 160.1
Boron 170 ug!L EPA 200.7
Cadmium <3 ug!L EPA 200.7
Chromium <7 ug!L EPA 200.7
Copper 31 ug!L EPA 200.7
Iron 63 ug!L EPA 200.7
Manganese 25 ug!L EPA 200.7
.l < 15 ug!L EPA 200.7
<7 ug!L EPA 200.7
Zinc 9 ug!L EPA 200.7
Arsenic <5 ug!L EPA 206.2
Lead <I ug!L EPA 239.2
Mercury <0.5 ug!L EPA245.l
Fluoride < 0.2 mg!L EPA340.2
Ammonia < O.l mg!L-N EPA 350.3
Sulfate 9 mg!L
Dissolved Organic Cru bon 10 mg!L
Bromodichloromethane <I ug!L
Bromoform <I ug!L
Chlorodibromomethane <I ug!L
Chloroform <I ug!L
Caffeine <10 ug!L
Surrogate Recovery
2-Fiuorobiphenyl 46
Dibromofiuoromethane 106
4-Bromofluorobenzene 103
Nitrobenzene-dS 44 • SPECTRA LABORATORIES
Steve Hibbs, Laboratory Manager ai4/sgh
EPA 375.4
EPA 415.1
EPA 624
EPA 624
EPA 624
EPA 624
EPA 625
Method
EPA 625
EPA 624
EPA 624
EPA 625
• (253) 272-4850 • Fax (253) 572-9838
Project: Yelm Groundwater Monitoring Client ID: SC6MW4 Sample Matrix: Water
Date Sampled: 06/05/2003 Date Received: 06/05/2003 Spectra Project: 2003060069 Spectra Number: 6
Analyte Result Units Method N-Nitrosodimethylamine <TO ug!L EPA 625
Fecal Coliform <2 /!00 Membrane
Fecal Streptococcus 2 /!00 Membrane
TKN ND mg!L SM4500-N-B
BOD <2 mg!L SM 5210
Bromide < O.l mg!L SM4500-Br-B
Chloride 24.5 mg!L SM4500CL-C
Nitrite < 0.01 mg!L-N SM4500N02B
Nitrate 2.4 mg!L-N SM4500N03D
Anionic Surf. as MBAS 0.07 mg!L SM5540C
-'
Surrogate Recovery Method
p-Terphenyl-dl4 52 EPA 625
Toluene-d8 99 EPA 624
Page 6 of 15
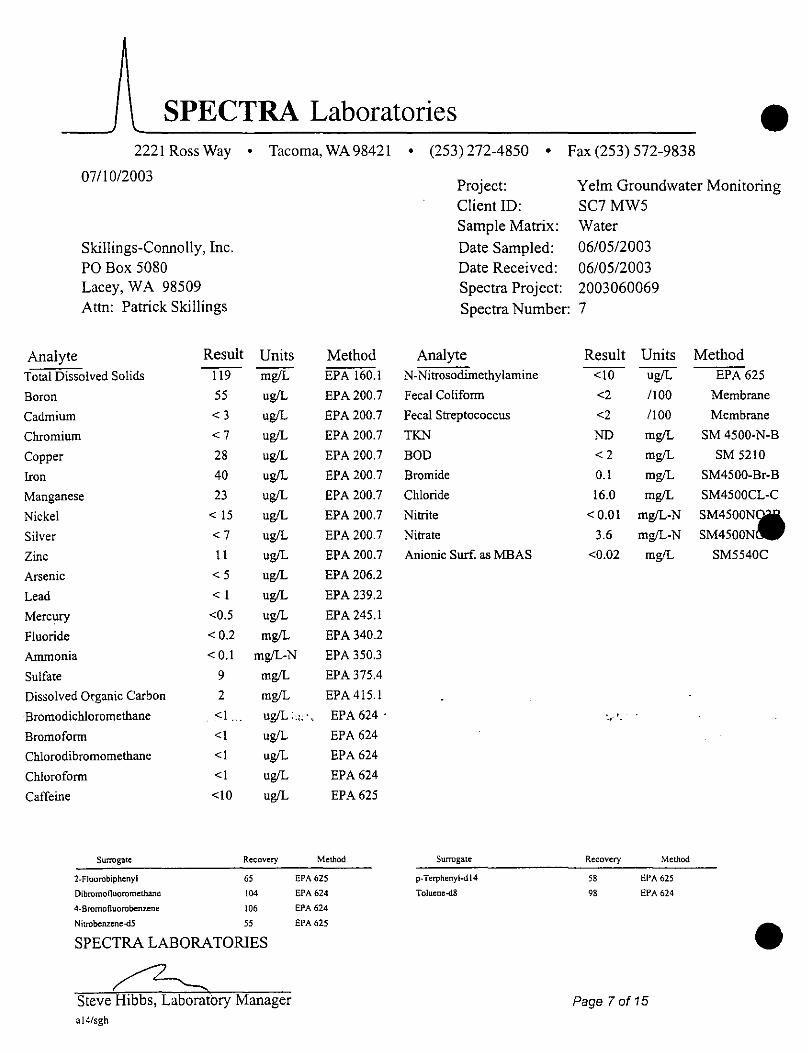
SPECTRA Laboratories • 2221 Ross Way • Tacoma, WA98421
07110/2003
Skillings-Connolly, Inc. PO Box 5080 Lacey, W A 98509 Attn: Patrick Skillings
Analyte Result Units Method Total Dissolved Solids
Boron
Cadmium
Chromium
Copper
Iron
Manganese
Nickel
Silver
Zinc
Arsenic
Lead
Mercury
Fluoride
Ammonia
Sulfate
Dissolved Organic Carbon
·Bromodichloromethane
Bromoform
Chlorodibromomethane
Chloroform
Caffeine
Surrogate
2-Fluorobiphenyl
Dibromofluoromethane
4-Bromof\uorobcnzene
Nitrobenzene-d5
11'9 55
<3
<7
28
40
23
< 15
<7
11
<5
< l
<0.5
<0.2
< 0.1
9
2
<1.
<I
<I
<I
<10
mg/L EPA 160.1
ug/L EPA 200.7
ug/L EPA 200.7
ug/L EPA 200.7
ug/L EPA 200.7
ug/L EPA 200.7
ug/L EPA 200.7
ug/L EPA 200.7
ug/L EPA 200.7
ug/L EPA 200.7
ug/L EPA 206.2
ug/L EPA 239.2
ug/L EPA 245.1
mg!L EPA340.2
mg!L-N EPA 350.3
mg/L EPA 375.4
mg/L EPA 415.1
ug/L .,;; . , EPA 624 ·
ug/L EPA 624
ug/L EPA 624
ug/L EPA624
ug/L EPA 625
Ret:ovcry Method
65 EPA 625
l04 EPA 624
106
55
EPA 624
EPA 625
SPECTRA LABORATORIES
Steve Hibbs, Laboratory Manager al4/sgh
• (253) 272-4850 • Fax (253) 572-9838
Project: Client ID: Sample Matrix:
Date Sampled: Date Received: Spectra Project:
Spectra Number:
Analyte N-Nitrosodimethylamine
Fecal Coliform
Fecal Streptococcus
TKN
BOD
Bromide
Chloride
Nitrite
Nitrate
Anionic Surf. as MBAS
Surrogate
p-Terphenyl-dl4
Toluene-dB
Yelm Groundwater Monitoring SC7MW5 Water 06/05/2003 06/05/2003 2003060069 7
Result Units Method <10 ug/L EPA 625
<2 /100 Membrane
<2 /100 Membrane
NO mg/L SM 4500-N-B
<2 mg/L SM 5210
0.1 mg!L SM4500-Br-B
16.0 mg!L SM4500CL-C
< 0.01 mg/L-N SM4500N-3.6 mg/L-N SM4500N
<0.02 mg!L SM5540C
• •. !_
Recovery Method
58 EPA 625
98 EPA 624
• Page 7 of 15

SPECTRA Laboratories 2221 Ross Way • Tacoma, WA98421
07/10/2003
Analyte
Skillings-Connolly, Inc. PO Box 5080 Lacey, W A 98509 Attn: Patrick Skillings
Result Total Dissolved Solids 298
Boron 500
Cadmium <3
Chromium <7
Copper 35
Iron 54
Manganese 40 .I < 15
<7
Zinc 45
Arsenic <5
Lead <I
Mercury <0.5
Fluoride <0.2
Units Method mg!L EPA 160.1
ug!L EPA 200.7
ug!L EPA 200.7
ug!L EPA 200.7
ug!L EPA 200.7
ug!L EPA 200.7
ug!L EPA 200.7
ug!L EPA 200.7
ug!L EPA 200.7
ug!L EPA 200.7
ug!L EPA 206.2
ug!L EPA 239.2
ug!L EPA 245.1
mg!L EPA 340.2
Ammonia < 0.1 mg!L-N EPA 350.3
Sulfate 31 mg!L
Dissolved Organic Carbon 12 mg!L
Bromodichloromethane .8 ug!L
Bromofonn <I ug!L
Chlorodibromomethane I ug!L
Chlorofonn 39 ug!L
Caffeine <10 ug!L
Surrogate Recovery
2-Fluorobiphenyl 76
Dibromofluoromethane ill
4-Bromofluorobenzene 104
:-litrobenzene-<15 " • SPECTRA LABORATORIES
Steve Hibbs, Laboratory Manager al4/sgh
EPA 375.4
EPA 415.1
EPA 624
EPA 624
EPA 624
EPA 624
EPA 625
Method
EPA 625
EPA 624
EPA 624
EPA 625
• (253) 272-4850 • Fax (253) 572-9838
Project: Client ID: Sample Matrix:
Date Sampled: Date Received:
Yelm Groundwater Monitoring SC8IS Water 06/05/2003 06/05/2003
Spectra Project: 2003060069 Spectra Number: 8
Analyte Result Units Method --
N-Nitrosodimethylarnine <10 ug!L EPA 625
Fecal Colifonn <2 /100 Membrane
Fecal Streptococcus <2 1100 Membrane
TKN 1.2 mg!L SM 4500-N-B
BOD <2 mg!L SM 5210
Bromide 0.1 mg!L SM4500-Br-B
Chloride 67.0 mg!L SM4500CL-C
Nitrite < 0.01 mg!L-N SM4500N02B
Nitrate 2.3 mg!L-N SM4500N03D
Anionic Surf. as MBAS 0.06 mg!L SM5540C
Swrcgatc: Recovery Method
p--Terphenyl-dl4 58 EPA 625
Toluene-d& 97 EPA 624
Page 8 of 15

SPECTRA Laboratories • 2221RossWay • Tacoma,WA98421
07/10/2003
Analyte
Skillings-Connolly, Inc. PO Box 5080 Lacey, W A 98509 Attn: Patrick Skillings
Result Total Dissolved Solids 392
Boron 530
Cadmium <3
Chromium <7
Copper 31
Iron 240
Manganese 77
Nickel < 15
Silver <7
Zinc 30
Arsenic <5
Lead <I
Mercury <0.5
Fluoride <0.2
Units Method mg/L EPA 160.1
ug/L EPA 200.7
ug/L EPA 200.7
ug/L EPA 200.7
ug/L EPA 200.7
ug/L EPA 200.7
ug/L EPA 200.7
ug/L EPA 200.7
ug/L EPA200.7
ug/L EPA 200.7
ug/L EPA 206.2
ug/L EPA 239.2
ug/L EPA 245.1
mg/L EPA 340.2
Ammonia < 0.1 mg/L-N EPA 350.3
Sulfate 21 mg/L EPA 375.4
Dissolved Organic Carbon 11 mg/L EPA 415.1
Bromodichloromethane 2 ugJL··~ :· . EPA 624
Bromoform <I ug/L
Chlorodibromomethane <I ug/L
Chloroform 13 ug/L
Caffeine <10 ug/L
Surrogate Recovery
2-Fluorobiphenyl 52
Dibromotluoromethanc 107
4-Bromofluorobenzene 105
Nitrobcnzene-d5 5I
SPECTRA LABORATORIES
Steve Hibbs, Laboratory Manager al4/sgh
EPA 624
EPA624
EPA 624
EPA 625
Method
EPA 625
EPA 624
EPA 624
EPA 625
• (253) 272-4850 •
Project: Client ID: Sample Matrix:
Date Sampled: Date Received: Spectra Project:
Fax(253)572-9838
Y elm Groundwater Monitoring SC9 CSl Water
06/05/2003 06/05/2003 2003060069
Spectra Number: 9
Analyte N-Nitrosodimethylamine
Fecal Coliform
Fecal Streptococcus
TKN
BOD
Bromide
Chloride
Nitrite
Nitrate
Anionic Surf. as MBAS
Surrogate
p-Terphenyl-dl4
Toluene-d8
Result <10
1030
150
1.0
2
< 0.1
66.5
< O.Gl
<0.5
0.09
Recovery
57
96
Units ug/L
/100
1100
mg/L
mg/L
mg/L
mg/L
mg/L-N
mg/L-N
mg/L
Method
EPA 625
EPA 624
Page 9 of 15
Method EPA 625
Membrane
Membrane
SM 4500-N-B
SM 5210
SM4500-Br-B
SM4500CL-C
SM4500N. SM4500N
SM5540C
•

•---' SPECTRA Laboratories 2221 Ross Way • Tacoma, WA 98421
07110/2003
Skillings-Connolly, Inc. PO Box 5080 Lacey, W A 98509 Attn: Patrick Skillings
Analyte Result Units Method --
Total Dissolved Solids 361 mg!L EPA 160.1
Boron 520 ug!L EPA 200.7
Cadmium <3 ug!L EPA200.7
Chromium <7 ug!L EPA 200.7
Copper 31 ug!L EPA 200.7
!ron 450 ug!L EPA 200.7
Manganese 200 ug!L EPA 200.7 .I < 15 ug!L EPA 200.7
<7 ug!L EPA 200.7
Zinc 30 ug!L EPA 200.7
Arsenic <5 ug!L EPA 206.2
Lead <I ug!L EPA 239.2
Mercury <0.5 ug!L EPA 245.1
Fluoride <0.2 mg!L EPA 340.2
Ammonia < 0.1 mg!L-N EPA 350.3
Sulfate 14 mg!L
Dissolved Organic Carbon 13 mg!L
Bromodichloromethane . <l ug!L
Bromoform <l ug!L
Chlorodibromomethane <l ug!L
Chloroform ug!L
Caffeine <10 ug!L
Surrogate Recovery
2-Fiuorobiphenyl 58
Dibromolluoromethane 113
4-Bromotluorobenzcne 104
Nitrobenzene-d5 lS • SPECTRALABORATORlliS
Steve Hibbs, Laboratory Manager a14/sgh
EPA 375.4
EPA 415.1
EPA 624
EPA624
EPA 624
EPA 624
EPA 625
Method
EPA 625
EPA 624
EPA 624
EPA 625
• (253) 272-4850 •
Project: Client ID: Sample Matrix:
Date Sampled: Date Received: Spectra Project:
Fax (253) 572-9838
Yelm Groundwater Monitoring SClO CS2 Water 0610512003 06/05/2003 2003060069
Spectra Number: I 0
Analyte Result Units Method N-Nitrosodimethylarnine <10 ug!L EPA 625
Fecal Coliform 720 /100 Membrane
Fecal Streptococcus 26 /100 Membrane
TKN 1.4 mg!L SM 4500-N-B
BOD 2 mg!L SM 5210
Bromide < 0.1 mg!L SM4500-Br-B
Chloride 66.0 mg!L SM4500CL-C
Nitrite < 0.01 mg!L-N SM4500N02B
Nitrate <0.5 mg!L-N SM4500N03D
Aoionic Surf. as MBAS 0.08 mg!L SM5540C
I:,
Surrogate Recovery Method
p-T erphenyl-d 14 54 EPA 625
Toluene-dB 97 EPA624
Page 10of15

SPECTRA Laboratories • 2221 Ross Way • Tacoma, WA 98421
07/10/2003
Skillings-Connolly, Inc. PO Box 5080 Lacey, W A 98509 Attn: Patrick Skillings
Analyte Result Units Method Total Dissolved Solids 357 mg/L EPA 160.1
Boron 550 ug/L EPA 200.7
Cadmium <3 ug/L EPA 200.7
Chromium <7 ug/L EPA 200.7
Copper 28 ug/L EPA 200.7
Iron 270 ug/L EPA 200.7
Manganese 240 ug/L EPA 200.7
Nickel < 15 ug/L EPA 200.7
Silver <7 ug/L EPA200.7
Zinc 21 ug/L EPA 200.7
Arsenic <5 ug/L EPA 206.2
Lead <I ug/L EPA 239.2
Mercury <0.5 ug/L EPA 245.1
Fluoride < 0.2 mg/L EPA 340.2
Ammonia 0.3 mg/L-N EPA 350.3
Sulfate 13 mg/L EPA 375.4
Dissolved Organic Carbon 14 mg/L EPA415.1
Bromodichloromethane <I ug/L EPA 624 ·
Bromoform <I ug/L EPA 624
Chlorodibromomethane <I ug/L EPA624
Chloroform <I ug/L EPA624
Caffeine <10 ug/L EPA 625
Surrogate Recovery Method
2-F\uorobiphenyl 62 EPA 625
Dibromofluoromethane 112 EPA 624
4-Bromofluorobenzenc 104 EPA 624
• (253) 272-4850 •
Project: Client ID: Sample Matrix:
Date Sampled: Date Received:
Fax(253)572-9838
Yelm Groundwater Monitoring SCI! CS3 Water 06/05/2003 06/05/2003
Spectra Project: 2003060069 Spectra Number: 11
Analyte Result Units Method N-Nitrosodimethylamine <10 ug/L EPA 625
Fecal Colifonn 170 /100 Membrane
Fecal Streptococcus 20 1100 Membrane
TKN 1.3 mg/L SM 4500-N-B
BOD <2 mg!L SM 5210
Bromide < 0.1 mg/L SM4500-Br-B
Chloride 67.5 mg/L SM4500CL-C
Nitrite < 0.01 mg!L-N SM4500N-Nitrate <0.5 mg/L-N SM4500N
Anionic Surf. as MBAS 0.16 mg/L SM5540C
Surrogate Recovery Method
p-Terphenyl-d\4 52 EPA 625
Toluene-dB 96 EPA 624
Nitrobenzene-d5 62 EPA 625
SPECTRA LABORATORIES •
A Steve Hibbs, Laboratory Manager ai4isgh
Page 11 of15

• SPECTRA Laboratories 2221 Ross Way • Tacoma, WA98421
07110/2003
Skillings-Connolly, Inc.
PO Box 5080
Lacey, WA 98509
Attn: Patrick Skillings
Analyte Result Units Method
Total Dissolved Solids 377 mg!L EPA 160.1
Boron 540 ug!L EPA 200.7
Cadmium <3 ug!L EPA 200.7
Chromium <7 ug!L EPA 200.7
Copper 28 ug!L EPA 200.7
Iron 240 ug!L EPA 200.7
Manganese 240 ug!L EPA 200.7
-I < 15 ug!L EPA 200.7
<7 ug!L EPA 200.7
Zinc 15 ug!L EPA 200.7
Arsenic <5 ug!L EPA 206.2
Lead <I ug!L EPA 239.2
Mercury <0.5 ug!L EPA 245.1
Fluoride <0.2 mg!L EPA 340.2
Ammonia 0.2 mg!L-N EPA 350.3
Sulfate 12 mg!L
Dissolved Organic Carbon 8 mg!L
Bromodichloromethane <I ug!L.
Bromoform <I ug!L
Chlorodibromomethane <I ug!L
Chloroform <I ug!L
Caffeine <10 ug!L
Surrogate Recovery
2-Fiuorobiphcnyl 57
Dibromofluoromethanc 121
4-Bromofluorobenzenc: 105
N itrobenzene-dS 35
• SPECTRA LABORATORIES
Steve Hibbs, Laboratory Manager al4/sgb
EPA 375.4
EPA 415.1
EPA 624
EPA 624
EPA624
EPA624
EPA 625
Method
EPA 625
EPA 624
EPA 624
EPA 625
• (253) 272-4850 • Fax(253)572-9838
Project: Y elm Groundwater Monitoring
Client ID: SC12 CS4
Sample Matrix: Water
Date Sampled: 06/05/2003
Date Received: 06/05/2003
Spectra Project: 2003060069
Spectra Number: 12
Analyte Result Units Method
N-Nitrosodimethylamine <10 ug!L EPA 625
Fecal Coliform 130 /100 Membrane
Fecal Streptococcus 23 1100 Membrane
TKN 1.1 mg!L SM 4500-N-B
BOD 2 mg!L SM 5210
Bromide <0.1 mg!L SM4500-Br-B
Chloride 66.0 mg!L SM4500CL-C
Nitrite < 0.01 mg!L-N SM4500N02B
Nitrate <0.5 mg!L-N SM4500N03D
Anionic Surf. as MBAS 0.18 mg!L SM5540C
_ .. ;·
Sunugate Recovery Method
p.-Terphcnyl-d14 56 EPA 625
Toluc:ne-d8 97 EPA 624
Page 12 of 15

SPECTRA Laboratories • 2221 Ross Way • Tacoma, WA 98421
07/10/2003
Skillings-Connolly, Inc. PO Box 5080 Lacey, W A 98509 Attn: Patrick Skillings
Analyte Result Units Method Total Dissolved Solids
Boron
Cadmium
Chromium
Copper
Iron
Manganese
Nickel
Silver
Zinc
Arsenic
Lead
Mercury
Fluoride
Ammonia
Sulfate
Dissolved Organic Carbon
Bromodichloromethane
Bromoform
Chlorodibromomethane
Chloroform
Caffeine
Surrogate
2-Fluorobiphenyl
Dibromofluoromethane
4-Bmmofluorobenzene
Nitrobenzcne-<15
--225
240
<3
<7
32
17
22
< 15
<7
15
<5
<!
<0.5
< 0.2
< 0.1
9
13
<!
<!
<!
<!
<!0
mg!L EPA !60.1
ug/L EPA 200.7
ug!L EPA 200.7
ug!L EPA 200.7
ug/L EPA 200.7
ug!L EPA 200.7
ug!L EPA 200.7
ug!L EPA 200.7
ug!L EPA200.7
ug!L EPA 200.7
ug/L EPA 206.2
ug!L EPA 239.2
ug!L EPA 245.1
mg/L EPA 340.2
mg!L-N EPA 350.3
mg!L EPA 375.4
mg!L EPA 415.1
ug/L ·EPA 624
ug!L EPA624
ug!L EPA624
ug!L EPA624
ug/L EPA 625
Recovery Method
48 EPA 625
120 EPA 624
107
]]
EPA 624
EPA 625
SPECTRA LABORATORIES
Steve Hibbs, Lab'oratory Manager al4/sgh
• (253)272-4850 • Fax(253)572-9838
Project: Client ID: Sample Matrix:
Date Sampled: Date Received:
Y elm Groundwater Monitoring SC13 FD Water 06/05/2003 0610512003
Spectra Project: 2003060069 Spectra Number: 13
Analyte N-Nitrosodimethylamine
Fecal Coliform
Fecal Streptococcus
TKN
BOD
Bromide
Chloride
Nitrite
Nitrate
Anionic Surf. as MBAS
·. ,. •! l
Surrogate
p--Terphenyl-dl4
Toluene-<18
Result Units <10 ug!L
<2 1100
<2 1100
ND mg/L
<2 mg!L
< 0.1 mg!L
34.0 mg/L
< 0.01 mg/L-N
1.8 mg!L-N
0.04 mg/L
Recovery Method
50 EPA 625
97 EPA 624
Page 13 of 15
Method EPA625
Membrane
Membrane
SM 4500-N-B
SM 5210
SM4500-Br-B
SM4500CL-C
SM4500N-SM4500N
SM5540C
•

• SPECTRA Laboratories 2221 Ross Way • Tacoma, WA98421
07/10/2003
Skillings-Connolly, Inc. PO Box 5080 Lacey, W A 98509 Attn: Patrick Skillings
Analyte Result Units Method Thallium <I ug/L EPA 279.2
Conductivity 15.8 umhos/ EPA 120.1
Total Dissolved Solids 161 mg/L
Barium <2 ug/L
Beryllium <I ug/L
Boron 290 ug/L
Cadmium <3 ug/L
-mium <7 ug/L
er 28 ug/L
Iron < 15 ug/L
Manganese 21 ug/L
Nickel < 15 ug!L
Silver <7 ug!L
Sodium 8400 ug!L
Total Hardness 4500 ug!L
Zinc II ug!L
Antimony <5 ug!L
Arsenic .< 5 ug!L
Lead <I ug!L
Mercury <0.5 ug!L
Selenium <5 ug!L
Fluoride < 0.2 mg/L
Surrogate Recovel)'
2-Fiuorobiphcnyl 43
Dibromolluoromctbanc 118
.;..sromofluorobenzenc !OJ
Nitrobcnzene-d5 45
• SPECTRA LABORATORIES
Steve Hibbs, Laboratory Manager :~.14/sgh
EPA 160.1
EPA 200.7
EPA 200.7
EPA 200.7
EPA 200.7
EPA 200.7
EPA 200.7
EPA 200.7
EPA 200.7
EPA 200.7
EPA 200.7
EPA 200.7
EPA 200.7
EPA 200.7
EPA 204.2
EPA206.2
EPA 239.2
EPA 245.1
EPA 270.2
EPA 340.2
Method
EPA 625
EPA 624
EPA 624
EPA 625
• (253) 272-4850 • Fax (253) 572-9838
Project: Yelm Groundwater Monitoring Client ID: RO Sample Matrix: Water
Date Sampled: 06/05/2003 Date Received: 06/05/2003 Spectra Project: 2003060069 Spectra Number: 14
Analyte Result Units Method Ammonia < 0.1 mg!L-N EPA350.3
Sulfate <I mg!L EPA 375.4
Dissolved Organic Carbon 5 mg!L EPA415.1
Bromodichloromethane 2 ug!L EPA 624
Bromoform <I ug!L EPA 624
Chlorodibromomethane <1 ug!L EPA 624
Chloroform 16 ug!L EPA 624
Caffeine <10 ug!L EPA 625
N-Nitrosodimethylamine <10 ug!L EPA 625
Fecal Coliform <2 /100 Membrane
Fecal Streptococcus <2 /100 Membrane
Color < 1 Color SM 2120B
Turbidity <0.01 ntu SM 2130B
TKN ND mg!L SM 4500-N-B
BOD <2 mg!L SM 5210
Bromide < 0.1 mg!L SM4500-Br-B
Chloride 3.5 mg!L SM4500CL-C
Total Cyanide " 0.< 0.01 mg!L SM4500CN-E
Nitrite < 0.01 mg!L-N SM4500N02B
Nitrate <0.5 mg!L-N SM4500N03D
Total Organic Carbon 10 mg/L SM5310 B
Anionic Surf. as MBAS <0.10 mg/L SM5540C
Surrogate Recovery Method
p-Tcrphenyl-d\4 54 EPA 625
Toluene-dB 78 EPA 624
Page 14 of 15

SPECTRA Laboratories • 2221 Ross Way • Tacoma, WA98421 • (253) 272-4850 • Fax (253) 572-9838
07110/2003 Project: Y elm Groundwater Monitoring Client ID: RW Sample Matrix: Water
Skillings-Connolly, Inc. Date Sampled: 06/05/2003 PO Box 5080 Date Received: 06/05/2003 Lacey, W A 98509 Spectra Project: 2003060069 Attn: Patrick Skillings Spectra Number: 15
Analyte Result Units Method Analyte Thallium <I ug/L EPA 279.2 Ammonia
Conductivity 542 unnhos/ EPA 120.1 Sulfate
Total Dissolved Solids 345 mg/L
Barium 4 ug/L
Beryllium < I ug/L
Boron 510 ug/L
Cadmium <3 ug/L
Chromium <7 ug/L
Copper 36 ug/L
Iron < 15 ug/L
Manganese 43 ug/L
Nickel < 15 ug/L
Silver <7 ug/L
Sodium 83600 ug/L
Total Hardness 68000 ug/L
Zinc 54 ug/L
Antimony <5 ug/L
···Arsenic:· ' ';.
<5 ug/L
Lead <I ug/L
Mercury <0.5 ug/L
Selenium <5 ug/L
Fluoride < 0.2 mg/L
Surrogate Recovery
2-Fluorobiphenyl 113
Dibromofluoromethane 118
4-Bromofluorobenzenc 99
Nitrobenzc:ne-d5 100
SPECTRA LABORATORIES
Steve Hibbs, Laboratory Manager al4/sgh
EPA 160.1 Dissolved Organic Carbon
EPA 200.7 Bromodichloromethane
EPA 200.7 Bromoform
EPA 200.7 Chlorodibromomethane
EPA 200.7 Chloroform
EPA 200.7 Caffeine
EPA 200.7 N-Nitrosodimethylarnine
EPA 200.7 Fecal Coliform
EPA 200.7 Fecal Streptococcus
EPA 200.7 Color
EPA 200.7 Turbidity
EPA 200.7 TKN
EPA 200.7 BOD
EPA 200.7 Bromide
EPA 204.2 .. •. Chloride
EPA 206.2~ -' Total Cyanide
EPA 239.2 Nitrite
EPA 245.1 Nitrate
EPA 270.2 Total Organic Carbon
EPA 340.2 Anionic Surf. as MBAS
Method Smroga<c
EPA 625 p-Terphenyl-dl4
EPA 624 Tolucne-d8
EPA 624
EPA 625
Result <0.1
29
II
8
<I
25
<10
<10
<2
<2
<I
0.16
0.9
<2
0.2
66.5
< 0.01
<0.01
3.5
12
0.16
Recovery
84
84
Units mg/L-N
mg/L
mg/L
ug/L
ug/L
ug/L
ug/L
ug/L
ug/L
/100
/100
Color
ntu
mg/L
mg!L
mg/L
mg/L
mg/L
mg/L-N
mg/L-N
mg/L
mg/L
Method
EPA 62.5
EPA 624
Page 15 of 15
Method EPA 350.3
EPA 375.4
EPA 415.1
EPA 624
EPA 624
EPA 624
EPA 624
EPA62. EPA62
Membrane
Membrane
SM 2120B
SM 2130B
SM 4500-N-B
SM 5210
SM4500-Br-B
SM4500CL-C
.... SM4500CN'E
SM4500N02B
SM4500N03D
SM5310 B
SM5540C
•

ITS.
• SPECTRA Laboratories 2221 Ross Way • Tacoma, WA 98421
11126/2003
Analyte
Skillings-Connolly, Inc. PO Box 5080 Lacey, W A 98509 Attn: Patrick Skillings
Result Total Dissolved Solids 82.0
Boron 0.04
Cadmium <3
Chromium <7
Copper 16
Iron 29
Manganese <2
-1 < 15
<7
Zinc <6
Arsenic <5
Lead < 1
Mercury. <0.5
Fluoride < 0.2
Units Method mg/L EPA 160.1
ug/L EPA 200.7
ug/L EPA 200.7
ug/L EPA 200.7
ug/L EPA 200.7
ug/L EPA 200.7
ug/L EPA 200.7
ug/L EPA 200.7
ug/L EPA 200.7
ug/L EPA200.7
ug/L EPA206.2
ug/L EPA239.2
ug/L EPA 245.1
mg!L EPA 340.2
Ammonia < 0.1 mg/L-N EPA 350.3
Sulfate < 1 mg!L
Dissolved Organic Carbon 5 mg!L
Bromodichloromethane <I ug/L
Bromoform <1 ug!L
Chlorodibromomethane <1 ug!L
Chloroform <1 ug!L
Caffeine <10 ug!L
Surrogate Recovery
Dibromofluoromethanc 80
Toluene-dB 106
4-Bromofluorobcnzenc 100
2-Fluorophenol 18 • SPECTRA LABORATORIES
Steve Hibbs, Laboratory Manager al4/gma
EPA 375.4
EPA415.1
EPA 624
EPA 624
EPA 624
EPA 624
EPA 625
Method
EPA 624
EPA 624
EPA 624
EPA 625
• (253) 272-4850 • Fax (253) 572-9838
Project: Client ID: Sample Matrix:
Date Sampled: Date Received: Spectra Project:
Spectra Number:
Analyte N-Nitrosodimethylamine
Fecal Coliform
Fecal Streptococcus
TKl'l
BOD
Bromide
Chloride
Nitrite
Nitrate
Anionic Surf. as MBAS
Surrogate
Phenol...d6
:-4 itrobenzenc-d5
2-Fluorobiphenyl
2.4,6-Tribromopbcnol
Y elm Groundwater Monitoring SCI CW Water
10/22/2003 10/22/2003 2003100258
Result Units Method <10 ug/L EPA 625
15* 1100 Membrane
0 1100 Membrane
<1 mg/L SM 4500-N-B
<2 mg/L SM 5210
< 0.1 mg/L SM4500-Br-B
3.5 mg/L SM4500CL-C
<0.01 mg/L-N SM4500N02B
2.5 mg/L-N SM4500N03D
<0.02 mg/L SM5540C
Recovery Method
37 EPA 625
-19 EPA 625
~ EPA 625
54 EPA 625
Page 1 of 10

SPECTRA Laboratories 2221 Ross Way • Tacoma, WA 98421
11126/2003
Analyte
Skillings-Connolly, Inc. PO Box 5080 Lacey, W A 98509 Attn: Patrick Skillings
Result Total Dissolved Solids 54.0 Boron 0.02
Cadmium <3
Chromium <7
Copper 6
Iron 720
Manganese 860
Nickel < 15
Silver <7
Zinc <6
Arsenic <5
Lead <I
Mercury <0.5
Fluoride <0.2
Units Method mg/L EPA 160.1
ug/L EPA 200.7
ug/L EPA 200.7
ug/L EPA 200.7
ug/L EPA 200.7
ug/L EPA 200.7
ug/L EPA 200.7
ug/L EPA 200.7
ug/L EPA 200.7
ug/L EPA200.7
ug/L EPA 206.2
ug/L EPA 239.2
ug/L EPA 245.1
mg/L EPA 340.2
Ammonia < 0.1 mg/L-N EPA 350.3
Sulfate mg/L
Dissolved Organic Carbon 4 mg/L
Bromodichloromethane <l ug/L
Bromoform <I ug/L
Chlorodibromomethane <I ug/L
Chloroform <l ug/L
Caffeine <10 ug/L
Surrogate Recovery
Dibromofluoromethane 85
Toluene-d8 106
4-Bromofluorobenzene 101
2-Fiuorophenol 6
SPECTRA LABORATORIES
Steve Hibbs, Laboratoiy Manager a14/gma
EPA 375.4
EPA 415.1
EPA 624
EPA 624
EPA 624
EPA 624
EPA 625
Method
EPA 624
EPA 624
EPA 624
EPA 625
• (253) 272-4850 •
Project: Client ID: Sample Matrix:
Date Sampled: Date Received: Spectra Project: Spectra Number:
Analyte N-Nitrosodimethylamine
Fecal Coliform
Fecal Streptococcus
TKN
BOD
Bromide
Chloride
Nitrite
Nitrate
Anionic Surf. as MBAS
Surrogate
Phenol-rl6
Nitrobenzene-d5
2-F\uorobiphenyl
2,4,6-Tribromophenol
• Fax(253)572-9838
Yelm Groundwater Monitoring SC2MW6 Water 10/22/2003 10/22/2003 2003100258 2
Result Units Method <10 ug/L EPA 625
5 1100 Membrane
10 1100 Membrane
<l mg/L SM 4500-N-B
<2 mg/L SM 5210
< 0.1 mg/L SM4500-Br-B
3.0 mg/L SM4500CL-C
< 0.01 mg/L-N SM4500N. 1.1 mg/L-N SM4500N
<0.02 mg/L SM5540C
Recovery Method
12 EPA 625
59 EPA 625
47 EPA 625
32 EPA 625 • Page 2 of 10

• ----' SPECTRA Laboratories 2221 Ross Way
11126/2003
• Tacoma, WA98421
Skillings-Connolly, Inc. PO Box 5080 Lacey, W A 98509 Attn: Patrick Skillings
Analyte Result Units Method Total Dissolved Solids 62.0 mg!L EPA 160.1
Boron 0.02 ug/L EPA 200.7
Cadmium <3 ug/L EPA 200.7
Chromium <7 ug/L EPA 200.7
Copper <6 ug/L EPA 200.7
Iron 290 ug/L EPA200.7
Manganese 56 ug/L EPA200.7 .I < 15 ug/L EPA200.7
<7 ug/L EPA 200.7
Zinc <6 ug/L EPA 200.7
Arsenic <5 ug/L EPA 206.2
Lead <1 ug/L EPA 239.2
Mercury <0.5 ug/L EPA 245.1
Fluoride <0.2 mg!L EPA 340.2
Ammonia < 0.1 mg/L-N EPA 350.3
Sulfate <1 mg!L
Bromodichloromethane <1 ug/L
Bromoform <1 ug/L
Chlorodibromomethane <l ug/L
Chloroform <l ug/L
Caffeine <10 ug/L
N-Nitrosodimethylamine <10 ug!L
Surrogate Recovery
Dibromonuoromethane 89
Toluene-d8 106
"'-Bromofluombenzene 102
2-Fiuorophenol 47 • SPECTRA LABORATORIES
Steve Hibbs, Laboratory Manager a14/gma
EPA375.4
EPA 624
EPA 624
EPA 624
EPA 624
EPA 625
EPA 625
Method
EPA 624
EPA 624
EPA 624
EPA 625
• (25 3) 272-4850 • Fax (253) 572-9838
Project: Client ID: Sample Matrix:
Date Sampled: Date Received: Spectra Project:
Y elm Groundwater Monitoring SC3 MWl Water 10/22/2003 10/22/2003 2003100258
Spectra Number: 3
Analyte Result Units Method Fecal Coliform 0 7f(jQ Membrane
Fecal Streptococcus 990 /100 Membrane
TK.."' <l mg!L SM 4500-N-B
BOD <2 mg/L SM 5210
Bromide < 0.1 mg/L SM4500-Br-B
Chloride 5.0 mg/L SM4500CL-C
Nitrite < O.Gl mg/L-N SM4500N02B
Nitrate 3.0 mg!L-N SM4500N03D
Dissolved Organic Carbon 4 mg!L SM5310B
Anionic Surf. as MBAS <0.02 mg!L SM5540C
Surrogate Recovery Method
Phenol-d6 81 EPA 625
~itrobenzene-dS 100 EPA625
2-Fluorobiphenyl 80 EPA 625
1,4,6-Tribmm()phenol 75 EPA 625
Page 3 of 10

SPECTRA Laboratories 2221 Ross Way • Tacoma, WA98421 • (253) 272-4850 • Fax(253)572-9838
10/06/2003 Project: Y elm Groundwater Client ID: SC3 MWl
Skillings-Connolly, Inc. Sample Matrix: Water
PO Box 5080 Date Sampled: 09111/2003 Lacey, WA 98509 Date Received: 09/1112003 Attn: Patrick Skillings Spectra Project: 2003090138
Spectra Number: 2
Analyte Result Units --Total Dissolved Solids 81 mg/L Bromodichloromethane <1 ug/L Bromoform <1 ug/L Chlorodibromomethane <1 ug/L Chloroform <1 ug/L Fecal Coliform 2* /100 mls. Fecal Streptococcus 0 /100 mls. TKN ND mg/L Chloride 4.0 mg/L Nitrite < 0.01 mg/L Nitrate 2.91 mg/L-N
Fecal Coliform, Fecal Strep., and TK.!'Is were analyzed by STL Seattle.
Recovery Method
Dibromolluoromethane 93 EPA 624
Toluene-d8 99 EPA 624
4-Bromofluorobenzene 102 EPA 624
SPECTRA LABORATORIES
~ Steve Hibbs, Laboratory Manager a5/sgh
Method EPA 160.1 EPA624 EPA624 EPA624 EPA624
Membrane Filtration Membrane Filtration
SM4500-N-B SM4500CL-C SM4500N02B SM4500N03D
Page 2 of14
•
•
•
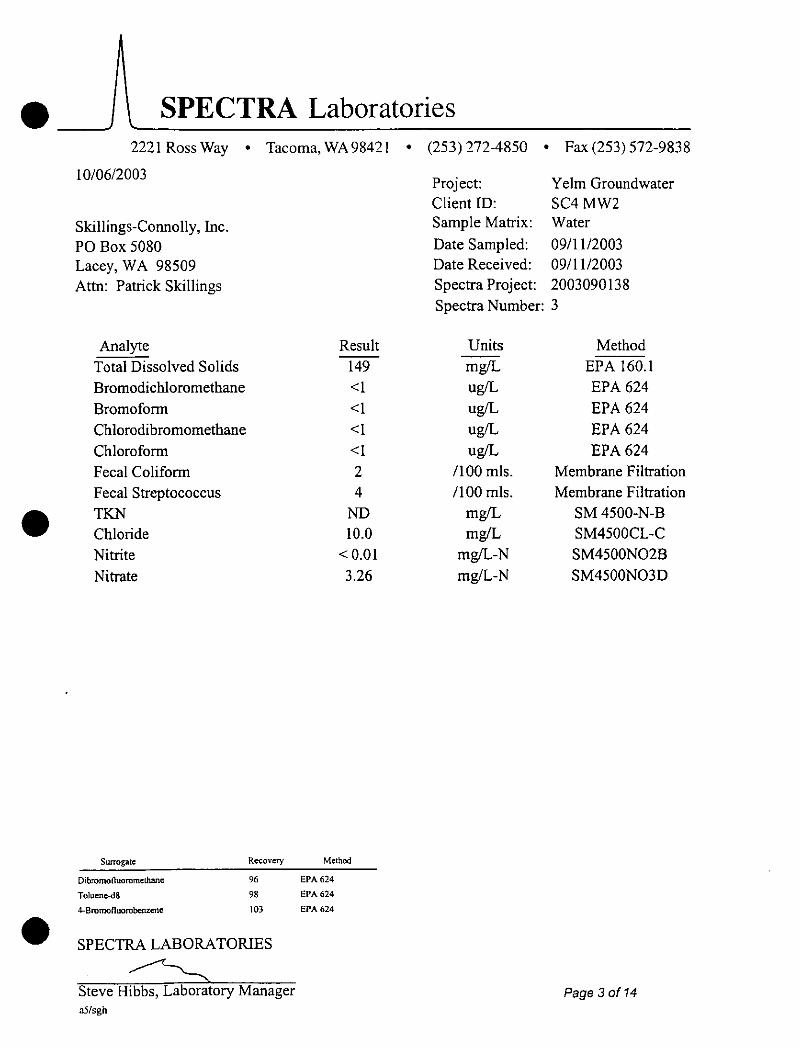
•
•
•
SPECTRA Laboratories 2221 Ross Way • Tacoma, WA 98421
10/06/2003
Skillings-Connolly, Inc. PO Box 5080 Lacey, WA 98509 Attn: Patrick Skillings
Analyte Result Total Dissolved Solids 149 Bromodichloromethane <I
Bromoform <I Chlorodibromomethane <I
Chloroform <I Fecal Coliform 2 Fecal Streptococcus 4
TKN ND Chloride 10.0
Nitrite < 0.01
Nitrate 3.26
Surrogate Recovery Method
Dibromotluoromethane 96 EPA 624
Toluc:nc-d8 98 EPA 624
4-Bromofluorobenzene \03 EPA 624
SPECTRA LABORATORIES
~ Steve Hibbs, Laboratory Manager a5/sgh
• (253) 272-4850 • Fax (253) 572-9838
Project: Y elm Groundwater Client ID: SC4MW2 Sample Matrix: Water
Date Sampled: 09/11/2003 Date Received: 09/11/2003 Spectra Project: 2003090138 Spectra Number: 3
Units Method mg!L EPA 160.1 ug!L EPA624 ug!L EPA624
ug/L EPA624
ug/L EPA 624 /100 mls. Membrane Filtration /100 mls. Membrane Filtration
mg/L SM4500-N-B mg/L SM4500CL-C
mg!L-N SM4500N02B mg/L-N SM4500N03D
Page 3 of14

SPECTRA Laboratories 2221 Ross Way • Tacoma, WA98421
10/06/2003
Skillings-Connolly, Inc. PO Box 5080 Lacey, W A 98509 Attn: Patrick Skillings
Analyte Result --Total Dissolved Solids 255 Bromodichloromethane <I
Bromoform <I
Chlorodibromomethane <I
Chloroform <I
Fecal Coliform 10 Fecal Streptococcus 0 TKN ND Chloride 19.5 Nitrite 0.02 Nitrate 1.64
Surrogate Recovery Method
Dibromofluoromethane 96 EPA 624
Toluene-d8 98 EPA 624
4-Bromofluorobcnzene 104 EPA 624
SPECTRA LABORATORIES
~ Steve Hibbs, Laboratory Manager a5/sgh
• (253) 272-4850 • Fax(253)572-9838
Project: Y elm Groundwater Client ID: SC5MW3 Sample Matrix: Water
Date Sampled: 09/11/2003 Date Received: 09/11/2003 Spectra Project: 2003090138 Spectra Number: 4
Units Method mg/L EPA 160.1 ug/L EPA624 ug!L EPA624 ug/L EPA624 ug/L EPA624
/100 mls. Membrane Filtration /100 mls. Membrane Filtration
mg/L SM4500-N-B mg!L SM4500CL-C
mg/L-N SM4500N02B mg/L-N SM4500N03D
Page 4 of 14
•
•
•

•
•
•
SPECTRA Laboratories 2221 Ross Way • Tacoma, WA98421
10/06/2003
Skillings-Connolly, Inc. PO Box 5080 Lacey, W A 98509 Attn: Patrick Skillings
Analyte Result --Total Dissolved Solids 143 Bromodichloromethane <1 Bromoform <1 Chlorodibromomethane <1 Chloroform <1
Fecal Coliform 2 Fecal Streptococcus 6 TKN ND Chloride 61.5 Nitrite < 0.01 Nitrate 3.02
Surrogate Recovery Method
Dibromotluoromethanc 98 EPA 624
Toluenc-<18 98 EPA 624
4-Bromofluorobenzenc 103 EPA624
SPECTRA LABORATORIES
~'---,__ Steve Hibbi,Laboratory Manager o5/sgh
• (253) 272-4850 • Fax (253) 572-9838
Project: Y elm Groundwater Client ID: SC6MW4 Sample Matrix: Water
Date Sampled: 09/11/2003 Date Received: 09/1112003 Spectra Project: 2003090138 Spectra Number: 5
Units Method mg!L EPA 160.1 ug!L EPA 624 ug!L EPA 624 ug!L EPA 624 ug!L EPA 624
/100 mls. Membrane Filtration /100 mls. Membrane Filtration
mg!L SM4500-N-B mg!L SM4500CL-C
mg!L-N SM4500N02B mg!L-N SM4500N03D
Page 5 of14

SPECTRA Laboratories 2221 Ross Way • Tacoma, WA 98421
10/06/2003
Skillings-Connolly, Inc. PO Box 5080 Lacey, W A 98509 Attn: Patrick Skillings
Analyte Result --Total Dissolved Solids 122
Bromodichloromethane <1
Bromoform <1
Chlorodibromomethane <1
Chloroform <1
Fecal Coliform 8
Fecal Streptococcus 8
TKN NO Chloride 21.5
Nitrite O.Dl Nitrate 2.76
Surrogate Recovery Method
Dibromofluoromethane 98 EPA 624
Toluene-d8 97 EPA 624
4-Bromofluorobenzene 103 EPA624
SPECTRA LABORATORIES
~ Steve Hibbs, Laboratory Manager a5/sgh
• (253) 272-4850 • Fax(253)572-9838
Project: Y elm Groundwater Client ID: SC7MW5 Sample Matrix: Water
Date Sampled: 09/11/2003 Date Received: 09111/2003 Spectra Project: 2003090138 Spectra Number: 6
Units Method --mg/L EPA 160.1
ug/L EPA624
ug/L EPA624 ug/L EPA624
ug/L EPA624 /100 mls. Membrane Filtration
/100 mls. Membrane Filtration mg/L SM 4500-N-B mg/L SM4500CL-C
mg/L-N SM4500N02B
mg/L-N SM4500N03D
Page 6 of 14
•
•
•

• SPECTRA Laboratories 2221 Ross Way • Tacoma, WA 98421
11/26/2003
Analyte
Skillings-Connolly, Inc. PO Box 5080 Lacey, W A 98509 Attn: Patrick Skillings
Result ---
Total Dissolved Solids 249.0
Boron 0.40
Cadmium <3
Chromium <7
Copper <6
Iron 60
Manganese 3
~~~ < 15
<7
Zinc 29
Arsenic <5
Lead <I
Mercury <0.5
Fluoride < 0.2
Units Method mg!L EPA 160.1
ug!L EPA 200.7
ug!L EPA 200.7
ug!L EPA 200.7
ug!L EPA 200.7
ug!L EPA 200.7
ug!L EPA 200.7
ug!L EPA 200.7
ug!L EPA 200.7
ug!L EPA 200.7
ug!L EPA 206.2
ug!L EPA 239.2
ug!L EPA 245.1
mg!L EPA 340.2
Ammonia < 0.1 mg!L-N EPA 350.3
Sulfate 27 mg!L
Dissolved Organic Carbon 9 mg!L
Bromodichloromethane 11- ug!L
Bromoform <l ug!L
Chlorodibromomethane l ug!L
Chloroform 35 ug!L
Caffeine <10 ug!L
Surrogate Recovery
Dibromofluoromethane 92
Toluene-dB 109
4·Brnmofluorobenzene 102
2·Fiuorophenol 51 • SPECTRA LABORATORIES
Steve Hibbs, Laboratory Manager al4/gma
EPA 375.4
EPA 415.1
EPA 624
EPA 624
EPA624
EPA 624
EPA 625
Method
EPA 624
EPA 624
EPA 624
EPA 625
• (253) 272-4850 •
Project: Client ID: Sample Matrix:
Date Sampled: Date Received: Spectra Project: Spectra Number:
Analyte N-Nitrosodimethylamine
Fecal Coliform
Fecal Streptococcus
TKN
BOD
Bromide
Chloride
Nitrite
Nitrate
Anionic Surf. as MBAS
Surrogate
Phenol-d6
Nitrobenzene-dS
2-Fiuorobiphenyl
2.4.6-Tribromophenol
Fax (253) 572-9838
Yelm Groundwater Monitoring SC8 IS Water 10/22/2003 10/22/2003 2003100258 4
Result Units Method <10 ug!L EPA 625
0 /100 Membrane
5 /100 Membrane
<l mg!L SM 4500-N-B
<2 mg!L SM 5210
< 0.1 mg!L SM4500-Br-B
55.0 mg!L SM4500CL-C
< 0.01 mg!L-N SM4500N02B
3.9 mg!L-N SM4500N03D
0.060 mg!L SM5540C
Recovery Method
77 EPA 625
90 EPA 625
76 EPA 625
73 EPA 625
Page 4 of 10
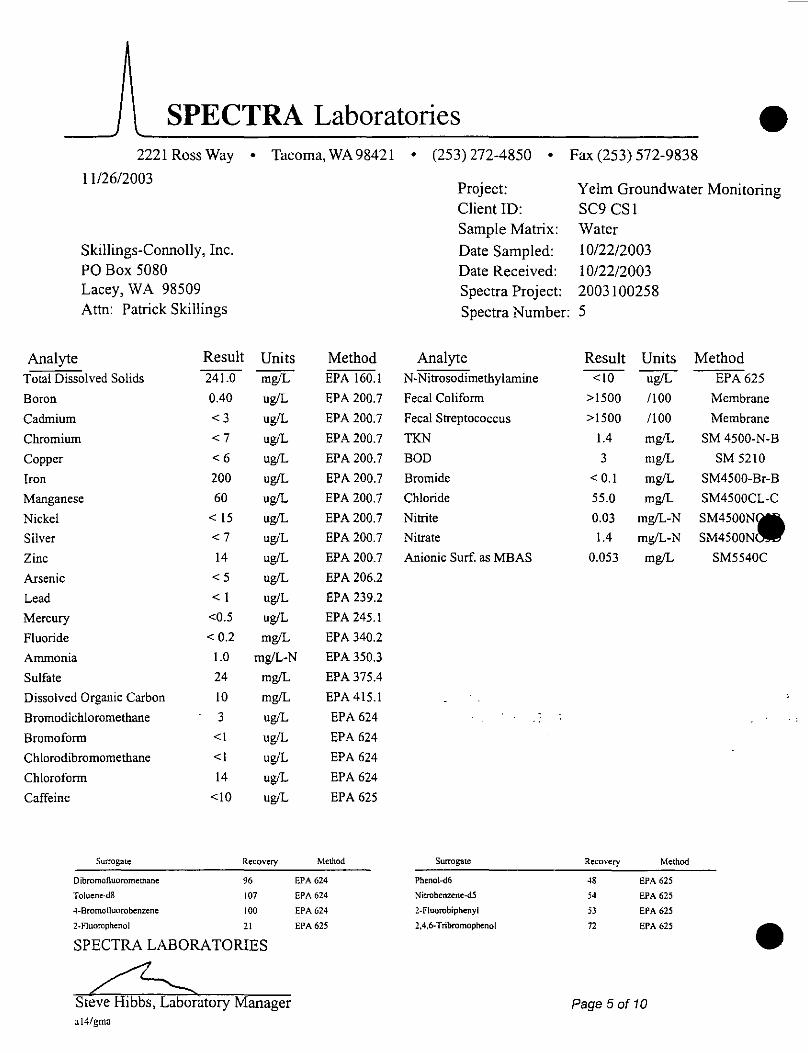
SPECTRA Laboratories 2221 Ross Way • Tacoma, WA 98421
11126/2003
Analyte
Skillings-Connolly, Inc. PO Box 5080 Lacey, WA 98509 Attn: Patrick Skillings
Result Total Dissolved Solids 241.0
Boron 0.40
Cadmium <3
Chromium <7
Copper <6
Iron 200
Manganese 60
Nickel < 15
Silver <7
Zinc 14
Arsenic <5
Lead < l
Mercury <0.5
Fluoride <0.2
Units Method mg/L EPA 160.1
ug/L EPA 200.7
ug/L EPA 200.7
ug/L EPA 200.7
ug/L EPA 200.7
ug/L EPA 200.7
ug/L EPA 200.7
ug/L EPA 200.7
ug/L EPA 200.7
ug/L EPA 200.7
ug/L EPA 206.2
ug/L EPA 239.2
ug/L EPA 245.1
mg/L EPA 340.2
Ammonia l.O mg/L-N EPA 350.3
Sulfate 24 mg/L
Dissolved Organic Carbon 10 mg/L
Bromodichloromethane 3 ug/L
Bromoform <I ug/L
Chlorodibromomethane <I ug/L
Chloroform 14 ug/L
Caffeine <10 ug/L
Surrogate Recovery
Dibromolluornmethane 96
Toluene-d8 107
4-Bromotluorobenzene 100
2-Fluorophenol 21
SPECTRA LAB ORA TORIES
Steve Hibbs, Laboratory Manager ai4/gma
EPA 375.4
EPA415.1
EPA 624
EPA 624
EPA 624
EPA 624
EPA 625
Method
EPA 624
EPA 624
EPA 624
EPA 625
• (253) 272-4850 •
Project: Client ID: Sample Matrix:
Date Sampled: Date Received: Spectra Project: Spectra Number:
Analyte N-Nitrosodimethylamine
Fecal Coliform
Fecal Streptococcus
TKN
BOD
Bromide
Chloride
Nitrite
Nitrate
Anionic Surf. as MBAS
Surrogate
Phenol-d6
Nitrobenzene-d5
2-Fluorobiphenyl
2,4,6-Tribromophenol
• Fax (253) 572-9838
Yelm Groundwater Monitoring SC9 CS1 Water 10/22/2003 10/22/2003 2003100258 5
Result Units Method <10 ug/L EPA 625
>1500 /100 Membrane
>1500 /100 Membrane
1.4 mg/L SM 4500-N-B
3 mg/L SM 5210
< 0.1 mg/L SM4500-Br-B
55.0 mg/L SM4500CL-C
0.03 mg/L-N SM4500N. 1.4 mg/L-N SM4500N
0.053 mg/L SM5540C
Recovery Method
48 EPA 625
54 EPA 625
53 EPA 625
72 EPA 625 • Page 5 of 10

• _ __, SPECTRA Laboratories 2221 Ross Way
11/26/2003
• Tacoma, WA98421
Analyte
Skillings-Connolly, Inc. PO Box 5080 Lacey, WA 98509 Attn: Patrick Skillings
Result Total Dissolved Solids 336.0
Boron 0.41
Cadmium <3
Chromium <7
Copper <6
Iron 310
Manganese 94 .I < 15
<7
Zinc 8
Arsenic <5
Lead <I
Mercury <0.5
Fluoride <0.2
Units Method mg/L EPA 160.1
ug/L EPA 200.7
ug/L EPA 200.7
ug/L EPA 200.7
ug/L EPA 200.7
ug/L EPA 200.7
ug/L EPA 200.7
ug/L EPA 200.7
ug/L EPA 200.7
ug/L EPA 200.7
ug/L EPA 206.2
ug/L EPA 239.2
ug/L EPA 245.1
mg!L EPA 340.2
Ammonia 0.2 mg/L-N EPA 350.3
Sulfate 22 mg/L
Dissolved Organic Carbon 12 mg!L
Bromodichloromethane <I ug/L
Bromoform <1 ug/L
Ch1orodibromomethane <I ug/L
Chloroform ug/L
Caffeine <10 ug/L
Surrogate Recovery
Dibromolluoromethane 94
Toluene-d8 109
+.Bromofluorobenzene 102
z~Fiuomphenol 34 • SPECTRA LABORATORIES
Steve Hibbs, Laboratory Manager al4/gma
EPA 375.4
EPA 415.1
EPA 624.
EPA624
EPA 624
EPA 624
EPA 625
Method
EPA 624
EPA 624
EPA 624
EPA 62S
• (253) 272-4850 •
Project: Client ID: Sample Matrix:
Date Sampled: Date Received: Spectra Project:
Spectra Number:
Analyte N-Nitrosodimethylamine
Fecal Coliform
Fecal Streptococcus
TK.t'l
BOD
Bromide
Chloride
Nitrite
Nitrate
Anionic Surf. as MBAS
Surrogate
Phenol.d6
Nitrobenzene..d5
2-Fiuorobiphenyl
2.4.6-Tribmmophenol
Fax (253) 572-9838
Yelm Groundwater Monitoring SClO CS2 Water
10/22/2003 10/22/2003 2003100258 6
Result Units Method <10 ug/L EPA 625
1080 /100 Membrane
>1500 /100 Membrane
1.8 mg/L SM 4500-N-B
8 mg!L SM 5210
< 0.1 mg!L SM4500-Br-B
63.0 mg!L SM4500CL-C
0.01 mg/L-N SM4500N02B
0.6 mg!L-N SM4500N03D
0.025 mg!L SM5540C
Recovery Method
59 EPA 625
79 EPA 625
69 EPA 625
72 EPA 625
Page 6 of 10

SPECTRA Laboratories • 2221RossWay • Tacoma,WA98421
11/26/2003
Analyte
Skillings-Connolly, Inc. PO Box 5080 Lacey, W A 98509 Attn: Patrick Skillings
Result Units Total Dissolved Solids
Boron
360.0 mg/L
0.42 ug!L
Cadmium < 3 ug!L
Chromium < 7 ug!L
Copper < 6 ug!L
Iron 190 ug/L
Manganese 66 ug!L
Nickel < 15 ug/L
Silver <7 ug!L
Zinc < 6 ug!L
Arsenic < 5 ug!L
Lead < I ug/L
Mercury <0.5 ug!L
Fluoride < 0.2 mg/L
Ammonia 0.3 mg!L-N
Method EPA 160.1
EPA200.7
EPA 200.7
EPA 200.7
EPA 200.7
EPA200.7
EPA200.7
EPA 200.7
EPA 200.7
EPA200.7
EPA 206.2
EPA239.2
EPA 245.1
EPA 340.2
EPA 350.3
EPA 375.4
EPA 415.1
EPA 624
EPA 624
EPA 624
EPA 624
EPA 625
Sulfate
Dissolved Organic Carbon
Bromodichloromethane
Bromoform
Chlorodibromomethane
Chloroform
Caffeine
22 mg!L
7 mg!L
.<1. '·· ug!L
<I
<I
<I
<10
ug!L
ug!L
ug!L
ug!L
*Microbioloical tests were performed by STL-Seattle.
Surrogate
Dibromolluoromethane
Toluene-dB
4·Bromotluorobenzenc
2-Fiuorophenol
Recovery Method
93 EPA 624
109 EPA 624
\00
28
EPA 624
EPA 625
SPECTRA LABORATORIES
Steve Manager al4/gma
• (253) 272-4850 • Fax(253)572-9838
Project: Client ill:
Y elm Groundwater Monitoring SCll CS3
Sample Matrix: Water Date Sampled: 10/22/2003 Date Received: 10/22/2003 Spectra Project: 2003100258 Spectra Number: 7
Analyte N-Nitrosodimethylamine
Fecal Coliform
Fecal Streptococcus
TKN
BOD
Bromide
Chloride
Nitrite
Nitrate
Anionic Surf. as MBAS
Surrogate
Phenol-d6
Nitrobenzene-d5
2 · Fluorobipbcnyl
2,4,6-Tribromophenol
Result <10
>1500
260
1.3
3
< 0.1
61.5
<0.01
0.5
<0.02
Units ug!L
/100
1100
mg/L
mg!L
mg!L
mg!L
mg!L-N
mg/L-N
mg/L
Recovery Method
50 EPA 625
55 EPA 625
52
67
EPA 625
EPA 625
Page 7 of 10
Method EPA 625
Membrane
Membrane
SM 4500-N-B
SM 5210
SM4500-Br-B
SM4500CL-C
SM4500Niilli.
SM4500N.
SM5540C
•

• SPECTRA Laboratories 2221 Ross Way • Tacoma, WA 98421
11126/2003
Analyte
Skillings-Connolly, Inc. PO Box 5080 Lacey, W A 98509 Attn: Patrick Skillings
Result Total Dissolved Solids 308.0
Boron 0.39
Cadmium <3
Chromium <7
Copper <6
Iron 160
Manganese 170
.I < 15
<7
Zinc <6
Arsenic <5
Lead <I
Mercury <0.5
Fluoride < 0.2
Units Method mg/L EPA 160.1
ug/L EPA 200.7
ug/L EPA 200.7
ug/L EPA 200.7
ug/L EPA 200.7
ug/L EPA 200.7
ug/L EPA 200.7
ug/L EPA 200.7
ug/L EPA 200.7
ug!L EPA 200.7
ug/L EPA 206.2
ug/L EPA 239.2
ug/L EPA 245.1
mg/L EPA 340.2
Ammonia < 0.1 mg/L-N EPA 350.3
Sulfate 18 mg/L
Dissolved Organic Carbon 7 mg/L
Bromodichloromethane <I ug/L
Bromoform <I ug/L
Chlorodibromomethane <I ug/L
Chloroform <I ug/L
Caffeine <10 ug/L
Surrogate Recovery
Dibromofluoromethane 95
Toluene-dB 109
4-Bromofluorobenzene 100
2-Fluorophenol 28 • SPECTRA LABORATORIES
Steve Hibbs, Laboratory Manager al4/gma
EPA 375.4
EPA 415.1
. EPA.624
EPA 624
EPA 624
EPA 624
EPA 625
Method
EPA 624
EPA 624
EPA 624
EPA 62.5
• (253) 272-4850 •
Project: Client ID: Sample Matrix:
Date Sampled: Date Received: Spectra Project:
Fax (253) 572-9838
Y elm Groundwater Monitoring SC12 CS4 Water 10/22/2003 10122/2003 2003100258
Spectra Number: 8
Analyte Result Units Method ---
N-Nitrosodimethylamine <10 ug/L EPA 625
Fecal Coliform 930 /100 Membrane
Fecal Streptococcus 860 1100 Membrane
TKN <I mg/L SM 4500-N-B
BOD 5 mg/L SM 5210
Bromide < 0.1 mg/L SM4500-Br-B
Chloride 61.0 mg/L SM4500CL-C
Nitrite < 0.01 mg/L-N SM4500N02B
Nitrate 0.4 mg/L-N SM4500N03D
Anionic Surf. as MBAS 0.029 mg/L SM5540C
Surrogate Recovery Method
Phenol-d6 -16 EPA 625
Nitrobenzcnc-<15 -19 EPA 625
2-Floornbiphenyi 50 EPA 625
2.4.6-Tribromophenol 75 EPA 625
Page 8 of 10

SPECTRA Laboratories • 2221 Ross Way • Tacoma, WA 98421
11/26/2003
Skillings-Connolly, Inc. PO Box 5080 Lacey, W A 98509 Attn: Patrick Skillings
Analyte Result Units Method Total Dissolved Solids 253.8 mg!L EPA 160.1
Boron 0.42 ug!L EPA 200.7
Cadmium <3 ug!L EPA 200.7
Chromium <7 ug!L EPA 200.7
Copper <6 ug!L EPA 200.7
Iron 220 ug!L EPA 200.7
Manganese 70 ug!L EPA 200.7
Nickel < 15 ug!L EPA 200.7
Silver <7 ug!L EPA 200.7
Zinc <6 ug!L EPA 200.7
Arsenic <5 ug!L EPA 206.2
Lead < I ug!L EPA 239.2
Mercury <0.5 ug!L EPA 245.1
Fluoride < 0.2 mg!L EPA 340.2
Ammonia 0.3 mg!L-N EPA 350.3
Sulfate 7 mg!L EPA 375.4
Dissolved Organic Carbon 7 mg!L EPA 415.1
Bromodichloromethane <I :ug!L .. ·EPA 624
Bromofonn <I ug!L EPA 624
Chlorodibromomethane <I ug!L EPA 624
Chlorofonn <I ug!L EPA 624
Caffeine <10 ug!L EPA 625
Surrogate Recovery Method
Dibromofluoromethane 94 EPA 624
Toluene-d8 108 EPA 624
4·8romofluorobenzene 101 EPA 624
2-F\uorophenol 0 EPA 625
SPECTRA LABORATORIES
Manager al4/gma
• (253) 272-4850 • Fax (253) 572-9838
Project: Client ID: Sample Matrix:
Date Sampled: Date Received: Spectra Project:
Spectra Number:
Analyte N-Nitrosodimethylamine
Fecal Colifonn
Fecal Streptococcus
TKN
BOD
Bromide
Chloride
Nitrite
Nitrate
Anionic Surf. as MBAS
Surrogate
Phenol-d6
:-.l'itrobenzene-d5
2-Fluorobiphenyl
2.4,6-Tribromophenol
Yelm Groundwater Monitoring SC13 FD Water
10/22/2003 10/22/2003 2003100258 9
Result Units Method <10 ug/L EPA 625
240 /100 Membrane
220 /100 Membrane
<l mg/L SM 4500-N-B
2 mg/L SM 5210
< 0.1 mg/L SM4500-Br-B
62.5 mg/L SM4500CL-C
< 0.01 mg/L-N SM4500N.
0.4 mg/L-N SM4500N
0.023 mg/L SM5540C
n '
Recovery Method
14 EPA 625
10 EPA 625
27 EPA 625
71 EPA 625 • Page 9 of 10

• SPECTRA Laboratories 2221 Ross Way • Tacoma, WA 98421 •
11126/2003
Skillings-Connolly, Inc. PO Box 5080
(253) 272-4850 •
Project: Client ID: Sample Matrix:
Date Sampled: Date Received:
Fax (253) 572-9838
Yelm Groundwater Monitoring RW Water 10/22/2003 10/22/2003
Lacey, W A 98509 Attn: Patrick Skillings
Spectra Project: 2003100258 Spectra Number: 10
Analyte Result Units Method Analyte Result Units Method Total Dissolved Solids 268.8 mg/L EPA 160.1 N-Nitrosodimethylamine <iO ug!L EPA 625
Boron 0.41 ug/L EPA 200.7 Fecal Coliform 0 /100 Membrane
Cadmium <3 ug/L EPA 200.7 Fecal Streptococcus 0 1100 Membrane
Chromium <7 ug/L EPA 200.7 TKN <1 mg!L SM4500-N-B
Copper <6 ug!L EPA 200.7 BOD <2 mg/L SM 5210
Iron < 15 ug/L EPA 200.7 Bromide < 0.1 mg/L SM4500-Br-B
Manganese <2 ug/L EPA 200.7 Chloride 55.0 mg!L SM4500CL-C
-1 < 15 ug!L EPA 200.7 Nitrite
<7 ug/L EPA 200.7 Nitrate
< 0.01 mg!L-N SM4500N02B
3.7 mg/L-N SM4500N03D
Zinc 29 ug!L EPA 200.7 Anionic Surf. as MBAS 0.021 mg/L SM5540C
Arsenic <5 ug/L EPA 206.2
Lead <I ug/L EPA 239.2
Mercury <0.5 ug/L EPA245.1
Fluoride <0.2 mg!L EPA 340.2
Ammonia <0.1 mg/L-N EPA 350.3
Sulfate 26 mg/L EPA 375.4
Dissolved Organic Carbon 4 mg!L EPA 415.1 _..... __ _
Bromodichloromethane 12 ug/L EPA 624
Bromoform <1 ug/L EPA 624
Chlorodibromomethane 2 ug!L EPA 624
Chloroform 30 ug/L EPA 624
Caffeine <10 ug/L EPA 625
Surrogate Recm·ery Method Surrogate Recovery Method
Dibromofluoromethane 96 EPA 624 Phenol-d6 4 EPA 625
Toluene-dB 109 EPA 624 Nitrobenzene-J5 47 EPA 625
4-Brnmofluorobenzene !OJ EPA 624 2-Fiuorobiphenyl " EPA 625
• 2-Fiuorophenol 0 EPA 625 2,4,6-Tribromophenol 51 EPA 625
SPECTRA LABORATORIES
Steve Manager Page 10 of 10 al4/gma

Parameter Fecal Coliform, MF Fecal Strep
Parameter Fecal Coliform, MF Fecal Strep Total Kjeldahl Nitrogen
Parameter Fecal Coliform, MF Fecal Strep Total Kjeldahl Nitrogen
Parameter Fecal Coliform, MF Fecal Strep Total Kjeldahl Nitrogen
Parameter Fecal Coliform, MF Fecal Strep Total Kjeldahl Nitrogen
STL Seattle
Client Name Project Name Date Received
Spectra Laboratories 2003090138
09-11-03
General Chemistry Parameters
Client Sample ID LabiD
Method SM 92220 SM 9230C
Client Sample ID Lab ID
Method SM 92220 SM 9230C EPA 351.2
Client Sample ID Lab ID
Method SM 92220 SM 9230C EPA351.2
Client Sample ID LabiD
Method SM 92220 SM 9230C EPA 351.2
Client Sample ID Lab ID
Method SM92220 SM 9230C EPA 351.2
Date Analyzed 09-11-03 09-11-03
Date Analyzed 09-11-03 09-11-03 09-22-03
Date Analyzed 09-11-03 09-11-03 09-22-03
Date Analyzed 09-11-03 09-11-03 09-22-03
Date Analyzed 09-11-03 09-11-03 09-22-03
2003090138-01 116053-01
Units CFU/100 ml CFU/100 ml
2003090138-02 116053-02
Units CFU/100 ml CFU/100 ml
mg/L
2003090138-03 116053-03
Units CFU/100 ml CFU/100 ml
mg/L
2003090138-04 116053-04
Units CF.UL100 ml
' . GFU/100 ml .. mg/L
2003090138-05 116053-05
Units CFU/100 ml CFU/100 ml
mg/L
Result 0 0
Result 12 6
NO
Result 2 0
NO
Result 2
- .. 4 .··
NO
Result 10 0
NO
STL Seattle is a part of Severn Trent Laboratories, Inc.
•
POL 2 2
POL 2 2
0.5
• POL 2 2
0.5
POL 2 l ~. . . . 2
0.5
POL 2 2
0.5
• v

• Parameter Fecal Coliform, MF Fecal Strep Total Kjeldahl Nitrogen
Parameter Fecal Coliform, MF FecaiStrep Total Kjeldahl Nitrogen
Parameter Fecal Coliform, MF Fecal Strep
• Parameter Fecal Coliform, MF Fecal Strep
Parameter Fecal Coliform, MF
. . Fecal Strep
Parameter Fecal Coliform, MF Fecal Strep
•
STL Seattle
Client Sample ID LabiD
Method SM 92220 SM 9230C EPA351.2
Client Sample ID Lab ID
Method SM 92220 SM9230C EPA351.2
Client Sample ID labiD
Method SM 92220 SM 9230C
Client Sample ID Lab ID
Method SM9222D SM9230C
Client Sample ID Lab ID
Method SM9222D SM9230C
Client Sample ID Lab ID
Method SM9222D SM9230C
Date Analyzed 09-11-03 09-11-03 09-22-03
Date Analyzed 09-11-03 09-11-03 09-22-03
Date Analyzed 09-11-03 09-11-03
Date Analyzed 09-11-03 09-11-03
Date Analyzed 09-11-03 09-11-03
Date Analyzed 09-11-03 09-11-03
2003090138-06 116053-06
Units CFU/100 ml CFU/100 ml
mg/L
2003090138-07 116053-07
Units CFU/100 ml CFU/100 ml
mg/L
2003090138-08 116053-08
Units CFU/100 ml CFU/100 ml
2003090138-09 116053-09
Units CFU/100 ml CFU/100 ml
2003090138-10 116053-10
Units CFU/100 ml CFU/100 ml
2003090138-11 116053-11
Units CFU/100 ml CFU/100 ml
Result 2 6
ND
Result 8 8
ND
Result >900 730
Result > 900 210
Result 170 150
Result 36 22
STL Seattle is a part of Severn Trent Laboratories, Inc.
PQL 2 2
0.5
PQL 2 2
0.5
PQL 2 2
PQL 2 2
PQL 2
·,· .. :2
PQL 2 2

STL Seattle
Client Sample ID 2003090138-12 • LabiD 116053-12
Date Parameter Method Analvzed Units Result PQL Fecal Coliform, MF SM 92220 09-11-03 CFU/100 ml 74 2 Fecal Strep SM 9230C 09-11-03 CFU/100 ml 32 2
Client Sample ID 2003090138-13 LabiD 116053-13
Date Parameter Method Analyzed Units Result PQL Fecal Coliform, MF SM 92220 09-11-03 CFU/100 ml 2 2 Fecal Strep SM 9230C 09-11-03 CFU/100 ml 0 2
Client Sample ID 2003090138-14 Lab ID 116053-14
Date Parameter Method Analyzed Units Result PQL Fecal Coliform, MF SM92220 09-11-03 CFU/100 ml 0 2 Fecal Strep SM9230C 09-11-03 CFU/100 ml 0 2
•
• ------------------------------------------------------------~~ STL Seattle is a part of Severn Trent Laboratories, Inc. "'

• SPECTRA Laboratories 2221 Ross Way • Tacoma, WA 98421
03118/2004
Skillings-Connolly, Inc. PO Box 5080 Lacey, W A 98509 Attn: Patrick Skillings
Analyte Result ---
Total Dissolved Solids 113
Boron < 30
Cadmium <3
Chromium <7
Copper 60
Iron < 15
Manganese 3 .I < 15
<7
Zinc 7
Arsenic by GF AA <5
Lead by GFAA 2
Mercury <0.5
Fluoride <0.2
Ammonia <0.2
Sulfate 6
Dissolved Organic Carbon 2
Brolnodichloromethane <I
Bromoform <I
Chlorodibromomethane <I
Chloroform <I
Caffeine <10
Units Method mg/L EPA 160.1
ug/L EPA 200.7
ug/L EPA 200.7
ug/L EPA 200.7
ug/L EPA 200.7
ug/L EPA 200.7
ug/L EPA 200.7
ug/L EPA 200.7
ug/L EPA 200.7
ug/L EPA 200.7
ug!L EPA 206.2
ug/L EPA 239.2
ug/L EPA 245.1
mg/L EPA 340.2
mg/L-N EPA 350.3
mg/L EPA 375.4
mg/L EPA 415.1
ug/L EPA 624.
ug/L EPA 624
ug/L EPA 624
ug/L EPA 624
ug/L EPA 625
• (253) 272-4850 •
Project: Client ID: Sample Matrix:
Date Sampled: Date Received: Spectra Project:
Spectra Number:
Analyte N-Nitrosodimethy !amine
Fecal Coliform
Fecal Streptococcus
TKN
BOD
Bromide
Chloride
Nitrite
Nitrate
Anionic Surf. as MBAS
** Analysis was performed by Water Management Laboratories, Inc
Surrogate Recovery Method Surrogate
Dibromofluoromethane 87 EPA 624 Phenol-d6
Toluene-dS 99 EPA 624 Nitrobenzene...d5
4-Bromofluorobenzene 99 EPA 624 2-Fluorobiph.cnyl
2-Fiuorophenol 52 EPA 625 2,4,6-Tribromophenol • SPECTRA LABORATORIES
Fax (253) 572-9838
Y elm Groundwater Monitoring SCI CW Water
12110/2003
12/10/2003 2003120127 1
Result Units Method <10 ug/L EPA 625
<2** /100 Membrane
<2 1100 Membrane
<I mg/L SM 4500-N-B
<2 mg!L SM 5210
0.2 mg/L SM4500-Br-B
7.0 mg/L SM4500CL-C
< 0.01 mg/L-N SM4500N02B
2.4 mg/L-N SM4500N03D
<0.02 mg/L SM5540C
Recovery Method
58 EPA 625
54 EPA 625
63 EPA 625
80 EPA 625
Page 1 of 12

SPECTRA Laboratories • 2221 Ross Way • Tacoma, WA98421 • (253) 272-4850 • Fax(253)572-9838
03/18/2004 Project: Ye1m Groundwater Monitoring Client ID: SC2 MW6 Sample Matrix: Water
Skillings-Connolly, Inc. Date Sampled: 12/10/2003 PO Box 5080 Date Received: 12/10/2003 Lacey, W A 98509 Spectra Project: 2003120127 Attn: Patrick Skillings Spectra Number: 2
Analyte Result . Units Method Analyte Result Units Method ---
Total Dissolved Solids 119 mg!L EPA 160.1 N-Nitrosodimethylamine <10 ug!L EPA 625
Boron < 30 ug!L EPA 200.7 Fecal Coliform <2 /100 Membrane
Cadmium <3 ug/L EPA 200.7 Fecal Streptococcus 46 /100 Membrane
Chromium <7 ug!L EPA 200.7 TKN <I mg!L SM 4500-N-B
Copper 31 ug/L EPA 200.7 BOD <2 mg!L SM 5210
Iron 840 ug/L EPA 200.7 Bromide < 0.1 mg!L SM4500-Br-B
Manganese 1000 ug/L EPA 200.7 Chloride 4.5 mg!L SM4500CL-C
Nickel < 15 ug/L EPA 200.7 Nitrite < 0.01 mg!L-N SM4500N-
Silver <7 ug/L EPA 200.7 Nitrate 4.0 mg/L-N SM4500N
Zinc <6 ug!L EPA 200.7 Anionic Surf. as MBAS <0.02 mg!L SM5540C
Arsenic by GF AA <5 ug/L EPA 206.2
LeadbyGFAA < I ug/L EPA239.2
Mercury <0.5 ug/L EPA245.1
Fluoride < 0.2 mg!L EPA 340.2
Ammonia < 0.2 mg/L-N EPA 350.3
Sulfate 6 mg/L EPA 375.4
Dissolved Organic Carbon 5 mg/L EPA 415.1
Bromodichloromethane <I ug/L EPA 624 L'.!
Bromoform <I ug/L EPA 624
Chlorodibromomethane <I ug/L EPA 624
Chloroform <I ug/L EPA 624
Caffeine <10 ug/L EPA 625
Surrogate Recovery Method Surrogate Recovery Method
Dibromofluoromethane 87 EPA 624 Phenol-d6 83 EPA 625
Toluene-d8 99 EPA 624 ~itrobenzene-d5 101 EPA 625
4-Bromofluorobenzene 102 EPA 624 :!-Fluorobiphenyl 104 EPA 625
2-Fluorophenol 88 EPA 625 2.4.6-Tribromophenol 112 EPA 625 • SPECTRA LABORATORIES
Manager Page 2 of 12 al4/mlh

• _ __, SPECTRA Laboratories 2221 Ross Way • Tacoma, WA 98421
03/18/2004
Skillings-Connolly, Inc. PO Box 5080 Lacey, WA 98509 Attn: Patrick Skillings
Analyte Result Units Method Total Dissolved Solids 87.0 mg!L EPA 160.1
Boron < 30 ug!L EPA 200.7
Cadmium <3 ug/L EPA 200.7
Chromium <7 ug!L EPA 200.7
Copper 45 ug!L EPA 200.7
Iron 2000 ug!L EPA 200.7
Manganese 110 ug!L EPA 200.7
.I <IS ug!L EPA 200.7
<7 ug!L EPA 200.7
Zinc 20 ug!L EPA 200.7
Arsenic by GF AA <5 ug!L EPA 206.2
Lead by GFAA ug!L EPA 239.2
Mercury <0.5 ug!L EPA 245.1
Fluoride < 0.2 mg!L EPA 340.2
Ammonia < 0.2 mg!L-N EPA 350.3
Sulfate 6 mg!L
Dissolved Organic Carbon 8 mg!L
Bromodichloromethane <I ug!L
Bromoform <I ug!L
Chlorodibromomethane <I ug!L
Chloroform <I ug!L
Caffeine <10 ug!L
Surrogate Recovery
Dibromofluoromelhane 86
Toluene-dB 97
4-Bromofluorobcnzene 100
2-Fiuorophenol 39 • SPECTRA LABORATORIES
~ Steve Hibbs, Laboratory Manager al4/mlh
EPA 375.4
EPA 415.1
EPA 624
EPA 624
EPA 624
EPA 624
EPA 625
Method
EPA 624
EPA 624
EPA 624
EPA 625
• (253) 272-4850 •
Project: Client ID: Sample Matrix:
Date Sampled: Date Received: Spectra Project: Spectra Number:
Analyte N-Nitrosodimethylamine
Fecal Coliform
Fecal Streptococcus
TKN BOD
Bromide
Chloride
Nitrite
Nitrate
Anionic Surf. as MBAS
!, .
Surrogate
Phenol-d6
Nitrobenzene-dS
2·fluorobiphenyl
2.4,6-Tribromophenol
Fax (253) 572-9838
Yelm Groundwater Monitoring SC3MW1 Water 12/10/2003 12/10/2003 2003120127 3
Result Units Method ---
<10 ug!L EPA 625
<2 /100 Membrane
62 /100 Membrane
<I mg!L SM 4500-N-B
<2 mg!L SM 5210
0.1 mg!L SM4500-Br-B
6.0 mg!L SM4500CL-C
. < 0.01 mg!L-N SM4500N02B
2.4 mg!L-N SM4500N03D
<0.02 mg!L SM5540C
Recovery Method
44 EPA 625
42 EPA 625
49 EPA 625
53 EPA 625
Page 3 of 12

SPECTRA Laboratories • 2221 Ross Way • Tacoma, WA 98421
03/18/2004
Skillings-Connolly, Inc. PO Box 5080 Lacey, W A 98509 Attn: Patrick Skillings
Analyte Result Total Dissolved Solids 169
Boron 40
Cadmium <3
Chromium <7
Copper 43
Iron 5400
Manganese 110
Nickel < 15
Silver <7
Zinc 16
Arsenic by GF AA <5
Lead by GFAA 2
Mercury <0.5
Fluoride < 0.2
Units Method mg/L EPA 160.1
ug/L EPA 200.7
ug/L EPA 200.7
ug/L EPA 200.7
ug/L EPA 200.7
ug/L EPA 200.7
ug/L EPA 200.7
ug/L EPA 200.7
ug/L EPA 200.7
ug/L EPA 200.7
ug/L EPA 206.2
ug/L EPA 239.2
ug/L EPA 245.1
mg/L EPA 340.2
Ammonia < 0.2 mg/L-N EPA 350.3
Sulfate 15 mg/L
Dissolved Organic Carbon 4 mg/L
Bromodichloromethane ::<L. . ug/L
Bromoform <l ug/L
Chlorodibromomethane <l ug/L
Chloroform <l ug/L
Caffeine <10 ug/L
Surrogate Recovery
Dibromofluoromethane 90
Toluene-dB 96
4-Bromofluorobenzene 100
2-Fiuorophenol 68
SPECTRA LABORATORIES
~ Steve Hibbs, Laboratory Manager al4/mlh
EPA 375.4
EPA 415.1
EPA 624
EPA 624
EPA 624
EPA 624
EPA 625
Method
EPA 624
EPA 624
EPA 624
EPA 625
• (253) 272-4850 •
Project: Client ID: Sample Matrix:
Date Sampled: Date Received:
Fax(253)572-9838
Yelm Groundwater Monitoring SC4MW2 Water 12/10/2003 12/10/2003
Spectra Project: 2003120127 Spectra Number: 4
Analyte Result Units Method N-Nitrosodimethylamine <10 ug/L EPA625
Fecal Coliform <2 /100 Membrane
Fecal Streptococcus 70 /100 Membrane
TKN <l mg/L SM 4500-N-B
BOD <2 mg/L SM 5210
Bromide < 0.1 mg/L SM4500-Br-B
Chloride 40 mg/L SM4500CL-C
Nitrite
Nitrate
< 0.01 mg/L-N SM4500N. l.5 mg/L-N SM4500NO
Anionic Surf. as MBAS <0.02 mg/L SM5540C
Surrogate Recovery Method
Phenol-d6 74 EPA 625
Nitrobenzene..d5 70 EPA 625
2-Fluorobiphenyl 81 EPA 625
2,4,6. Tribromopbenol 99 EPA 625 • Page 4 of 12

• SPECTRA Laboratories 2221 Ross Way • Tacoma, WA 98421
01122/2004
Skillings-Connolly, Inc. PO Box 5080 Lacey, WA 98509 Attn: Patrick Skillings
Analyte Result Units Method Total Dissolved Solids 184 mg!L EPA 160.1
Boron 130 ug!L EPA 200.7
Cadmium < 0.003 ug!L EPA 200.7
Chromium < 0.007 ug!L EPA 200.7
Copper 0.007 ug!L EPA 200.7
Iron 1.6 ug/L EPA 200.7
Manganese 0.023 ug!L EPA 200.7
.I < 0.015 ug!L EPA 200.7
< 0.007 ug/L EPA 200.7
Zinc 0.056 ug/L EPA 200.7
Arsenic by GF AA <5 ug!L EPA 206.2
Lead byGFAA < I ug!L EPA 239.2
Mercury <0.5 ug!L EPA 245.1
Fluoride < 0.2 mg/L EPA 340.2
Ammonia <0.1 mg!L-N EPA 350.3
Sulfate 25 mg/L EPA 375.4
Dissolved Organic Carbon <2 mg/L EPA 415.1
Bromodichloromethane <I ug!L EPA 624
Bromoform <I ug!L EPA 624
Chlorodibromomethane <I ug/L EPA 624
Chloroform <I ug/L EPA624
Caffeine <10 ug/L EPA 625
• (253) 272-4850 •
Project: Client ID: Sample Matrix:
Date Sampled: Date Received: Spectra Project: Spectra Number:
Analyte N-Nitrosodimethylamine
Fecal Coliform
Fecal Streptococcus
TKN BOD
Bromide
Chloride
Nitrite
Nitrate
Anionic Surf. as MBAS
*Microbiological samples were analyzed by Water management Laboratories, Inc
• Surrogate Recovery
Dibromofluoromethane 87
Toluene-dB 96
4-Bromofluorobenzenc 99
2-Fiuorophcnol 36
SPECTRA LABORATORIES
Steve Hibbs, Laboratory Manager :~14/gma
Method SumJgatc
EPA 624 Phenoi--d6
EPA 624 ~itrobenzene-d5
EPA 624 2-Fiuorobiph.enyl
EPA 625 2,4,6-Tribromophenol
Fax (253) 572-9838
Yelm Groundwater SC5 MW3 Water
12/18/2003 12/18/2003 2003120242 1
Result Units Method <10 ug!L EPA 625
<2 /100 Membrane
<2 /100 Membrane
<I mg/L SM 4500-N-B
<2 mg/L SM 5210
< 0.1 mg/L SM4500-Br-B
35 mg/L SM4500CL-C
< 0.01 mg/L-N SM4500N02B
3.6 mg!L-N SM4500N03D
<0.02 mg!L SM5540C
Recovery Method
48 EPA 625
41 EPA 625
53 EPA 625
64 EPA 625
Page 1 of 3

SPECTRA Laboratories • 2221 Ross Way
01122/2004
• Tacoma, WA98421
Skillings-Connolly, Inc. PO Box 5080 Lacey, W A 98509 Attn: Patrick Skillings
Analyte Result Units Method Total Dissolved Solids 114 mg!L EPA 160.1
Boron 110 ug!L EPA 200.7
Cadmium < 0.003 ug!L EPA 200.7
Chromium < 0.007 ug!L EPA 200.7
Copper <0.006 ug!L EPA 200.7
Iron 0.44 ug!L EPA 200.7
Manganese < 0.002 ug!L EPA 200.7
Nickel < 0.015 ug!L EPA 200.7
Silver < 0.007 ug!L EPA 200.7
Zinc 0.036 ug!L EPA 200.7
Arsenic by GF AA <5 ug!L EPA 206.2
Lead byGFAA < 1 ug!L EPA 239.2
Mercury <0.5 ug!L EPA 245.1
Fluoride <0.2 mg!L EPA 340.2
Ammonia <0.1 mg!L-N EPA 350.3
Sulfate 10 mg!L EPA 375.4
Dissolved Organic Carbon <2 mg!L EPA 415.1
Bromodichloromethane <I ug!L EPA 624
Bromoform <I ug!L EPA 624
Chlorodibromomethane <I ug!L EPA 624
Chloroform <I ug!L EPA 624
Caffeine <10 ug!L EPA 625
Surrogate Recovery Method
Dibromolluoromethane 89 EPA 624
Toluene-d8 96 EPA 624
4-Bromofluorobenzene 97 EPA 624
2-Fiuorophenol 39 EPA 625
SPECTRA LABORATORIES
Steve Hibbs, Laboratory Manager al4/gma
• (253) 272-4850 •
Project: Client ID: Sample Matrix:
Date Sampled: Date Received: Spectra Project:
Fax(253)572-9838
Y elm Groundwater SC6MW4 Water 12/18/2003 12/18/2003 2003120242
Spectra Number: 2
Analyte Result Units Method N-Nitrosodimethylarnine <10 ug!L EPA 625
Fecal Coliform <2 /100 Membrane
Fecal Streptococcus <2 /100 Membrane
TKN <I mg!L SM 4500-N-B
BOD <2 mg!L SM 5210
Bromide < 0.1 mg!L SM4500-Br-B
Chloride 24 mg!L SM4500CL-C
Nitrite < 0.01 mg!L-N SM4500N.
Nitrate 1.6 mg!L-N SM4500N
Anionic Surf. as MBAS <0.02 mg/L SM5540C
• T',t_ • 0 • '
Surrogate Recovery Method
Phenol-d6 49 EPA 625
Nitrobenzene-d5 41 EPA 625
2-Fluorobiphenyl 50 EPA 625
2,4,6-Tribromophenol 58 EPA 625 • Page 2 of3

• SPECTRA Laboratories 2221 Ross Way
01/22/2004
• Tacoma, WA98421
Skillings-Connolly, Inc. PO Box 5080 Lacey, W A 98509 Attn: Patrick Skillings
Analyte Result Total Dissolved Solids 114
Boron 80
Cadmium < 0.003
Chromium < 0.007
Copper < 0.006
Iron 0.16
Manganese < 0.002
.l < O.Dl5
< 0.007
Zinc 0.028
Arsenic by GF AA <5
Lead by GFAA < 1
Mercury <0.5
Fluoride < 0.2
Units Method mg!L EPA 160.1
ug!L EPA 200.7
ug!L EPA 200.7
ug!L EPA 200.7
ug!L EPA 200.7
ug!L EPA 200.7
ug!L EPA 200.7
ug!L EPA 200.7
ug!L EPA 200.7
ug!L EPA 200.7
ug!L EPA206.2
ug!L EPA 239.2
ug!L EPA245.1
mg!L EPA 340.2
Anunonia <0.1 mg!L-N EPA 350.3
Sulfate 10 mg!L
Dissolved Organic Carbon <·2 mg!L
Bromodichloromethane <:1 ug!L
Bromoform <1 ug!L
C:hlorodibromomethane <1 ug!L
C:hloroform <l ug!L
Caffeine <10 ug!L
Surrogate Recovery
Dibromofluoromethanc 89
Toluene-d8 97
4-Bromofluorobenzenc 97
2-Fiuorophenol 52 • SPECTRA LABORATORIES
Steve Hibbs, Laboratory Manager a14/gma
EPA 375.4
EPA415.l
EPA624
EPA 624
EPA624
EPA 624
EPA 625
Method
EPA 624
EPA 624
EPA 624
EPA 625
• (253) 272-4850 •
Project: Client ID: Sample Matrix:
Date Sampled: Date Received: Spectra Project:
Fax (253) 572-9838
Y elm Groundwater SC7MW5 Water 12/18/2003 12/18/2003 2003120242
Spectra Number: 3
Analyte Result Units Method --
N-Nitrosodimethylamine <10 ug!L EPA 625
Fecal Coliform <2 /100 Membrane
Fecal Streptococcus <2 /100 Membrane
TKN <1 mg!L SM 4500-N-B
BOD <2 mg!L SM 5210
Bromide < 0.1 mg!L SM4500-Br-B
Chloride 24 mg!L SM4500CL-C
Nitrite < 0.01 mg!L-N SM4500N02B
Nitrate 2.4 mg!L-N SM4500N03D
Anionic Surf. as MBAS <0.02 mg!L SM5540C
Surrogate Recovery Method
Phenol-d6 63 EPA 625
Nitrobcnzene-d5 57 EPA 625
2·Fiuorobiphenyl 68 EPA 625
2.4.6-Tribromophcnol 70 EPA 625
Page 3 of3

SPECTRA Laboratories • 2221RossWay • Tacoma,WA98421
03/18/2004
Skillings-Connolly, Inc. PO Box 5080 Lacey, W A 98509 Attn: Patrick Skillings
Analyte Result ---
Total Dissolved Solids 296
Boron 120
Cadmium <3
Chromium <7
Copper 20
Iron 58
Manganese 14
Nickel < 15
Silver <7
Zinc 39
Arsenic by GF AA <5
Lead byGFAA <I
Mercury <0.5
Fluoride <0.2
Units Method mg/L EPA 160.1
ug/L EPA 200.7
ug/L EPA 200.7
ug/L EPA 200.7
ug/L EPA 200.7
ug/L EPA 200.7
ug/L EPA 200.7
ug/L EPA 200.7
ug/L EPA200.7
ug/L EPA200.7
ug/L EPA 206.2
ug/L EPA 239.2
ug/L EPA 245.1
mg/L EPA 340.2
Ammonia <0.2 mg!L-N EPA350.3
Sulfate 28 mg/L
Dissolved Organic Carbon 8 mg/L
Bromodichloromethane 6 ug/L
Bromofonn <1 ug/L
Chlorodibromomethane <1 ug/L
Chloroform 21 ug/L
Caffeine <10 ug/L
Surrogate Recovery
Dibromofluoromelhane 83
Toluene-dB 97
4-Bromo!luorobenzene 100
2-Fluorophenol 60
SPECTRA LABORATORIES
Steve Hibbs, Laboratory Manager a14/mlh
EPA 375.4
EPA415.1
EPA624
EPA 624
EPA 624
EPA 624
EPA 625
Method
EPA 624
EPA 624
EPA 624
EPA 625
• (253) 272-4850 • Fax(253)572-9838
Project: Client ID:
Yelm Groundwater Monitoring SC8 IS
Sample Matrix: Water
Date Sampled: Date Received: Spectra Project:
Spectra Number:
Analyte N-Nitrosodimethylamine
Fecal Coliform
Fecal Streptococcus
TKN
BOD
Bromide
Chloride
Nitrite
Nitrate
Anionic Surf. as MBAS
Surrogate
Phenol-d6
Nitrobcnzene-d5
2-F\uorobipbenyl
2.4.6-Tribromophenol
12/10/2003 12/10/2003 2003120127 5
Result Units <10 ug/L
<2 1100
<2 /100
<1 mg/L
<2 mg/L
<0.1 mg/L
57 mg/L
<0.01 mg/L-N
2.8 mg/L-N
0.032 mg/L
Recovery Method
59 EPA 625
67 EPA 625
84 EPA 625
93 EPA 625
Page 5 of 12
Method EPA 625
Membrane
Membrane
SM 4500-N-B
SM 5210
SM4500-Br-B
SM4500CL-C
SM4500N-SM4500N
SM5540C
•

• SPECTRA Laboratories 2221 Ross Way • Tacoma, WA98421
03/18/2004
Skillings-Connolly, Inc. PO Box 5080 Lacey, W A 98509 Attn: Patrick Skillings
Analyte Result Total Dissolved Solids 271
Boron 100
Cadmium <3
Chromium <7
Copper 15
Iron 140
Manganese 20
.I < 15
<7
Zinc 36
Arsenic by GF AA <5
LeadbyGFAA < I
Mercury <0.5
Fluoride <0.2
Units Method mg/L EPA 160.1
ug!L EPA 200.7
ug/L EPA 200.7
ug!L EPA200.7
ug!L EPA 200.7
ug!L EPA200.7
ug!L EPA 200.7
ug!L EPA 200.7
ug!L EPA 200.7
ug!L EPA 200.7
ug!L EPA 206.2
ug/L EPA 239.2
ug!L EPA 245.1
mg!L EPA 340.2
Ammgnia <0.2 mg!L-N EPA 350.3
Sulfate 33 mg/L
Dissolved Organic Carbon 8 mg/L
Bromodichloromethane 4 . ug!L
Bromoform <1 ug!L
Chlorodibromomethane <I ug!L
Chlorofonn 17 ug!L
Caffeine <10 ug!L
Surrogate Recovery
Dibromofluoromethane 88
Toluene-dB 96
4-Bromotluorobenzene 98
2-Fiuorophenol 68 • SPECTRA LABORATORIES
Steve Hibbs, Laboratory Manager al4/mlh
EPA 375.4
EPA 415.1
EPA 624; .
EPA 624
EPA 624
EPA 624
EPA 625
Method
EPA 624
EPA 624
EPA 624
EPA625
• (253) 272-4850 •
Project: Client ID: Sample Matrix:
Date Sampled: Date Received: Spectra Project:
Spectra Number:
Analyte N-Nitrosodimethylamine
Fecal Colifonn
Fecal Streptococcus
TKN
BOD
Bromide
Chloride
Nitrite
Nitrate
Anionic Surf. as MBAS
Surrogate
Phenol-d6
NitroDenzene-dS
2-F\uorobiphenyl
2,4.6-Tribromophenol
Fax (253) 572-9838
Yelm Groundwater Monitoring SC9 CSl Water
12110/2003
12110/2003 2003120127 6
Result Units Method <10 ug/L EPA 625
10 /100 Membrane
4000 /100 Membrane
<I mg!L SM 4500-N-B
<2 mg!L SM 5210
< 0.1 mg/L SM4500-Br-B
61 mg/L SM4500CL-C
0.01 mg!L-N SM4500N02B
2.2 mg!L-N SM4500N03D
0.034 mg!L SM5540C
Recovery Method
76 EPA 625
69 EPA 625
72 EPA 625
104 EPA 625
Page 6 of 12

SPECTRA Laboratories • 2221 Ross Way • Tacoma, WA 98421
03/18/2004
Skillings-Connolly, Inc. PO Box 5080 Lacey, W A 98509 Attn: Patrick Skillings
Analyte Result Total Dissolved Solids 249
Boron 96
Cadmium <3
Chromium <7
Copper 36
Iron 260
Manganese 41
Nickel < 15
Silver <7
Zinc 36
Arsenic by GF AA <5
Lead by GFAA < 1
Mercury <0.5
Fluoride < 0.2
Units Method mg/L EPA 160.1
ug/L EPA 200.7
ug/L EPA 200.7
ug/L EPA 200.7
ug/L EPA 200.7
ug/L EPA 200.7
ug/L EPA 200.7
ug/L EPA 200.7
ug/L EPA 200.7
ug/L EPA 200.7
ug/L EPA 206.2
ug/L EPA 239.2
ug/L EPA 245.1
mg/L EPA 340.2
Ammonia < 0.2 mg/L-N EPA 350.3
Sulfate 26 mg/L
Dissolved Organic Carbon 9 mg/L
Bromodichloromethane <1 ·. ug/L
Bromoform <1 ug/L
Chlorodibromomethane <1 ug/L
Chloroform 2 ug/L
Caffeine <10 ug/L
Surrogate Recovery
Dibromofluoromethane 87
Toluene-dS 97
4-Bromotluorobenzene 98
2-Fluorophenol 50
SPECTRA LABORATORIES
·Steve Hibbs, Laboratory Manager al4/mlh
EPA 375.4
EPA 415.1
EPA 624 ·
EPA 624
EPA 624
EPA 624
EPA 625
Method
EPA 624
EPA 624
EPA 624
EPA 625
• (253) 272-4850 •
Project: Client ID: Sample Matrix:
Date Sampled: Date Received:
Fax(253)572-9838
Yelm Groundwater Monitoring SC!O CS2 Water 12/10/2003 12/10/2003
Spectra Project: 2003120127 Spectra Number: 7
Analyte Result Units Method N-Nitrosodimethylamine <10 ug/L EPA 625
Fecal Coliform <2 /100 Membrane
Fecal Streptococcus 440 1100 Membrane
TKN 2 mg/L SM 4500-N-B
BOD 4 mg/L SM 5210
Bromide < 0.1 mg/L SM4500-Br-B
Chloride 58 mg/L SM4500CL-C
Nitrite 0.02 mg/L-N SM4500N. Nitrate 0.9 mg/L-N SM4500N
Anionic Surf. as MBAS 0.023 mg/L SM5540C
Surrogate Recovery Method
Phenol-d6 59 EPA 625
:\litrobenzene-dS 50 EPA 625
2-Fluorobiphenyl 60 EPA 625
2,4,6-Tribromophenol 90 EPA 625 • Page 7 of 12

• SPECTRA Laboratories 2221 Ross Way
03/18/2004
• Tacoma, WA98421
Skillings-Connolly, Inc. PO Box 5080 Lacey, W A 98509 Attn: Patrick Skillings
Analyte Result Total Dissolved Solids 249
Boron 120
Cadmium <3
Chromium <7
Copper 24
Iron 130
Manganese 19 .I < 15
<7
Zinc 59
Arsenic by GF AA <5
LeadbyGFAA <I
Mercury <0.5
Fluoride <0.2
Units Method mg/L EPA 160.1
ug/L EPA 200.7
ug/L EPA 200.7
ug/L EPA 200.7
ug/L EPA 200.7
ug/L EPA 200.7
ug/L EPA 200.7
ug/L EPA 200.7
ug/L EPA 200.7
ug/L EPA 200.7
ug/L EPA 206.2
ug/L EPA 239.2
ug/L EPA 245.1
mg/L EPA 340.2
.Ammonia 0.3 mg/L-N EPA 350.3
Sulfate 28 mg!L
Dissolved Organic Carbon 9 mg/L
Bromodichloromethane <I ug/L
Bromoform <I ug/L
C:hlorodibromomethane <I ug/L
C:hloroform 2 ug/L
C:affeine <10 ug/L
Surrogate Recovery
Dibromofluoromethane 87
Toluene-dB 96
4-Bromofluorobenzene \00
2-Fiuorophenol 55 • SPECTRA LABORATORIES
~ Steve Hibbs, Laboratory Manager al4/mlh
EPA 375.4
EPA415.l
EPA 624
EPA 624
EPA 624
EPA 624
EPA 625
Method
EPA 624
EPA 624
EPA 624
EPA 625
• (253) 272-4850 • Fax (253) 572-9838
Project: Client ID: Sample Matrix:
Date Sampled: Date Received: Spectra Project: Spectra Number:
Analyte N-Nitrosodimethylamine
Fecal Coliform
Fecal Streptococcus
TKN BOD
Bromide
Chloride
Nitrite
Nitrate
Anionic Surf. as MBAS
Surrogate
Phenol.d6
~itrobenzene-d5
2-Fiuorobiphenyl
2,4,6-Tribromophenol
Yelm Groundwater Monitoring SC11 CS3 Water 12/10/2003 12/10/2003 2003120127 8
Result Units Method <10 ug!L EPA 625
2 1100 Membrane
2200 1100 Membrane
7 mg!L SM 4500-N-B
<2 mg!L SM 5210
< 0.1 mg!L SM4500-Br-B
54 mg!L SM4500CL-C
< 0.01 mg!L-N SM4500N02B
1.1 mg!L-N SM4500N03D
<0.02 mg!L SM5540C
Recovery Method
66 EPA 625
63 EPA 625
63 EPA 625
103 EPA 625
Page 8 of 12

~--S_P_E_C_T_RA ___ L_a_b_o_ra_t_or_ie_s ____________ __ • 2221 Ross Way • Tacoma, WA98421
03/18/2004
Skillings-Connolly, Inc. PO Box 5080 Lacey, W A 98509 Attn: Patrick Skillings
Analyte Result Total Dissolved Solids 240
Boron 98
Cadmium <3
Chromium <7
Copper 14
Iron 190
Manganese 110
Nickel < 15
Silver <7
Zinc 27
Arsenic by GF AA <5
Lead by GFAA <I
Mercury <0.5
Fluoride <0.2
Units Method mg/L EPA 160.1
ug/L EPA 200.7
ug/L EPA 200.7
ug!L EPA 200.7
ug!L EPA 200.7
ug/L EPA 200.7
ug!L EPA 200.7
ug/L EPA 200.7
ug/L EPA 200.7
ug!L EPA 200.7
ug/L EPA 206.2
ug/L EPA 239.2
ug/L EPA 245.1
mg/L EPA 340.2
Ammonia <0.2 mg!L-N EPA 350.3
Sulfate 20 mg!L EPA 375.4
Dissolved Organic Carbon 0 mg!L EPA415.i . Bromodichloromethane <l ug/L EPA 624 :
Bromoform <l ug/L EPA 624
Chlorodibromomethane <1 ug!L EPA 624
Chloroform ug/L EPA 624
Caffeine <10 ug/L EPA 625
Surrogate Recovery Method
Dibromofluoromethane 88 EPA 624
Toluene-d8 97 EPA 624
4-Bromofluorobenzenc 99 EPA 624
2-Fiuorophenol 56 EPA 625
SPECTRA LABORATORIES
• (253) 272-4850 • Fax (253) 572-9838
Project: Client ID: Sample Matrix:
Date Sampled: Date Received: Spectra Project:
Spectra Number:
Analyte N-Nitrosodimethylamine
Fecal Coliform
Fecal Streptococcus
TKN
BOD
Bromide
Chloride
Nitrite
Nitrate
Anionic Surf. as MBAS
Surrogate
Phenol-d6
Nitrobc:nzene-d5
2-Fluorobiphenyl
2,4.6-Tribromophenol
Yelm Groundwater Monitoring SC12 CS4 Water 12/10/2003
12/10/2003 2003120127 9
Result Units Method <10 ug/L EPA 625
600 /100 Membrane
570 /100 Membrane
<I mg!L SM 4500-N-B
<2 mg/L SM 5210
< 0.1 mg/L SM4500-Br-B
54 mg/L SM4500CL-C
< 0.01 mg/L-N SM4500N-0.6 mg!L-N SM4500N
<0.02 mg!L SM5540C
Recovery Method
66 EPA 625
57 EPA 625
69 EPA 625
106 EPA 625 • Page 9 of 12

• SPECTRA Laboratories 2221 Ross Way • Tacoma, WA98421
03/18/2004
Skillings-Connolly, Inc. PO Box 5080 Lacey, W A 98509 Attn: Patrick Skillings
Analyte Result ---
Total Dissolved Solids 250
Boron 89
Cadmium <3
Chromium <7
Copper <6
Iron 240
Manganese 52
.1 < 15
<7
Zinc 34
Arsenic by GF AA <5
Lead by GFAA < 1
Mercury <0.5
Fluoride <0.2
Units Method mg/L EPA 160.1
ug/L EPA 200.7
ug/L EPA 200.7
ug/L EPA 200.7
ug/L EPA 200.7
ug/L EPA 200.7
ug/L EPA 200.7
ug/L EPA 200.7
ug/L EPA 200.7
ug/L EPA 200.7
ug/L EPA 206.2
ug/L EPA 239.2
ug/L EPA 245.1
mg/L EPA 340.2
Ammonia <0.2 mg/L-N EPA 350.3
Sulfate 27 mg!L EPA 375.4
Dissolved Organic Carbon 10 mg/L EPA 4!5.1
Bromodichloromethane <1 ug/L EPA 624
Bromoform <I ug/L EPA 624
Chlorodibromomethane <1 ug!L EPA 624
Chloroform 3 ug!L EPA 624
Caffeine <10 ug!L EPA 625
Surrogate Recovery Method
Dibromotluoromethane 88 EPA 624
Toluene-dB 96 EPA 624
4-Bromofluorobenzene 99 EPA 624
2-Fluorophenol 49 EPA 625 • SPECTRA LABORATORIES
~------, Steve Hibbs, Laboratory Mabager al4/mlh
• (253) 272-4850 • Fax (253) 572-9838
Project: Client ID:
Yelm Groundwater Monitoring SC13 FD
Sample Matrix: Water
Date Sampled: 12/10/2003 Date Received: 12/10/2003 Spectra Project: 2003120127 Spectra Number: 12
Analyte Result Units N-Nitrosodimethylamine <10 ug/L
Fecal Coliform 130 /100
Fecal Streptococcus 270 /100
TKN <I mg/L
BOD 2 mg/L
Bromide < 0.1 mg/L
Chloride 55 mg/L
Nitrite 0.02 mg/L-N
Nitrate 0.8 mg/L-N
Anionic Surf. as MBAS <0.02 mg/L
Surrogate Recovery Method
Phenol-<16 65 EPA 625
Nitrobenzene-d5 54 EPA 625
2-Fluorobiphenyl 68 EPA 625
2.4.6-Tribromophenol 100 EPA 625
Page 12 of 12
Method EPA 625
Membrane
Membrane
SM 4500-N-B
SM 5210
SM4500-Br-B
SM4500CL-C
SM4500N02B
SM4500N03D
SM5540C

SPECTRA Laboratories • 2221 Ross Way • Tacoma, WA98421
03/18/2004
Skillings-Connolly, Inc. PO Box 5080 Lacey, W A 98509 Attn: Patrick Skillings
Analyte Result Units Method Thallium by GFAA <I ug/L EPA 279.2
Total Dissolved Solids 7.0 mg/L EPA 160.1
Barium <2 ug/L EPA 200.7
Beryllium < l ug/L EPA 200.7
Boron < 30 ug/L EPA 200.7
Cadmium <3 ug/L EPA 200.7
Chromium <7 ug/L EPA 200.7
Copper 9 ug/L EPA 200.7
Iron < 15 ug/L EPA 200.7
Manganese <2 ug/L EPA 200.7
Nickel < 15 ug/L EPA 200.7
Silver <7 ug/L EPA 200.7
Sodium 1900 ug/L EPA 200.7
Total Hardness <300 ug/L EPA 200.7
Zinc 7 ug/L EPA 200.7
Antimony by GFAA <5 ug/L EPA 204.2
Arsenic by GFAA <5 ug/L EPA 206.2
Lead byGFAA < 1 ug/L EPA 239.2
Mercury <0.5 ug/L EPA 245.1
Selenium by GF AA <5 ug/L EPA 270.2
Fluoride <0.2 mg/L EPA 340.2
Ammonia <0.2 mg/L-N EPA 350.3
Surrogate Recovery
Dibromofluoromelhane 87
Toluene-dB 9\
4--Bromofluorobenzene 94
2-Fiuorophenol 50
SPECTRA LABORATORIES
~ Steve Hibbs, Laboratory Manager al4/mlh
Method
EPA 624
EPA 624
EPA 624
EPA 625
• (253) 272-4850 • Fax(253)572-9838
Project: Y elm Groundwater Monitoring Client ID: RO Sample Matrix: Water Date Sampled: 12/1012003 Date Received: 12110/2003 Spectra Project: 2003120127 Spectra Number: 10
Analyte Result Units Method Sulfate < l mg/L EPA 375.4
Dissolved Organic Carbon 3 mg/L EPA 415.1
Bromodichloromethane <l ug/L EPA 624
Bromoform <1 ug/L EPA 624
Chlorodibromomethane <1 ug/L EPA 624
Chloroform 5 ug/L EPA 624
Caffeine <10 ug/L EPA 625
N-Nitrosodimethylarnine <10 ug/L EPA625. Fecal Coliform <2 /100 Membran
Fecal Streptococcus <2 /100 Membrane
Color < 1 Color SM 2120B
Turbidity 0.25 ntu SM 2130B
TKN <1 mg/L SM4500-N-B
BOD <2 mg/L SM 5210
Conductivity 8.1 urnhos/ SM2510B
Bromide < 0.1 mg/L SM4500-Br-B
Chloride <1.0 mg/L SM4500CL-C
Total Cyanide .<·0.01 . mg/L SM4500CN-E
Nitrite < 0.01 mg/L-N SM4500N02B
Nitrate 0.1 mg/L-N SM4500N03D
Total Organic Carbon 3 mg/L SM5310 B
Anionic Surf. as MBAS <0.02 mg/L SM5540C
Surrogate Recovery Method
Phenol-d6 35 EPA 625
Nitrobenzene-d5 60 EPA 625
2-Fluorobiphenyl 67 EPA 625
2,4,6-Tribromophenol 75 EPA 625 • Page 10 of 12

• SPECTRA Laboratories 2221 Ross Way • Tacoma, WA98421 • (253) 272-4850 • Fax (253) 572-9838
03/18/2004 Project: Yelm Groundwater Monitoring Client ID: RW Sample Matrix: Water
Skillings-Connolly, Inc. Date Sampled: 12/10/2003 PO Box 5080 Date Received: 12/10/2003 Lacey, W A 98509 Spectra Project: 2003120127 Attn: Patrick Skillings Spectra Number: 11
Analyte Result Units Method Analyte Result Units Method --- ---
Total Dissolved Solids 293 mg!L EPA 160.1 N-Nitrosodimethylamine <10 ug!L EPA 625
Boron 120 ug!L EPA 200.7 Fecal Coliform <2 1100 Membrane
Cadmium <3 ug!L EPA 200.7 Fecal Streptococcus 4 1100 Membrane
Chromium <7 ug!L EPA 200.7 TKN mg!L SM 4500-N-B
Copper 10 ug!L EPA 200.7 BOD <2 mg!L SM 5210
Iron 48 ug!L EPA 200.7 Bromide < 0.1 mg!L SM4500-Br-B
Manganese 97 ug!L EPA 200.7 Chloride 58 mg!L SM4500CL-C
.1 < 15 ug!L EPA 200.7 Nitrite < 0.01 mg!L-N SM4500N02B
<7 ug!L EPA200.7 Nitrate 2.9 mg!L-N SM4500N03D
Zinc 54 ug!L EPA 200.7 Anionic Surf. as MBAS <0.02 mg!L SM5540C
Arsenic by GF AA <5 ug!L EPA 206.2
Lead by GFAA < 1 ug!L EPA 239.2
Mercury <0.5 ug!L EPA 245.1
Fluoride <0.2 mg!L EPA 340.2
Ammonia < 0.2 mg!L-N EPA 350.3
Sulfate 27 mg!L EPA 375.4
Dissolved Organic Carbon 8 mg!L EPA 415.1
Bromodichloromethane . ' 4 ug!L EPA 624 '.
Bromoform <1 ug!L EPA 624
Chlorodibromomethane <1 ug!L EPA 624
Chloroform 14 ug!L EPA 624
Caffeine <10 ug!L EPA 625
Surrogate Recovel)' Method Surrogate Recovery Method
Dibromofluoromethane 87 EPA 624 Phenol-d6 71 EPA 625
Toluene-dB 95 EPA 624 Nitrobenzene-d5 68 EPA 625
4-Bromofluorobenzene 100 EPA 624 2-Fluorobiphenyl 76 EPA 625
2-Fiuoropbenol 59 EPA 625 2.4,6-Tribromopheno\ • 99 EPA 625
SPECTRA LAB ORA TORIES
Page 11 of12

•
•
•

•
•
•
Quality Assurance
Field quality assurance samples consisted of one duplicate set per quarter. Field duplicates for the Groundwater Monitoring Project are defined as two sequential samples obtained from the same sampling site using identical sampling procedures. Duplicate sampling sites were chosen at random each quarter. The duplicate sample results are used to estimate combined sampling and analytical precision. The relative percent difference (RPD) of the mean, the ratio of the difference and the mean of duplicate results expressed as a percentage, can be used to describe the precision of duplicate results. RPD results are included in Table D-1 in Appendix D. While RPD can be used to describe the precision of duplicate results, it is limited by the precision of the data reporting level. RPD can be misleading when data levels are listed out to only one or two significant digits. In cases where testing results are rounded, RPD may not provide an accurate description of precision of duplicate results.
Copies of Quality Control Results from Spectra Laboratories for each sampling quarter are included in Appendix D. Laboratory quality control tests consisted of method blanks, duplicate samples, spiked samples, and check (control) standards .

·-- SPECTRA Laboratories
•
•
2221 Ross Way • Tacoma, WA 98421 • (253) 272-4850
Date: 3111/2002 Sample Matrix: Water EPA Method: 375.4/SM4500E
Client: Skillings-Connely Units: mg/L
Method 375.4 I SM4500E SULFATE QUALITY CONTROL RESULTS
Initial Calibration Verification Date Analyzed: 3111/2002
Known Value Measured Value
257 Method Blank Results Date Analyzed:
MATRIX SPIKE RESULTS
3/11/2002
Spiked Sample: 030066-12 Date Analyzed: 3/11/2002
277.2
SAMPLE RESULT
SPIKE SPIKE AMOUNT RESULT
27.410 20.0 47.200 SAMPLE DUPLICATE RESULTS Duplicate Sample# 030066-8 Date Analyzed: 3111/2002
Check Standard Results Date Analyzed: 3111/2002
SAMPLE RESULT
29.16
RESULT < 1
% REC.
99.0
Known Value Measured Value
50 53.9
%Recovered
MSD RESULT
47.510
DUPLICATE RESULT
30.04
%Recovered
108
1 030066-1 2 030066·2 3 030066-3 4 030066-4 5 030066-5 6 030066·6 7 030066·7 8 030066-8 9 030066·9
108
MSD %REC.
100.5
RPD
2
RPD
3
11 030066-11 12 030066-12 13 030066-13 14 ___ _ 15 ___ _ 16 ___ _ 17 ___ _ 18 ___ _ 19 ___ _
10 030066·1 0 20 ___ _

Date:
Client:
SPECTRA Laboratories 2221 Ross Wav • Tacoma, WA 98421 • (253) 272-4850
3111102
Skillings/Connolly Sample Matrix: Water Standard Methods: 5220B Units: mg/L
.. , . ... - . SM 52108/405.1 BOD ANALYSIS . ·• QUALITY CONTROL RESULTS
Glucose-Glutamic Acid Check Standard Date Analyzed: 3/11/02
G/GA G/GA G/GA
Known Value
198 198 198
5 Day Measured Value
216 195.5 202
1 030066·1 2 030066·2 3 030066·3 4 030066-4 5 030066·5 6 030066·6 7 030066·7 8 030066·8 9 030033·9
10 030066·10
11 030066·11 12 030066·12 13 030066·13 14 ____ _ 15 ____ _ 16 ____ _
17 18 ____ _
19 ____ _ 20 ____ _
%Recovered
109 99 102
•
•
•

•
•
SPECTRA Laboratories 2221 Ross Way • Tacoma, WA 98421 o (253) 272-4850
Date: 03/13/02
Client: Skillings/Connolly Sample Matrix: Water EPA Method: 415.1/9060 Units: mg/L
415.119060 DISSOLVED ORGANIC CARBON ANALYSIS QUALITY CONTROL RESULTS
Initial Calibration Verification Date Analyzed: 03113/02
Known Value Measured Value %Recovered
50.00 40.54 81.08
Method Blank Results Date Analyzed: 03113/02 RESULT
<6 MATRIX SPIKE RESULTS Spiked Sample: 030066-12 Date Analyzed: 03113/02
SAMPLE SPIKE SPIKE MSD MSD RESULT AMOUNT RESULT %REC. RESULT % REC. RPD
11.30 25.00 32.62 85.28 32.73 85.72 0.51
SAMPLE DUPLICATE RESULTS Duplicate Sample# 030066·12 SAMPLE DUPLICATE Date Analyzed: _0::_:3::_:1_:1c:;:3:.:._1.:::;02:;___.:..:R:::ES::_:U::_:L::.;T _____ ___.:.R!.!:E::::S.:::U.!:.L T.!._ _____ ~RPc.;D::.__
Check Standard Results Date Analyzed:
Known Value
50.00
03113/02
11.30 11.16 1.25
Measured Value %Recovered
55.05 110.10 1 030066-1 11 ~~~,.---2 030066-2 12 3 030066-3 13..:::.:::.:="-'-"'--4 030066·4 14 ___ _ 5 030066·5 15 ___ _ 6 030066·6 16 ___ _ 7 030066-7 17 ___ _ 8 030066-8 18----9 030066-9 19
10 030066-10 20 ___ _

SPECTRA Laboratories 2221 Ross Way • Tacoma, WA 98421 • (253) 272-4850
June 16, :!009 zac(_
Skillings-Connolly, Inc. Attn: Patrick Skillings PO Box 5080 Lacey, W A 98509
'\•·'
Sample Matrix: Water EPA Method: 624/8260 Sample Spiked: Method Blank Date Analyzed: 6-19-02 Units: ug/L ~ Spectra Project: 2002060156 Applies to Spectra #'s I - 13
GCMS VOLA TILE ORGANIC ANALYSIS QUALITY CONTROL RESULTS
Dup. Spike Spike Spike
Sample Amount Amount % Amount % Compound Result Added Found Recovery Found Recovery
I, 1-Dichloroethene <I 9.36 8.24 88 8.50 91
Trichloroethene <I 10.00 8.52 85 9.40 94
Benzene <I 10.00 8.85 89 9.71 97
Toluene <I 10.00 9.31 93 10.15 102
Chlorobenzene <I 10.00 9.44 94 10.15 102
SPECTRA LABORATORIES, INC.
Steven G. Hibbs, Laboratory Manager
•
• RPD
3
10
9
9
7
•

•---- SPECTRA Laboratories
•
•
2221 Ross Way e Tacoma, W A 98421 o (253) 272-4850 June 17, 2002
EPA Method: 6010 Skillings-Connolly, Inc. P.O. Box 5080 Lacey, W A 98509
Spectra Project: 2002030066 Applies to Spectra #'s 1 - 13
Attn: Patrick Skillings METALS
QUALITY CONTROL RESULTS
""""t'·-.· Spiked Sample: 2002030066-12 Units: ug/L
Sample Spike ComQound Result Amount Arsenic ND 1000.00 Boron 322.88 1000.00 Cadmium ND 1000.00 Chromium ND 1000.00 Mercury* ND 2.0 Copper ND 1000.00 Iron 115.75 1000.00 Lead ND 1000.00 Manganese 14.69 1000.00 Nickel 13.24 1000.00 Silver ND 1000.00 Zinc 22.41 1000.00
Units: ug!L
Arsenic <5
Boron <30
Cadmium <3
Chromium <7
Copper <6
Mercury <0.5
MS/MSD
Spike %
Date Prepared: 3-12-02 Date Analyzed: 3-12-02
Dup. Dup.% Result Recovea Result Recoven: 961.20 96.1 1074.80 107.5
1074.74 75.2 1081.58 75.9 1093.05 109.3 1073.92 107.4 1140.39 114.0 1132.20 113.2
195 97 1.95 97 1085.11 108.5 1077.72 107.8 1141.63 102.6 1128.50 101.3 1170.40 117.0 1000.40 100.0 1110.92 109.6 1088.94 107.4 1094.90 108.2 1054.07 104.1 858.73 85.9 870.39 87.0
1097.25 107.5 1098.08 107.6 METHOD BLANK
Date Prepared: 3-12-02 Date Analyzed: 3-12-02
!ron
Lead
Manganese
Nickel
Silver
Zinc
* Mercury spiked in to sample #2002030066-9
SPECTRA LAB ORA TORIES, INC .
Stev.en G. Hibbs, Laboratory Manager
RPD 11.2 0.9 1.8 0.7 0.0 0.7 1.3
15.7 2.0 3.8 1.3 0.1
<I
<2
<15
<7
<5

SPECTRA Laboratories 2221 Ross Way • Tacoma, WA 98421 • (253)272-4850
June 17, 2002
Skillings-Connolly, Inc. P.O. Box 5080 Lacey, W A 98509
Sample Matrix: Water EPA Method: 415.1/9060 Units: mg!L
Attn: Patrick Skillings Spectra Project: 2002030066 Applies to Spectra #'s I - 13
METHOD 415.1/9060 DISSOLVED ORGANIC CARBON ANALYSIS QUALITY CONTROL RESULTS
Date 3-13-02
Sample Result 11.30
Initial Calibration Verification
Date 3-13-02
Spike Amount 25.00
Known Value 50.0
Measured Value
40.54 Matrix Spike Results
Spike Result 32.62
% Rec. 85.28
MSD Result 32.73
Sample Duplicate Results Duplicate Sample #2002030066-12
Date 3-13-02
Date 3-13-02
Sample Result 1130
Duplicate Result 1LI6
Check Standard Results
Known Value 50.0
Measured Value 55.05
Method Blank Results
Date 3-13-02
Result <6
SPECTRA LABORATORIES, INC.
& Steven G. Hibbs, Lab~ratory Manager
%Rec. 81.08
MSD %Rec. 85.72
RPD 1.25
%Rec. II 0.10
RPD 0.51
•
•
•

•
•
SPECTRA Laboratories 2221 Ross Way o Tacoma, W A 98421 • (253) 272-4850
June 17, 2002
Skillings-Connolly, Inc. P.O. Box 5080
· ·· · Lacey, W A 98509
Attn: Patrick Skillings
Sample Matrix: Water EPA Method: SM 5210B/405.1 Units: mg/L Spectra Project: 2002030066 Applies to Spectra #'s I - 13
SM 5210B/405.1 BOD ANALYSIS QUALITY CONTROL RESULTS
Glucose-Glutamic Acid Check Standard
Date 3-11-02
SPECTRA LABORATORIES, INC.
Known Value
198 198 198
Steven G. Hibbs, Laboratory Manager
Measured Value
216 195.5 202
%Rec. 109 99 102

SPECTRA Laboratories 2221 Ross Way • Tacoma, WA 98421 • (253) 272-4850
June 17, 2002
Skillings-Connolly, Inc. P.O. Box 5080
Sample Matrix: Water
Lacey, W A 98509 EPA Method: 375.4/SM4500E Units: mg/L
Attn: Patrick Skillings Spectra Project: 2002030066 Applies to Spectra #'s I - 13
Sample Date Result
3-11-02 27.41
METHOD 375.4/SM4500E SULFATE QUALITY CONTROL RESULTS
Initial Calibration Verification
Known Measured Date Value Value
3-11-02 257 277.2 Matrix Spike Results
Spike Spike % MSD Amount Result Rec. Result 20.0 47.20 99.0 47.51
Sample Duplicate Results Duplicate Sample #2002030066-8
Date 3-11-02
Date 3-11-02
Sample Result 29.16
Duplicate Result 30.04
Check Standard Results
Known Value 50
Measured Value
53.9 Method Blank Results
Date 3-11-02
Result <I
SPECTRA LABORATORIES, INC.
~ Steven G. Hibbs, Laboratory Manager
%Rec. 108
MSD %Rec. 100.5
RPD 3
%Rec. 108
RPD 2
•
•
•

•
•
SPECTRA Laboratories 2221 Ross Way • Tacoma, WA 98421 • (253) 272-4850
July 11, 2002
Skillings-Connolly Ann: Patrick Skillings PO Box 5080 Lacey, W A 98509
Sample Matrix: Water EPA Method: 415.1/9060 Spiked Sample: 060156-1 Units: mg/L Spectra Project: 2002060156 Applies to Spectra #'s 1-13
415.1/9060 DISSOLVED ORGANIC CARBON ANALYSIS QUALITY CONTROL RESULTS
Date 6-17-02
Initial Calibration Verification
Date 6-17-02
Known Value 100.00
Measured Value 82.64
Sample Result 2.04
Date 6-17-02
Date 6-17-02
Matrix Spike Results Spike Spike
Amount Result 25.00 22.36
Sample Duplicate Results Duplicate Sample #060156-12
Sample Duplicate Result Result 7.993 7.575
Check Standard Results Known Value 50.00
Measured Value 43.16
Method Blank Results Date 06-17-02
Result <2
% Rec.
81.30
SPECTRA LABORATORIES, INC .
Steven G. Hibbs, Laboratory Manager
%Recovered 82.64
MSD MSD Result %REC. RPD 21.54 78.02 4.12
RPD 5.37
% Rec. 86.32

SPECTRA Laboratories 2221 Ross Way • Tacoma, WA 98421 • (253) 272-4850
July II, 2002
Skillings-Connolly Attn: Patrick Skillings PO Box 5080
METHOD BLANK
Lacey, W A 98509
Sample Matrix: Water Spectra Project: 2002060156 Applies to Spectra #'s 1 - 13
VOLATILE ORGANIC COMPOUNDS Compound CAS# ug/L
Bromodichloromethane 75-27-4. <1
Bromoform 75-25-2 <1
Chlorodibromomethane 124-48-1 <I
Chloroform 67-66-3 <1
CAS# = Chemical Abstract Services Registry Number VOA Surrogate Percent Recoveries
Dibromofluoromethane Toluene-dB 4-Bromofluorobenzene
SPECTRA LABORATORIES, INC.
Steven G. Hibbs, Labor;;\ory Manager
101% 104% 100%
Date Analyzed: 6-19-02 Dilution: 1 < =less than
EPA METHOD 8260
•
•
•
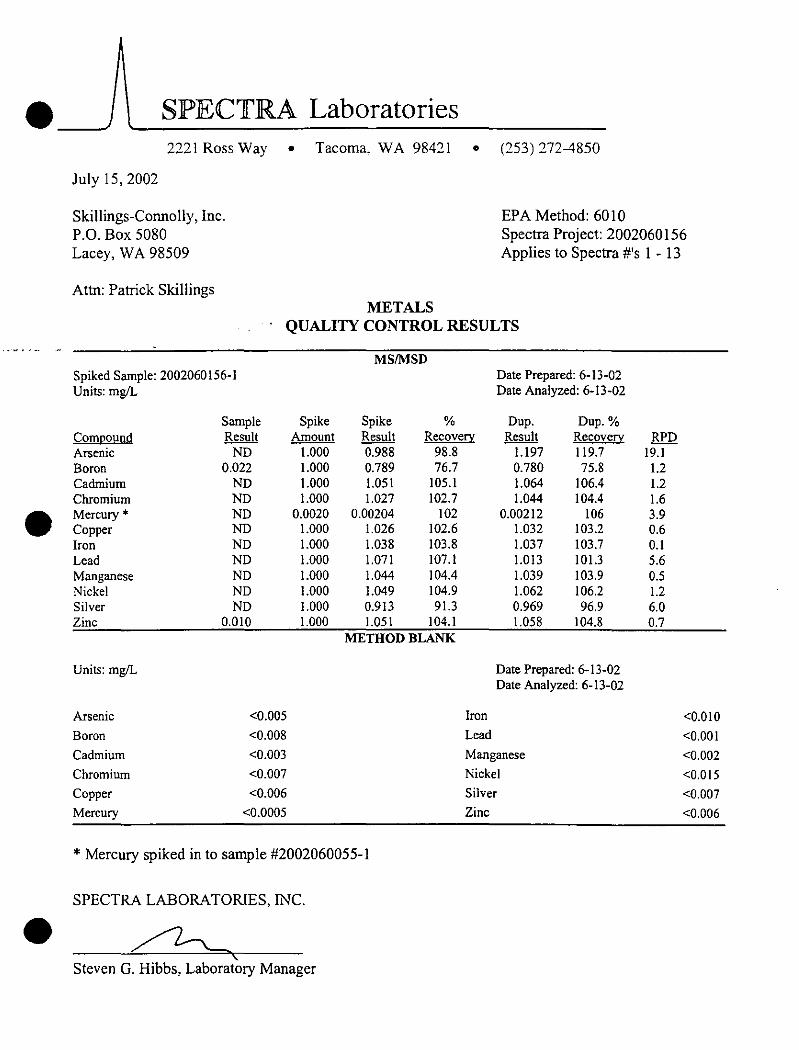
•
•
SPECTR.A Laboratories 2221 Ross Way • Tacoma, WA 98421 o (253) 272-4850
July 15, 2002
EPA Method: 6010 Skillings-Connolly, Inc. P.O. Box 5080 Lacey, W A 98509
Spectra Project: 2002060156 Applies to Spectra #'s I - 13
Attn: Patrick Skillings METALS
QUALITY CONTROL RESULTS
Spiked Sample: 2002060156-1 Units: mg/L
ComQound Arsenic Boron Cadmium Chromium Mercury • Copper Iron Lead Manganese Nickel Silver Zinc
Units: mg!L
Arsenic
Boron
Cadmium
Chromium
Copper
Mercury
Sample Result
ND 0.022
ND ND ND ND ND ND ND ND ND
0.010
<0.005
<0.008
<0.003
<0.007
<0.006
<0.0005
Spike Amount
1.000 1.000 1.000 1.000
0.0020 1.000 1.000 1.000 1.000 1.000 1.000 1.000
MS/MSD Date Prepared: 6-13-02 Date Analyzed: 6-13-02
Spike % Dup. Dup.% Result RecoverY Result Recovea 0.988 98.8 1.197 119.7 0.789 76.7 0.780 75.8 1.051 105.1 1.064 106.4 1.027 102.7 1.044 104.4
0.00204 102 0.00212 106 1.026 102.6 1.032 103.2 1.038 103.8 1.037 103.7 1.071 107.1 1.013 101.3 1.044 104.4 1.039 103.9 1.049 104.9 1.062 106.2 0.913 91.3 0.969 96.9 1.051 104.1 1.058 104.8
METHOD BLANK
Date Prepared: 6-13-02 Date Analyzed: 6-13-02
Iron
Lead
Manganese
Nickel
Silver
Zinc
* Mercury spiked in to sample #2002060055-1
SPECTRA LABORATORIES, INC.
' Steven G. Hibbs, Laboratory Manager
RPD 19.1 1.2 1.2 1.6 3.9 0.6 0.1 5.6 0.5 1.2 6.0 0.7
<0.010
<0.001
<0.002
<0.015
<0.007
<0.006

SPECTRA Laboratories 2221 Ross Way • Tacoma, W A 98421 • (253) 272-4850
July 15, 2002
Skillings-Connolly, Inc. P.O. Box 5080 Lacey, W A 98509
Sample Matrix: Water EPA Method: 4500Br Units: mg!L
Attn: Patrick Skillings Spectra Project: 2002060156 Applies to Spectra #'s I - 13
Date 6-10-02
STANDARD METHOD 4500 BR BROMIDE ANALYSIS QUALITY CONTROL RESULTS
Sample Result 0.202
Date 6-10-02
Initial Check Standard Results
Known Value 0.5
Measured Value
0,555 %Rec.
1!1.0
Matrix Spike/Matrix Spike Duplicate. Results
Spike Spike % MSD Amount Result Rec. Result 0.5 0.738 107.2 I
Sample Duplicate Results Duplicate Sample #2002060 I 56-6
Date 6-10-02
Sample Result 0.139
Duplicate Result 0.137
MSD %Rec.
107.8
RPD 1.4
SPECTRA LABORATORIES, INC.
Steven G. Hibbs, Labo~atory Manager
RPD I
•
•
•

•
•
SPECTRA Laboratories 2221 Ross Way • Tacoma, WA 98421 • (253) 272-4850
July 15, 2002
Skillings-Connolly, Inc. P.O. Box 5080 Lacey, W A 98509
Attn: Patrick Skillings
Sample Matrix: Water EPA Method: SM 521 OB/405.1 Units: mg/L Spectra Project: 2002060156 Applies to Spectra #'s 1- 13
SM 5210B/405.1 BOD ANALYSIS QUALITY CONTROL RESULTS
Glucose-Glutamic Acid Check Standard
Date 6-19-02
SPECTRA LABORATORIES, INC.
Known Value
198 198 198
Steven G. Hibbs, Laborafory Manager
Measured Value
175 194.5 183.3
%Rec. 88 98 93

SPECTRA Laboratories 2221 Ross Way • Tacoma, WA 98421 • (253) 272-4850
October 1, 2002
Skillings-Connolly Attn: Patrick Skillings PO Box 5080 Lacey, W A 98509
Sample Matrix: Water EPA Method: 375-4/SM4500E Spiked Sample: 090031-13 Units: mg/L Spectra Project: 2002090031 Applies to Spectra #'s 1-13
- Method 375.4/SM4500E Sulfate QUALITY CONTROL RESULTS
Date 9-13-02
Initial Calibration Verification
Date 9-13-02
Known Value 257
Measured Value 272.3
%Recovered 106
Sample Result 6.120
Date 9-13-02
Date 9-13-02
Matrix Spike Results Spike Spike
Amount Result 20.00 26.310
Sample Duplicate Results Duplicate Sample #090031-8
Sample Duplicate Result Result 24.90 24.77
Check Standard Results Known Value 50
Measured Value
52.0
Method Blank Results Date 9-13-02
Result <1
% MSD MSD Rec. Result %REC. RPD
101.0 26.970 104.3 3
RPD 1
% Rec. 104
SPECTRA LABORATORIES, INC.
Steven G. Hibbs, Lab'bratory Manager
•
•
•

•
SPECTRA Laboratories 2221 Ross Way • Tacoma, WA 98421 • (253) 272-4850
October 3, 2002
EPA Method: 6010 Skillings-Connolly, Inc. P.O. Box 5080 Lacey, W A 98509
Spectra Project: 2002090031 Applies to Spectra #'s 1 - 13
Attn: Patrick Skillings METALS
QUALITY CONTROL RESULTS u .:_
Spiked Sample:2002090031-l Units: mg!L
Spike
MS/MSD.
Spike
Date Prepared: 9-6-02 Date Analyzed: 9-11-02
% Dup. Dup.% Comnound
Sample Result
ND ND ND ND ND ND ND ND ND ND ND ND
Amount Result Recovea Result Recovea Arsenic 1.000 0.934 93.4 1.098 109.8 Boron 1.000 0.996 99.6 1.003 100.3 Cadmium 1.000 1.083 108.3 1.119 111.9 Chromium 1.000 1.065 106.5 1.072 107.2 Mercury • 0.0020 0.0021 104 0.0022 108 Copper 1.000 1.088 108.8 1.101 110.1 Iron 1.000 1.063 106.3 1.053 105.3 Lead 1.000 0.907 90.7 0.913 91.3 Manganese 1.000 1.053 105.3 1.075 107.5 Nickel 1.000 1.076 107.6 1.074 107.4 Silver 1.000 1.050 105.0 1.031 103.1 Zinc 1.000 1.097 109.7 1.074 107.4
METHOD BLANK
Units: mg/L Date Prepared: 9-6-02 Date Analyzed: 9-11-02
Arsenic <0.005 Iron
Boron <0.008 Lead
Cadmium <0.003 Manganese
Chromium <0.007 Nickel
Copper <0.006 Silver
Mercury <0.0005 Zinc
*Mercury spiked in to sample #2002090031-13
RPD 16.1 0.7 3.3 0.7 3.7 1.2 0.9 0.7 2.1 0.2 1.8 2.1
<0.010
<0.001
<0.002
<0.015
<0.007
<0.006
• SPECTRA LABORATORIES, INC.
Steven G. Hibbs, Laboratory Manager

SPECTRA Laboratories 2221 Ross Way • Tacoma, WA 98421 • (253) 272-4850
October 3, 2002
Skillings-Connolly, Inc. P.O. Box 5080 Lacey, W A 98509
Sample Matrix: Water EPA Method: 415.1/9060 Units: mg/L
Atm: Patrick Skillings Spectra Project: 2002090031 Applies to Spectra #'s 1 - 13
METHOD 415.1/9060 DISSOLVED ORGANIC CARBON ANALYSIS QUALITY CONTROL RESULTS
Date 9-11-02
Sample Result 3.89
Initial Calibration Verification
Date 9-9-02
Spike Amount
25.00
Known Value 50.00
Measured Value 50.71
Matrix Spike Results
Spike Result
22.98
% Rec. 76.36
MSD Result 22.73
Sample Duplicate Results Duplicate Sample #2002090031-13
Date 9-9-02
Date 9-9-02
Sample Result 9.813
Duplicate Result 9.091
Check Standard Results
Known Value 50.0
Measured Value 59.50
Method Blank Results
Date 9-9-02
Result <2
SPECTRA LABORATORIES, INC.
Steven G:HiblJS>LiibUratory Manager
%Rec. 101.42
MSD %Rec. 75.36
RPD 7.64
%Rec. 119.00
RPD 1.32
•
•
•

.___, SPECTRA Laboratories 2221 Ross Way • Tacoma, W A 98421 • (253) 272-4850
October 7, 2002
Skillings & Connolly, Inc. P.O. Box 5080 Lacey, W A 98509
Attn: Patrick Skillings
Sample Matrix: Water Sample Spiked: Method Blank Date. Extracted: 9-1 0-02 Date Analyzed: 9-16-02 Units: ug/L Spectra Project: 2002090031 Applies to Spectra #'s I - 13
SOIL SEMIVOLATILE MATRlX SPIKE QUALITY CONTROL
Sample Spike MS MS% MSD MSD Result Added Cone. Rec, Cone. Rec. RPD
• Phenol 75 <10 56 74 64 85 14 2-Chloropbenol 75 <10 51 68 60 80 15 I ,4-Dichlorobenzene 50 <10 33 66 36 71 8 N-Nitroso-Di-n-Propylamine 50 <10 57 113 61 122* 7 I ,2,4-Trichlorobenzene 50 <10 39 77 41 82 6 4-Cbloro-3-Methylpbenol 75 <10 65 86 71 95 9 Acenapbthene 50 <10 43 85 47 94 9 4-Nitropbenol 75 <50 72 96* 77 103* 7 2,4-Dinitrotoluene 50 <10 38 77 43 87 12 Pentachlorophenol 75 <50 61 81 68 90 11 Pyrene 50 <10 52 104 56 111 7
• Out of limits
SPECTRA LAB ORA TORIES, INC.
• Steven G. Hibbs, Laboratory Manager

SPECTRA Laboratories 2221 Ross Way • Tacoma, WA 98421 • (253) 272-4850
October 7, 2002
Skillings-Connolly, Inc. P.O. Box 5080 Lacey, W A 98509
Sample Matrix: Water EPA Method: 4500Br Units: mg/L
Atrn: Patrick Skillings · .Spectra Project: 2002090031
Applies to Spectra #'s 1 - 13
STANDARD METHOD 4500 BR BROMIDE ANALYSIS QUALITY CONTROL RESULTS
Date 9-16-02
Initial Check Standard Results
Known Value 0.5
Measured Value
0.518 %Rec.
103.6
Matrix Spike/Matrix Spike Duplicate Results
Sample Spike Spike % MSD Date Result Amount Result Rec. Result
9-16-02 ND 0.5 0.462 92.4 0.405
Sample Duplicate Results Duplicate Sample #2002090031-2
Date 9-16-02
SPECTRA LABORATORIES, INC.
~
Sample Result 0.132
Steven G. Hibbs, Laboratory Manager
Duplicate Result 0.108
MSD %Rec. 81.0
RPD 20.0
RPD 13
•
•
•

•
•
SPECTR.A Laboratories 2221 Ross Way • Tacoma, W A 98421 • (253) 272-4850
October 7, 2002
Skillings-Connolly, Inc. P.O. Box 5080 Lacey, W A 98509
Attn: Patrick Skillings
Sample Matrix: Water EPA Method: SM 5210B/405.1 Units: mg/L Spectra Project: 2002090031 Applies to Spectra #'s I - 13
SM 5210B/405.1 BOD ANALYSIS QUALITY CONTROL RESULTS
Glucose-Glutamic Acid Check Standard
Date 9-11-02
SPECTRA LABORATORIES, INC.
Known Value
198 198 198
~ Steveri G. Hibbs, Lab~atory Manager
Measured Value
160 . 150.5 163.3
%Rec. 81 76 82

SPECTRA Laboratories, Inc. 2221 Ross Way • Tacoma. WA 98421 • (253) 272--4850 • Fax (253) 572-9838
January 16, 2003
Skillings-Connolly, Inc. P.O. Box 5080 Lacey, WA 98509
,. Attn: Patrick Skillings
Sample Matrix: Water EPA Method: 375.4/SM4500E Units: mg!L Spectra Project: 2002120056 Applies to Spectra #'s 1 - 13
METHOD 375.4/SM4500E SULFATE QUALITY CONTROL RESULTS
Sample Date Result
12-10-02 4.44
Matrix Spike Results
Spike Spike % MSD Amount Result Rec. Result 20.00 22.85 92.05 21.88
Sample Duplicate Results Duplicate Sample #2002120056-4
Date 12-10-02
Date 12-10-02
Sample Result 8.79
Duplicate Result 8.34
Check Standard Results
Known Value 50.00
Measured Value
51.94 Method Blank Results
Date 12-10-02
Result <1
SPECTRA LABORATORIES, INC.
~~ Steven G. Hibbs, LaBoratory Manager
MSD %Rec. 87.20
RPD 5.25
%Rec. 103.88
RPD 5.41
•
•
•

·-- SPECTRA Laboratories, Inc.
•
•
2221 Ross Way • Tacoma, WA98421 o (253) 272-4850 o Fax (253) 572-9838
January 16, 2003
Skillings-Connolly, Inc. P.O. Box 5080 Lacey, W A 98509
Attn: Patrick Skillings
Sample Matrix: Water EPA Method: 415.119060 Units: mg!L Spectra Project: 2002120056 Applies to Spectra #'s 1 c 13
··_.._METHOD 415-119060 DISSOLVED ORGANIC CARBON ANALYSIS QUALITY CONTROL RESULTS
Date 12-12-02
Initial Calibration Verification
Known Value 50.00
Measured Value 45.99
Matrix Spike Results
Sample Spike Spike Result 28.62
% Rec. 80.01
MSD Result 28.49
Date Result Amount 12-12-02 8.62 25.00
Date 12-12-02
Date 12-12-02
Sample Duplicate Results Duplicate Sample #2002120056-3
Sample Duplicate Result Result 8.747 8.156
Check Standard Results
Known Measured Value Value 50.00 43.35
Method Blank Results
Date Result 12-12-02 <2
SPECTRA LABORATORIES, INC.
~ ' Steven G. Hibbs, Laboratory Manager
%Rec. 91.97
MSD %Rec. 79.49
RPD 6.99
%Rec. 86.70
RPD 0.65

SPECTRA Laboratories, Inc. 2221 Ross Way • Tacoma, WA 98421 • (253) 272-4850 • Fax (253) 572-9838
January 16,2003
Skillings-Connolly, Inc. P.O. Box 5080 Lacey, W A 98509
Attn: Patrick Skillings
Sample Matrix: Water EPA Method: SM 521 OB/405. I Units: mg!L · · Spectra Project: 2002120056 Applies to Spectra #'s I - 13
· SM 5210B/405.1 BOD ANALYSIS QUALITY CONTROL RESULTS
Glucose-Glutamic Acid Check Standard
Date 12-12-02
SPECTRA LABORATORIES, INC.
Known Value 198 198 198
Steven G. Hibbs, Laboratory Manager
Measured Value
177 170.3 204.3
%Rec. 89 86 103
•
•
•

•---' SPECTRA Laboratories, Inc. 2221 Ross Way • Tacoma, WA 98421 • (253) 272-4850 • Fax (253) 572-9838
•
•
January 20, 2003
Skillings & Connolly, Inc. P.O. Box 5080
. Lacey, W A 98509 •
Sample Matrix: Water EPA Method: 624/8260 Sample Spiked: Method Blank Date Analyzed: 12-13-02 Units: ug/L Spectra Project: 2002120056 Applies to Spectra #'s 1 - 13
GCMS VOLA TILE ORGANIC ANALYSIS QUALITY CONTROL RESULTS
Dup. Spike Spike Spike
Sample Amount Amount % Amount % Compound Result Added Found Recovery Found Recovery
I, 1-Dichloroethene <I 9.36 6.06 65 6.47 69
Trichloroethene <I 10.00 8.27 83 8.86 89
Benzene <I 10.00 8.41 84 9.13 91
Toluene <I 10.00 7.80 78 8.14 81
Chlorobenzene <I 10.00 9.20 92 9.86 99
SPECTRA LABORATORIES, INC.
/1-t <
Steven G. Hibbs, Laboratory Manager
RPD
7
7
8
4
7
j t .·

SPECTRA Laboratories, Inc. 2221 Ross Way • Tacoma, WA 98421 • (253) 272-4850 • Fax (253) 572-9838
January 20, 2003
Skillings & Connolly, Inc. P.O. Box 5080 Lacey, W A 98509
Attn: Patrick Skil!ings
... Sample Matrix: Water Sample Spiked: Method Blank Date Extracted: 10-30-02 Date Analyzed: 10-31-02 Units: ug!L Spectra Project: 2002120056 Applies to Spectra #'s 1 - 13
SOIL SEMIVOLATILE MATRIX SPIKE QUALITY CONTROL
Sample Spike MS MS% MSD MSD Result Added Cone. Rec. Cone. Rec. RPD
Phenol 75 <10 36 48 35 46 5 2-Chlorophenol 75 <10 39 52 36 48 7 I ,4-Dichlorobenzene 50 <10 20 39 19 38 4 N-Nitroso-Di-n-Propylamine 50 <10 27 54 26 52 5 1,2,4-Trichlorobenzene 50 <10 21 42 22 43 3 4-Chloro-3-Methylphenol 75 <10 38 51 36 48 5 Acenaphthene 50 <10 29 58 27 54 8 4-Nitrophenol 75 <50 17 23 15 20 14 2,4-Dinitrotoluene 50 <10 29 58 23 46 22 Pentachlorophenol 75 <50 34 45 29 39 15 Pyrene 50 <10 47 93 39 78 18
SPECTRA LABORATORIES, INC.
/b,. Steven G. Hibbs, Laboratory Manager
•
•
•

• _ __., SPECTRA Laboratories, Inc .
•
•
2221 Ross Way • Tacoma, WA 98421 • (253) 272-4850 • Fax (253) 572-9838
January 20, 2003
Skillings-Connolly, Inc. P.O. Box 5080 Lacey, WA 98509
Sample Matrix: Water EPA Method: 4500Br Units: mg!L ·
Atrn: Patrick Skillings Spectra Project: 2002120056 Applies to Spectra #'s 1 - 13
Date 1-13-03
STANDARD METHOD 4500 BR BROMIDE ANALYSIS QUALITY CONTROL RESULTS
Sample Result ND
Date 1-13-03
Initial Check Standard Results
Known Value .5
Measured Value
0.614 %Rec.
122.8
Matrix Spike/Matrix Spike Duplicate Results
Spike Spike % MSD Amount Result Rec. Result 0.5
Date 1-13-03
0.401 80.2 0.386
Sample Duplicate Results Duplicate Sample #2002120056-5
Sample Result 0.201
Duplicate Result 0.198
MSD %Rec. 77.2
RPD 1.5
SPECTRA LABORATORIES, INC.
Steven G. Hibbs, Laboratory Manager
RPD 4

SPECTRA Laboratories, Inc. 2221 Ross Way • Tacoma. WA 98421 • (253) 272-4850 • Fax (253) 572-9838
January 20, 2003
Skillings-Connolly, Inc. P.O. Box 5080 Lacey, WA 98509
Attn: Patrick Skillings METALS
EPA Method: 601 0 Spectra Project: 2002120056 Applies to Spectra #'s 1 - 13
QUALITY CONTROL RESULTS
Spiked Sample:2002120056-l Units: mg!L
Sample Coml!ound Result Arsenic ND Boron 0.199 Cadmium ND Chromium ND Mercury* ND Copper 0.008 Iron ND Lead ND Manganese ND Nickel ND Silver ND Zinc 0.015
Units: mg/L
Arsenic <0.005
Boron <0.01
Cadmium <0.003
Chromium <0.007
Copper <0.006
Mercury <0.0005
Spike Amount
1.000 1.000 1.000 1.000
0.0020 1.000 1.000 1.000 1.000 1.000 1.000 1.000
* Mercury spiked in to method blank.
SPECTRA LAB ORA TORIES, INC.
Steven G. Hibbs, Laboratory Manager
MSIMSD
Spike %
Date Prepared: 12-9-02 Date Analyzed: 12-9-02
Dup. Dup.% Result Recovery Result Recovery 1.182 118.2 0.988 98.8 0.993 79.4 1.051 85.2 1.067 106.7 1.033 103.3 1.110 111.0 1.065 106.5
0.0021 105 0.0020 100 1.057 104.9 1.036 102.8 0.973 97.3 0.961 96.1 1.188 118.8 1.168 116.8 1.027 102.7 1.041 104.1 1.030 103.0 0.897 89.7 0.961 96.1 0.928 92.8 1.029 101.4 1.043 102.8
METHOD BLANK
Date Prepared: 12-9-02 Date Analyzed: 12-9-02
Iron
Lead
Manganese
Nickel
Silver
Zinc
RPD 17.9 7.0 3.2 4.1 4.8 2.0 1.2 1.7 1.4
13.8 3.5 1.4
<0.015
<0.001
<0.002
<0.015
<0.007
<0.006
•
•
•

•--" SPECTRA Laboratories
''
•
•
2221 Ross Way • Tacoma, WA 98421 • (253) 272-4850 • Fax (253) 572-9838
April 10, 2003
Skillings-Connolly, Inc. P.O. Box 5080 Lacey, W A 98509
Sample Matrix: Water EPA Method: 4500Br Units: mg!L · ·
Attn: Patrick Skillings Spectra Project: 2003030069 Applies to Spectra #'s I - 13
STANDARD METHOD 4500 BR BROMIDE ANALYSIS QUALITY CONTROL RESULTS
Date 4-3-03
Initial Check Standard Results
Known Value 0.5
Measured Value
0.48 %Rec.
96.0
Matrix Spike/Matrix Spike Duplicate Results
Sample Spike Spike % MSD Date Result Amount Result Rec. Result
4-3-03 <0.1 0.5 0.586 117.2 0.566
Sample Duplicate Results Duplicate Sample #2003030069-13
Date 4-3-03
SPECTRA LABORATORIES, INC.
Sample Result <0.1
~ Steven G. Hibbs, Laboratory Manager
Duplicate Result <0.1
MSD %Rec. 113.2
RPD 0.0
RPD 3

SPECTRA Laboratories 2221 Ross Way • Tacoma, WA 98421 • (253) 272-4850 • Fax (253) 572-9838
April I 0, 2003
Skillings-Connolly, Inc. P.O. Box 5080 Lacey, W A 98509
Attn: Patrick Skillings
Sample Matrix: Water EPA Method: 415.1/9060 Units: mg/L Spectra Project: 2003030069 Applies to Spectra #'s 1 - 13
METHOD 415.119060 DISSOLVED ORGANIC CARBON ANALYSIS QUALITY CONTROL RESULTS
Date 3-10-03
Sample Result 6.091
Spike Amount
25
Matrix Spike Results
Spike Result
29.68
% Rec. 94.4
MSD Result 29
Sample Duplicate Results Duplicate Sample #2003030069-2
Date 3-10-03
Date 3-10-03
Sample Result 8.992
Duplicate Result 9.406
Check Standard Results
Known Value 50
Measured Value 42.26
Method Blank Results
Date 3-10-03
Result <5
SPECTRA LABORATORIES, INC.
~ Steven G. Hibbs, Lab~ratory Manager
MSD %Rec. 90.4
RPD 4.5
%Rec. 84.5
RPD 4
•
•
•

·---' SPECTRA Laboratories 2221 Ross Way • Tacoma, WA 98421 • (253) 272-4850 • Fax (253) 572-9838
•
•
April 10, 2003
Skillings-Connolly, Inc. P.O. Box 5080 Lacey, WA 98509
----
METHOD BLANK Sample Matrix: Water Spectra Project:2003030069 Applies to Spectra #'s I - 13
SEMIVOLA TILE ORGANIC ANALYSIS Compound ug/L
N -N itrosodimethylamine <I 0
Caffeine <1 0
SURROGATE RECOVERIES: Nitrobenzene-d5 2-Fluorobiphenyl p-Terphenyl-dl4
SPECTRA LABORATORIES, INC.
/h Stev~n G. Hibbs, Lili6ratory Manager
54% 50% 83%
Date Extracted: 3-11-03 Dl!te Analyzed: 3-14-03 Dilution: I . <=less than
METHOD 625/8270
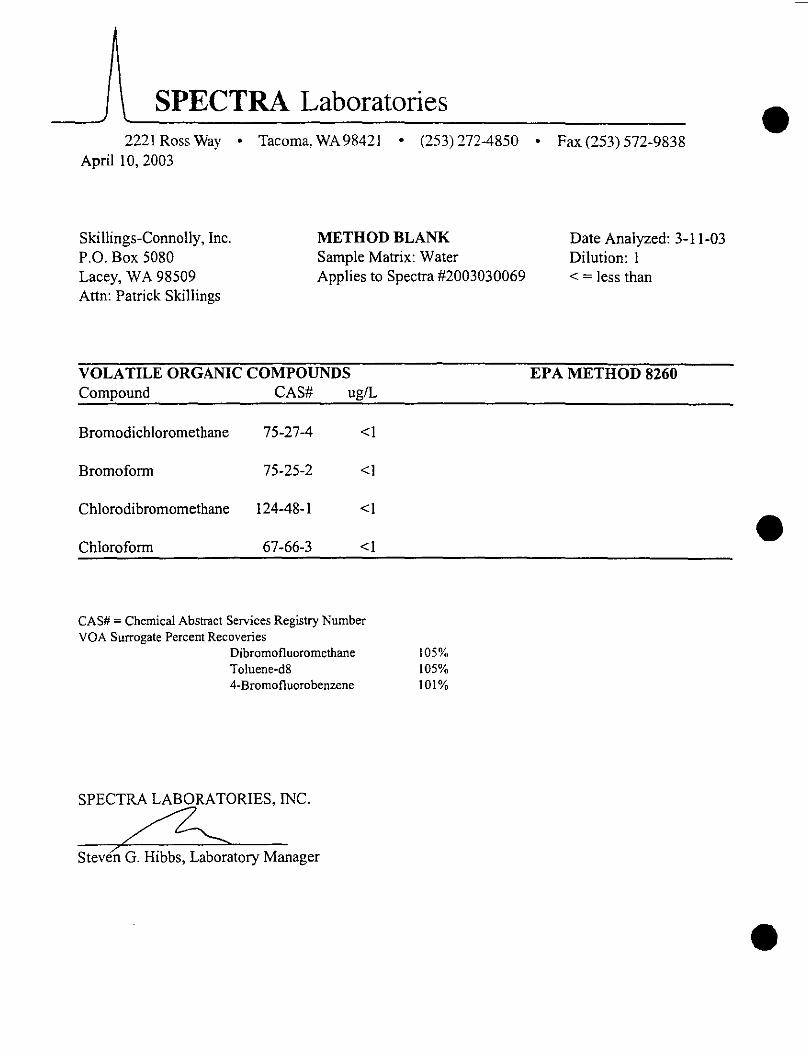
SPECTRA Laboratories 2221 Ross Way o Tacoma, WA98421 o (253) 272-4850 o Fax (253) 572-9838
April 10, 2003
Skillings-Connolly, Inc. P.O. Box 5080
METHOD BLANK Sample Matrix: Water
Lacey, W A 98509 Attn: Patrick SkiJlings
Applies to Spectra #2003030069
VOLATILE ORGANIC COMPOUNDS Compound CAS# ug!L
Bromodichloromethane 75-27-4 <I
Bromoform 75-25-2 <1
Chlorodihromomethane 124-48-1 <1
Chloroform 67-66-3 <1
CAS#= Chemical Abstract Services Registry Number VOA Surrogate Percent Recoveries
Dibromofluoromethane Toluene-d8 4-Bromofluorobenzene
SPECTRA LAB ORA TORIES, INC.
~ Stev?n G. Hibbs, Laboratory Manager
105% 105% 101%
Date Analyzed: 3-11-03 Dilution: 1 <=less than
EPA METHOD 8260
•
•
•

·--" SPECTRA Laboratories
•
2221 Ross Way • Tacoma. WA 98421 • (253) 272-4850 • Fax (253) 572-9838
April I 0, 2003
Skillings-Connolly, Inc. . P.O. Box 5080 Lacey, WA 98509
Attn: Patrick Skillings
Sample Matrix: Water EPA Method: 375.4 Units: mg/L Spectra Project: 2003030069 Applies to Spectra #'s I - 13
METHOD 375.4/SM4500E SULFATE QUALITY CONTROL RESULTS
Sample Date Result
4-2-03 2.55
Matrix Spike Results
Spike Spike % MSD Amount Result Rec. Result 20.00 24.15 108.00 23.63
Sample Duplicate Results Duplicate Sample #2003030069-2
Date 4-2-03
Date 4-2-03
Sample Duplicate Result Result 2.70 3.15
Check Standard Results
Known Measured Value Value 50.00 47.15
Method Blank Results
Date 4-2-03
Result <I
SPECTRA LABORATORIES, INC .
MSD %Rec. RPD
105.40 2.44
RPD 15.38
%Rec. 94.30
• ~ Steven G. Hibbs, Laboratory Manager

SPECTRA Laboratories 2221 Ross Way • Tacoma, WA 98421 • (253) 272-4850 • Fax (253) 572-9838
April 10, 2003
Skillings & Connolly, Inc, P.O. Box 5080 Lacey, W A 98509
Sample Matrix: Water EPA Method: 624/8260 Sample Spiked: Method Blank Date Analyzed: 3-11-03 Units: ug!L Spectra Project: 2003030069 Applies to Spectra #'s I - 13
GCMS VOLATILE ORGANIC ANALYSIS QUALITY CONTROL RESULTS
Dup. Spike Spike Spike
Sample Amount Amount % Amount % Compound Result Added Found Recovery Found Recovery
1,1-Dicbloroethene <1 10.00 9.61 96 9.91 99
Trichloroethene <1 10.00 9.71 97 9.76 98
Benzene <I 10.00 9.91 99 10.04 100
Toluene <I 10.00 10.11 101 10.26 103
Chlorobenzene <I 10.00 9.78 98 9.69 97
SPECTRA LABORATORIES, INC.
~ Steven G. Hibbs, Laboratory Manager
RPD
3
I
•
•
•

•-- SPECTRA Laboratories
•
•
2221 Ross Way • Tacoma, WA98421 • (253) 272-4850 • Fax (253) 572-9838
April 8, 2003
Skillings-Connolly, Inc. P.O. Box 5080 Lacey, W A 98509
Attn: Patrick Skillings It ' ' \ • , METALS
EPA Method: 6010 Spectra Project: 2003030069 Applies to Spectra #'s 1 - 13
' :QUALITY CONTROL RESULTS
Spiked Sample:2003030069-l Units: mg!L
ComQound Arsenic Boron Cadmium Chromium Mercury • Copper Iron Lead Manganese Nickel Silver Zinc
Sample Result
ND 0.045
ND ND ND
0.010 0.012
ND 0.006
ND ND ND
Spike Amount
1.000 1.000 1.000 1.000
0.0040 1.000 1.000 1.000 1.000 1.000 1.000 1.000
MS/MSD
Spike % Result Recovery 0.917 91.7 1.035 99.0 0.998 99.8 0.975 97.5
0.0042 105 1.018 100.8 0.992 98.0 0.828 82.8 0.971 96.5 0.990 99.0 0.808 80.8 1.007 100.7
Date Prepared: 3-10-03 Date Analyzed: 3-10-03
Dup. Dup.% Result Recovery
1.045 104.5 1.022 97.7 1.017 101.7 1.020 102.0
0.0042 105 1.028 101.8 0.985 97.3 0.811 81.1 0.996 99.0 1.012 101.2 0.858 85.8 1.009 100.9
METHOD BLANK
Units: mg!L Date Prepared: 3-10-03 Date Analyzed: 3-10-03
Arsenic <0.005 Iron
Boron <0.01 Lead
Cadmium <0.003 Manganese
Chromium <0.007 Nickel
Copper <0.006 Silver
Mercury <0.0005 Zinc
* Mercury spiked in to sample #20030005-1
SPECTRA LABORATORIES, INC.
Steven G. Hibbs, Laboratory Manager
RPD 13.0
1.3 1.9 4.5
0 1.0 0.7 2.1 2.6 2.2 6.0 0.2
<0.015
<0.001
<0.002
<0.015
<0.007
<0.006

SPECTRA Laboratories 2221 Ross Way • Tacoma, WA 98421 • (253) 272-4850 • Fax (253) 572-9838
April 10, 2003
Skillings-Connolly, Inc, P,O, Box 5080 Lacey, WA 98509
Attn: Patrick Skillings
Sample Matrix: Water EPA Method: SM 5210B/405,1 Units: mg!L Spectra Project: 2003030069 Applies to Spectra #'s I - 13
SM 5210B/405.1 BOD ANALYSIS QUALITY CONTROL RESULTS
Glucose-Glutamic Acid Check Standard
Date 3-12-03
SPECTRA LAB ORA TORIES, INC.
Known Value 198 198 198
Steven G. Hibbs, L;;&l!atory Manager
Measured Value
182 190 196
%Rec. 92 96 99
•
•
•

·---- SPECTRA Laboratories
. •.
•
•
2221 Ross Way • Tacoma, WA 98421 • (253) 272-4850 • Fax (253) 572-9838
April 24, 2003
Skillings-Connolly, Inc. P.O. Box 5080 Lacey, W A 98509
Attn: Patrick Skillings METALS
EPA Method: 60 I 0 Spectra Project: 2003030396 Applies to Spectra# 1
QUALITY CONTROL RESULTS
Spiked Sample:2003030069-l Units: mg!L
Sample Com11ound Result Arsenic ND Boron 0.045 Cadmium ND Chromium ND Mercury * ND Copper 0.010 Iron 0.012 Lead ND Manganese 0.006 Nickel ND Silver ND Zinc ND
Spike Amount
1.000 1.000 1.000 1.000
0.0040 1.000 1.000 1.000 1.000 1.000 1.000 1.000
MS/MSD
Spike % Result Recoven: 0.917 91.7 1.035 99.0 0.998 99.8 0.975 97.5
0.0042 105 1.018 100.8 0.992 98.0 0.828 82.8 0.971 96.5 0.990 99.0 0.808 80.8 1.007 100.7
Date Prepared: 3-10-03 Date Analyzed: 3-1 0-03
Dup. Dup.% Result Recovery
1.045 104.5 1.022 97.7 1.017 101.7 1.020 102.0
0.0042 105 1.028 101.8 0.985 97.3 0.811 81.1 0.996 99.0 1.012 101.2 0.858 85.8 1.009 100.9
METHOD BLANK
Units: mg!L Date Prepared: 3-10-03 Date Analyzed: 3-10-03
Arsenic <0.005 Iron
Boron <0.01 Lead
Cadmium <0.003 Manganese
Chromium <0.007 Nickel
Copper <0.006 Silver
Mercury <0.0005 Zinc
* Mercury spiked in to sample #20030005-1
SPECTRA LABORATORIES, INC.
//·~ Steven G. Hibbs, Laboratory Manager
RPD 13.0
1.3 1.9 4.5
0 1.0 0.7 2.1 2.6 2.2 6.0 0.2
<0.015
<0.001
<0.002
<0.015
<0.007
<0.006

SPECTRA Laboratories 2221 Ross Way • Tacoma, WA 98421 • (253) 272-4850 • Fax (253) 572-9838
April 24, 2003
Skillings-Connolly, Inc. P.O. Box 5080 Lacey, W A 98509
Attn: Patrick Skillings
Sample Matrix: Water EPA Method: 375.4 Units: mg!L Spectra Project: 2003030396 Applies to Spectra # 1
METHOD 375.4/SM4500E SULFATE QUALITY CONTROL RESULTS
Sample Date Result
4-2-03 2.55
Matrix Spike Results
Spike Spike % MSD Amount Result Rec. Result 20.00 24.15 108.00 23.63
Sample Duplicate Results Duplicate Sample #2003030069-2
Date 4-2-03
Date 4-2-03
Sample Result 2.70
Duplicate Result 3.15
Check Standard Results
Known Value 50.00
Measured Value
47.15
Method Blank Results
Date 4-2-03
Result <I
SPECTRA LABORATORIES, INC.
Stevei G. Hibbs, Labbratory Manager
MSD %Rec. 105.40
RPD 15
%Rec. 94
RPD 2
•
•
•

•---' SPECTRA Laboratories
•
•
2221 Ross Way • Tacoma. WA 98421 • (253) 272-4850 • Fax (253) 572-9838
April 24, 2003
Skillings-Connolly, Inc. P.O. Box 5080 Lacey, W A 98509
Sample Matrix: Water EPA Method: 4500Br Units: mg/L
Attn: Patrick Skillings Spectra Project: 2003030396 Applies to Spectra # 1
Date 4-3-03
STANDARD METHOD 4500 BR BROMIDE ANALYSIS QUALITY CONTROL RESULTS
Sample Result <0.1
Date 4-3-03
Initial Check Standard Results
Known Value 0.5
Measured Value
0.48 %Rec.
96.0
Matrix Spike/Matrix Spike Duplicate Results
Spike Spike % MSD Amount Result Rec. Result 0.5 0.586 117.2 0.566
Sample Duplicate Results Duplicate Sample #2003030069-13
Date 4-3-03
Sample Result <0.1
Duplicate Result <0.1
MSD %Rec. 113.2
RPD 0.0
SPEC~ORIES, INC.
' Steven G. Hibbs, Laboratory Manager
RPD 3

SPECTRA Laboratories 2221 Ross Way • Tacoma, WA 98421 • (253) 272-4850 • Fax (253) 572-9838
April 24, 2003
Skillings-Connolly, Inc. P.O. Box 5080 Lacey, W A 98509
Attn: Patrick Skillings
Sample Matrix: Water EPA Method: 415.1/9060 Units: mg/L Spectra Project: 2003030396 Applies to Spectra# 1
METHOD 415.1/9060 DISSOLVED ORGANIC CARBON ANALYSIS QUALITY CONTROL RESULTS
Date 3-10-03
Sample Result 6.091
Spike Amount
25
Matrix Spike Results
Spike Result
29.68
% Rec.
94.4
MSD Result 29
Sample Duplicate Results Duplicate Sample #2003030069-2
Date 3-10-03
Date 4-4-03
Sample Result 8.992
Duplicate Result 9.406
Check Standard Results
Known Value 50
Measured Value 51.26
Method Blank Results
Date 4-4-03
Result <5
SPECTRA LABORATORIES, INC.
SteverfG. Hibbs, Labor~ory Manager
MSD %Rec. 90.4
RPD 4.5
%Rec. 102.5
RPD 4
•
'.
•
•

·---' SPECTRA Laboratories
•
•
2221 Ross Way • Tacoma, WA 98421 • (253) 272-4850 • Fax (253) 572-9838
April 24, 2003
Skillings & Connolly, 1nc, P,O, Box 5080 Lacey, W A 98509
Sample Matrix: Water EPA Method: 624/8260 Sample Spiked: Method Blank Date Analyzed: 3-11-03 Units: ug/L Spectra Project: 2003030396 Applies to Spectra #I
GCMS VOLA TILE ORGANIC ANALYSIS QUALITY CONTROL RESULTS
Dup. Spike Spike Spike
Sample Amount Amount % Amount % Compound Result Added Found Recovery Found Recovery
1, 1-Dichloroethene <1 10.00 9.61 96 9.91 99
Trichloroethene <1 10.00 9.71 97 9.76 98
Benzene <1 10.00 9.91 99 10.04 100
Toluene <I 10.00 10.11 101 10.26 103
Chlorobenzene <1 10.00 9.78 98 9.69 97
SPECTRA LAB ORA TORIES, INC.
~ <
Steven G. Hibbs, Laboratory Manager
RPD
3

SPECTRA Laboratories 2221 Ross Way • Tacoma, WA 98421 • (253) 272-4850 • Fax (253) 572-9838
April 24, 2003
Skillings-Connolly, Inc. P.O. Box 5080 Lacey, W A 98509
· Attn: Patrick Skillings
Sample Matrix: Water EPA Method: SM 5210B/405.1 Units: mg/L Spectra Project: 2003030396 Applies to Spectra #1
SM 5210B/405.1 BOD ANALYSIS QUALITY CONTROL RESULTS
Glucose-Glutamic Acid Check Standard
Date 3-12-03
SPECTRA LABORATORIES, INC.
Known Value
198 198 198
Steven G. Hibbs, Labo?litory Manager
Measured Value
182 190 196
%Rec. 92 96 99
•
•
•

•
•
•
SPECTRA Laboratories 2221 Ross Way • Tacoma, WA 98421 • (253) 272-4850 • Fax (253) 572-9838
April 24, 2003
Skillings-Connolly, Inc. P.O. Box 5080 Lacey, WA 98509 Attn: Patrick Skillings
METHOD BLANK Sample Matrix: Water Applies to Spectra #2003030396
VOLATILE ORGANIC COMPOUNDS Compound CAS# ug!L
Bromodichloromethane 75-27-4 <I
Bromoform 75-25-2 <I
Chlorodibromomethane 124-48-1 <I
Chloroform 67-66-3 <I
CAS# = Chemical Abstract Services Regisny Number VOA Surrogate Percent Recoveries
Dibromofluoromethane l 07% Toluene-d8 l 0 l% 4-Bromofluorobenzene 104%
SPECTRA LABORATORIES, INC.
~ ~\
Steven G. Hibbs, Laboratory Manager
Date Analyzed: 4-2-03 Dilution: I <=less than
EPA METHOD 8260

SPECTRA Laboratories 2221 Ross Way • Tacoma, WA98421 • (253) 272-4850 • Fax (253) 572-9838
April 24, 2003
Skillings-Connolly, Inc. P.O. Box 5080 Lacey, W A 98509 ... : ·: ·. ·
METHOD BLANK Sample Matrix: Water Spectra Project: 2003030396 Applies to Spectra #I
SEMIVOLA TILE ORGANIC ANALYSIS Compound ug!L
N-Nitrosodimethylamine <10
Caffeine <I 0
SURROGATE RECOVERIES: Nitrobenzene-d5 2-Fiuorobiphenyl p-Terphenyl-dl4
SPECTRA LABORATORIES, INC.
Steven G. Hibbs, Laboratory Manager
79% 82% 77%
Date Extracted: 4-3-03 Date Analyzed: 4-4-03 Dilution: I <=less than
METHOD 625/8270
•
•
•

·---' SPECTRA Laboratories
•
•
2221 Ross Way • Tacoma, WA 98421 • (253) 272-4850 • Fax (253) 572-9838
July I 0, 2003
Skillings-Connolly, Inc. P.O. Box 5080 Lacey, W A 98509
Attn;J'A.tri.ck Skillings
· Sample Matrix: Water EPA Method: SM 5210B/405.1 Units: mg/L Spectra Project: 2003060069 Applies to Spectra#' s I - 15
SM 5210B/405.1 BOD ANALYSIS QUALITY CONTROL RESULTS
Glucose-Glutamic Acid Check Standard
Date 6-12-03
SPECTRA LABORATORJES, INC.
Known Value
198 198 198
Steven G. Hibbs, L'aboratory Manager
Measured Value
215 176 172.3
%Rec. 109 89 87

SPECTRA Laboratories 2221 Ross Way • Tacoma, WA98421 • (253) 272-4850 • Fax (253) 572-9838
July I 0, 2003
EPA Method: 60 I 0 Skillings-Connolly, Inc. P.O. Box 5080 Lacey, W A 98509
Spectra Project: 2003060069 Applies to Spectra #'s I - 15
Attn: Patrick Skillings METALS
QUALITY CONTROL RESULTS
Spiked Sample:2003060069-1 0 Units: mg/L
Sample Com11ound Result Arsenic ND Boron 0.525 Cadmium ND Chromium ND Mercury* ND Mercury •• ND Copper 0.031 Iron 0.454 Lead ND Manganese 0.201 Nickel ND Silver ND Zinc 0.030
Units: mg!L
Arsenic <0.005
Boron <0.01
Cadmium <0.003
Chromium <0.007
Copper <0.006
Spike Amount
1.000 1.000 1.000 1.000
0.0020 0.0020
1.000 1.000 1.000 1.000 1.000 1.000 1.000
MS/MSD
Spike %
Date Prepared: 6-16-03 Date Analyzed: 6-17-03
Dup. Dup.% Result Recovery Result Recoven:: 1.074 107.4 0.955 95.5 1.690 116.5 1.701 117.6 1.128 112.8 1.130 113.0 1.095 109.5 1.076 107.6
0.0021 107 0.0023 116 0.0019 96 0.0022 Ill
1.214 118.3 1.195 116.4 1.554 110.0 1.549 109.5 0.965 96.5 0.986 98.6 1.245 104.4 1.273 107.2 1.113 111.3 1.103 110.3 1.050 105.0 1.051 105.1 1.201 117.1 1.207 117.7
METHOD BLANK Date Prepared: 6-16-03 Date Analyzed: 6-17-03
Iron
Lead
Manganese
Nickel
Silver
Mercury <0.0005 Zinc
• Mercury spiked in to sample #2003050405-1, Applies to Spectra Sample #'s 2003060069 I - II.
• Mercury spiked in to sample #2003060122-1, Applies to Spectra Sample #'s 2003060069 12- 15.
SPECTRA LABORATORIES, INC.
" Steven G. Hibbs, Laboratory Manager
RPD 11.7 0.9 0.2 1.8 8.6
14.2 1.6 0.5 2.2 2.6 0.9 0.1 0.5
<0.015
<0.001
<0.002
<0.015
<0.007
<0.006
•
•
•

• _ __, SPECTRA Laboratories
•
•
2221 Ross Way • Tacoma, WA 98421 • (253) 272-4850 • Fax (253) 572-9838
July 10, 2003
Skillings-Connolly, Inc. P.O. Box 5080 Lacey, W A 98509
Attn: Patrick Skillings '
Sample Matrix: Water EPA Method: 375.4/SM4500E Units: mg!L Spectra Project: 2003060069 Applies to Spectra #'s 1 - 15
METHOD 375.4/SM4SOOE SULFATE QUALITY CONTROL RESULTS
Sample Date Result
6-26-03 21.00
Matrix Spike Results
Spike Spike % MSD Amount Result Rec. Result 20.00 42.41 107.06 42.41
Sample Duplicate Results Duplicate Sample #2003060069-8
Date 6-26-03
Date 6-26-03
Sample Duplicate Result Result 30.66 25.36
Check Standard Results
Known Measured Value Value 50.00 50.74
Method Blank Results
Date 6-26-03
Result <I
SPECTRA LAB ORA TORIES, INC .
Steven G. Hibbs, L'aboratory Manager
MSD %Rec. RPD 107.04 0.02
RPD 18.92
%Rec. 101.49

SPECTRA Laboratories 2221 Ross Way o Tacoma, WA 98421 o (253) 272-4850 • Fax (253) 572-9838
July I 0, 2003
Skillings-Connolly, Inc. P.O. Box 5080 Lacey, W A 98509 Attn: Patrick Skillings
METHOD BLANK Sample Matrix: Water Applies to Spectra #2003060069
VOLATILE ORGANIC COMPOUNDS Compound CAS# ug/L
Bromodichloromethane 75-27-4 <1
Bromoform 75-25-2 <I
Chlorodibromomethane 124-48-1 <I
Chloroform 67-66-3 <I
CAS#= Chemical Abstract Services Registry Number VOA Surrogate Percent Recoveries
Dibromofluoromethane 84% Toluene-d8 I 00% 4-Bromofluorobenzene I 01%
SPECTRA LAB ORA TORIES, INC.
Steven G. Hibbs, Laboratory Manager
Date Analyzed: 6-9-03 Dilution: 1 <=less than
EPA METHOD 8260
•
•
•

•
•
•
SPECTRA Laboratories 2221 Ross Way • Tacoma, WA98421 • (253) 272-4850 • Fax (253) 572-9838
July 10, 2003
Skillings & Connolly, Inc. P.O. Box 5080
:·,, .. Lacey, W A 98509
Sample Matrix: Water EPA Method: 624/8260 Sample Spiked: Method Blank Date Analyzed: 6-9-03 Units: ug/L Spectra Project: 2003060069 Applies to Spectra #'s l - 15
GCMS VOLA TILE ORGANIC ANALYSIS QUALITY CONTROL·RESUL TS
Dup. Spike Spike Spike
Sample Amount Amount % Amount % Compound Result Added Found Recovery Found Recovery
1,1-Dichloroethene <I 9.36 11.10 119 11.50 123
Trichloroethene <I 10.00 9.32 93 9.33 93
Benzene <I 10.00 9.45 95 9.55 96
Toluene <I 10.00 9.44 94 9.46 95
Chi oro benzene <I 10.00 9.39 94 9.27 93
SPECTRA LAB ORA TORIES, INC .
Steven G. Hibbs, Laboratory Manager
RPD
4
0
0
>'' ...... ' '.

SPECTRA Laboratories 2221 Ross Way • Tacoma, WA 98421 • (253) 272-4850 • Fax (253) 572-9838
July I 0, 2003
Skillings-Connolly, Inc. P.O. Box 5080 Lacey, W A 98509
Sample Matrix: Water EPA Method: 4500Br Units: mg!L
Attn: Patrick Skillings Spectra Project: 2003060069 Applies to Spectra #'s I- .15
Date 6-26-03
STANDARD METHOD 4500 BR BROMIDE ANALYSIS QUALITY CONTROL RESULTS
Sample Result ND
Date 6-26-03
Initial Check Standard Results
Known Value 0.5
Measured Value
0.433 %Rec.
86.6
Matrix Spike/Matrix Spike Duplicate Results
Spike Spike % MSD Amount Result Rec. Result 0.5
Date 6-26-03
0.426 85.2 0.485
Sample Duplicate Results Duplicate Sample #2003060069-8
Sample Result 0.139
Duplicate Result 0.159
Method Blank
Date 6-26-03
Result <0.1
MSD %Rec. 97.0
RPD 13
. SPECTRA LAB ORA TORIES, INC.
Steven G. Hibbs, Laboratory Manager
RPD 13
•
•
•

.---' SPECTRA Laboratories
•
•
2221 Ross Way • Tacoma, WA98421 • (253) 272-4850 • Fax (253) 572-9838
July 10, 2003
Skillings-Connolly, Inc. P.O. Box 5080 Lacey, W A 98509
Atm: Patrick Skillings
Sample Matrix: Water EPA Method: 415.1 Units: mg/L Spectra Project: 2003060069 Applies to Spectra#' s 1 - 15
METHOD 415.1/IR DISSOLVED ORGANIC CARBON ANALYSIS QUALITY CONTROL RESULTS
Sample Date Result
7-2-03 1.4
Spike Amount
25
Matrix Spike Results
Spike Result
22.4
% Rec. 84.0
MSD Result 22
Sample Duplicate Results Duplicate Sample #2003060069-2
Date 7-2-03
Date 7-2-03
Sample Result 4.080
Duplicate Result 5.630
Check Standard Results
Known Value 100
Measured Value 87.65
Method Blank Results
Date 7-2-03
Result <5
SPECTRA LABORATORIES, INC .
Steven G. Hibbs, Laboratory Manager
MSD %Rec. 83.6
RPD 31.9
%Rec. 87.7
RPD 0

SPECTRA Laboratories 2221 Ross Way • Tacoma. WA 98421 • (253) 272-4850 • Fax (253) 572-9838
July I 0, 2003
Skillings-Connolly, Inc. P.O. Box 5080 Lacey, W A 98509
METHOD BLANK Sample Matrix: Water Spectra Project: 2003060069 Applies to Spectra #'s 1- 15
SEMIVOLATILE ORGANIC ANALYSIS Compound ug/L
N-Nitrosodimethylamine <10
Caffeine <10
SURROGATE RECOVERIES: Nitrobenzene-d5 2-Fluorobiphenyl p-Terphenyl-dl4
SPECTRA LABORATORIES, INC.
. \: Steven G. H1bbs, Laboratory Manager
59% 66% 62%
Date Extracted: 6-9-03 Date Analyzed: 6-13-03 Dilution: 1 <=less than
METHOD 625/8270
•
•
•

.__., SPECTRA Laboratories
•
•
2221 Ross Way • Tacoma, WA98421 • (253) 272-4850 • Fax (253) 572-9838
July I 0, 2003
Skillings & Connolly, Inc. P.O. Box 5080 Lacey, W A 98509
Attn: Patrick Skillings
Sample Matrix: Water Sample Spiked: Method Blank Date Extracted: 6-24-03 Date Analyzed: 6-25-03 Units: ug!L Spectra Project: 2003060069 Applies to Spectra #'s 1- 15
SOIL SEMIVOLA TILE MATRIX SPIKE QUALITY CONTROL
Sample Spike MS MS% MSD MSD Result Added Cone. Rec. Cone. Rec.
Phenol 75 <10 49 65 41 54 2-Chlorophenol 75 <10 41 55 40 54 1 ,4-Dichlorobenzene 50 <10 25 49 27 54 N-Nitroso-Di-n-Propylamine 50 <10 42 84 45 90 1 ,2,4-Trichlorobenzene 50 <10 26 51 33 66 4-Chloro-3-Methylphenol 75 <10 50 67 72 96 Acenaphthene 50 <10 39 77 43 85 4-Nitrophenol 75 <50 45 59 48 63 2,4-Dinitrotoluene 50 <10 41 82 47 95 Pentachlorophenol 75 <50 49 66 58 77 Pyrene 50 <10 43 87 46 91
SPECTRA LABORATORIES, INC.
Steven G. Hibbs, Laboratory Manager
RPD
18 1 9 6
25 36 9 7 15 16 5
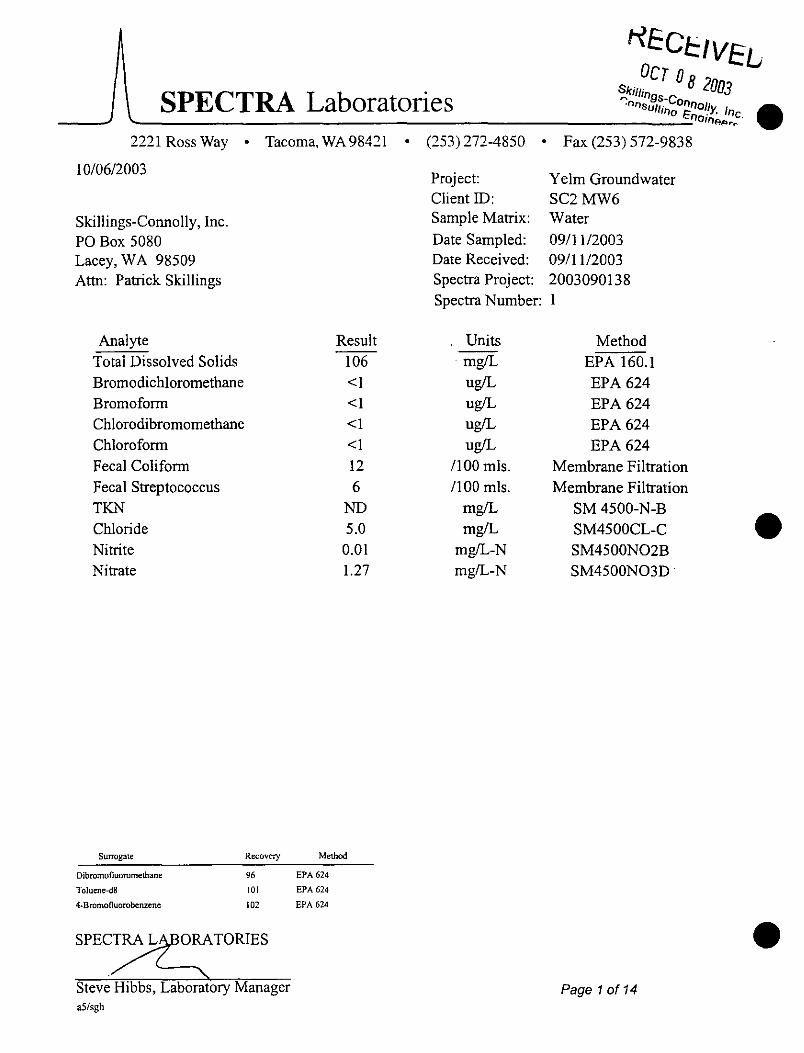
HECf:::IVEL ocr o
Skillin 8 2003 ..___S_P_E_C_T_RA ___ L_a_b_o_r_a_t_o_r_i_e_s ________ ~_.n"_•_J,~-i~c-oo.:::E~~?K~~~; •
2221 Ross Way • Tacoma, WA 98421 • (253) 272-4850 • Fax (253) 572-9838
10/06/2003
Skillings-Connolly, Inc. PO Box 5080 Lacey, W A 98509 Attn: Patrick Skillings
Analyte
Total Dissolved Solids Bromodichloromethane Bromoform Chlorodibromomethane Chloroform Fecal Coliform Fecal Streptococcus TKN Chloride Nitrite Nitrate
Result 106 <I <I <1 <1 12 6
ND 5.0 0.01 1.27
Surrogate Recovery Method
Dibromofluoromethane 96 EPA 624
Toluene-dB 101 EPA 624
4-Bromofluorobenzene 102 EPA 624
SPEC~ORATORIES
. "\. Steve Hibbs, Laboratory Manager a5/sgh
Project: Y elm Groundwater Client ID: SC2MW6 Sample Matrix: Water
Date Sampled: 09/1112003 Date Received: 09/1112003 Spectra Project: 2003090138 Spectra Number: I
Units Method mg!L EPA 160.1 ug!L EPA624 ug!L EPA 624 ug!L EPA624 ug!L EPA624
1100 mls. Membrane Filtration /100 mls. Membrane Filtration
mg!L SM 4500-N-B mg!L SM4500CL-C
mg/L-N SM4500N02B mg!L-N SM4500N03D ·
Page 1 of 14
•
•

.____., SPECTRA Laboratories 2221 Ross Way • Tacoma, WA 98421 • (253) 272-4850 • Fax (253) 572-9838
•
•
October 7, 2003
Skillings & Connolly, Inc. P.O. Box 5080 Lacey, W A 98509
Sample Matrix: Water EPA Method: 624/8260
·· , Sample Spiked: Method Blank Date Analyzed: 1 0-1-03 Units: ug!L Spectra Project: 2003090138 Applies to Spectra #'s 1- 14
GCMS VOLATILE ORGANIC ANALYSIS QUALITY CONTROL RESULTS
Dup. Spike Spike Spike
Sample Amount Amount % Amount % Compound Result Added Found Recoverv Found Recovery
1, 1-Dichloroethene <1 9.36 10.73 115 10.44 112
Trichloroethene <1 10.00 9.50 95 9.21 92
Benzene <I 10.00 10.18 102 9.89 99
Toluene <1 10.00 9.64 96 9.35 94
Chlorobenzene <I 10.00 9.63 96 9.36 94
SPECTRA LABORATORIES, INC.
~ Steve"n G. Hibbs, Laboratory Manager
RPD
3
3
3
3
3

SPECTRA Laboratories 2221 Ross Way • Tacoma, WA 98421 • (253) 272-4850 • Fax (253) 572-9838
October 7, 2003
Skillings-Connolly, Inc. P.O. Box 5080 Lacey, W A 98509 Attn: Patrick Skillings
METHOD BLANK Sample Matrix: Water Spectra Project: 2003090138 Applies to Spectra #'s I- 14
VOLATILE ORGANIC COMPOUNDS Compound CAS# ug/L
Bromodichlorometbane 75-27-4 <I
Bromoform 75-25-2 <I
Chlorodibromomethane 124-48-1 <I
Chloroform 67-66-3 <I
CAS# = Chemical Abstract Services Registry Number VOA Surrogate Percent Recoveries
Dibromofluoromethane 93% Toluene-d8 99% 4-Bromofluorobenzene 105%
SPECTRA LABORATORIES, INC.
7 ........ Steven G. Hibbs, Laboratory Manager
Date Analyzed: 10-2-03 Dilution: I <=less than
EPA METHOD 8260
•
•
•

•
•
SPECTRA Laboratories ---'
2221 Ross Way • Tacoma, WA 98421 • (253) 272-4850 • Fax (253) 572-9838
December 2, 2003
Skillings-Connolly, Inc. P.O. Box 5080 Lacey, W A 98509
Attn: Patrick Skillings
Sample Matrix: Water EPA Method: 415.1/9060 Units: mg/L Spectra Project: 2003100258 Applies to Spectra #' s I - 10
METHOD 415.119060 DISSOLVED ORGANIC CARBON ANALYSIS QUALITY CONTROL RESULTS
Matrix Spike/Matrix Spike Duplicate Results
Sample Date Result
11-13-03 4.5
Spike Spike % MSD Amount Result Rec. Result
25 23.6 76.4 25 Sample Duplicate Results
Duplicate Sample #20031 0025 8-6
Date 11-13-03
Date 11-13-03
Sample Result
12.2
Duplicate Result 13.4
Check Standard Results
Known Value
100
Measured Value 106.4
Method Blank Results
Date 11-13-03
Result <5
SPECTRA LABORATORIES, INC .
MSD %Rec. 81.6
RPD 9.4
%Rec. 106.4
RPD 7
• ~ Steven G. Hibbs, Lab~ratory Manager

SPECTRA Laboratories 2221 Ross Way • Tacoma, WA98421 • (253) 272-4850 • Fax (253) 572-9838
December 2, 2003
Skillings-Connolly, Inc, P.O. Box 5080 Lacey, W A 98509
Sample Matrix: Water EPA Method: 4500Br Units: mg!L
Attn: Patrick Skillings Spectra Project: 2003100258 Applies to Spectra #'s I - 10
Date 11-10-03
STANDARD METHOD 4500 BR BROMIDE ANALYSIS QUALITY CONTROL RESULTS
Sample Result 0.048
Date 11-10-03
Initial Check Standard Results
Known Value 0.5
Measured Value
0.397 %Rec.
79.4
Matrix Spike/Matrix Spike Duplicate Results
Spike Spike % MSD Amount Result Rec. Result 0.5
Date 11-10-03
0.451 80.6 0.444
Sample Duplicate Results Duplicate Sample #20031 0258-6
Sample Result 0.025
Duplicate Result 0.022
Method Blank Results
Date 11-10-03
Result <0.1
MSD %Rec. 79.2
RPD 13
SPECTRA LAB ORA TORIES, INC.
Steven G. Hibbs, tiboratory Manager
RPD 2
•
•
•

• _ __, SPECTRA Laboratories
•
•
2221 Ross Way • Tacoma, WA 98421 • (253) 272-4850 • Fax (253) 572-9838 December 2, 2003
Skillings-Connolly, Inc. P.O. Box 5080 Lacey, W A 98509 Attn: Patrick Skillings
METHOD BLANK Sample Matrix: Water Applies to Spectra #20031 00258
VOLATILE ORGANIC COMPOUNDS Compound CAS# ug/L
Bromodichloromethane 75-27-4 <1
Bromoform 75-25-2 <1
Chlorodibromomethane 124-48-1 <1
Chloroform 67-66-3 <1
CAS# = Chemical Abstract Services Registry Number VOA Surrogate Percent Recoveries
Dibromofluoromethane 87% Toluene-d8 106% 4-Bromofluorobenzene I 0 I%
SPECTRA LABORATORIES, INC.
Steven G. Hibbs, La~ory Manager
Date Analyzed: 11-10-03 Dilution: 1 <=less than
EPA METHOD 8260

SPECTRA Laboratories 2221 Ross Way • Tacoma, WA 98421 • (253) 272-4850 • Fax (253) 572-9838
December 2, 2003
Skillings & Connolly, Inc. P.O. Box 5080 Lacey, WA 98509
Sample Matrix: Water EPA Method: 624/8260
• · · · ·. '· ' ,.Sample Spiked: Method Blank Date Analyzed: 11-10-03 Units: ug/L Spectra Project: 2003100258 Applies to Spectra #'s 1 - 10
GCMS VOLATILE ORGANIC ANALYSIS QUALITY CONTROL RESULTS
Dup. Spike Spike Spike
Sample Amount Amount % Amount % Compound Result Added Found Recovery Found Recovery
I, 1-Dichloroethene <I 9.36 10.04 107 9.90 106
Trich!oroethene <I 10.00 8.60 86 8.19 82
Benzene <I 10.00 8.77 88 8.53 85
Toluene <I 10.00 8.86 89 8.85 89
Chi oro benzene <I 10.00 8.75 88 8.49 85
SPECTRA LABORATORIES, INC .
. ~ Steven G. Hibbs, Labo~atory Manager
RPD
5
3
0
3
•
•
•

·---' SPJEC'JI'RA Laboratories 2221 Ross Way • Tacoma, WA 98421 • (253) 272-4850 • Fax (253) 572-9838
December 2, 2003
Skillings & Connolly, Inc. P.O. Box 5080 Lacey,WA98509 ··.;·:~.;.• ... ·: '·
Ann: Patrick Skillings
Sample Matrix: Water Sample Spiked: Method Blank Date Extracted: I 0-1-03 Date Analyzed: 10-2-03 Units: ug/L Spectra Project: 2003100258 Applies to Spectra #' s 1 - 1 0
SOIL SEMIVOLA TILE MATRIX SPIKE QUALITY CONTROL
Sample Spike MS MS% MSD MSD
• Result Added Cone. Rec. Cone. Rec. RPD
Phenol 75 <10 52 69 58 77 11 2-Chlorophenol 75 <10 62 82 67 90 9 1 ,4-Dichlorobenzene 50 <10 33 65 35 70 7 N-Nitroso-Di-n-Propylamine 50 <10 45 91 48 97 6 1 ,2,4· T richlorobenzene 50 <10 38 75 40 79 6 4-Chloro-3-Methylphenol 75 <10 60 80 66 87 9 Acenaphthene 50 <10 42 84 46 92 9 4-Nitrophenol 75 <50 40 54 40 54 0 2,4-Dinitrotoluene 50 <10 41 82 45 89 8 Pentachlorophenol 75 <50 13 17 17 23 28 Pyrene 50 <10 42 84 45 91 8
SPECTRA LABORATORIES, INC .
.... • Steven G. Hibbs, Laboratory Manager

SPECTRA Laboratories 2221 Ross Way • Tacoma, WA 98421 • (253) 272-4850 • Fax (253) 572-9838
December 3, 2003
Skillings-Connolly, Inc. P.O. Box 5080 Lacey, W A 98509
Attn: Patrick Skillings
Sample Matrix: Water EPA Method: 375.4/SM4500E Units: mg/L Spectra Project: 2003100258
· Applies to Spectra #'s 1 - 10
METHOD 375.4/SM4500E SULFATE QUALITY CONTROL RESULTS
Sample Date Result
11-25-03 0.94
Matrix Spike Results
Spike Spike % MSD Amount Result Rec. Result 20.00 21.11 100.85 20.78
Sample Duplicate Results Duplicate Sample #20031 00258-8
Date 11-25-03
Date 11-25-03
Sample Result 18.21
Duplicate Result
19.12 Check Standard Results
Known Value 50.00
Measured Value
51.25 Method Blank Results
Date 11-25-03
Result <I
SPECTRA LABORATORIES, INC.
Steven G. Hibbs, L';;boratory Manager
MSD %Rec. 99.17
RPD 4.84
%Rec. 102.50
RPD 1.68
•
•
•

• _ _., SPECTRA Laboratories
•
2221 Ross Way • Tacoma. WA 98421 • (253) 272-4850 • Fax (253) 572-9838
December 3, 2003
Skillings-Connolly, lnc. P.O. Box 5080 Lacey, W A 98509
Attn: Patrick Skillings METALS
EPA Method: 6010 Spectra Project: 2003100258 Applies to Spectra #'s 1 - 1 0
QUALITY CONTROL RESULTS
Spiked Sample:20031 00258-8 Units: mg!L
Sample ComQound Result Arsenic ND Boron 0.393 Cadmium ND Chromium ND Mercury* ND Copper 0.009 Iron 0.155 Lead ND Manganese 0.173 Nickel ND Silver ND Zinc ND
Units: mg/L
Arsenic <0.005
Boron <0.01
Cadmium <0.003
Chromium <0.007
Copper <0.006
Mercury <0.0005
Spike Amount
1.000 1.000 1.000 1.000
0.0200 1.000 1.000 1.000 1.000 1.000 1.000 1.000
MSIMSD
Spike %
Date Prepared: 11-3-03 Date Analyzed: 11-3-03
Dup. Dup.% Result Recovery Result Recovea 1.194 119.4 1.106 110.6 1.372 97.9 1.328 93.5 0.988 98.8 0.984 98.4 0.987 98.7 0.997 99.7
0.0194 97 0.0209 104 1.066 105.7 1.061 105.2 1.248 109.3 1.205 105.0 0.968 96.8 0.836 83.6 1.276 110.3 1.287 111.4 0.971 97.1 0.986 98.6 0.939 93.9 0.903 90.3 1.033 103.3 1.008 100.8
METHOD BLAA'K
Date Prepared: 12-3-03 Date Analyzed: 12-3-03
Iron
Lead
Manganese
Nickel
Silver
Zinc
* Mercury spiked in to sample #20031 00224-3
RPD 7.7 4.6 0.4 1.0 7.2 0.5 4.0
14.6 1.0 1.5 3.9 2.4
<0.015
<0.001
<0.002
<0.015
<0.007
<0.006
• SPECTRA LABORATORiES, INC.
Steven G. Hibbs, Laboratory Manager

SPECTRA Laboratories 2221 Ross Way • Tacoma, WA 98421 • (253) 272-4850 • Fax (253) 572-9838
December 3, 2003
Skillings-Connolly, Inc. P.O. Box 5080 Lacey, WA 98509
Attn: Patrick Skillings
Sample Matrix: Water EPA Method: SM 5210B/405.1 Units: mg/L Spectra Project: 2003100258 Applies to Spectra #'s 1- 10
SM 5210B/405.1 BOD ANALYSIS QUALITY CONTROL RESULTS
Glucose-Glutamic Acid Check Standard
Date 10-29-03
SPECTRA LAB ORA TORIES, INC.
Known Value 198 198 198
Steverfb. Hibbs, Labo;i'iOry Manager
Measured Value 214 209.5 202
%Rec. 108 106 102
•
•
•

• _ ___, SPECTRA Laboratories 2221 Ross Way • Tacoma, WA 98421 • (253) 272-4850 • Fax (253) 572-9838
•
•
December 3, 2003
Skillings-Connolly, Inc. P.O. Box 5080 Lacey,WA98509 •
. " '.
METHOD BLANK Sample Matrix: Water Spectra Project: 2003100258 Applies to Spectra #'s I - 10
SEMIVOLATILE ORGANIC ANALYSIS Compound ug!L
N-Nitrosodimethylarnine <10
Caffeine <10
SURROGATE RECOVERlES: Nitrobenzene-dS 2-Fluorobiphenyl p-Terphenyl-dl4
SPECTRA LABORATORIES, INC.
~ Steven G. Hibbs, Laboratory Manager
53% 51% 77%
Date Extracted: 10-23-03 Date Analyzed: 11-4-03 Dilution: 1 <=less than
METHOD 625/8270

SPECTRA Laboratories 2221 Ross Way • Tacoma, WA 98421 • (253) 272-4850 • Fax (253) 572-9838
December 3, 2003
Skillings-Connolly, Inc. P.O. Box 5080 Lacey, WA 98509 ,
·:: •'
METHOD BLANK Sample Matrix: Water Spectra Project: 2003100258 Applies to Spectra #'s 1 - 10
SEMIVOLATILE ORGANIC ANALYSIS Compound ug!L
N-Nitrosodimethylamine <10
Caffeine <1 0
SURROGATE RECOVERIES: Nitrobenzene-d5 2-Fluorobiphenyl p·Terphenyl-dl4
SPECTRA LAB ORA TORIES, INC.
~ Steven G. Hibbs, Laboratory Manager
88% 69% 88%
Date Extracted: 10-27-03 Date Analyzed: 11-4-03 Dilution: 1 <=less than
METHOD 625/8270
•
'. ~- .
•
•

·---- SPECTRA Laboratories
•
•
2221 Ross Way • Tacoma, WA 98421 • (253) 272-4850 • Fax (253) 572-9838
March 17, 2004
Skillings-Connolly, Inc. P.O. Box 5080 Lacey, WA 98509
Attn: Patrick Skillings METALS
EPA Method: 601 0 Spectra Project: 200312012 7 Applies to Spectra #'s 1 - 12
QUALITY CONTROL RESULTS
Spiked Sample: 2003120127-2 Units: mg!L
Com2ound Arsenic Boron Cadmium Chromium Mercury • Copper Iron Lead Manganese Nickel Silver Zinc
Units: mg!L
Arsenic
Boron
Cadmium
Chromium
Copper
Mercury
Sample Result
ND ND ND ND ND
0.009 0.155
ND 0.173
ND ND ND
<0.005
<0.03
<0.003
<0.007
<0.006
<0.0005
Spike Amount
1.000 1.000 1.000 1.000
0.0020 1.000 1.00
1.000 1.000 1.000 1.000 1.000
*Mercury spiked in to sample #120172-1
SPECTRA LAB ORA TORIES, INC.
Steven G. Hibbs, Laboratory Manager
MS/MSD Date Prepared: 12-18-03 Date Analyzed: 12-18-03
Spike % Dup. . Dup.% Result Recovea Result Recoven:: 1.083 108.3 0.929 92.9 0.988 98.8 0.987 98.7
0.0021 103 1.066 105.7 1.248 109.3 1.154 115.4 1.273 110.3 0.971 97.1 0.939 93.9 1.033 103.3
METHOD BLANK
1.042 104.2 0.929 92.9 0.984 98.4 0.997 99.7
0.0021 106 1.061 105.2 1.205 105.0 1.160 116.0 1.287 111.4 0.986 98.6 0.903 90.3 1.008 100.8
Date Prepared: 12-18-03 Date Analyzed: 12-18-03
Iron
Lead
Manganese
Nickel
Silver
Zinc
RPD 3.9
0 0.4 1.0 3.4 0.5 4.0 0.5 1.0 1.5 3.9 2.4
<0.015
<0.001
<0.002
<0.015
<0.007
<0.006

SPECTRA Laboratories 2221 Ross Way • Tacoma, WA 98421 • (253) 272-4850 • Fax (253) 572-9838
March 17, 2004
Skillings-Connolly, Inc. P.O. Box 5080 Lacey, W A 98509
Attn: Patrick Skillings
Sample Matrix: Water EPA Method: 375.4/SM4500E Units: mg/L Spectra Project: 2003120127 Applies to Spectra #'s 1 - 12
METHOD 375.4/SM4500E SULFATE QUALITY CONTROL RESULTS
Sample Date Result
1-5-04 32.80
Matrix Spike Results
Spike Spike % MSD Amount Result Rec. Result 20.0 49.66 84.27 51.76
Sample Duplicate Results Duplicate Sample #2003120127-12
Date 1-5-04
Date 1-5-04
Sample Result 26.70
Duplicate Result 26.34
Check Standard Results
Known Value 405.00
Measured Value
401.09 Method Blank Results
Date 1-5-04
Result <I
SPECTRA LAB ORA TORIES, INC.
Steven G. Hibbs, Labbratory Manager
MSD %Rec. 94.79
RPD 1.36
%Rec. 99.03
RPD 11.76
•
•
•

•
•
•
SPECTRA Laboratories __ ../ 2221 Ross Way • Tacoma, WA 98421 • (253) 272-4850 • Fax (253) 572-9838
March 17, 2004
Skillings-Connolly, Inc. P.O. Box 5080 Lacey, W A 98509 Attn: Patrick Skillings
METHOD BLANK Sample Matrix: Water Applies to Spectra #2003120127
I - 12
VOLATILE ORGANIC COMPOUNDS Compound CAS# ug/L
Bromodichloromethane 75-27-4 <I
Bromoform 75-25-2 <I
Chlorodibromomethane 124-48-1 <1
Chloroform 67-66-3 <1
CAS#= Chemical Abstract Services Registry Number VOA Surrogate Percent Recoveries
Dibromofluoromethane 87% Toluene-d8 99% 4-Bromofluorobenzene 99%
SPECTRA LABORATORIES, INC.
Steven G. Hibbs, Lab;;"?;ltory Manager
Date Analyzed: 12-26-03 Dilution: I <=less than
EPA METHOD 8260

SPECTRA Laboratories 2221 Ross Way • Tacoma, WA98421 • (253) 272-4850 • Fax (253) 572-9838
March 17, 2004
Skillings & Connolly, Inc, P,O, Box 5080 Lacey, WA 98509
Sample Matrix: Water EPA Method: 624/8260 Sample Spiked: Method Blank Date Analyzed: 12-8-03 Units: ug!L Spectra Project: 2003 i20127 Applies to Spectra #'s 1 - 12
GCMS VOLATILE ORGANIC ANALYSIS QUALITY CONTROL RESULTS
Dup, Spike Spike Spike
Sample Amount Amount % Amount % Compound Result Added Found Recovery Found Recovery
1, 1-Dichloroethene <I 10.00 10.26 103 11.14 Ill
Trichloroethene <1 10.00 9.21 92 10.19 102
Benzene <I 10.00 9.61 96 10.48 105
Toluene <1 10.00 9.57 96 10.50 105
Chlorobenzene <I 10.00 9.34 93 10.19 102
SPECTRA LABORATORIES, INC.
Steven G. Hibbs, Laboratory Manager
RPD
8
10
9
9
9
•
•
•

• _ __, SPECTRA Laboratories
•
•
2221 Ross Way • Tacoma, WA98421 • (253) 272-4850 • Fax (253) 572-9838
March 17,2004
Skillings-Connolly, Inc. P.O. Box 5080 Lacey, W A 98509
Sample Matrix: Water EPA Method: 4500Br Units: mg!L
Attn: Patrick Skillings Spectra Project: 2003120127 Applies to Spectra #'s 1 - 12
STANDARD METHOD 4500 BR BROMIDE ANALYSIS QUALITY CONTROL RESULTS
Date 1-6-04
Initial Check Standard Results
Known Value 0.5
Measured Value
0.55 %Rec.
II 0.0
Matrix Spike/Matrix Spike Duplicate Results
Sample Spike Spike % MSD Date Result Amount Result Rec. Result
1-6-04 0.167 0.5 0.713 109.2 0.682
Sample Duplicate Results Duplicate Sample #2003120127-3
Date 1-6-04
SPECTRA LABORATORIES, INC.
~
Sample Result 0.117
Steven G. Hibbs, Laboratory Manager
Duplicate Result 0.115
MSD %Rec. 103.0
RPD 2
RPD 6

SPECTRA Laboratories 2221 Ross Way • Tacoma, WA 98421 • (253) 272-4850 • Fax (253) 572-9838
March 17, 2004
Skillings-Connolly, lnc. P.O. Box 5080 Lacey, W A 98509
. Attn: Patrick Skillings
Sample Matrix: Water EPA Method: 415.119060 Units: mg/L Spectra Project: 2003120127 Applies to Spectra Ws L- 12
METHOD 415.119060 DISSOLVED ORGANIC CARBON ANALYSIS QUALITY CONTROL RESULTS
Matrix Spike Results
Sample Spike Spike % MSD Date Result Amount Result Rec. Result
12-18-03 4.945 25 30.69 103.0 30.80 Sample Duplicate Results
Duplicate Sample #2003120127-10
Date 12-18-03
Sample Result 2.55
Duplicate Result 2.05
Check Standard Results
Date 12-18-03
Known Value 100
Measured Value 101.9
Method Blank Results
SPECTRA LAB ORA TORIES, INC.
Date 12-18-03
Steven G. Hibbs, La1i'iihltory Manager
Result <5
MSD %Rec. 103.4
RPD 21.6
%Rec. 101.9
RPD 0
•
•
•

• _ __, SPECTRA Laboratories 2221 Ross Way • Tacoma. WA 98421 • (253) 272-4850 • Fax (253) 572-9838
•
•
March 18, 2004
Skillings-Connolly, Inc. P.O. Box 5080 Lacey, WA 98509
METHOD BLANK Sample Matrix: Water Spectra. Project: 2003120127 Applies to Spectra #'s 1 - 12
SEMIVOLA TILE ORGANIC ANALYSIS Compound ug!L
N-Nitrosodimethylamine <10.0
Caffeine <1 0.0
SURROGATE RECOVERIES: Nitrobenzene-d5 2-Fluorobiphenyl p-Terphenyl-dl4
SPECTRA LABORATORIES, INC.
Steven G. Hibbs, Laboraalry Manager
50% 56% 82%
Date Extracted: 12-22-03 Date Analyzed: 1-17-04 Dilution: 1 <=less than
METHOD 625/8270

SPECTRA Laboratories 2221 Ross Way • Tacoma, WA98421 • (253) 272-4850 • Fax (253) 572-9838
March 18, 2004
Skillings & Connolly, Inc. P.O. Box 5080 Lacey, W A 98509
Attn: Patrick Skillings
Sample Matrix: Water Sample Spiked: Method Blank Date Extracted: 1-20-04 Date Analyzed: 1-21-04 Units: ug!L Spectra Project: 2003120127 Applies to Spectra #'s 1 - 12
SOIL SEMlVOLATILE MATRIX SPIKE OUALITY CONTROL
Sample Spike MS MS% MSD MSD Result Added Cone. Ree. Cone. Ree. RPD
Phenol 75 <10 38 51 43 57 II 2-Chlorophenol 75 <10 37 50 43 57 14 1 ,4-Diehlorobenzene 50 <10 20 40 24 47 15 N-Nitroso-Di-n-Propylamine 50 <10 23 45 24 48 6 1 ,2,4-Triehlorobenzene 50 <10 25 51 30 61 18 4-Chloro-3-Methylphenol 75 <10 45 61 50 66 9 Acenaphthene 50 <10 29 58 33 65 12 4-Nitrophenol 75 <50 59 79 66 88 II 2,4-Dinitrotoluene 50 <10 30 59 37 74 22 Pentachlorophenol 75 <50 47 63 63 84 28 Pyrene 50 <10 36 72 41 82 13
• Out oflimits
SPECTRA LABORATORIES, INC.
/G Steven G. Hibbs, Labdtatory Manager
•
•
•

•
•
•
SPECTRA Laboratories 2221 Ross Way • Tacoma, WA 98421 • (253) 272-4850 • Fax (253) 572-9838
March 18,2004
Skillings-Connolly, Inc. P.O. Box 5080 Lacey, W A 98509
Attn: Patrick Skillings
Sample Matrix: Water EPA Method: SM 52IOB/405.1 Units: mg/L Spectra Project: 2003120127 Applies to Spectra #'s I - 12
SM 5210B/405.1 BOD ANALYSIS QUALITY CONTROL RESULTS
Glucose-Glutamic Acid Check Standard
Date 12-17-03
SPECTRA LABORATORIES, INC.
Known Value 198 198 198
Steven G. Hibbs, L~ratory Manager
Measured Value
195 178 166
%Rec. 98 90 84

•
•
•

•
•
•
XELM WELL NO. I
\
Soil
0 !)
I) "' __{}_ o 0 ~ Boulders & Clay, Gray __Q () 0
II o
p ·o · i>·.o·. . . ••• _., .. b·, __ , .• . • b' -• Cl • • . •• • • • • . - •/o ..
• t;j_ ·.0 ... ...
... o. · .. · .. .. o·· . . . . ~ ·o . ... . • • • • 1)\ • • •••• . : 0 ... 0° .
. . . 0 ~ .....
. " .. . .· .. ·---: ""' · ...... .,·,o:· Water
Level
. . 0 ·. C> ·--• . . · 0 Hardpan, Gray -·-. ·-· ...
~·
- .--; 0 · .. ·· ~6 _,. 6 ... " ... . "'-===-1 . : ."'.-. o~· . .,.'
... ~ .. ··· .. ····~ .. o· ... ~-· o ...... • ':" ... -~·0
· :·o.o · · · .· . . .. /.·· .. · ~ ···;,· •. 0 ·.o' . · .. ~= . . . o· . : ,,...--""' • • •
• ... "' 4
0--o-6 D ~ ~Gravel & Clay, Yellow
6 · o· o· ·o· ·o , . . , . 0 () ·o· o'.o 0 . .. .. .. .
SCREEN DETAILS
TYPE: Wirewound Armco Iron SLOT: 0.06 Inch between Wires 0. D. 11\"; I. D. 10 9/8"
CASING: 12" I .D. ~. STATIC WATER LEVELS FROM GROUND
9-14-50 25.5'; 10-18-50 27.2 DRAWDOWN 0.16 ft. 10-18-50 at 550
Hardpan, Yellow
PLATE NO.ll!: l I II- 4 G.P.M.

Log . ·.o • l>o II .
• • 0 ' .~o . 0 • C) • ~ --o o'-• 0 .. - -• • ...
0 0 - 0 -;-· !)
- • -t • 0 - ' . - • 0
• 0 .......!! ·-• 0
- c . ..-- -: I.
. 0
-06-\ 0 -l> •
• l -_,_6 •..---. ., • . ~ •
0 . () • ~ b . • • II -• .,. ' ' . . . 0 0 . . . .. 0 " ..
0 • 0 ~ . .. . t>
lJ 0 • (J . .
• " c . . t1
0 'o . . 0 () v . . . .() . . 0
• . . · . •0 cl . ll
... . '· . . ()
. o • . 0 . 0 •• • .
.. 0 •• . ,. . 0
•
• PLATE NO. III-2
YELM WELL NO. 2
o' Gravel & Sand '\
4
Gravel & Clay
10 27 Ft. to Well
Hardpan, Blue
23
Clay, Sand & Gravel
30
Sand & Gravel, Blue
36 Hardpan
38
Sand & Gravel (Loose from 53 feet)
53
6l Hardpan 62
III-5
Construction Details
No. 1
Shoe
. A • b
0 ~ ' /J. • b.
12-Inch I. D. Casing
Lead Packer
.2. a...___
/J ' 6 Cement • Seal t>
~ I> '
151:
l ""~~~~' 52 ~ 12-inch
nominal wirewound screen-
[~~~~ overall length 10.65 ft.
61
Screen-Johnson Armco Iron 80-slot-(.080 inch between wires) O.D. lllt" I.D. 10 3/8"

RESOURCE PROTEC'IION WELL REPORT
• .rNITCNIDNO. R00645
~= Thurston LOCI.~'- NW '- ... 30 ._ 17NR_E: ll'lllliT ACO'IIiiSOP WilL: M i 11 · Road
0' T \;'1'-~ ....... !;:!!;!!:r-,-.....,;;.,-t---:-_..!~~~---+--_!I'O~_,.~IM~!f'~:n!!:ION~DI&CIW~!!!I~IOII!!.._ __ T 0' I I I I I il I
f'-t . LJ~.V I
5' ~ II 11
t1FitD I I
. I
10'~ I I I
~. : hT 111' -. o.• I \CJ-...,
I
lD'~ I I I I
2.~~ I I I
jo'~ I I I I
~·..L ,:)Q IIOAL&:I"·-----
• BCY-IJ(IIoll,lf_,
••
&tt,..i6'-- l
tc\,~ l• <:, 1
6oulrte.t.~.
~~ ....... ,.., C.o CJQ.e, E.
G!lAtJ~C...,
WA-ii.A..
· ... ~.::
I T
I T
I "T'
I
I I
l.

RESOURCE PROTECTION WELL REPORT
•
o·, I I I
3'-t s' ~
I I I
. I
I ' I 0-r
I I
e: I
,~. \'-' -. o.• I \o-,
I
2.D'~ I I I I
l~~ I I I
jo'~
I
~~t··----• 11:'1'-11~ .• ..,
ITMTtARDHO. R00645
OOIIfJY: Thurston LOOAnat,.!!!!lt NW It ... 30 1'Mo 17NR~ mtllil' MIDRiin OF WiLl.: Mi 11 · R o a d
:'b~.v
U~~eo &,,..~ac.-1
~\,~l·~J'
1:>otJlrtf«-~ :-··= .. ~ :£! ,_ f' • 2
s. -· -· - .. - ..
~6v.)N
PMII ___:._OF....;__
C.cHHl. e, E. ~ ~"' <:)1
Gil~~ c.., W~'Ti..A..
~ N 0\
:t> \0
u .. -
T I I I I I
T I I. I
I I
T .,I
ril ,·1 .• L
I T , ..... I~J_
I I I
0'
~ "1.1,
.....L 2.Z:' I I I
'T
I I ,.. I
1.

· ... RESOURCE PROIEC110N WELL REPORT STNITCNIDNO. R00645 • ~~ Cochrane Park
-.,lll8fnFfOA1IOHNO, AES881 1:1M1!1«11SIIOD: Air R o t a ry ~ Rogeray Phyth1an AMt Arc~illtlOg_. 'Inc. .... 'IUIII: ~ I#'-<$ :.l COI'III-'liDPIM llings-Conolly. IUIIiiE11'Al1¥1: R. Moeckel
' ...
OIIUNIY: Thurston t.OCA1101t..!!!!" NW " 1oo 3 0 """ 1 7 N A 2 E - ---mar~OI'MLL:Mill· Road
-TERLi;Ya,'iuvA110N:-21.._,' ~~---GIIW:IUIIDtiiiBC& IU\IA'I10ft ,;;;3,;;.5,;;.0_' ":":"~:-:-c::--=--
Inc. !NitAU.ID: 05/03/99
1.:. -~ 05/03/99
o·,,~~~~~~~~~--+-~~~~~-- T 1 I I
3'-1 s' ~
I I I
. I.
I o' ~ I I .:
,.., I I"!! .,,-.·., .. , I \o-,
I
ZD'~
........ :"b~.v
UA«D
btt.,.-lat.- 1
~b~ l·~J 1=>o ol~etL~ . .-"
~·-... "' -. . ,. ,, -:::::,.--~
SWl..-
I I I I I
T
I I I
T I
:2l I ft.
~ f'' -< -~ . S! T
I .
""' I \0
I •JI .. , - I
T -1
0'
~·· I I I I
....!.. z.z• I
z<+ I I I I
jo'~ I I I I
.ss'~, .. ___ _ • ll:'f_tl,_, IWII
OF
~•wN I I
C.()CJ4..,~ <;.Ill"' 0, T
G llA..~ c.l., I
WA-T&..4l. I T
I I I I
J.

RESOURCE PROTECnON WELL REPORT
•• 8TAIITCNU>NO. R0064 5
o·, I I I
3'--t s' +
I .
I I I .
• I I 0 I
I I
e: r• I
1-:. • \1."., o.• I \O--.
I
ZD'+ I I I I
Z.<..;.. I I I
jo·~ I I I I
~~ ... ___ _ •
·-~b~AJ
~/4tD &tt,..o/s.t....-l
to~~ l-~ J
""bouldett.~ ~
~~6u.JN C.o ut..,E.
G llAU'- c.. I WA-T&.A.
£
T 0' I I I I I
T
I I I
T
•"II ~'-
- ~ ~·· -L z..z•
I I I
T
I I
T I
I
1.

RESOURCE PROTEC'IION WELL REPORT
•• ~~ Cochrane Park WILLIIIMI'IC»>'nCIHNO, ~~A;.;;E;;:S~8::.;7:...;9:.,_ ___ _ IJI!!IIII'QW"rHao: Air Rotary ~ Rogeray Phythian Fllllt Arcad~.Drilling. 'Inc.
ln'NITCAADNO. R00645 -.ny, Thurston LOCA~\t NW \II ... 30 ,...17NR~ mar-aOFWiiLL:Mill· Road
tM11R L&va:iuvA'IICN: 21 I
GACIUIID8UN'AOIIUYA11Q1:-.a....3"'S..:0~1:------==I'IIIM:$ii"lling~~.):!olly. Inc.INifAU.ED: 05/03/99 •u EIU'II'Ii: R. Moeckel ·-~ 05/03/99 ...
C)' ,.,~~~·~··~~~T~~rr-~----~~~----~~---!~~-~v~~~~~~~~~QH~--- ,.. 1 I I
3'-i s' ~
I I I
.I .
I ' I 0;; I I
e: r• I
I-:~ 'T \~'I e>• I xo---,
I
·"'b~ .... ij~D &-.,..~5-l.J)
~~~l·':lJ, bould~~t.-:>.
I
I I I I ,.. I I I I ,..
~. M ,-. t ·T
I I
I 'I I ~~
I
0'
z.o·-!-1 I I I
-:- '1.1'
z.<-:-I I I
jo'~ I I I I
1>~6.WN C. o c.Hl.., E. ~,.,"' 0,
GctA.J~(..,
WA-'iG..A.
-L Z.Z' I I I ,.. I I I I ii
~~~r-~~~L-L--------~~~~----~----------------~ • lll'f'OIOolt!AIIII. 111111

•• RESOURCE PROIEC'nON WELL REPORT
STNITCNIDNO. R0064 5
~~ Cochrane Park ~ Thurston WILLIIIIITIPIOA1IONNO • ..,...:A:.:E~S:,:::B:!:B.::.2_____ LOCA~Iol NW "" ... 30 ,.., 17NA_l!: IN.I.HiiEntoo::_~~u~#.L..,.--- mar _..OF WILL: Mi u· Road ~'--~--~~~~~~~-RMI: __ ..;::.;_;,:;o;.=~ wATI!IL.iYia."tuvA110H:-.2.~o.l...,' ~r.------'1\JM:,_......:;; =~__::::::;::;:;..::- GIIOUIIDI1JRFAOiliLiiYA110tt _;;;,3::.;50:;..'-::-::-:-::-~:-=--QONU.1Itlll'lll* InC.NTALLED: 05/03/99 i&IWILifA"IM: .•. •.: .. aev.amm· 05/03/99
o·, I I I
3'--1 s' ~
I I I
. I .
I • I 01
I I I •. :
It; I , .. -, ,~·-:
I ,,
···b~IJ
~~a (::fit.,.~ st..-)
to~~ l·-:, J
boulc.{~c.oe>.
7 ,. ~ ..
,.. I I I I I
I
I I I
T
;u IT t ·~ .,
I I : ,.
0'
Zd~ I I I I
(...,;...
-; 1..1'
2.~~ I I I I
jo'~ I I I I
~tu.IN C.c.HJ (l. C, E. ~Ill~ 1;)
1
G-l""C.(..I
WA-'iG.~
-L Z.Z' I I I
I
I I ,.. I
~~_Lr.~~~L-~-------,~~~-~--~----------------~ • B:Y-tti!'W.It.wl

• ,,.,
• & n ,-...,.,. ru=<:
- - ~-'o'>o.l ---
~----0
,•
J
KEYNOTES
' ~·~"''"~"'fl. ,' ;r • oo 900. n .. et ~ c~~Cil< f.S f<UCW
. l~J'O" > t"G"" V<" ... fM OO<J>~
~r.,.,C>~<Ctu C(<;CIIllL! •wr.•c ~·· 0<' ,. o 011C'11L£ 11'«1 •. <'!' fL
l<fi:AL!.~ ... 114 CFU..C ~<';~lWO ~~>C<Ei~ o~(, li<!:RI<o:lfAl
, ~-''[ '""- ~,'!1"><= ora •a• Cl ~· o WCTU lf!OO/ •1fT 11
!1.0Cfl ~~!~ (1'1.[ ~·.I~;, l>l£ll $)
• ;1" <X a- • D<•-:ru ·~rll< P!?i n_ • ~•
• ; !!..1" ... ~t· ~~E.lt W.<.:r ;"<)1. ~~--.a!. ........
!I" ~:y &t><f> ,.,
............. rW<T>i"ocn-Gf>iTAlrLOC<;,I'f ... lt<'"'"' ""•'"" "'"c .o.rn.ro.; ~''"' cmu•m ""'"~ ''"'' HO:.~
rA · ~· n.w w!'Tf.'<
'(.l)P~["!<E"-"1>~ [W0,,.1!"0)
•. ,..,,...,,.,, "'""'" '"'"1l"
WSW.f>t.AlU
(<) ,.. ~(,.;'_ "-'•'>< C'OO<(~ fl<!.~' "''~ I" Ert.llll Rll!<'. AY 1>" CC-. t: C\INCIIO'E. W.l!:l<
' ' ' ' ' ' ~
('\ I
::!it : Ll!i i[lt)Jii)1
«' -··· """
SECTION~··
·····
rn1.•~ ~""""'~ "'·"· .. ....., A~ ,;rnrn ,.,n; .. ~ !/~" ~IU\ C0t<l1~c~< OUUCD TO E_>O~~~ C>\10<(). !.>:PO"' ;,A<;l T (,>' II:" t•!»>;~ Tr. Wo "'''' A S..OOl~ "'"";;m::»< EC> nte ""~1•~~ 1~·* c.<~II>G I>OO<FY c~.....c ...-n. '"" .•;•· ~T.TL 1') •"-""""~-''r \t:l..,m.c t.!'« Pl.~ ~•"'-''''~!t;r<(r., •ccx..~[><O~W'\
•oon: liP rw~ U~o.!!l ro C<PP!.U ~>'C Pill<~ UNf 11!1H ll'f',(itj WFIO~~'
....,;· ""c~ "''!'lorl! r""~""'.<l ,f)INt "'"' 3· • ._~~ "l:VT~_,(. W<~'ti 'S ,.
I"~~, .. -, AI 10° OC, V\.il WA~, J" COII'.XC'f!: W>!,~
c'"""" """ "'"·~ u"' '"" "~'' "'""" o•...,~
M v~c• IXo'lto< 1~ ct;cm ,.'~><
<>00\I.Y!tO< ll<i ~o--l'-"""""" "'"e X><:t~ "''"' """"~'~" "'~ UP ro 'WI T:i''I•N
, ~- w eo..o wJ "'"' ""~"""-""f-0 ""~' VI'
~ '- ~;~~: :::~:~·~;~~;,;""' w""""~
COM INIOn.&. V
<vo.cr· r , :• • ,. ~~--oro"" ~-""" ~HoOlW< tOflW CE 1001100 A~~ 1'1>1:
GENERA! f! ECIR!CAI NOTES·
n.IJOR!'.\CWT <1Ct!l'\ o><)I<O.>O 1!('1<1. (";t)lo;\U0[...-:1: ()J"HE.t:l. r.tlmlllcAl ··~·u. •..n ""'()II: '""~"~ AAt 10 111. f'f<<l>li>\"0 ... ~Ci<!ll><~ !Q "!.CTIUCAl 0,0A""'Il5.
CITY Of VELrul 5<' i <• !.~,.-.,' b<><>l""":i ~_'!.', I ~-""! "''·>~~,"~'"" &3<,J"' !:<>J(•:•I(•1·~l["l {!;0•)14">-1·751~ F~· <J!Nof.91-Jn?
I'!Ell 2 ll;lPIIOVEt:ENTS
IYELM
•
WELL HEAD '''" "' ac.w:
Al At.!_ 1!11<:1 Wlfill"'-'lDII OS 10 f'llORCl II!Jj_ ,_ "'""'..__...1100< .... ~..n· ,.,,,..,;,_I)AI,O ... ,(
RECORD DR/H'JI~JG APRIL 2003
NEW WELL 2 FACILITY
.:;

•
• •
, . . -.
• •
' ·,.!_·
• ..
,
• • •
< •
•

30E2 •
30E3 30E1 30F1 \ e 30E4 e
25K1 25J2\ e 7.30E5
• 25J3e \ 30M 1
LEGEND:
CITY OF YELM WELL
30M2 REFERENCE NUMBER
e WELL LOCATION
e WELL LOCATED ON CROSS SECTION
HYDROGEOLOGIC CROSS SECTION
25J5 e • • 30L2
• 2~1 30!.42. • 25J4 30L3e
30N1 e • 30N2
PM: D\J'utnl'\n l
MAY 2001
SCALE 1
2002 20C2 • • 2001 2oc1e 2082
2003 e e 20C4e e
20E1 20F3 e ' [ 20G4 e 20F4~0FS 20G5 20A2
19H1 20E3e e 20~ ·2~3:R~:20G2 20E2• 20~• • 2oG~ ~oc:re 20G7
20F5 • • 2ocs 20L4e • 20F7 '\:.:2oc9
2ou • • 2oL3 20L2 e 20K4e
20: 3 20K2e
• 20N1 e 20P1
• 20P2
2 ~ • 00 2002
29G1e e -...._ 28E1
29G2 fg~ · • 28E2
29J4 •
29J1 e 28M4 e 21
8M1
2901 29J3e l 2i J2 28M2 .. 28t.4 3
·~902 29R1e / • 29R:1--/ e 28N1 e
29~3 28P1
29Rt_ 29~3 2~N2 e 28P2
~2A3.A4 330! ' / ., •3~ ~ ·3302 ~ 3303
I
2802 •
3394e/ e eJ365 3363-' •
336~ 3361
FIGURE2
WELL AND CROSS SECTION LOCATION MAP CITY OF YELM WELLHEAD PROTECTION PLAN

A SOUTHWEST
400' - 25L1
300'-
? -
200 ' ? -
100'-
D-D'
I
2401
4
2
-Qf --
CROSS SECTION L£G£ND
SYMBOLS LITHOLOGY
21 L 1 WELL NAME 1 GRAVEL
Qvr Qvt
Ova
LITHOLOGY INTERVAL AND IDENTIFIER
STATIC WATER LEVEL
2 SAND AND GRAVEL
3 SAND
4 SAND, GRAVEL, SILT, AND CLAY (TILL)
5 SILT
6 CLAY
br BEDROCK
wb WATER-BEARING
EXAMPLES 3.5.6 SANDY, SILTY, CLAY
5.3 SILTY SAND
HYDROSTRATIGRAPHIC UNITS
VASHON RECESSIONAL OUTWASH Qf KITSAP FORMATION
VASHON TILL
VASHON ADVANCE OUTWASH
Qc SALMON SPRINGS DRIFT
Tau TERTIARY /QUATERNARY DEPOSITS, UNDIFFERENTIATED
PM: BGC/KAH
MAY 2001
00-211WH
B-B'
I
19M1
0 I
A' NORTHEAST
E-E'
I
18R2
--- Qvr -__gvt -Qva
--- -----2wb
Qc
--- - ?-------
TQu
2000 I
HORIZONTAL SCALE IN FEET
4000 I
6.3 ash
FIGURE 5 HYDROGEOLOGIC CROSS SECTION A-A'
CITY OF YELM WELLHEAD PROTECTION PLAN

500' -
400'-
300' -
200'-
100' -
WSL-
-100'-
- 200' -
• B NORTH
PM: BGC/KAH
MAY2001
00-211WH
C-C'
I
1303 :MH1
...
•
D-D'
A-A' E-E' ~
I I ~ <.>
E
YELM ~
WELL 1 3061 30H2 29M2
1.2
2000 4000 I I
HORIZONTAL SCALE IN FEET
• 8'
SOUTH
331<1 32A1
" Qvr
Qvt
-------? - ~
-- ?
Qc
CROSS SeCTION LeGeND
SYMBOLS
21l1 WELl N.WE
LITHOLOGY GRAVEL SAND .4.ND CRA\IEL
SAND, GRAVEl., SILT, AND ClAY (TILl)
SJ..T STATIC WATER l.E.V£l Cl.AY
br BEDROCI<
wb WATER-BEARING
EXAMPLES 3.5.6 SANOY. SILTY. CLAY
5.3 SLTY SAND
HYDROSTRATIGRAPHIC UNITS
Qvr VASHON RECESSIONAL OUTWASH Of KITSAP FURIAATlON
Qvt VASHON TILL Qc SALMON SPRINGS DRifT
Qvll VASHON .t.OVANCE OUTWASH TQu TERTIAA'r'/OUATERNARY DEPOSITS, UNOIFF'ERENllAT£0
500'-
400' -
300'-
zoo·-
100' -
1.4Sl-
-1 00'-
-200 ' -
FIGURES HYDROGEOLOGIC CROSS SECTION B-B'
CITY OF YELM WELLHEAD PROTECTION PLAN

c SOUTHWEST
500 ' -
400'-
300'-
200'-
24E1
4
y 2
5.6.2wb
5.6.2
CROSS SECTION L£G£ND
SYMBOLS
2 1 L 1 WELL NAME
LITHOLOGY INTERVAL AND IDENTIFIER
STATIC WATER LEVEL
LITHOLOGY 1 GRAVEL
2 SAND AND GRAVEL
3 SAND
4 SAND, GRAVEL. SILT, AND CLAY (TILL)
5 SILT
6 CLAY
br BEDROCK
wb WATER-BEARING
EXAMPLES 3.5.6 SANDY, SILTY, CLAY
5.3 SILTY SAND
HYDROSTRATIGRAPHIC UNITS
Qvr VASHON RECESSIONAL OUTWASH
Qvt VASHON TILL
Of KITSAP FORMATION
Qc SALMON SPRINGS DRIFT
Qva VASHON ADVANCE OUTWASH TQu TERTIARY/QUATERNARY DEPOSITS, UNDIFFERENTIATED
PM: BGC/KAH
MAY 2001
00-211WH
B-B'
I
13Q3
4
6.2
y 4wb
1wb
6. 1wb
1wb
0 I
""" <I> <I> ....
<...>
Qc
2000 I
HORIZONTAL SCALE IN FEET
0> c: 'i: a..
(/)
4000 I
E-E'
I
1wb
C' NORTHEAST
5 00'-
400 '-
300' -
200'-
100 ' -
MSL-
FIGURE 7 HYDROGEOLOGIC CROSS SECTION C-C'
CITY OF YELM WELLHEAD PROTECTION PLAN

WEST
500' -
A-A' 400'- I
2401
300'-
200' -
100'-
MSL-
-10D ' -
30C2
B-B' E-E'
I
30B1
E ~ 29C1 29B1
'-Q) ~
i£ ~ 0 ::.
D' EAST
500 ' -
400'-
o- y 28G2 Ill -----------,--------------__/
PM: BGC/KAH
MAY 2001
00-211WH
Qvr z Qvt 300'-
--- --- Qva
- ?-
Qf 200'-
CROSS SECTION LEGEND Qc 3.6
SYMBOLS
2 1 L 1 WELL NAME
LITHOLOGY INTERVAL AND IDENnFIER
STATIC WATER LEVEL
1
2
3 4
5 6
LITHOLOGY GRAVEL
SAND AND GRAVEL
SAND
SAND, GRAVEL, SILT, AND CLAY (TILL)
SILT
CLAY
br BEDROCK
wb WATER-BEARING
EXAMPLES 3.5.6 SANDY, SILTY, CLAY
5.3 SILTY SAND
1DD'-
MSL-
HYDROSTRATIGRAPHIC UNITS
Qvr VASHON RECESSIONAL OUTWASH
Qvt VASHON TILL
Qva VASHON ADVANCE OUTWASH
Qf KITSAP FORMATION
Qc SALMON SPRINGS DRIFT
0 I
2000 I
4000 I
TQU TERTIARY/QUATERNARY DEPOSITS, UNDIFFERENTIATED
HORIZONTAL SCALE IN FEET
FIGURE 8 HYDROGEOLOGIC CROSS SECTION D-D'
CITY OF YELM WELLHEAD PROTECTION PLAN

500'-
400'-
300' -
200 ' -
100' -
~SL-
ROBINSON&
E SOUTH
30P1 30K1
PM: BGC/KAH
MAY 2001
INC. 00-211WH
B-8' D-D'
I -"< Q) Q) ... u
E Q; >-
3081 19J2 19H1
CROSS SECTION LEGEND
SYMBOLS LITHOLOGY
21L1 WELL NAME GRAVEL
2 SAND AND GRAVEL
3 SAND
A-A'
I
Qc -----?-
E' NORTH
C-C'
I
18A1
4
500'-
400'-
300' -
200 ' -
100 ' -
LITHOLOGY INTERVAL AND IDENTIFIER 4 SAND, GRAVEL, SILT, AND CLAY (TILL)
5 SILT STATIC WATER LEVEL 6 CLAY
br BEDROCK
wb WATER-BEARING
EXAMPLES 3 .5 .6 SANDY. SILTY. CLAY
5 .3 SILTY SAND
HYDROSTRATIGRAPHIC UNITS
Qvr VASHON RECESSIONAL OUTWASH
Qvt VASHON TILL
Qva VASHON ADVANCE OUTWASH
Qf KITSAP FORMATION
Qc SALMON SPRINGS DRIFT
TQu TERTIARY/QUATERNARY DEPOSITS, UNDIFFERENTIATED
~SL-
0 2000 4000 I
HORIZONTAL SCALE IN FEET
FIGURE 9 HYDROGEOLOGIC CROSS SECTION E-E'
CITY OF YELM WELLHEAD PROTECTION PLAN