D etermination of gene signatures to subgroup … 5. QuantiGene Plex mRNA principal component...
8
QuantiGene Plex Assay Tissue homogenates 62 genes tested APPLICATION NOTE QuantiGene Plex and ViewRNA ISH Assays Determination of gene signatures to subgroup melanoma patients using novel branched DNA hybridization assays Poster presentation from the 4th International Symposium on Cancer Metastasis and the Lymphovascular System: Basis for Rational Therapy, May 2011 Gary K. McMaster, Botoul Maqsodi, Wilson Lew, Yunqing Ma, Razia Khan, Takuro Yaoi, John C. Moretto,* Brigitte Robert,* George Bers, Mohammed Kashani-Sabet,* and Stanley P. L. Leong* melanomas and age of stored formalin-fixed, paraffin- embedded (FFPE) samples can make gene expression analysis difficult [3]. Here we describe two gene expression technologies to validate microarray data, that work either directly on melanoma tissue lysates using the Invitrogen ™ QuantiGene ™ Plex Assay, or by in situ hybridization (ISH) using the Invitrogen ™ ViewRNA ™ ISH Tissue Assay, which uses FFPE tissue sections (Figure 1). The two assays, based on second-generation branched-DNA nanostructures, enable direct, specific, and quantitative detection of mRNAs without RNA isolation, reverse transcription, or PCR amplification. Background Melanoma is the most life-threatening neoplasm of the skin, with increasing incidence and mortality worldwide. The development of melanoma progresses through discrete stages that have well-known clinical and histological features; however, key underlying molecular events have not been clearly elucidated [1]. Identification of prognostic and predictive biomarkers will help to better understand the biological pathways of relevance; genomic studies of melanomas are necessary. Gene expression signatures have been successfully employed to distinguish cancer subtypes in many tumor types including melanoma [2]; however, melanin content of later-stage * California Pacific Medical Center, Center for Melanoma Research and Treatment, 2340 Clay St., San Francisco, CA 94115. Figure 1. QuantiGene Plex and ViewRNA biomarker assay strategy—melanoma and normal skin. 40 human samples (20 melanoma and 20 matched skin) ViewRNA ISH Tissue Assay In situ RNA detection 7 genes with best P values tested }
Transcript of D etermination of gene signatures to subgroup … 5. QuantiGene Plex mRNA principal component...

QuantiGene Plex AssayTissue homogenates
62 genes tested
APPLICATION NOTE QuantiGene Plex and ViewRNA ISH Assays
Determination of gene signatures to subgroup melanoma patients using novel branched DNA hybridization assaysPoster presentation from the 4th International Symposium on Cancer Metastasis and the Lymphovascular System: Basis for Rational Therapy, May 2011
Gary K. McMaster, Botoul Maqsodi, Wilson Lew, Yunqing Ma, Razia Khan, Takuro Yaoi, John C. Moretto,* Brigitte Robert,* George Bers, Mohammed Kashani-Sabet,* and Stanley P. L. Leong*
melanomas and age of stored formalin-fixed, paraffin-embedded (FFPE) samples can make gene expression analysis difficult [3]. Here we describe two gene expression technologies to validate microarray data, that work either directly on melanoma tissue lysates using the Invitrogen™ QuantiGene™ Plex Assay, or by in situ hybridization (ISH) using the Invitrogen™ ViewRNA™ ISH Tissue Assay, which uses FFPE tissue sections (Figure 1). The two assays, based on second-generation branched-DNA nanostructures, enable direct, specific, and quantitative detection of mRNAs without RNA isolation, reverse transcription, or PCR amplification.
Background Melanoma is the most life-threatening neoplasm of the skin, with increasing incidence and mortality worldwide. The development of melanoma progresses through discrete stages that have well-known clinical and histological features; however, key underlying molecular events have not been clearly elucidated [1]. Identification of prognostic and predictive biomarkers will help to better understand the biological pathways of relevance; genomic studies of melanomas are necessary. Gene expression signatures have been successfully employed to distinguish cancer subtypes in many tumor types including melanoma [2]; however, melanin content of later-stage
* California Pacific Medical Center, Center for Melanoma Research and Treatment, 2340 Clay St., San Francisco, CA 94115.
Figure 1. QuantiGene Plex and ViewRNA biomarker assay strategy—melanoma and normal skin.
40 human samples(20 melanoma and 20 matched skin)
ViewRNA ISH Tissue AssayIn situ RNA detection
7 genes with best P values tested
Samplepreparation
Targethybridization
Signalamplification
Detection
Fix cells and permeabilize
Fast Red substrate
Incubate
Sequentialhybridizations
Visualize using brightfield or fluorescence
microscope
Pre-amplifier(PreAmp1 QF)
Amplifier(Amp1 QF)
Label probe(label probe–AP)
Target-specificprobe set }

QuantiGene Plex Assay overview Twenty matched-pair melanoma and normal skin samples were prepared for QuantiGene Plex Assays as follows: 5 mg wet-weight, snap-frozen tissue samples were homogenized in 300 µL Invitrogen™ QuantiGene™ Homogenization Solution plus Proteinase K. Homogenates were tested in 40 µL triplicate samples by the QuantiGene
Plex Assay using two 36-gene panels as described in the user manual; each panel contained 31 target genes and 5 housekeeping genes. All samples were analyzed using a Luminex® instrument, and all target gene expression was normalized to a geometric mean of the 5 housekeeping genes (PGK1, HPRT, TBP, ACTB, GUSB; see Figure 2).
Lyse sample
Luminex beadswith capture probes
Streptavidin-phycoerythrin (SAPE)
Read signal using a Luminex instrument
Capture extenders (CE)
Incubate beads with sample and probes
Pre-amplifier
Amplifier
Label probe
Label extenders (LE)
Blocking probes (BL)
Lysate (with target RNA)
Hybridization and wash steps
Lysate (with target RNA)
80 RNA targets per well
Samplepreparation
Targethybridization
Signalamplification
Detection
Figure 2. QuantiGene Plex Assay overview. The assay uses Luminex® xMAP® technology to simultaneously measure as many as 80 genes in a single well.

ViewRNA ISH Tissue Assay overview Snap-frozen tissues were fixed in 10% buffered formalin for 24 hours, rinsed in water, dehydrated, and embedded in paraffin. Tissue sections (5 µm) were deposited on positively charged Fisher Scientific™ SuperFrost™ Plus slides (Cat. No. 12-550-15). All samples were tested in duplicate by the ViewRNA ISH Tissue Assay for the 7 genes with the best P values, including dapB (negative
control), ACTB (positive control for all samples), and KRT5 (positive control for normal skin and negative control for metastatic melanoma). Sections were hybridized with probe and labeled with Fast Red, and nuclei were counterstained with DAPI as described in the user manual. 20x/NA 0.75 images were taken with an Olympus™ IX71 microscope and Olympus™ DP71 camera (Figure 3).
Samplepreparation
Targethybridization
Signalamplification
Detection
Fix cells and permeabilize
Fast Red substrate
Incubate
Sequentialhybridizations
Visualize using brightfield or fluorescence
microscope
Pre-amplifier(PreAmp1 QF)
Amplifier(Amp1 QF)
Label probe(label probe–AP)
Target-specificprobe set
Figure 3. ViewRNA ISH assay. The ViewRNA ISH Tissue Assay, based on branched-DNA signal amplification technology, has the sensitivity and robustness to measure single molecules of mRNA in single cells.

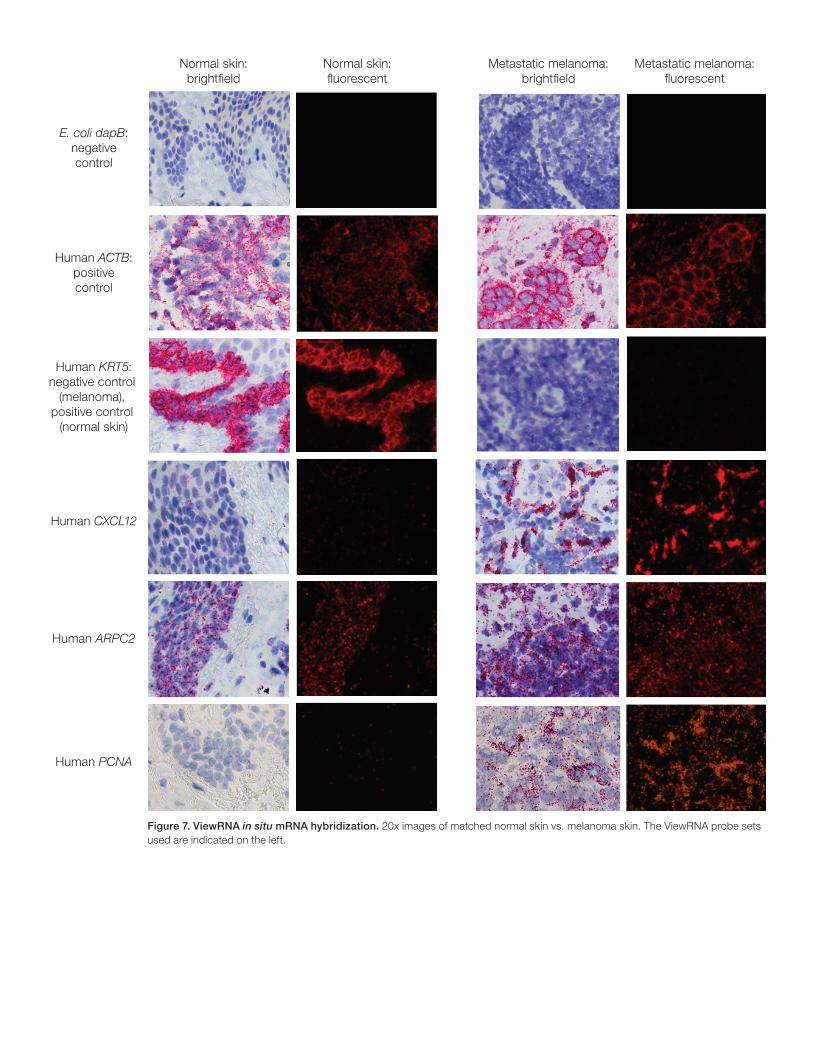
Results Sixty-two genes related to melanoma have been categorized from the literature using RNA expression to determine the prevalence of these genes in 20 frozen sections of metastatic melanoma tissues, as compared to their corresponding normal skin counterparts. RNA expression was quantified directly from melanoma and normal skin tissue homogenates by the QuantiGene Plex Assay, based on branched DNA technology (Figure 4) [4,5]. Seven genes, demonstrating the most significant difference in expression between tissue types (P values 1.28 x 10⁻⁹ to 1.13 x 10⁻⁶), were found to be significantly associated with melanoma as compared to normal skin when analyzed by principal component analysis and cluster analysis (Figures 5 and 6). These 7 genes were validated using FFPE tissues from the same donors by the ViewRNA ISH Tissue Assay (Figure 7) [6]. Of the 7 genes, 4 genes were upregulated in the melanoma metastases versus normal skin tissues. These 7 candidate genes gave signal differences in both intensity and spatial recognition between melanoma tumor and normal skin tissue microenvironments. These genes support angiogenesis, immune response and inflammation, DNA replication, cell proliferation and motility, tissue invasion and progression, epidermis development, cell communication, and morphogenesis.
Gene P value Gene P value
BCL6 1.28 x 10⁻⁹ XRCC6 1.88 x 10⁻²
PTEN 1.03 x 10⁻⁸ DNAJA1 2.51 x 10⁻²
ARPC2 2.17 x 10⁻⁸ CDKN2A 3.31 x 10⁻²
CXCL12 1.37 x 10⁻⁷ NOS2 4.91 x 10⁻²
BRAF 4.18 x 10⁻⁷ CTNNB1 7.62 x 10⁻²
PCNA 6.33 x 10⁻⁷ VEGFC 1.02 x 10⁻¹
CLEC3B 1.13 x 10⁻⁶ B3GAT1 1.19 x 10⁻¹
MCM6 1.93 x 10⁻⁶ CEACAM1 1.20 x 10⁻¹
NME1 2.39 x 10⁻⁶ CCNA1 1.43 x 10–1
EMX2 3.07 x 10⁻⁶ GMNN 1.72 x 10⁻¹
MKI67 3.45 x 10⁻⁶ TRPM1 1.96 x 10⁻¹
TP53 3.63 x 10⁻⁶ IL-8 2.37 x 10⁻¹
MMP2 6.60 x 10⁻⁶ APAF1 2.82 x 10⁻¹
NCOA3 1.84 x 10⁻⁴ MCAM 2.91 x 10⁻¹
BIRC5 2.21 x 10⁻⁴ CD8A 3.22 x 10⁻¹
PLAT 3.27 x 10⁻⁴ IL-10 3.23 x 10⁻¹
FXYD5 3.67 x 10⁻⁴ MCM4 3.47 x 10⁻¹
RGS1 4.13 x 10⁻⁴ TFAP2A 3.75 x 10⁻¹
SPP1 4.45 x 10⁻⁴ FGF2 3.84 x 10⁻¹
LICAM 1.70 x 10⁻³ BCL2L1 3.85 x 10⁻¹
CDKN1A 2.13 x 10⁻³ XRCC5 3.86 x 10⁻¹
IL-24 2.40 x 10⁻³ CXCR4 4.11 x 10⁻¹
LYVE1 2.46 x 10⁻³ ICAM1 4.76 x 10⁻¹
MITF 2.53 x 10⁻³ BCL2 5.23 x 10⁻¹
TYR 5.06 x 10⁻³ ATF2 5.37 x 10⁻¹
MAP2 7.88 x 10⁻³ WNT2 5.54 x 10⁻¹
MLANA 8.26 x 10⁻³ BBC3 6.51 x 10⁻¹
TNF 1.11 x 10⁻² STMN2 8.32 x 10⁻¹
CDH3 1.20 x 10⁻² HSPA4 8.89 x 10⁻¹
FN1 1.21 x 10⁻² CD4 9.54 x 10⁻¹
ITGB3 1.43 x 10⁻² CNN3 9.98 x 10⁻¹
Figure 4. Gene expression differences between melanoma and normal skin. Expression of all 62 genes was normalized to the geometric mean of 5 housekeeping genes, and the P value for each gene was calculated using a supervised Student’s t-test. The genes are in the order of their P values; the best P values are in bold.

Figure 5. QuantiGene Plex mRNA principal component analysis (PCA). Genes with the best 7 P values were analyzed using an unsupervised principal component analysis. Note: Sample 17 was not a melanoma sample (lymph node with pigmented histiocytes).
Figure 6. QuantiGene Plex mRNA cluster analysis. Genes with the best 7 P values were analyzed using an unsupervised cluster analysis. Note: Sample 17 was not a melanoma sample (lymph node with pigmented histiocytes).
–5 1050
–4
–2
0
2
4
pca2$x[.1]
pca
2$x[
.2]
Gene P value
BCL6 1.28 x 10⁻⁹
PTEN 1.03 x 10⁻⁸
ARPC2 2.17 x 10⁻⁸
CXCL12 1.37 x 10⁻⁷
BRAF 4.18 x 10⁻⁷
PCNA 6.33 x 10⁻⁷
CLEC3B 1.13 x 10⁻⁶
Metastatic melanomaNormal PCA
Principal component analysis of 7 genes
M17
M17: Not melanoma; lymph node with pigmented histiocytes
Cluster analysis of 7 genes
010
86
42
M17
M25
M13
M4
M23
M39
M10
M30
M35
M8
M19
M31
M2
M27
M11
M37
M15
M21
M6
M1
M33
n18
n20
n22
n28
n40
n34
n5 n36
n38
n9 n14
n16
n24
n32
n7 n26
n3 n12
n29
Gene P value
BCL6
PTEN
ARPC2
CXCL12
BRAF
PCNA
CLEC3B
M17: Not melanoma; lymph node with pigmented histiocytes
1.28 x 10⁻⁹
1.03 x 10⁻⁸
2.17 x 10⁻⁸
1.37 x 10⁻⁷
4.18 x 10⁻⁷
6.33 x 10⁻⁷
1.13 x 10⁻⁶
Metastatic melanoma:brightfield
Metastatic melanoma:fluorescent
Normal skin:brightfield
Normal skin:fluorescent
Human KRT5:negative control
(melanoma), positive control
(normal skin)
Human CXCL12
Human ARPC2
Human PCNA
Human ACTB:positivecontrol
E. coli dapB:negativecontrol
Figure 7. ViewRNA in situ mRNA hybridization. 20x images of matched normal skin vs. melanoma skin. The ViewRNA probe sets used are indicated on the left.

Functions of the top 7 genes with the best P values• BCL6 (B-cell CLL/lymphoma 6): Repressor of
transcription; decreased expression associated with impaired prognosis [7]
• PTEN (phosphatase and tensin homolog): Signal transduction regulator; decreased expression associated with impaired prognosis [8]
• ARPC2 (actin-related protein 2/3 complex, subunit 2): Control of actin polymerization in cells; increased expression in malignant melanomas [9]
• CXCL12 (chemokine (C-X-C motif) ligand 12): Angiogenesis; increased expression is involved in melanoma progression [10]
• BRAF (v-Raf murine sarcoma viral oncogene homolog B1): Cell division; increased expression in PCNA (proliferating cell nuclear antigen): DNA replication; increased expression correlated with increased risk of developing distant metastasis and impaired prognosis [12]
• CLEC3B (C-type lectin domain family 3, member B): Cell-extracellular matrix interaction; decreased expression associated with primary tumors with low tumor thickness [13]
Conclusions • The QuantiGene Plex Assay works directly on human
melanoma and skin tissue homogenates, providing a fast, convenient workflow with precise and accurate simultaneous measurements of mRNAs without purification and target amplification, streamlining the target validation.
• The ViewRNA ISH Tissue Assay is an in situ hybridization assay that has the sensitivity and robustness to measure single RNA molecules in single cells in human melanoma and skin.
• Sixty-two genes from the literature were validated: (1) QuantiGene Plex Assay expression data from 7 of the 62 genes were sufficient to discriminate melanoma from matched normal skin; (2) the ViewRNA ISH Tissue Assay showed both signal intensity and spatial resolution of these 7 validated genes within melanoma and normal skin tissue samples.
• Taken together, these results demonstrate the power of using branched-DNA technologies to validate melanoma biomarkers.

For Research Use Only. Not for use in diagnostic procedures. © 2017 Thermo Fisher Scientific Inc. All rights reserved. All trademarks are the property of Thermo Fisher Scientific and its subsidiaries unless otherwise specified. Luminex and xMAP are registered trademarks of Luminex Corporation. Olympus is a trademark of Olympus Corporation. COL31607 0417
Find out more at thermofisher.com/quantigene
References 1. Balch CM, et al. (2009) Final version of 2009 AJCC melanoma staging and
classification. J Clin Oncol 27(36):6199–6206.
2. Haqq C, et al. (2005) The gene expression signatures of melanoma progression. Proc Natl Acad Sci USA 102(17):6092–6097.
3. Conway C, et al. (2009) Gene expression profiling of paraffin-embedded primary melanoma using the DASL assay identifies increased osteopontin expression as predictive of reduced relapse-free survival. Clin Cancer Res 15(22):6939–6946.
4. Paik S, et al. (2008) HER2 status and benefit from adjuvant trastuzumab in breast cancer. N Engl J Med 358(13):1409–1411.
5. Hall JS, et al. (2011) Exon-array profiling unlocks clinically and biologically relevant gene signatures from formalin-fixed paraffin-embedded tumour samples. Br J Cancer 104:971–981.
6. Ting DT, et al. (2011) Aberrant overexpression of satellite repeats in pancreatic and other epithelial cancers. Science 331(6017):593–596.
7. Alonso SR, et al. (2004) Progression in cutaneous malignant melanoma is associated with distinct expression profiles: a tissue microarray-based study. Am J Pathol 164(1):193–203.
8. Mikhail M, et al. (2005) PTEN expression in melanoma: relationship with patient survival, Bcl-2 expression, and proliferation. Clin Cancer Res 11(14):5153–5157.
9. Kashani-Sabet M, et al. (2009) A multi-marker assay to distinguish malignant melanomas from benign nevi. Proc Natl Acad Sci USA 106(15):6268–6272.
10. Franco R, et al. (2010) CXCR4-CXCL12 and VEGF correlate to uveal melanoma progression. Frontiers Biosci (Elite Ed.) 2:13–21.
11. Curtin JA, et al. (2006) Somatic activation of KIT in distinct subtypes of melanoma. J Clin Oncol 24(26):4340–4346.
12. Winnepenninckx V, et al. (2006) Gene expression profiling of primary cutaneous melanoma and clinical outcome. J Natl Cancer Inst 98(7):472–482.
13. Jaeger J, et al. (2007) Gene expression signatures for tumor progression, tumor subtype, and tumor thickness in laser-microdissected melanoma tissues. Clin Cancer Res 13(3):806–815.