D. Bychanok, S. Li, G. Gorokhov, K. Piasotski, D. Meisak ...
10
Fully carbon metasurface: Absorbing coating in microwaves D. Bychanok, S. Li, G. Gorokhov, K. Piasotski, D. Meisak, P. Kuzhir, E. A. Burgess, C. P. Gallagher, F. Y. Ogrin, A. P. Hibbins, A. Pasc, A. Sanchez-Sanchez, V. Fierro, and A. Celzard Citation: Journal of Applied Physics 121, 165103 (2017); doi: 10.1063/1.4982232 View online: http://dx.doi.org/10.1063/1.4982232 View Table of Contents: http://aip.scitation.org/toc/jap/121/16 Published by the American Institute of Physics
Transcript of D. Bychanok, S. Li, G. Gorokhov, K. Piasotski, D. Meisak ...

Fully carbon metasurface: Absorbing coating in microwavesD. Bychanok, S. Li, G. Gorokhov, K. Piasotski, D. Meisak, P. Kuzhir, E. A. Burgess, C. P. Gallagher, F. Y. Ogrin,A. P. Hibbins, A. Pasc, A. Sanchez-Sanchez, V. Fierro, and A. Celzard
Citation: Journal of Applied Physics 121, 165103 (2017); doi: 10.1063/1.4982232View online: http://dx.doi.org/10.1063/1.4982232View Table of Contents: http://aip.scitation.org/toc/jap/121/16Published by the American Institute of Physics
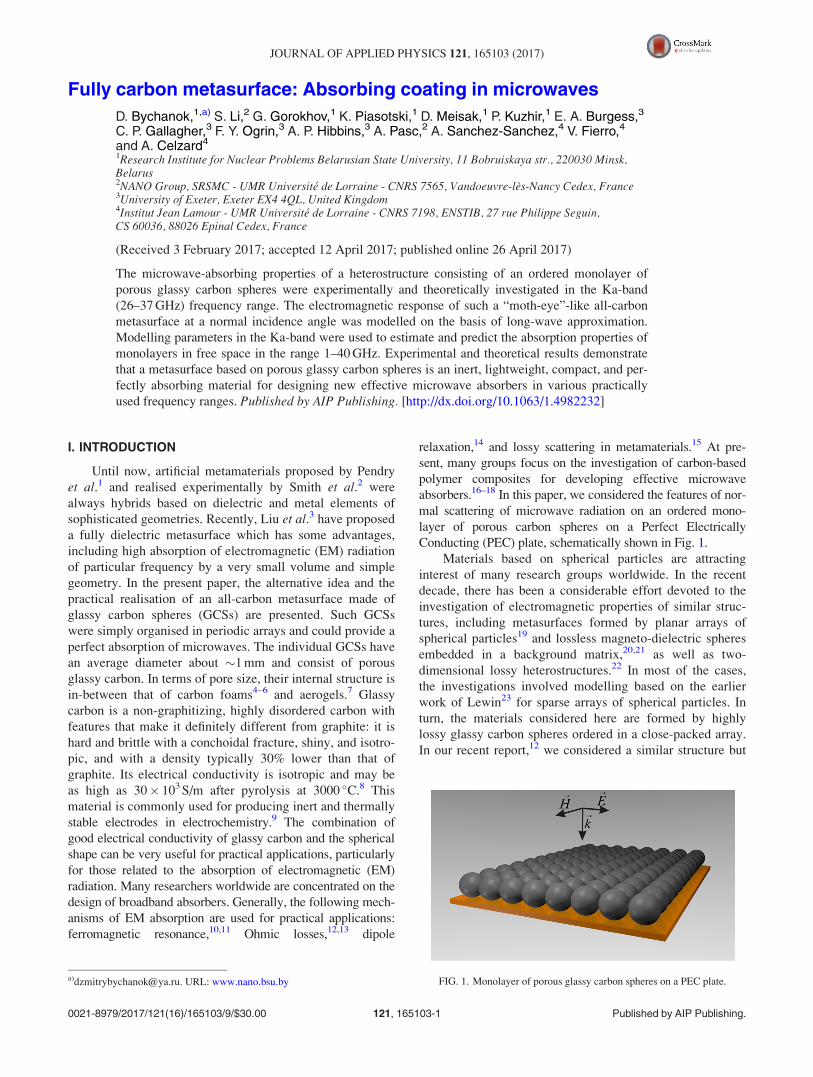
Fully carbon metasurface: Absorbing coating in microwaves
D. Bychanok,1,a) S. Li,2 G. Gorokhov,1 K. Piasotski,1 D. Meisak,1 P. Kuzhir,1 E. A. Burgess,3
C. P. Gallagher,3 F. Y. Ogrin,3 A. P. Hibbins,3 A. Pasc,2 A. Sanchez-Sanchez,4 V. Fierro,4
and A. Celzard4
1Research Institute for Nuclear Problems Belarusian State University, 11 Bobruiskaya str., 220030 Minsk,Belarus2NANO Group, SRSMC - UMR Universit�e de Lorraine - CNRS 7565, Vandoeuvre-les-Nancy Cedex, France3University of Exeter, Exeter EX4 4QL, United Kingdom4Institut Jean Lamour - UMR Universit�e de Lorraine - CNRS 7198, ENSTIB, 27 rue Philippe Seguin,CS 60036, 88026 Epinal Cedex, France
(Received 3 February 2017; accepted 12 April 2017; published online 26 April 2017)
The microwave-absorbing properties of a heterostructure consisting of an ordered monolayer of
porous glassy carbon spheres were experimentally and theoretically investigated in the Ka-band
(26–37 GHz) frequency range. The electromagnetic response of such a “moth-eye”-like all-carbon
metasurface at a normal incidence angle was modelled on the basis of long-wave approximation.
Modelling parameters in the Ka-band were used to estimate and predict the absorption properties of
monolayers in free space in the range 1–40 GHz. Experimental and theoretical results demonstrate
that a metasurface based on porous glassy carbon spheres is an inert, lightweight, compact, and per-
fectly absorbing material for designing new effective microwave absorbers in various practically
used frequency ranges. Published by AIP Publishing. [http://dx.doi.org/10.1063/1.4982232]
I. INTRODUCTION
Until now, artificial metamaterials proposed by Pendry
et al.1 and realised experimentally by Smith et al.2 were
always hybrids based on dielectric and metal elements of
sophisticated geometries. Recently, Liu et al.3 have proposed
a fully dielectric metasurface which has some advantages,
including high absorption of electromagnetic (EM) radiation
of particular frequency by a very small volume and simple
geometry. In the present paper, the alternative idea and the
practical realisation of an all-carbon metasurface made of
glassy carbon spheres (GCSs) are presented. Such GCSs
were simply organised in periodic arrays and could provide a
perfect absorption of microwaves. The individual GCSs have
an average diameter about �1 mm and consist of porous
glassy carbon. In terms of pore size, their internal structure is
in-between that of carbon foams4–6 and aerogels.7 Glassy
carbon is a non-graphitizing, highly disordered carbon with
features that make it definitely different from graphite: it is
hard and brittle with a conchoidal fracture, shiny, and isotro-
pic, and with a density typically 30% lower than that of
graphite. Its electrical conductivity is isotropic and may be
as high as 30� 103 S/m after pyrolysis at 3000 �C.8 This
material is commonly used for producing inert and thermally
stable electrodes in electrochemistry.9 The combination of
good electrical conductivity of glassy carbon and the spherical
shape can be very useful for practical applications, particularly
for those related to the absorption of electromagnetic (EM)
radiation. Many researchers worldwide are concentrated on the
design of broadband absorbers. Generally, the following mech-
anisms of EM absorption are used for practical applications:
ferromagnetic resonance,10,11 Ohmic losses,12,13 dipole
relaxation,14 and lossy scattering in metamaterials.15 At pre-
sent, many groups focus on the investigation of carbon-based
polymer composites for developing effective microwave
absorbers.16–18 In this paper, we considered the features of nor-
mal scattering of microwave radiation on an ordered mono-
layer of porous carbon spheres on a Perfect Electrically
Conducting (PEC) plate, schematically shown in Fig. 1.
Materials based on spherical particles are attracting
interest of many research groups worldwide. In the recent
decade, there has been a considerable effort devoted to the
investigation of electromagnetic properties of similar struc-
tures, including metasurfaces formed by planar arrays of
spherical particles19 and lossless magneto-dielectric spheres
embedded in a background matrix,20,21 as well as two-
dimensional lossy heterostructures.22 In most of the cases,
the investigations involved modelling based on the earlier
work of Lewin23 for sparse arrays of spherical particles. In
turn, the materials considered here are formed by highly
lossy glassy carbon spheres ordered in a close-packed array.
In our recent report,12 we considered a similar structure but
FIG. 1. Monolayer of porous glassy carbon spheres on a PEC plate.a)[email protected]. URL: www.nano.bsu.by
0021-8979/2017/121(16)/165103/9/$30.00 Published by AIP Publishing.121, 165103-1
JOURNAL OF APPLIED PHYSICS 121, 165103 (2017)

based on hollow carbon spheres (HCSs). Compared to the
latter, the GCSs are much more mechanically resistant,
which is especially important for further practical use.
The analysis of the electromagnetic response of non-
uniform periodic structures may be significantly simplified
when the wavelength of the external electromagnetic wave is
much larger than the characteristic lateral dimensions of the
structure. Moreover, non-homogeneous structures with a
graded refractive index are widely used in the industry for
designing and developing various types of microwave
absorbers24–29 and the long-wave approximation30–33 is com-
monly applied to describe and predict their electromagnetic
properties in the microwave frequency range.
The present paper is organized as follows. The details of
preparation of GCSs and of the characterisation techniques
as well of experimental microwave measurements are given
in Section II. In Section III, we provide the material’s main
characteristics. In Section IV, we describe the homogenisa-
tion technique which is used to obtain the equivalent mate-
rial properties and the electromagnetic response of the GCS
monolayer. Herein, we also compare the experimental data
with the results of modelling. Theoretical predictions of the
absorption properties in free space of the GCS-based meta-
surface are discussed in Section V. Finally, the Conclusions
section summarises the findings and gives an outlook on
potential application of such metasurfaces.
II. EXPERIMENTAL
A. Preparation of materials
The synthesis of porous glassy carbon spheres is based
on several main components including sodium alginate
(Algin Texturas), calcium chloride (Roth), resorcinol (Alfa
Aesar), and a 37% aqueous solution of formaldehyde (Roth).
All these chemicals were used “as is” without further purifi-
cation. First, a 20 ml aqueous solution containing 12.8 g res-
orcinol, 9.43 g formaldehyde solution, and 2.22 g of CaCl2was prepared. Dropwise addition of 5 ml of a 0.5 wt. %
sodium alginate in water, using a syringe of volume 10 ml
having a needle of diameter and length 0.8 mm and 50 mm,
respectively, to the former solution heated at 60 �C under
magnetic stirring, instantaneously induced gelation and led
to polymer beads of size about 2.1 mm. The beads were
recovered by filtration after 1 h of stirring at the same tem-
perature of 60 �C, and then treated in hot pressurised water
(180 �C, 24 h) for hydrothermal carbonisation (HTC) in an
autoclave. The aim of HTC was to stabilise the spheres and
increase their carbon content. Finally, the beads recovered
after HTC were submitted to pyrolysis at 900 �C (2 �C/min,
2 h dwell time).
Whereas the size of the final carbon spheres did not
significantly depend on the experimental conditions, their
density could be tuned through the concentration of the reac-
tants. Given the carbon precursor used here, i.e., resorcinol-
formaldehyde resin, the spheres were made of glassy carbon,
a material rather similar to the one with which hollow
spheres were prepared from another non-graphitizing precur-
sor and reported recently for EM applications.12
B. Characterisation of materials
Carbon spheres were observed without preliminary met-
allisation with a FEI Quanta 600 FEG scanning electron
microscope (SEM). Elemental analysis was performed with
an elemental analyser Vario EL Cube (Elementar). The con-
tents of C, H, N, and S were measured through the combus-
tion of 3 identical samples in a quartz tube at 1150 �C under
helium and oxygen in excess, and the average was calculated
for each element. The oxygen content was estimated by
difference.
Raman spectroscopy was carried out using an XploRa
Raman spectrometer (Horiba) without sample preparation.
The spectra were collected under a microscope using a 50�objective. The Raman-scattered light was dispersed by a
holographic grating with 1200 lines/mm and detected by a
CCD camera. Three lasers were used, having wavelengths of
532, 638, and 785 nm, thus corresponding to incident ener-
gies of 2.33, 1.94, and 1.58 eV, respectively. The lasers were
filtered at 10% of their nominal power for avoiding any heat-
ing or damage of the samples. Each spectrum was obtained
by accumulation of 2 spectra recorded from 800 to
2200 cm–1 over 120 s. It was systematically checked that no
significant difference was observed when the analysis was
performed in different areas of the same sample, suggesting
the excellent homogeneity of the materials.
Finally, the textural properties were determined from
nitrogen adsorption-desorption isotherms at �196 �C, using an
ASAP 2020 surface area analyser (Micromeritics). The sam-
ples were out-gassed overnight under vacuum at 250 �C prior
to analysis. Micropore volume, Vl, and surface area, SBET,
were determined by application of Dubinin-Radushkevich and
Brunauer–Emmett–Teller (BET) methods, respectively. The
total pore volume measurable by adsorption, VT, was defined
as the volume of liquid nitrogen corresponding to the amount
adsorbed at a relative pressure P/P0¼ 0.99. The mesopore vol-
ume, Vm, was calculated as the difference VT – Vl. The pore
size distribution was determined by application of the non-
linear density functional theory (NLDFT).
C. Ka-band measurements
The electromagnetic response of a GCS-based monolayer
was experimentally investigated in the Ka-band (26–37 GHz)
using a scalar network analyser ELMIKA R2-408R. All meas-
urements were carried out in a 7.2� 3.4 mm waveguide sys-
tem. For testing the model presented below in Section III, two
types of experiments were performed. In one type, the GCSs
were initially packed to form a close-compact single layer
which was then carefully fixed inside the waveguide between
two 1 mm-thick layers of StyrofoamVR
(Dow Chemical), a
trademarked brand of closed-cell extruded polystyrene foam
transparent to microwave. Due to the unavoidable, slight distri-
bution of GCS sizes and due to some defects in the packing,
the as-obtained 2D ordering was closer to a square-shaped
lattice. The electromagnetic response of the GCS-based mono-
layer was obtained as amplitude ratios of transmitted to input
(S21) and reflected to input (S11) signals. In the second type of
experiment, the layer of Styrofoam behind the sample was
replaced by the PEC-plate (i.e., behaving as a mirror with a
165103-2 Bychanok et al. J. Appl. Phys. 121, 165103 (2017)

reflection coefficient of 100%). In that case, only the S11-
parameters were measured. Reflection and transmission coeffi-
cients were then obtained from S-parameters: R ¼ S211 and
T ¼ S221, respectively. The absorption coefficient was then cal-
culated as A¼ 1 – R – T and A¼ 1 – R in the first and second
types of experiments, respectively.
III. MATERIAL’S CHARACTERISTICS
Scanning Electron Microscopy (SEM) images of typical
samples of GCSs are presented in Figs. 2(a) and 2(b). A
photo of the GCS monolayer formed “as is” is presented in
Fig. 2(c). The order of real GCS-arrays is in between cubic
or hexagonal.
From SEM analysis, the average diameter of the spheres
was found to be around d¼ 0.79 mm. The inner structure
was relatively homogeneous and close to that of glassy
carbon aerogels with a typical pore size less than 1 lm, as
evidenced by SEM images at higher magnification (not
shown). Based on the average diameter and on the weight of
a number of carbon spheres, their average density was found
to be q¼ 0.39 g/cm3. Taking a value of 1.55 g/cm3 for the
skeletal density of glassy carbon,12,34 the porosity of the
GCS was estimated to be 75%.
The elemental weight composition was the following:
91.70 6 0.50% carbon; 0.80 6 0.15% hydrogen; 0.21 6 0.10%
nitrogen; and 0.00% sulphur. The deduced oxygen content was
then around 7%. Those values are quite typical for a carbon
material derived from phenolic resin and other oxygenated pre-
cursors such as those reported in the synthesis.34,35 As a result,
the carbon was expected to be highly disordered, hence the
name “glassy” it was given, and this was proved by Raman
spectra shown in Fig. 3.
It can indeed be seen in Fig. 3 that the spectrum obtained
at an energy of 2.33 eV presents a broad D band centred on
1340 6 2 cm�1 and a slightly narrower G band of rather simi-
lar intensity at 1595 6 2 cm�1. A shallow valley between
them and a shoulder at around 1200 cm�1, accounted by con-
tributions called D3 and D4, respectively, are also observed.
Besides, the positions of D and G bands, their general shapes,
and their FWHM values (close to 135 and 70 cm�1, respec-
tively) fully match those already reported for glassy carbon
derived from phenolic/furanic resins pyrolysed below
1000 �C (see for instance36–40). Decreasing the laser energy,
EL, from 2.33 to 1.58 eV produced the expected phenomena,
i.e., a shift of the D band to lower wavenumbers, whereas the
G band remained at the same position but with a relatively
lower intensity. Although only three incident energies were
available for establishing quantitative trends, the intensity
ratio of D to G bands was found to vary as ID=IG ’ E�1:13L ,
and the D band was seen to shift with the increasing excita-
tion energy at a rate of 48 cm�1/eV. The latter values and the
aforementioned ones (band positions and widths) are consis-
tent with each other and are typical of highly disordered car-
bons having crystallite size close to—or lower than �5 nm,41
an order of magnitude already reported for similar carbon
materials.35
Although the texture of such carbon is highly disor-
dered, the electrical conductivity remains rather high, around
200 S/m, see Section IV. This value is lower but still consis-
tent with the one reported elsewhere for non-porous glass-
like carbon pyrolysed at 900 �C, around 7000 S/m.36 The pre-
sent material indeed has a porosity U¼ 75% and, assuming
that the simplest relationship for the conductivity of metal
foams holds,42 i.e., r¼rbulk(1 – U)3=2, then the conductivity
is one order of magnitude lower than that of the bulk. The
present conductivity value is even lower than that, for at least
two additional reasons expected to decrease the conductivity
further: (i) the presence of alginate of natural origin in the
FIG. 2. SEM images of: (a) porous glassy carbon spheres, and (b) inner
structure of a broken sphere; (c) Photo of a real GCS monolayer.
165103-3 Bychanok et al. J. Appl. Phys. 121, 165103 (2017)

synthesis should have introduced impurities in the carbon
matrix and (ii) the porosity is far narrower than that of a
foam, in favour of a much higher scattering of charge car-
riers within the material.
Indeed, the adsorption-desorption given in Fig. 4 is typi-
cal of a highly microporous solid (pore size <2 nm) with a
very low amount of mesoporosity (2–50 nm), as confirmed by
the pore-size distribution shown in the inset. Moreover, the
corresponding surface area was SBET¼ 588 m2/g, whereas
micropore and mesopore volumes were Vl¼ 0.22 cm3/g and
Vm¼ 0.04 cm3/g, respectively. As a result, the macropore vol-
ume (>50 nm) was therefore deduced to be predominant and
equal to 1/q�1/qc�Vm�Vl¼ 0.75 cm3/g.
IV. MODELLING
The wavelength of the radiation in the Ka-band (1 cm at
30 GHz) exceeds considerably the GCS diameter. Hence, the
calculations can be significantly simplified by applying a
homogenisation procedure to the given structure and using
the long-wave approximation. This methodology is tradition-
ally used in optics for modelling antireflective coatings,30,32
and was successfully applied in our recent works.12,27
It is important to note that the primitive homogenisation
used in Ref. 12 for a monolayer of hollow spheres, consisting
of averaging non-conductive air regions with highly conduc-
tive carbon regions according to their relative volume frac-
tions, was not successful in describing the experimental data
in the case of the present porous spheres. Simple averaging
indeed gave correct results in the case of hollow sphere
monolayer because the shell thickness of HCSs was much
smaller than their diameter, and because the effective dielec-
tric permittivity in the middle part of the layer remained
constant. For a monolayer made of GCSs, the spatial distri-
bution of effective dielectric permittivity is much more
non-uniform; thus, the homogenisation procedure had to be
modified to account for these variations.
To model the electromagnetic response of an ordered
monolayer of conducting spherical particles on a metal sur-
face, we followed homogenisation methods which are widely
used for designing microwave absorbers.24,26,28 These meth-
ods are generally based on the application of equivalent
circuits for calculating the effective dielectric permittivity
of the structure, and are valid for a wide range of absorber
geometries. After homogenisation, the electromagnetic
response of the investigated structure in the long-wave
approximation was considered to be equivalent to that of a
layer of bulk material of the same thickness but with graded
effective dielectric permittivity.
A. Homogenisation procedure
The general principles of the homogenisation procedure
used in this work are detailed in Refs. 24 and 28. Throughout
the article, we use SI units and assumed an exp½ixt� ikz�harmonic time convention.
Let us consider the side projection of a GCS monolayer
along the xz-plane as shown in Fig. 5(a). The origin of the
coordinates is located in the middle of the monolayer. The
wave vector of the initial radiation is parallel to the x-
direction. Fig. 5(b) presents the monolayer cross-section
along the yz-plane at the coordinate x (jxj < D=2), where Dis the GCS diameter. This cross-section consists of round-
like carbon regions of radius r ¼ffiffiffiffiffiffiffiffiffiffiffiffiffiffiffiffiffiffiffiffiffiD2=4� x2
pand air
regions. Due to the symmetry of the system, only one quarter
of the unit cell (the square of side D/2 and thickness dx pre-
sented in Fig. 5(c)) may be considered to calculate the effec-
tive dielectric permittivity of the layer at coordinate x. Let us
examine a thin slice of it, having a thickness dy. It consists
of carbon and air regions, which are equivalent to two
capacitors in series (Fig. 5(d)). The stack of such carbon-air
capacitors in parallel contributes to the effective capacitance
of the layer. Now, this parameter may be easy calculated by
integration over the y-coordinate within the unit cell and
then converted into effective dielectric permittivity of the
layer at coordinate x
FIG. 3. First-order Raman spectra of glassy carbon spheres as a function of
laser incident energy.
FIG. 4. Adsorption-desorption isotherm (full and empty symbols, respec-
tively) of glassy carbon spheres, and the corresponding pore-size distribution
(inset).
165103-4 Bychanok et al. J. Appl. Phys. 121, 165103 (2017)

eef f x; �ð Þ ¼D�
ffiffiffiffiffiffiffiffiffiffiffiffiffiffiffiffiffiffiD2� 4x2p
Dþð ffiffiffiffiffiffiffiffiffi
D2
4�x2
p0
� e �ð Þdy
e �ð Þ D
2�
ffiffiffiffiffiffiffiffiffiffiffiffiffiffiffiffiffiffiffiffiffiffiffiffiffiD2
4� x2� y2
r !þ
ffiffiffiffiffiffiffiffiffiffiffiffiffiffiffiffiffiffiffiffiffiffiffiffiffiD2
4� x2� y2
r ;
(1)
where eð�Þ ¼ 1� ir2p�e0
is the dielectric permittivity of glassy
carbon, i being the imaginary unit, r¼ 200 S/m is the quasi-
static bulk electrical conductivity, � is the frequency, and
e0¼ 8.85� 10–12 F/m is the permittivity of vacuum. The
value of r was obtained by fitting the experimental data
below, and seems realistic for porous glassy carbon with
density q¼ 0.39 g/cm3 since it is in good agreement with
recent published results.6,43 The spatial distribution of effec-
tive dielectric permittivity (1) calculated at 30 GHz is pre-
sented in Fig. 6.
From Fig. 6, we can see that the absolute values of both
real and imaginary parts of effective e are rather low in the
outer regions of the GCS monolayer, and increase towards
the centre. Nevertheless, in the middle region where the
glassy carbon fraction is high and where the contribution of
conductive losses dominates, the real part of effective edecreases and has a minimum in the centre of the monolayer.
It should be noted that this complex distribution of dielectric
permittivity is formed by combination of insulating (e¼ 1)
and conducting (eð�Þ ¼ 1� ir2p�e0
) media. It is also interesting
to see that, if we apply Eq. (1) to a monolayer of lossless
dielectric spheres, for example with e¼ 2, we obtain a spatial
distribution very close to the parabolic one used in Refs. 12
and 30.
To conclude this section, we should point out that the
homogenisation procedure presented above is valid as far as
the wavelength of the initial radiation considerably exceeds
the GCS diameter. In this case, we can assume that the peri-
odic GCS-based monolayer structure (or GCS metasurface)
presents the same electromagnetic response as an effective
medium with a spatial distribution of effective dielectric per-
mittivity (1).
B. Multi-layered medium
For calculating the EM response of a structure having
the spatial dispersion described by Eq. (1), we used the
model of wave distribution in a multi-layered medium.31,44
Let us consider a layer of bulk material with the spatial
dispersion obeying Eq. (1). For calculating its coefficients of
reflection R, transmission T, and absorption A, the following
procedure was applied.12 The layer was first divided into Nparts. When N is high, it can be assumed that the refractive
index inside each part is constant.
Using Maxwell equations, it is possible to obtain the
direct solutions for electric and magnetic fields at the bound-
aries of each thin layer. Written in matrix notations, they
have the following form:12,31,44
E1
H1
" #¼
cosðkts0Þ i sinðkts0Þk0=kt
i sinðkts0Þkt=k0 cosðkts0Þ
" #E2
H2
" #; (2)
where E1, H1 and E2, H2 are electric and magnetic fields in
the left and right sides of a layer of thickness s0, respectively,
kt ¼ 2pka
ffiffiffiffiffiffiffiffiffiffiffiffiffiffiffiffiffiffiffiffiffiffiffiffiffiffiffiffiffiffinðxÞ2a2 � k2=4
qand k0 ¼ 2p
ka
ffiffiffiffiffiffiffiffiffiffiffiffiffiffiffiffiffiffiffiffiffiffiffiffin2
0a2 � k2=4
qare the
wave vectors in the layer of refractive index n(x) and in air
(refractive index n0¼ 1) inside the waveguide of width
a¼ 7.2 mm, respectively, k being the wavelength. The first
term in the right part of Eq. (2) is known as the characteristic
matrix of the layer.
In the case of a multi-layered structure, the characteristic
matrix of the whole layer is the product of all single layer
matrices. The R and T coefficients of the N-layered subsys-
tem inside the waveguide can be calculated as
FIG. 5. (a) Side projection of a GCS monolayer along the xz-plane; (b)
cross-section along the yz-plane at the coordinate x (jxj < D=2); (c) quarter
of unit cell used for the calculation of the equivalent material constants; (d)
equivalent capacitance model of the layer.
FIG. 6. Spatial distribution of the homogenised effective dielectric permit-
tivity of the GCS-based monolayer calculated using Eq. (1) at 30 GHz.
165103-5 Bychanok et al. J. Appl. Phys. 121, 165103 (2017)

R ¼ S211 ¼
n0 � C=B
n0 þ C=B
� �2
; (3)
T ¼ S221 ¼
2n0
n0Bþ C
� �2
; (4)
where
B
C
" #¼
YNt¼1
cosðktsÞ i sinðktsÞk0=kt
i sinðktsÞkt=k0 cosðktsÞ
" #( )1
n0
" #: (5)
For the numerical calculations, we used nðx; �Þ ¼ffiffiffiffiffiffiffiffiffiffiffiffiffiffiffiffiffieef f ðx; �Þ
pto obtain the refractive index inside the GCS-monolayer
region jxj < D=2.
The aforementioned equations were applied in Section
IV C to the description and to the analysis of the experimen-
tal data.
C. Comparison between experiment and modelling
The electromagnetic response of the GCS-based mono-
layer without a metal plate, either measured in waveguide or
modelled in the Ka-band, is given in Fig. 7(a). From this fig-
ure, it can be seen that the free-standing monolayer absorbed
about 24% of the initial radiation power. However, the
absorption properties of the monolayer could be significantly
improved when a metal plate is located beneath the mono-
layer. The corresponding S11-parameters are presented in
Fig. 7(b). In this case, the absorption coefficient A ¼ 1� S211
indeed varied in the range 30%–94%. Additionally, the inter-
ference minimum of the signal reflected from the GCS-
monolayer could be shifted by varying the width of the air
gap between the monolayer and the metal plate (Fig. 7(c)).
The combination of the GCS-based monolayer, an air gap
(l¼ 6.1 mm), and a metal plate thus allows observing experi-
mentally an asymmetric and sharp absorption peak with a
maximum at about A¼ 84%. The position of this peak was
quite well predicted by the modelling.
In Figs.7(a)–7(c), a good agreement can be observed
between experiments and modelling for the three indepen-
dent measurements. The maximum absolute difference
between experimental data and results of theoretical model-
ing in Figs. 7(a), 7(b), and 7(c) is 0.09, 0.04, and 0.27,
respectively. We can see that the best correlation between
experiment and modeling is for the GCS monolayer located
on a metal plate. When the GCS is in the form of a mono-
layer separated from the metal plate by an air gap of width
6.1 mm, the divergence near 33 GHz is maximal but the
shape of the peak and its position still are in good agreement
with the modelling. The possible reason for some deviation
between modelled and measured S-parameters in Fig. 7 is
the inhomogeneity of diameters of the real porous GCSs
forming the monolayer. Nevertheless, the obvious coinci-
dence between experiment and theory confirms the relevance
of the model presented here, and allows using it to predict
the electromagnetic response as well as the absorption prop-
erties in free space and in a broader frequency range, as dis-
cussed below.
V. ABSORPTION PROPERTIES IN FREE SPACE
The results presented above were obtained with
waveguide-based measurements. These are indeed the most
accurate and widely developed techniques for investigating
electromagnetic properties in dielectric spectroscopy.
However, the most important practical use of microwave
absorbers is associated with the free space applications. Eqs.
(4) and (5) can be also applied in free space but, in such a
FIG. 7. Comparison of experimental (full circles and squares) and theoret-
ical (lines) results in waveguide: (a) S11- and S21-parameters of a free-
standing 0.79-mm thick GCS-monolayer; (b) S11-parameters of the same
GCS monolayer located on a metal plate; (c) S11-parameters of the GCS
monolayer separated from the metal plate by an air gap of width
l¼ 6.1 mm.
165103-6 Bychanok et al. J. Appl. Phys. 121, 165103 (2017)

case, wave vectors kz¼ 2p/k and k2z ¼ 2pffiffiep=k should be
used.
To investigate the absorption properties of GCS-based
monolayers on a PEC plate at a normal incidence angle in
free space, we varied parameters such as the diameter of the
GCS and the width of the air gap between the monolayer and
the PEC plate. Additionally, for better understanding of the
absorption properties, we extended the modelling from the
relatively narrow Ka-band to the frequency range from 1 up
to 40 GHz. This allowed having an overall view of the
expected microwave absorbing properties and estimating
the optimal parameters for a further practical use of GCS
metasurfaces.
It is worth noting that the diameter of GCSs is the most
important geometrical parameter in the considered system.
Additionally, air gap is the most flexible, “easy to change”
parameter defining electromagnetic response. The variation
of both parameters significantly affects the electromagnetic
response of GCS monolayers and presents the general
features of absorbing properties of GCS-monolayers in
microwaves.
A. Diameter dependence
The dependence of the absorption coefficient of a GCS-
based monolayer on frequency and diameter in free space is
presented in Fig. 8.
It can be seen from Fig. 8 that the first absorption maxi-
mum (wherein absorption is 100%) is shifted towards lower
frequencies when the GCS diameter increases. Both the
width and height of such a peak remain practically constant.
For larger diameters, a second, wider maximum appears.
This maximum may be used in practice for designing broad-
band absorbers.
It is interesting to compare those results with the absorb-
ing properties of a lossy homogeneous plane parallel plate of
thickness s and permittivity e¼ 1 – ir/xe0 located on a PEC
plate. In Fig. 8, the first maximum in the Ka-band can be
achieved with spheres of diameter about 1 mm. The model-
ling of a plane parallel plate with e¼ 1 – ir/xe0 shows that,
in this case, the same first maximum may also be achieved in
the Ka-band only for a minimal thickness of about
2.5–3 mm. The latter result shows that the GCS-based mono-
layer is much more compact than a plane parallel plate. Such
an advantage of the GCS metasurface may be very important
for aerospace applications for example.
Additionally, from the symmetry of the 3D-surface pre-
sented in Fig. 8 we can see that a change of diameter is
equivalent to a change of frequency. This result is evident
because, in the case of free space, Eq. (5) depends only
on the simple product of thickness s and frequency �.
Therefore, the variations of both parameters in free space are
equal. As in the case of hollow carbon spheres12 we see from
Fig. 8 that for broadband absorption applications the spheres
with a larger diameter are preferable.
B. Air gap dependence
The dependence of the absorption coefficient of a GCS-
based monolayer on frequency and air gap width in free
space is presented in Fig. 9.
Fig. 9 shows that the increase of the air gap makes the
first absorption maximum decrease and be shifted to lower
frequencies. The second maximum is clearly asymmetric,
and sharper than the former one. This second maximum was
exactly the one observed experimentally in the waveguide
(Fig. 7(c)) at a frequency near 33 GHz. In Fig. 9, it is shifted
to a lower frequency (near 26 GHz) due to the difference of
wave vectors in free space and in a waveguide. Usually, if the
interference absorption maximum is observed in the wave-
guide at a frequency �wg, it is also expected in free space at a
frequency �fs. In most cases, such a shift of frequency can be
roughly estimated by the following equation:45
�2wg � �2
f s ¼c2
4a2; (6)
where c is the speed of light in vacuum and a is the width of
the waveguide. At highest values of air gap, a third maxi-
mum also appears. The latter is even sharper than the second
peak. The asymmetry and the variations between first,
second, and third maxima are important differences between
the GCS metasurface presented here and traditional lossy
FIG. 8. Dependence of the absorption coefficient of the GCS-monolayer on
frequency and diameter in free space.
FIG. 9. Dependence of the absorption coefficient of the GCS-monolayer on
frequency and air gap width in free space.
165103-7 Bychanok et al. J. Appl. Phys. 121, 165103 (2017)

homogeneous plane parallel plate of thickness s and dielec-
tric permittivity e¼ 1 – ir/xe0. In the case of a plane parallel
plate, the first maximum indeed does not decrease with the
air gap and the second and third maxima are symmetric and
equivalent to the first one. We assume that this special fea-
ture of the GCS-based monolayer may find some practical
applications in the future, for example for designing
frequency-selective filters.
Also noteworthy is that the microwave absorption per-
formances of the GCS monolayers considered here are gen-
erally comparable with those of other absorbers presented
recently16–18 (the absorption mechanism is classical Ohmic
losses in conductive medium). These recent reports generally
deal with materials based on a polymer matrix and their
operating temperature range is usually limited below
200–300 �C. In contrast, the glassy carbon considered here is
thermally stable in air up to a temperature of 400 �C, and
even up to 3000 �C in vacuum.46
VI. CONCLUSIONS
Porous glassy carbon spheres (GCSs), assumed to have
a purely imaginary dielectric permittivity e¼ 1 – ir/xe0,
were used for obtaining a microwave-absorbing metasurface.
Spherical particles arranged in a periodic structure indeed
allowed obtaining a metamaterial with graded real and imag-
inary parts of effective dielectric permittivity (see Fig. 6).
A detailed comparison of the absorption properties of
the aforementioned GCS-based metasurface with those of a
homogeneous lossy plane parallel plate of thickness s¼Dand permittivity e¼ 1 – ir/xe0 located on a PEC plate led to
the following differences, features, and advantages of the
new heterostructure presented here:
• the experimental waveguide measurements showed that
GCS monolayers absorb up to 92% of the initial micro-
wave radiation power in the Ka-band;• theoretical predictions showed that absorption peaks in
free space may be effectively tuned by varying the width
of the air gap and the diameter of the GCSs;• the GCS monolayer is a compact absorber. The same
absorbing parameters can indeed only be achieved with a
conductive plane parallel plate presenting a significantly
higher thickness;• the carbon material presented in this manuscript may be
applied as broadband or as a resonant absorber, depending
on the width of the air gap;• tuning the air gap allows obtaining asymmetric absorption
peaks, which might be potentially used in microwave filter
applications.
Finally, it is also worth mentioning that the material
considered here is thermally stable, inert, easy to prepare,
and cheap. These features of GCSs make them very attrac-
tive for designing new, effective microwave-absorbing
coatings.
ACKNOWLEDGMENTS
The work was supported by Projects FP7-610875
(NAMICEMC, 2013-2017), H2020 RISE 734164 Graphene
3D, and FP7 IRSES project CANTOR (Grant No. FP7-
612285). Sijin Li thanks the China Scholarship Council for
the financial support under Grant No. 201406510029.
Cameron Gallagher and Emma Burgess acknowledge
financial support from the Engineering and Physical
Sciences Research Council (EPSRC) of the United
Kingdom, via the EPSRC Centre for Doctoral Training in
Metamaterials (Grant No. EP/L015331/1).
1J. B. Pendry, A. J. Holden, D. Robbins, and W. Stewart, “Magnetism from
conductors and enhanced nonlinear phenomena,” IEEE Trans. Microwave
Theory Tech. 47, 2075–2084 (1999).2D. R. Smith, W. J. Padilla, D. Vier, S. C. Nemat-Nasser, and S. Schultz,
“Composite medium with simultaneously negative permeability and
permittivity,” Phys. Rev. Lett. 84, 4184 (2000).3X. Liu, K. Fan, I. V. Shadrivov, and W. J. Padilla, “Experimental realiza-
tion of a terahertz all-dielectric metasurface absorber,” Opt. Express 25,
191–201 (2017).4G. Tondi, V. Fierro, A. Pizzi, and A. Celzard, “Tannin-based carbon
foams,” Carbon 47, 1480–1492 (2009).5F. Moglie, D. Micheli, S. Laurenzi, M. Marchetti, and V. M. Primiani,
“Electromagnetic shielding performance of carbon foams,” Carbon 50,
1972–1980 (2012).6D. Bychanok, A. Plyushch, K. Piasotski, A. Paddubskaya, S. Voronovich,
P. Kuzhir, S. Baturkin, A. Klochkov, E. Korovin, M. Letellier, S.
Schaefer, A. Szczurek, V. Fierro, and A. Celzard, “Electromagnetic prop-
erties of polyurethane template-based carbon foams in Ka-band,” Phys.
Scr. 90, 094019 (2015).7A. Szczurek, G. Amaral-Labat, V. Fierro, A. Pizzi, E. Masson, and A.
Celzard, “The use of tannin to prepare carbon gels. Part I: Carbon aero-
gels,” Carbon 49, 2773–2784 (2011).8M. Inagaki and F. Kang, Materials Science and Engineering of Carbon:Fundamentals (Butterworth-Heinemann, 2014), p. 298.
9F. Walsh, L. Arenas, C. Ponce de Leon, G. Reade, I. Whyte, and B.
Mellor, “The continued development of reticulated vitreous carbon as a
versatile electrode material: Structure, properties and applications,”
Electrochim. Acta 215, 566–591 (2016).10S. V. K. E. Zhuravlev and K. Dorozhkin, “Electromagnetic waves absorb-
ing characteristics of composite material containing carbonyl iron parti-
cles,” Mater. Sci. Appl. 5, 803–811 (2014).11M. Ipatov, V. Zhukova, L. V. Panina, and A. Zhukov, “Ferromagnetic
microwires composite metamaterials with tuneable microwave electro-
magnetic parameters,” PIERS Proc. 5, 586–590 (2009).12D. Bychanok, S. Li, A. Sanchez-Sanchez, G. Gorokhov, P. Kuzhir, F.
Ogrin, A. Pasc, T. Ballweg, K. Mandel, A. Szczurek, V. Fierro, and A.
Celzard, “Hollow carbon spheres in microwaves: Bio inspired absorbing
coating,” Appl. Phys. Lett. 108, 013701 (2016).13M.-S. Cao, W.-L. Song, Z.-L. Hou, B. Wen, and J. Yuan, “The effects of
temperature and frequency on the dielectric properties, electromagnetic
interference shielding and microwave-absorption of short carbon fiber/sil-
ica composites,” Carbon 48, 788–796 (2010).14R. Buchner, J. Barthel, and J. Stauber, “The dielectric relaxation of water
between 0C and 35C,” Chem. Phys. Lett. 306, 57–63 (1999).15W. Withayachumnankul and D. Abbott, “Metamaterials in the terahertz
regime,” IEEE Photonics J. 1, 99–118 (2009).16M. S. Sarto, A. G. D’Aloia, A. Tamburrano, and G. De Bellis, “Synthesis,
modeling, and experimental characterization of graphite nanoplatelet-
based composites for emc applications,” IEEE Trans. Electromagn.
Compat. 54, 17–27 (2012).17Y. Danlee, I. Huynen, and C. Bailly, “Thin smart multilayer microwave
absorber based on hybrid structure of polymer and carbon nanotubes,”
Appl. Phys. Lett. 100, 213105 (2012).18D. Bychanok, G. Gorokhov, D. Meisak, P. Kuzhir, S. A. Maksimenko, Y.
Wang, Z. Han, X. Gao, and H. Yue, “Design of carbon nanotube-based
broadband radar absorber for Ka-band frequency range,” Prog.
Electromagn. Res. 53, 9–16 (2017).19C. L. Holloway, E. F. Kuester, J. A. Gordon, J. O’Hara, J. Booth, and D.
R. Smith, “An overview of the theory and applications of metasurfaces:
The two-dimensional equivalents of metamaterials,” IEEE Antennas
Propag. Mag. 54, 10–35 (2012).20C. L. Holloway, E. F. Kuester, J. Baker-Jarvis, and P. Kabos, “A double
negative (DNG) composite medium composed of magnetodielectric
165103-8 Bychanok et al. J. Appl. Phys. 121, 165103 (2017)

spherical particles embedded in a matrix,” IEEE Trans. Antennas Propag.
51, 2596–2603 (2003).21S. Kim, E. F. Kuester, C. L. Holloway, A. D. Scher, and J. Baker-Jarvis,
“Boundary effects on the determination of metamaterial parameters from
normal incidence reflection and transmission measurements,” IEEE Trans.
Antennas Propag. 59, 2226–2240 (2011).22A. Mejdoubi and C. Brosseau, “Dielectric response of perforated two-
dimensional lossy heterostructures: A finite-element approach,” J. Appl.
Phys. 100, 094103 (2006).23L. Lewin, “The electrical constants of a material loaded with spherical par-
ticles,” J. Inst. Electr. Eng., Part III 94, 65–68 (1947).24D. I. Kim, M. Takahashi, H. Anzai, and S. Y. Jun, “Electromagnetic wave
absorber with wide-band frequency characteristics using exponentially
tapered ferrite,” IEEE Trans. Electromagn. Compat. 38, 173–177 (1996).25E. F. Kuester and C. L. Holloway, “A low-frequency model for wedge or
pyramid absorber arrays-I: Theory,” IEEE Trans. Electromagn. Compat.
36, 300–306 (1994).26H. J. Yoon and D. I. Kim, “Two-dimensional simulation of broad-band
ferrite electromagnetic wave absorbers by using the fdtd method,”
J. Korean Phys. Soc. 45, 1025–1031 (2004).27D. S. Bychanok, A. O. Plyushch, G. V. Gorokhov, U. S. Bychanok, P. P.
Kuzhir, and S. A. Maksimenko, “Microwave radiation absorbers based on
corrugated composites with carbon fibers,” Tech. Phys. 61, 1880–1884
(2016).28M.-J. Park, J. Choi, and S.-S. Kim, “Wide bandwidth pyramidal absorbers
of granular ferrite and carbonyl iron powders,” IEEE Trans. Magn. 36,
3272–3274 (2000).29See http://niipfp.bsu.by/index.php/oborud/tora for “Microwave absorber
“Tora””.30D. Stavenga, S. Foletti, G. Palasantzas, and K. Arikawa, “Light on the
moth-eye corneal nipple array of butterflies,” Proc. R. Soc. London, Ser. B
273, 661–667 (2006).31H. A. Macleod, Thin-Film Optical Filters (CRC Press, 2001).32N. Klochko, G. Khrypunov, Y. Myagchenko, E. Melnychuk, V. Kopach,
K. Klepikova, V. Lyubov, and A. Kopach, “Electrodeposited zinc oxide
arrays with the moth-eye effect,” Semiconductors 48, 531–537 (2014).33C.-H. Sun, P. Jiang, and B. Jiang, “Broadband moth-eye antireflection
coatings on silicon,” Appl. Phys. Lett. 92, 061112 (2008).
34S. F. Parker, S. Imberti, S. K. Callear, and P. W. Albers, “Structural and
spectroscopic studies of a commercial glassy carbon,” Chem. Phys. 427,
44–48 (2013).35M. Letellier, A. Szczurek, M.-C. Basso, A. Pizzi, V. Fierro, O. Ferry, and
A. Celzard, “Preparation and structural characterisation of model cellular
vitreous carbon foams,” Carbon 112, 208–218 (2017).36L. Soukup, I. Gregora, L. Jastrabik, and A. Konakova, “Raman spectra and
electrical conductivity of glassy carbon,” Mater. Sci. Eng., B 11, 355–357
(1992).37K. Ray and R. L. McCreery, “Spatially resolved Raman spectroscopy of
carbon electrode surfaces: Observations of structural and chemical hetero-
geneity,” Anal. Chem. 69, 4680–4687 (1997).38S. Bukalov, L. Leites, A. Sorokin, and A. Kotosonov, “Structural changes
in industrial glassy carbon as a function of heat treatment temperature
according to Raman spectroscopy and x-ray diffraction data,” Nanosyst.
Phys. Chem. Math. 5, 186–191 (2014).39N. Solopova, N. Dubrovinskaia, and L. Dubrovinsky, “Raman spectroscopy
of glassy carbon up to 60 GPa,” Appl. Phys. Lett. 102, 121909 (2013).40M. Nakamizo, R. Kammereck, and P. L. Walker, “Laser Raman studies on
carbons,” Carbon 12, 259–267 (1974).41P. Mallet-Ladeira, P. Puech, C. Toulouse, M. Cazayous, N. Ratel-Ramond,
P. Weisbecker, G. L. Vignoles, and M. Monthioux, “A Raman study to
obtain crystallite size of carbon materials: A better alternative to the
Tuinstra-Koenig law,” Carbon 80, 629–639 (2014).42F. Cuevas, J. Montes, J. Cintas, and P. Urban, “Electrical conductivity and
porosity relationship in metal foams,” J. Porous Mater. 16, 675 (2009).43D. Micheli, R. B. Morles, M. Marchetti, F. Moglie, and V. M. Primiani,
“Broadband electromagnetic characterization of carbon foam to metal con-
tact,” Carbon 68, 149–158 (2014).44M. Born and E. Wolf, Principles of Optics, 4th ed. (Pergamon Press,
1970).45D. Bychanok, A. Plyushch, G. Gorokhov, V. Skadorov, P. Kuzhir, S.
Maksimenko, J. Macutkevic, A. Ortona, L. Ferrari, and E. Rezaei,
“Electromagnetic properties of periodic carbon architectures at high
frequencies,” in 2015 International Conference on Electromagnetics inAdvanced Applications (ICEAA) (IEEE, 2015), pp. 43–46.
46F. C. Cowlard and J. C. Lewis, “Vitreous carbon - A new form of carbon,”
J. Mater. Sci. 2, 507–512 (1967).
165103-9 Bychanok et al. J. Appl. Phys. 121, 165103 (2017)