D A BUREAU OF AGRICULTURAL STATISTICS - … OF AGRICULTURAL STATISTICS PHILIPPINES. F| ISHERIES...
17
ISSN-2012-0400 18 DEPARTMENT OF AGRICULTURE BUREAU OF AGRICULTURAL STATISTICS PHILIPPINES
Transcript of D A BUREAU OF AGRICULTURAL STATISTICS - … OF AGRICULTURAL STATISTICS PHILIPPINES. F| ISHERIES...

| FISHERIES SITUATIONER
ISSN-2012-0400
18
DEPARTMENT OF AGRICULTURE
BUREAU OF AGRICULTURAL STATISTICS PHILIPPINES

| FISHERIES SITUATIONER
HIGHLIGHTS
The total volume of fisheries production decreased by 5.66 percent in the third quarter of 2011 compared with last year’s record. All sectors had reduced production with commercial fisheries posting the biggest decrease at 17.59 percent. Municipal fisheries production went down by 2.82 percent while aquaculture experienced a 0.52 percent decline in output (Table1).
Commercial fishermen unloaded 242,398.36 metric tons
of fish catch this quarter. This was 51,740.13 metric tons lower than last year’s third quarter record. Zamboanga Peninsula accounted for the bulk of commercial fish catch unloaded at 55,131.67 metric tons. Moreover, it was in Zamboanga Peninsula where the biggest decrease in fish catch at
29,096.69 metric tons was noted. Another 12 regions recorded production shortfalls while only three (3) regions fared well during the quarter. The slide in production was largely attributed to the lower volume of fish unloadings in Zamboanga Peninsula, specifically, in Zamboanga City. The cut in production was traced to lesser occurrence of Indian sardines which volume of unloadings was down by 11,658.16 metric tons. Reduced fishing trips were observed because of high cost of fuel and occurrence of successive typhoons. All types of landing centers recorded decreased volume of unloadings. The bulk of commercial fish catch at 111,763.08 metric tons were unloaded at traditional landing centers. Commercial fisheries contributed about 22.89 percent to total fisheries production.
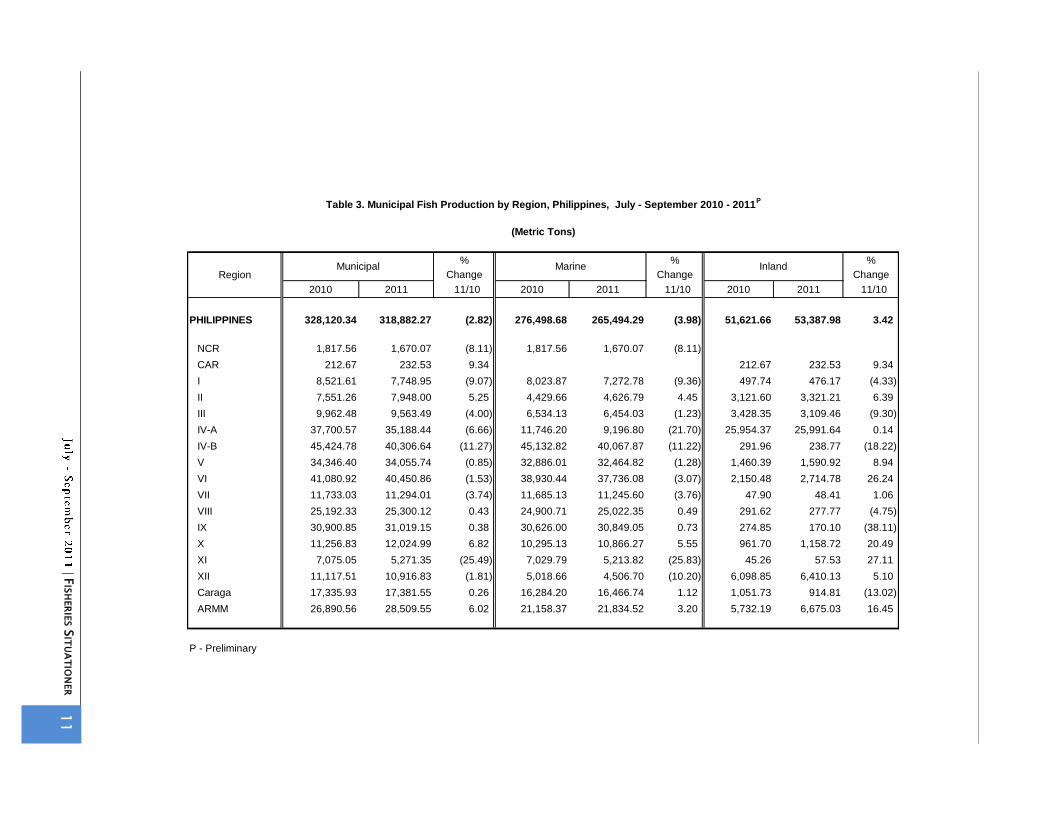
Municipal fisheries produced 318,882.27 metric tons of fish catch this third quarter of 2011 or 9,238.07
metric tons lower than in 2010. The volume of fish unloaded by municipal fishing boats reached 265,494.29 which shared 83.26 percent in the total municipal fisheries output. The volume of fish caught by inland municipal fishing households at 53,387.98 metric tons was 16.74 percent of the total municipal fisheries output. Ten (10) regions recorded production shortfalls while seven (7) regions recorded production gain. The decline in production was largely attributed to lesser number of fishing trips due to rough seas brought by several typhoons that hit the regions and high costs of gas and oil. Municipal fisheries accounted for 30.11 percent of the total fisheries production.
1
Fig.1 Fisheries: Volume of Production by Sector,
Philippines, July – September 2010-2011 Fig.2 Fisheries: Percent Distribution of
Production by Sector, Philippines,
July-September 2011

| FISHERIES SITUATIONER
Aquaculture production at 497,782.04 metric tons was 2,616.07 metric tons lower than the record in the same quarter last year. Seaweed production at 325,929.02 metric tons contributed more than half or 65.48 percent to the total aquaculture production. Fin fishes and shellfishes, on the other hand, contributed 34.52 percent. These included milkfish, tilapia, tiger prawn, oyster and mussel. Seaweed production declined by 1.42 percent or 4,684.12 metric tons this quarter. The production cut was traced to unavailability of planting materials, thus, less area utilized in Zamboanga del Sur. More areas in Zamboanga Sibugay and Zamboanga del Norte were affected by ice-ice disease and chemicals from washed-out rice fields. Aquaculture accounted for 47 percent of the total fisheries production.
COMMERCIAL FISHERIES
Commercial fisheries production at 242,398.36 metric tons was 17.59 percent or 51,740.13 metric tons lower than last year’s third quarter record of 294,138.49 metric tons. Zamboanga Peninsula accounted for the bulk of commercial fish catch unloaded at 55,131.67 metric tons of which more than half or 41,074.15 metric tons were recorded in Zamboanga City landing centers. It was further observed that 94.70 percent or 38,898.54 metric tons of fish catch in Zamboanga City were unloaded at private landing centers. However, it was also in Zamboanga Peninsula where the biggest decrease in fish catch at 29,096.69 metric tons was noted. Reduced production was recorded in other 12 regions, namely: Ilocos Region, Cagayan Valley, Central Luzon, National Capital Region, CALABARZON, MIMAROPA, Western Visayas, Central Visayas, Eastern Visayas, Northern Mindanao, SOCCSKSARGEN and Caraga. The decrease in production was largely attributed to the lower volume of fish unloadings in Zamboanga Peninsula, specifically, in Zamboanga City. This was traced to lesser occurrence of Indian sardines which volume of unloading was down by 11,658.16 metric tons from 42,942.67 metric tons in 2010 to 31,284.51 metric tons this quarter. Owners of commercial fishing vessels sent their crew into the sea and used fish finders. When there was less school of Indian sardines, they would not to go on fishing in order to conserve fuel and gasoline. As a result, some canneries reduced their operations because their main ingredient in canning was Indian sardines. Lesser occurrences of Indian mackerel, roundscad, frigate tuna and big-eyed scad were, likewise, observed in Zamboanga City. The drop in production from other regions was also attributed to lesser fishing operations due to rough seas and strong winds brought by successive typhoons which affected commercial fishing activities. Some regions also related their production shortfall to high operating expenses on gas and oil. Dry-docking of some commercial fishing vessels for repair and maintenance was also reported. It was noted that lower production was also result of the existing high seas closure imposed by the Western and Central Pacific Fisheries Commission (WCPFC) on its members countries to replenish stocks of the highly migratory tuna species. On the other hand, three (3) regions fared well during the quarter, namely: Bicol Region, Davao Region and ARMM. In these regions, there was abundant catch of in-season species like big-eyed scad, frigate tuna, roundscad, skipjack and Indian sardines. The volume of commercial fish catch unloaded at private landing centers recorded the biggest decrease at 32.65 percent or 26,308.05 metric tons this quarter. The volume of fish catch unloaded at the ports managed by the Philippine Fisheries Development Authority (PFDA) went down by 16.21 percent or 10,117.52 metric tons. Unloadings in Local Government Unit (LGU) – managed landing centers declined by 3.63 percent or 907.32 metric tons. Traditional landing centers accounted for the bulk of commercial fish catch with a total of 111,763.08 metric tons. However, this registered a decline of 11.42 percent or 14,407.24 metric tons (Table 2).
2

| FISHERIES SITUATIONER
MUNICIPAL FISHERIES
Municipal fisheries production of 318,882.27 metric tons for
the third quarter of the year was 2.82 percent lower than the output in the same period last year. Marine fisheries produced 265,494.29 metric tons and inland fisheries, 53,387.98 metric tons during the quarter. The 3.98 percent decrease in marine fisheries production caused the performance of the sector to drop in spite of the 3.42 percent increase in catch from inland fisheries.
Lower municipal fish production was registered by 10 out of 16 regions. MIMAROPA, CALABARZON, Davao Region, Ilocos Region and Western Visayas registered the biggest reductions in volume of fish landed. Meanwhile, the six (6) regions that surpassed their outputs of the same period last year were Cagayan Valley, Eastern Visayas, Zamboanga Peninsula, Northern Mindanao, ARMM and Caraga.
Fishing operations in marine waters were hampered by different weather conditions that the country experienced during the quarter. Among the three (3) major island groups, Luzon recorded the biggest slump in production at 7.97 percent , equivalent to 8,817.10 metric tons, followed by Visayas at 2.00 percent or 1,512.25 metric tons and Mindanao at 0.75 percent or 675.10 metric tons.
By province, Palawan, Batangas, Quezon, Capiz and Camarines Norte lost huge quantities of fish unloadings. Fishing activities by municipal fishermen slowed down during the quarter. Meager catch of various species was observed in different provinces that aside from the effects of weather condition on fisheries production, many fishermen believed that some fishing grounds were already being overfished.
The occurrence of typhoons Juaning, Kabayan, Lando, Mina, Pedring and Quiel led to temporary suspension of fishing operations, reduced number of trips , and fewer hours spent in the fishing grounds. Strong winds and big waves prevented fishermen, especially those with light and non-motorized boats, from exploring fishing grounds for schools of fish.
Other factors that affected fishing were the unstable price of oil and gas; use of destructive fishing methods and intrusion of commercial fishing vessels into municipal waters that still hound the sector. Lower volumes of catch from fish shelters and fish traps were also observed.
Inspite of the ill effects of typhoons, MIMAROPA, Western Visayas, Bicol Region, Zamboanga Peninsula and Eastern Visayas continued to be the top contributors to the output of marine municipal fisheries. The percentage share of these five (5) regions to the total marine fish production was 62.58. Among the provinces, the top gainers in volume of fish unloaded included Zamboanga Sibugay, Zamboanga City, Sorsogon, Eastern Samar, Samar, Basilan and Tawi-Tawi.
The following were the dominant species unloaded at municipal fish landing centers during the quarter: big-eyed scads (matang-baka), roundscads (galunggong), Indian sardines (tamban), frigate tuna (tulingan), yellowfin tuna (tambakol), skipjack (gulyasan) and Indian mackerel (alumahan).
On the other hand, production from communal bodies of water like rivers, lakes, dams, creeks, irrigation canals and swamps increased by 3.42 percent. The swelling of rivers during rainy season became beneficial to inland fishermen. Bigger sizes of milkfish and big head carp were caught in Laguna Lake due to frequent rains that induced growth of natural food. Species that spilled-out from fish pens and fish cages and eventually caught by fishermen were added to inland fisheries. Demand for “suso” also encouraged gatherers in Rizal and Laguna to maintain supply of these supplemental feeds for aquaculture species.
The prolific tilapia was the most common species caught in rivers and lakes due to regular dispersal of fingerlings by the Bureau of Fisheries and Aquatic Resources (BFAR) with the coordination of Local Government Units (LGUs). Rivers and marshes that recovered from the drought last year showed improvement in catch during the quarter. Rains also washed out some pollutants in rivers improving water quality needed for species reproduction. Rizal, Laguna, Maguindanao, North Cotabato, Sultan Kudarat, Lanao del Sur, Cagayan, Iloilo, Camarines Sur continued to contribute bigger shares to the production of inland fisheries (Table 3).
3

| FISHERIES SITUATIONER
improvement in catch during the quarter. Rains also washed out some pollutants in rivers improving water quality needed for species reproduction. Rizal, Laguna, Maguindanao, North Cotabato, Sultan Kudarat, Lanao del Sur, Cagayan, Iloilo, Camarines Sur continued to contribute bigger shares to the production of inland fisheries (Table 3).
AQUACULTURE
Aquaculture production of 498 thousand metric tons during the third quarter of 2011 was slightly lower by 0.52 percent from the previous year’s level. Production cuts were reported from seaweed farms and freshwater fish cages. On the other hand, harvests from brackishwater fishponds, freshwater fishponds and marine fish cages grew by 2.36 percent, 12.97 percent and 20.34 percent, respectively (Table 4).
Decreases in seaweed production were observed in Zamboanga Peninsula and Northern Mindanao. Seaweed farms in Zamboanga Peninsula were affected by the ice-ice disease and chemicals washed out from rice fields brought by floods specifically in Zamboanga Sibugay and Norte. Lack of planting materials was also monitored in Zamboanga Sur. In Northern Mindanao, the drop in seaweed production was due to low salinity and water pollution as a result of frequent rainfall in Lanao del Norte.
Reduced production in freshwater fish cages in Taal Lake, Batangas was an extended effect of fish kill that took place during the previous quarter. Moreover, local government’s preventive measures on fish kill such as dismantling of illegal fish cages hampered the growth on this aquafarm type.
Brackishwater fishpond production in Western Visayas had the highest increase from last year’s level. Good growth of milkfish due to good quality of fingerlings and availability of natural food are noted in Iloilo. In Negros Occidental, better market price boosted production.
Freshwater fishpond was another aquafarm type that showed positive growth during the quarter. The increase mainly came from Cagayan Valley and Central Luzon. Cagayan Valley provinces bounced back from the El Niño phenomenon experienced last year. In Isabela, sufficient water supply generated more harvests from fishponds under intensive management system. Meanwhile, good water condition, increased stocking density and abundant supply of natural food were the reasons for more harvests in Central Luzon, particularly, in Pampanga and Tarlac.
Finally, output from marine fish cages mostly in Davao Sur improved due to availability of fingerlings.
The following table shows the percentage change in production by aquafarm type from 2010 to 2011.
Type of Aquafarm/Environment % Increase (Decrease)
Brackishwater fishpond 2.36 Brackishwater fish pen (14.01) Brackishwater fish cage (7.94) Freshwater fishpond 12.97 Freshwater fish pen 1.41 Freshwater fish cage (10.84) Rice fish 27.53 Small farm reservoir 153.73 Marine fish pen (9.59) Marine fish cage 20.34 Oyster (2.83) Mussel (7.93) Seaweed (1.42)
4
| FISHERIES SITUATIONER
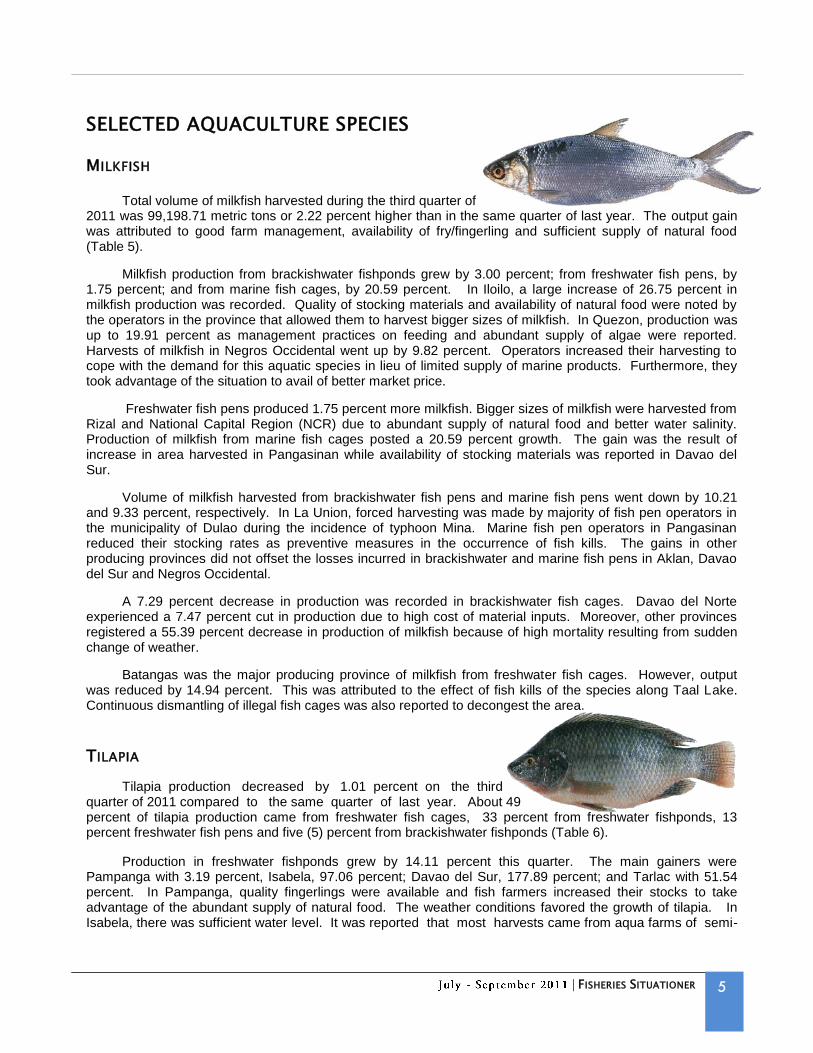
SELECTED AQUACULTURE SPECIES
MILKFISH
Total volume of milkfish harvested during the third quarter of 2011 was 99,198.71 metric tons or 2.22 percent higher than in the same quarter of last year. The output gain was attributed to good farm management, availability of fry/fingerling and sufficient supply of natural food (Table 5).
Milkfish production from brackishwater fishponds grew by 3.00 percent; from freshwater fish pens, by 1.75 percent; and from marine fish cages, by 20.59 percent. In Iloilo, a large increase of 26.75 percent in milkfish production was recorded. Quality of stocking materials and availability of natural food were noted by the operators in the province that allowed them to harvest bigger sizes of milkfish. In Quezon, production was up to 19.91 percent as management practices on feeding and abundant supply of algae were reported. Harvests of milkfish in Negros Occidental went up by 9.82 percent. Operators increased their harvesting to cope with the demand for this aquatic species in lieu of limited supply of marine products. Furthermore, they took advantage of the situation to avail of better market price.
Freshwater fish pens produced 1.75 percent more milkfish. Bigger sizes of milkfish were harvested from Rizal and National Capital Region (NCR) due to abundant supply of natural food and better water salinity. Production of milkfish from marine fish cages posted a 20.59 percent growth. The gain was the result of increase in area harvested in Pangasinan while availability of stocking materials was reported in Davao del Sur.
Volume of milkfish harvested from brackishwater fish pens and marine fish pens went down by 10.21 and 9.33 percent, respectively. In La Union, forced harvesting was made by majority of fish pen operators in the municipality of Dulao during the incidence of typhoon Mina. Marine fish pen operators in Pangasinan reduced their stocking rates as preventive measures in the occurrence of fish kills. The gains in other producing provinces did not offset the losses incurred in brackishwater and marine fish pens in Aklan, Davao del Sur and Negros Occidental.
A 7.29 percent decrease in production was recorded in brackishwater fish cages. Davao del Norte experienced a 7.47 percent cut in production due to high cost of material inputs. Moreover, other provinces registered a 55.39 percent decrease in production of milkfish because of high mortality resulting from sudden change of weather.
Batangas was the major producing province of milkfish from freshwater fish cages. However, output was reduced by 14.94 percent. This was attributed to the effect of fish kills of the species along Taal Lake. Continuous dismantling of illegal fish cages was also reported to decongest the area.
TILAPIA
Tilapia production decreased by 1.01 percent on the third quarter of 2011 compared to the same quarter of last year. About 49 percent of tilapia production came from freshwater fish cages, 33 percent from freshwater fishponds, 13 percent freshwater fish pens and five (5) percent from brackishwater fishponds (Table 6).
Production in freshwater fishponds grew by 14.11 percent this quarter. The main gainers were Pampanga with 3.19 percent, Isabela, 97.06 percent; Davao del Sur, 177.89 percent; and Tarlac with 51.54 percent. In Pampanga, quality fingerlings were available and fish farmers increased their stocks to take advantage of the abundant supply of natural food. The weather conditions favored the growth of tilapia. In Isabela, there was sufficient water level. It was reported that most harvests came from aqua farms of semi-intensive and intensive management culture. In Davao del Sur, area harvested increased, intensive farming management also adjusted and quality fingerlings were used under the continous dispersal program of the Bureau of Fisheries and Aquatic Resources (BFAR). In Tarlac, the opening of Parua River resulted in more harvest because of natural entry fingerlings in some fishponds. On the other hand, Nueva Ecija showed a slight decrease of 1.74 percent mainly due to tilapia fish kill in Gapan City as fingerlings fell prey to predators (turtles). Noted also was the unpredictable weather condition in the province during the quarter.
5

| FISHERIES SITUATIONER
intensive and intensive management culture. In Davao del Sur, area harvested increased, intensive farming management also adjusted and quality fingerlings were used under the continous dispersal program of the Bureau of Fisheries and Aquatic Resources (BFAR). In Tarlac, the opening of Parua River resulted in more harvest because of natural entry fingerlings in some fishponds. On the other hand, Nueva Ecija showed a slight decrease of 1.74 percent mainly due to tilapia fish kill in Gapan City as fingerlings fell prey to predators (turtles). Noted also was the unpredictable weather condition in the province during the quarter.
Freshwater fish pens produced 0.25 percent more this year. The increase was contributed by the major producing province of Rizal which production grew by 3.11 percent. The abundant supply of natural food in the lake enhanced the growth of tilapia that allowed operators to harvest bigger sizes of tilapia. However, production from Maguindanao, Sultan Kudarat, Laguna and Davao del Norte dropped. The output decrease of 2.14 percent in Maguindanao and 5.38 percent in Sultan Kudarat were caused by high mortality rate. The strong water current due to the frequent rainfall during the quarter affected the growth of tilapia. Lesser areas were utilized as some operators temporarily stopped aqua farming. Laguna’s low output was the result of decrease in area utilized because of financial difficulties. Meanwhile in Davao del Norte, it was reported that some dilapidated fish pens were dismantled and less stockings were done .
The volume of tilapia harvested in freshwater fish cages was reduced by 9.57 percent and the souces of decreases were from Batangas, Laguna, Camarines Sur, and South Cotabato. The decrement of 12.29 percent in Batangas was due to dismantling of illegal fish cages and the effect of fish kill in the province. In Laguna, a 2.08 percent decrease was attributed to lack of natural food and water disposal from hydro electric plant in the lake resulting to stunted growth of species. In Camarines Sur, production was down by 4.99 percent because of the municipal ordinance on fish cage zoning, presence of water hyacinths and overflowing of water due to flood. Tilapia production in South Cotabato declined by three (3) percent because of frequent heavy rains resulting in high mortality rate. On the other hand, the increase of 5.52 percent in Rizal was traced to abundance of natural food in the lake which enchanced the growth of tilapia.
Brackishwater fishpond production was up by 0.92 percent. The increase in Luzon provinces (Cagayan, Pampanga and Bataan) was the result of improved management practices on feeding and stocking resulting in bigger sizes produced. Early harvest was also reported in anticipation of coming typhoons. In Negros Occidental, more areas were utilized due to better market price and consumer preference for freshwater species that enabled the province to produce 2.39 percent more than last year’s level. Fish farmers in Zamboanga del Sur increased their production by 3.27 percent due to abundant supply of natural food and good water condition.
There were minimal harvests of tilapia from marine fish cages/pens in Bohol (municipalities of Dauis, Candiay and Calape) as most operators stopped their operations due to slow growth of the species.
Rice-fish farms registered an output increase of 0.65 metric ton from last year’s level. This was due to the usage of quality fingerlings and the frequent rains during the third quarter enhanced the growth of tilapia that resulted to bigger sizes harvested.
Tilapia production from small farm reservoirs (SFRs) showed a 159 percent increase this quarter
compared to the same quarter last year. Luzon provinces reported of new harvested areas due to continous fingerling dispersal from BFAR and sufficient water of the reservoirs. It was noted that tilapia harvests in Bohol and North Cotabato were of bigger sizes due to sufficient water level. Also, some operators in Carmen, Bohol culturing tilapia in SFRs resumed operations.
6

| FISHERIES SITUATIONER
TIGER PRAWN
Total production of tiger prawn for the third quarter of 2011 was 2.07 percent less than the same quarter of 2010 (Table 7). Of the top five (5) producing provinces, only Lanao del Norte suffered a setback of 12.62 percent in tiger prawn production since there was a reduction in area operated. Also, the frequent rainfall in the province during the quarter resulted in low salinity, thus, smaller sizes of tiger prawn harvested.
On the contrary, the growth in production in Misamis Occidental was the result of re-operation of fishponds because of high demand for this species. Meanwhile in Pampanga, increase in area harvested was reported. In Pangasinan and Zamboanga del Sur, proper feeding and high survival rate augmented the production of tiger prawn for this quarter. However, the combined increases in production of the top four (4) provinces did not offset the negative performance of tiger prawn this quarter of 2011.
MUD CRAB
Compared to third quarter of 2010, mud crab production at 3,274.9618
metric tons was 10.28 percent higher this quarter of 2011. This was brought about by bigger sizes of mud crab and more area harvested, specifically, in Capiz, Lanao del Norte and Misamis Occidental because of high demand and good price in the market. In Pampanga, the availability of quality crablets encouraged mud crab growers to increase their stocking density.
Meanwhile, of the top producing provinces of mud crab, only Sorsogon recorded production cut since stocks were washed out during typhoon Juaning (Table 7).
CARP
Production was 2.78 percent higher this 2011 than in 2010 and
this was contributed by fish pen, fish cage and small farm reservoir production. There was sufficient organic food in Laguna Lake that enhanced growth of carps in Rizal, the top contributor, and in Metro Manila. Laguna, also a major producer, however, recorded a production decline due to slower growth of carps. In Camarines Sur, fish cages had less harvest of carps of natural entry. Small farm reservoir production soared by 55.82 percent as Cagayan and Bohol operators harvested more carps of natural entry. Reservoir water level was normal or sufficient, when in 2010, some farms had low water level or dried up due to El Nino. The initial harvest of 0.20 metric ton of carps in North Cotabato reservoir also accounted for the high production increment (Table 7).
Production of carps from rice fish farm went down this 2011 as Pangasinan, the sole producing province, reported smaller sizes of natural entry carps. The decrease in fishpond production of carp was even bigger, by 29.56 percent. This was accounted for by the 34.60 percent drop in Lanao del Norte, the top producing province of carps in fishponds. Operators here reduced area utilized due to frequent rainfall. Other fishpond producing provinces also recorded decreases in harvests this year. Only Pampanga and Nueva Ecija, major fishpond producing provinces, recorded production increases.
CATFISH
Catfish production grew by 1.34 percent during the third quarter of 2011 compared to the same quarter of last year. About 99 percent of catfish production came from f reshwater fishponds. The remaining one (1) percent was production in small farm reservoirs (SFRs). The 8.42 percent increase in Iloilo and 58.30 percent in Nueva Ecija were traced to sufficient water level. This allowed farmers to stock more than before to avail of market demand. In Davao City, the 4.35 percent output increment came about because of the shifting of tilapia to catfish culture. The 4.02 percent output increase in Maguindanao was attributed to the early harvest due to typhoon Pedring. On the contrary, production of catfish in Bulacan decreased by 4.76 percent due to limited supply of fry and fingerlings because of declining number of breeders. It was also reported that some operators will harvest their stocks in November.
7

| FISHERIES SITUATIONER
Iloilo and 58.30 percent in Nueva Ecija were traced to sufficient water level. This allowed farmers to stock more than before to avail of market demand. In Davao City, the 4.35 percent output increment came about because of the shifting of tilapia to catfish culture. The 4.02 percent output increase in Maguindanao was attributed to the early harvest due to typhoon Pedring. On the contrary, production of catfish in Bulacan decreased by 4.76 percent due to limited supply of fry and fingerlings because of declining number of breeders. It was also reported that some operators will harvest their stocks in November.
The volume of catfish harvested in small farm reservoirs (SFRs) grew from 0.65 to 1.36 metrric tons this quarter which was higher by 110.17 percent compared to last year’s level. The increment was attributed to the normal water level and availability of fingerlings which was observed in all catfish producing provinces (Table 7).
SEAWEED
Seaweed production slid by 1.42 percent this quarter compared to same quarter of last year. Among the top five (5) producing provinces, Zamboanga Sibugay recorded a 20.12 percent drop in production. Most of the seaweed farms in the area were affected by ice-ice disease. There were also reports that mud and washed-out chemicals from rice fields brought by floods caused seaweed plants to rot (Table 8).
On the other hand, additional input assistance like distribution of planting materials, plastic and nylon ropes from Bureau of Fisheries and Aquatic Resources (BFAR) and Local Government Units (LGUs), encouraged farmers in Palawan to plant more and increase their harvest area. The weather conditions that prevailed during the
quarter, proper management and lesser incidence of diseases resulted in better quality of seaweed harvested in Tawi-Tawi and Sulu. Expansion of area harvested in the municipalities of Hingotanan East and West, Bien Unido, and the adoption of improved farming technology “tumbo-tumbo” (spider web farming method) for seaweed culture in Maribojoc and Mabini, further improved production in Bohol.
OYSTER
Production of oyster was higher by 2.53 percent compared to last year’s level. The growth in production was contributed by Negros Oriental, Bulacan, Capiz and Bohol. Favorable weather conditions and good water quality enhanced the growth of oyster in these provinces which resulted in good quality and bigger sizes of oyster harvested. Longer culture period of oyster was observed in Negros Oriental. Continuous demand and good price in the market motivated operators in Bulacan to harvest their stocks more frequent (Table 8).
In La Union, the low production of oyster was attributed to lesser spats produced due to predators such as small mussels that attached themselves to oyster shells and environment stress caused by sudden change in water temperature.
MUSSEL
Mussel production was up by 7.93 percent this quarter. Samar managed to put up a 14.72 percent growth from last year’s level. Demand from local markets and other provinces had been constantly increasing and farmers took advantage of this. Good quality and bigger sizes of mussels harvested during the quarter were due to good weather conditions coupled with proper farm management. There were also some operators which increased their stocks. Those that were harvested in Cavite and Bataan were just left over of the previous quarter’s stocks. There were also reports that some bamboo stakes were destroyed by strong current brought about by series of typhoons (Table 8).
8

| F
ISH
ER
IES S
ITU
AT
ION
ER
9
(Metric Tons)
Sub-Sector Change Change Change Change
2010 2011 11/10 2010 2011 11/10 2010 2011 11/10 2010 2011 11/10
PHILIPPINES 1,122,656.95 1,059,062.67 (5.66) 294,138.49 242,398.36 (17.59) 328,120.34 318,882.27 (2.82) 500,398.12 497,782.04 (0.52)
NCR 26,417.54 18,331.99 (30.61) 23,807.79 15,817.23 (33.56) 1,817.56 1,670.07 (8.11) 792.19 844.69 6.63
CAR 706.67 773.86 9.51 212.67 232.53 9.34 494.00 541.33 9.58
I 22,836.40 21,994.98 (3.68) 1,281.20 837.29 (34.65) 8,521.61 7,748.95 (9.07) 13,033.59 13,408.74 2.88
II 14,364.72 15,409.25 7.27 4,152.91 3,994.74 (3.81) 7,551.26 7,948.00 5.25 2,660.55 3,466.51 30.29
III 39,840.27 39,042.79 (2.00) 831.51 682.42 (17.93) 9,962.48 9,563.49 (4.00) 29,046.28 28,796.88 (0.86)
IV-A 121,072.00 113,525.09 (6.23) 18,563.62 15,842.02 (14.66) 37,700.57 35,188.44 (6.66) 64,807.81 62,494.63 (3.57)
IV-B 103,129.72 100,659.02 (2.40) 11,591.23 9,839.64 (15.11) 45,424.78 40,306.64 (11.27) 46,113.71 50,512.74 9.54
V 70,300.64 70,554.33 0.36 16,499.55 16,560.06 0.37 34,346.40 34,055.74 (0.85) 19,454.69 19,938.53 2.49
VI 112,196.96 113,968.85 1.58 25,547.59 23,725.20 (7.13) 41,080.92 40,450.86 (1.53) 45,568.45 49,792.79 9.27
VII 52,394.56 51,712.50 (1.30) 9,372.86 8,735.93 (6.80) 11,733.03 11,294.01 (3.74) 31,288.67 31,682.56 1.26
VIII 49,141.81 51,105.16 4.00 12,774.51 12,312.52 (3.62) 25,192.33 25,300.12 0.43 11,174.97 13,492.52 20.74
IX 185,365.85 143,897.91 (22.37) 84,228.36 55,131.67 (34.55) 30,900.85 31,019.15 0.38 70,236.64 57,747.09 (17.78)
X 44,313.06 42,844.58 (3.31) 10,221.76 9,628.37 (5.81) 11,256.83 12,024.99 6.82 22,834.47 21,191.22 (7.20)
XI 15,731.14 15,760.32 0.19 2,768.15 3,374.35 21.90 7,075.05 5,271.35 (25.49) 5,887.94 7,114.62 20.83
XII 65,979.00 59,101.84 (10.42) 50,147.05 43,219.19 (13.82) 11,117.51 10,916.83 (1.81) 4,714.44 4,965.82 5.33
Caraga 25,751.84 25,029.89 (2.80) 2,009.12 1,613.09 (19.71) 17,335.93 17,381.55 0.26 6,406.79 6,035.25 (5.80)
ARMM 173,114.77 175,350.31 1.29 20,341.28 21,084.64 3.65 26,890.56 28,509.55 6.02 125,882.93 125,756.12 (0.10)
P - Preliminary
Table 1. Fisheries: Volume of Fish Production by Sub-Sector, by Region, Philippines, July - September 2010 - 2011P
Fisheries Commercial Municipal Aquaculture%% % %Region/

| F
ISH
ER
IES S
ITU
AT
ION
ER
1
0
(Metric Tons)
Change Change Change Change Change
2010 2011 11/10 2010 2011 11/10 2010 2011 11/10 2010 2011 11/10 2010 2011 11/10
PHILIPPINES 294,138.49 242,398.36 (17.59) 80,585.88 54,277.83 (32.65) 62,414.45 52,296.93 (16.21) 24,967.84 24,060.52 (3.63) 126,170.32 111,763.08 (11.42)
NCR 23,807.79 15,817.23 (33.56) 22,876.05 14,874.08 (34.98) 931.74 943.15 1.22
CAR
I 1,281.20 837.29 (34.65) 144.58 94.31 (34.77) 1,136.62 742.98 (34.63)
II 4,152.91 3,994.74 (3.81) 4,152.91 3,994.74 (3.81)
III 831.51 682.42 (17.93) 654.97 440.81 (32.70) 24.46 21.91 (10.43) 152.08 219.70 44.46
IV-A 18,563.62 15,842.02 (14.66) 3,170.49 2,212.99 (30.20) 1,849.29 1,747.40 (5.51) 13,543.84 11,881.63 (12.27)
IV-B 11,591.23 9,839.64 (15.11) 11,591.23 9,839.64 (15.11)
V 16,499.55 16,560.06 0.37 3,221.00 3,113.00 (3.35) 5,238.55 5,379.14 2.68 8,040.00 8,067.92 0.35
VI 25,547.59 23,725.20 (7.13) 1,814.28 1,181.94 (34.85) 947.20 1,188.37 25.46 6,278.05 6,086.50 (3.05) 16,508.06 15,268.39 (7.51)
VII 9,372.86 8,735.93 (6.80) 572.16 512.47 (10.43) 8,800.70 8,223.46 (6.56)
VIII 12,774.51 12,312.52 (3.62) 240.40 253.75 5.55 2.10 5.25 150.00 12,532.01 12,053.52 (3.82)
IX 84,228.36 55,131.67 (34.55) 58,369.13 39,121.96 (32.97) 1,393.61 1,442.70 3.52 7,615.09 6,379.01 (16.23) 16,850.53 8,188.00 (51.41)
X 10,221.76 9,628.37 (5.81) 2,362.70 2,146.22 (9.16) 7,859.06 7,482.15 (4.80)
XI 2,768.15 3,374.35 21.90 369.13 236.39 (35.96) 855.48 473.73 (44.62) 1,025.44 1,782.62 73.84 518.10 881.61 70.16
XII 50,147.05 43,219.19 (13.82) 15,916.97 9,929.98 (37.61) 33,027.04 32,010.75 (3.08) 1,203.04 1,278.46 6.27
Caraga 2,009.12 1,613.09 (19.71) 2,009.12 1,613.09 (19.71)
ARMM 20,341.28 21,084.64 3.65 20,341.28 21,084.64 3.65
P - Preliminary
%PFDA TraditionalLGU
Table 2. Commercial Fisheries: Volume of Fish Unloading by Region, by Type of Landing Center, Philippines, July - September 2010 - 2011P
RegionCommercial Private
% % % %
| F
ISH
ER
IES S
ITU
AT
ION
ER
1
1
% % %
Change Change Change
2010 2011 11/10 2010 2011 11/10 2010 2011 11/10
PHILIPPINES 328,120.34 318,882.27 (2.82) 276,498.68 265,494.29 (3.98) 51,621.66 53,387.98 3.42
NCR 1,817.56 1,670.07 (8.11) 1,817.56 1,670.07 (8.11)
CAR 212.67 232.53 9.34 212.67 232.53 9.34
I 8,521.61 7,748.95 (9.07) 8,023.87 7,272.78 (9.36) 497.74 476.17 (4.33)
II 7,551.26 7,948.00 5.25 4,429.66 4,626.79 4.45 3,121.60 3,321.21 6.39
III 9,962.48 9,563.49 (4.00) 6,534.13 6,454.03 (1.23) 3,428.35 3,109.46 (9.30)
IV-A 37,700.57 35,188.44 (6.66) 11,746.20 9,196.80 (21.70) 25,954.37 25,991.64 0.14
IV-B 45,424.78 40,306.64 (11.27) 45,132.82 40,067.87 (11.22) 291.96 238.77 (18.22)
V 34,346.40 34,055.74 (0.85) 32,886.01 32,464.82 (1.28) 1,460.39 1,590.92 8.94
VI 41,080.92 40,450.86 (1.53) 38,930.44 37,736.08 (3.07) 2,150.48 2,714.78 26.24
VII 11,733.03 11,294.01 (3.74) 11,685.13 11,245.60 (3.76) 47.90 48.41 1.06
VIII 25,192.33 25,300.12 0.43 24,900.71 25,022.35 0.49 291.62 277.77 (4.75)
IX 30,900.85 31,019.15 0.38 30,626.00 30,849.05 0.73 274.85 170.10 (38.11)
X 11,256.83 12,024.99 6.82 10,295.13 10,866.27 5.55 961.70 1,158.72 20.49
XI 7,075.05 5,271.35 (25.49) 7,029.79 5,213.82 (25.83) 45.26 57.53 27.11
XII 11,117.51 10,916.83 (1.81) 5,018.66 4,506.70 (10.20) 6,098.85 6,410.13 5.10
Caraga 17,335.93 17,381.55 0.26 16,284.20 16,466.74 1.12 1,051.73 914.81 (13.02)
ARMM 26,890.56 28,509.55 6.02 21,158.37 21,834.52 3.20 5,732.19 6,675.03 16.45
P - Preliminary
Table 3. Municipal Fish Production by Region, Philippines, July - September 2010 - 2011P
MunicipalRegion
Marine Inland
(Metric Tons)

| F
ISH
ER
IES S
ITU
AT
ION
ER
1
2
% Change % Change % Change % Change % Change % Change % Change
2010 2011 11/10 2010 2011 11/10 2010 2011 11/10 2010 2011 11/10 2010 2011 11/10 2010 2011 11/10 2010 2011 11/10
PHILIPPINES 500,398.12 497,782.04 (0.52) 85,337.38 87,350.76 2.36 159.69 137.31 (14.01) 173.04 159.29 (7.94) 13,962.64 15,773.73 12.97 13,368.74 13,556.75 1.41 36,836.42 32,843.69 (10.84)
NCR 792.19 844.69 6.63 69.53 61.46 (11.61) - - - - - - - - - 500.17 523.78 4.72 208.25 218.90 5.12
CAR 494.00 541.33 9.58 - - - - - - - - - 340.75 401.51 17.83 - - - 153.25 139.81 (8.77)
I 13,033.59 13,408.74 2.88 5,488.43 5,361.41 (2.31) 143.62 125.74 (12.45) 34.95 9.03 (74.17) 284.24 210.00 (26.12) 0.09 - - 0.70 0.50 (28.93)
II 2,660.55 3,466.51 30.29 691.07 744.75 7.77 - - - 24.89 30.94 24.30 1,330.56 2,068.68 55.47 - - - 59.31 72.90 22.91
III 29,046.28 28,796.88 (0.86) 18,814.75 17,892.68 (4.90) - - - - - - 9,340.05 9,919.29 6.20 - - - - - -
IVA 64,807.81 62,494.63 (3.57) 3,559.51 4,132.08 16.09 - - - - - - 285.82 267.93 (6.26) 9,371.70 9,705.76 3.56 33,962.57 30,064.00 (11.48)
IVB 46,113.71 50,512.74 9.54 1,348.51 1,380.99 2.41 - - - - - - 161.99 181.30 11.92 - - - - - -
V 19,454.69 19,938.53 2.49 1,449.51 1,514.59 4.49 - - - - - - 678.96 685.37 0.94 - - - 2,100.10 2,003.86 (4.58)
VI 45,568.45 49,792.79 9.27 28,579.62 31,710.15 10.95 4.98 5.86 17.70 1.85 1.60 (13.90) 234.98 323.11 37.50 - - - - - -
VII 31,288.67 31,682.56 1.26 2,725.72 2,262.60 (16.99) - - - 1.37 2.99 117.71 32.36 41.69 28.83 - - - 1.87 0.79 (57.55)
VIII 11,174.97 13,492.52 20.74 2,040.32 2,916.73 42.95 5.20 4.38 (15.81) 4.57 4.21 (7.95) 45.98 55.05 19.73 0.91 1.24 37.25 13.73 16.84 22.58
IX 70,236.64 57,747.09 (17.78) 5,540.13 4,762.89 (14.03) - - - 0.17 0.10 (42.44) 46.52 36.07 (22.46) 0.30 0.65 114.99 - - -
X 22,834.47 21,191.22 (7.20) 10,858.45 10,395.79 (4.26) - - - 292.29 248.17 (15.10) - - - - 0.04 -
XI 5,887.94 7,114.62 20.83 1,359.50 1,195.74 (12.05) 0.28 0.23 (16.57) 11.79 10.91 (7.47) 522.18 959.15 83.68 4.35 2.21 (49.07) 0.83 0.50 (39.66)
XII 4,714.44 4,965.82 5.33 1,859.53 2,069.39 11.29 - - - - - - 217.53 234.90 7.99 1,818.84 1,684.17 (7.40) 208.77 202.61 (2.95)
Caraga 6,406.79 6,035.25 (5.80) 685.40 659.13 (3.83) 5.62 1.11 (80.34) 93.43 99.52 6.51 47.92 39.87 (16.82) - - - 18.46 16.13 (12.60)
ARMM 125,882.93 125,756.12 (0.10) 267.42 290.36 8.58 - - - - - - 100.49 101.64 1.14 1,672.38 1,638.94 (2.00) 108.57 106.81 (1.62)
% Change % Change % Change % Change % Change % Change % Change
2010 2011 11/10 2010 2011 11/10 2010 2011 11/10 2010 2011 11/10 2010 2011 11/10 2010 2011 11/10 2010 2011 11/10
PHILIPPINES 3,245.61 2,934.23 (9.59) 9,819.49 11,816.88 20.34 3,589.78 3,691.21 2.83 3,265.18 3,524.27 7.93 330,613.44 325,929.32 (1.42) 2.49 3.18 27.53 24.20 61.41 153.73
NCR - - - - - - - - - 14.24 40.55 184.68 - - - - - - - - -
CAR - - - - - - - - - - - - - - - - - - - - -
I 2,372.94 2,079.17 (12.38) 4,504.85 5,425.39 20.43 154.59 146.18 (5.44) 42.31 44.44 5.05 4.47 4.38 (1.89) 2.37 2.48 4.63 0.02 - -
II - - - - - - 125.18 111.75 (10.73) - - - 411.12 383.41 (6.74) - - - 18.42 54.08 193.62
III - - - 338.72 398.88 17.76 156.57 172.43 10.13 300.74 284.08 (5.54) 95.00 129.00 35.79 - - - - 0.51 13.86
IVA - - - 0.16 0.14 (12.39) 25.38 18.75 (26.14) 91.91 64.99 (29.29) 17,510.76 18,240.98 4.17 - - - - - -
IVB - - - 8.29 6.42 (22.53) - - - - - - 44,594.92 48,944.03 9.75 - - - - - -
V 54.75 79.44 45.09 12.92 13.88 7.44 - - - - - - 15,158.45 15,641.40 3.19 - - - - - -
VI 173.03 167.43 (3.24) 28.17 41.31 46.67 2,653.55 2,830.80 6.68 973.75 979.49 0.59 12,917.44 13,731.42 6.30 0.12 0.70 480.67 0.97 0.94 (2.71)
VII 32.17 0.84 (97.40) 114.95 29.19 (74.60) 262.98 289.12 9.94 - - - 28,115.27 29,052.70 3.33 - - - 1.98 2.64 32.88
VIII 15.35 1.41 (90.84) 1,299.35 895.69 (31.07) 5.80 7.46 28.68 1,842.16 2,110.72 14.58 5,901.59 7,478.80 26.73 - - - - - -
IX - - - 13.02 26.50 103.45 170.32 79.58 (53.28) - - - 64,466.17 52,841.29 (18.03) - - - - - -
X - - - 526.86 611.77 16.12 0.25 0.24 (4.00) 0.07 - - 11,156.28 9,935.09 (10.95) - - - 0.28 0.12 (57.69)
XI 590.98 601.75 1.82 2,291.86 3,594.88 56.85 35.17 34.89 (0.77) - - - 1,071.01 714.35 (33.30) - - - - - -
XII - - - 529.38 635.12 19.97 - - - - - - 78.30 136.50 74.33 - - - 2.09 3.13 49.88
Caraga 5.64 3.43 (39.19) 95.92 93.55 (2.47) - - - - - - 5,454.39 5,122.51 (6.08) - - - - - -
ARMM 0.75 0.77 3.31 55.04 44.14 (19.82) - - - - - - 123,678.27 123,573.46 (0.08) - - - - - -
P - Preliminary
Rice Fish SFRRegion
Marine Fish Pen Marine Fish Cage Oyster Mussel Seaweed
Table 4. Aquaculture Production by Type of Aquafarm, by Environment and by Region, July - September 2009 - 2010P
(Metric Tons)
RegionAquaculture Brackishwater Fishpond Brackishwater Fish Pen Brackishwater Fish Cage Freshwater Fishpond Freshwater Fish Pen Freshwater Fish Cage

| FISHERIES SITUATIONER 13
Philippines, July - September 2010 - 2011P
Culture Environment/ % Change
Type of Aquafarm/Province 11/10
PHILIPPINES 97,043.58 99,198.71 2.22
Brackishwater Fishpond 67,516.85 69,544.33 3.00
Capiz 9,843.93 10,445.39 6.11
Iloilo 8,100.00 10,266.75 26.75
Bulacan 8,100.88 7,075.31 (12.66)
Negros Occidental 6,345.10 6,968.19 9.82
Pangasinan 4,600.09 4,430.81 (3.68)
Quezon 3,301.39 3,958.69 19.91
Other Provinces 27,225.47 26,399.19 (3.03)
Brackishwater Fish pen 151.07 135.65 (10.21)
La Union 136.06 124.22 (8.71)
Aklan 4.88 5.54 13.61
Other Provinces 10.14 5.89 (41.87)
Brackishwater Fish cage 135.28 125.42 (7.29)
Agusan del Norte 88.97 95.01 6.78
Davao del Norte 11.79 10.91 (7.47)
Cagayan 6.59 7.05 6.92
Other Provinces 27.92 12.45 (55.39)
Freshwater Fish pen 5,493.57 5,589.88 1.75
Rizal 3,840.87 4,001.42 4.18
Sultan Kudarat 796.91 717.22 (10.00)
NCR 500.17 523.78 4.72
Other Provinces 355.62 347.47 (2.29)
Freshwater Fish cage 10,887.11 9,262.85 (14.92)
Batangas 10,866.35 9,242.92 (14.94)
Other Provinces 20.76 19.93 (3.96)
Marine Fish pen 3,230.83 2,929.48 (9.33)
Pangasinan 2,372.94 2,079.17 (12.38)
Davao del Sur 590.88 601.58 1.81
Negros Occidental 74.45 108.68 45.99
Other Provinces 192.56 140.04 (27.27)
Marine Fish cage 9,628.87 11,611.10 20.59
Pangasinan 4,481.10 5,407.79 20.68
Davao Sur 1,824.66 3,217.24 76.32
Samar 1,100.00 682.99 (37.91)
Other Provinces 2,223.11 2,303.07 3.60
P - Preliminary
Table 5. Aquaculture: Milkfish Production of Top Producing
Provinces by Culture Environment and Type of Aquafarm,
2010 2011
(Metric Tons)

| FISHERIES SITUATIONER 14
Table 6. Aquaculture: Tilapia Production of Top Producing Provinces,
by Culture Environment and Type of Aquafarm, Philippines,
July - September 2010 - 2011P
(Metric Tons)
PHILIPPINES 46,458.08 45,990.84 (1.01)
Brackishwater Fishpond 2,241.70 2,262.29 0.92Cagayan 600.59 649.05 8.07Pampanga 412.57 424.91 2.99Zamboanga del Sur 169.52 175.06 3.27Negros Occidental 148.41 151.95 2.39Bataan 114.77 115.95 1.02Other Provinces 795.85 745.37 (6.34)
Brackishwater Fishpen/Cage 31.24 29.54 (5.46)Cagayan 16.46 21.91 33.12Ilocos Norte 9.98 7.38 (26.00)La Union 4.55 Ilocos Sur 0.26 0.24 (6.58)
Freshwater Fishpond 13,183.41 15,043.17 14.11Pampanga 6,903.04 7,123.25 3.19Nueva Ecija 1,045.79 1,027.60 (1.74)Isabela 578.02 1,139.07 97.06Tarlac 460.52 697.88 51.54Davao del Sur 270.74 752.37 177.89Other Provinces 3,925.28 4,303.01 9.62
Freshwater Fish cage 25,053.69 22,657.03 (9.57)Batangas 18,876.36 16,556.45 (12.29)Laguna 2,330.97 2,282.49 (2.08)Camarines Sur 1,984.04 1,885.04 (4.99)Rizal 1,019.49 1,075.77 5.52South Cotobato 207.27 201.05 (3.00)Other Provinces 635.56 656.23 3.25
Freshwater Fish pen 5,924.48 5,939.19 0.25Rizal 3,350.69 3,454.90 3.11Maguindanao 1,373.14 1,343.75 (2.14)Sultan Kudarat 1,021.93 966.95 (5.38)Laguna 171.82 168.57 (1.89)Davao del Norte 4.35 2.21 49.07Other Provinces 2.55 2.80 9.80
Marine Fishcage/Pen 0.05 All Provinces 0.05
Rice Fish 1.32 1.97 49.24All Provinces 1.32 1.97 49.24
Small Farm Reservoir 22.24 57.61 159.00Quirino 10.50 41.74 297.50Cagayan 3.87 5.10 31.91Isabela 2.90 4.98 71.67Bohol 1.90 2.53 33.55North Cotabato 1.83 2.18 19.19Other Provinces 1.25 1.08 (13.80)
P - Preliminary
% Change
11/10
Culture Environment/
Type of Aquafarm/Province2010 2011

| FISHERIES SITUATIONER
15
TIGER PRAWN 10,188.18 9,977.60 (2.07) Brackishwater Fishpond
Pampanga 2,867.34 2,963.97 3.37 Lanao del Norte 4,034.14 3,525.03 (12.62) Misamis Occidental 580.79 729.06 25.53 Zamboanga del Sur 626.68 644.98 2.92 Pangasinan 302.33 316.17 4.58 Other Provinces 1,776.92 1,798.39 1.21
MUD CRAB 2,978.64 3,274.96 9.95 Brackishwater Fishpond 2,969.54 3,274.96 10.28
Pampanga 1,124.36 1,159.89 3.16 Lanao del Norte 883.46 1,100.17 24.53 Misamis Occidental 292.33 307.59 5.22 Capiz 55.46 94.77 70.88 Sorsogon 94.83 92.60 (2.36) Other Provinces 519.11 519.95 0.16
Marine Fish Cage 9.10 0.00 (100.00) Eastern Samar 9.00 (100.00) Camiguin 0.10 (100.00)
CARP 2,928.81 3,010.35 2.78 Freshwater Fishpond 82.64 58.21 (29.56)
Lanao del Norte 66.89 43.74 (34.60) Nueva Ecija 4.25 5.39 26.74 Pampanga 3.72 3.97 6.60 Other Provinces 7.78 5.11 (34.30)
Freshwater Fish Pen/Cage 2,845.43 2,951.19 3.72 Rizal 2,549.67 2,671.23 4.77 Laguna 259.04 242.29 (6.47) Metro Manila 34.04 35.66 4.75 Other Provinces 2.68 2.01 (24.84)
Small Farm Reservoir 0.46 0.71 55.82 Cagayan 0.43 0.48 11.62
North Cotabato 0.20Other Provinces 0.03 0.03 18.08
Rice Fish 0.28 0.24 (14.29) Pangasinan 0.28 0.24 (14.29)
CATFISH 524.61 531.64 1.34 Freshwater Fishpond 523.96 530.28 1.21
Iloilo 100.00 108.42 8.42 Davao City 63.06 65.80 4.35 Maguindanao 59.55 61.95 4.02 Bulacan 58.54 55.75 (4.76) Nueva Ecija 32.98 52.21 58.30 Other Provinces 209.83 186.15 (11.29)
Small Farm Reservoir 0.65 1.36 110.17 Isabela 0.09 0.32 250.00 North Cotabato 0.06 0.20 233.33 Quirino 0.05 0.23 339.92 Cagayan 0.12 0.16 31.89 Guimaras 0.30 0.23 (25.00) Bohol 0.02 0.03 20.00 Iloilo - 0.20
P - Preliminary
Species/Province 2010 2011
Table 7. Aquaculture: Tiger Prawn, Mud Crab, Carp and Catfish Production of Top Producing Provinces by Culture Environment and Type of Aquafarm,
Philippines, July - September 2010 - 2011P
(Metric Tons)
% Change
11/10

| FISHERIES SITUATIONER
16
Philippines, July - September 2010 - 2011P
Seaweed 330,613.44 325,929.32 (1.42)
Tawi-Tawi 58,190.16 58,964.09 1.33
Sulu 46,862.56 47,368.68 1.08
Palawan 42,291.66 45,973.48 8.71
Zamboanga Sibugay 40,236.34 32,140.79 (20.12)
Bohol 26,400.63 26,995.16 2.25
Other Provinces 116,632.08 114,487.13 (1.84)
Oyster 3,589.78 3,691.21 2.83
Capiz 2,456.18 2,617.31 6.56
Bulacan 152.57 168.60 10.51
Bohol 146.72 148.85 1.45
Negros Oriental 116.27 140.27 20.65
La Union 138.32 130.42 (5.71)
Other Provinces 579.73 485.76 (16.21)
Mussel 3,265.18 3,524.27 7.93
Samar 1,839.96 2,110.72 14.72
Capiz 564.61 594.26 5.25
Negros Occidental 320.60 324.26 1.14
Bataan 300.74 284.08 (5.54)
Cavite 91.91 64.99 (29.29)
Other Provinces 147.35 145.96 (0.94)
P - Preliminary
Table 8. Aquaculture: Mariculture Production by Species and by Province,
(Metric Tons)
Species/Province 2010 2011% Change
11/10