D 5.B New Wind Propulsion Technology A Literature Review ...
38
Project acronym: WASP (Wind Assisted Ship Propulsion) Project full title: Run Wind Propulsion Technology real life trials on sea going ships in operation>showcase proven concepts>market adoption>green sea transport Project No. 38-2-6-19 Coordinator: Netherlands Maritime Technology Foundation D 5.B New Wind Propulsion Technology A Literature Review of Recent Adoptions
Transcript of D 5.B New Wind Propulsion Technology A Literature Review ...

Project acronym: WASP (Wind Assisted Ship Propulsion) Project full title: Run Wind Propulsion Technology real life trials on sea going ships in
operation>showcase proven concepts>market adoption>green sea transport
Project No. 38-2-6-19 Coordinator: Netherlands Maritime Technology Foundation
D 5.B
New Wind Propulsion Technology
A Literature Review of Recent
Adoptions
D 5.B New Wind Propulsion Technology - A Literature Review of Recent Adoptions
2
Deliverable data
Deliverable No 5.B.
Deliverable Title New Wind Propulsion Technology – A Literature Review of Recent Adoptions
Work Package no: title WP4: Policy and viable business
Deliverable type Report/strategy
Lead beneficiary KLU
Responsible author Todd Chou
Co-authors Vasileios Kosmas, Katharina Renken, Michele Acciaro
Date of delivery 24-09-2020
Approved Name Date
Peer reviewer 1 Roberto Rivas Hermann (NOY) 10-09-2020
Peer reviewer 2 Roberto Rivas (NUY) 10-09-2220
Peer reviewer 3 Danitsja van Heusden-van Winden (NMT) 11-09-2020
Peer reviewer 4 Gavin Allwright (IWSA) 15-09-2020
Document history
Version Date Description
1 07-09-2020 First draft
2 24-09-2020 Final version

D 5.B New Wind Propulsion Technology - A Literature Review of Recent Adoptions
i
Table of Contents
Table of Figures ........................................................................................................................................ii
Table of Tables......................................................................................................................................... iii
List of symbols and abbreviations ........................................................................................................... iv
1. Introduction ..................................................................................................................................... 1
2. The transition towards decarbonisation ......................................................................................... 4
3. WASP Technology and alternative fuels.......................................................................................... 7
4. Development of wasp technology................................................................................................... 9
5. Economic impact - fuel saving ....................................................................................................... 15
6. Fuel-saving considerations ............................................................................................................ 21
7. Technology-specific considerations .............................................................................................. 22
8. Concluding remarks ....................................................................................................................... 24
Bibliography ........................................................................................................................................... 26

D 5.B New Wind Propulsion Technology - A Literature Review of Recent Adoptions
ii
Table of Figures
Figure 1: the four phases and three dimensions of transition ................................................................. 5
Figure 2: rotor – flettner rotor ................................................................................................................... 9
Figure 3: towing kite – airseas ............................................................................................................... 10
Figure 4: suction wings .......................................................................................................................... 10
Figure 5: rigid sail/wingsail ................................................................................................................... 11
Figure 6: soft sail – dynarig ................................................................................................................... 11
Figure 7: wind turbine ............................................................................................................................ 11
Figure 8: hull sail – vindskip .................................................................................................................. 12
Figure 9: heavy fuel oil price from february 2015 to february 2020 ...................................................... 15
D 5.B New Wind Propulsion Technology - A Literature Review of Recent Adoptions
iii
Table of Tables
Table 1: review of recent studies on different abatement options in shipping ........................................ 7
Table 2: recent wasp adoptions of commercial ships............................................................................ 13
Table 3: review of fuel-saving performance of rotors ............................................................................ 18
Table 4: review of fuel-saving performance of kites .............................................................................. 19
Table 5: review of fuel-saving performance of soft sails ....................................................................... 20
Table 6: review of fuel-saving performance of wingsails ....................................................................... 20
Table 7: review of fuel-saving performance of wind turbines ................................................................ 20
D 5.B New Wind Propulsion Technology - A Literature Review of Recent Adoptions
iv
List of symbols and abbreviations
AIS Automatic Identification System
CIIs
Carbon Intensity Indicators
DNV GL Det Norske Veritas Germanischer Lloyd
DWT Deadweight Tonnage
EEDI Energy Efficiency Design Index
EEXI Energy Efficiency Existing Ships Index
GST 2020 Green Shipping Technology Conference
ICCT International Council on Clean Transportation
IMO International Maritime Organization
IRENA International Renewable Energy Agency
ITF International Transport Forum
MEPC Marine Environment Protection Committee
MOL Mitsui O.S.K. Lines
MRV Monitoring, Reporting and Verification
SEEMP Ship Energy Efficiency Management Plan
WASP Wind Assisted Ship Propulsion

D 5.B New Wind Propulsion Technology - A Literature Review of Recent Adoptions
1
Executive Summary
The international community examines various measures towards the enhancement of the energy
efficiency profile of the maritime transport sector. The installation of Wind Assisted Ship Propulsion
Technologies (WASP) as opposed to primary wind is one of the various potential ways forward to
meeting the emission reduction goals that have been set by the International Maritime Organization.
The present report by means of an extensive literature review — it involves scientific articles, industry
reports, company newsletters and conference presentations — sheds light on the following areas:
• The potential role of WASP technologies within the decarbonisation of the shipping industry
• WASP technological uptakes within the shipping sector
• Economic and operational impact of WASP technologies
WASP technologies have the potential to play an important role in maritime industry’s decarbonisation
transition. The growth of the “WASP industry” is likely to have a significant economic and environmental
impact within the sector. Academic and industry research show considerable fuel savings that can be
achieved by the adoption of Flettner rotors, kites, rigid sails, soft sails, and suction wings under different
operating conditions (e.g., routes, speed, weather conditions of various shipping segments). Technology
developers, ship owners/operators, classification societies, and Non-Governmental Organisations show
a growing interest in the potential that this technology has to offer. The number and diversity of
commercial uptakes continues to rise and the experience shows significant energy-efficiency
improvement. Nevertheless, the full potential of WASP technology for decarbonizing the whole maritime
industry is yet to be realized while a number of researchers expect a higher diffusion to take place.
Despite the appealing character of such technologies, there are certain areas that require further
research. As the operations of WASP technology are subject to a number of underlying factors, the
profile of its risk and return must be further studied for the purpose of investment appraisal. The
introduction of WASP technology is likely to motivate ship owners/operators to innovate their business
models for more sustainable business cases. When the status quo in the organization is broken, a
greater understanding of change management and transformational leadership must be in place for
management to steer the company in alignment of the new visions and strategies. At the moment there
is a lack of literature in the above area in shipping. With the collaboration of partners in the WASP Project
of Interreg North Sea Region Program of the European Regional Development Fund, the WASP project
seeks to expand the knowledge and its diffusion in the following research. To this end, the present report
paves the way for future research regarding risks of diffusion, adoption barriers, and institutional drivers,
related to the uptake of WASP technologies within the maritime transport industry.
D 5.B New Wind Propulsion Technology - A Literature Review of Recent Adoptions
2
1. Introduction
International shipping accounts for around 2.89% of globally produced CO2 emissions in 2018,
increased from 2.76% in 2012, according to the fourth GHG study of the International Maritime
Organization (IMO)(IMO, 2020b); projections about their future increase range from 90% to 130% by
2050 compared to the baseline year of 2008. Container ships, bulk carriers, and oil tankers which
represent the largest shares of global fleet — 17.6%, 33.6%, 25.4% in gross tonnage respectively in
2018 (Equasis, 2019) — are the leading pollutants whose main engines consume most marine fuels —
22.5%, 18.7%, 13.4% respectively in 2015 (ICCT, 2017).
The disquieting projections of emission escalation have placed the topic of shipping’s decarbonisation
on the forefront of the global policy making agenda. Particularly, in October 2016, the IMO’s Marine
Environment Protection Committee (MEPC) at the 70th session agreed that ships over 5,000 gross
tonnage, which account for 85% of CO2 emissions from international shipping, are required to submit
fuel consumption data along with their transport work from 2019 on a yearly basis (IMO, 2016). This is
in line with the European Union (EU) Monitoring, Reporting and Verification (MRV) regulation, which
was ratified in 2015 for ships calling at EU ports (EUR-Lex, 2015). At the MEPC’s 72nd session in April
2018, IMO reached a milestone agreement. In alignment with the emission reduction goals set out in
United Nation’s 2015 Paris Agreement, IMO agreed to cut GHG emissions by at least 50% by 2050 and
CO2 emissions per transport work by at least 40% by 2030 and 70% by 2050 compared to the 2008
level as well (IMO, 2018).
The IMO emission reduction strategy was followed by multiple efforts made to accelerate or toughen
the already set abatement targets. In May 2019, at its 74th session, the MEPC approved the acceleration
of Energy Efficiency Design Index (EEDI) "phase 3" requirements, which, subject to final adoption in
April 2020, not only require more types of ships to be built more fuel efficient, but also tightens the
requirements of energy efficiency of newbuild container ships (IMO, 2019). In March 2020, the Clean
Shipping Coalition and Pacific Environment tabled a new regulatory proposal to the IMO aiming for a
minimum reduction of CO2 by 80% by 2030, instead of the 40% target initially set out in April 2018. The
same proposal also attempted to bring charterers into the picture with the suggestion of a calculation of
carbon intensity based on each journey so that they also become more accountable for their operational
decisions (Lloyd’s List, 2020a).
In line with the IMO emission reduction strategy, the international community is currently examining
various measures and actions so as to enhance the energy efficiency of the maritime transport sector
by means of promoting best green practices and technological innovation uptake. Among the various
existing options towards this direction, the IMO has started to pay attention to the exploitation of wind
assisted propulsion technologies (WASP) due to their capability of fuel consumption and emission
reduction (IMO, 2020a). Given the urgency for finding suitable and viable options for the decarbonisation
D 5.B New Wind Propulsion Technology - A Literature Review of Recent Adoptions
3
of the shipping sector, the Interreg North Sea Region Program of the European Regional Development
Fund initiated the Wind Assisted Ship Propulsion (WASP) project in 2019. The project brings together
industry and research institutes to study and validate the performance and commercial viability of wind-
assisted propulsion technologies (Interreg North Sea Region, 2019).
In view of few existing studies, this report focuses on the wider economic impact that wind assisted ship
propulsion (WASP) technologies can have on the shipping industry, in conjunction with all the WASP
installations in the WASP project. An analysis of secondary data that was retrieved from a broad range
of verifiable sources by means of a review of scientific literature, industry reports, news articles,
conference presentations, and commercial companies’ websites was conducted and complemented by
a content analysis. The report is structured in eight sections. The first introduces the topic under study,
while the second focuses on the linkage of shipping’s decarbonisation transition and WASP technology.
The third section discusses the role of alternative fuels within the industry’s decarbonisation efforts and
describes the potential of WASP technology as option for the energy efficiency enhancement of the
shipping sector. The fourth section provides a detailed overview of current commercial WASP
technologies uptake within the maritime industry. The fuel consumption savings achieved by the usage
of these technologies is described in section five. Sections six and seven present generic and
technology specific considerations respectively. Section 8 concludes this report and sets the way
forward.

D 5.B New Wind Propulsion Technology - A Literature Review of Recent Adoptions
4
2. The transition towards decarbonisation
Karlsen et al.(2018) used an agent-based model to explore the transition and associated barriers for the
adoption of Flettner rotors in dry bulk shipping. They found that demonstration projects and the
implementation of carbon price together could significantly improve the diffusion of the technology. More
discussion about the transition and barriers specific to the diffusion of the WASP technology will be
featured in future reports of the WASP project. In the following section, a transition model will be used
to provide a high-level perspective of the green transition of the maritime industry and
challenges/opportunities the WASP technology encounters.
A dynamic transition is defined by Rotmans et al. (2001) as “a gradual, continuous process of change
where the structural character of a society (or a complex sub-system of society) transforms”. During a
transition, changes happen in multiple domains such as technology, the economy, institutions,
behaviour, culture, ecology, and belief systems, which have a dynamic relationship as they reinforce
one another. This multi-domain process can also be observed within the maritime industry. Particularly,
technological changes, such as these of WASP, represent only one of the potential pathways towards
achieving the desired emission abatement results that have been set by the policy makers. When
examining a transition under such framework, the result of the transition is shaped by long-term
developments of stocks, and short-term developments of flows. Stocks are properties that change slowly
(eg., natural, social-cultural changes) while flows are properties that change relatively quickly (eg.,
economic changes). As far as the technological and institutional changes go, those can be considered
as medium-term. From this dynamic perspective, it could be observed that the current decarbonisation
transition is shaped by the medium-term changes in technology and institutions that create impact on
economic changes and the result of which will change the natural and socio-cultural landscape. As the
changes involve changes on multiple levels across different temporal dimensions, wide-scale promotion,
adoption, and acceptance of new technology by transnational institutions such as the IMO, larger ship
owners/operators, classification societies, and financiers require more than short-term efforts and
demands interdisciplinary research and cross-industry collaborations.
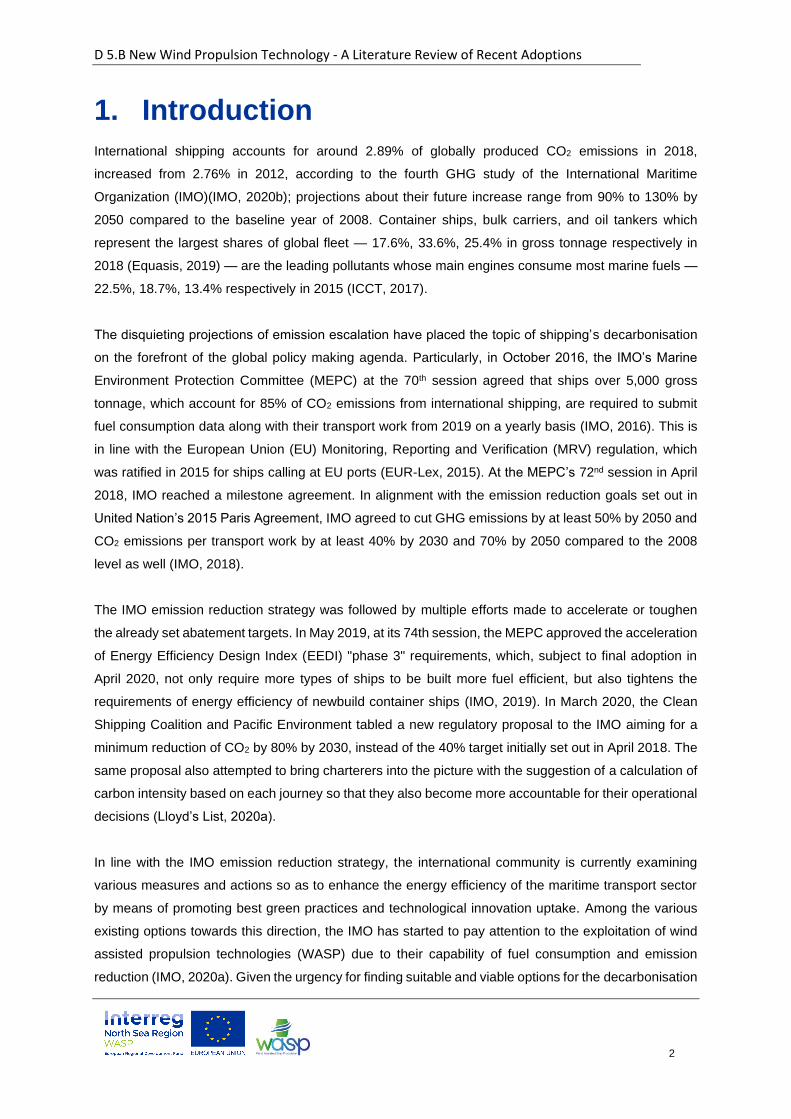
The transition process could be dissected into four phases: predevelopment, take-off, acceleration, and
stabilization (Rotmans et al., 2001). The decarbonisation transition of the maritime industry can be
placed between the take-off and acceleration phase, as the system starts to witness structural changes
in terms of social-cultural, economic, and institutional aspects and a combination of collective learning
and diffusion through active involvement of participants in different industries. However, there is an
urgency to accelerate the process in view of the various proposals related to the three dimensions of
transition: the speed of change, the size of change, and the time-period of change. As a result, an
increased diffusion of the WASP technology is likely to be a key factor on the entire transition process
due to its potential significant impact on emission reduction. This will be discussed further in the following
sections.
D 5.B New Wind Propulsion Technology - A Literature Review of Recent Adoptions
5
Figure 1: The four phases (red) and three dimensions (orange) of transition (Rotmans et al., 2001)
Technological and institutional changes driven by the WASP technology take place at all three levels:
socio-technical landscape, regimes, and niche (Rotmans et al., 2001). Interactions between levels are
also observed. In comparison with the incremental changes that usually happen in a regime, niche level
actors are generally less constrained and more agile at responding to landscape pressure for radical
changes (Mander, 2017). However, niche level innovations face the challenge of competing with existing
technologies, rules, practices, and organizational arrangement where stability and inertia reside.
As the IMO, sovereign States, and transnational institutions continue to face pressure from the socio-
technical landscape and niche levels to decarbonize shipping, it can be expected that regime actors will
play an increasingly enabling role for the uptake of WASP technology. As the diffusion of WASP
technology grows steadily on the niche level, an accumulated amount of momentum will be transmitted
to socio-technical landscape and regimes levels, creating a positive feedback loop that further
accelerates the process (Rotmans et al., 2001). Referring to Jacobsson & Lauber (2006)’s key
conditions for the formative stage of a new industry, i.e., institutional changes, market formation,
advocacy coalitions, and the entry of other organizations, the same conditions are already present for
WASP technology and actively engaged by a broad range of participants (Allwright, 2018). If the
example of German wind and solar industry described in Jacobsson & Lauber (2006) could be used as
a reference1, we expect that, with adequate support from regimes and alterations in the regulatory
environment, the “WASP industry” will continue to grow and create substantial economic and
environmental impact.
1 With the initial reliance on domestic coal mining and the subsequent plutonium shift, German government’s support for renewables started in a “limited and ambivalent support” fashion. However, the formation of the renewable industry continued on the “fertile ground” cultivated by a community of enthusiastic participants who set the groundwork and vision needed for the following rapid development from the late 1980s.

D 5.B New Wind Propulsion Technology - A Literature Review of Recent Adoptions
6
D 5.B New Wind Propulsion Technology - A Literature Review of Recent Adoptions
7
3. WASP Technology and alternative fuels
The discussion of potential ways towards the decarbonisation of the maritime industry is mainly placed
on the uptake of alternative fuels such as hydrogen, methanol, ammonia, and biofuel. In spite of the
appealing character of the uptake of alternative fuels within shipping, it is important to look at the
complete life cycle of those fuels from production to utilization. Although ships’ “tank to propeller”
emission could be significantly lower with the usage of alternative fuels, many applications of hydrogen,
methanol, and ammonia induce high “well to tank” emissions comparable to conventional heavy fuel oil
and marine gas oil. In other words, there is a risk of emissions being transferred upstream. Moreover, it
needs to be stressed that recent research has not yet arrived at a conclusion about alternative fuels’
impact on total life cycle emissions and costs (Balcombe et al., 2019; DNV GL, 2019a; IRENA, 2019). It
is estimated2 that an investment of USD 1 – 1.4 trillion into new fuel over 20 years is required for land-
based investments (87%) and ship related investments (13%) in order to meet the current IMO 2050
goal (Global Maritime Forum, 2020).
In view of the extensive capital and extensive cross-value chain collaboration requirements so as to
achieve meaningful emission abatement results through the usage of alternative fuels, there has been
growing interest in exploiting renewable energy to replace part of the propulsive power ships obtain from
its motor engine. The importance of adopting a variety of abatement measures and the potential of wind
power are evident in Bouman et al. (2017). They concluded that, after reviewing 22 technological and
operational practices, none of those alone is sufficient to reduce the required amount of CO2 to meet
the IMO 2050 target, but a combination of measures could achieve 75% reduction. Therefore, sole
reliance/focus on alternative fuel is suboptimal. The same study also showed that, among various
options, wind assisted technology is one of the top eight measures whose third quantile of CO2 reduction
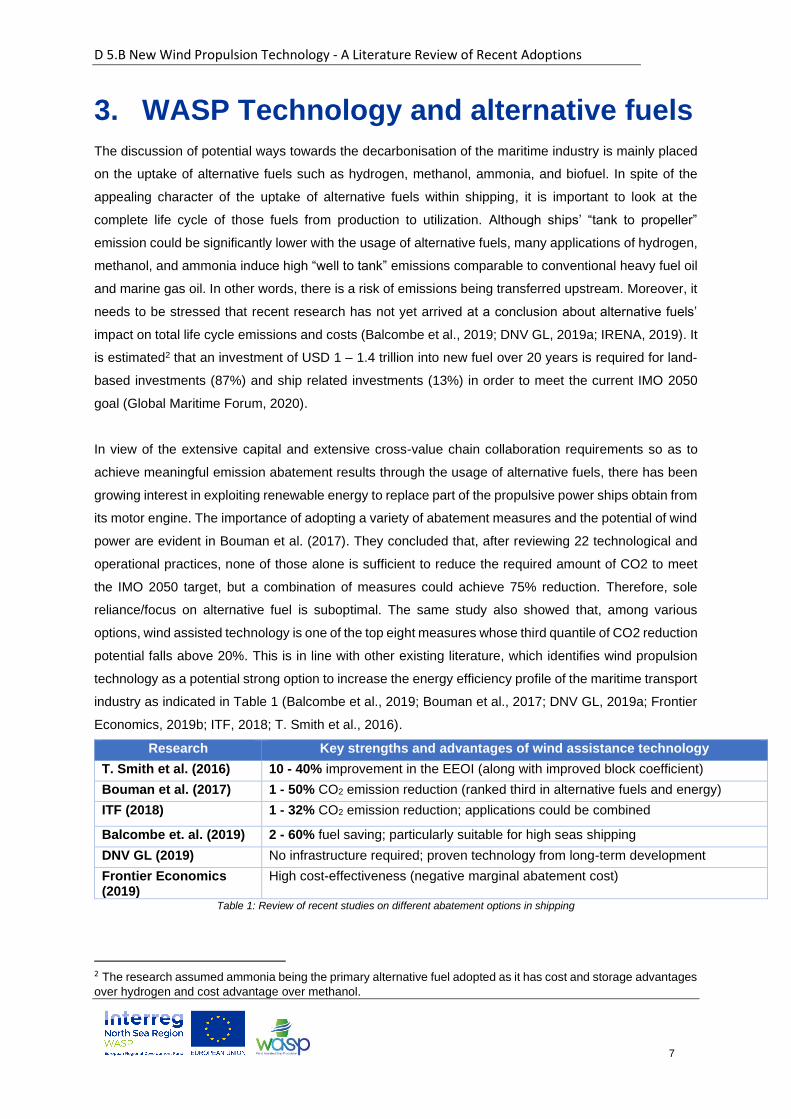
potential falls above 20%. This is in line with other existing literature, which identifies wind propulsion
technology as a potential strong option to increase the energy efficiency profile of the maritime transport
industry as indicated in Table 1 (Balcombe et al., 2019; Bouman et al., 2017; DNV GL, 2019a; Frontier
Economics, 2019b; ITF, 2018; T. Smith et al., 2016).
Research Key strengths and advantages of wind assistance technology
T. Smith et al. (2016) 10 - 40% improvement in the EEOI (along with improved block coefficient)
Bouman et al. (2017) 1 - 50% CO2 emission reduction (ranked third in alternative fuels and energy)
ITF (2018) 1 - 32% CO2 emission reduction; applications could be combined
Balcombe et. al. (2019) 2 - 60% fuel saving; particularly suitable for high seas shipping
DNV GL (2019) No infrastructure required; proven technology from long-term development
Frontier Economics (2019)
High cost-effectiveness (negative marginal abatement cost)
Table 1: Review of recent studies on different abatement options in shipping
2 The research assumed ammonia being the primary alternative fuel adopted as it has cost and storage advantages
over hydrogen and cost advantage over methanol.

D 5.B New Wind Propulsion Technology - A Literature Review of Recent Adoptions
8

D 5.B New Wind Propulsion Technology - A Literature Review of Recent Adoptions
9
4. Development of wasp technology
This section presents the current development of WASP technologies given the appealing character of
such innovation as a promising emission abatement solution. A variety of WASP technologies are
available on the market with each having its distinct characteristics. Nelissen et al. (2016) presented a
taxonomy by screening for technologies aimed for commercial shipping and are developed by
developers with more certain commercial presence which are as follows and illustrated in Figure 2-7:
Rotors (Figure 2): These are rotating cylinders installed on deck that generate forward thrust from the
Magnus Effect as the cylinders create low and high pressure. In 2018, under one of the subprojects in
the EU sponsored project MariGreen, University of Applied Sciences Emden/Leer conducted a study
on-board and verified the performance of a retrofitted Flettner rotor developed by EcoFlettner
(MariGreen, 2019). Finnish developer Norsepower is currently active in this area and backed by major
energy companies (TradeWinds, 2019). Anemoi is a developer active in providing movable rotors on
vessels (Dry Bulk Magazine, 2018).
Figure 2: Rotor – Flettner rotor (Norsepower, n.d.)
Towing kites (Figure 3): They provide thrust to ships with the lift generated by high altitude winds. From
2008 to 2012, some commercial applications of towing kites were developed by Skysails. Airseas, a
spin-off of Airbus Group, is currently developing their own automated products.

D 5.B New Wind Propulsion Technology - A Literature Review of Recent Adoptions
10
Figure 3: Towing kite – Airseas (“Airseas K Line,” n.d.)
In Nelissen et al. (2016), suction wings are considered either under the category of rotors or sails. As
suction wings have a significant role in the WASP project and are adopted by key external project
partners, they will be discussed separately.
Suction wings (Figure 4): eConowind’s Ventifoil and eConowind unit are non-rotating wings with vents
and internal fans that generate force with boundary layer suction. The former has the benefit of achieving
a larger size, which translates to larger thrust while the latter has the flexibility to be moved around.
Figure 4: Suction Wings (eConowind, n.d.)
Rigid sails/wingsails (Figure 5): foils that could be adjusted to produce aerodynamic forces. Japanese
ship owners had already applied the technology in 1980s. One example is the "Wind Challenger Project"
from MOL, Oshima Shipbuilding, and University of Tokyo (MOL, 2019).

D 5.B New Wind Propulsion Technology - A Literature Review of Recent Adoptions
11
Figure 5: Rigid sail/wingsail (University of Tokyo, n.d.)
Soft sails (Figure 6): These are traditional sails with modern features. One example is Dynarig which is
currently used on large sailing yachts (DNV GL, 2019a).
Figure 6: Soft sail – Dynarig (DNV GL, 2019a)
Wind turbines (Figure 7): turbines that generate electricity and/or thrust by the blades.
Figure 7: Wind turbine (PROPit, n.d.)
Hull sails (Figure 8): These are hulls that use relative wind with its symmetrical hull foils that generate
aerodynamic lifts.

D 5.B New Wind Propulsion Technology - A Literature Review of Recent Adoptions
12
Figure 8: Hull sail – Vindskip (Lade, n.d.)
The installation of WASP technologies does not take place at the same pace for each technology,
mainly, due to their varying benefits, costs, restrictions, technical requirements, and the fit to the ships.
At the moment it appears that rotors, kites, and suction wings are most popular as these have been
installed on 13 commercial ships since 2008. Table 2 provides a detailed summary of the commercial
uptakes of the WASP technology. The table mainly covers commercial transport ships that exceed 5,000
gross tonnage as those account for about 85% of CO2 emissions from international shipping (IMO,
2016). Some smaller commercial ships are also included as the installations of the WASP technology
are recent and their gross tonnage is close to 5,000. Container ships, bulk carriers, and oil tankers are
the focus of the study, as those ships represent the largest shares of global fleet with 17.6%, 33.6%,
and 25.4% in gross tonnage respectively in 2018 (Equasis, 2019) and are the leading pollutants, whose
main engines consume most marine fuels, 22.5%, 18.7%, 13.4% respectively in 2015 (ICCT, 2017).
This report does not investigate the cases of private yachts and small exhibition ships, as they account
for a small portion of emissions.

D 5.B New Wind Propulsion Technology - A Literature Review of Recent Adoptions
13
Ship Name Ship Type DWT Specific Technology Characteristics Ship Built Yearc Installation Year
Flettner Rotor Number of rotors/diameter (m)/height (m)
E-Ship 1a General Cargo/Ro-Lo 10,020 4/4/27 2010 2010
Estradena Ro-Ro 9,700 2/3b/18 1999 2014
Viking Gracea Passenger 6,107 1/4/24 2013 2018
Fehn Polluxa General Cargo 4,250 1/3/18 1997 2018
Maersk Pelicana Tanker 109,647 2/5/30 2008 2018
Afrosd Bulk Carrier 64,000 4/-/- (movable) 2018 2018
Copenhagene Ferry 5,088 1/5/30 2012 2020
Annika Brarenf General Cargo 5,100 1/18/3 2020 Oct 2020 expected
SC Connectorg Ro-Ro 8,843 2/35/5 1997 Q4 2020 expected
Kite Dimension of the kite (m2)
Michael A.h General Cargo 4,884 160 1994 2008
BBC Skysailsi General Cargo 9,832 320i 2008 2008j
Theseusi General Cargo 3,667 160g 2009 2009h
Aghia Marinai Bulk Carrier 28,522 320i 1994 2012j
Ville de Bordeauxk,l Ro-Ro 5,200 500 2004 Nov 2020 expected
TBAk Bulk Carrier TBA (Capesize) 1,000 TBA 2021 expected
Suction Wing Number of wings/height (m)
Ankiem General Cargo 3,600 2/10 2007 2020
Frisian Sean General Cargo 6,477 2/TBA 2013 Sep 2020 expected
Rigid sails/wing sails Number of foils/height (m)/width (m)
New Vitalityo,p Tanker 306,751 2/32/15 2018 2018
TBAq Tanker TBA (VLCC) TBA 2022 2022 expected Table 2: Recent WASP adoptions of commercial ships (a: (Comer et al., 2019); b:(Norsepower, n.d.); c: marinetraffic.com; d:(Dry Bulk Magazine, 2018); e:(Press - Scandlines, n.d.); f:(“Eco-Flettner Für Das Neue Frachtschiff ‘Annika Braren,’” 2020); g:(Norsepower Unveils First Tiltable Rotor Sail Installation with Sea-Cargo Agreement - Norsepower Rotor Sails, n.d.); h:(Aguiar Delgado, 2016); i: (Nelissen et al., 2016); j: (Novotny, 2016); k:(Reinhard, 2020); l: (Lloyd’s List, 2020b); m: (The Maritime Executive, 2020); n:(Boomsma Shipping, n.d.); o: (G. Peng, personal communication, May 13, 2020); p: (Peng, 2019), q: (China Merchants Orders VLCC with Sails, 2020)

D 5.B New Wind Propulsion Technology - A Literature Review of Recent Adoptions
14
Table 2 mainly illustrates the commercial uptakes of WASP technologies until 2018. Since then, these
have accelerated together with the involvement of multiple market players and are as follows:
• In January 2018, four moveable Flettner rotors developed by Anemoi were installed on Blue
Planet’s ultramax vessel Afros which marked the first installation of Flettner rotors on geared
dry bulk vessels (Dry Bulk Magazine, 2018).
• Maersk Tankers reported 8.2% fuel saving from September 2018 to September 2019 on its Long
Range 2 product tanker Maersk Pelican after the installation of two Flettner rotors from
Norsepower (Maersk Tankers, 2019).
• Van Dam shipping’s Ankie was retrofitted with two suction wings from eConowind in January
2020 (The Maritime Executive, 2020).
• Airbus Group is scheduled to install one 500 m2 kite from Airseas on Louis Dreyfus Armateurs’
Ro-Ro vessel Ville de Bordeaux in November 2020. Japanese ship owner “K” LINE also agreed
to install one 1,000 m2 kite on one capsize bulk carrier by end of 2021, according to Airseas. “K”
LINE also indicated 50 possible installations conditional on a successful first delivery (Lloyd’s
List, 2020b; Nor-Shipping, 2019; Reinhard, 2020).
• Danish ferry operator Scandlines has installed one Flettner rotor from Norsepower on ferry
Copenhagen in May 2020 (Pressekontakt et al., n.d.).
• Boomsma Shipping has scheduled an installation of two eConowind Flatrack unit of suction
wings in October 2020 (Boomsma Shipping, n.d.).
• In September 2020, we have learned that Tharsis Sea-River Shipping has also expressed
interest in participating in the WASP project by means of a suction-wings installation on one of
its ships.
Overall, the industry has been witnessing a steady increase in the number of WASP technological
installations, diversification of available WASP technologies, as well as an increase in the diversification
of ship type, size, and ship owners that adopt them. This is a positive sign as the market expands and
the collective learning of the “WASP industry” is likely to speed up and contribute to a positive feedback
loop.

D 5.B New Wind Propulsion Technology - A Literature Review of Recent Adoptions
15
5. Economic impact - fuel saving
As shipping is an energy intensive industry and fuel costs account for a large share of a ship’s operating
cost and total costs (T. Notteboom, 2011; T. E. Notteboom & Vernimmen, 2009; Ronen, 2011), ship
owners/operators are generally informed and concerned about fuel consumption (Jafarzadeh & Utne,
2014). The uptake of WASP technology has the potential to improve ships’ efficiency as it reduces the
propulsive power required from the fossil fuel-consuming main engine by introducing propulsive power
generated from wind power so that a ship could maintain the same speed for reduced engine power or
increase ship speed for the same engine power (Argyros, 2015). As mentioned in Stopford, (2009),
different operating models in shipping (eg., voyage charter, time charter, bare boar charter) result in
different cost distributions. In voyage charter, owners bear the cost of fuel while in time charter and bare
boat charter charterers bear the cost of fuel. This has an impact on the decision making for WASP
adoption because it is usually owners who decide on and fund ship modifications. This topic will be
discussed further in the future reports in the WASP project. Here the focus is on the fuel-saving potential
of the WASP technology.
An improved fuel efficiency does not only increase the expected profitability of the asset but also
provides an operational hedge against volatile fuel costs. This can be seen for instance in other transport
industries. Particularly, Treanor et al. (2014) and Berghöfer & Lucey (2014) showed that operational
hedge of airline companies (i.e. fleet composition and fleet fuel efficiency) is more effective in reducing
exposure to jet fuel price than financial hedge with derivatives. Figure 9 shows that marine fuel in two
major bunker ports Rotterdam and Singapore has been traded in the range between USD 100 and USD
600 per tonne in the last five years from February 2015 to February 2020. Hence, WASP technology
can also act as a hedging instrument that helps ship owners/operators reduce their exposure to the
volatility of bunker prices and reduce the number of bunker calls, making the ships more flexible.
Figure 9: Heavy Fuel Oil Price from February 2015 to February 2020 (Reuters, accessed on 2 March 2020)
Articles and statements of WASP technology developers, centre their focus on the amount of fuel-saving
that can be achieved. This caters to the interests of ship owners/operators. As observed on the GST
0
100
200
300
400
500
600
700
26-2
-201
5
26-4
-201
5
26-6
-201
5
26-8
-201
5
26-1
0-2
015
26-1
2-2
015
26-2
-201
6
26-4
-201
6
26-6
-201
6
26-8
-201
6
26-1
0-2
016
26-1
2-2
016
26-2
-201
7
26-4
-201
7
26-6
-201
7
26-8
-201
7
26-1
0-2
017
26-1
2-2
017
26-2
-201
8
26-4
-201
8
26-6
-201
8
26-8
-201
8
26-1
0-2
018
26-1
2-2
018
26-2
-201
9
26-4
-201
9
26-6
-201
9
26-8
-201
9
26-1
0-2
019
26-1
2-2
019
26-2
-202
0
USD
/To
nn
e
Price of Heavy Fuel Oil at Rotterdam (Blue) and Singapore (Red)

D 5.B New Wind Propulsion Technology - A Literature Review of Recent Adoptions
16
2020 Wind Propulsion Forum in Copenhagen, ship owners who have already adopted WASP technology
clearly pointed out the importance of legitimate economic benefit from their investment. In other words,
emission reduction alone is unlikely to convince ship owners and justify an investment in WASP
technology due to the capital investment required and operational risks involved, such as technical
uncertainty, counterpart issues, and port operations. An economic case has to be made so the potential
financial upside compensates the costs and risks.
As the commercial adoptions of WASP technologies start to ramp up, academic research on the
commercial viability has also been increasing in the past decade. The majority of studies conduct ship-
wise simulations of ships’ fuel consumption in steps, as described in Tristan Smith et al. (2013):
1. Parameterization of the physics of a wind-assisted ship and its WASP technology.
2. Parameterization of the performance of a wind-assisted ship taking into account weather
variability.
3. Aggregation of performance data from multiple simulations.
The aim of this process is to model the wind power contribution towards ship propulsion. Despite the
similarities in the process that is mainly followed in every study, differences are identified in terms of the
methodological approaches that are applied. Among the studies, three approaches are observed:
1. The first approach is non-route-based simulation (De Marco et al., 2016; Leloup et al., 2016;
Naaijen et al., 2006; Ran et al., 2013). It uses models to capture a range of parameters of
modelled technologies, ships, and weather conditions based on assumptions or historical data
found in literature or data bases. The objective is to calculate, under each scenario, how much
energy output could be generated by the WASP technology. The net energy output is then
compared with the propulsive power required by the modelled ships to ascertained the energy
saving. Simply put, the simulation aims to compare the fuel consumption of a referenced ship
with and without a WASP technology installed.
2. The second approach is route-based simulation, which in addition to the first approach,
reconstructs specific route from ships’ Automatic Identification System (AIS) data and takes into
account wind and wave condition along the voyage of each route (Bentin et al., 2016; Comer et
al., 2019; Lu & Ringsberg, 2019; Ouchi et al., 2013; Tristan Smith et al., 2013; Traut et al., 2014).
3. The third approach does not rely on simulation but requires measured fuel consumption data
from ships sailing with WASP technology. The amount of fuel saving is found by switching the
technology on and off in identical sea and wind conditions (DNV GL, 2019) and comparing the
amount of fuel consumption.
The results of the studies consistently showed that WASP technologies have the potential to help ships
save considerable amount of fuel under different conditions as is illustrated in Tables 3 - 5. It is important
to note that different studies choose different parameters in their models such as the technology

D 5.B New Wind Propulsion Technology - A Literature Review of Recent Adoptions
17
specification (e.g., number, dimensions, technical specifications), ships (e.g., type and size of the ships,
speed), wind conditions, and routes. The table aims to include studies done on common commercial
ships that make up the majority of the worldwide tonnage. Studies done on concept ships are not
included because special designs of concept ships make the interpretation of data and comparisons
between studies particularly challenging. A representative example is seen in the Sail project (Schwarz-
Röhr et al., 2015) which found that WASP technology could lead to about 46% fuel saving with four
Flettner rotors and about 10 – 40% fuel saving with 3-mast Dynarig.
As shown in the parametric study of Lu & Ringsberg, (2019), for ships fitting a Flettner rotor, the
diameter, height, rotating speed, installed location, and average voyage speed all have an impact on
the resulting fuel saving. Therefore, a direct comparison of results between different studies is not
meaningful. In addition to the amount of potential fuel saving, the studies revealed a number of generic
considerations and technology-specific considerations, which have direct and significant impact on the
economics of WASP technology.

D 5.B New Wind Propulsion Technology - A Literature Review of Recent Adoptions
18
Study Dimensions of the Technology Ship Type Route Fuel Saving Found
Tristan Smith et al. (2013)
Unspecified 10K dwt Chemical Tanker Buenos Aires - Western Approaches 20% - 50%
Traut et al. (2014) 1 Flettner rotor: height (h) = 0 35 m, diameter (d) = 5 m
7k dwt Ro-Ro 8k dwt Product Tanker 6k dwt General Cargo 50k dwt Bulk Carrier 30k dwt Container Ship
Dunkirk - Dover London - Milford Haven Varberg - Gillingham Tubarao - Grimsby Yantian - Felixstowe
4% 14% 21%
5% 2%
Nelissen et al. (2016)
2 Flettner rotors: h = 22 m, d = 3 m 3 Flettner rotors: h = 48 m, d = 6 m 2 Flettner rotors: h = 24 m, d = 3.5 m 2 Flettner rotors: h = 48 m, d = 6 m
5k dwt Tanker 90k dwt Tanker 7k dwt Bulk Carrier 90k dwt Bulk Carrier
Worldwide trades of each ship type according to AIS data
5% - 7% 9% - 13%
5% - 7% 17% - 23%
Bentin et al. (2016)
1 Flettner rotors: h = 25 m, d = 4 m 17k dwt General Cargo Baltimore - Wilhelmshaven 14% - 36%
De Marco et al. (2016)
2 Flettner rotors: h = 28 m, d = 4 m
75k dwt Product Tanker N.A. Up to 30%
Comer et al. (2019)
4 Flettner rotors: h = 27 m, d = 4 m 2 Flettner rotors: h = 18 m, d = 4 m 1 Flettner rotor: h = 24 m, d = 4 m 1 Flettner rotor: h = 18 m, d = 3 m 2 Flettner rotors: h = 30 m, d = 5 m
10k dwt General Cargo/Ro-Lo 10k dwt Ro-Ro 6k dwt (2.8k pax) Passenger 4k dwt General Cargo 110k dwt Tanker
Porto - Montevideo; Eemshaven - Porto Rotterdam - Middlesbrough Stockholm - Turku Livormo – Mostaganem; Huelva - Alexandria Sklkda – Singapore; Yeosu - Spain
8.3% - 47%
1.6% - 9.0% 0.4% - 2.8% 1.0% - 6.6% 1.8% - 4.7%
Lu & Ringsberg (2019)
1 Flettner rotor: h = 18 m, d = 3 m Aframax Tanker Cape Lopez - Point Tupper Angra dos Reis - Rotterdam
8.9% 6.5%
DNV GL (2019) 1 Flettner rotor: h = 18 m, d = 3 m 4k dwt General Cargo Unspecified 10% - 20%
Table 3: Review of fuel-saving performance of rotors

D 5.B New Wind Propulsion Technology - A Literature Review of Recent Adoptions
19
Study Dimensions of the Technology Ship Type Route Fuel Saving Found
Naaijen et al. (2006)
1 kite: area (a) = 500 m2, length of the rope (l) = 150 m
50k dwt Tanker N.A. Up to 35%
1 kite: area (a) = 500 m2, length of the rope (l) = 350 m
Up to 50%
Ran et al. (2013) 1 kite: a = 640 m2, l = 600 m 73k dwt Tanker N.A. 40%
Traut et al. (2014) 1 kite: a = 500 m2, l = 350 m
7k dwt RoRo Dunkirk - Dover 3%
8k dwt Product Tanker London - Milford Haven 24%
6k dwt General Cargo Varberg - Gillingham 32%
50k dwt Bulk Carrier Tubarao - Grimsby 6%
30k dwt Container Ship Yantian - Felixstowe 1%
Nelissen et al. (2016) 1 kite: a = 400 m2, l = 350m
5k dwt Tanker
Worldwide trades of each ship type according to AIS data
9% - 15%
90k dwt Tanker 3% - 4%
7k dwt Bulk Carrier 9% - 14%
90k dwt Bulk Carrier 5% - 9%
1k TEU Container Ship 2% - 4%
5k TEU Container Ship 1% - 2%
Leloup et al. (2016) 1 kite: a = 320 m2, l = 300m 50k dwt Tanker N.A. 10% - 50%
Table 4: Review of fuel-saving performance of kites

D 5.B New Wind Propulsion Technology - A Literature Review of Recent Adoptions
20
Study Dimensions of the Technology Ship Type Route Fuel Saving Found
Tristan Smith et al. (2013)
1 Dynarig 10K dwt Chemical Tanker
Buenos Aires - Western Approaches 15% - 35%
Lu & Ringsberg (2019) 1 Dynarig: area = 1,000 m2 Aframax Tanker Cape Lopez - Point Tupper Angra dos Reis - Rotterdam
5.6% 4.2%
Table 5: Review of fuel-saving performance of soft sails
Study Dimensions of the Technology Ship Type Route Fuel Saving Found
Ouchi et al. (2013) 9 wingsails: height (h) = 50 m, width (w) = 20 m 180k dwt Bulk Carrier Yokohama - Seattle 20% - 30%
Tristan Smith et al. (2013)
Unspecified 10K dwt Chemical Tanker
Buenos Aires - Western Approaches 20% - 60%
Nelissen et al. (2016)
3 wingsails: h = 25 m, w = 9 m 5 wingsails: h = 50 m, w = 17 m 3 wingsails: h = 27 m, w = 10 m 5 wingsails: h = 50 m, w = 18 m
5k dwt Tanker 90k dwt Tanker 7k dwt Bulk Carrier 90k dwt Bulk Carrier
Worldwide trades of each ship type according to AIS data
5% - 8% 9% - 13%
5% - 7% 18% - 24%
Lu & Ringsberg (2019) 1 wingsail: h = 50 m, w = 20 m Aframax Tanker Cape Lopez - Point Tupper Angra dos Reis - Rotterdam
8.8% 6.1%
Table 6: Review of fuel-saving performance of wingsails
Study Dimensions of the Technology Ship Type Route Fuel Saving Found
Nelissen et al. (2016)
1 turbine: height (h) = 20 m, diameter (d) = 38 m 3 turbines: h = 20 m, d = 38 m 1 turbine: h = 20 m, d = 38 m 3 turbines: h = 20 m, d = 38 m
5k dwt Tanker 90k dwt Tanker 7k dwt Bulk Carrier 90k dwt Bulk Carrier
Worldwide trades of each ship type according to AIS data
1% - 2% 1% - 2% 1% - 2% 2% - 4%
Table 5: Review of fuel-saving performance of wind turbines
D 5.B New Wind Propulsion Technology - A Literature Review of Recent Adoptions
21
6. Fuel-saving considerations
The speed and direction of wind are two major factors that determine the fuel saving in the models of all
the studies examined in section five. In general, it is shown that with all other factors being identical, the
higher the wind speed the larger the energy output of the WASP technology resulting in higher fuel
savings. This is not unexpected as WASP technologies utilize wind power to produce thrust for ships
(Bentin et al., 2016; Leloup et al., 2016; Naaijen et al., 2006; Nelissen et al., 2016; Ouchi et al., 2013;
Ran et al., 2013; Tristan Smith et al., 2013).
Optimal routes of ships fitted with WASP technologies could differ from the optimal route for ships without
WASP technologies. On the other hand, wave height, which has a negative impact on ships’
performance, are often higher where wind speed is higher (Tristan Smith et al., 2013). When modelling
performance of ships with WASP technologies, more sophisticated models that account for side forces
and yaw moments should be used to obtain more accurate fuel consumption predictions (Tillig &
Ringsberg, 2019). Many of the studies use reconstructed routes from AIS data and/or shortest paths (Lu
& Ringsberg, 2019; Nelissen et al., 2016; Traut et al., 2014). Bentin et al. (2016) has shown that when
a route-optimizing tool is utilized, fuel saving of WASP technologies is increased from 14 - 36 % to 28 –
53%. Tristan Smith et al. (2013) showed 5% - 10% more fuel saving could be achieved when the ship
is free to deviate from the Great Circle route to utilize optimal wind and wave, while Ouchi et al. (2013)
observed a 30% fuel saving on a wind-optimal route compared to 22% on the Great Circle.
In practice ship operators are unlikely to have perfect foresight of weather conditions through the entire
voyage; hence, actual fuel savings might deviate from simulations of reconstructed voyages (Naaijen et
al., 2006; Tristan Smith et al., 2013). In cases where a route is optimized for WASP technologies to
achieve a lower fuel consumption, the trip duration and irregularity of the trip duration may deteriorate
when trying to maximize the most favourable wind, resulting in a suboptimal economic result (Naaijen
et al., 2006). Even when the route and the trip duration, including its irregularity, are all optimized,
operational limits of the WASP technology present another issue. As it is the crew on-board responsible
for the navigation of the ship and the deployment of the machinery, they may experience a larger
workload and need additional training to operate and maintain the WASP technology effectively. The
change of the crew takes place on a regular basis and thus the level of operational efficiency could be
difficult to maintain (Nelissen et al., 2016). An automatic system could play a significantly role in reducing
the risks associated with crew demand.
As the ship master is in charge of the navigation of the ship, a fully automated system may not allow the
flexibility of a competent ship master with good sailing skills to achieve an optimal result (Argyros, 2015).
At times, it might be beneficial to changing ship’s speed and course to maximize fuel saving to catch
favourable wind, which demands good decision making of the ship master.

D 5.B New Wind Propulsion Technology - A Literature Review of Recent Adoptions
22
Trade patterns have a significant impact on the fuel saving potential of WASP technologies, as wind and
ocean current in different geographic locations affect ships’ performance. It is important to match the
right technology to the right trade pattern. Rehmatulla et al. (2017) show that for dry bulk carriers ranging
from 0 – 35,000 DWT, there is a match between areas of higher wind speed and areas where ships
consume more fuel (North Pacific, North Atlantic, Indian Ocean), which is a positive sign for the type of
ship to consider WASP technologies. Comer et al. (2019) found that fuel saving in the western coast of
Europe, South China Sea, the Indian Ocean, and the Arabian Sea are the largest while the fuel saving
is the smallest in the Mediterranean Sea and off the west coast of Africa. Other studies also suggest
that in different trading areas significantly different fuel savings are found (Lu & Ringsberg, 2019;
Nelissen et al., 2016; Traut et al., 2014).
Seasonal differences in fuel savings are observed in the simulation of (Tristan Smith et al., 2013) for the
Argentina-UK trade line where Flettner rotors perform better in the winter and a wingsail performs better
in the summer period. Comer et al. (2019) shows that in the winter of Northern Hemisphere the wind
speed is higher and enables Flettner rotors to achieve more fuel saving. In Bentin et al. (2016), Tristan
Smith et al. (2013), and Traut et al. (2014), direction of the voyage is found to cause a difference in fuel
saving. The dominant west – east wind direction present in the Atlantic ocean resulted in significant
difference in fuel saving between Baltimore to Wilhelmshaven (36%) and Wilhelmshaven to Baltimore
(14%) (Bentin et al., 2016). Longer-haul voyages are found to have a lower variability of fuel saving than
short ones (Traut et al., 2014), and are more likely to enable more fuel saving as wind speed tends to
be higher in more open ocean (Nelissen et al., 2016). Research focusing on application of the WASP
technology in North Sea is currently lacking. The WASP project fills this gap and will verify the potential
of the WASP technology in North Sea by measuring the performance of each installation.
7. Technology-specific considerations
Flettner rotors contribute more to fuel savings achieved, while Dynarig (soft sail) save less according to
the studies by Lu & Ringsberg (2019), Nelissen et al. (2016), and Tristan Smith et al. (2013) that provided
direct comparisons between technologies. However, it is worth noting that the studies used different
specifications of ships and technologies so the results may only serve as a reference. As studies that
provide direct comparisons are scarce, more research, like the WASP project will serve as an important
way to find out more about the performance between different technologies. Traut et al. (2014) found
that the power output of kites is more volatile than Flettner rotors, as by nature, Flettner rotors generate
propulsive power over a wider range of wind directions; hence, Flettner rotors’ performance is less
sensitive to geographic locations and weather conditions. Similar result is found in Nelissen et al. (2016).
On the other hand, kites have a number of advantages over Flettner rotors as they can catch stronger
wind at a higher altitude, they are safer for the ship due to lower impact on the roll heeling moment, and
they take little deck space (Naaijen et al., 2006). However, the impact on the roll heeling moment shall
D 5.B New Wind Propulsion Technology - A Literature Review of Recent Adoptions
23
be studied further on real-life installations on actual sailing conditions. Such research will be done in the
WASP project with the collaboration of ship owners. On the other hand, it was found that when the kite
flies higher, it contributes more thrust to the ship and helps save more fuel (Naaijen et al., 2006)
compared to flying at a lower altitude. In terms of scalability, both Flettner rotors and wingsails have the
potential to scale up with ship size. Although kites may have less scalability, the fact that they do not
take much deck space make them particularly attractive for container ships (Nelissen et al., 2016).
Differences in the nature of technologies lead to different technology functions under the same wind
condition. For example, kites produce the largest amount of propulsive power under tail wind, while
Flettner rotors thrive on sideway winds ((De Marco et al., 2016; Leloup et al., 2016; Lu & Ringsberg,
2019; Nelissen et al., 2016; Ran et al., 2013; Traut et al., 2014). Although absolute fuel saving increases
for rotors and wingsails when ship speed increases, relative fuel savings decrease. The reason is that,
as energy demand increases, power demand of the ship has a greater effect on the fuel consumption
than the contribution of rotors/wingsails (Lu & Ringsberg, 2019; Nelissen et al., 2016; Tristan Smith et
al., 2013). Kites not only generate more savings in absolute term under lower speed, but also generate
more or equal absolute savings as the apparent tailwind is likely to be stronger (Nelissen et al., 2016;
Ran et al., 2013). As suction wings is relatively new to the market, more research shall be done to better
understand its performance under different conditions. It plays a key role in the WASP project and will
be thoroughly studied.

D 5.B New Wind Propulsion Technology - A Literature Review of Recent Adoptions
24
8. Concluding remarks
The global maritime community is currently investigating various measures in order to meet the
decarbonisation targets that have been set by policy makers. Although under less spotlight than
alternative fuel, WASP technology is increasingly available and proven to be an integral piece in this
transition process that requires a variety of abatement measures to work in conjunction. In addition to
niche actors that have been driving the development of WASP technology since day one, an increasing
number of regime actors such as regulatory authorities, classification societies, and large international
ship owners have joined the “WASP industry”. This growth has the potential to lead to more uptakes and
an accelerated decarbonisation transition.
WASP technology has come a long way in terms of its development and commercial adoptions. An
uncertainty remains over just how much longer it takes to make a larger economic and environmental
impact. Rotmans et al. (2001) noted that “all transitions contain periods of slow and fast development.
Nor is a transition usually a quick change, but a gradual, continuous process typically spanning at least
one generation (25 years)”. Germany’s transition to wind power from the formative phase 1970s to
continued growth phase 2000s appears to confirm this requirement of at least one generation’s effort
(Jacobsson & Lauber, 2006). If we consider 2008 the start of recent uptake of new WASP technology,
it seems we are now at around the mid-point of this transition and the acceleration has begun thanks to
a cluster of dedicated industry and academic participants. From now there is clearly much more potential
to be realized before the WASP technology reaches the diffusion level suggested in Nelissen et al.
(2016) (3,700 - 10,700 ships in 2030) and Frontier Economics (2019a) (37,000 – 40,000 ships by 2050).
The sense of urgency is growing in the maritime industry, as discussion intensifies to bring more long
and short-term changes, such as the implementation of Energy Efficiency Existing Ships Index (EEXI)
and Ship Energy Efficiency Management Plan and Carbon Intensity Indicators (SEEMP & CIIs) (Lloyd’s
Register, 2020). The WASP technology is a strong option for policy makers to support and ship owners
to adapt for the transition. A good amount of research in academia and industry have quantified ship-
wise fuel saving potential and studied the impact from variability in wind speed/directions, trade patterns,
geographical areas, seasonal effect, long/short-haul voyage, ship’s operation profile/limits, and route
optimization. The result consistently showed that WASP technology has significant potential to make
ships more energy-efficient. To achieve the most desirable fuel consumption reduction in the most
favourable way to ship owners/operators, a range of factors mentioned in the previous sections must be
taken into consideration.
As the uptake continues to increase in both number and diversity, the economic impact of WASP
technology will be made even more transparent going forward. A promising pipeline in the next 12 to 24
months will increase the pace of the development of the WASP industry. Since different technology has
distinct performance characteristics under different conditions, a one-size-fits-all solution is unlikely to

D 5.B New Wind Propulsion Technology - A Literature Review of Recent Adoptions
25
exist. In other words, before seeing mass uptakes, the majority of ship owners/operators will likely
demand more information and seek to learn the experience of market players that have adopted WASP
technology. Therefore, at the core of the WASP project, it is crucial to produce more verified third-party
research teamed with actual commercial uptakes, thus more legitimacy could be generated and a
broader audience could gain more insight into the risks and opportunities of WASP technology. In
addition, more research shall be done to establish the risk and return relationship of WASP technology
and how it could contribute to the operational hedge of ship owners/operators. A higher management
perspective on the organizational transformation and business models is also a future area of research.
Along with the ambition to shed light on above topics, the WASP project will also place an emphasis on
the technologies’ performance in the North Sea region and provide one of the first studies on suction
wings at sea. The objective is to further the green transition of maritime transportation in North Sea and
help verify new WASP technology.
D 5.B New Wind Propulsion Technology - A Literature Review of Recent Adoptions
26
Bibliography
Aguiar Delgado, V. (2016). Skysail: Estudio del sistema y aportacion a la sostenibilidad en el
transporte maritimo [B.S. thesis]. Universitat Politècnica de Catalunya.
Airseas K Line. (n.d.). Hansa International Maritime Journal. Retrieved September 15, 2020, from
https://hansa-online.de/2019/06/featured/128452/k-line-vor-grossauftrag-fuer-
zugdrachen/attachment/airseas-k-line/
Allwright, G. (2018). Commercial Wind Propulsion Solutions: Putting the ‘Sail’Back into Sailing. In
Trends and Challenges in Maritime Energy Management (pp. 433–443). Springer.
Argyros, D. (2015). Wind-powered shipping: A review of commercial, regulatory and technical factors
affecting uptake of wind-assisted propulsion. Lloyd’s Register Marine.
Balcombe, P., Brierley, J., Lewis, C., Skatvedt, L., Speirs, J., Hawkes, A., & Staffell, I. (2019). How to
decarbonise international shipping: Options for fuels, technologies and policies. Energy
Conversion and Management, 182, 72–88.
Bentin, M., Zastrau, D., Schlaak, M., Freye, D., Elsner, R., & Kotzur, S. (2016). A New Routing
Optimization Tool-influence of Wind and Waves on Fuel Consumption of Ships with and
without Wind Assisted Ship Propulsion Systems. Transportation Research Procedia, 14, 153–
162. https://doi.org/10.1016/j.trpro.2016.05.051
Berghöfer, B., & Lucey, B. (2014). Fuel hedging, operational hedging and risk exposure—Evidence
from the global airline industry. International Review of Financial Analysis, 34, 124–139.
Boomsma Shipping. (n.d.). Media and news | Boomsma Shipping. Retrieved April 8, 2020, from
https://boomsmashipping.nl/boomsma-shipping-esigns-contract-with-econowind-for-ventifoil-
installation.htm
Bouman, E. A., Lindstad, E., Rialland, A. I., & Strømman, A. H. (2017). State-of-the-art technologies,
measures, and potential for reducing GHG emissions from shipping – A review. Transportation
Research Part D: Transport and Environment, 52, 408–421.
https://doi.org/10.1016/j.trd.2017.03.022
Brown, M. A. (2001). Market failures and barriers as a basis for clean energy policies. Energy Policy,
29(14), 1197–1207. https://doi.org/10.1016/S0301-4215(01)00067-2

D 5.B New Wind Propulsion Technology - A Literature Review of Recent Adoptions
27
China Merchants Orders VLCC with Sails. (2020, May 19). MarineLink.
https://www.marinelink.com/news/china-merchants-orders-vlcc-sails-478624
Comer, B., Chen C., Stolz, D., Rutherford D. (2019). Rotors and bubbles: Route-based assessment of
innovative technologies to reduce ship fuel consumption and emissions. International Council
on Clean Transportation. Working paper 2019-11. Available at:
https://theicct.org/sites/default/files/publications/Rotors_and_bubbles_2019_05_12.pdf.
De Marco, A., Mancini, S., Pensa, C., Calise, G., & De Luca, F. (2016). Flettner Rotor Concept for
Marine Applications: A Systematic Study [Research Article]. International Journal of Rotating
Machinery. https://doi.org/10.1155/2016/3458750
DNV GL. (2019a). Assessment of selected alternative fuels and technologies in shipping. DNV GL.
https://www.dnvgl.com/maritime/publications/alternative-fuel-assessment-download.html
DNV GL. (2019b). ECO FLETTNER rotor sail stands the test—Industry insights—DNV GL. Missing
Label with Key: Page-Annotations-Sitename. https://www.dnvgl.com/expert-story/maritime-
impact/ECO-FLETTNER-rotor-sail-stands-the-test.html
Dry Bulk Magazine. (2018, December 14). Ultramax bulker installed with wind engines; awarded Ship
of the Year 2018. Dry Bulk. https://www.drybulkmagazine.com/shipping/14122018/ultramax-
bulker-installed-with-wind-engines-awarded-ship-of-the-year-2018/
Eco-Flettner für das neue Frachtschiff “Annika Braren.” (2020, September 1). Green Shipping News.
https://www.green-shipping-news.de/annika-braren-eco-flettner/
eConowind. (n.d.). Home. Econowind. Retrieved April 6, 2020, from https://www.econowind.nl/
Equasis. (2019). The world merchant fleet—Statistics from Equasis.
http://www.emsa.europa.eu/equasis-statistics/items.html?cid=95&id=472
EUR-Lex. (2015). EUR-Lex—02015R0757-20161216—EN - EUR-Lex. https://eur-lex.europa.eu/legal-
content/EN/TXT/?uri=CELEX%3A02015R0757-20161216
Frontier Economics. (2019a). Reducing the Maritime Sector’s Contribution to Climate Change and Air
Pollution: Economic Opportunities from Low and Zero Emission Shipping. London:
Department for Transport.
Frontier Economics. (2019b). Reducing the Maritime Sector’s Contribution to Climate Change and Air
Pollution: Scenario Analysis: Take-up of Emissions Reduction Options and their Impacts on
Emissions and Costs. A Report for the Department for Transport.

D 5.B New Wind Propulsion Technology - A Literature Review of Recent Adoptions
28
Global Maritime Forum. (2020). The scale of investment needed to decarbonize international shipping.
https://www.globalmaritimeforum.org/news/the-scale-of-investment-needed-to-decarbonize-
international-shipping
ICCT. (2017). Greenhouse gas emissions from global shipping, 2013–2015. 38.
IMO. (2016). MEPC 70th session.
http://www.imo.org/en/MediaCentre/MeetingSummaries/MEPC/Pages/MEPC-70th-
session.aspx
IMO. (2018). UN body adopts climate change strategy for shipping.
http://www.imo.org/en/MediaCentre/PressBriefings/Pages/06GHGinitialstrategy.aspx
IMO. (2019). MEPC 74th session.
http://www.imo.org/en/MediaCentre/MeetingSummaries/MEPC/Pages/MEPC-74th-
session.aspx
IMO. (2020a). REDUCTION OF GHG EMISSIONS FROM SHIPS Wind propulsion solutions.
ResearchGate. https://doi.org/10.13140/RG.2.2.18835.02081
IMO. (2020b). Third imo ghg study 2020. International Maritime Organization (IMO), London.
Interreg North Sea Region. (2019). EU-backed Wind-Assist Ship Propulsion Project Sets Sail on its
Three-Year Voyage, Interreg VB North Sea Region Programme.
https://northsearegion.eu/wasp/news/eu-backed-wind-assist-ship-propulsion-project-sets-sail-
on-its-three-year-voyage/
IRENA. (2019). Navigating the way to a renewable future: Solutions to decarbonise shipping.
/publications/2019/Sep/Navigating-the-way-to-a-renewable-future
ITF. (2018). Decarbonizing Maritime Transport: Pathways to zero-carbon shipping by 2035. Paris,
France: International Transportation Forum.
Jacobsson, S., & Lauber, V. (2006). The politics and policy of energy system transformation—
Explaining the German diffusion of renewable energy technology. Energy Policy, 34(3), 256–
276. https://doi.org/10.1016/j.enpol.2004.08.029
Jafarzadeh, S., & Utne, I. B. (2014). A framework to bridge the energy efficiency gap in shipping.
Energy, 69, 603–612. https://doi.org/10.1016/j.energy.2014.03.056
Karlsen, R., Papachristos, G., & Rehmatulla, N. (2018). The diffusion of wind propulsion technologies
in shipping: An agent-based model.

D 5.B New Wind Propulsion Technology - A Literature Review of Recent Adoptions
29
Lade. (n.d.). About the Vindskip. Lade AS. Retrieved February 11, 2020, from https://ladeas.no/about-
the-vindskip/
Leloup, R., Roncin, K., Behrel, M., Bles, G., Leroux, J.-B., Jochum, C., & Parlier, Y. (2016). A
continuous and analytical modeling for kites as auxiliary propulsion devoted to merchant ships,
including fuel saving estimation. Renewable Energy, 86, 483–496.
Lloyd’s List. (2020a, March 17). Ships pushed to cut carbon emissions by at least 80%. Lloyd’s List.
https://lloydslist.maritimeintelligence.informa.com/LL1131516/Ships-pushed-to-cut-carbon-
emissions-by-at-least-80
Lloyd’s List. (2020b, April 14). From the News Desk: Will coronavirus accelerate the use of tech in
shipping? Lloyd’s List. https://lloydslist.maritimeintelligence.informa.com/LL1131917/From-the-
News-Desk-Will-coronavirus-accelerate-the-use-of-tech-in-shipping
Lloyd’s Register. (2020). Life after IMO 2020. Lloyd’s Register.
https://www.lr.org/en/insights/articles/life-after-imo-regulatory-landscape/
Lu, R., & Ringsberg, J. W. (2019). Ship energy performance study of three wind-assisted ship
propulsion technologies including a parametric study of the Flettner rotor technology. Ships
and Offshore Structures, 0(0), 1–10. https://doi.org/10.1080/17445302.2019.1612544
Maersk Tankers, V.-. (2019). Norsepower Rotor Sails confirmed savings.
https://maersktankers.com:443/en/media/norsepower-rotor-sails-confirmed-savings
Mander, S. (2017). Slow steaming and a new dawn for wind propulsion: A multi-level analysis of two
low carbon shipping transitions. Marine Policy, 75, 210–216.
https://doi.org/10.1016/j.marpol.2016.03.018
MariGreen. (2019). MariGreen EN | Maritime Innovations in Green Technologies | GreenShipping.
http://en.marigreen.eu/
MOL. (2019). “Wind Challenger” Design Acquires Preliminary Approval—Realizing Japan’s 1st Large
Cargo Ship with ‘Sail’, Aiming at Reduction of GHGs -. Mitsui O.S.K. Lines.
https://www.mol.co.jp/en/pr/2019/19065.html
Naaijen, P., Koster, V., & Dallinga, R. P. (2006). On the Power Savings by an Auxiliary Kite Propulsion
System, Report 1502-P. Delft University of Technology, Department of Marine Engineering,
Ship Hydromechanics Laboratory Published in: International Shipbuilding Progress, ISP,

D 5.B New Wind Propulsion Technology - A Literature Review of Recent Adoptions
30
Volume 53, Number 4, 2006, IOS Press, ISSN: 0020-868X, Report 1502-P.
https://repository.tudelft.nl/islandora/object/uuid%3A6d225f75-43c3-4dcd-b15d-8c7f87bc02ab
Nelissen, D., Traut, M., Köhler, J., Mao, W., Faber, J., & Ahdour, S. (2016). Study on the analysis of
market potentials and market barriers for wind propulsion technologies for ships.
https://research.chalmers.se/en/publication/245854
Norsepower. (n.d.). Norsepower Rotor Sails. Retrieved April 6, 2020, from
https://www.norsepower.com/tanker
Norsepower unveils first tiltable rotor sail installation with Sea-Cargo agreement—Norsepower Rotor
Sails. (n.d.). Retrieved September 4, 2020, from
https://www.norsepower.com/post/norsepower-unveils-first-tiltable-rotor-sail-installation-with-
sea-cargo
Nor-Shipping. (2019, June 6). Breakthrough in green shipping: The Japanese KAWASAKI KISEN
KAISHA, LTD. (“K” LINE) signs for up to 50 automated kites from AIRSEAS. Nor-Shipping
2021 - 1-4 June. http://www.nor-shipping.com/breakthrough-in-green-shipping-the-japanese-
kawasaki-kisen-kaisha-ltd-k-line-signs-for-up-to-50-automated-kites-from-airseas/
Notteboom, T. (2011). The impact of low sulphur fuel requirements in shipping on the competitiveness
of roro shipping in Northern Europe. WMU Journal of Maritime Affairs, 10(1), 63–95.
https://doi.org/10.1007/s13437-010-0001-7
Notteboom, T. E., & Vernimmen, B. (2009). The effect of high fuel costs on liner service configuration
in container shipping. Journal of Transport Geography, 17(5), 325–337.
https://doi.org/10.1016/j.jtrangeo.2008.05.003
Novotny, T. (2016). Use of alternative means of propulsion in maritime industry to increase ship
energy efficiency (CO2 problematic) [B.S. thesis]. Universitat Politècnica de Catalunya.
Ouchi, K., Uzawa, K., Kanai, A., & Katori, M. (2013). Wind challenger” the next generation hybrid
sailing vessel. International Symposium on Marine Propulsors Smp, 13.
Peng, G. (2019). Findings on the EEDI assessment framework for wind propulsion systems.
http://www.sssri-marin-jv.com/wp-content/uploads/2019/09/2019-09-VLCC-with-areofoils-
Peng-Guisheng.pdf
Peng, G. (2020, May 13). New Vitality [Personal communication].

D 5.B New Wind Propulsion Technology - A Literature Review of Recent Adoptions
31
Pressekontakt, Communications, H. of C.,
Annpetdkteep.ukkstueruwmp.ppsvtxenzodsllengt@siycafundwclitunekjs.qjcoldmtr, & SMS),
+45 26 777 000 (keine. (n.d.). Reederei & Passagiere werden vom Wind angetrieben.
Mynewsdesk. Retrieved September 17, 2020, from https://scandlines-
de.mynewsdesk.com/pressreleases/reederei-og-passagiere-werden-vom-wind-angetrieben-
3027260
Press—Scandlines. (n.d.). Retrieved September 4, 2020, from https://www.scandlines.de/uber-
scandlines/presse#/pressreleases/reederei-og-passagiere-werden-vom-wind-angetrieben-
3027260
PROPit. (n.d.). The PROPit concept. Retrieved February 11, 2020, from
http://propit.se/propitconcept.shtml
Ran, H., Janson, C.-E., & Allenström, B. (2013). Auxiliary kite propulsion contribution to ship thrust.
ASME 2013 32nd International Conference on Ocean, Offshore and Arctic Engineering.
Rehmatulla, N., Parker, S., Smith, T., & Stulgis, V. (2017). Wind technologies: Opportunities and
barriers to a low carbon shipping industry. Marine Policy, 75, 217–226.
https://doi.org/10.1016/j.marpol.2015.12.021
Reinhard, L. (2020). Presentation. GST 2020, Copenhagen, Denmark.
Ronen, D. (2011). The effect of oil price on containership speed and fleet size. Journal of the
Operational Research Society, 62(1), 211–216. https://doi.org/10.1057/jors.2009.169
Rotmans, J., Kemp, R., & Van Asselt, M. (2001). More evolution than revolution: Transition
management in public policy. Foresight-The Journal of Future Studies, Strategic Thinking and
Policy, 3(1), 15–31.
Schwarz-Röhr, B., Eggers, R., Neumann, D., Grijpstra, J., de Vries, J., Insel, M., van der Meer, R., &
Voerman, E. J. (2015). Roadmap for sail transport: Engineering. Interreg IVB, Work Package,
3, 15–20.
Smith, T., Raucci, C., Hosseinloo, S. H., Rojon, I., Calleya, J., De La Fuente, S., Wu, P., & Palmer, K.
(2016). CO2 emissions from international shipping. Possible reduction targets and their
associated pathways. UMAS: London, UK.
Smith, Tristan, Newton, P., Winn, G., & Rosa, A. G. L. (2013). Analysis techniques for evaluating the
fuel savings associated with wind assistance. 13.

D 5.B New Wind Propulsion Technology - A Literature Review of Recent Adoptions
32
Stopford, M. (2009). Maritime economics 3e. Routledge.
The Maritime Executive. (2020). New Wind-Assist Technology Enters Service in North Sea. The
Maritime Executive. https://www.maritime-executive.com/article/new-wind-assist-technology-
enters-service-in-north-sea
Tillig, F., & Ringsberg, J. W. (2019). A 4 DOF simulation model developed for fuel consumption
prediction of ships at sea. Ships and Offshore Structures, 14(sup1), 112–120.
TradeWinds. (2019). Rotor sail maker Norsepower seals oil major investment | TradeWinds.
TradeWinds | Latest Shipping and Maritime News.
https://www.tradewindsnews.com/tankers/rotor-sail-maker-norsepower-seals-oil-major-
investment/2-1-678387
Traut, M., Gilbert, P., Walsh, C., Bows, A., Filippone, A., Stansby, P., & Wood, R. (2014). Propulsive
power contribution of a kite and a Flettner rotor on selected shipping routes. Applied Energy,
113, 362–372. https://doi.org/10.1016/j.apenergy.2013.07.026
Treanor, S. D., Simkins, B. J., Rogers, D. A., & Carter, D. A. (2014). Does operational and financial
hedging reduce exposure? Evidence from the US airline industry. Financial Review, 49(1),
149–172.
University of Tokyo. (n.d.). Projects. Department of Ocean Technology,Policy, and Environment
Graduate School,The University of Tokyo. Retrieved April 6, 2020, from http://www.otpe.k.u-
tokyo.ac.jp/en/project_details.html