D-1134 C.2 .. 94101034 HIJRTCROWSER
42
------------ D-1134 C.2 94101034 .. .. HIJRTCROWSER Earth and Environmental Technologies Hydrogeologic Characterization for Protection of the Wildcat Creek Aquifer Grays Harbor County, Washington Centennial Clean Water Fund Grant G93 Prepared for City of McCleary April 12, 1994 J-3500-01 Seattle • Tacoma • Richland • Anchorage • Portland • San Francisco • Long Beach I I I I II . ' I I I
Transcript of D-1134 C.2 .. 94101034 HIJRTCROWSER

------------D-1134 C.2
94101034
.. .. HIJRTCROWSER Earth and Environmental Technologies
Hydrogeologic Characterization for Protection of the Wildcat Creek Aquifer Grays Harbor County, Washington Centennial Clean Water Fund Grant G93
Prepared for City of McCleary
April 12, 1994 J-3500-01
Seattle • Tacoma • Richland • Anchorage • Portland • San Francisco • Long Beach
I I I
I
II . '
I
I
I

CONTENTS
INTRODUCTION
Study Area Description Scope of Work
EXISTING DATA REVIEW
FIELD DATA COLLECTION
Water Level Measurements Aquifer Testing Land Use Survey
HYDROGEOLOGIC CONDITIONS (CONCEPTUAL MODEL)
Geology Groundwater Conditions Aquifer Characteristics Wellfu!ld Recharge Area
WELLFIELD CAPTURE ZONES
Delineation Approach Results
RECOMMENDATIONS
Take Immedwte Actions Petition EPA for a Sole Source Aquifer Designation Establish Reliable Wellhead Protection Area Develop Wellhead Protection Program Prepare a Contingency Plan
LIMITATIONS
REFERENCES
Hart Crowser J-3500-01
1
1 2
3
4
4 5 6
6
6 7 7 8
8
8 10
10
10 11 12 12 15
15
17
Page i
I
: .i
. II
:I I li I
'I I.
I
!1
. !
I

-~- - -··· - .. ---- ··--· -------- - ----
. CONTENTS (Continued)
TABLE
1 Potential Point Contaminant Sources
FIGURES
1 Project Location Map 2 McCleary Study Area Map Showing Surficial Geology 3 Groundwater Elevation Contour and Aquifer Boundary Map 4 Geologic Cross Sections A-A' and B-B' 5 Generalized Wellfield Recharge Area Map 6 Land Use Map and Time-Related Capture Zones
APPENDIX A AQUIFER TEST PROCEDURES AND RESULTS
Aquifer Test Data and Analyses
FIGURES
A-1 Constant Rate Pumping Test in Well MC-2 Drawdown and Recovery Measured in Observation Well MC-3
A-2 Constant Rate Pumping Test in Well MC-2 Recovery Measured in Observation Well MC-2A
A-3 Constant Rate Pumping Test McCleary Well MC-2 Measurements in Well DP-1
A-4 Constant Rate Pumping Test McCleary Well MC-2 Log-Log Plot of Measurements in Well MC-3
Hart Crowser J-3500-01
19
A-1
A-1
Page ii

)NTENTS (Continued)
~PENDIX B ROUNDWATER MODELING AND CAPTURE ZONE ANALYSIS
fodel Description hysical Configuration ,quifer Parameters fodel Calibration
FIGURE
B-1 Finite Difference Grid Showing Boundary Conditions
Hart Crowser J-3500-01
B-1
B-1 B-1 B-2 B-3
Page iii
i I :I
I ' I ' I
I i I,
I.
I
li il
' 'I ''
' \
' I ' ;) I . ,I
I I II I[ I, I I I ' ,I I \",
I i \ '
: 1: I
I

IYDROGEOLOGIC CHARACTERIZATION 10R PROTECTION OF THE NILDCAT CREEK AQUIFER :iRAYS HARBOR COUNTY, WASHINGTON
lNTRODUCTION ·
Hart Crowser J-3500-01
This report presents the results of hydrogeologic characterization activities conducted to provide a basis for protecting the Wildcat Creek Aquifer in Grays Harbor County, Washington. This aquifer serves as the only water supply source for the City of McCleary. Our work focused on evaluating the hydrogeology and determining where land use activities may directly impact groundwater used by the City. As a result of this work we provide several recommendations for protecting the water supply.
This project provides information to be included in a Wellhead Protection Program for the City of McCleary. WAC 246-290-100 requires all public water systems to prepare a Water System Plan, which after modification in early 1994, will require explicit wellhead protection components (Washington State Department of Health, 1993)
According to the state requirements, wellhead protection areas are delineated based on time-related capture zones. These zones define the areas where if a contaminant were to enter groundwater, it would travel to the wellfield within a specified time period. The three primary zones in a wellhead protection area are defmed as the 1-, 5-, and 10-year capture zones.
For this study, we defined the extent of the aquifer, evaluated groundwater flow conditions, determined aquifer hydraulic properties, and estimated time-related capture zones for the City's wellfield. As part of this study we also preliminarily identify land uses that have the potential to affect groundwater quality, and provide recommendations for the development of a wellhead protection plan. This information should enable the City, working in cooperation with Grays Harbor County, to develop a comprehensive wellhead protection plan that will ensure the protection of the City's water supply.
Study Area Description
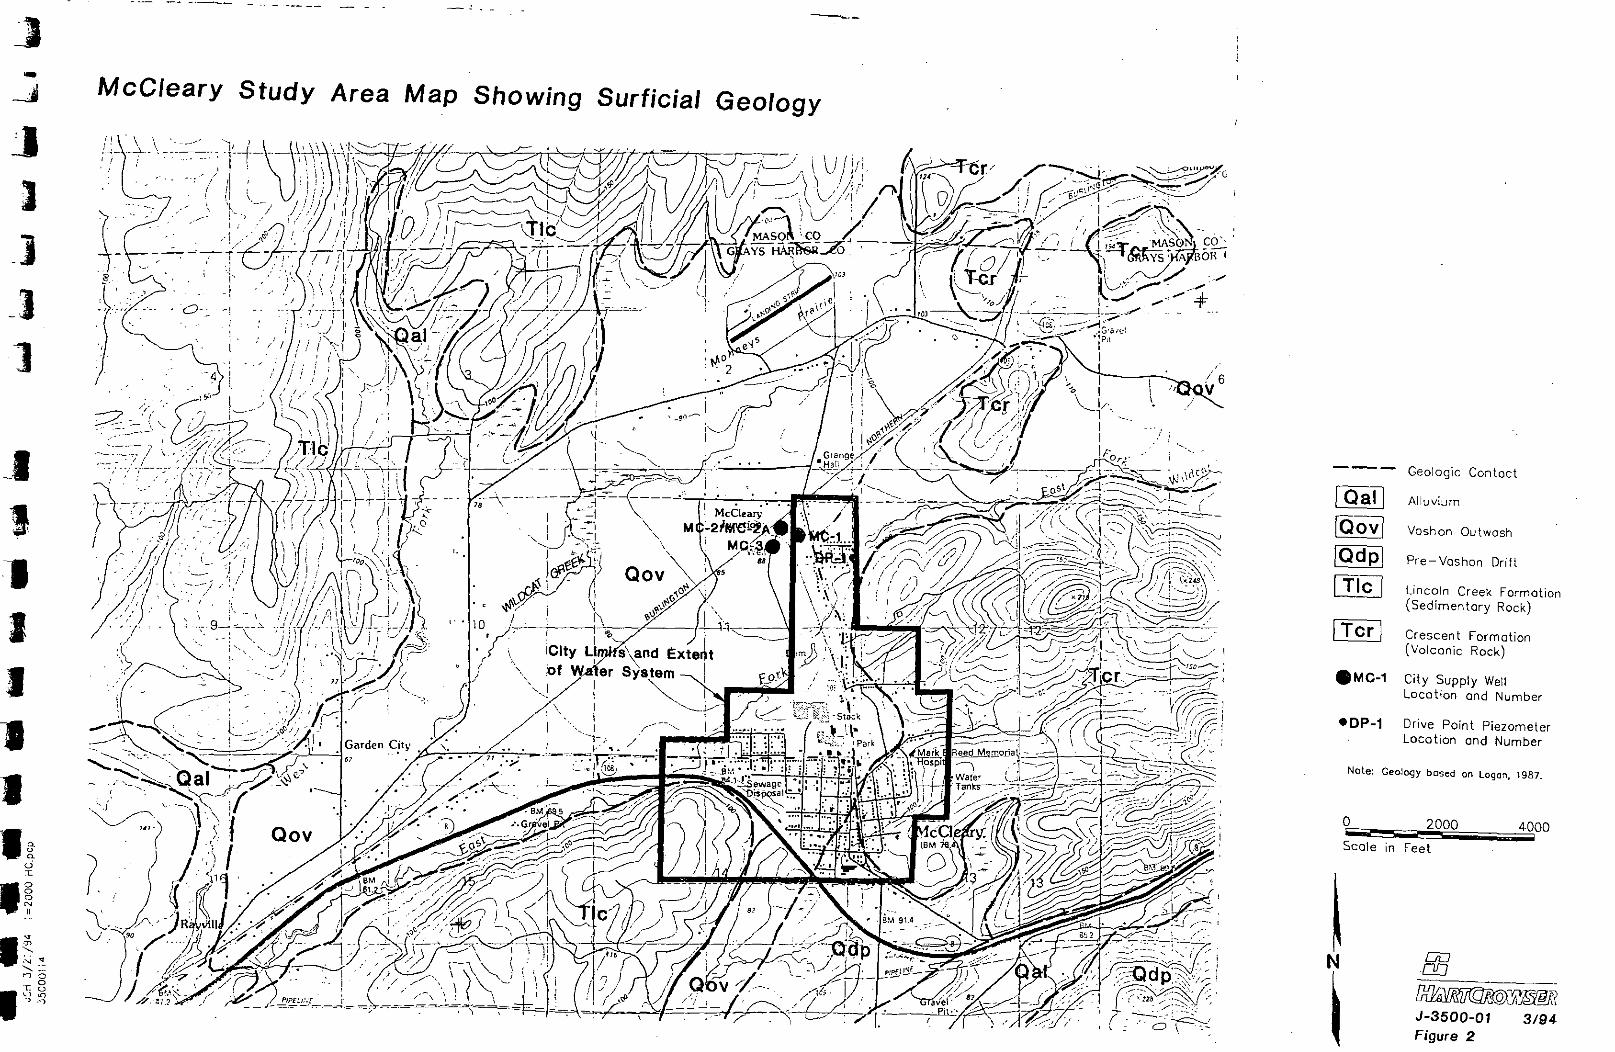
The Wildcat Creek Aquifer and City of McCleary are located in the northeastern portion of Grays Harbor County, Washington (T18N, R5W). The location of the study area is shown on Figures 1 and 2.
Page 1
I 'I 1,1
' I'
. I
i
~ I I
!i It
'I
I
I
I i
'I
I I
'
, I'
I I
,i ·'
II I , .,
. I : i
!I
I ,,
I i

Scope of Work
Hart Crowser J-3500-01
The aquifer is named for the creek that drains the sand and gravel-filled valley from which the City of McCleary obtains its water supply. The sand and gravel fills a northeast-southwest trending valley between hills and upland areas composed of basalt. The aquifer material includes rocks from the southeastern Olympic mountains as well as granitic pebbles and rocks derived from the northern Cascades that were deposited from glacial meltwater (Eddy, 1966). The floor of the valley has very little relief and slopes gently to the southwest.
The City operates a wellfield located approximately 3/4 of a mile north of the city center as shown on Figure 2. The wellfield consists of a primary pumping well (MC-2) and back-up well (MC-3). A third well (MC-1) is located in the wellfield, but is not connected to the City's distribution system. A fourth well (MC-2A) is located approximately 7 feet from well MC-2. According to employees of the City of McCleary, this well was drilled crooked and is therefore unsuitable for use as a pumping well. The construction details (e.g., presence and location of screen) of this well are unknown.
Each of the wells in the wellfield are at an elevation of approximately 290 feet (88 meters) above mean sea level, and are completed at depths of between 60 and 90 feet (18.5 to 27.5 meters) below ground surface. The McCleary water system serves approximately 1 ,500 residents located within the City Limits shown on Figure 2.
The McCleary city center lies on the southeastern edge of the valley. Land use in the valley is predominantly rural/residential; however, a few industrial operations related to the timber industry are present north of the City. The population of the McCleary region has been reasonably stable over the last thirty years, but has recently experienced moderate growth. Most of the recent growth has occurred north of the City, near the wellfield. This study was conceived to provide planning information to ensure that this increased growth does not degrade the quality of the shallow groundwater used by the City.
The purpose of this study was to evaluate the hydrogeology in the vicinity of the wellfield to identify locations where land use in the McCleary area is most likely to have the potential to affect the City's water supply. Our scope of work included:
• Reviewing existing data to help prioritize field data collection and develop a conceptual picture of the hydrogeologic and land use issues that may affect the wellfield;
Page 2
I
',i I
I I
I ,i
I
I'
I I I
I i ' '

Hart Crowser J-3500-01
.,. Conducting field work, including aquifer hydraulic testing, measuring groundwater elevations, and identifying current land use issues;
.,. Analyzing the information gathered during the data review and field work to determine aquifer properties and estimate 1-, 5-, and 10-year capture zones for the wellfield; and
.,. Developing recommendations for wellhead protection and preparing this report.
EXISTING DATA REVIEW
We reviewed existing data to develop a conceptual picture of the aquifer and identify areas of interest requiring additional study. The data we reviewed included the following:
.,. Surficial Soil Survey. The soil survey for the area (Pringle, 1986) provides maps of surficial soil types and descriptions of soil properties. We reviewed this information to help identify the extent of glaciofluvial deposits in the study area, and identify where surficial soils are permeable, exposing the aquifer to greater potential adverse impacts.
.,. Regional Geologic Reports. We reviewed a Washington State Water Resources Bulletin (Eddy, 1966) a Ph.D. thesis by Carson (1970), and the Washington State Department of Resources Open File Report 87-9 prepared by Robert L. Logan in December 1997 to obtain general regional information on the geologic processes that formed the Wildcat Creek Aquifer.
.,. Well Log Records. We obtained copies of 67 well logs from the area that were on file with the Washington State Department of Ecology (Ecology). These logs proved to be invaluable for determining the extent, thickness, and character of aquifer materials tapped by these wells .
.,. McCleary Water System Plan. A Water System Plan for McCleary was prepared by Byrne-Stevens & Associates (1977). This planning document discusses the existing water system in detail, including a description of the facilities, operation and maintenance, and water consumption. The document also has important information concerning land use and social and economic issues.
Page 3
'' I ; ..
' I ! •I
I . I I

Hart Crowser J-3500-01
.. Aerial Photograph. A 1:12,000 scale orthophoto map of the N.E. 1/4 ofT 18N, R 5 W from the Washington State Department of Natural Resources helped identify existing land uses.
.. Zoning Map. The Grays Harbor Regional Planning Commission produced a land use plan for the McCleary Planning Area in 1978. We reviewed a map showing the existing zoning classifications to identify areas where planned land use may impact water quality.
.. City Wellfield Operations Records. We evaluated monthly total pumping data supplied by the City to determine a steady state pumping rate used for capture zone estimation.
FIELD DATA COLLECTION
We conducted general reconnaissance and field testing during the week of July 26 to 30, 1993. During this week we gathered data on groundwater elevations to evaluate groundwater flow conditions, and conducted an aquifer pumping test to estimate permeability, which is necessary to determine time-related capture zones. We also visually surveyed land use to help identify potential sources of contamination.
The following sections describe the field activities and identify the data collected.
Water Level Measurements
We estimated the wellhead elevations and measured the depth to water in 16 domestic wells. These data were used to map groundwater flow directions and provide a basis for calibrating the groundwater flow model used for estimating time-related capture zones for the McCleary wellfield. We also precisely surveyed wellhead elevations and measured water levels at the McCleary we1lfield to assess groundwater gradients under pumping and non-pumping conditions.
We only considered measuring water levels in domestic wells for which we had wells logs from Ecology. This enabled us to ensure that each well we measured was completed in the same aquifer as the McCleary wells. The sixteen wells were selected in the field based on owner's permission, accessibility, and location (we attempted to have an even geographic distribution of measurement points across the aquifer).
The depth to water in domestic wells was measured with an electric water level sounder. The wellhead elevations were estimated with a surveying
Page 4
I I j ;·r I ' '
. I
I
I
lquifer Testing
Hart Crowser J-3500-01
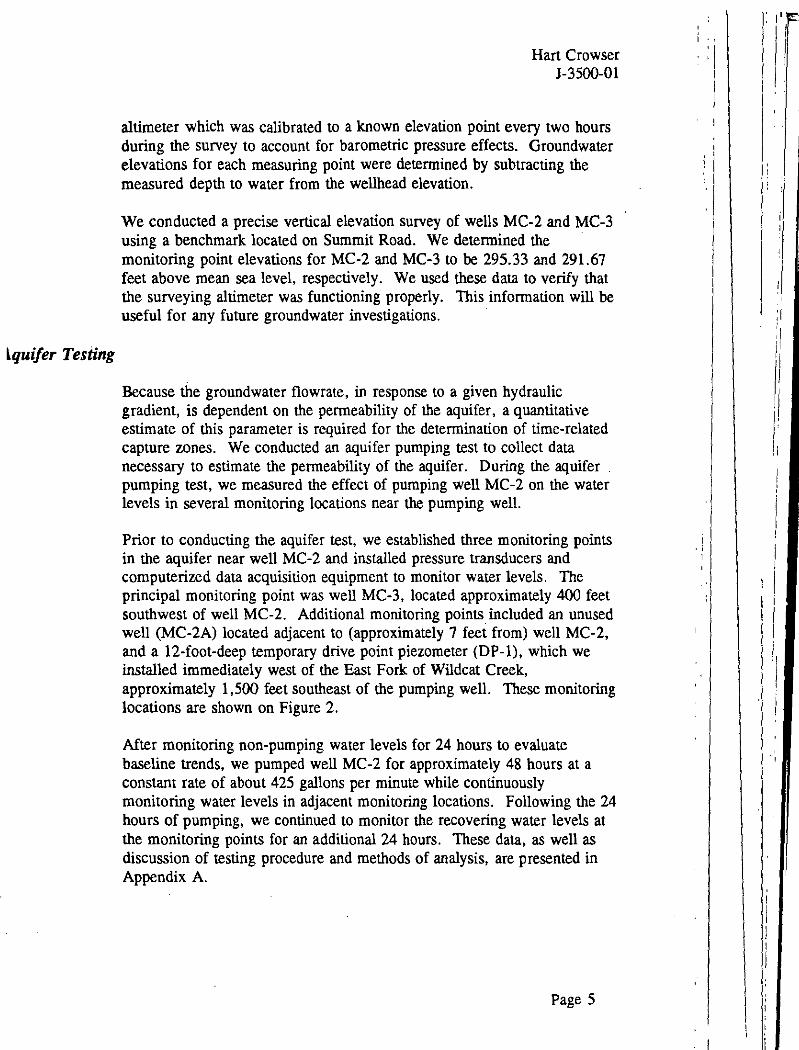
altimeter which was calibrated to a known elevation point every two hours during the survey to account for barometric pressure effects. Groundwater elevations for each measuring point were determined by subtracting the measured depth to water from the wellhead elevation.
We conducted a precise vertical elevation survey of wells MC-2 and MC-3 using a benchmark located on Summit Road. We determined the monitoring point elevations for MC-2 and MC-3 to be 295.33 and 291.67 feet above mean sea level, respectively. We used these data to verify that the surveying altimeter was functioning properly. This information will be useful for any future groundwater investigations.
Because the groundwater flowrate, in response to a given hydraulic gradient, is dependent on the permeability of the aquifer, a quantitative estimate of this parameter is required for the determination of time-related capture zones. We conducted an aquifer pumping test to collect data necessary to estimate the permeability of the aquifer. During the aquifer pumping test, we measured the effect of pumping well MC-2 on the water levels in several monitoring locations near the pumping well.
Prior to conducting the aquifer test, we established three monitoring points in the aquifer near well MC-2 and installed pressure transducers and computerized data acquisition equipment to monitor water levels. The principal monitoring point was well MC-3, located approximately 400 feet southwest of well MC-2. Additional monitoring points included an unused well (MC-2A) located adjacent to (approximately 7 feet from) well MC-2, and a 12-foot-deep temporary drive point piezometer (DP-1), which we installed immediately west of the East Fork of Wildcat Creek, approximately 1,500 feet southeast of the pumping well. These monitoring locations are shown on Figure 2.
After monitoring non-pumping water levels for 24 hours to evaluate baseline trends, we pumped well MC-2 for approximately 48 hours at a constant rate of about 425 gallons per minute while continuously monitoring water levels in adjacent monitoring locations. Following the 24 hours of pumping, we continued to monitor the recovering water levels at the monitoring points for an additional 24 hours. These data, as well as discussion of testing procedure and methods of analysis, are presented in Appendix A.
Page 5
I
'' I
' ·,

Hart Crowser J-3500-01
'And Use Survey
We conducted a preliminary land use survey in the McCleary area to identify potential sources of groundwater contan1ination. This survey was conducted to get a general idea of the land uses and the type of sources to be expected, and to identify anything that could be an immediate threat to the wellfield. A more detailed survey will likely be required to comply with the state Wellhead Protection Program (Washington State Department of Health, 1993).
Due to the reasonably undeveloped nature and manageable size of the Wildcat Creek Valley, we elected to conduct a "windshield survey" of the entire valley to identify potential land use concerns. That is, we drove through the area guided by the telephone directory yellow pages (PTI Communications, 1993) and identified land uses and facilities that could be associated with potential groundwater contamination.
There were two types of potential sources identified in our survey: point sources associated with specific activities at specific places; and non-point sources, which are areally extensive and may be associated with a variety of contamination mechanisms such as transportation accidents and domestic wastewater disposal. The potential point sources we identified are listed in Table 1 and illustrated on Figure 6. Non-point sources of concern to the wellfield include the Burlington Northern Railroad, Highway 108, and an area of unsewered homes along the Elma-Hicklin Rd as shown on Figure 6.
HYDROGEOLOGIC CONDffiONS (CONCEPTUAL MODEL)
Geology
Developing an understanding of the groundwater system was our primary goal. This understanding is necessary for selecting and implementing the modeling tools used for capture zone calculation. We used the results of our review of existing data and field testing to develop a conceptual model. The conceptual model consists of our understanding of the configuration and characteristics of the aquifer, and how groundwater is moving through it. Developing this conceptual picture not only helps us model the system and evaluate aquifer vulnerability, but it also helps identify areas where limited data create uncertainty in our results.
Our geologic interpretation was developed from our field reconnaissance, existing well log information, extrapolation of regional information
Page 6
I '
I
I
. I
I
t
i
I'
, I
I •I [, II I It I•
1)
I I
I '

Hart Crowser J-3500-01
contained in Logan (1987) and Carson (1970), and soil studies (Pringle, 1986).
The general surficial geology of the area is depicted on Figure 2 and by the geologic cross sections shown on Figure 4. Figure 3 shows the locations of the cross sections. The geology consists of a sequence of recent alluvial and glacial sediments overlying bedrock to depths of up to approximately 100 feet. The boundaries of the aquifer, shown on Figure 3, generally follow the bedrock topography. Uncertainty in the location of the boundary, indicated by dots on Figure 3, exist in some areas because of a lack of well log information. Although it is likely that recharge to the aquifer occurs from areas beyond this boundary, shallow outcrops of bedrock in a close vicinity to these areas suggest that the area outlined on Figure 3 represents the principal area of the aquifer.
Within the valley, the deposits in the first 10 to 20 feet tend to be composed of silt, sand, clay, and peat, and are likely to be of recent alluvial origin. These deposits are underlain by glacial outwash materials, which form the aquifer. The outwash consists of reasonably permeable sand and gravel with some silt and clay.
Although the overlying alluvial material is generally fmer-grained and therefore less permeable than the aquifer material, the aquifer is still vulnerable because the overlying deposits are relatively thin and of variable character. Most of the surficial soils of the vallry floor mapped by Pringle (1986) are also highly permeable.
Groundwater Conditions
Groundwater in most wells in the valley is encountered at depths of 10 to 20 feet below ground surface. The fme-grained materials at the surface create a partial confining layer in many locations. Figure 3 shows the groundwater elevations as measured in July 1993. Most groundwater in the valley likely enters the aquifer as direct precipitation recharge. The flow is from the northeast to southwest with a gradient of 0.009 ftlft. Discharge from the aquifer is likely to be to Wildcat Creek as it leaves the valley.
Aquifer Characteristics
We used the data from the aquifer test on well MC-2 to determine aquifer characteristics. The data from the aquifer test and a description of the data analysis methods are contained in Appendix A. The data show a recharge effect (i.e., a slowing of the rate of drawdown) after approximately 2.5 hours of pumping. Our analysis indicates that the formation tapped by the
Page 7
I ,.
I I
I
'• ,,

Han Crowser J-3500-01
McCleary wells is a "leaky confmed aquifer" with a transmissivity of 25,000 to 30,000 gpd/ft, and a storage coefficient of 0.001. A leaky confined aquifer has an overlying layer that is partially confming and allows water to drain from or through it as the aquifer is drawn down. This is consistent with our geologic interpretation which shows fme-grained strata above the principal aquifer material. It is also possible that effects of recharge from Wildcat Creek through the alluvial layer explain, in pan, the recharge effect seen in the later time data.
Wellfreld Recharge Area
A generalized concept of the recharge area for a wellfield may be developed by considering aquifer boundaries, the direction of regional groundwater flow, and the Wildcat Creek watershed area. The primary area for recharge (infiltration of precipitation to the aquifer) likely occurs within the boundary of the aquifer as shown on Figure 3. However, additional recharge is likely received from runoff in the surrounding watershed area of the Wildcat Creek drainage. In fact groundwater elevations coincident with Wildcat Creek elevation in the 90 and 100 meter contour areas suggest some surface water/groundwater interaction occurs. Based on this understanding, we identified the area shown on Figure 5 as the generalized recharge area of the wellfield.
WELLFlELD CAPTURE ZONES
We conducted a capture zone analysis to determine areas within the generalized recharge area where the McCleary weilfield is most vulnerable to land use impacts. Capture zones may be used to define wellhead protection areas under the proposed Washington State Wellhead Protection Program (Department of Health, 1993).
Delineation Approach
According to the state Draft Wellhead Protection Program, considerable flexibility will be allowed in the methodology used for delineating timerelated capture zones. For this study, we elected to use a numerical modeling method, which is one of the more sophisticated approaches available. In its most basic form, as has been implemented, this approach requires a similar level of effort as the simpler methodologies. The benefit of using such an approach is that more detail and predictive accuracy may be added in the future, if necessary. The approach consists of simulating groundwater elevations and conducting a pathline analysis to defme capture zones. Appendix B provides a more detailed description of the
Page 8
. I
I I I
' I
I

Hart Crowser J-3500-01
groundwater modeling and capture zone calculation procedures, as well as discussions of input parameters and assumptions.
Groundwater Flow Modeling
Groundwater flow modeling is used to simulate groundwater elevations across an aquifer that are consistent with hydraulic parameters estimated from the aquifer test analysis and actual field measurements of groundwater elevations. The model predicts groundwater elevations in greater detail than can be practically measured in the field.
We implemented our numerical approach for solving the groundwater flow equation with the computer code PLASM (Prickett and Lonquist, 1971). This approach allows the simulation of two-dimensional steady flow of groundwater in heterogeneous aquifers. The model can easily consider spatially varying hydraulic conductivity should more data become available in the future. The model also has sufficient uexibility to allow it to simulate transient groundwater flow, if necessary. Simpler approaches do not provide this flexibility, and do not consider important aquifer characteristics such as non-uniform flow due to boundaries and aquifer recharge. Both of these factors are considered by the numerical modeling approach used for this study.
Time-related capture zones are typically based on "steady-state" groundwater elevations. That is, short-term temporal changes in groundwater levels are not considered, and groundwater pumping rates in the simulation are set at a constant value based on yearly averages for pumping. To develop a steady-state pumping rate for the McCleary wellfield, we determine how much water is pumped in an average year and selected a pumping rate to achieve this quantity if the pump were operated continuously. This is a reasonable approach given the length of the travel time criterion used for the capture zones (i.e., 1, 5, and 10 years). For the McCleary wellfield, records of monthly pumping for 1991 and 1992 indicate that the well probably operates an average of 10 hours per day at a rate of 425 gpm. Therefore, we assumed a steady-state pumping rate of 200 gpm.
Capture Zone Calculation
Capture zones are determined by defining groundwater flow pathlines based on the gradients set up by the modeled groundwater elevations, and calculating travel times along the pathlines based on hydraulic conductivity values. Using the modeled groundwater elevations, we calculated 1-, 5-, and 10-year capture zones for well MC-2 using the computer code GWPATH (Shafer, 1987b). Well MC-3 is typically only used as a backup,
Page 9
I
I I
' ·I

Results
Hart Crowser J-3500-01
and located quite close (approximately 400 feet) to MC-2. Therefore, capture zones would be quite similar if MC-3 were to be operated exclusively instead of MC-2.
The 1-, 5-, and 10-year capture zones for the McCleary wellfield are shown on Figure 6. The location of potential contaminant sources and existing land use plans are also shown on this figure. The capture zones, which are approximately 2,000 feet wide, intersect several potential sources of contamination located to the northeast of the wellfield.
It is important to recognize that these modeled capture zones are subject to uncertainty (Varljen and Shafer, 1991). This uncertainty, which could be quantified with a more rigorous study, is inherent to all studies of this nature. The uncertainty is unavoidable because it is not possible to have perfect knowledge of the aquifer and its hydraulic properties. In the recommendations section below we suggest two approaches for addressing this uncertainty when defining the wellhead protection area.
RECOMMENDATIONS
We have defined the hydrogeology of the Wildcat Creek Aquifer, determined approximate time-related capture zones for the McCleary wellfield, and conducted a preliminary land use assessment to evaluate potential threats to water supply. We conclude that the McCleary water supply is most vulnerable to contamination northeast of the wellfield within the capture zones shown on Figure 6, and secondarily within the recharge area outlined on Figure 5.
Our recommendations for wellhead protection are based on the vulnerability of the aquifer and the lack of an existing alternative water supply for the city. In the interest of ensuring a continuous, safe water supply, we recommend that the City consider the activities discussed in the following sections.
Take Immediate Actions
Of immediate concern are four facilities, which pose the potential to affect the wellfidd (numbered I, 2, 3, and 17 on Figure 6), the Burlington Northern Railroad and Highway 108 corridors, and areas of unsewered housing. We recommend the following actions to immediately address these potential sources of contamination.
Page 10
" I
.I
! I
' i,

Notification
Hart Crowser J-3500-01
Inform persons responsible for the identified potential contaminant sources that they are located in a wellhead protection area. Also notify the federal, local, or state agency having jurisdiction over the potential contaminant source.
Education
Initiate a public outreach and educational program concerning the water supply and potential means of contamination. The Washington State Department of Health will likely require such a program and it will be one of the most immediately effective measures for preventing future problems, since most of the recharge areas for the wellfleld are located outside the City Limits, and therefore beyond the City's ability to directly control without interagency coordination. These programs are also especially effective for managing household hazardous waste issues.
lAbeling
Install wellhead protection area boundary signs for transportation corridors. This low cost action not only encourages extra care within the wellhead protection area, but also functions to increase the level of awareness of local residents.
Petition EPA for a Sole Source Aquifer Designation
We recommend petitioning the Environmental Protection Agency (EPA) to designate the Wildcat Creek Aquifer as a "sole source" aquifer. The Sole Source Aquifer Designation Program is a federal program mandated by the Safe Drinking Water Act. According to the Act, an aquifer may be designated as a sole source aquifer if "the (EPA Regional) Administrator determines, on his own or upon petition, that an area has an aquifer which is the sole or principal drinking water source for an area and which, if contaminated, would create a significant hazard to public health."
After EPA designates a sole source aquifer, a notice is published in the Federal Register. After this notice is published, "No commitment for federal financial assistance (through grant, contract, loan guarantee, or otherwise) may be entered into for any project which the Administrator determines may contaminate such an aquifer. . . "
Although the effect of evaluating federal projects in the area by itself will not address existing issues, we recommend petitioning for the designation because it will give the aquifer publicity and raise the level of awareness
Page ll
I
11
r/ 'I
l I
I
I
I i
: I I I : I ! I i I I I'
. II
I II I I ! . I I
:I .
I I , ,i
,I
I
---~---
Hart Crowser J-3500-01
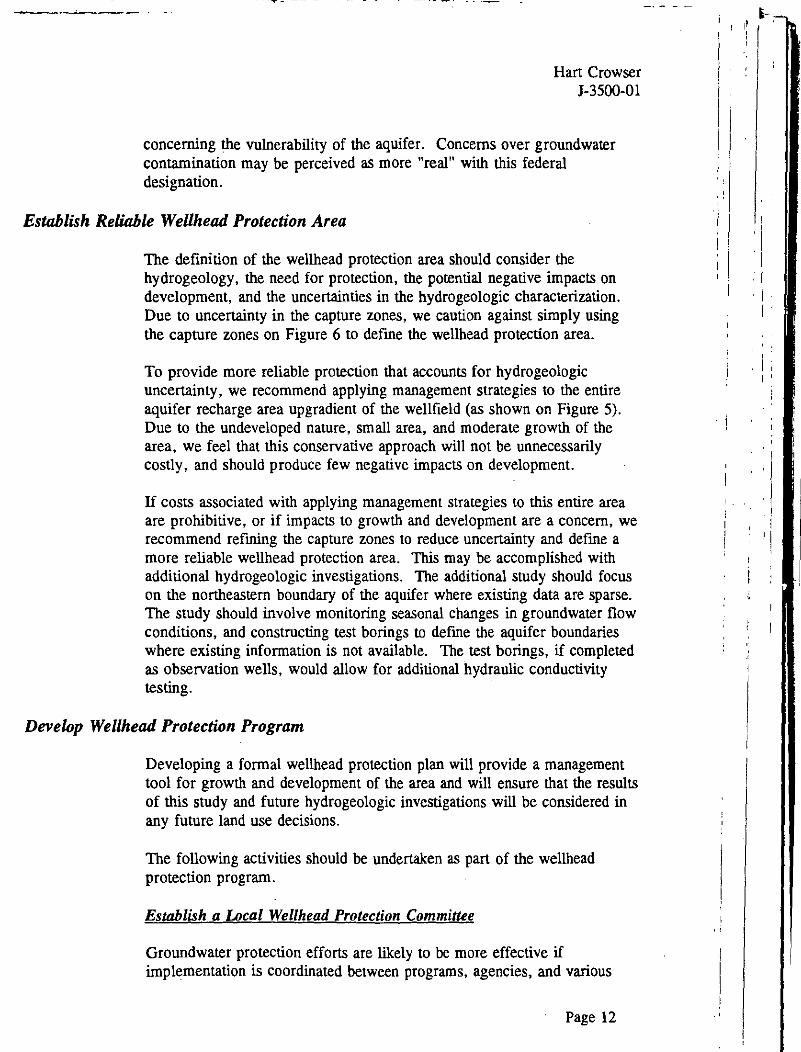
concerning the vulnerability of the aquifer. Concerns over groundwater contamination may be perceived as more "real" with this federal designation.
Establish Reliable WeUhead Protection Area
The definition of the wellhead protection area should consider the hydrogeology, the need for protection, the potential negative impacts on development, and the uncertainties in the hydrogeologic characterization. Due to uncertainty in the capture zones, we caution against simply using the capture zones on Figure 6 to defme the wellhead protection area.
To provide more reliable protection that accounts for hydrogeologic uncertainty, we recommend applying management strategies to the entire aquifer recharge area upgradient of the wellfield (as shown on Figure 5). Due to the undeveloped nature, small area, and moderate growth of the area, we feel that this conservative approach will not be unnecessarily costly, and should produce few negative impacts on development.
If costs associated with applying management strategies to this entire area are prohibitive, or if impacts to growth and development are a concern, we recommend refining the capture zones to reduce uncertainty and defme a more reliable wellhead protection area. This may be accomplished with additional hydrogeologic investigations. The additional study should focus on the northeastern boundary of the aquifer where existing data are sparse. The study should involve monitoring seasonal changes in groundwater flow conditions, and constructing test borings to defme the aquifer boundaries where existing information is not available. The test borings, if completed as observation wells, would allow for additional hydraulic conductivity testing.
Develop WeUhead Protection Program
Developing a formal wellhead protection plan will provide a management tool for growth and development of the area and will ensure that the results of this study and future hydrogeologic investigations will be considered in any future land use decisions.
The following activities should be undertaken as part of the wellhead protection program.
Establish a Local Wellhead Protection Committee
Groundwater protection efforts are likely to be more effective if implementation is coordinated between programs, agencies, and various
Page 12
; . ' ': I I
!
,, 1 I
I I , '
' . I ' I '
I i
i 'I
'

• "'KST s;- • ---,----, -- ---· -""---:..-- --
Hart Crowser J-3500-01
levels of government. Representatives from all affected jurisdictions, regulatory agencies, and other constituents (private sector, citizens groups, and media) should be participants.
Conduct a More Detailed Source Assessment
Our preliminary assessment identified obvious issues; however, a more detailed assessment should be undertaken and will likely be required by the Department of Health. Also, a detailed management plan cannot be developed until a detailed source inventory is complete. The assessment will need to be expanded to identify specific threats. For example, the detailed assessment should identify specific chemicals, underground storage tanks, etc. that are associated with each land use.
The wellhead protection section of a Water System Plan will have to include documentation of how the detailed inventory was conducted and what follow up work was done to contact both the identified potential contaminant sources as well as the federal, local, or state agency having jurisdiction over the potential contaminant source. In light of our preliminary assessment, we recommend the following for the detailed assessment:
... Conduct a field search for domestic wells (especially improperly decommissioned wells) that may be a potential direct conduit for contamination to reach the aquifer;
... Determine if nitrates from residential septic systems are a potential source by sampling and analyzing domestic wells; and
... Identify specific threats (hazardous chemicals, underground storage tanks, etc.) associated with properties by reviewing federal, state, and local databases dealing with commercial permits and performing real estate title searches.
The results of this survey should be carefully documented and prioritized for additional action as needed.
Develop a Source Management Plan
In addition to the immediate management actions recommended, other longer term management strategies should be part of the wellhead protection program. Development of other management strategies will require identification of existing authorities at the local, state, and federal levels, and an understanding of interagency cooperation. We also cannot recommend specific long-term strategies without completing the detailed
Page 13
I II
I !
! I
I I I i
I
I i
i I
I I
I

•
~.--- ----------------------------
Hart Crowser J-3500-01
source assessment. Therefore, our goal at this time is to present possible source management options, rather than specific courses of action.
When presenting source management options, it is useful to consider the level of protection that should be required in each zone of the wellhead protection area. General guidelines for source management for each capture zone identified in the state Draft Wellhead Protection Program (Department of Health, 1993) include:
1-Year Capture Zone. Within this zone, the water supply should be protected from microbial contamination and direct chemical contamination. To accomplish this, chemicals capable of contaminating groundwater should not be stored or used, or should be used with sufficient precautions to protect the groundwater resource. The 1-year capture zone should be intensely monitored to provide response time.
5-Year Capture Zone. Source management in this zone should be conducted similarly to that in the 1-year capture zone. Within this zone, potential sources should be identified and controlled with an emphasis on pollution prevention and risk reduction management. This zone will also be used by agencies for targeting inspections and enforcement actions.
10-Year Capture Zone. Source management within this zone may be less active, although high risk sources should be identified and actively managed. The zone is defined to encourage planning to recognize the long-term source of drinking water to allow the community to plan and site future high risk sources outside the recharge area.
Based on the issues of hydrogeology and current land use that we have identified during this study, we feel that the following source management options may be appropriate and should be considered in the wellhead protection program:
'" Source Removal. Household hazardous waste collection decreases the possibility of improper disposal and accidental spillage. If nitrates are identified as a problem, city sewers could be extended to replace on-site wastewater (septic tank) disposal.
'" Land Use Management. Zoning in the wellhead protection areas should be changed to prevent industrial and urban-type land uses from locating ii) the capture zones.
'" Ordinances. Groundwater protection ordinances could include facility design requirements, operating standards, and direct spill reporting requirements for facilities located in the capture zones.
Page 14
~----l
I
i : I
j·
I . I
Hart Crowser J-3500-01
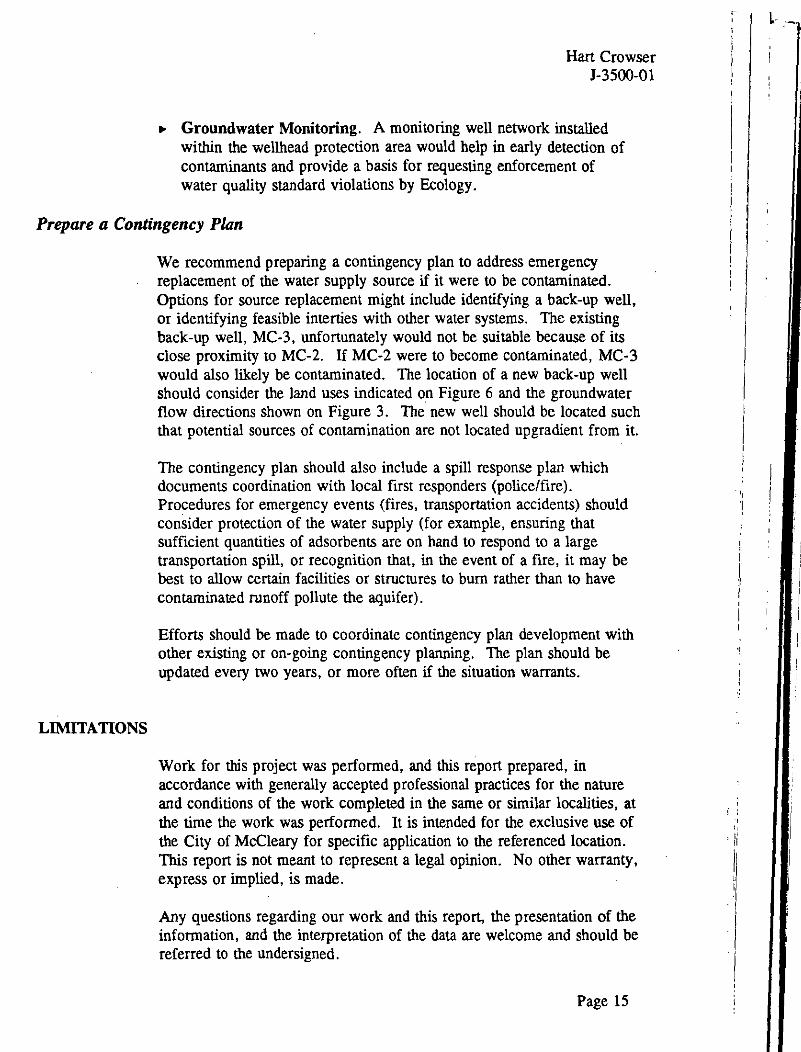
.,. Groundwater Monitoring. A monitoring well network installed within the wellhead protection area would help in early detection of contaminants and provide a basis for requesting enforcement of water quality standard violations by Ecology.
Prepare a Contingency Plan
LIMITATIONS
We recommend preparing a contingency plan to address emergency replacement of the water supply source if it were to be contaminated. Options for source replacement might include identifying a back-up well, or identifying feasible interties with other water systems. The existing back-up well, MC-3, unfortunately would not be suitable because of its close proximity to MC-2. If MC-2 were to become contaminated, MC-3 would also likely be contaminated. The location of a new back-up well should consider the land uses indicated on Figure 6 and the groundwater flow directions shown on Figure 3. The new well should be located such that potential sources of contamination are not located upgradient from it.
The contingency plan should also include a spill response plan which documents coordination with local first responders (police/fire). Procedures for emergency events (fires, transportation accidents) should consider protection of the water supply (for example, ensuring that sufficient quantities of adsorbents are on hand to respond to a large transportation spill, or recognition that, in the event of a fire, it may be best to allow certain facilities or structures to burn rather than to have contaminated runoff pollute the aquifer).
Efforts should be made to coordinate contingency plan development with other existing or on-going contingency planning. The plan should be updated every two years, or more often if the situation warrants.
Work for this project was performed, and this report prepared, in accordance with generally accepted professional practices for the nature and conditions of the work completed in the same or similar localities, at the time the work was performed. It is intended for the exclusive use of the City of McCleary for specific application to the referenced location. This report is not meant to represent a legal opinion. No other warranty, express or implied, is made.
Any questions regarding our work and this report, the presentation of the information, and the interpretation of the data are welcome and should be referred to the undersigned.
Page 15
• '
' i : ' ,,
; li
I
I I '
L-

_ _.. ___ - ---- ----·
Hart Crowser J-3500-01
We enjoyed working with you on this project and we trust that this report meets your current needs.
Sincerely,
HART CROWSER, INC.
LORI J. HERMAN Senior Associate UH:cen WP601HYDROGEO.FR
Page 16
I I
I' I
I I
I 1
' ''

REFERENCES
.. --..- --·--
Hart Crowser J-3500-01
Bauer, H.H. and J.J. Vaccaro, 1987. Percolation Model for Estimating Groundwater Recharge. USGS Open-File Report 86-536. U.S. Geological Survey, Tacoma, Washington.
Byrne-Stevens & Associates, Engineers, Inc., 1977. Comprehensive Water Plan for the Town of McCleary.
Carson, Robert James, 1970. Quaternary Geology of the South-Central Olympic Peninsula, Washington, University of Washington Doctor of Philosophy thesis, 67 p., 4 plates.
Eddy, P .A., 1966. Preliminary Investigation of the Geology and GroundWater Resources of the Lower Chehalis River Valley and Adjacent Areas. Water Supply Bulletin No. 30. Washington State Department of Conservation, Olympia, Washington.
Freeze, R.A. and J.A Cherry, 1979. Groundwater. Prentice-Hall, Inc. Englewood Cliffs, N.J.
Logan, Robert L., 1987. Geologic Map of the South Half of the Shelton and the South Half of the Copalis Beach Quadrangles, Washington, Washington State Department of Resources Open File Report 87-9, December 1987.
Molenaar, Dee and J.B. Noble, 1970. Geology and Related Groundwater Occurrence, Southeastern Mason County, Washington, Washington Department of water Resources Water Supply Bulletin 29, 145 p. Geologic Map: Plate 1, Geology of Southeastern Mason County, Washington, scale 1:62,500.
Peaceman, D.W. and H. H. Rachford, Jr. 1955. The numerical solution of parabolic and elliptic differential equations. Journal Society of Industrial and Applied Mathematics, v. 3, pp. 28-41.
Prickett, T.A. and C.G. Lonquist, 1971. Selected Digital Computer Techniques for Groundwater Resource Evaluation. lllinois State Water Survey Bulletin 55. Champaign, Illinois.
Pringle, R.F., 1986. Soil Survey of Grays Harbor County Area, Pacific County, and Wahkiakum County, Washington. USDA Soil Conservation Service.
Page 17
~ -·
I
: i ' I ' '
I i ' '
:I I i
' I
!
I I

Hart Crowser J-3500-01
PTI Communications, 1993. Telephone Directory for Montesano, McCleary and Elma, Washington.
Shafer, J.M., 1987a. Reverse pathline calculation of time-related capture zones in non-uniform flow. Ground Water. v. 25, no. 3, pp 283-289.
Shafer, J.M., 1987b. GWPATH: Interactive Groundwater Flow Path Analysis. lllinois State Water Survey Bulletin 69. Champaign, lllinois.
Varljen, M.D. and J.M. Shafer, 1991. Assessment of Uncertainty in Time-Related Capture Zones Using Conditional Simulation of Hydraulic Conductivity. Groundwater, vol 29, no. 5, pp. 737-748.
Walton, W.C., 1962. Selected Analytical Methods for Well and Aquifer Evaluation. lllinois State Water Survey Bulletin 49. Champaign, IL.
Washington State Department of Health, 1993. Draft State Wellhead Protection Program. Olympia, Washington.
Page 18
I , I

Table 1 · Potential Point Contaminant Sources
Map Number Address
1 96 Elma-Hicklin Road
2 Elma-Hicklin Road
3 162 North Summit Road
4 Church Rd./Elma-McCleary Road
5 Elma-McCleary Road
6 157 Elma-McCleary Road
7 Elma-Hicklin Road
8 Elma-Hicklin Road
9 Elma-McCleary Road
10 Elma-McCleary Road
11 3rd Street & Fir Street
12 Simpson A venue & Summit Road ·
13 Simpson A venue
14 Simpson Avenue
15 Simpson Avenue
16 3rd Street
17 160 North Summit Road
Hart Crowser J-3500-01
Description/Business Name
Grays Harbor Shake
Former Logging Equipment Maintenance Facility
Quality Lumber Remanufacturing
Former Gas/Service Station, Existing Junk Yard
Jack's Welding/Fabrication, Former DOT Maintenance
Sunrise Autobody
Alternator/Generator Rebuild
Gravel Pit w/ Garbage & Junk Autos
Auto Service/Junk Autos
Cemetery
Former Gas/Service Station
Former Gas/Service Station
Former Gas/Service Station
Active Gas Station
Simpson Door Factory
McCleary City Maintenance Shop
Brooks Timber
Page 19

~
\:5 (5 c ~ !:!; (5
~
0 20 40
Approximate Scale in Miles
.. .. H/!mOWWSER J-3500-Qt Figure 1
3/94
_,.
,,
~l
·: '
·,
-i
.... _. -
_j
J _]
_)
]
I -. 1
u I
-- -- ---- - ·- - -·-McCleary Study Area Map Showing Surficial Geology
' ' ' . / • - • I
/ // \
I I .. -c I
~/·._ I I
I ,, I /
/
/e v
--- Geologic Contact
!Oall Alluvium
fOOVl Vashon Outwash
!Odpl Pre- Vashon Drift
I Tic I Lincoln Creek Formation (Sedimentary Rock)
I Tcr I Crescent Formation (Volcanic Rock)
·~1C-1 City Supply Well Location and Number
•DP-1 Drive Point Piezometer Location and Number
Note: Geology based on Logan, 1987.
0 2000 4000
Scale in Feet
l CiLJ N m
' ~JMJJ J-3500-01 3194 Figure 2

.. Groundwater Elevation Contour and Aquifer Boundary Map
'I
l_ .I ?
\ --7--- . ---~--
____ ...:.~? .- - . I /
r -r.-~lr/l·~' / 1 . I
' . I
.' ·.·.J: . - ,, / -- '·-.·--;-/ / •,
J -. / .
. . /' . i'·-·,
./:'
\ / .
~ ' - I I I
·., ,.......----. . : .... :·--\- \· . 'j "' ( ii} ~·
) .· .. f r>/ ·: r ) .{ _ _.-
) .. ::·.:-
I __J
/
., ..'I ;
•.-J ,· ..1 • '.
\ I I 6 ... -c I i ,,, I
\__l.r I / 1
~ N
~ 8 MC-1 City Supply Well
Location and Number
~2R01 Domesk Well Location and Number
296.26
--75--
A A' t __ ..t
___ ......,_
Groundwater Elevation in Meters (7/93)
Groundwater Elevation Contour in Meters
Approximate Aquifer Boundary
Geologic Cross Section Locot'1on and Designation
Groundwater Flow Direction
Note: Bose mop topogr::phic elevations cxQressed in m~ters (10 meter contour inten,.~!).
0 2000
Scale in Feet
J-3500..01 Figure 3
4000
3194

-l J
• _.
• • 1 _.
• ' J
• ll
•
Geologic C . ross
A 400
-~ 300 u._
.S c: .'2 -0 > Q) w 200 -
100
8 400
-~ 300 u._
c: .'2 -0 > Q)
w 200
100
-'< Q) Q) L
u
-'< L 0
u._
Sections A-A'
~
0 ::;; 10 ~
and 8-8 ·
-" Q) Q) L
u
.....
A-A'
__ _]_ __
-'< Q) Q) L
u
8'
A'
O
Horizontal. Scale ,·n Feet
~~~~~10~0~0~~--~ 0 2000
v r 100 er Jcal Scale in F 200 Vertical Exa eet ggeration x 10
Horizon tal 0 Scale in Feet
0 Vertical Vertical
1E01
MC-2
Note:
2000 4000
200 100 Scale in Feet Exaggeration X 20
Domestic Well N Ct umber
I y Sup pi y. Well W Number
ell Location
Groundwater L eve I
Screened S . ect1on
Refer to =i Cross Se~t_gure 3 for
Jon lac t· a mns
[){];(jlffJ[J@M:§l'l'~ J-3500-01 Figure 4 3/94

•• I I l
• -• t
• •
"v "u r 0 0 0
"'
-- / )
I I
~:j,j . --~;
'"' I ....--- !' __ _
"
' -
r (
J
... :-,:
I I I I
--
I I
.· t-~ .·
:· . ''.>
6
'/ ·-..;.,~·
;:/
,. ,;-:..
,,_:j'----'~~~
C·t Supply Well I Y d N mber Location on u
R h rge Area Primary ec 0 . V7 7J7;7J based on ApproXImate l::.L'i /1 /.L:J Aquifer Boundary
. Well field Recharge r . . .. I Area based an - -_ --....., Generol,zed Wildcat Creek
L __ -_·._· .. d Watershed DIVIde
--···- f Water Divide Sur ace .
--- Upgrodient Aquifer Area Boundary
I N
' 0 2000 4000 Scale in Feet
BB ~ J-3500-01 Figure 5
3/94

~ g 0
"' ...,
Land Use ---i i
-'
/ ~ I
' ''
Map and Time-Related
'2JA\· .--.·-.>- .- ... - _J .-_ \
-·- . .
Capture I
Zones I
·I
F ores ~/Open Space
Rurc! Residential
Urbac:zing
Urban Residential
Commercial
Industrial
Public/Semi-Public
T ~ Yecr Capture Zone Bourdary
••••••• • Gro\.i."1dwater Flow Line
0
Welif:eld Recharge Are8
Potential Point Source Location and Number (Refer to Table 1 for address and description)
Poteoliol Non-Point Source Locations of Immediate Concern (Refer to text for description)
2000 4008
Scale in feel
J-3500-01 Figure 6
3/94

"·
'-··
·~ · ..
•. : >',
·.;-.
.. :-
· .. ·'
" -.·
"•
;._
.... '.·
· ...
,< -,
. . : .
. : -·-
·.·. ..··
) ••• ",!:-.
Hart Crowser J-3500-01
APPENDIX A ,AQUIFER TEST PROCEDURES AND RESULTS
' . :
.. "'·-·
._, _-
. : ..
-·,=
..
.·' .
,·
I "! .,_.._,.
I
• < ••• - .
-_,·
. .• "! ...... ,
·!.-_
' _,
' •. .. , \, . . -} . . , .· ..·---;

Hart Crowser J-3500-01
APPENDIX A AQUIFER TEST PROCEDURES AND RESULTS
The McCleary Well aquifer test was conducted between July 26 and 30, 1993. 24 hours prior to starting the test, pressure transducers and data Joggers were installed in the observation wells MC-2A, MC-3, and DP-1. The City filled the storage tank, then removed the well from service for approximately 8 hours. The test was started at 7:10a.m. on July 27, 1993, and was conducted by pumping water directly into the system. The pumping portion of the test was conducted for 2,994 minutes until 9:04 a.m. on July 29, 1993. At that time the well was shut off and allowed to recover for approximately 24 hours until 9:30 a.m. on July 30, 1993. The average pumping rate used for our analysis was determined to be 425 gpm based on the totalizing meter at the wellhead. Periodic measurements made on a flowmeter adjacent to the wellhead during the test confirmed this flowrate.
Aquifer Test Data and Analyses
We used the data from the aquifer pumping test conducted on well MC-2 to estimate aquifer properties to be used in the capture zone analysis. Graphs of drawdown versus time after pumping started were used to solve formulas which express the relation between the hydraulic properties of an aquifer and the lowering of water levels in the vicinity of the pumped well.
Methods of aquifer test analysis are described in detail by Walton (1962). For this analysis, we used a curve-matching technique to estimate aquifer transmissivity (permeability times aquifer thickness). To use this technique, observed drawdown data are matched to theoretical "type curves," which have been developed for different types of aquifers with various properties. Each type curve has a set of parameters associated with it. The parameters of the curve that best matches the observed data are then used in a formula to calculate transmissivity.
Figures A-1, A-2, and A-3 show the observed drawdownlrecovery data for monitoring locations MC-3, MC-2A, and DP-1, respectively. The data from well MC-2A were not used in the analysis due to the uncertain construction of the well (there is no well logs, it is shallower than the others suggesting partial penetration of the aquifer), which could bias the results. Additionally, the drawdown data was lost in translation from the transducer equipment to the desk top system. Data from DP-1 were not used because it was not possible to distinguish water level changes that might have been caused by the pumping test from those caused by fluctuations in the nearby East Fork of the Wildcat Creek.
Page A-1
•
I! 'I
It
'I
I
I I ! I ' I
~ , I ! : I
:
I I
I I

Hart Crowser J-3500-01
MC-3 provided the best data for analysis. Figure A-1, a semi-log plot of the MC-3 data and Figure A-4, a log-log plot of the MC-3 data indicate a "recharge" type effect in the data after about 300 minutes of pumping. This recharge effect is shown by a decreased rate of drawdown and typically occurs as another source of water is supplied to the well. This can be from the drawdown core of the well intersecting a more transmissive portion of the aquifer, a surface water source, or as leakage from water storage in overlying materials. In this case we believe the recharge effect is from leakage based on the hydrogeologic conditions in the vicinity of the well and a Theis curve matching analysis.
To allow a Theis curve matching analysis, data from well MC-3 were plotted on a log-log graph (Figure A-4). The MC-3 drawdown data very closely matched the type curve of a leaky confined aquifer under nonsteady state conditions at leak and factor of 0.4. Analysis of semi-log data plots of the data using Jacob Cooper methods was not used because the validity condition of U ~ 0.01 was not met until between 400 and 700 minutes into the test at which time the recharge effect was already seen.
The drawdown data from well MC-3 do not match a "Theis" type curve (also shown on Figure A-4), which describes drawdown from an ideal confined aquifer of infinite extent. The actual drawdown observed during the test is less than what would be expected for an ideal aquifer, indicating that the aquifer is receiving recharge that is offsetting the drawdown. The data matched a curve for a "leaky confined aquifer" with a transmissivity of 25,000 to 30,000 gpd/ft and a storage coefficient of 0.001.
The original time-drawdown and time-recovery data are not produced in this report because of the volume (measurements were obtained every 5 to 15 seconds for 4 days) but can be obtained upon request from the City of McCleary.
HYDROGEO.FR
Page A-2
• : b ' ~
I . ' '
; I : I

~
)
Residual Drawdown below Static Water Level in Feet
&. = 0 0 ~
0 0 0 ~
0 0 ~
/
0 ~// ~
f!} 7
0 N
~ ~
I" Af'' _,#'
<!?-
/' / / 'r.
0 0
0 0 N
0 n
0 v
L-~ r
L...-
0 n
<l<l <l
<l
0 v
Drawdown below Static Water Level in Feet
0 0 0 ~
rn
"' -:> c :::;;;
c
0 C1)
~ E
0
0 I{)
.. ..
f.= 0> c 0..
E :>
0..
0> c ·c._ E :> a. .... .... .... a 0 ..., t=> 0.!: ...,(f)
V1 0..
VE <>:> .~a...
(/)
Cl)~ E.!:':
j.::U>
-<1)
BE o·-t-1-
II II ...,:;..,
E 0.. 0>
U) N
O<lv 0 .. -ov 0+'..-ao o
Otr c 3:~0> ovc
"0 >·c.. "'oE ~~:J 00:0..
HIJRTCROWSER. J-3500-D 1 4/94 . Figure A-1
I I
I I
i I I ! I i I I I I I I
I . : I ' J I I
' I ' I
i '

c:R = 0 0
0 0 0 ~
0 0
0
0 0
Residual Drawdown below Static Water Level in
0 0 q 0 ~ N r<) .t
. P"
~
~ ,-
0 0 0 0 N r<) ....
Drawdown below Static Water Level in Feet
Feet
qo LflCJ
0 0
0 0 0
.~
0 Ill
~ E l=
0
~
q l{)
C7> c a. E :J [L
.. ..
C7> c ·c.. E :J [L~ ..... ~o 0 ~
t"' o-'= ~(/)
(/)a. VE g:;,
·-ll._
"' v~ E.~
i=to? -Q)
BE ~l= II II
E c._ C7>
lJ") N
~"¢
0 (D ~~ 0 0 Oc::
I::' en v c >·-00. uE v :J
O::ll._
HIJRTCROWSER J-3500-D 1 4/94
. . FigureA-2
I....
I I i
I I i

Constant Rate Pumping Test McCleary Well MC-2 Measurements in Well DP-1
-0.5
~
Ql -0.3 Ql
!.....
.s -.; > Ql
...J
.... -0.1 Ql ~
0 ;::
.2 0 ~
0
J.l 11 ... t J.... ,.. -VJ
3: 0.1 0 -.; .0
c 3: 0 .., 3: .o 0.3 .... 0
1000 2000 3000
~ IIIII ... f'
I IT
4000
Time in Minutes after Pumping Started
Pumping Rate = 425 GPM
I I I
5000
88 ~~ J-3500-01 11193 Figure A-3
k I
I I

Constant Rate Pumping Test McCleary Well MC-2 Log-Log Plot of Measurements in Well MC-3
10 Theis Type Curve
' . -., ., ~
.!: -.; > 1 .,
;;JI'I I I
2 :iiiiii ...,, ~ . I I
li~ Drawdown Data and Leaky Confined Type Curve
..J
.... ., -0 3: f
IJ' () :;:; 0 -(/) 10 _, 3: 0 -.; £)
c: 3: / 0
" 3: 0 10 _, ....
Cl
I r 10 10 2 10 J
Time in Minutes after Pumping Started
Pumping Rate = 425 GPM
I
10 . : '
~ J-3500-0f ~HO'>
I i i I I
,,
'·
- ,:
"·
·Hart Crowser J-3500-01
APPENDIXB GROUNDWATER MODELING AND CAPTURE ZONE ANALYSIS
-._· •.
,.; . :· "
·-·.-.
.,,
-·
• ..... . ~- ' ..
":.-_' - .. '
._ .·
'I

APPENDIXB
Han Crowser J-3500-01
. GROUNDWATER MODELING AND CAPTURE ZONE ANALYSIS
Model Description
PLASM (Prickett and Lonquist, 1971) is based on a mesh-centered finitedifference approach for solving the groundwater flow equation. The set of simultaneous algebraic equations that are produced from this technique are solved using the alternating direction implicit method of Peaceman and Rachford (1955). The model is capable of assessing aquifer response (in terms of water level elevations and therefore gradients) to stresses such as wells, precipitation recharge, and streams.
GWPATH (Shafer, 1987b) is a computer program for estimating horizontal fluid pathlines and travel times in non-uniform groundwater flow fields. The program is based on the numerical method presented by .Shafer (1987a). This method is basically a particle tracking method, whereby infinite! y small imaginary fluid particles are placed in the flow domain and their positions are tracked as they move through the flow field in a series of small time steps. The movement of the particles is driven by the hydraulic gradients calculated from hydraulic heads determined in the flow modeling step. Capture zones for pumping wells are estimated by placing imaginary particles immediately around the pumping well and tracking them backward in time.
Physical Configuration
Application of PLASM requires that the physical configuration of the aquifer be hypothetically discretized into a grid. The intersection of each grid line is referred to as a node. The program calculates groundwater elevations at each node. The discretization employed for modeling the McCleary Aquifer is shown on Figure B-1. The orientation of the grid on Figure B-1 was specified such that the regional groundwater flow field would be oriented along the direction of the grid (i.e., flow would be parallel and perpendicular to grid lines). Such a configuration avoids the possibility of errors in the pathline analysis step that frequently occur when the principal flow directions are oriented at an angle to the grid lines.
An irregular grid spacing (82 X 37 nodes covering an area of 22,000 X
10,000 feet) was developed to minimize the total number of nodes in the model and maintain an adequate resolution near the pumping center. The minimum cell dimension is 200 feet; the maximum is 1,400 feet. The solid circles on Figure B-1 indicate no-flow nodes, used to represent aquifer boundaries. The open circles indicate constant head cells which

Hart Crowser J-3500-01
represent the groundwater elevations of the natural flow system outside the area of influence of the modeled stresses. The constant head values were selected to produce a regional hydraulic gradient of 0.009 ft/ft, which was observed from the water levels measured in domestic wells in July 1993. The specific values used in the model were obtained by projecting observed water levels to the model edge based on this gradient.
Aquifer Parameters
The flow model requires a number of input parameters that are specific to the hydrogeologic system. These parameters include aquifer thickness, hydraulic conductivity, and recharge rate. In addition to hydraulic conductivity data, the pathline analysis also requires specification of effective porosity. Each of these input parameters are discussed below.
Aquifer Thickness
A saturated aquifer thickness of 7 5 feet was assumed throughout the domain. This assumption was supported by several well logs. Based on our conceptual model of the aquifer, we feel that the aquifer thins near the boundaries; however, these thinner areas are sufficiently far from the pumping center to be insignificant for this application.
Hydraulic Conductivity
Our pumping test analysis yielded an average aquifer transmissivity of about 28,000 gal/day/ft. Given the assumed aquifer thickness of 75 ft, this corresponds to a hydraulic conductivity of 375 gal/day/ft2
• This is a reasonable value for a predominantly sand aquifer (Freeze and Cherry, 1979), which is indicated by the drillers logs from the area. Although the groundwater modeling and pathline analysis schemes that we employed are capable of considering spatially varying hydraulic conductivity, the only data available were from the pumping test. Therefore, we specified a hydraulic conductivity of 375 gallday/ft2 everywhere in the domain.
Recharge Rate
Recharge to the aquifer from precipitation can affect the size of the steadystate drawdown cone of a pumping well, and is therefore important for estimating time-related capture zones accurately. Recharge is not a parameter that can be measured directly. It must be inferred from precipitation data by considering climatologic (evapotranspiration), topographic and geologic conditions that affect how much of the precipitation can actually reach the aquifer.

Hart Crowser J-3500-01
Detailed analyses of recharge in similar geologic settings in Western Washington using a model developed by the U.S. Geological Survey (Bauer and Vaccaro, 1987) have indicated that typically 30 to 40 percent of precipitation is available as groundwater recharge. We assumed the larger percentage due to the shallow depth to water, presence of permeable soils, and generally level topography (limiting runoff).
The closest weather observation station is in Elma, located approximately 8 miles west of McCleary. Elma lies approximately 200 feet lower in elevation than McCleary; however, it was considered to be representative of McCleary due to its proximity. A study of precipitation records dating back to 1931, indicated a yearly average of 59 inches (Byrne-Stevens & Associates, 1977).
Using these data as guidance, we assumed a recharge rate of 24 inches/year. This corresponds to 800 gpm/mF.
Effective Porosity
In practice, it is extremely difficult and uncommon to determine actual field values of effective porosity. A value of 0.25, taken from literature values for a well-sorted medium sand (Freeze and Cherry, 1978), was used for the pathline and capture zone analysis. Fortunately, the effect of uncertainty in effective porosity on time-related capture zone calculations is small compared that associated with other parameters (Varljen and Shafer, 1991).
Model Calibration
Model calibration was accomplished through a trial and error process of parameter adjustment to force simulated groundwater elevations to match those observed in July 1993, including the drawdown observed during the pumping test. An initial simulation was conducted and modeled groundwater elevations were visually compared with those observed during July 1993.
Modeled groundwater elevations initially produced an unrealistically steep gradient in the extreme northeast comer of the aquifer. This likely occurred because the initial model configuration produced a low transmitting capacity in this region created by the close proximity of the boundaries. The transmitting capacity was increased by changing the hydraulic conductivity in this region to 425 gal/day/ft2 to produce groundwater elevations that matched those measured in July 1993.
Page B-3

Hart Crowser J-3500-01
This increased hydraulic conductivity is certainly within the range of possible conductivities indicated by the pumping test, allowing for uncertainties in the analysis and assumed aquifer thickne.sS. A higher hydraulic conductivity in this region is also consistent with the conceptual geologic model of the area, which indicates outwash material was carried into the valley from the northeast, with coarser material being deposited first.
HYDROGEO.FR
Page B-4
I

I
-· .. I
-·
•
I~
1:.? ., - ' .-::
" Cl
"' 1--:~ • ': Q
;, g ·o ' "' I
•..:
.. ,
Finite Difference Grid Showing Boundary Conditions
'I
0 ·:
. -.. / i\
~ -~--9_: --~.--·~,_ '. - 1 \.
. ,- ,_
..
/ 6
. i I
0 Constant Head Boundary
e No Flow Boundary
0
Scale in
~ N
' 2000
Feet
88
J-3500-01 Figure 8-1
400D
11193