Cytometry Data Analysis in FlowJo V10 - UAB€¢ What is FlowJo? • Navigating the V10 Workspace...
37
Cytometry Data Analysis in FlowJo V10 Timothy Quinn Crawford, PhD Application Scientist FlowJo, LLC timc@flowjo.com
Transcript of Cytometry Data Analysis in FlowJo V10 - UAB€¢ What is FlowJo? • Navigating the V10 Workspace...

Cytometry Data Analysis in FlowJo V10
Timothy Quinn Crawford, PhD Application Scientist
FlowJo, LLC [email protected]

• What is FlowJo? • Navigating the V10 Workspace • Customizing Ribbons • Demo Data Background • Creating and Editing Groups • Graphs, Gating and Ancestry • The Layout Editor • Batching and Exporting Graphics • The Table Editor
Outline – Part I

• An integrated environment for viewing and analyzing flow cytometry data.
• Uniformly analyze whole experiments encompassing many related samples.
• Sophisticated tools allow generation of graphs
and statistical reports, driving discovery of biological mechanisms.
What is FlowJo?
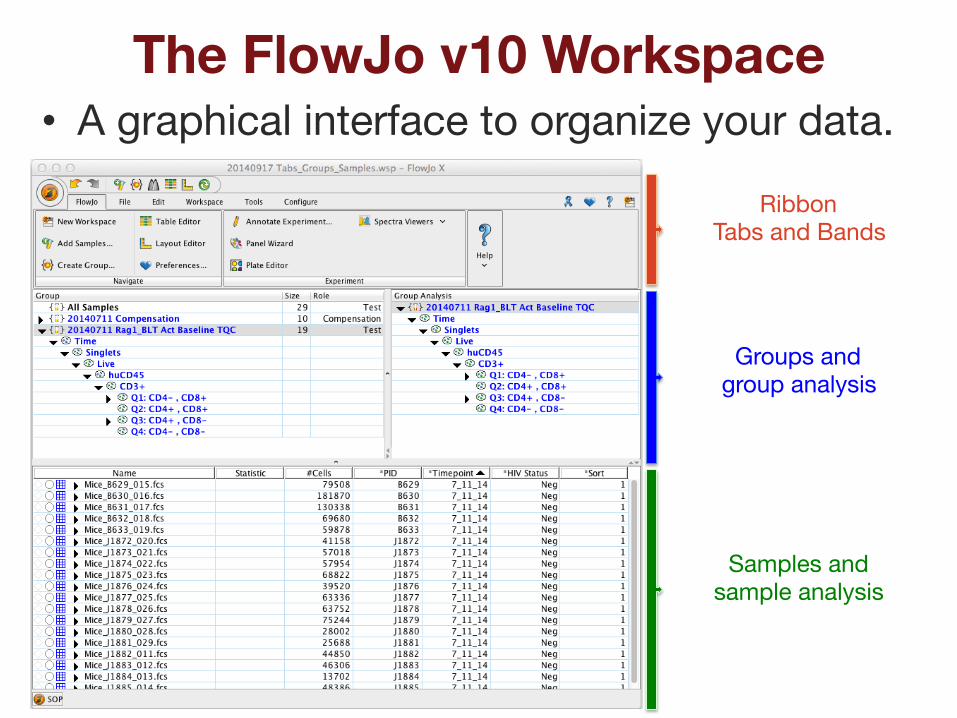
The FlowJo v10 Workspace • A graphical interface to organize your data.
Ribbon Tabs and Bands
Groups and group analysis
Samples and sample analysis

• Tabs group similar Bands together. • Bands group similar Actions together.
• Ribbon organization allows easy visual navigation of workspace functions.
Ribbons, Tabs and Bands
Application Button
Task Bar Ribbon Configuration &
Preferences Tabs Bands

• Click on the Ribbon icon to configure Customizing Ribbons
• Click on Simple, Experienced or Advanced to change the number of Tabs displayed.
• Drag the icon for any Band into the ribbon to add that set of Actions to your selected Tab.

Importing Data Into FlowJo Three possible methods: 1. Drag and drop into samples pane 2. Click Add Samples button 3. Press ⌘ ;

Todays Demo Data Set: Phospho-Flow + Intracellular Cytokine
Staining (PFICS) Polyclonal PFICS Assay: • Thaw and rest cryopreserved human PBMC overnight • No S@m (NS) or s@mulate with PMA+Ionomycin (PMA+I or PI)
for 2 hours • Stain for viability (AARD) and surface an@gens (CD3, CD4, CD8,
CD38 and HLA-‐DR) • No S@m or s@mulate PMA+I for 20 minutes • Fix, permeabilize and stain for intracellular an@gens (phopho-‐
ERK1/2, IFN-‐γ and Perforin)

PFICS Stim Conditions • 2 S@ms à 4 poten@al combina@ons
No S%m Fix&Perm Stain
Surface Stain
Intracellular Thaw&Rest PBMC No S%m
NS+NS
PMA+I Fix&Perm Stain Surface PMA+I
Stain Intracellular Thaw&Rest PBMC
PI+PI
PMA+I Fix&Perm Stain Surface
Stain Intracellular Thaw&Rest PBMC
No S%m
NS+PI
No S%m Fix&Perm Stain
Surface Stain
Intracellular Thaw&Rest PBMC PMA+I PI+NS
• 5 donors X 4 condi@ons = 20 experimental samples • 1 donor with 7 FMOs X 2 s@m condi@ons = 14 FMO controls • 12 Compensa@on Controls
Total S@mula@on
Time
0 min
20 min
120 min
140 min

Groups and Group Analysis • The Group area lists all groups in the Workspace, #
of samples in each group (Size), and the Role of that group (ex. Test, Compensation, Controls) .
• Groups act like folders to organize your sample files and allow unified master gating and analysis.
• Group Analysis displays all analysis within a group.

Creating and Editing Groups • To create a new group type ⌘ G, or click the Create
Group Icon located in either the task bar at the top of the workspace, or within the Navigate band.
• Double click on an existing group to edit its properties.

Samples and Sample Analysis • Displays the sample list and associated analysis of
the currently selected group. • Statistic and #Cells columns are displayed by
default. Additional information can be displayed as columns. (Workspace Tab à Add Keywords or Configure Tab à Edit Columns)
• Double click on a sample to open a Graph Window and add gates.
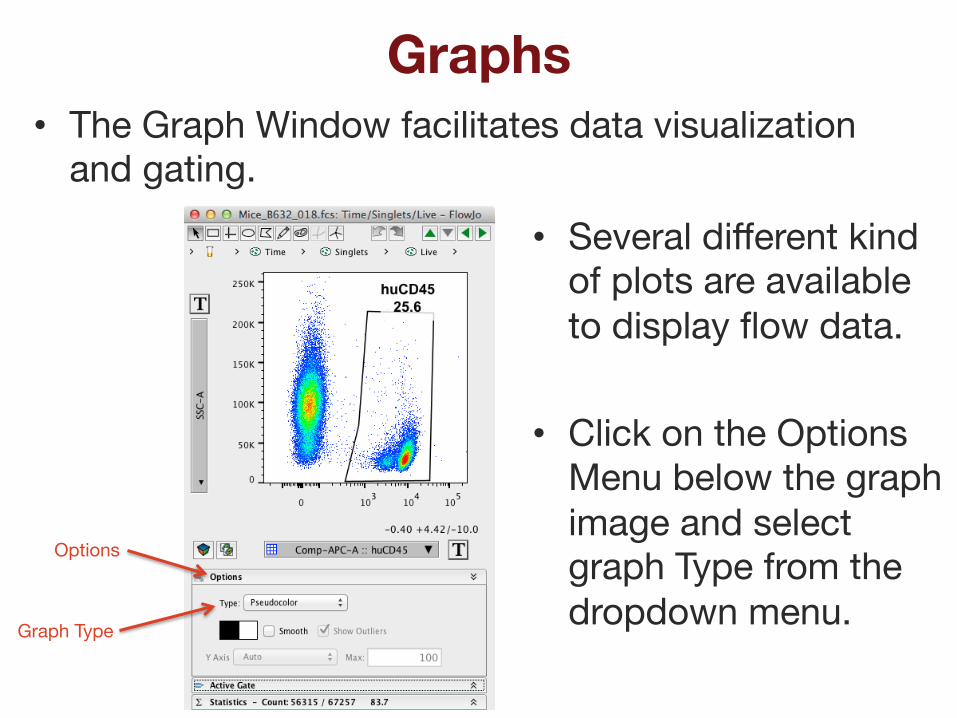
Graphs • The Graph Window facilitates data visualization
and gating.
• Several different kind of plots are available to display flow data.
• Click on the Options
Menu below the graph image and select graph Type from the dropdown menu.
Options
Graph Type

Graph Display Options • Try them all and pick what pleases you, or best
represents your data.

Gating tools • Are located at the top of a Graph Window.
• Gates can always be modified or removed, so don’t be shy.
• Explore the gating options and pick what works best for you.
Gating Tools Undo!!
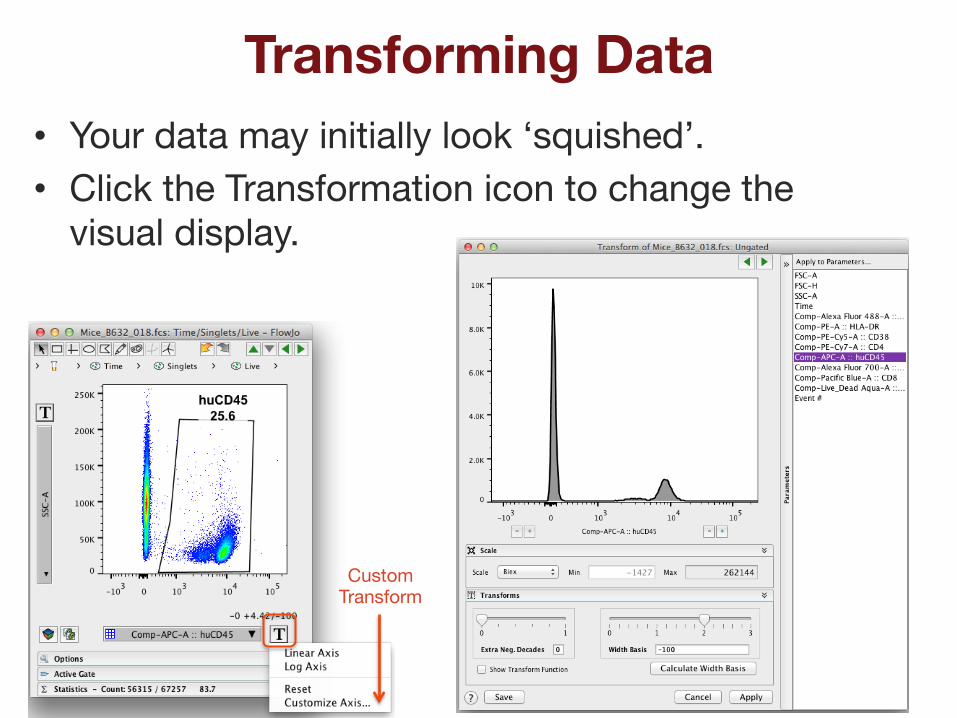
Transforming Data • Your data may initially look ‘squished’. • Click the Transformation icon to change the
visual display.
Custom Transform

Gating Hierarchy • When you create a gate on a sample, FlowJo
shows you this gate (subset population) as a genealogical tree.
• The subset population is a child of the parent sample.
Parent
Child
Siblings

The Layout Editor • A tool for creating graphical reports. • Type ⌘ L, or click on the Layout Editor icon. • Drag populations from a sample to Layout Editor. Layout Editor

Working in Layout Editor • Similar to the Workspace, the Layout Editor has its
own customizable Ribbon with Tabs and Bands to organize actions.
Ribbon Configura@on & Preferences Tabs
Bands
Text and Draw Tools
• Try clicking on the different tabs to see what types of actions are available.

Within Layout Editor • Graphs can be organized and re-formatted. • Statistics, keywords, text and even shapes or
objects can be added to illustrate your analysis.
• We encourage you to explore the tools and display features available to improve the visualization of your data.

Working in Layout Editor • Click once on a graph or object to select it. • Double Click a graph to change its properties.
• Right click the graph for even more options. • Hold down shift and click on multiple graphs to
select and edit their properties simultaneously.

Batch Analysis of Layout Editor Graphics
• Batch operations perform repetitive analysis on multiple samples, applying the layout to an entire set of samples.
• Within the Layout Editor Tab, Look for the Create Batch Report icon.

Batch Analysis of Layout Editor Graphics
• Specify the group you wish to batch, and how to iterate the batch process (ex. by sample or keyword), then specify where you want the batch output to go. Finally, click on
Group
Iteration Criteria
Batch Output

The Table Editor • A tool for creating statistical reports. • Type ⌘ T, or click on the Table Editor icon. • Drag populations from sample to Table Editor.
Table Editor

Within Table Editor • Again, the Table Editor has its own customizable
Ribbon with Tabs and Bands to organize actions. Ribbon Configuration &
Preferences Tabs Bands
• Specify the group you wish to batch, and how to iterate the batch process, then in the Output band, specify where you want the batch output to go.

• Compensation • Templates • Command Line FlowJo
Outline – Part II

Compensation • Compensation corrects for spillover between
fluorochrome emission spectra.
• Compensation is essential for multicolor panels

Three Rules of Compensation
1. Controls need to be at least as bright or brighter than any sample the compensation will be applied to.
2. Background fluorescence should be the same for the positive and negative control.
3. Compensation controls MUST match the exact experimental fluorochrome.
• First, there must be a single stained control for every parameter in the experiment!
• In Addition, there are three rules for ‘good’ compensation controls.

PFICS Compensation Controls • PBMC Cells
1. Unstained Cells 2. AARD 3. CD3 Alexa700
• Compensation Beads 1. Unstained Beads with
Fix and Perm 2. CD4 PE-TexasRed 3. CD8 Pacific Blue 4. CD38 PE-Cy5 5. HLA-DR APC-H7 6. Unstained Beads
without Fix and Perm 7. p-ERK1/2 Alexa 488 8. IFN-g PE-Cy7 9. Perforin PE

Compensation Wizard • Select a Compensation Group in the groups
window, then click in the task bar.

Compensation Wizard • The wizard auto gates your compensation samples
and fills in the positive and negative. • To select a
different sample, or gate choose from the dropdown lists.
• Double click on a graph in the wizard to modify the gate
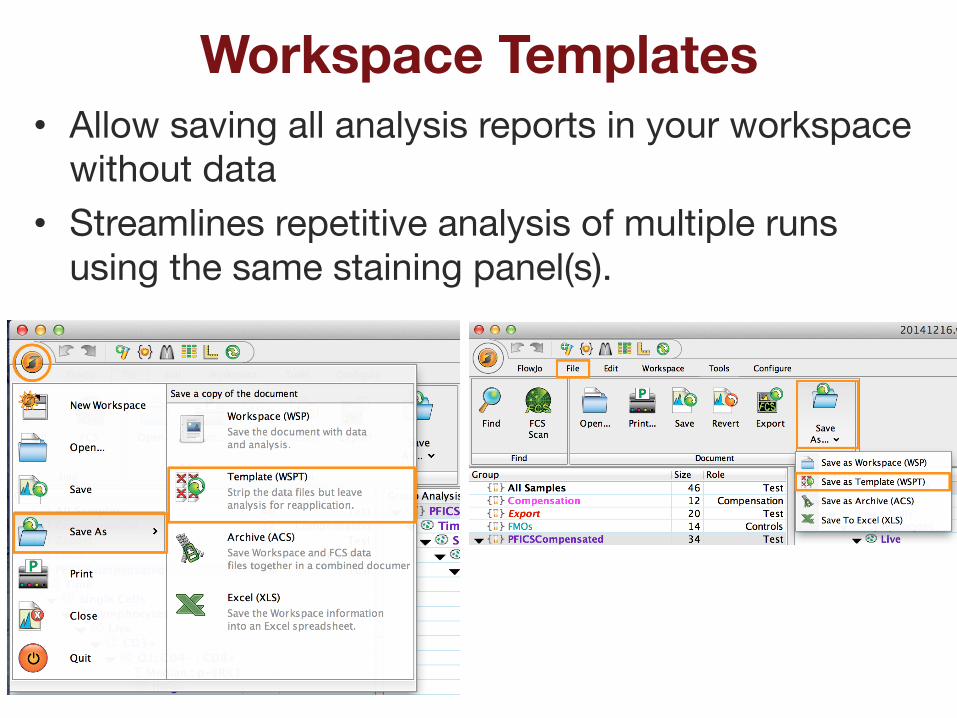
Workspace Templates • Allow saving all analysis reports in your workspace
without data • Streamlines repetitive analysis of multiple runs
using the same staining panel(s).
Command Line FlowJo(Ninja Skills)
• FlowJo can be run “headless” through command line interface, applying templates and generating automated reports.
• FlowJo Enterprise is a server based version of
FlowJo 10 that spawns command line tasks through a web browser interface.
• Designed to assist with data management, analysis and report generation for high dimensional, high throughput flow or mass cytometry.
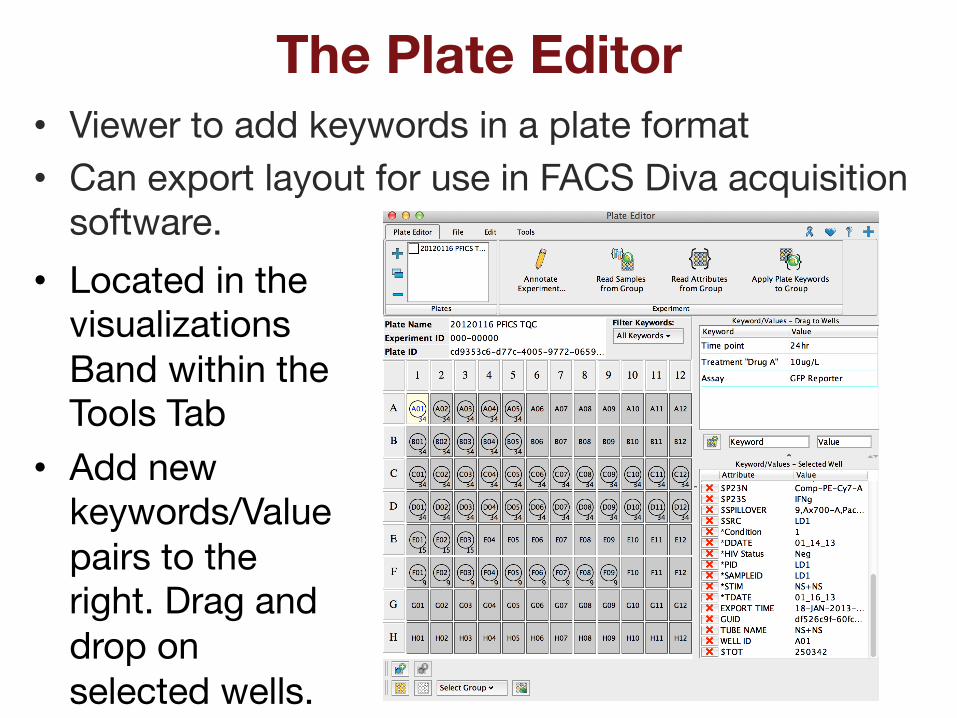
The Plate Editor • Viewer to add keywords in a plate format • Can export layout for use in FACS Diva acquisition
software. • Located in the
visualizations Band within the Tools Tab
• Add new keywords/Value pairs to the right. Drag and drop on selected wells.

Cell Cycle Analysis • The Cell Cycle platform allows 1D modeling of cell
cycle phases based on DNA content
• Currently under development, the upcoming point release of v10.0.8 will have 1D Watson and Dean-‐Jea-‐Fox models, similar to FlowJo v9 for Mac

Additional Training Resources • Webinars on basic and advanced features of
FlowJo, held on the 1st and 3rd Thursday of each month.
• Webinar Schedule can be found at http://www.flowjo.com/webinars/
• Technical Documentation for V10 can be found at http://docs.flowjo.com/
• The Daily Dongle provides tips, tricks and answers to common questions. http://flowjo.typepad.com/

Questions? • FlowJo is here to help with all your cytometry
analysis needs.
• Contact [email protected] for general questions and support.
• Contact [email protected] for science questions, additional training resources and information on FlowJo Enterprise.
Thank You!