CytoFLEX System Performance Evaluation · Beckman Coulter Particle Sizing Standards 0.5 μm, 0.3...
22
CytoFLEX System Performance Evaluation Authors: James Tung 1 , Dan Condello 3 , Albert Donnenberg 4 , Erika Duggan 3 , Jesus Lemus 1 , John Nolan 3 , Kathy Ragheb 2 , Jennifer Sturgis 2 , J Paul Robinson 2 , Zhao, Jing 1 , Domenic Fenoglio 1 , Yijun, Huang 5 , Paul Scibelli 1 Affiliation: 1. Beckman Coulter, Inc. Miami, FL, USA 2. Purdue University Cytometry Laboratories, 3. La Jolla Bioengineering Institute, 4. University of Pittsburgh Cancer Center, 5. Sun Yat-Sen University, School of Medicine, Guangzhou, China a Beckman Coulter Life Sciences: White Paper
Transcript of CytoFLEX System Performance Evaluation · Beckman Coulter Particle Sizing Standards 0.5 μm, 0.3...

CytoFLEX System Performance Evaluation
Authors: James Tung1, Dan Condello3, Albert Donnenberg4, Erika Duggan3, Jesus Lemus1, John Nolan3, Kathy Ragheb2, Jennifer Sturgis2, J Paul Robinson2, Zhao, Jing1, Domenic Fenoglio1, Yijun, Huang5, Paul Scibelli1
Affiliation: 1. Beckman Coulter, Inc. Miami, FL, USA 2. Purdue University Cytometry Laboratories, 3. La Jolla Bioengineering Institute, 4. University of Pittsburgh Cancer Center, 5. Sun Yat-Sen University, School of Medicine, Guangzhou, China
a B
eckm
an C
oulte
r Life
Sci
ence
s: W
hite
Pap
er

B E C K M A N C O U L T E R • W H I T E P A P E R 2
CytoFLEX System Performance Evaluation
ABSTRACT
Performance testing of cytometry instruments is utilized to characterize the capability of the cytometer to perform high complexity applications. We have tested the new CytoFLEX flow cytometer against the performance measurements for sensitivity, dynamic range, population resolution, linearity, stability, reproducibility, and small particle resolution. Commercially available bead standards were used to evaluate performance expectations across multiple parameters.
The CytoFLEX flow cytometer was evaluated at La Jolla Bioengineering Institute, Purdue University Cytometry Laboratory (PUCL) and the Beckman Coulter, Miami site. Additional data was collected through a collaborative effort with Al Donnenberg from University of Pittsburgh Cancer Center and School of Medicine at Sun Yat-Sen University, Guangzhou, China. Each instrument was equipped with three lasers (405nm, 488nm and 638nm) and 12 parameters with 9 fluorescence detectors. Instruments were equipped with the enhanced Violet laser Side Scatter Channel (VSSC) option for small particle detection..
MATERIAL AND METHODS
CytoFLEX multicolor flow cytometer equipped with enhanced Violet laser Side Scatter Channel (VSSC) option (manufactured by Beckman Coulter)
To calculate the daily Quality Control rCV (robust CV) through the CytExpert Software, CytoFLEX QC Beads were used. The QC beads were collected on three different CytoFLEX instruments. Robust CV is approximately the 75th percentile minus the 25th percentile divided by the median. And is not as skewed by outlying values as the CV.
Spherotech 8 Peak Rainbow Beads were used for resolution, linearity, stability and separation testing.

B E C K M A N C O U L T E R • W H I T E P A P E R 3
For Microparticle testing the following were used:
Laboratory 1: Beckman Coulter Miami Spherotech beads. 0.5 μm and 0.2 μm.
Laboratory 2: La Jolla Bioengineering Institute Polybead Polystyrene Sampler Kit III PolySciences # 16905-1Polybead Polystyrene Sampler Kit II PolySciences # 21756-1
Laboratory 3: PUCL. PolySciences beads 0.5, 0.4, 0.35, 0.3, and 0.2 μm beads
Laboratory 4: School of Medicine, Sun Yat-Sen University, Guangzhou, ChinaBeckman Coulter Particle Sizing Standards 0.5 μm, 0.3 μm, and 0.2 μm latex beads (non-fluorescent) mixture for testing. Beads were diluted using UPW (UltraPure Water).
Cytometer comparison was conducted against a competitor system configured with equivalent lasers and filter setup.
Separation index is described as the separation of adjacent peaks of Rainbow beads measured by the difference between the peak MFIs, divided by the geometric mean of their standard deviations.
Separation Index is measured using the following formula:
Separation Index = (MFIpeak2-MFIpeak1)/(SQRT(SDpeak1^2+SDpeak2^2)/2)
RESULTS
Figure 1. rCV analysis of QC beads over 18 days
QC beads were run on the instrument for 18 days. Twelve Startup and Shutdown cycles were captured and rCV were tracked via Levey-Jennings. The data below is relative parameters for each Laser.

B E C K M A N C O U L T E R • W H I T E P A P E R 4
Figure 2. rCVs on 8 peak beads run continuously for one hour period
Spherotech 8 Peak Rainbow beads were run continuously for one hour on the CytoFLEX unit. rCV data was collected on Peak#5 PE: 2.12%, APC: 4.40% and BV421: 2.34% showing the stability of the system.
Figure 3. Spherotech 8 Peak Rainbow beads were run every day for seventeen days on two instruments and the rCV Data was collected and plotted on Peak#5.

B E C K M A N C O U L T E R • W H I T E P A P E R 5
Figure 4.
Spherotech 8 peak rainbow bead data for 3 Laser 10 Color detectors. Data provided by University of Pittsburgh Cancer Center

B E C K M A N C O U L T E R • W H I T E P A P E R 6
Figure 5.
Spherotech 8 peak rainbow bead data calculated for a Separation Index between bead peaks as compared to a standard High Complexity research Cytometer.
Data provided by University of Pittsburgh Cancer Center
Figure 6.
Spherotech 8 peak rainbow bead data calculated for a Separation Index between bead peaks as compared to a standard High Complexity research Cytometer. Data is Specific for Red Channel Sensitivity.
Data provided by University of Pittsburgh Cancer Center

B E C K M A N C O U L T E R • W H I T E P A P E R 7
Figure 7.
Microparticle Detection. Four separate labs ran bead based small particles detected using side scatter and VSSC.
Data provided by University of Pittsburgh Cancer Center, PUCL, La Jolla Bioengineering Institute, Sun Yat-Sen University Medical College.
B E C K M A N C O U L T E R • W H I T E P A P E R 8
SUMMARY
Performance evaluation results show the CytoFLEX cytometer is stable, reproducible and sensitive especially in violet and far red channels. The system’s ability to separate populations as measured by the separation index is overall superior to comparable instrumentation.
Small particle evaluation showed clear resolution of 0.2 μm particles from noise using SSC from the Violet laser. Moreover, the CytoFLEX flow cytometer can clearly distinguish between different sizes of submicron beads.
CytoFLEX and CytExpert are trademarks of Xitogen Technologies (Suzhou), Inc., a Beckman Coulter company.Fast track to success are trademarks of Beckman Coulter, Inc.Beckman Coulter and the stylized logo are trademarks of Beckman Coulter, Inc. and are registered in the USPTO.
FLOW-608WP01.15-A -

Set-Up of the CytoFLEX* for Extracellular Vesicle Measurement
Andreas Spittler, MD, Associate Professor for Pathophysiology, Medical University of Vienna, Core Facility Flow Cytometry & Department of Surgery, Research Laboratories
Application Information Bulletin: Set-Up of the CytoFLEX

S e t - U p o f t h e C y t o F L E X • B E C K M A N C O U L T E R 2
Set-Up of the CytoFLEX* for Extracellular Vesicle Measurement
BACKGROUND
The measurement and the characterization of Extracellular Vesicles (EV) have been of growing interest over
the last 20 years. Flow cytometry instruments were not the most appropriate way to analyse these particles as
the optical resolution of instruments was insufficient to detect particles below 250nm. However, the Beckman
Coulter CytoFLEX* now offers the ability to measure EV down to at least 150nm and allows the detection of
their cellular origin using up to 13 fluorescence parameters. Regardless of the technical improvements the
set-up of the instrument is still a critical point and several requirements need to be met which are illustrated
here.
INTRODUCTION
Extracellular vesicles are a heterogeneous cell-derived particle population in a size range between 50nm to 1,000nm. There is a growing interest not only from academic research groups to determine EV in several fluids such as cell culture supernatant, in plasma samples or in whole blood but also in clinical research since it has been shown that the measurement of microparticles (MPs)1 might be of clinical relevance. The methods to identify EV are many and involve high speed centrifugation, Western blotting, proteomics, electron microscopy, imaging methods and flow cytometry. Methods for the detection of EV by flow cytometry have been developed in the last years and special attention has been paid to standardization protocols. Compared with other methods, flow cytometry has the big advantage that EV can be detected as rare events, in high
numbers and by antigens on the surface, which characterize their cellular origin.

S e t - U p o f t h e C y t o F L E X • B E C K M A N C O U L T E R 3
However, until now flow cytometry technology has had some unfortunate limitations. It was not possible to detect microparticles below 250-300nm in size in a meaningful manner. This size range does not appear to be very far from the smallest particles of 50nm in size, however we have to consider that MPs in a size greater than 300nm are only the “tip of the iceberg“ of visible particles and at least as many particles are smaller than 300nm in size. The importance in clinical research and the technical requirements to detect smaller microparticles was clearly demonstrated in 2013 by Sarlon-Bartoli et al2. Using a Beckman Coulter Gallios* flow cytometer they correlated an increase in plasma levels of leukocyte-derived MPs with unstable plaque in asymptomatic patients with high-grade carotid stenosis. These differences between sample groups were detectable using the Gallios flow cytometer which allowed for better discrimination between noise in an acceptable range and extracellular particles. The CytoFLEX is the first flow cytometer which can detect EVs in a meaningful way down to 150nm and therefore offers the possibility to detect particles below 300nm which enhances information. The better resolution of the CytoFLEX can be reached by using the side scatter of the 405nm laser and by several technical as well as preanalytical preparations. Here we describe how to set-up and standardize the CytoFLEX for particle measurement and discuss some pitfalls which should be avoided to get the best information from EVs detection.
PROTOCOL
Instrument set-up
Turn on the CytoFLEX and the computer. Proceed with the daily start-up procedure and execute the QC measurement using the Default Filter Configuration. Change your filter configuration as follows.
Filter configuration
Change your filter configuration of the Violet laser (405nm) as shown in Figure 1. The Violet SSC (VSSC) 405/10 channel will now serve as trigger channel and discriminates the noise.
Figure 1. Filter configuration (Trigger signal on VSSC 405nm)
S e t - U p o f t h e C y t o F L E X • B E C K M A N C O U L T E R 4
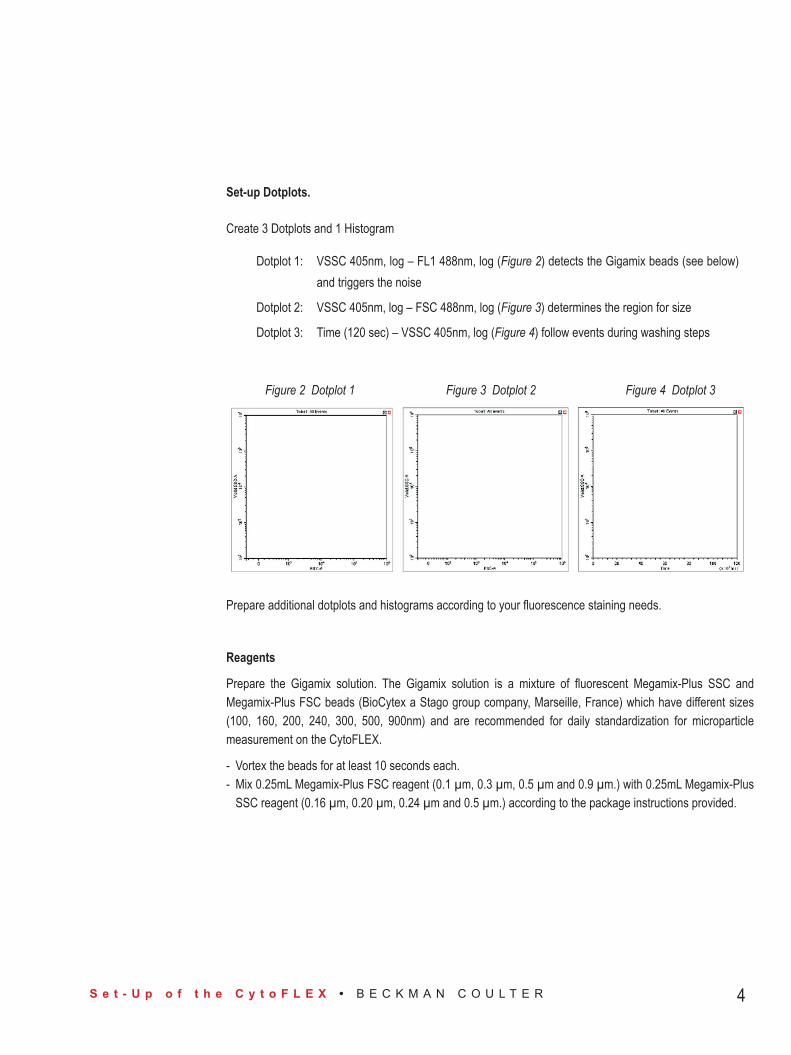
Set-up Dotplots.
Create 3 Dotplots and 1 Histogram
Dotplot 1: VSSC 405nm, log – FL1 488nm, log (Figure 2) detects the Gigamix beads (see below) and triggers the noise
Dotplot 2: VSSC 405nm, log – FSC 488nm, log (Figure 3) determines the region for size
Dotplot 3: Time (120 sec) – VSSC 405nm, log (Figure 4) follow events during washing steps
Figure 2 Dotplot 1 Figure 3 Dotplot 2 Figure 4 Dotplot 3
Prepare additional dotplots and histograms according to your fluorescence staining needs.
Reagents
Prepare the Gigamix solution. The Gigamix solution is a mixture of fluorescent Megamix-Plus SSC and Megamix-Plus FSC beads (BioCytex a Stago group company, Marseille, France) which have different sizes (100, 160, 200, 240, 300, 500, 900nm) and are recommended for daily standardization for microparticle measurement on the CytoFLEX.
- Vortex the beads for at least 10 seconds each. - Mix 0.25mL Megamix-Plus FSC reagent (0.1 µm, 0.3 µm, 0.5 µm and 0.9 µm.) with 0.25mL Megamix-Plus
SSC reagent (0.16 µm, 0.20 µm, 0.24 µm and 0.5 µm.) according to the package instructions provided.

S e t - U p o f t h e C y t o F L E X • B E C K M A N C O U L T E R 5
Set-up the Gains and the Threshold
Set the Threshold of the trigger signal (VSSC) manually to 2000 and Height Figure 5 Threshold and set the gains of the FSC to ~106, VSSC to ~61 and FITC to ~272 Figure 6 Gains.
Figure 5 Threshold Figure 6 Gains
Clean your sample line with fresh and sterile distilled water for 2 minutes at a flow rate of 60µL/minute- Increase/decrease VSSC gain to an event rate of ~400 events/sec.- Measure Megamix beads as shown in Dotplot 1 at a flow rate of Slow = 10µL/minute.
a) increase/decrease SSC 405nm gain.b) increase/decrease FL1 gain according to Figure (Dotplot 1).
- You should now see a picture as shown below Figure 7 Gigamix beads. If this picture is not seen readjust the gains for FSC, VSSC and FITC until it displays Figure 7.
- Save your sample as “Gigamix“.- For better visibility set 2 regions: the first around the 100nm beads (blue) and the second around the
900nm beads (red) as shown in Figure 8.
Figure 7 Gigamix beads ungated Figure 8 Gigamix beads gated

S e t - U p o f t h e C y t o F L E X • B E C K M A N C O U L T E R 6
In Dotplot 2, set a region as shown in Figure 9 around the 900nm and the 100nm bead population. Label this region as MP Gate – in this gate MPs are displayed. The following dotplots and histograms should be gated on the MP gate.
Figure 9 MP Gate setting
After you have measured the Gigamix beads thoroughly rinse the sample line with distilled water for 2 minutes at flow rate Fast = 60µL/minute and watch Dotplot 3 and the Histogram. At the end of the 2 minutes cleaning procedure you should reach an event rate per second which is equal to the first washing step at the beginning of your experiments (~400 events/sec); repeat the washing procedure if it does not return to baseline. Repeat the 2 minutes washing step between each sample measurement!
Sample measurement:
Measure your sample at the flow rate Slow. Adjust the gains for the other fluorescence parameters according to your staining protocol and your needs.

S e t - U p o f t h e C y t o F L E X • B E C K M A N C O U L T E R 7
EXAMPLES AND PITFALLS
Extracellular Vesicle staining:
An example from Extracellular Vesicle measurement is shown below (Figure 10) and illustrates detection of Annexin V FITC, CD41 PE and CD63 PE-Cy7 stained particles. Isolation was performed by centrifugation of a platelet concentrate. Particles were subsequently stained and analysed on a CytoFLEX. Figure 10A shows particles in the MP gate. Figure 10B and C demonstrate autofluorescence intensities of particles in the relevant fluorescence channels. Figure 10D shows detection of two Annexin positive populations. The Annexin dim population is indicated as green, expresses CD41 but no or low CD63 and are of a very small in size. The Annexin high population is also CD41 and CD63 double positive and a larger size. (Figure 10E and F)
Figure 10A Figure 10B Figure 10C
Figure 10D Figure 10E Figure 10F

S e t - U p o f t h e C y t o F L E X • B E C K M A N C O U L T E R 8
Swarm detection
When multiple vesicles are simultaneously illuminated by the laser beam and are counted as one larger single cell event, this phenomenon is referred to as swarm detection. As a result the true concentration of EVs is underestimated. To avoid this problem a serial dilution assay has to be performed and the optimal EV concentration which is in the linear range of dilution and EV concentration has to be calculated Figure 11.
Figure 11: Linear range of detection
Particles from Platelet Free Plasma (PFP) were serially diluted from 1:2 to 1:1000 and measured on the CytoFLEX. The red line indicates the linear range of particle measurement without swarm detection. In the present case a dilution of 1:400 gives the best results.
Sample Media
Each media or buffer in which the sample was diluted was analysed using the Gigamix setting (VSSC Gain: 61, Threshold: 2000, FSC Gain: 106) for 120 seconds at flow rate Slow (10µL/min)
The following figures show examples of measurements using various samples. NOTE: it is highly critical to clean the sample line between each measurement for at least 2 minutes. Figure 12A shows Gigamix beads measured over time for 2 minutes. Washing after Gigamix (Figure 12B) demonstrates that beads are washed out of the system after about one minute; this varies for different bead populations.
The background noise of distilled water is shown in Figure 12C, even PBS (Figure 12D) slightly increases the background particle noise which is much more elevated when fetal calf serum (FCS, Figure 12E) is added to the sample media. As can be seen in the Figure 12F PBS with 10% FCS, dots in the red oval indicate the appearance of particles, possibly extracellular events and/or protein aggregates present in the FCS.

S e t - U p o f t h e C y t o F L E X • B E C K M A N C O U L T E R 9
Figure 12:
Figure 12A Gigamix Figure 12B Washing after Gigamix
Figure 12C Distilled water Events/sec: 557 Figure 12D PBS Events/sec: 533
Figure 12E PBS with 1% FCS Events/sec: 2194 Figure 12F PBS with 10% FCS Events/sec: 4082

S e t - U p o f t h e C y t o F L E X • B E C K M A N C O U L T E R 10
Antibodies and reagents diluted in distilled water
20µL of monoclonal antibody solution or 1µL of Annexin V solution with or without centrifugation, were subsequently diluted in 250µL distilled water and measured for 120 seconds at a flow rate SLOW. As a control, Pentaglobin (IgG, IgM, IgA) solution was diluted in distilled water in a concentration of 1:100. Coloured markers were set for each channel indicating the background of unstained immunoglobulins (Pentaglobín, Figure 13A). Interestingly as can be seen in Figure 13 below, there was a signal for antibody aggregates specific for CD16-FITC, CD14-APC, CD45-Krome Orange and Annexin-FITC; however, the strongest signals were detectable for APC and Krome Orange. Since there was no compensation set, FITC and Krome Orange spillovers could be observed. When antibody cocktails were centrifuged (Figure 13F, Microfuge 22R Centrifuge, Beckman Coulter) prior to staining procedures there was no specific signal detectable.
Figure 13A Immunoglobulin Solution (Pentaglobin : distilled water = 1:100)
Figure 13B CD16 FITC

S e t - U p o f t h e C y t o F L E X • B E C K M A N C O U L T E R 11
Figure 13C CD14 APC
Figure 13D CD45 Krome Orange
Figure 13E Annexin V FITC
Figure 13F Antibodies and Annexin V after centrifugation

S e t - U p o f t h e C y t o F L E X • B E C K M A N C O U L T E R 12
TECHNICAL NOTES
Linearity of Megamix-Plus SSC beads in comparison of size to fluorescence intensity
As shown in Figure 14 there is a strong linearity (R2=0.9995) between the size of the Megamix-Plus SSC beads (100, 160, 200, 500nm) which are optimized for the SSC light signal. Megamix-Plus SSC beads were measured using the Gigamix protocol described above. For analysis, a marker was set over each single peak. The mean channel fluorescence intensity of each peak was set in relation to the size of the peak and a regression curve analysis was calculated using Excel (Microsoft).
Figure 14: Linearity between size of Megamix-Plus SSC beads and mean channel fluorescence intensity of the measured beads.
Influence of the measured sample flow rate in comparison to the noise
Gigamix beads were diluted 1:5 in distilled water and measured at flow rates of 10, 60 and 120μl/min. As can be seen in Figure 15 the population of the 100nm beads is very small and within the range of noise. Increasing the flow rate makes the 100nm beads more «visible» which clearly indicates that only the beads signal was increased but not the background noise. Also all other peaks are better visible so that it is obvious that by increasing the flow rate the background noise is not increased and remains stable if distilled water is used as diluent.
Figure 15A 10μl/min Figure 15B 60μl/min Figure 15C 120μl/min

S e t - U p o f t h e C y t o F L E X • B E C K M A N C O U L T E R 13
SUMMARY AND DISCUSSION
The CytoFLEX is the first flow cytometer with an acceptable noise range on which we can clearly demonstrate detection of extracellular vesicles down to a size of 150nm. The potential to combine small particle analysis with the detection of up to 13 additional fluorescence parameters makes this cytometer an outstanding instrument for extracellular vesicle detection.
However, the correct measurement is strongly dependent on a series of prerequisites. For example, the staining of extracellular vesicles from whole blood requires blood draw into citrate anticoagulated tubes with special conditions which are described in detail in the literature cited herein. The so-called preanalytic procedures include not only blood drawing procedures but also the handling of the blood – do not shake or mix – otherwise a lot of microparticles are produced and artefacts are measured. Sample preparation is highly dependent on centrifugation steps which are also well described in the literature. Additionally we demonstrate here, again, the selection and preparation of the sample media is important. Measuring samples that contain plasma or measuring cell culture samples which contain FCS give a high background of particles similar to the particles which are intended to be measured.
Staining procedures are also important. Before starting, sample staining dilution steps should be performed to avoid the swarm effect and ensure measurement of single events. Centrifuge the antibody solution(s) before dilution or titration otherwise aggregates can be detected by the flow cytometer. Taken together, these precautions allow for best practice in extracellular vesicle measurement.
While Gigamix beads serve as a good tool to standardize the CytoFLEX on a daily basis for particle measurement, they are in reality polystyrene beads and are very different from biological membranes which ultimately leads to some discrepancy in predicting the size of the extracellular vesicles. The refractory index of beads differs substantially from the refractory index of biological membranes/particles. The particle size should be only seen in a range of size measurements and the results should be carefully interpretated. The next few years will show whether increasing sensitivities of particle measurement will enhance the knowledge and the biological relevance of extracellular vesicles. The CytoFLEX is a big step forward to nanoparticle detection and offers particle evaluation down to approximately 150nm.

S e t - U p o f t h e C y t o F L E X • B E C K M A N C O U L T E R 14
REAGENTS
Megamix-Plus SSC beads: BioCytex – Reference 7803, 500 µl beads, 50 tests
Megamix-Plus FSC beads: BioCytex – Reference 7802, 500 µl beads, 50 tests
REFERENCES
1. Barteneva NS et al. Circulating microparticles: square the circle. BMC Cell Biol. 2013, 14:23
2. Sarlon-Bartoli G et al. Plasmatic level of leukocyte-derived microparticles is associated with unstable plaque in asymptomatic patients with high-grade carotid stenosis. J Am Coll Cardiol. 2013, 62:1436
*For Research Use Only. Not for use in diagnostic procedures.
CytoFLEX and CytExpert are trademarks of Xitogen Technologies (Suzhou), Inc., a Beckman Coulter company.
Krome Orange and Gallios are trademarks of Beckman Coulter, Inc.
Beckman Coulter and the stylized logo are registered trademarks of Beckman Coulter, Inc and are registered in the USPTO.
FLOW-861APP0315-A © 2015 Beckman Coulter, Inc. All rights reserved.


![Simultaneous and absolute quantification of nucleoside ......9]UTP, 10 μM [15N 5, 13C 10]dATP, 10 μM[15N 5, 13C 10]dGTP, 10 μM [15N 3, 13C 9]dCTP, and 10 μM[15N 2, 13C 10]dTTP)](https://static.fdocuments.us/doc/165x107/6110c5cfc90cfe531510e3b4/simultaneous-and-absolute-quantification-of-nucleoside-9utp-10-m-15n.jpg)