Cytochrome P450 site of metabolism prediction from 2D topological ...
14
Tyzack et al. Journal of Cheminformatics 2014, 6:29 http://www.jcheminf.com/content/6/1/29 RESEARCH ARTICLE Open Access Cytochrome P450 site of metabolism prediction from 2D topological fingerprints using GPU accelerated probabilistic classifiers Jonathan D Tyzack 1 , Hamse Y Mussa 1 , Mark J Williamson 1 , Johannes Kirchmair 2 and Robert C Glen 1* Abstract Background: The prediction of sites and products of metabolism in xenobiotic compounds is key to the development of new chemical entities, where screening potential metabolites for toxicity or unwanted side-effects is of crucial importance. In this work 2D topological fingerprints are used to encode atomic sites and three probabilistic machine learning methods are applied: Parzen-Rosenblatt Window (PRW), Naive Bayesian (NB) and a novel approach called RASCAL (Random Attribute Subsampling Classification ALgorithm). These are implemented by randomly subsampling descriptor space to alleviate the problem often suffered by data mining methods of having to exactly match fingerprints, and in the case of PRW by measuring a distance between feature vectors rather than exact matching. The classifiers have been implemented in CUDA/C++ to exploit the parallel architecture of graphical processing units (GPUs) and is freely available in a public repository. Results: It is shown that for PRW a SoM (Site of Metabolism) is identified in the top two predictions for 85%, 91% and 88% of the CYP 3A4, 2D6 and 2C9 data sets respectively, with RASCAL giving similar performance of 83%, 91% and 88%, respectively. These results put PRW and RASCAL performance ahead of NB which gave a much lower classification performance of 51%, 73% and 74%, respectively. Conclusions: 2D topological fingerprints calculated to a bond depth of 4-6 contain sufficient information to allow the identification of SoMs using classifiers based on relatively small data sets. Thus, the machine learning methods outlined in this paper are conceptually simpler and more efficient than other methods tested and the use of simple topological descriptors derived from 2D structure give results competitive with other approaches using more expensive quantum chemical descriptors. The descriptor space subsampling approach and ensemble methodology allow the methods to be applied to molecules more distant from the training data where data mining would be more likely to fail due to the lack of common fingerprints. The RASCAL algorithm is shown to give equivalent classification performance to PRW but at lower computational expense allowing it to be applied more efficiently in the ensemble scheme. Keywords: Cytochrome P450, Metabolism, Probabilistic, Classification, GPU, CUDA, 2D Background The prediction of sites and products of metabolism for xenobiotic and endogenous compounds is an impor- tant avenue of research, playing an influential role in the development and use of pharmaceuticals, cosmet- ics, nutritional supplements and agrochemicals. Toxicity of metabolites can play a major role in the withdrawal *Correspondence: [email protected] 1 Unilever Centre for Molecular Science Informatics, Department of Chemistry, University of Cambridge, Lensfield Road, CB2 1EW Cambridge, UK Full list of author information is available at the end of the article of new drugs or black-box warnings, contributing to the high attrition rates in the development of new chemical entities. The cytochrome P450s (CYPs) are a family of heme- containing enzymes involved in the phase-I metabolism of over 90% of drugs on the market [1,2]. The CYP family of enzymes consists of 57 isoforms with the majority of bio- transformations in mammals facilitated by the CYP 3A4 isoform, followed by 2D6 and 2C9. The most common reactions catalysed by CYPs involve the insertion of a single oxygen into an organic molecule © 2014 Tyzack et al.; licensee Chemistry Central Ltd. This is an Open Access article distributed under the terms of the Creative Commons Attribution License (http://creativecommons.org/licenses/by/4.0), which permits unrestricted use, distribution, and reproduction in any medium, provided the original work is properly credited. The Creative Commons Public Domain Dedication waiver (http://creativecommons.org/publicdomain/zero/1.0/) applies to the data made available in this article, unless otherwise stated.
Transcript of Cytochrome P450 site of metabolism prediction from 2D topological ...

Tyzack et al. Journal of Cheminformatics 2014, 6:29http://www.jcheminf.com/content/6/1/29
RESEARCH ARTICLE Open Access
Cytochrome P450 site of metabolism predictionfrom 2D topological fingerprints using GPUaccelerated probabilistic classifiersJonathan D Tyzack1, Hamse Y Mussa1, Mark J Williamson1, Johannes Kirchmair2 and Robert C Glen1*
Abstract
Background: The prediction of sites and products of metabolism in xenobiotic compounds is key to thedevelopment of new chemical entities, where screening potential metabolites for toxicity or unwanted side-effects isof crucial importance. In this work 2D topological fingerprints are used to encode atomic sites and three probabilisticmachine learning methods are applied: Parzen-Rosenblatt Window (PRW), Naive Bayesian (NB) and a novel approachcalled RASCAL (Random Attribute Subsampling Classification ALgorithm). These are implemented by randomlysubsampling descriptor space to alleviate the problem often suffered by data mining methods of having to exactlymatch fingerprints, and in the case of PRW by measuring a distance between feature vectors rather than exactmatching. The classifiers have been implemented in CUDA/C++ to exploit the parallel architecture of graphicalprocessing units (GPUs) and is freely available in a public repository.
Results: It is shown that for PRW a SoM (Site of Metabolism) is identified in the top two predictions for 85%, 91% and88% of the CYP 3A4, 2D6 and 2C9 data sets respectively, with RASCAL giving similar performance of 83%, 91% and88%, respectively. These results put PRW and RASCAL performance ahead of NB which gave a much lowerclassification performance of 51%, 73% and 74%, respectively.
Conclusions: 2D topological fingerprints calculated to a bond depth of 4-6 contain sufficient information to allow theidentification of SoMs using classifiers based on relatively small data sets. Thus, the machine learningmethods outlinedin this paper are conceptually simpler and more efficient than other methods tested and the use of simple topologicaldescriptors derived from 2D structure give results competitive with other approaches using more expensive quantumchemical descriptors. The descriptor space subsampling approach and ensemble methodology allow the methods tobe applied to molecules more distant from the training data where data mining would be more likely to fail due tothe lack of common fingerprints. The RASCAL algorithm is shown to give equivalent classification performance toPRW but at lower computational expense allowing it to be applied more efficiently in the ensemble scheme.
Keywords: Cytochrome P450, Metabolism, Probabilistic, Classification, GPU, CUDA, 2D
BackgroundThe prediction of sites and products of metabolism forxenobiotic and endogenous compounds is an impor-tant avenue of research, playing an influential role inthe development and use of pharmaceuticals, cosmet-ics, nutritional supplements and agrochemicals. Toxicityof metabolites can play a major role in the withdrawal
*Correspondence: [email protected] Centre for Molecular Science Informatics, Department of Chemistry,University of Cambridge, Lensfield Road, CB2 1EW Cambridge, UKFull list of author information is available at the end of the article
of new drugs or black-box warnings, contributing to thehigh attrition rates in the development of new chemicalentities.The cytochrome P450s (CYPs) are a family of heme-
containing enzymes involved in the phase-I metabolism ofover 90% of drugs on the market [1,2]. The CYP family ofenzymes consists of 57 isoforms with the majority of bio-transformations in mammals facilitated by the CYP 3A4isoform, followed by 2D6 and 2C9.The most common reactions catalysed by CYPs involve
the insertion of a single oxygen into an organic molecule
© 2014 Tyzack et al.; licensee Chemistry Central Ltd. This is an Open Access article distributed under the terms of the CreativeCommons Attribution License (http://creativecommons.org/licenses/by/4.0), which permits unrestricted use, distribution, andreproduction in any medium, provided the original work is properly credited. The Creative Commons Public Domain Dedicationwaiver (http://creativecommons.org/publicdomain/zero/1.0/) applies to the data made available in this article, unless otherwisestated.

Tyzack et al. Journal of Cheminformatics 2014, 6:29 Page 2 of 14http://www.jcheminf.com/content/6/1/29
giving rise to C=C epoxidation, aromatic C oxidation, Soxidation and C-H hydroxylation reactions, the last exam-ple often leading to N-dealkylation or O-dealkylation ifoxidation occurs on a suitable leaving group in an amineor ether moiety.A host of computational approaches to predict SoMs
have been developed as an alternative or aid to theresource and time consuming nature of experimentalinvestigation. These approaches can be either ligand-based, where the structures and properties of knownsubstrates or non-substrates are modelled to developstructure-activity relationships, or structure-based, wherethe structure of the metabolising CYP enzyme andits interactions with ligands are modelled. The readeris referred to the many comprehensive review papers[3-7] for an overview of the current computational toolsto predict SoMs.Many methods consider reactivity and accessibility fac-
tors since a SoMmust be sufficiently reactive and also ableto come into close proximity to the reactive heme centre.One such example is SMARTCyp [8], a Java-based SoMpredictor that uses a database of activation energies forvarious pre-defined ligand fragments to assign reactivityestimates to matching moieties in a query ligand, with anaccessibility descriptor used to tune the ranking.Other methods take the accessibility consideration
further and employ docking techniques to refine the pre-dictions from reactivity approaches. Examples of thesemethods include IMPACTS [9], which combines dock-ing with a fragment based reactivity approach, and arecently published approach [10] that makes use of a teth-ered docking methodology using GOLD [11] combinedwith a reactivity approach based on hydrogen bond orderdescriptors and a novel implementation of the averagelocal ionisation energy.In contrast to these approaches the methods described
in this work do not require the explicit modelling of ligandbinding or reactivity, but make use of machine learningtechniques applied to an appropriate, representative dataset. Various machine learning methods have been appliedto the problem of SoMmetabolismwith some of themajorcontributions summarised below.An example of a data-mining approach is MetaPrint2D
[12], an online metabolism prediction tool trained onthe Accelrys Metabolite Database [13] that makes SoMpredictions based on occurrence counts of atomic fin-gerprints within the database where they appear as SoMversus non-SoM. If matching sites are not found in thedatabase, Metaprint2D informs the user and makes nopredictions rather than extrapolating beyond its domainof applicability.Many methods employing machine learning techniques
generate a wide-range of descriptors for each atomicsite in the data set often including quantum chemical
and electronic descriptors. An example is RegioSelectivity(RS)-predictor [14,15] which uses a Support VectorMachine (SVM) to predict SoM using 148 topological and392 quantum chemical atomic descriptors where some ofthese descriptors are modified to include contributionsfrom neighbouring atoms. A neural network approachcalled Xenosite [16] has also been applied to this descrip-tor set but combinedwith othermolecular descriptors andfingerprint descriptors based on the Daylight [17] defini-tion. A probability score that each atomic site is a SoMis obtained allowing the different sites in the moleculeto be ranked with improved predictive performance over(RS)-predictor reported.Another study [18] combines descriptors based on the
electronic structure of the molecule with explicitly cal-culated activation energies [19,20], and also incorporatesSolvent Accessible Surface Area (SASA) descriptors cal-culated using MOE [21]. Classification of the atomic sitesin the data set into SoMs and non-SoMs was performedusing random forest/ensemble decision trees, with theactivation energy shown to be the most important indetermining SoM.A further method [22] with relevance to small endoge-
nous molecules makes use of the Kyoto Encyclopediaof Genes and Genomes (KEGG) pathway database [23]where 4843 reactions were classified into 80 classes.SMARTS patterns were used to define chemical substruc-tures (reaction centres and surrounding regions) withvarious descriptors used to encode these sites includingelectronic, energetic, topological, distance and steric. Foreach reaction centre a SVM binary classification modelwas trained and the score obtained for each potentialSoM in a query molecule was used to rank the candidatereaction centres.The computational expense of using quantum chemi-
cal descriptors is addressed by FAME [24], a metabolismprediction tool that applies random forest models to theMetabolite [13] database. It calculates atomic descrip-tors using the CDK [25] relating to charge and moleculartopology and generates SoM predictions in a few secondsper molecule. FAME has other benefits since it is not justa predictor of CYP metabolism but reflects the broaderenzyme reactions documented in the Metabolite databaseand can be filtered for Phase-I and Phase-II metabolism inhuman, rat and dog.A recent publication [26] describes an approach to SoM
prediction that applies the PASS algorithm to atom envi-ronment fingerprints encoded with 2D descriptors. Thisallows the method to be faster than those methods thatmust first generate 3D structures to calculate quantumchemical descriptors and gives results that are competitivewith RS-Predictor and SMARTCyp.This paper takes a similar approach using the 2D topo-
logical circular fingerprint [27,28] of atomic sites within a
Tyzack et al. Journal of Cheminformatics 2014, 6:29 Page 3 of 14http://www.jcheminf.com/content/6/1/29
molecule as the sole descriptor making the method com-putationally less expensive than those that use 3D descrip-tors. Three probabilistic classifiers have been applied tothe problem of xenobiotic SoM prediction: the NaiveBayesian (NB), the Parzen-Rosenblatt Window (PRW)and a novel method called RASCAL (Random AttributeSubsampling Classification Algorithm) that will be pre-sented in the Methods section. In all classifiers themachine learning technique was applied on an ensem-ble basis by randomly subsampling descriptor space andtreating each sub-classifier as one vote in an overallclassification.The kernelised nature of the PRW and RASCAL
algorithms allied with the ensemble approach lends itselfto a parallel implementation exploiting the massively par-allel processing capability of Graphical Processing Units(GPUs). The computing industry is moving towards a par-allel model as the limitations and capabilities of modernsemiconductor manufacturing mean that ever increas-ing performance from a single processor is no longerpossible [29]. In recent years, GPUs have become increas-ingly competitive with regard to programmability, speedand price, with the release of CUDA (Compute UnifiedDevice Architecture) providing a standard C-like inter-face allowing scientists to exploit the parallel power ofthe GPU. The CUDA model operates by launching blocksof threads that are executed on stream multiprocessors(SMs) concurrently. Threads and blocks can be referred toby identification numbers allowing each to operate on adifferent portion of the data, where threads in a commonblock can communicate via a localised shared memory.Recent developments in GPU accelerated classifica-
tion tools include implementations for support vectormachines [30-32], neural networks [33], k-nearest neigh-bours [34] and a parallel tool for the classification ofremotely sensed imagery [35]. The techniques describedin these studies could lead to similar efficiency gains whenapplied to cheminformatics classification problems and inthe remainder of this paper GPU accelerated probabilisticclassifiers are applied to the problem of SoM identifica-tion. The CUDA implementation released as part of thiswork could be applied to other binary or multi-class datasets, where in the case of RASCAL and NB the featurevectors would need to consist of integer or binary val-ues. It is hoped that this implementation would be ofinterest to members of the cheminformatics communityapplying classification approaches to large data sets whereperformance is hindered by high computational demands.In the Methods section the data sets and descriptors
are presented, along with the three probabilistic classi-fiers (PRW, RASCAL and NB) and a discussion of theCUDA implementation. In the Results section the classifi-cation performance of the different methods is presentedin terms of the Matthews Correlation Coefficient (MCC),
area under the ROC curve and the percentage of the datasets where a SoM is identified in the top k positions.The effect of varying the size of the circular fingerprintsused to describe atomic sites is investigated and a bench-marking analysis comparing the speed performance ofthe CUDA implementation on a Tesla C2075 GPU anda GeForce GT640 GPU to reference is presented. Theimportant inferences from this work are presented in theConclusions section.To emphasize the benefits and novel aspects of this
work it is important to point out that the SoM predictionmodels are built from 2D topological circular fingerprintswithout the requirement for complex quantum chemicaland 3D descriptors. RASCAL combines the classifica-tion performance of the PRW with greater computationalspeed and hence could be applied to other much largerdata sets. The data sets employed here are relatively smalland show that SoMs can be identified within data sets ofthe order of 100’s of molecules being of potential inter-est to pharmaceutical companies with limited data on aspecific series of molecules.
ExperimentalData setsThe machine learning approaches used in this study havebeen applied to the publicly available CYP 3A4, 2D6 and2C9 data sets that originate from those initially released inthe supporting information of the RS-Predictor paper [15]but further curated [9] with reference to the primary lit-erature to identify and eliminate conflicting information.Open Babel v2.3.1 [36] was used to generate the proto-nation state of each ligand at pH 7.4 and the mol2 filesgenerated are made available in the Additional files. Thedata sets have been sampled on a leave-one-out-cross-validation basis to generate results that are comparablewith other reported methods [16].The feature vectors used to describe the atomic sites
in each molecule are 2D topological circular fingerprints[27,28] based on the occurrence counts of SYBYL [37]atom types at different topological distances from theatom in question (see Figure 1 for a pictorial representa-tion of the construction of these fingerprints). The sizeof the circular fingerprints can be varied by choosing dif-ferent bond depths and for this study separate trainingsets were created for bond depths ranging from 0-8, thusallowing the impact of bond depth on classification per-formance to be assessed. A Java program was written toread in the data sets in mol2 [13] format and generate thecircular fingerprints creating two classes: those circularfingerprints associated with a SoM and those not asso-ciated with a SoM. The circular fingerprints assigned tothese two classes for each data set and bond depth wereused as the inputs to the machine learning approachesdescribed in this work. The data sets for each isoform for

Tyzack et al. Journal of Cheminformatics 2014, 6:29 Page 4 of 14http://www.jcheminf.com/content/6/1/29
Figure 1 Topological circular fingerprints. Graphic to represent the construction of a circular fingerprint to a bond depth, d, of 6 using counts ofSYBYL atom types at each level.
bond depths ranging from 4-6 are made available in theAdditional files section in Additional files 1, 2, 3, 4, 5, 6,7, 8 and 9. The mol2 files used to generate these circularfingerprints are also made available in the Additional filessection in Additional files 10, 11 and 12.
SoM predictionThe SoM classification performance of each approachdescribed in the Methods section was assessed for eachisoform data set using feature vectors calculated at eachof the bond depths ranging from 0-8. These methods havebeen implemented on an ensemble subsampling method-ology, hence as described previously the length of thesubsample, q, needs to be optimised. Therefore, for each
classification model q was varied from an initial value of5 to the full number of features L in increments of 5, withthe Matthews Correlation Coefficient (MCC) [38] and thearea under ROC curves used to compare classificationperformance. Selection of the j parameter is a balancebetween sufficiently sampling feature space versus com-putational load, with a value of 201 found to be suitablein this case. The graphs shown in Figure 2 show classifi-cation performance against j for models with q = 40 andbond depth ranging from 4-6 and show that by j = 201 theclassification performance has largely reached a plateau.In this way the probability that an atomic site is a SoM
can be calculated allowing all sites in a molecule to beranked. The percentage of the data set where a SoM is
Figure 2 Impact of number of subsamples, j. Graphs showing classification performance for the three data sets in terms of MCC against numberof subsamples j for models built using circular fingerprint bond depths ranging from 4-6. A value of j = 201 was chosen to run the classificationmodels.
Tyzack et al. Journal of Cheminformatics 2014, 6:29 Page 5 of 14http://www.jcheminf.com/content/6/1/29
identified in the top two (top-2%) and top three (top-3%)predictions was calculated to allow comparisons to otherSoM identificationmethods.When calculating the top-2%and top-3% values steps were taken to identify atoms inequivalent sites to ensure that such sites are only includedonce in predictions. This was achieved by generating fullcircular fingerprints for each atomic site in the same wayas described previously but this time spanning the entireligand, with equivalent atomic sites defined as those withidentical circular fingerprints.
CUDA implementationThe three probabilistic classifiers have been implementedusing the Nvidia Nsight [39] integrated development envi-ronment for CUDA/C++ released as part of CUDA Tools5.5. A benchmarking analysis has been carried out com-paring the performance speed of an Nvidia C2075 TeslaGPU and an Nvidia GT640 GeForce GPU against a refer-ence CPU implementation running on a single Intel XeonE5506 at 2.13GHz.The source code is available in a public reposi-
tory (https://bitbucket.org/jdt42/probclassifier_cuda) andcould be applied to other classification problems wherethe input files are formatted in the appropriate manner forthis tool. The code exploits the parallel nature of GPU’sby aligning the dimensions of the classification problem,such as number of feature vectors N and number of sub-classifiers j, with the parallel architecture of CUDA wherecomputational work is kernelised and spread over blocksof threads. The code makes use of atomic operations andso requires a CUDA enabled GPU with a compute ratingof ≥ 1.1.
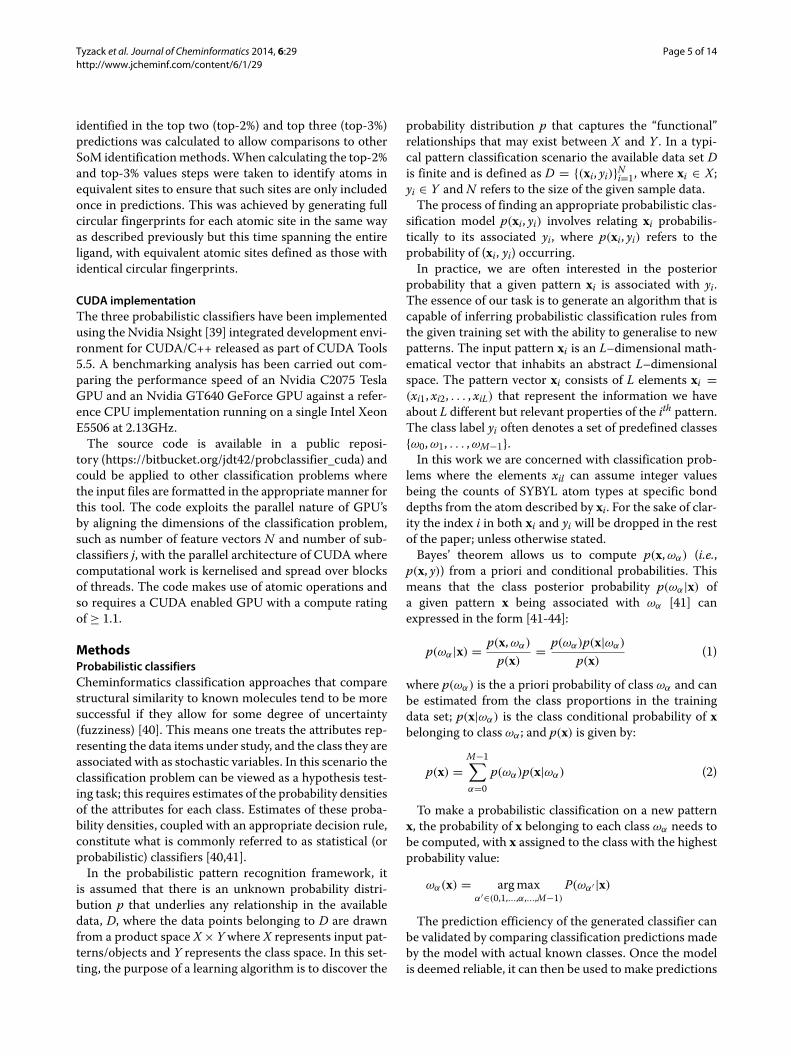
MethodsProbabilistic classifiersCheminformatics classification approaches that comparestructural similarity to known molecules tend to be moresuccessful if they allow for some degree of uncertainty(fuzziness) [40]. This means one treats the attributes rep-resenting the data items under study, and the class they areassociated with as stochastic variables. In this scenario theclassification problem can be viewed as a hypothesis test-ing task; this requires estimates of the probability densitiesof the attributes for each class. Estimates of these proba-bility densities, coupled with an appropriate decision rule,constitute what is commonly referred to as statistical (orprobabilistic) classifiers [40,41].In the probabilistic pattern recognition framework, it
is assumed that there is an unknown probability distri-bution p that underlies any relationship in the availabledata, D, where the data points belonging to D are drawnfrom a product space X× Y where X represents input pat-terns/objects and Y represents the class space. In this set-ting, the purpose of a learning algorithm is to discover the
probability distribution p that captures the “functional”relationships that may exist between X and Y . In a typi-cal pattern classification scenario the available data set Dis finite and is defined as D = {(xi, yi)}Ni=1, where xi ∈ X;yi ∈ Y and N refers to the size of the given sample data.The process of finding an appropriate probabilistic clas-
sification model p(xi, yi) involves relating xi probabilis-tically to its associated yi, where p(xi, yi) refers to theprobability of (xi, yi) occurring.In practice, we are often interested in the posterior
probability that a given pattern xi is associated with yi.The essence of our task is to generate an algorithm that iscapable of inferring probabilistic classification rules fromthe given training set with the ability to generalise to newpatterns. The input pattern xi is an L–dimensional math-ematical vector that inhabits an abstract L–dimensionalspace. The pattern vector xi consists of L elements xi =(xi1, xi2, . . . , xiL) that represent the information we haveabout L different but relevant properties of the ith pattern.The class label yi often denotes a set of predefined classes{ω0,ω1, . . . ,ωM−1}.In this work we are concerned with classification prob-
lems where the elements xil can assume integer valuesbeing the counts of SYBYL atom types at specific bonddepths from the atom described by xi. For the sake of clar-ity the index i in both xi and yi will be dropped in the restof the paper; unless otherwise stated.Bayes’ theorem allows us to compute p(x,ωα) (i.e.,
p(x, y)) from a priori and conditional probabilities. Thismeans that the class posterior probability p(ωα|x) ofa given pattern x being associated with ωα [41] canexpressed in the form [41-44]:
p(ωα|x) = p(x,ωα)
p(x)= p(ωα)p(x|ωα)
p(x)(1)
where p(ωα) is the a priori probability of class ωα and canbe estimated from the class proportions in the trainingdata set; p(x|ωα) is the class conditional probability of xbelonging to class ωα ; and p(x) is given by:
p(x) =M−1∑α=0
p(ωα)p(x|ωα) (2)
To make a probabilistic classification on a new patternx, the probability of x belonging to each class ωα needs tobe computed, with x assigned to the class with the highestprobability value:
ωα(x) = argmaxα′∈(0,1,...,α,...,M−1)
P(ωα′ |x)
The prediction efficiency of the generated classifier canbe validated by comparing classification predictions madeby the model with actual known classes. Once the modelis deemed reliable, it can then be used to make predictions

Tyzack et al. Journal of Cheminformatics 2014, 6:29 Page 6 of 14http://www.jcheminf.com/content/6/1/29
about the behaviour of real world patterns coming fromthe same domain, X, as the given training set.Clearly the estimation of the probability function
p(x|ωα) is the most important step in the estimationof p(ωα|x), vide supra. Thus, over the years a numberof approaches to obtain estimates of p(x|ωα) have beendeveloped [44-46].When the data are sparse in the descriptor/input space,
it can become difficult to generate a good estimate ofp(x|ωα). This may result in a probabilistic classifier (a sin-gle classifier) with poor generalisation performance. Thisproblem is also encountered when one tries to constructnon–probabilistic classifiers on a data set sparse in thedescriptor space.There are different approaches that can be used to
improve the generalisation performance of single clas-sifiers. Feature selection schemes [41]; regularisationmethods [42,46]; and the so–called ensemble learningtechnique (which is currently popular [42,47,48]) are goodexamples of these approaches. In the ensemble technique,the scheme employed in this work, the classification of anew pattern x is typically made through majority votingof the classification predictions of j(> 1) single (or base)classifiers. Empirical and theoretical results indicate thatan ensemble of base classifiers gives improvements in gen-eralisation over the individual classifiers [49], providingthe base classifiers are not correlated with one another.It was suggested that an effective method of achiev-ing uncorrelated individual classifiers in an ensemble isby training the single classifiers using randomly selectedq distinct attributes/features of the available L featureswhere q ≤ L [49] and the q–dimensional descriptor vectoris denoted by xq.It is important to note that, in this ensemble approach,
the number of training data points remains the same,i.e., N . Thus, the relative (with respect to q, the descrip-tor subspace dimension) training sample size increases[50], which in turn can improve the approximationof the class–conditioned probability from the trainingset.Three probabilistic classifiers based on the ideas briefly
described in the preceding paragraphs have been used tocreate SoM prediction tools, namely the Naive Bayesian(NB) [41,42], Parzen–RosenblattWindow (PRW) [51] andan internally developed methodology called RASCAL.The latter two approaches are kernel based, vide infra.In the following sections we describe how p(ωα|xq)
is estimated in each of the classification methods. Theatomic site and its class (SoM or nonSoM) are representedby xq, and ωα , respectively. Note that in this workM = 2,i.e. we are only dealing with 2 classes ω0 and ω1, whereω0 refers to SoM and ω1 denotes nonSoM. Finally it isassumed that all a priori class distributions are equal, i.e.,p(ω0) = p(ω1).
Naive Bayesian (NB)In the Naive Bayesian case, the class conditional p(xq|ωα)
can be estimated as
p(xq|ωα) =q∏
l=1p(xql |ωα) (3)
where
p(xql |ωα) = Cl + 1Nα + 2
(4)
with Cl being the number of times descriptor xql assumesthe same value in class ωα and Nα is the number oftraining items belonging to class ωα .Since p(ω0) = p(ω1), the posterior probability predic-
tion for membership of a particular class is computed as
p(ωα|xq) = p(xq|ωα)∑α p(xq|ωα)
(5)
The data item xq is predicted to be in the class withthe highest posterior probability p(ωα|xq), and in the casewhere equal posterior probabilities are calculated for twoclasses they are ranked arbitrarily. The final classmember-ship probabilities are calculated as the ratio of the numberof votes for that class divided by the total number ofsubclassifiers j.
Kernel based probabilistic classifiersIn kernel based methods, the average similarity, Siα , of atest atom xqi with the set of atoms xqk in the training set forclass ωα is calculated by comparing xqi with all examplesin the training set for ωα as
Siα = 1Nα
∑xqk∈ωα
K(xqi , xqk) (6)
where Nα represents the number of training data itemsbelonging to class ωα and the kernel function K
(xqi , x
qk)
measures the similarity between xqi and xqk . In this casethe class conditional probability p
(xqi |ωα
)is equal to
Siα , i.e.
p(xqi |ωα) = 1Nα
∑xqk∈ωα
K(xqi , x
qk)
(7)
Two different kernel functions have been implemented:the PRW and a Dirac kernel [52] used in the imple-mentation of RASCAL, both described in the nextsubsections.

Tyzack et al. Journal of Cheminformatics 2014, 6:29 Page 7 of 14http://www.jcheminf.com/content/6/1/29
Randomised attribute subsampling classificationalgorithm (RASCAL)In this study we present a probabilistic classifier calledRASCAL that uses a Dirac kernel function as shownbelow.
K(xqi , xqk) =
{1 xqi = xqk0 xqi �= xqk
(8)
In the case where the descriptors are defined over thebinary domain it has been shown that this kernel is equiv-alent to a full expansion in RadmacherWalsh polynomials[53]. However, in this application the circular finger-prints used to describe the atomic sites are integer valuedalthough the closed form of the kernel shown above canbe applied to all discrete valued feature vectors.
Parzen-Rosenblatt window (PRW)In this study, a Gaussian kernel has been used for PRWdefined as
K(xqi , xqk) = 1
(h√2π)q
exp(
− (xqi − xqk)T (xqi − xqk)2h2
)
(9)
where (xqi − xqk)T (xqi − xqk) is a measure of the distance
between xqi and xqk , q is the number of features and h is a
smoothing parameter, where a value of h = 0.1 was foundto give good performance.
Results and discussionFigure 3 summarises the classification results for fourmolecules chosen at random from the CYP 3A4 data setusing the scenario with a bond depth of 4, q = 45, j = 201and the RASCAL classifier. SoMs have been labelled witha green circle and the scores for the top three predictionsare labelled against the atom: green text is used where aSoM is identified, red text is used with a correspondingred ring where a non-SoM is identified. A SoM is identi-fied in the top 3 predictions for all molecules, and the top 2predictions for all except Lovastatin, reflecting the strongclassification performance observed across the entire dataset.
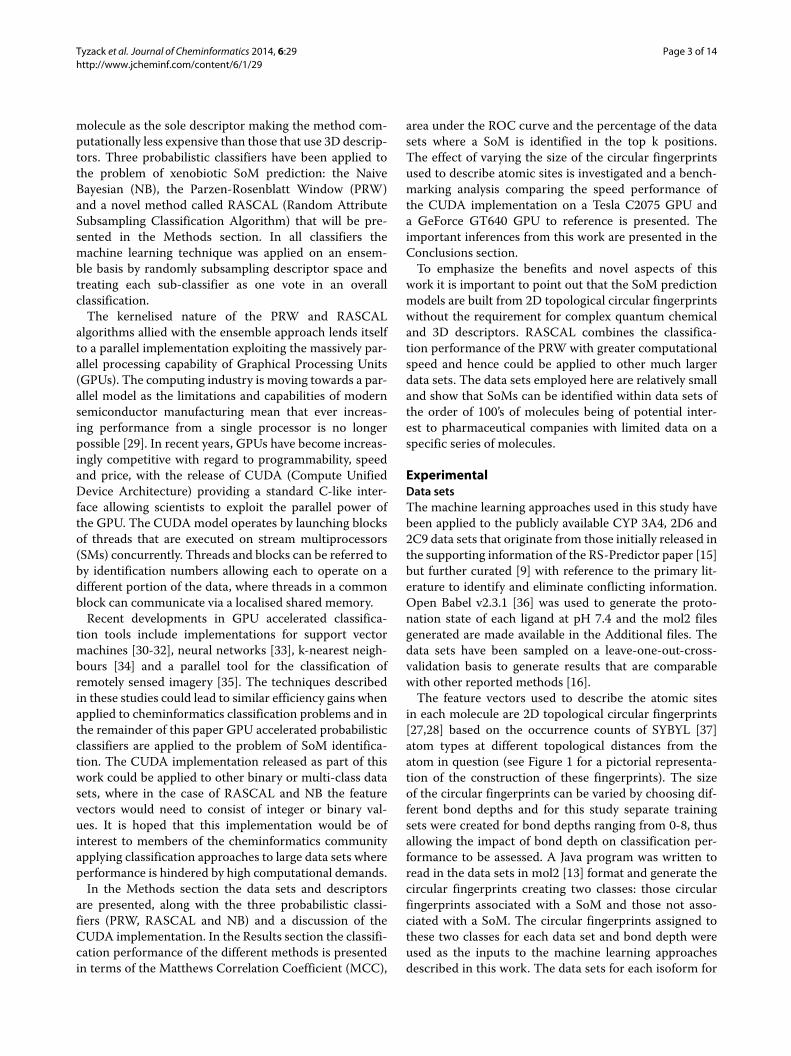
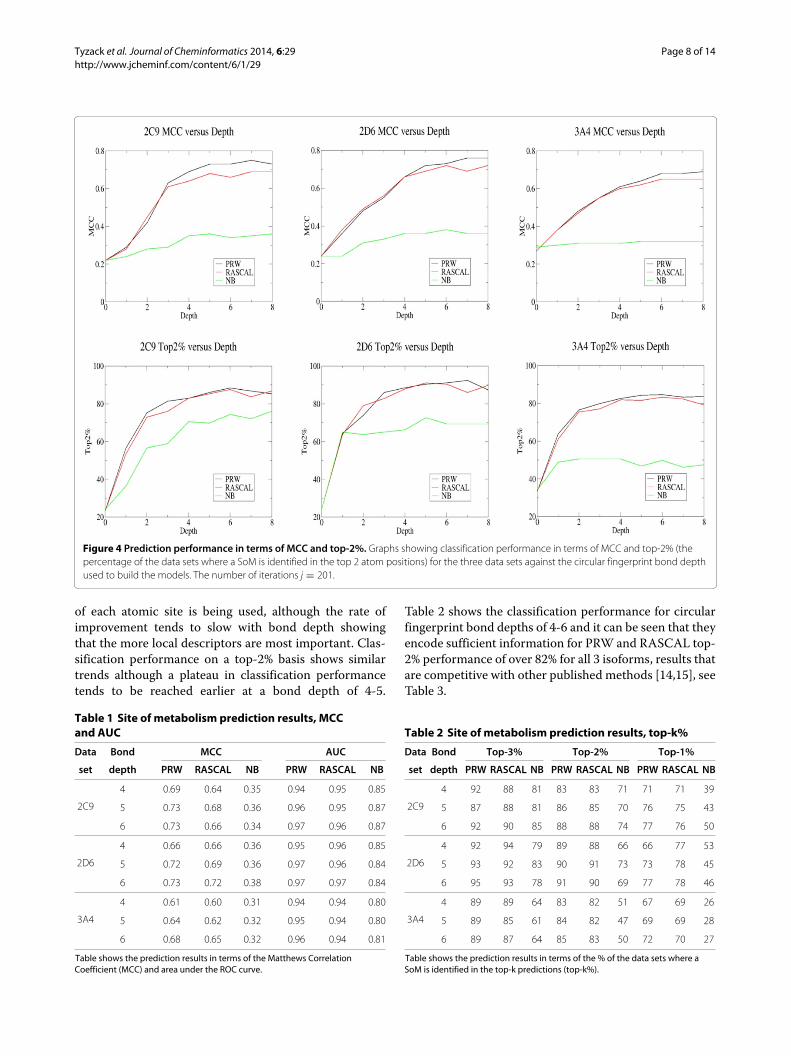
Circular fingerprint depth analysisThe graphs in Figure 4 show classification performancefor the three data sets against the bond depth used togenerate topological circular fingerprints, with the firstrow of graphs showing the Matthews Correlation Coeffi-cient (MCC) and the second row of graphs showing thetop-2%. Classification performance on an MCC basis isshown in Table 1 and generally improves with circularfingerprint bond depth since a more detailed description
Lovasta�n Perphenazine
Laquinimod Tamoxifen
0.520.95
0.73
0.450.53
0.77
0.68
0.69
1.0
1.0 0.53
0.40
0.92
Figure 3 Example SoM predictions. Graphic to summarise the classification results for four molecules chosen at random from the CYP 3A4 dataset using the scenario with a bond depth of 4, q = 45, j = 201 and the RASCAL classifier. SoMs have been labelled with a green circle and the scoresfor the top three predictions are labelled against the atom: green text is used where a SoM is identified, red text is used with a corresponding redring where a non-SoM is identified.
Tyzack et al. Journal of Cheminformatics 2014, 6:29 Page 8 of 14http://www.jcheminf.com/content/6/1/29
Figure 4 Prediction performance in terms of MCC and top-2%. Graphs showing classification performance in terms of MCC and top-2% (thepercentage of the data sets where a SoM is identified in the top 2 atom positions) for the three data sets against the circular fingerprint bond depthused to build the models. The number of iterations j = 201.
of each atomic site is being used, although the rate ofimprovement tends to slow with bond depth showingthat the more local descriptors are most important. Clas-sification performance on a top-2% basis shows similartrends although a plateau in classification performancetends to be reached earlier at a bond depth of 4-5.
Table 1 Site of metabolism prediction results, MCCand AUC
Data Bond MCC AUC
set depth PRW RASCAL NB PRW RASCAL NB
2C9
4 0.69 0.64 0.35 0.94 0.95 0.85
5 0.73 0.68 0.36 0.96 0.95 0.87
6 0.73 0.66 0.34 0.97 0.96 0.87
2D6
4 0.66 0.66 0.36 0.95 0.96 0.85
5 0.72 0.69 0.36 0.97 0.96 0.84
6 0.73 0.72 0.38 0.97 0.97 0.84
3A4
4 0.61 0.60 0.31 0.94 0.94 0.80
5 0.64 0.62 0.32 0.95 0.94 0.80
6 0.68 0.65 0.32 0.96 0.94 0.81
Table shows the prediction results in terms of the Matthews CorrelationCoefficient (MCC) and area under the ROC curve.
Table 2 shows the classification performance for circularfingerprint bond depths of 4-6 and it can be seen that theyencode sufficient information for PRW and RASCAL top-2% performance of over 82% for all 3 isoforms, results thatare competitive with other published methods [14,15], seeTable 3.
Table 2 Site of metabolism prediction results, top-k%
Data Bond Top-3% Top-2% Top-1%
set depth PRW RASCAL NB PRW RASCAL NB PRW RASCAL NB
2C9
4 92 88 81 83 83 71 71 71 39
5 87 88 81 86 85 70 76 75 43
6 92 90 85 88 88 74 77 76 50
2D6
4 92 94 79 89 88 66 66 77 53
5 93 92 83 90 91 73 73 78 45
6 95 93 78 91 90 69 77 78 46
3A4
4 89 89 64 83 82 51 67 69 26
5 89 85 61 84 82 47 69 69 28
6 89 87 64 85 83 50 72 70 27
Table shows the prediction results in terms of the % of the data sets where aSoM is identified in the top-k predictions (top-k%).

Tyzack et al. Journal of Cheminformatics 2014, 6:29 Page 9 of 14http://www.jcheminf.com/content/6/1/29
Table 3 Comparison to other methods
Data Top-2%
set PRW RASCAL Xenosite RSPredictor SMARTCyp Reactivity & Random
(depth=6) [16] [14,15] [8] docking [10]
2C9 88 88 87 85 86 78 18
2D6 91 90 89 86 84 80 22
3A4 85 83 88 82 80 75 21
Table shows site of metabolism prediction results in terms of the top-2% compared to other methods.
Analysis of subsample length on classification for bonddepths of 4-6As described previously classification performance isdependent on the subsample length q and the number ofsubclassifiers j. The graphs in Figure 5 show the classifi-cation performance in terms of MCC against q for eachof the models based on circular fingerprint bond depthsranging from 4-6. It can be seen that PRW and NB are lesssensitive to q than RASCAL, which is to be expected sinceRASCAL is in effect a subsample matching algorithmand if the subsample becomes too long then no match-ing instances will be found in the training set for eitherclass. Therefore when classifying a data set using RASCALit is necessary to parametrise carefully to find a suitablevalue for q. For PRW and NB classification performancetends to plateau at high q when applied to these datasets and using a PRW smoothing parameter of h = 0.1.For these approaches the extra computational cost of anensemble approach is not justified in terms of improvedperformance and a standard implementation running overall L descriptors would be more suitable. It can be seenthat PRW and RASCAL give similar classification perfor-mance once the parameter q has been optimised, withboth systematically outperforming the NB. This is rein-forced by the ROC curves shown in Figure 6 where PRWand RASCAL performance tracks above that for NB.
Significance of molecular similarityMachine learning becomes more challenging when testdata is more dissimilar to training data. To investigatethe ability of these methods to be applied to moleculesmore dissimilar from the training data a test set (TS1)representing 20% of each isoform data set was selectedat random with the remaining 80% forming the trainingset. A second test set (TS2) was then defined as a 50%subset of TS1 representing the molecules most dissimilarto the training set, with Open Babel [36] used to mea-sure molecular similarity using the default fingerprint.The SoM prediction performance is shown in Table 4 andshows that a worsening in performance in TS2 is morepronounced in the CYP 3A4 data set for the RASCALclassifier and on a top-2% basis in the CYP 2D6 dataset for the PRW classifier indicating that care must be
taken when extrapolating into chemical space more dis-similar to the training data although reasonable predictiveperformance is maintained.
Benchmarking analysisA comparison of the running times of the PRW, RASCALand NB algorithms on the three different platforms isgiven in Table 5 and the benefits from running in parallelare apparent. The results discussed previously have shownthat RASCAL gives classification performance equivalentto PRW and so to become relevant and competitive asa classifier it is necessary to demonstrate that RASCALis a faster more efficient algorithm. The relevant factorsregarding the computational expense of the RASCAL andPRW algorithms are discussed next.The reminder of this section makes use of the follow-
ing variables to describe the computational expense ofthe various algorithms: N refers to the size of the train-ing set for a particular class; j refers to the number ofsubsamples; q refers to the subsample size; and L refersto the full length of the feature vector. Using these defi-nitions the PRW algorithm computational expense whensubsampling descriptor space, PRWsub, can be estimatedas
O(PRWsub) ≈ N × j × (3 × q + 2)
whereas the computational expense of RASCAL can beestimated as
O(RASCAL) ≈ N × j × q
It should be noted that the RASCAL estimate is an upperbound. Only in the case where the training and test sub-samples are identical are all q features compared other-wise the feature by feature comparison is halted as soona difference is noted. Therefore the 15-fold faster runningtime of RASCAL over PRW can be justified by the lowercomputational expense, the early termination of the RAS-CAL kernel where relevant and the simpler nature of theRASCAL kernel compared to the PRW kernel.However, as demonstrated in the Results section there
is no benefit to performing subsampling with PRW, hencea more valid evaluation of algorithm running times isby comparison against PRW running over all L features

Tyzack et al. Journal of Cheminformatics 2014, 6:29 Page 10 of 14http://www.jcheminf.com/content/6/1/29
Figure 5 Impact of subsample length, q. Graphs showing classification performance for the three data sets in terms of MCC against subsamplelength q for models built using circular fingerprint bond depths ranging from 4-6. The number of iterations j = 201. RASCAL requires carefulparametrisation of q due to its sensitivity to this parameter.
without subsampling, PRWall, where the computationalexpense can be estimated as
O(PRWall) ≈ N × (3 × L + 2)
Therefore RASCAL is more likely to run faster than PRWwhen q L. In the data set with bond depth of 6, whereL = 175, applying RASCAL with q = 40 and j = 201gives a speed increase of 1.5 − 2.0 compared to PRWrunning over all features. However, the case for using
RASCAL is likely to becomemuchmore compelling whenusing data sets consisting of longer feature vectors whereit is more likely that RASCAL models can be used whereq L.NB runs faster than RASCAL since it is possible to pre-
compute the counts of common features between test dataitems and each training class so that the training dataitems only need to be parsed once, albeit at the price ofpoorer classification performance.

Tyzack et al. Journal of Cheminformatics 2014, 6:29 Page 11 of 14http://www.jcheminf.com/content/6/1/29
Figure 6 ROC curves. Graphs showing ROC curves for the three data sets using the best classification models built using circular fingerprint bonddepths ranging from 4-6.
ConclusionsThe probabilistic classifiers outlined in this paper basedon 2D topological fingerprints give SoM predictive per-formance that is competitive with other machine learningmethods that employ complex 3D descriptors, enablingconceptually simple and efficient classification models tobe built. Data mining approaches often suffer when fin-gerprints from a test molecule are not contained in thetraining data, but descriptor space subsampling and theuse of classifiers that measure a distance between vectorsinstead of exact matching help to alleviate this problem.
This enables the creation of classification models that canbe based on relatively small data sets but still applicableto molecules more distant from the training data wheredata mining would be more likely to fail due to the lackof common fingerprints. Hence the methods could be ofinterest to pharmaceutical companies studying a series ofmolecules with only of the order of 100’s of data pointsavailable.RASCAL and PRWwere found to give similar predictive
performance with PRW identifying a SoM in the top 2predictions for 85%, 91% and 88% for the CYP 3A4, 2D6

Tyzack et al. Journal of Cheminformatics 2014, 6:29 Page 12 of 14http://www.jcheminf.com/content/6/1/29
Table 4 Impact of molecular similarity on predictionperformance
Data Classifier Bond Top-3% Top-2%
set depth TS1 TS2 TS1 TS2
2C9
PRW5 85 85 82 85
6 83 85 81 85
RASCAL5 85 85 78 85
6 81 85 77 85
2D6
PRW5 90 92 85 75
6 91 94 86 79
RASCAL5 90 90 84 75
6 87 88 84 83
3A4
PRW5 83 82 80 78
6 84 81 80 79
RASCAL5 80 76 76 67
6 79 75 72 63
Table shows the classification performance in terms of top-2% and top-3% fortest set 1 (TS1: 20% of each isoform data set selected at random) and test set 2(TS2: the 50% of molecules in TS1 most dissimilar to the training data).
and 2C9 data sets respectively, whereas for RASCAL thefigures are 83%, 91% and 88%, respectively. This perfor-mance is competitive with other publishedmachine learn-ing methods [14,15] but is achieved using 2D descriptors.This suggests that there are common patterns in the localstructure of SoMs in the data sets that are captured by
Table 5 Benchmarking analysis
Data Method q Runtime seconds x-fold to Ref
set Ref GT640 C2075 GT640 C2075
2C9
RASCAL 40 42 11 2.2 4 19
NB 40 8.8 1.4 0.3 6 29
PRW 40 436 114 32 4 14
NB 175 8.2 1.3 0.3 6 27
PRW 175 7.0 31 3.6 0.2 2
2D6
RASCAL 40 57 15 3.0 4 19
NB 40 12 1.9 0.4 6 30
PRW 40 727 157 44 5 17
NB 175 11 1.8 0.4 6 28
PRW 175 9.7 43 5.0 0.2 2
3A4
RASCAL 40 298 66 13 5 23
NB 40 55 8.3 1.8 7 31
PRW 40 3,654 714 201 5 18
NB 175 53 8.1 1.8 7 29
PRW 175 45 197 23 0.2 2
Table shows the time taken in seconds and relative performance o the reference(Ref) to run all three classifiers over the three data sets using a scenario withbond depth of 6 (175 features) and j = 201 and q = 40. The reference is a singleIntel Xeon E5506 at 2.13GHz. The number of vectors in data sets CYP 2C9, 2D6and 3A4 are 2905, 3399 and 7294, respectively.
the atomic circular fingerprints and can be identified bymachine learning methods.RASCAL gives similar classification performance to
PRW but at lower computational expense making it suit-able for use on large data sets and particularly for theensemble schemes outlined in this paper. The speed boostfrom using RASCAL is likely to becomemore apparent forclassification problems where q L (where q is the sub-sample length and L is the full length of the feature vector)and in these situations the benefits from using RASCALare likely to become more compelling.The suitability of using CUDA/C++ to exploit the par-
allel capabilities of GPU hardware for classification prob-lems has been demonstrated and it is hoped that thesource code will be of use to other researchers in thefield. Further enhancements to the implementation couldinclude maximising the use of faster memory (shared, tex-ture and constant), implementing task parallelism usingstreams and implementing code to run on multiple GPUs,all of which should further improve the speed-up in per-formance compared to the reference.In summary it has been shown that probabilistic clas-
sifiers implemented using randomly selected subclassi-fiers on an ensemble basis using 2D topological circularfingerprints as descriptors can give strong SoM predic-tive performance. However, as with all machine learningmethods, the models are likely to be most relevant withintheir domain of applicability and are likely to perform lesswell against novel molecules that are very different fromthose in the training set.
Additional files
The following additional files have been made available consisting of thedata sets released in the RS-Predictor paper [15] for the three isoforms CYP3A4, 2D6 and 2C9 but representing atomic sites as topological circularfingerprints to bond depths ranging from 4-6. The first column is in theformatmoleculeNum_atomNumwheremoleculeNum is the moleculenumber per the ordering in the mol2 data sets [15] and atomNum is theatom number per these data sets. The second column represents the class,either SOM or notSOM, and the remaining columns represent thetopological circular fingerprint constructed as described in theExperimental section. The mol2 files representing the ligands in eachisoform data set are also provided in tar files.
Additional file 1: Topological circular fingerprints for atomic sites inthe 3A4 data to a bond depth of 4.
Additional file 2: Topological circular fingerprints for atomic sites inthe 3A4 data to a bond depth of 5.
Additional file 3: Topological circular fingerprints for atomic sites inthe 3A4 data to a bond depth of 6.
Additional file 4: Topological circular fingerprints for atomic sites inthe 2D6 data to a bond depth of 4.
Additional file 5: Topological circular fingerprints for atomic sites inthe 2D6 data to a bond depth of 5.
Additional file 6: Topological circular fingerprints for atomic sites inthe 2D6 data to a bond depth of 6.

Tyzack et al. Journal of Cheminformatics 2014, 6:29 Page 13 of 14http://www.jcheminf.com/content/6/1/29
Additional file 7: Topological circular fingerprints for atomic sites inthe 2C9 data to a bond depth of 4.
Additional file 8: Topological circular fingerprints for atomic sites inthe 2C9 data to a bond depth of 5.
Additional file 9: Topological circular fingerprints for atomic sites inthe 2C9 data to a bond depth of 6.
Additional file 10: Ligands in the 3A4 data set in mol2 format.
Additional file 11: Ligands in the 2D6 data set in mol2 format.
Additional file 12: Ligands in the 2C9 data set in mol2 format.
Competing interestsThe authors declare that they have no competing interests.
Authors’ contributionsJDT wrote the programs in C++ and CUDA, produced the data sets of circularfingerprints to represent the atomic sites and generated the results; HYMprovided the theoretical ideas behind the probabilistic classifiers; MJWprovided guidance with the programming and implementation and assistancewith optimising the code; JK and RCG provided overall scientific guidance inthe development of this work particularly around the use of atomic fingerprintdescriptors. All authors read and approved the final manuscript.
AcknowledgementsThe authors would like to thank Unilever for funding. We thank Dr. GuusDuchateau, Leo van Buren and Prof. Werner Klaffke for useful discussions inthe development of this work.
Author details1Unilever Centre for Molecular Science Informatics, Department of Chemistry,University of Cambridge, Lensfield Road, CB2 1EW Cambridge, UK. 2ETH Zurich,Department of Chemistry and Applied Biosciences, Institute of PharmaceuticalSciences, HCI G 474.2, Vladimir-Prelog-Weg 1-5/10, 8093 Zurich, Switzerland.
Received: 19 February 2014 Accepted: 12 May 2014Published: 27 May 2014
References1. Guengerich FP: Cytochrome P450s and other enzymes in drug
metabolism and toxicity. AAPS J 2006, 8:E101–11. [http://link.springer.com/article/10.1208/aapsj080112]
2. Lewis DFV: 57 varieties: the human cytochromes P450.Pharmacogenomics 2004, 5(3):305–18. [http://www.futuremedicine.com/doi/abs/10.1517/phgs.5.3.305.29827]
3. Kirchmair J, Williamson MJ, Tyzack JD, Tan L, Bond PJ, Bender A, Glen RC:Computational prediction of metabolism: sites, products, SAR, P450enzyme dynamics, andmechanisms. J Chem Inf Model 2012,52(3):617–48. [http://pubs.acs.org/doi/abs/10.1021/ci200542m]
4. Kulkarni SA, Zhu J, Blechinger S: In silico techniques for the study andprediction of xenobiotic metabolism: a review. Xenobiotica; FateForeign Compounds Biol Syst 2005, 35(10-11):955–73. [http://www.ncbi.nlm.nih.gov/pubmed/16393855]
5. Tarcsay A, Keseru GM: In silico site of metabolism prediction ofcytochrome P450-mediated biotransformations. Expert Opin DrugMetab Toxicol 2011, 7(3):299–312. [http://www.ncbi.nlm.nih.gov/pubmed/21291341]
6. Ekins S, Andreyev S, Ryabov A, Kirillov E, Rakhmatulin Ea, Bugrim A,Nikolskaya T: Computational prediction of human drugmetabolism.Expert Opin DrugMetab Toxicol 2005, 1(2):303–24. [http://www.ncbi.nlm.nih.gov/pubmed/16922645]
7. Vaz RJ, Zamora I, Li Y, Reiling S, Shen J, Cruciani G: The challenges of insilico contributions to drugmetabolism in lead optimization. ExpertOpin DrugMetab Toxicol 2010, 6(7):851–61. [http://www.ncbi.nlm.nih.gov/pubmed/20565339]
8. Rydberg P, Gloriam DE, Zaretzki J, Breneman C, Olsen L: SMARTCyp: A 2Dmethod for prediction of cytochrome P450-Mediated drugmetabolism. ACSMed Chem Lett 2010, 1(3):96–100. [http://pubs.acs.org/doi/abs/10.1021/ml100016x]
9. Campagna-Slater V, Pottel J, Therrien E, Cantin LD, Moitessier N:Development of a computational tool to rival experts in theprediction of sites of metabolism of xenobiotics by p450s. J Chem InfModel 2012, 52(9):2471–83. [http://www.ncbi.nlm.nih.gov/pubmed/22916680]
10. Tyzack JD, Williamson MJ, Torella R, Glen RC: Prediction of cytochromeP450 xenobiotic metabolism: tethered docking and reactivityderived from ligandmolecular orbital analysis. J Chem Inf Model 2013,53(6):1294–305. [http://www.ncbi.nlm.nih.gov/pubmed/23701380]
11. Jones G, Willett P, Glen RC:Molecular recognition of receptor sitesusing a genetic algorithmwith a description of desolvation. J MolBiol 1995, 245:43–53. [http://www.sciencedirect.com/science/article/pii/S0022283695800379]
12. MetaPrint2D, (accessed 03-06-2013). [http://www-metaprint2d.ch.cam.ac.uk/]
13. Accelrys Metabolite Database. Accelrys Inc., 10188 Telesis Court, Suite100, San Diego, CA, 92121, USA. [http://accelrys.com/products/databases/bioactivity/metabolite.html]
14. Zaretzki J, Bergeron C, Rydberg P, Huang TW, Bennett KP, Breneman CM:RS-Predictor: a new tool for predicting sites of cytochromeP450-Mediated metabolism applied to CYP 3A4. J Chem Inf Model2011, 51(7):1667–89. [http://pubs.acs.org/doi/abs/10.1021/ci2000488]
15. Zaretzki J, Rydberg P, Bergeron C, Bennett KP, Olsen L, Breneman CM:RS-Predictor models augmented with SMARTCyp reactivities:robust metabolic regioselectivity predictions for nine CYP isozymes.J Chem Inf Model 2012, 52(6):1637–59. [http://www.ncbi.nlm.nih.gov/pubmed/22524152]
16. Zaretzki J, Matlock M, Swamidass SJ: XenoSite: accurately predictingCYP-mediated sites of metabolism with neural networks. J Chem InfModel 2013, 53(12):3373–83. [http://www.ncbi.nlm.nih.gov/pubmed/24224933]
17. Daylight Chemical Information Systems, Inc. Aliso Viejo, CA. [http://www.daylight.com/dayhtml/doc/theory/theory.finger.html]
18. Hasegawa K, Koyama M, Funatsu K: Quantitative prediction ofregioselectivity toward cytochrome P450/3A4 using machinelearning approaches.Mol Inform 2010, 29(3):243–249. [http://doi.wiley.com/10.1002/minf.200900086]
19. Olsen L, Rydberg P, Rod TH, Ryde U: Prediction of activation energiesfor hydrogen abstraction by cytochrome P450. J Med Chem 2006,49(22):6489–6499. [http://pubs.acs.org/doi/abs/10.1021/jm060551l]
20. Rydberg P, Ryde U, Olsen L: Prediction of activation energies foraromatic oxidation by cytochrome P450. J Phys Chem A 2008,112(50):13058–65. [http://www.ncbi.nlm.nih.gov/pubmed/18986131]
21. Molecular Operating Environment (MOE), 2012.10. ChemicalComputing Group Inc., 1010 Sherbooke St. West, Suite 910, Montreal, QC,Canada, H3A 2R7, 2012. [https://www.chemcomp.com/MOE-Molecular_Operating_Environment.htm]
22. Mu F, Unkefer CJ, Unkefer PJ, Hlavacek WS: Prediction of metabolicreactions based on atomic andmolecular properties ofsmall-molecule compounds. Bioinformatics (Oxford, England) 2011,27(11):1537–45. [http://bioinformatics.oxfordjournals.org/content/27/11/1537.short]
23. Kanehisa M, Goto S, Sato Y, Furumichi M, Tanabe M: KEGG forintegration and interpretation of large-scale molecular data sets.Nucleic Acids Res 2012, 40(Database issue):D109–14. [http://nar.oxfordjournals.org/content/40/D1/D109.short]
24. Kirchmair J, Williamson MJ, Afzal AM, Tyzack JD, Choy APK, Howlett A,Rydberg P, Glen RC: FAst MEtabolizer (FAME): A rapid and accuratepredictor of sites of metabolism in multiple species by endogenousenzymes. J Chem Inf Model 2013, 53(11):2896–907. [http://www.ncbi.nlm.nih.gov/pubmed/24219364]
25. Steinbeck C, Hoppe C, Kuhn S, Floris M, Guha R, Willighagen E: Recentdevelopments of the chemistry development kit (CDK) - anopen-source Java library for Chemo- and Bioinformatics. Curr PharmDes 2006, 12(17):2111–2120. [http://www.ingentaconnect.com/content/ben/cpd/2006/00000012/00000017/art00005]
26. Rudik AV, Dmitriev A, Lagunin AA, Filimonov D, Poroikov VV:Metabolismsite prediction based on xenobiotic structural formulae and PASSprediction algorithm. J Chem Inf Model 2014:140113114718001. [http://pubs.acs.org/doi/abs/10.1021/ci400472j]

Tyzack et al. Journal of Cheminformatics 2014, 6:29 Page 14 of 14http://www.jcheminf.com/content/6/1/29
27. Xing L, Glen R: Novel Methods for the Prediction of logP, pKa, andlogD. J Chem Inf Model 2002, 42(4):796–805. [http://pubs.acs.org/cgi-bin/doilookup/?10.1021/ci010315d]
28. Xing L, Glen RC, Clark RD: Predicting pK(a) by molecular treestructured fingerprints and PLS. J Chem Inf Comput Sci 2003,43(3):870–879. [http://www.ncbi.nlm.nih.gov/pubmed/12767145]
29. Asanovic K, Wawrzynek J, Wessel D, Yelick K, Bodik R, Demmel J, KeavenyT, Keutzer K, Kubiatowicz J, Morgan N, Patterson D, Sen K: A view of theparallel computing landscape. Commun ACM 2009, 52(10):56.[http://dl.acm.org/citation.cfm?id=1562783]
30. Catanzaro B, Sundaram N, Keutzer K: Fast support vector machinetraining and classification on graphics processors. In Proceedings ofthe 25th international conference onMachine learning - ICML ’08. New York,USA: ACM Press; 2008:104–111. [http://dl.acm.org/citation.cfm?id=1390170]
31. Li Q, Salman R, Test E, Strack R, Kecman V: GPUSVM: a comprehensiveCUDA based support vector machine package. Cent Eur J Comput Sci2011, 1(4):387–405. [http://www.springerlink.com/index/10.2478/s13537-011-0028-7]
32. Herrero-Lopez S, Williams JR, Sanchez A: Parallel multiclassclassification using SVMs on GPUs. In Proceedings of the 3rdWorkshopon General-Purpose Computation on Graphics Processing Units - GPGPU ’10.New York, USA: ACM Press; 2010:2.
33. Oh KS, Jung K: GPU implementation of neural networks. PatternRecognit 2004, 37(6):1311–1314. [http://www.sciencedirect.com/science/article/pii/S0031320304000524]
34. Jian SLCWYLL: CUKNN: A parallel implementation of K-nearestneighbor on CUDA-enabled GPU. In 2009 IEEE Youth Conference onInformation, Computing and Telecommunication. New York: IEEE;2009:415–418.
35. Bernabé S, Plaza A, Reddy Marpu P, Atli Benediktsson J: A new paralleltool for classification of remotely sensed imagery. Comput Geosci2012, 46:208–218. [http://www.sciencedirect.com/science/article/pii/S009830041100433X]
36. O’Boyle NM, Banck M, James CA, Morley C, Vandermeersch T, HutchisonGR: Open Babel: an open chemical toolbox. J Cheminformatics 2011,3:33. [http://www.jcheminf.com/content/3/1/33]
37. SYBYL Molecular Modeling Software: Tripos Associates Inc., St Louis,MO, USA. [http://www.certara.com]
38. Matthews B: Comparison of the predicted and observed secondarystructure of T4 phage lysozyme. Biochimica et Biophysica Acta (BBA) -Protein Struct 1975, 405(2):442–451. [http://www.sciencedirect.com/science/article/pii/0005279575901099]
39. NVIDIA Nsight. NVIDIA, Santa Clara, CA, USA. [https://developer.nvidia.com/cuda-toolkit]
40. Mussa HY, Mitchell JBO, Glen RC: Full “Laplacianised” posterior naiveBayesian algorithm. J Cheminformatics 2013, 5(1):37–43.
41. Duda RO, Hart PE: Pattern Classification and Scene Analysis. 1st edition.New York, NY: John Wiley and Sons Ltd; 1973.
42. Webb AR: Statistical Pattern Recognition. 2nd edition. New York:Wiley–Blackwell; 2002.
43. Young T, Calvert TW: Classification, Estimation and Pattern Recognition.New York: Elsevier; 1974.
44. Ripley BD: Pattern Recognition and Neural Networks. Cambridge, UK:Cambridge University Press; 1996.
45. Hand DJ: Discrimination and classification. New York: Wiley; 1981.46. Bishop CM: Neural Networks for Pattern Recognition. 2nd edition. New York:
Oxford University Press; 1996.47. Ho TK: The random subspace method for constructing decision
forests. IEEE Tran Pat Anal Mach Intel 1998, 20(5):832–844.48. Breiman L: Random forests.Mach Learn 2001, 45:5–32.49. Oza KNC: Tumer: Input decimation ensembles: decorrelation
through dimensionality reduction. Proc Intl WorkshopMultiple ClassifierSyst 2096, 2001:238–247.
50. Skurichina, RPW M: Duin: Bagging, boosting and the randomsubspace method for linear classifiers. Pattern Anal Appl 2002,5(2):121–135.
51. Parzen E: On estimation of a probability density function andmode.Annal Math Stat 1962, 33(3):1065–1076.
52. Jacob L, Vert JP: Protein-ligand interaction prediction: an improvedchemogenomics approach. Bioinformatics (Oxford, England) 2008,
24(19):2149–56. [http://bioinformatics.oxfordjournals.org/content/24/19/2149.short]
53. Mussa HY, Tyzack JD, Glen RC: Note on the Rademacher-Walshpolynomial basis functions. J Math Res 2013, 5:114–121. [http://www.ccsenet.org/journal/index.php/jmr/article/view/24995]
doi:10.1186/1758-2946-6-29Cite this article as: Tyzack et al.: Cytochrome P450 site of metabolismprediction from 2D topological fingerprints using GPU acceleratedprobabilistic classifiers. Journal of Cheminformatics 2014 6:29.
Open access provides opportunities to our colleagues in other parts of the globe, by allowing
anyone to view the content free of charge.
Publish with ChemistryCentral and everyscientist can read your work free of charge
W. Jeffery Hurst, The Hershey Company.
available free of charge to the entire scientific communitypeer reviewed and published immediately upon acceptancecited in PubMed and archived on PubMed Centralyours you keep the copyright
Submit your manuscript here:http://www.chemistrycentral.com/manuscript/