Cysteine Transport through Excitatory Amino Acid ...
12
Cysteine Transport through Excitatory Amino Acid Transporter 3 (EAAT3) Spencer D. Watts 1 , Delany Torres-Salazar 2 , Christopher B. Divito 1 , Susan G. Amara 1,2 * 1 Center for Neuroscience, Department of Neurobiology, University of Pittsburgh, Pittsburgh, Pennsylvania, United States of America, 2 Laboratory of Cellular and Molecular Neurobiology, National Institute of Mental Health, National Institutes of Health, Bethesda, Maryland, United States of America Abstract Excitatory amino acid transporters (EAATs) limit glutamatergic signaling and maintain extracellular glutamate concentrations below neurotoxic levels. Of the five known EAAT isoforms (EAATs 1–5), only the neuronal isoform, EAAT3 (EAAC1), can efficiently transport the uncharged amino acid L-cysteine. EAAT3-mediated cysteine transport has been proposed to be a primary mechanism used by neurons to obtain cysteine for the synthesis of glutathione, a key molecule in preventing oxidative stress and neuronal toxicity. The molecular mechanisms underlying the selective transport of cysteine by EAAT3 have not been elucidated. Here we propose that the transport of cysteine through EAAT3 requires formation of the thiolate form of cysteine in the binding site. Using Xenopus oocytes and HEK293 cells expressing EAAT2 and EAAT3, we assessed the transport kinetics of different substrates and measured transporter-associated currents electrophysiologically. Our results show that L-selenocysteine, a cysteine analog that forms a negatively-charged selenolate ion at physiological pH, is efficiently transported by EAATs 1–3 and has a much higher apparent affinity for transport when compared to cysteine. Using a membrane tethered GFP variant to monitor intracellular pH changes associated with transport activity, we observed that transport of either L-glutamate or L-selenocysteine by EAAT3 decreased intracellular pH, whereas transport of cysteine resulted in cytoplasmic alkalinization. No change in pH was observed when cysteine was applied to cells expressing EAAT2, which displays negligible transport of cysteine. Under conditions that favor release of intracellular substrates through EAAT3 we observed release of labeled intracellular glutamate but did not detect cysteine release. Our results support a model whereby cysteine transport through EAAT3 is facilitated through cysteine de-protonation and that once inside, the thiolate is rapidly re-protonated. Moreover, these findings suggest that cysteine transport is predominantly unidirectional and that reverse transport does not contribute to depletion of intracellular cysteine pools. Citation: Watts SD, Torres-Salazar D, Divito CB, Amara SG (2014) Cysteine Transport through Excitatory Amino Acid Transporter 3 (EAAT3). PLoS ONE 9(10): e109245. doi:10.1371/journal.pone.0109245 Editor: Dmitri Boudko, Rosalind Franklin University, United States of America Received July 3, 2014; Accepted September 8, 2014; Published October 2, 2014 This is an open-access article, free of all copyright, and may be freely reproduced, distributed, transmitted, modified, built upon, or otherwise used by anyone for any lawful purpose. The work is made available under the Creative Commons CC0 public domain dedication. Data Availability: The authors confirm that all data underlying the findings are fully available without restriction. All relevant data are within the paper. Funding: The work was supported by National Institutes of Health Grant MH080726 to SGA and the American Heart Association postdoctoral fellowship (#09POST2010115) to DT-S. The funders had no role in study design, data collection and analysis, decision to publish, or preparation of the manuscript. Competing Interests: The authors have declared that no competing interests exist. * Email: [email protected] Introduction Glutamate is the major excitatory neurotransmitter in the mammalian central nervous system (CNS). Following neurotrans- mitter release during synaptic transmission, glutamate is cleared perisynaptically by members of the excitatory amino acid transporter (EAAT) family. The EAAT family is composed of five members (EAAT 1–5), with EAAT1 and EAAT2 expressed primarily in glia, while EAAT3, EAAT4 and EAAT5 are mainly expressed in neurons of the CNS [1–3]. EAAT dysfunction results in elevated levels of glutamate, which have been associated with several neurological conditions such as ischemia, amyotrophic lateral sclerosis, Alzheimer’s disease, and epilepsy [1,2,4,5]. Glutamate uptake proceeds by a secondary active transport mechanism which has been modeled as a multi-step cycle [6,7]. The process is initiated by binding of co-transported ions (3 Na + ,1 H + ) and substrate to the outwardly-oriented carrier, followed by translocation and release into the cytoplasm. Binding of an intracellular K + ion drives the reorientation of the substrate binding site to an outward-facing conformation [7,8]. Glutamate transport by EAATs has been shown to result in intracellular acidification associated with proton cotransport [7,9–11]. Uptake of substrates by EAATs has also been shown to facilitate release of internal substrates [12–16], with substrate being translocated into the cell and exchanged for internal substrates that are then carried out of the cell as a result of reversibility of the translocation part of the transport cycle [15,16]. In addition to L-glutamate, other acidic molecules such as L- and D-aspartate, cysteic acid, and serine-O-sulfate have been found to be substrates for the EAATs, while neutral amino acids such as serine and alanine have very low affinity (.1 mM) for the transporters [3,17]. The specificity for high affinity binding and transport of acidic amino acids by EAATs involves a positively charged arginine residue, R447 in EAAT3, which is conserved across all EAATs [17]. In contrast, the neutral amino acid transporters (ASCT1 and ASCT2), which share sequence homol- ogy with the EAATs, transport the neutral amino acids serine, alanine and cysteine, and have the neutral residues threonine or cysteine respectively in the corresponding position [18,19]. Substitution of R447 by cysteine in EAAT3 converts the protein PLOS ONE | www.plosone.org 1 October 2014 | Volume 9 | Issue 10 | e109245
Transcript of Cysteine Transport through Excitatory Amino Acid ...
Cysteine Transport through Excitatory Amino AcidTransporter 3 (EAAT3)Spencer D. Watts1, Delany Torres-Salazar2, Christopher B. Divito1, Susan G. Amara1,2*
1Center for Neuroscience, Department of Neurobiology, University of Pittsburgh, Pittsburgh, Pennsylvania, United States of America, 2 Laboratory of Cellular and
Molecular Neurobiology, National Institute of Mental Health, National Institutes of Health, Bethesda, Maryland, United States of America
Abstract
Excitatory amino acid transporters (EAATs) limit glutamatergic signaling and maintain extracellular glutamateconcentrations below neurotoxic levels. Of the five known EAAT isoforms (EAATs 1–5), only the neuronal isoform, EAAT3(EAAC1), can efficiently transport the uncharged amino acid L-cysteine. EAAT3-mediated cysteine transport has beenproposed to be a primary mechanism used by neurons to obtain cysteine for the synthesis of glutathione, a key molecule inpreventing oxidative stress and neuronal toxicity. The molecular mechanisms underlying the selective transport of cysteineby EAAT3 have not been elucidated. Here we propose that the transport of cysteine through EAAT3 requires formation ofthe thiolate form of cysteine in the binding site. Using Xenopus oocytes and HEK293 cells expressing EAAT2 and EAAT3, weassessed the transport kinetics of different substrates and measured transporter-associated currents electrophysiologically.Our results show that L-selenocysteine, a cysteine analog that forms a negatively-charged selenolate ion at physiologicalpH, is efficiently transported by EAATs 1–3 and has a much higher apparent affinity for transport when compared tocysteine. Using a membrane tethered GFP variant to monitor intracellular pH changes associated with transport activity, weobserved that transport of either L-glutamate or L-selenocysteine by EAAT3 decreased intracellular pH, whereas transport ofcysteine resulted in cytoplasmic alkalinization. No change in pH was observed when cysteine was applied to cells expressingEAAT2, which displays negligible transport of cysteine. Under conditions that favor release of intracellular substratesthrough EAAT3 we observed release of labeled intracellular glutamate but did not detect cysteine release. Our resultssupport a model whereby cysteine transport through EAAT3 is facilitated through cysteine de-protonation and that onceinside, the thiolate is rapidly re-protonated. Moreover, these findings suggest that cysteine transport is predominantlyunidirectional and that reverse transport does not contribute to depletion of intracellular cysteine pools.
Citation: Watts SD, Torres-Salazar D, Divito CB, Amara SG (2014) Cysteine Transport through Excitatory Amino Acid Transporter 3 (EAAT3). PLoS ONE 9(10):e109245. doi:10.1371/journal.pone.0109245
Editor: Dmitri Boudko, Rosalind Franklin University, United States of America
Received July 3, 2014; Accepted September 8, 2014; Published October 2, 2014
This is an open-access article, free of all copyright, and may be freely reproduced, distributed, transmitted, modified, built upon, or otherwise used by anyone forany lawful purpose. The work is made available under the Creative Commons CC0 public domain dedication.
Data Availability: The authors confirm that all data underlying the findings are fully available without restriction. All relevant data are within the paper.
Funding: The work was supported by National Institutes of Health Grant MH080726 to SGA and the American Heart Association postdoctoral fellowship(#09POST2010115) to DT-S. The funders had no role in study design, data collection and analysis, decision to publish, or preparation of the manuscript.
Competing Interests: The authors have declared that no competing interests exist.
* Email: [email protected]
Introduction
Glutamate is the major excitatory neurotransmitter in the
mammalian central nervous system (CNS). Following neurotrans-
mitter release during synaptic transmission, glutamate is cleared
perisynaptically by members of the excitatory amino acid
transporter (EAAT) family. The EAAT family is composed of five
members (EAAT 1–5), with EAAT1 and EAAT2 expressed
primarily in glia, while EAAT3, EAAT4 and EAAT5 are mainly
expressed in neurons of the CNS [1–3]. EAAT dysfunction results
in elevated levels of glutamate, which have been associated with
several neurological conditions such as ischemia, amyotrophic
lateral sclerosis, Alzheimer’s disease, and epilepsy [1,2,4,5].
Glutamate uptake proceeds by a secondary active transport
mechanism which has been modeled as a multi-step cycle [6,7].
The process is initiated by binding of co-transported ions (3 Na+, 1
H+) and substrate to the outwardly-oriented carrier, followed by
translocation and release into the cytoplasm. Binding of an
intracellular K+ ion drives the reorientation of the substrate
binding site to an outward-facing conformation [7,8]. Glutamate
transport by EAATs has been shown to result in intracellular
acidification associated with proton cotransport [7,9–11]. Uptake
of substrates by EAATs has also been shown to facilitate release of
internal substrates [12–16], with substrate being translocated into
the cell and exchanged for internal substrates that are then carried
out of the cell as a result of reversibility of the translocation part of
the transport cycle [15,16].
In addition to L-glutamate, other acidic molecules such as L-
and D-aspartate, cysteic acid, and serine-O-sulfate have been
found to be substrates for the EAATs, while neutral amino acids
such as serine and alanine have very low affinity (.1 mM) for the
transporters [3,17]. The specificity for high affinity binding and
transport of acidic amino acids by EAATs involves a positively
charged arginine residue, R447 in EAAT3, which is conserved
across all EAATs [17]. In contrast, the neutral amino acid
transporters (ASCT1 and ASCT2), which share sequence homol-
ogy with the EAATs, transport the neutral amino acids serine,
alanine and cysteine, and have the neutral residues threonine or
cysteine respectively in the corresponding position [18,19].
Substitution of R447 by cysteine in EAAT3 converts the protein
PLOS ONE | www.plosone.org 1 October 2014 | Volume 9 | Issue 10 | e109245

from an acidic amino acid transporter to one that transports
neutral amino acids [17].
Selenium is an essential nutrient required in trace amounts and
estimated to be specifically incorporated as selenocysteine in more
than 20 human proteins. Many of these proteins use selenocysteine
as an active site residue and are critical for maintenance of cellular
redox potential and repair of oxidative damage [20–22].
Selenocysteine is a primary source of selenium for the selenopho-
sphate required for tRNASec synthesis [23]. Selenocysteine is
structurally similar to cysteine (Figure 1) with substitution of
selenium for the sulfur of cysteine. A primary effect of this
substitution is a lower pKa (5.3) for selenocysteine, resulting in a
deprotonated and negatively charged side chain at physiological
pH, similar to glutamate, whereas cysteine (pKa= 8.4) is primarily
protonated. While it is clear that selenocysteine uptake into cells
occurs, no transport system has been identified.
EAAT3, which is selectively expressed on neurons in the CNS,
also transports L-cysteine with an approximately 10-fold higher
apparent affinity for transport (Km) and a much larger transport
rate than the other members of the family [13]. Maintaining
sufficient intracellular concentrations of cysteine is vital not only
for protein synthesis but also for maintenance of cellular redox
homeostasis as cysteine is the rate limiting component for the
synthesis of glutathione, a critical co-factor of the intracellular
antioxidant machinery. Cysteine transport by EAAT3 has been
implicated in playing a significant role in maintenance of the
intracellular redox potential [4]. Indeed, in EAAT3 deficient mice,
the dopaminergic neurons of the substantia nigra pars compacta, a
neuronal population highly susceptible to oxidative stress, show
decreased levels of neuronal glutathione, increased evidence for
oxidative stress and decreased neuronal survival during aging [24].
Treatment of these mice with the cysteine analogue N-acetylcys-
teine (NAC), which is taken up by cells in an EAAT3 independent
manner, rescues the phenotype supporting the idea that EAAT3
activity is important for cellular cysteine homeostasis [4,25].
Here we examined cysteine transport through EAAT3. Based
on the structural similarities of selenocysteine with cysteine and
charge similarities between selenocysteine and glutamate, we
hypothesized that selenocysteine uptake could occur through
transport by the EAATs and provide a useful tool for
understanding cysteine transport by EAATs. We demonstrate
that selenocysteine can be readily transported by the human
glutamate transporter isoforms, EAAT1, EAAT2 and EAAT3,
and validate that these carriers transport selenocysteine with
apparent affinities and transport capacities comparable to
glutamate. By comparing the transport characteristics of seleno-
cysteine with cysteine and monitoring transport using a pH-
biosensor, our results suggest a mechanism in which EAAT3
facilitates cysteine transport through cysteine de-protonation.
Moreover, our results indicate that the mechanism favors
inwardly-directed transport of cysteine and does not contribute
to the depletion of intracellular cysteine pools.
Materials and Methods
mEGFPpH Construct PreparationmEGFPpH was constructed in our laboratory from EGFP using
site-directed mutagenesis and addition of an N-terminal palmi-
toylation sequence as follows. First, EGFP-H148D [26] (EGFPpH)
was generated in the mammalian expression plasmid pEGFP-N3
(Clontech) by a single nucleotide substitution using site directed
mutagenesis with the following primers: (sense) CTGGAGTA-
CAACTACAACAGCGACAACGTCTATATCATGGCCGAC
and (antisense) GTCGGCCATGATATA-
GACGTTGTCGCTGTTGTAGTTGTACTCCAG [C -. G
base change (bold) to create the CAC -. GAC codon change
(underlined)]. Mutagenesis was verified by DNA sequencing of the
EGFPpH reading frame in plasmid pEGFPpH. Addition of the
palmitoylation sequence to EGFPpH to provide advantages of
membrane targeting [27] was accomplished as follows. Plasmid
pEGFPpH was digested at the KpnI and BamHI sites immediately
59 of the ATG start codon for EGFPpH. Two complementary
oligos (sense: cGCCGCCACCATGCTGTGCTGTATGAGAA-
GAACCAAACAGGTTGAAAAGAATGATGAGGACCAAAA-
GATCg; antisense: gatccGATCTTTTGGTCCTCAT-
CATTCTTTTCAACCTGTTTGGTTCTTCTCATACAGCA-
CAGCATCAGCATGGTGGCGGCggtac; small letters denote
restriction site nucleotides) including Kozak site (GCCACCAC-
CATGC) [28] and coding for the palmitoylation signal peptide
from neuromodulin (GAP-43), MLCCMRRTKQVEKN-
DEDQKI [27,29] were 59-phosphorylated then hybridized to
form a double stranded insert and subsequently ligated into the cut
plasmid. Transformants were screened by colony PCR for
insertion of the palmitoylation sequence with the following
Figure 1. Structures of EAAT substrates and non-substrates.Diagrams of relevant amino acids and the associated side chain pKas.Amino acids are depicted in their primary charge state at physiologicalpH. Abbreviations are: L-Asp, L-aspartate; L-Glu, L-glutamate; L-Sec, L-selenocysteine; L-Cys, L-cysteine; L-Ser, L-serine.doi:10.1371/journal.pone.0109245.g001
EAAT3 Cysteine Transport
PLOS ONE | www.plosone.org 2 October 2014 | Volume 9 | Issue 10 | e109245
primers: forward, ATGCTGTGCTGTATGAGAAGA (palmitoy-
lation tag); reverse, TTACTTGTACAGCTCGTCCAT (39-
EGFP sequence). Positive colonies were subjected to DNA
sequencing of the entire mEGFPpH reading frame to verify
proper insertion and H148D mutation. A single positive transfor-
mant was expanded for DNA preparation (GenElute HP, Sigma-
Aldrich) for HEK293 cell transfection and protein expression.
Cell Culture and Protein ExpressionHEK293 cells were cultured at 37uC in a humidified 5% CO2
incubator in DMEM (Lifetech, Gibco BRL, Invitrogen) supple-
mented with 10% FBS, penicillin (100 U/mL) and streptomycin
(100 mg/mL). For characterization of the pH response of
mEGFPpH, 16105 cells/mL were batch transfected in 1 mL of
Opti-Mem (LifeTechnologies) using 6 mL Lipofectamine 2000
(Invitrogen) and 1 mg pmEGFPpH with 26104 cells plated on
poly-L-Lysine coated 15 mm coverslips. Cells were incubated as
above for two days prior to NH4Cl experiments.
For imaging experiments monitoring the intracellular acidifica-
tion associated with glutamate transport, 16105 cells/mL were
batch transfected in 1 mL of Opti-Mem (LifeTechnologies) using
6 mL Lipofectamine 2000 (Invitrogen) and 0.5 mg pCMV-EAAT3
[3] and 0.5 mg pmEGFPpH) with 26104 cells plated on poly-L-
Lysine coated 15 mm coverslips in 12 well plates with 1 mL
DMEM culture media as above. Cells were incubated at 37uC in a
humidified 5% CO2 for two days prior to imaging experiments.
For radiolabeled transport experiments, 26106 cells were
transfected in 1 mL of Opti-Mem (Life Technologies) using 6
mL of Lipofectamine 2000 (Invitrogen) with 1 mg pCMV-EAAT2
or pCMV-EAAT3 DNA and plated at 56104 cells/well in 24 well
Costar (Corning) plates with 0.5 mL DMEM culture media
prepared as above. Following transfection and plating, cells were
cultured 2–3 days prior to [3H]-L-Glutamate transport experi-
ments.
mEGFPpH Fluorescence Imaging in HEK293 cellsCells expressing mEGFPpH were imaged with a Zeiss Axiovert
135T inverted microscope with a 40X NeoFluar oil immersion
objective (NA1.3). A Lambda DG4 (Sutter Instrument Co.)
equipped with a xenon arc lamp was used for high-speed
excitation wavelength switching. Images were collected using
either a Quantix (Roper Scientific, Tucson, AZ) or an Orca ER
(Hammamatsu Co.) cooled CCD. For pH imaging experiments,
the fluorescence filters (Omega Optical) were: excitation 405620
and 48567.5; dichroic 400-480-585DLRP; emission 510611.5.
Software control and data acquisition were accomplished using
Axon Imaging Workbench (INDEC Biosystems) or OpenLab
acquisition software (Improvision, Perkin Elmer). Cells were
incubated at room temperature with continuous perfusion using
standard buffer containing (in mM): 146 NaCl, 5 KCl, 5 HEPES,
2.5 CaCl2 and 1.2 MgCl2 at pH 7.35 with additions (substrates
etc.) as indicated in figure legends. Acquisition exposure times
were identical for both 405 nm and 485 nm excitation wave-
lengths adjusted so that the 510 emission was not saturated for
either excitation wavelength. Prior to perfusion with buffers
containing substrates, cells were perfused in standard buffer to
achieve a stable base line. Fluorescence was reported as the ratio of
fluorescence at 510 nm by excitation with 485 and 405 nm
wavelengths (F485/F405).
For NH4Cl experiments, HEK293 cells expressing mEGFPpH
were perfused with buffer to establish a stable fluorescence
baseline, followed by perfusion with buffer containing 50 mM
NH4Cl substituted for 50 mM NaCl, followed by NH4Cl washout
with standard buffer as indicated. Calibration of fluorescence ratio
changes with intracellular pH was accomplished following the
NH4Cl experiments, by perfusion of the cells with standard buffer
containing 10 mM each of nigericin and valinomycin at the
following pH: 6.5, 7.35, 7.5, 7.75, 8, 8.5. Perfusion at each pH was
continued till a stable fluorescence ratio was achieved, upon which
perfusion with the next higher pH buffer was begun.
Expression of Constructs in Xenopus oocytesmRNA from linearized pOTV-EAAT1, pOTV-EAAT2 and
pOTV-EAAT3 was generated as previously described [30] and
resuspended in RNAase-free water and used for oocytes injections.
Xenopus oocytes where injected with 50 nl of mRNA and
incubated at 18uC in 96 mM NaCl, 2 mM KCl, 1.8 mM CaCl2,
1.0 mM MgCl2, 5 mM HEPES, pH 7.4 (ND96) supplemented
with 2.5 mM Sodium Pyruvate and Gentamicyn for 2 to 3 days
prior to using in electrophysiological recordings and radio-labeled
transport experiments.
Electrophysiological Recording in Xenopus oocytesGlutamate transporter-associated currents were recorded by
two-electrode voltage clamp using a GeneClamp 500B (Molecular
Devices, Sunnyvale, CA, USA). Oocytes were held at 260 mV,
and currents elicited by 200 ms voltage steps between 2120 mV
and +60 mV were filtered at 2 kHz (23dB) and digitalized with a
sampling rate of 10 kHz using a Digidata AD/DA converter
(Molecular Devices, Sunnyvale, CA, USA). Borosilicate pipets
where filled with 3 M KCl and typical resistances where 0.2 to 1
MV. Transport currents were determined at 260 mV in a
gluconate-based ND96 solution. In order to dialyze internal
chloride, oocytes were incubated 12 to 24 hours in the gluconate
solution. Anion currents were determined at positive potentials (+60 mV) after exchanging the external solution to NO3-based
ND96 (replacement of 96 mM NaCl with 96 mM NaNO3)
solution in the absence or in the presence of 1 mM external
substrates. In experiments using cysteine as a substrate, all
solutions contained 2 mM dithiothreitol (DTT). Data were
analyzed with a combination of pClamp 9.2 (Axon Instrument)
and Sigma Plot (Jandel Scientific, San Rafael, CA, USA). Whole
cell current amplitudes are shown without any subtraction
protocol. Current-voltage relationships were constructed by
plotting the isochronal current 6 ms after the voltage step versus
the membrane potential. All data are given as the mean 6
standard deviation of the mean (SDM). For evaluation the
statistical relevance, the Student’s t-Test was used with an a of
0.05.
Substrate inhibition of [3H]-L-glutamate uptake inHEK293 cellsFor cysteine and selenocysteine inhibition of glutamate trans-
port, HEK293 cells expressing EAAT3 or EAAT2 were incubated
in perfusion buffer with 20 nM [3H]-L-glutamate with non-
radiolabeled L-glutamate added for a final concentration of
30 mM glutamate in the presence of varying concentrations of
cysteine or selenocysteine as indicated. Transport was allowed to
proceed for 10 min and was terminated by 3 washes with cold
perfusion buffer. Cells were lysed with 1% SDS/0.1N NaOH and
radioactivity determined by scintillation counting. Data analysis
was performed using Graphpad Prism (Graphpad Software Inc.).
Cysteine transport and glutamate inhibition of cysteinetransport in Xenopus oocytesCysteine transport was measured for 10 min in Xenopus oocytes
with serial dilution of a mixture of 10 mM cysteine and 20 nM
EAAT3 Cysteine Transport
PLOS ONE | www.plosone.org 3 October 2014 | Volume 9 | Issue 10 | e109245
[35S]-L-cysteine in ND96. Transport was terminated by three
washes of ND96, after which accumulated radiolabel was
quantitated by liquid scintillation counting. For glutamate
inhibition of cysteine transport, oocytes were incubated with a
fixed concentration of [35S]-L-cysteine and increasing concentra-
tions of glutamate in ND96 at pH 6.9 or pH 8.5. Transport was
terminated by three washes in ND96 followed by liquid
scintillation counting. The percentage of thiolate to thiol cysteine
was calculated using the Henderson–Hasselbalch equation and a
cysteine sulfhydryl (R-SH) pKa of 8.3.
Glutamate uptake and hetero-exchange assays inXenopus oocytesFor experiments in Xenopus oocytes, oocytes co-expressing
EAAT3 and ASCT1 were preincubated with either 20 nM [35S]-
L-cysteine for a final concentration of 300 mM cysteine or 20 nM
[3H]-L-glutamate for a final concentration of 30 mM glutamate
incubated for 20 min. Oocytes were washed 3 times in ND96
buffer followed by incubation for 10 min with non-radiolabeled
substrates as indicated. The supernatant was removed and
collected for scintillation counting, while the oocytes were lysed
in 1% sodium dodecylsulfate (SDS). The oocytes lysate and
supernatant were counted separately by liquid scintillation
counting to determine both retained and released radioactivity
respectively. Percent of released radioactivity was determined as a
function of the released/(retained + released).
Results
Selenocysteine induces transport currents in EAATexpressing oocytesSelenocysteine is structurally similar to cysteine but at physio-
logical pH the selenium side chain is deprotonated (pKa= 5.3) and
negatively charged similar to glutamate and aspartate (Figure 1).
Based on these characteristics we predicted that selenocysteine
would be a substrate for the glutamate transporters. To test this,
we first measured selenocysteine transport currents using two-
electrode voltage clamp in Xenopus oocytes expressing EAAT3.
Perfusion of EAAT3 expressing oocytes with 1 mM selenocysteine
induced an inward transport current of 20 nA (Figure 2A, top).
Perfusion with increasing concentrations of selenocysteine resulted
in a corresponding increase in the transport current amplitude.
Normalizing the current amplitude to the maximal selenocysteine
induced transport current and plotting as a function of the applied
selenocysteine concentration (Figure 2A, bottom) exhibited a
concentration dependence well described by the Michaelis-
Menten equation with an apparent affinity of 7.1460.3 mM(n=6). This was not observed in uninjected oocytes (data not
shown).
As a further characterization of selenocysteine transport, we
measured the current obtained by perfusion of 1 mM selenocys-
teine and cysteine relative to the maximal current obtained upon
application of a saturating 1 mM glutamate in Xenopus oocytes(Figure 2B). We found that selenocysteine induced currents in
oocytes expressing EAATs were similar to those observed for
glutamate, with current amplitudes of 89.566.7% (n= 5),
72.1617% (n= 7) and 95.6614% (n= 7) of the glutamate
transport current for EAAT1, EAAT2 and EAAT3 respectively
(Figure 2B). In contrast to selenocysteine, the currents measured
by perfusion of 1 mM cysteine in oocytes expressing EAAT1 or
EAAT2 were only 3361.5% (n= 3) and 7.064.2% (n= 5) of that
for 1 mM glutamate respectively, consistent with the reported
poor cysteine transport properties of these carriers [13]. In
comparison, cysteine induced a robust transport current in
EAAT3 expressing oocytes, with a current amplitude that was
86614% (n= 5) of that produced by 1 mM glutamate (Figure 2B).
These results indicate that at physiological pH selenocysteine is a
substrate not only for EAAT3, but for EAAT 1 and 2 as well.
EAAT3 has an uncoupled anion conductance which is activated
by Na and glutamate [31,32]. To further characterize the
interaction of selenocysteine with EAAT3, using two electrode
voltage-clamp we compared the current-voltage relationship for
the anion current gated by 1 mM selenocysteine and 1 mM
glutamate in EAAT3 expressing oocytes (Figure 2C). After
perfusion with a NO3-based solution in the absence of substrate,
at +60 mV we obtained a macroscopic current amplitude of
0.560.09 mA (black open circles, n = 4). Application of 1 mM
glutamate to the same cells elicited a 3-fold larger current with an
amplitude of 1.7860.4 mA (red open circles, n = 4), as previously
observed [33]. Upon application of 1 mM selenocysteine, we
obtained a very similar current-voltage relationship with a current
amplitude at +60 mV of 1.7260.4 mA (blue open circles, n = 4)
(Figure 2C). Current amplitudes from control oocytes in the
presence of substrate were 0.260.001 mA (solid line, n= 5). These
results demonstrate that selenocysteine activates the EAAT3-
mediated anion conductance in a fashion similar to glutamate.
Inhibition of glutamate transport by Selenocysteine andcysteineSubstrates for the EAATs can act as competitive inhibitors of
glutamate uptake. Using a fixed concentration of radiolabeled
glutamate and varying the substrate-inhibitor concentration, an
IC50 can be calculated providing a measure of the relative binding
affinity of the substrate for the transporter. Using this approach,
we calculated the selenocysteine and cysteine IC50s for inhibition
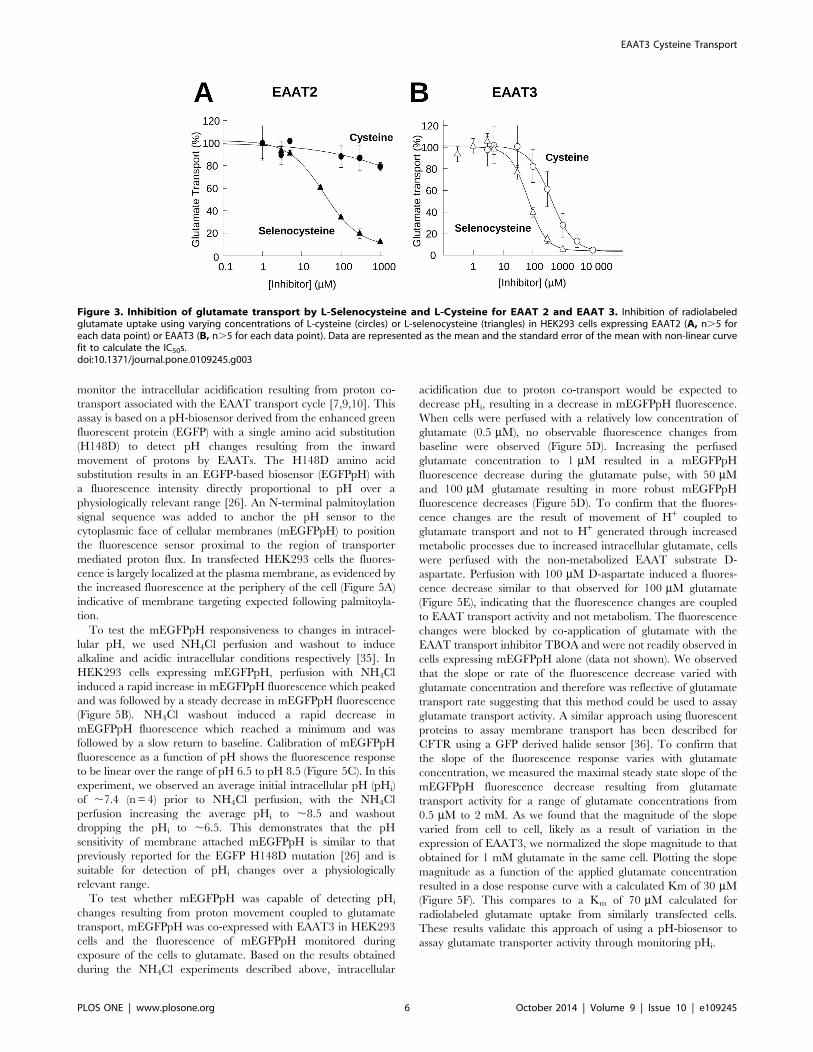
of radiolabeled glutamate uptake. Incubation of EAAT2 express-
ing HEK293 cells with varying concentrations of selenocysteine
resulted in a dose dependent inhibition of glutamate transport,
with ,90% inhibition at 1 mM selenocysteine and a calculated
IC50 of 46612 mM (n= 3) (Figure 3A). The cysteine inhibition
curve of glutamate transport in EAAT2 expressing cells was
incomplete under these assay conditions, with only a 20%
inhibition at the maximum concentration of 1 mM cysteine
(Figure 3A).
For EAAT3 expressing cells, cysteine inhibition of glutamate
uptake was substantially greater than that observed for EAAT2
with 70% inhibition at 1 mM cysteine and an IC50 of 631650 mM(n= 3). The concentration dependence for selenocysteine inhibi-
tion of glutamate transport by EAAT3 expressing cells was shifted
to the left when compared to that of cysteine with .90%
inhibition at 1 mM selenocysteine and an IC50 of 71610 mM(n= 3), approximately 10-fold lower than for cysteine (Figure 3B).
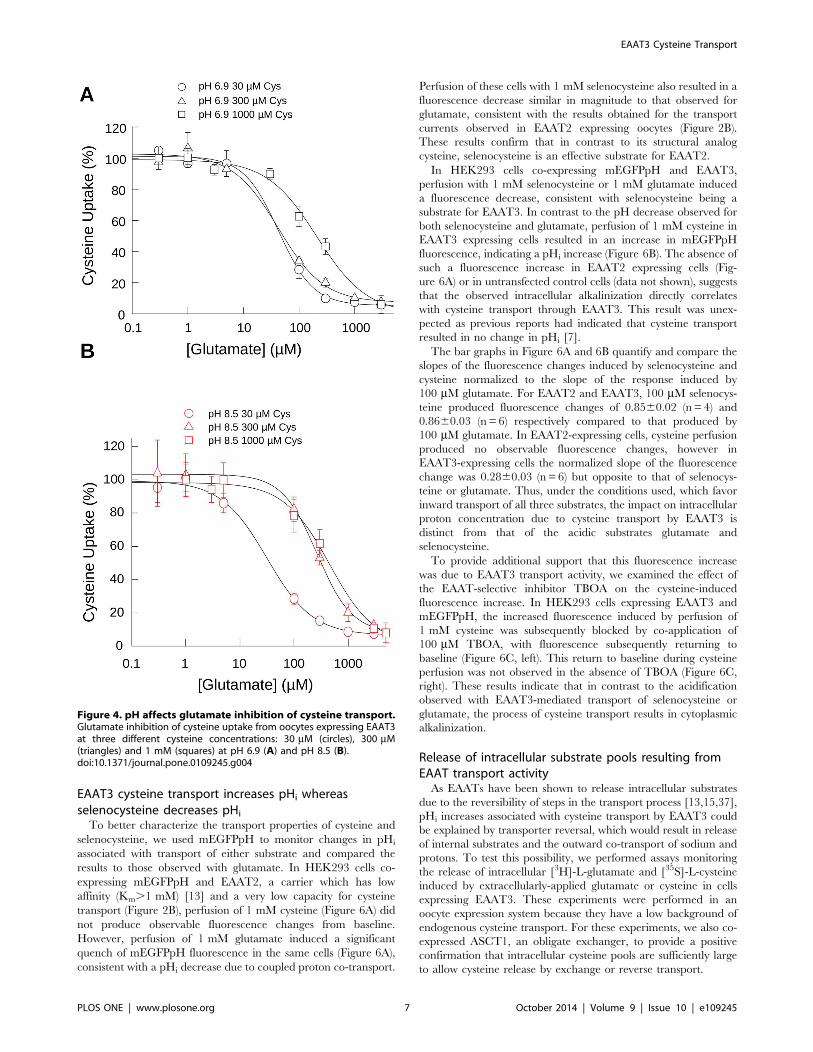
Effect of pH on glutamate inhibition of cysteine transportSelenocysteine and cysteine differ in side chain charge at
physiological pH with selenocysteine existing primarily in a
deprotonated (.99%) state at physiological pH compared to
cysteine which is predominantly protonated (,90%). For cysteine,
the thiolate (R-S2) form increases to ,61% at pH 8.5. As
glutamate has been reported to be a potent inhibitor of cysteine
transport [34] at physiological pH, we hypothesized that
increasing the thiolate to thiol ratio would alter the inhibitory
properties of glutamate toward [35S]-cysteine uptake. To test this,
we assayed [35S]-cysteine uptake at three cysteine concentrations
for a range of glutamate concentrations in buffers of pH 6.9
(Figure 4A) and pH 8.5 (Figure 4B), where cysteine is ,3.8% and
61% thiolate, respectively. At pH 6.9, the curves obtained for
glutamate inhibition of 30 mM and 300 mM cysteine were similar,
EAAT3 Cysteine Transport
PLOS ONE | www.plosone.org 4 October 2014 | Volume 9 | Issue 10 | e109245

with ,75% inhibition of cysteine uptake for both at 100 mMglutamate with similar IC50s for glutamate of 42.869.8 mM (n= 3)
and 42.5612.1 mM (n= 3) respectively. At the 1 mM cysteine
concentration, the glutamate inhibition curve was shifted to the
right, with 100 mM glutamate inhibiting cysteine transport by only
40% and an approximate 5 fold increase in the IC50 to
210.3658.8 mM (n= 3) (Figure 4A).
When we performed the assay at pH 8.5, where the thiolate
represents ,61% of the total cysteine, there was minimal
difference of the curve obtained for 30 mM cysteine compared
to that obtained for the same concentration assayed at pH 6.9,
with a calculated IC50 of 31.567.13 mM (n= 3) (Figure 4B).
However, at 300 mM cysteine, the glutamate inhibition curve was
shifted to the right with a calculated IC50 of 267.1612.1 mM(n= 3), a five-fold increase compared to the same cysteine
concentration assayed at pH 6.9. For the 1 mM cysteine
concentration at pH 8.5, the glutamate inhibitory curve did not
shift substantially compared to that obtained at pH 6.9, with a
calculated IC50 of 455.56127.8 mM (n=3). These data demon-
strate that EAATs preferentially interact and translocate the
thiolate form of cysteine, a likely necessity for satisfying
interactions with TM8 residue R447 [17].
Glutamate transport activity monitored by pHAs an additional method to compare selenocysteine and cysteine
transport by EAATs, we made use of a fluorescence assay to
Figure 2. Selenocysteine is transported by EAATs 1–3. A) Representative recordings (upper panel) and averaged normalized transportcurrents (lower panel) measured at 260 mV as a function of the L-selenocysteine concentration in EAAT3 expressing oocytes (n = 6). Data arepresented as the mean and Std. dev. of the mean and fit with the Hill equation to estimate the Km for transport. B) Comparison of the maximaltransport currents at260 mV for L-selenocysteine and L-cysteine by EAAT1 (n.3), EAAT2 (n.5) or EAAT3 (n.10) normalized to the maximal currentsinduced by L-glutamate measured in the same oocyte. C) Comparison of averaged current-voltage relationships recorded from oocytes expressingEAAT3 for both 1 mM glutamate (red symbols, n = 4) and 1 mM selenocysteine (blue symbols, n = 4). Black symbols indicate the averaged currentvoltage relationship of the same cells in the absence of substrate (n = 4) and the solid line represents the average of water injected oocytes in thepresence of 1 mM glutamate (n = 5).doi:10.1371/journal.pone.0109245.g002
EAAT3 Cysteine Transport
PLOS ONE | www.plosone.org 5 October 2014 | Volume 9 | Issue 10 | e109245
monitor the intracellular acidification resulting from proton co-
transport associated with the EAAT transport cycle [7,9,10]. This
assay is based on a pH-biosensor derived from the enhanced green
fluorescent protein (EGFP) with a single amino acid substitution
(H148D) to detect pH changes resulting from the inward
movement of protons by EAATs. The H148D amino acid
substitution results in an EGFP-based biosensor (EGFPpH) with
a fluorescence intensity directly proportional to pH over a
physiologically relevant range [26]. An N-terminal palmitoylation
signal sequence was added to anchor the pH sensor to the
cytoplasmic face of cellular membranes (mEGFPpH) to position
the fluorescence sensor proximal to the region of transporter
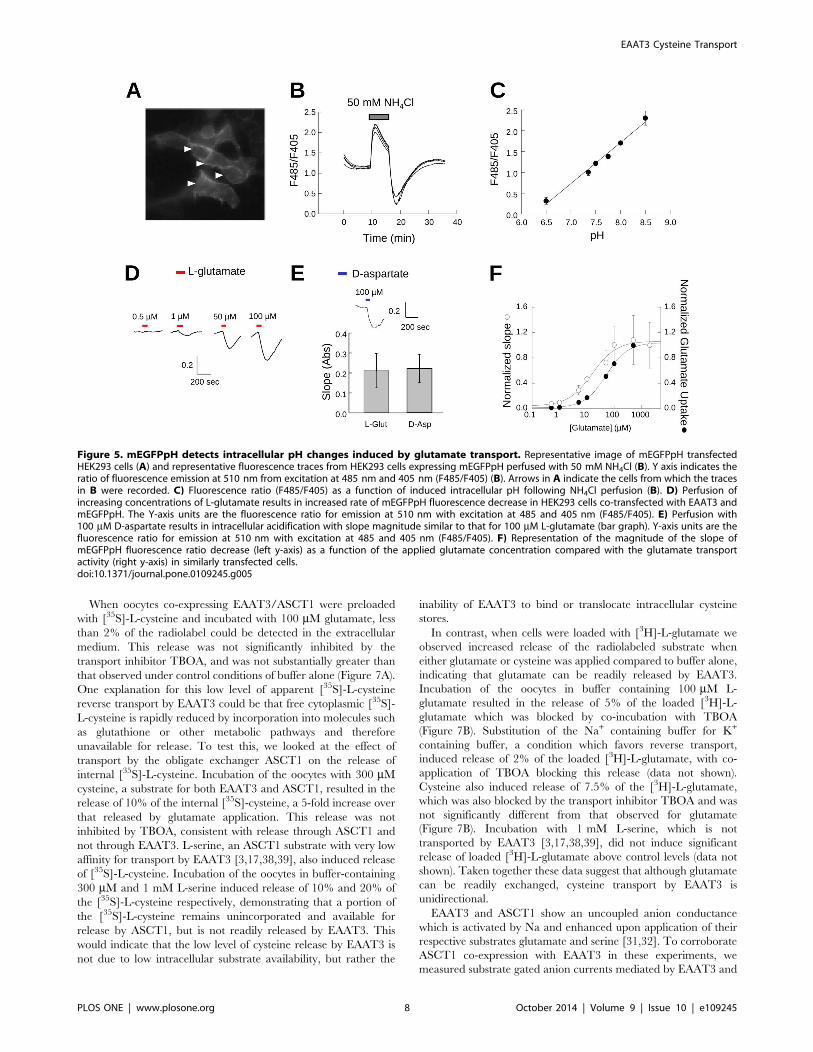
mediated proton flux. In transfected HEK293 cells the fluores-
cence is largely localized at the plasma membrane, as evidenced by
the increased fluorescence at the periphery of the cell (Figure 5A)
indicative of membrane targeting expected following palmitoyla-
tion.
To test the mEGFPpH responsiveness to changes in intracel-
lular pH, we used NH4Cl perfusion and washout to induce
alkaline and acidic intracellular conditions respectively [35]. In
HEK293 cells expressing mEGFPpH, perfusion with NH4Cl
induced a rapid increase in mEGFPpH fluorescence which peaked
and was followed by a steady decrease in mEGFPpH fluorescence
(Figure 5B). NH4Cl washout induced a rapid decrease in
mEGFPpH fluorescence which reached a minimum and was
followed by a slow return to baseline. Calibration of mEGFPpH
fluorescence as a function of pH shows the fluorescence response
to be linear over the range of pH 6.5 to pH 8.5 (Figure 5C). In this
experiment, we observed an average initial intracellular pH (pHi)
of ,7.4 (n = 4) prior to NH4Cl perfusion, with the NH4Cl
perfusion increasing the average pHi to ,8.5 and washout
dropping the pHi to ,6.5. This demonstrates that the pH
sensitivity of membrane attached mEGFPpH is similar to that
previously reported for the EGFP H148D mutation [26] and is
suitable for detection of pHi changes over a physiologically
relevant range.
To test whether mEGFPpH was capable of detecting pHi
changes resulting from proton movement coupled to glutamate
transport, mEGFPpH was co-expressed with EAAT3 in HEK293
cells and the fluorescence of mEGFPpH monitored during
exposure of the cells to glutamate. Based on the results obtained
during the NH4Cl experiments described above, intracellular
acidification due to proton co-transport would be expected to
decrease pHi, resulting in a decrease in mEGFPpH fluorescence.
When cells were perfused with a relatively low concentration of
glutamate (0.5 mM), no observable fluorescence changes from
baseline were observed (Figure 5D). Increasing the perfused
glutamate concentration to 1 mM resulted in a mEGFPpH
fluorescence decrease during the glutamate pulse, with 50 mMand 100 mM glutamate resulting in more robust mEGFPpH
fluorescence decreases (Figure 5D). To confirm that the fluores-
cence changes are the result of movement of H+ coupled to
glutamate transport and not to H+ generated through increased
metabolic processes due to increased intracellular glutamate, cells
were perfused with the non-metabolized EAAT substrate D-
aspartate. Perfusion with 100 mM D-aspartate induced a fluores-
cence decrease similar to that observed for 100 mM glutamate
(Figure 5E), indicating that the fluorescence changes are coupled
to EAAT transport activity and not metabolism. The fluorescence
changes were blocked by co-application of glutamate with the
EAAT transport inhibitor TBOA and were not readily observed in
cells expressing mEGFPpH alone (data not shown). We observed
that the slope or rate of the fluorescence decrease varied with
glutamate concentration and therefore was reflective of glutamate
transport rate suggesting that this method could be used to assay
glutamate transport activity. A similar approach using fluorescent
proteins to assay membrane transport has been described for
CFTR using a GFP derived halide sensor [36]. To confirm that
the slope of the fluorescence response varies with glutamate
concentration, we measured the maximal steady state slope of the
mEGFPpH fluorescence decrease resulting from glutamate
transport activity for a range of glutamate concentrations from
0.5 mM to 2 mM. As we found that the magnitude of the slope
varied from cell to cell, likely as a result of variation in the
expression of EAAT3, we normalized the slope magnitude to that
obtained for 1 mM glutamate in the same cell. Plotting the slope
magnitude as a function of the applied glutamate concentration
resulted in a dose response curve with a calculated Km of 30 mM(Figure 5F). This compares to a Km of 70 mM calculated for
radiolabeled glutamate uptake from similarly transfected cells.
These results validate this approach of using a pH-biosensor to
assay glutamate transporter activity through monitoring pHi.
Figure 3. Inhibition of glutamate transport by L-Selenocysteine and L-Cysteine for EAAT 2 and EAAT 3. Inhibition of radiolabeledglutamate uptake using varying concentrations of L-cysteine (circles) or L-selenocysteine (triangles) in HEK293 cells expressing EAAT2 (A, n.5 foreach data point) or EAAT3 (B, n.5 for each data point). Data are represented as the mean and the standard error of the mean with non-linear curvefit to calculate the IC50s.doi:10.1371/journal.pone.0109245.g003
EAAT3 Cysteine Transport
PLOS ONE | www.plosone.org 6 October 2014 | Volume 9 | Issue 10 | e109245
EAAT3 cysteine transport increases pHi whereasselenocysteine decreases pHi
To better characterize the transport properties of cysteine and
selenocysteine, we used mEGFPpH to monitor changes in pHi
associated with transport of either substrate and compared the
results to those observed with glutamate. In HEK293 cells co-
expressing mEGFPpH and EAAT2, a carrier which has low
affinity (Km.1 mM) [13] and a very low capacity for cysteine
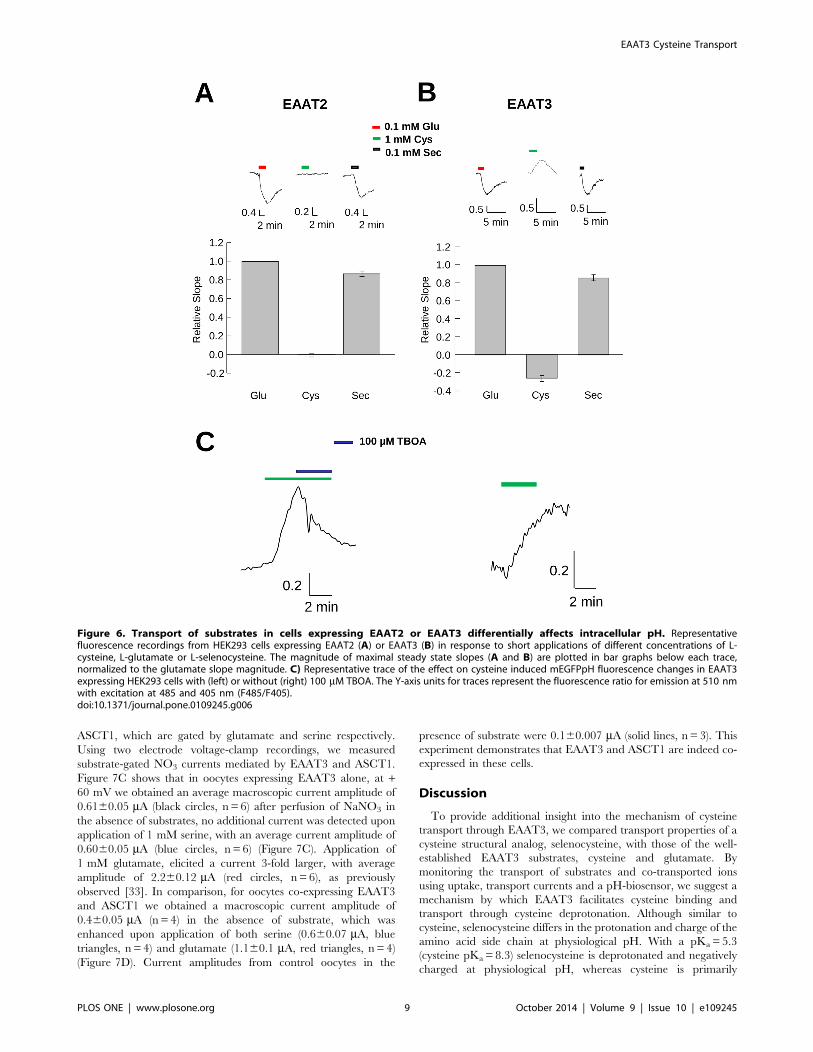
transport (Figure 2B), perfusion of 1 mM cysteine (Figure 6A) did
not produce observable fluorescence changes from baseline.
However, perfusion of 1 mM glutamate induced a significant
quench of mEGFPpH fluorescence in the same cells (Figure 6A),
consistent with a pHi decrease due to coupled proton co-transport.
Perfusion of these cells with 1 mM selenocysteine also resulted in a
fluorescence decrease similar in magnitude to that observed for
glutamate, consistent with the results obtained for the transport
currents observed in EAAT2 expressing oocytes (Figure 2B).
These results confirm that in contrast to its structural analog
cysteine, selenocysteine is an effective substrate for EAAT2.
In HEK293 cells co-expressing mEGFPpH and EAAT3,
perfusion with 1 mM selenocysteine or 1 mM glutamate induced
a fluorescence decrease, consistent with selenocysteine being a
substrate for EAAT3. In contrast to the pH decrease observed for
both selenocysteine and glutamate, perfusion of 1 mM cysteine in
EAAT3 expressing cells resulted in an increase in mEGFPpH
fluorescence, indicating a pHi increase (Figure 6B). The absence of
such a fluorescence increase in EAAT2 expressing cells (Fig-
ure 6A) or in untransfected control cells (data not shown), suggests
that the observed intracellular alkalinization directly correlates
with cysteine transport through EAAT3. This result was unex-
pected as previous reports had indicated that cysteine transport
resulted in no change in pHi [7].
The bar graphs in Figure 6A and 6B quantify and compare the
slopes of the fluorescence changes induced by selenocysteine and
cysteine normalized to the slope of the response induced by
100 mM glutamate. For EAAT2 and EAAT3, 100 mM selenocys-
teine produced fluorescence changes of 0.8560.02 (n= 4) and
0.8660.03 (n= 6) respectively compared to that produced by
100 mM glutamate. In EAAT2-expressing cells, cysteine perfusion
produced no observable fluorescence changes, however in
EAAT3-expressing cells the normalized slope of the fluorescence
change was 0.2860.03 (n= 6) but opposite to that of selenocys-
teine or glutamate. Thus, under the conditions used, which favor
inward transport of all three substrates, the impact on intracellular
proton concentration due to cysteine transport by EAAT3 is
distinct from that of the acidic substrates glutamate and
selenocysteine.
To provide additional support that this fluorescence increase
was due to EAAT3 transport activity, we examined the effect of
the EAAT-selective inhibitor TBOA on the cysteine-induced
fluorescence increase. In HEK293 cells expressing EAAT3 and
mEGFPpH, the increased fluorescence induced by perfusion of
1 mM cysteine was subsequently blocked by co-application of
100 mM TBOA, with fluorescence subsequently returning to
baseline (Figure 6C, left). This return to baseline during cysteine
perfusion was not observed in the absence of TBOA (Figure 6C,
right). These results indicate that in contrast to the acidification
observed with EAAT3-mediated transport of selenocysteine or
glutamate, the process of cysteine transport results in cytoplasmic
alkalinization.
Release of intracellular substrate pools resulting fromEAAT transport activityAs EAATs have been shown to release intracellular substrates
due to the reversibility of steps in the transport process [13,15,37],
pHi increases associated with cysteine transport by EAAT3 could
be explained by transporter reversal, which would result in release
of internal substrates and the outward co-transport of sodium and
protons. To test this possibility, we performed assays monitoring
the release of intracellular [3H]-L-glutamate and [35S]-L-cysteine
induced by extracellularly-applied glutamate or cysteine in cells
expressing EAAT3. These experiments were performed in an
oocyte expression system because they have a low background of
endogenous cysteine transport. For these experiments, we also co-
expressed ASCT1, an obligate exchanger, to provide a positive
confirmation that intracellular cysteine pools are sufficiently large
to allow cysteine release by exchange or reverse transport.
Figure 4. pH affects glutamate inhibition of cysteine transport.Glutamate inhibition of cysteine uptake from oocytes expressing EAAT3at three different cysteine concentrations: 30 mM (circles), 300 mM(triangles) and 1 mM (squares) at pH 6.9 (A) and pH 8.5 (B).doi:10.1371/journal.pone.0109245.g004
EAAT3 Cysteine Transport
PLOS ONE | www.plosone.org 7 October 2014 | Volume 9 | Issue 10 | e109245
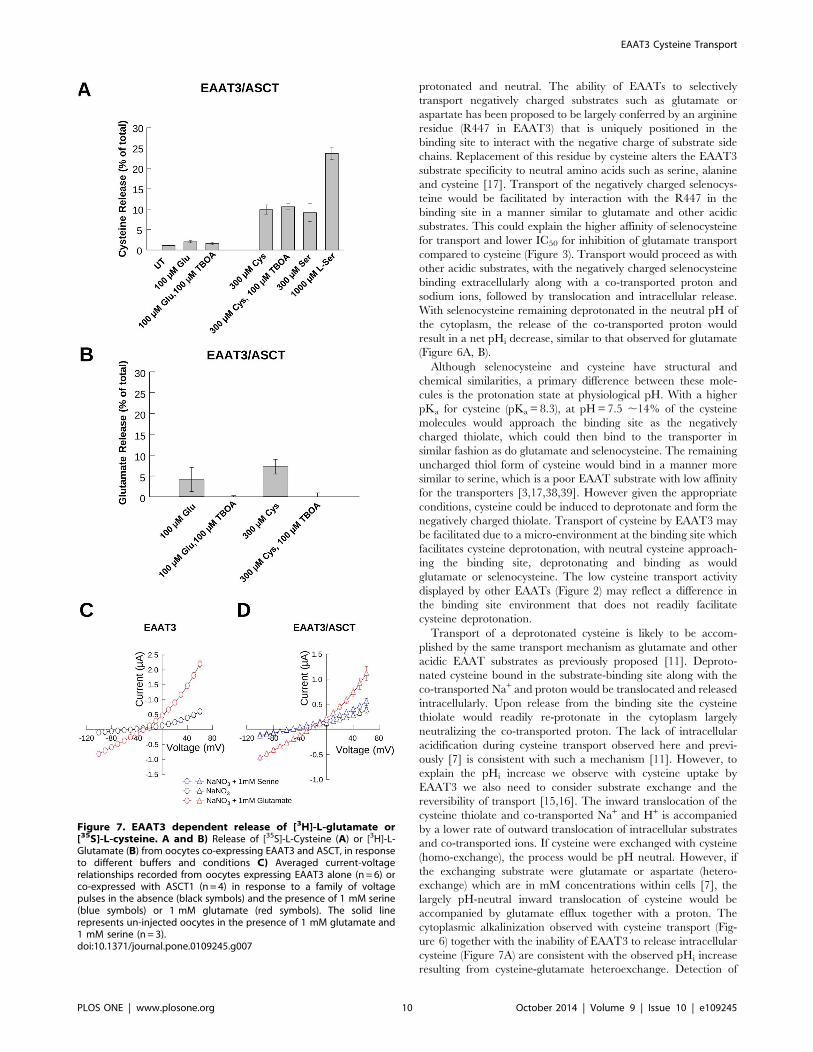
When oocytes co-expressing EAAT3/ASCT1 were preloaded
with [35S]-L-cysteine and incubated with 100 mM glutamate, less
than 2% of the radiolabel could be detected in the extracellular
medium. This release was not significantly inhibited by the
transport inhibitor TBOA, and was not substantially greater than
that observed under control conditions of buffer alone (Figure 7A).
One explanation for this low level of apparent [35S]-L-cysteine
reverse transport by EAAT3 could be that free cytoplasmic [35S]-
L-cysteine is rapidly reduced by incorporation into molecules such
as glutathione or other metabolic pathways and therefore
unavailable for release. To test this, we looked at the effect of
transport by the obligate exchanger ASCT1 on the release of
internal [35S]-L-cysteine. Incubation of the oocytes with 300 mMcysteine, a substrate for both EAAT3 and ASCT1, resulted in the
release of 10% of the internal [35S]-cysteine, a 5-fold increase over
that released by glutamate application. This release was not
inhibited by TBOA, consistent with release through ASCT1 and
not through EAAT3. L-serine, an ASCT1 substrate with very low
affinity for transport by EAAT3 [3,17,38,39], also induced release
of [35S]-L-cysteine. Incubation of the oocytes in buffer-containing
300 mM and 1 mM L-serine induced release of 10% and 20% of
the [35S]-L-cysteine respectively, demonstrating that a portion of
the [35S]-L-cysteine remains unincorporated and available for
release by ASCT1, but is not readily released by EAAT3. This
would indicate that the low level of cysteine release by EAAT3 is
not due to low intracellular substrate availability, but rather the
inability of EAAT3 to bind or translocate intracellular cysteine
stores.
In contrast, when cells were loaded with [3H]-L-glutamate we
observed increased release of the radiolabeled substrate when
either glutamate or cysteine was applied compared to buffer alone,
indicating that glutamate can be readily released by EAAT3.
Incubation of the oocytes in buffer containing 100 mM L-
glutamate resulted in the release of 5% of the loaded [3H]-L-
glutamate which was blocked by co-incubation with TBOA
(Figure 7B). Substitution of the Na+ containing buffer for K+
containing buffer, a condition which favors reverse transport,
induced release of 2% of the loaded [3H]-L-glutamate, with co-
application of TBOA blocking this release (data not shown).
Cysteine also induced release of 7.5% of the [3H]-L-glutamate,
which was also blocked by the transport inhibitor TBOA and was
not significantly different from that observed for glutamate
(Figure 7B). Incubation with 1 mM L-serine, which is not
transported by EAAT3 [3,17,38,39], did not induce significant
release of loaded [3H]-L-glutamate above control levels (data not
shown). Taken together these data suggest that although glutamate
can be readily exchanged, cysteine transport by EAAT3 is
unidirectional.
EAAT3 and ASCT1 show an uncoupled anion conductance
which is activated by Na and enhanced upon application of their
respective substrates glutamate and serine [31,32]. To corroborate
ASCT1 co-expression with EAAT3 in these experiments, we
measured substrate gated anion currents mediated by EAAT3 and
Figure 5. mEGFPpH detects intracellular pH changes induced by glutamate transport. Representative image of mEGFPpH transfectedHEK293 cells (A) and representative fluorescence traces from HEK293 cells expressing mEGFPpH perfused with 50 mM NH4Cl (B). Y axis indicates theratio of fluorescence emission at 510 nm from excitation at 485 nm and 405 nm (F485/F405) (B). Arrows in A indicate the cells from which the tracesin B were recorded. C) Fluorescence ratio (F485/F405) as a function of induced intracellular pH following NH4Cl perfusion (B). D) Perfusion ofincreasing concentrations of L-glutamate results in increased rate of mEGFPpH fluorescence decrease in HEK293 cells co-transfected with EAAT3 andmEGFPpH. The Y-axis units are the fluorescence ratio for emission at 510 nm with excitation at 485 and 405 nm (F485/F405). E) Perfusion with100 mM D-aspartate results in intracellular acidification with slope magnitude similar to that for 100 mM L-glutamate (bar graph). Y-axis units are thefluorescence ratio for emission at 510 nm with excitation at 485 and 405 nm (F485/F405). F) Representation of the magnitude of the slope ofmEGFPpH fluorescence ratio decrease (left y-axis) as a function of the applied glutamate concentration compared with the glutamate transportactivity (right y-axis) in similarly transfected cells.doi:10.1371/journal.pone.0109245.g005
EAAT3 Cysteine Transport
PLOS ONE | www.plosone.org 8 October 2014 | Volume 9 | Issue 10 | e109245
ASCT1, which are gated by glutamate and serine respectively.
Using two electrode voltage-clamp recordings, we measured
substrate-gated NO3 currents mediated by EAAT3 and ASCT1.
Figure 7C shows that in oocytes expressing EAAT3 alone, at +60 mV we obtained an average macroscopic current amplitude of
0.6160.05 mA (black circles, n = 6) after perfusion of NaNO3 in
the absence of substrates, no additional current was detected upon
application of 1 mM serine, with an average current amplitude of
0.6060.05 mA (blue circles, n = 6) (Figure 7C). Application of
1 mM glutamate, elicited a current 3-fold larger, with average
amplitude of 2.260.12 mA (red circles, n = 6), as previously
observed [33]. In comparison, for oocytes co-expressing EAAT3
and ASCT1 we obtained a macroscopic current amplitude of
0.460.05 mA (n= 4) in the absence of substrate, which was
enhanced upon application of both serine (0.660.07 mA, blue
triangles, n = 4) and glutamate (1.160.1 mA, red triangles, n = 4)
(Figure 7D). Current amplitudes from control oocytes in the
presence of substrate were 0.160.007 mA (solid lines, n = 3). This
experiment demonstrates that EAAT3 and ASCT1 are indeed co-
expressed in these cells.
Discussion
To provide additional insight into the mechanism of cysteine
transport through EAAT3, we compared transport properties of a
cysteine structural analog, selenocysteine, with those of the well-
established EAAT3 substrates, cysteine and glutamate. By
monitoring the transport of substrates and co-transported ions
using uptake, transport currents and a pH-biosensor, we suggest a
mechanism by which EAAT3 facilitates cysteine binding and
transport through cysteine deprotonation. Although similar to
cysteine, selenocysteine differs in the protonation and charge of the
amino acid side chain at physiological pH. With a pKa= 5.3
(cysteine pKa= 8.3) selenocysteine is deprotonated and negatively
charged at physiological pH, whereas cysteine is primarily
Figure 6. Transport of substrates in cells expressing EAAT2 or EAAT3 differentially affects intracellular pH. Representativefluorescence recordings from HEK293 cells expressing EAAT2 (A) or EAAT3 (B) in response to short applications of different concentrations of L-cysteine, L-glutamate or L-selenocysteine. The magnitude of maximal steady state slopes (A and B) are plotted in bar graphs below each trace,normalized to the glutamate slope magnitude. C) Representative trace of the effect on cysteine induced mEGFPpH fluorescence changes in EAAT3expressing HEK293 cells with (left) or without (right) 100 mM TBOA. The Y-axis units for traces represent the fluorescence ratio for emission at 510 nmwith excitation at 485 and 405 nm (F485/F405).doi:10.1371/journal.pone.0109245.g006
EAAT3 Cysteine Transport
PLOS ONE | www.plosone.org 9 October 2014 | Volume 9 | Issue 10 | e109245
protonated and neutral. The ability of EAATs to selectively
transport negatively charged substrates such as glutamate or
aspartate has been proposed to be largely conferred by an arginine
residue (R447 in EAAT3) that is uniquely positioned in the
binding site to interact with the negative charge of substrate side
chains. Replacement of this residue by cysteine alters the EAAT3
substrate specificity to neutral amino acids such as serine, alanine
and cysteine [17]. Transport of the negatively charged selenocys-
teine would be facilitated by interaction with the R447 in the
binding site in a manner similar to glutamate and other acidic
substrates. This could explain the higher affinity of selenocysteine
for transport and lower IC50 for inhibition of glutamate transport
compared to cysteine (Figure 3). Transport would proceed as with
other acidic substrates, with the negatively charged selenocysteine
binding extracellularly along with a co-transported proton and
sodium ions, followed by translocation and intracellular release.
With selenocysteine remaining deprotonated in the neutral pH of
the cytoplasm, the release of the co-transported proton would
result in a net pHi decrease, similar to that observed for glutamate
(Figure 6A, B).
Although selenocysteine and cysteine have structural and
chemical similarities, a primary difference between these mole-
cules is the protonation state at physiological pH. With a higher
pKa for cysteine (pKa= 8.3), at pH=7.5 ,14% of the cysteine
molecules would approach the binding site as the negatively
charged thiolate, which could then bind to the transporter in
similar fashion as do glutamate and selenocysteine. The remaining
uncharged thiol form of cysteine would bind in a manner more
similar to serine, which is a poor EAAT substrate with low affinity
for the transporters [3,17,38,39]. However given the appropriate
conditions, cysteine could be induced to deprotonate and form the
negatively charged thiolate. Transport of cysteine by EAAT3 may
be facilitated due to a micro-environment at the binding site which
facilitates cysteine deprotonation, with neutral cysteine approach-
ing the binding site, deprotonating and binding as would
glutamate or selenocysteine. The low cysteine transport activity
displayed by other EAATs (Figure 2) may reflect a difference in
the binding site environment that does not readily facilitate
cysteine deprotonation.
Transport of a deprotonated cysteine is likely to be accom-
plished by the same transport mechanism as glutamate and other
acidic EAAT substrates as previously proposed [11]. Deproto-
nated cysteine bound in the substrate-binding site along with the
co-transported Na+ and proton would be translocated and released
intracellularly. Upon release from the binding site the cysteine
thiolate would readily re-protonate in the cytoplasm largely
neutralizing the co-transported proton. The lack of intracellular
acidification during cysteine transport observed here and previ-
ously [7] is consistent with such a mechanism [11]. However, to
explain the pHi increase we observe with cysteine uptake by
EAAT3 we also need to consider substrate exchange and the
reversibility of transport [15,16]. The inward translocation of the
cysteine thiolate and co-transported Na+ and H+ is accompanied
by a lower rate of outward translocation of intracellular substrates
and co-transported ions. If cysteine were exchanged with cysteine
(homo-exchange), the process would be pH neutral. However, if
the exchanging substrate were glutamate or aspartate (hetero-
exchange) which are in mM concentrations within cells [7], the
largely pH-neutral inward translocation of cysteine would be
accompanied by glutamate efflux together with a proton. The
cytoplasmic alkalinization observed with cysteine transport (Fig-
ure 6) together with the inability of EAAT3 to release intracellular
cysteine (Figure 7A) are consistent with the observed pHi increase
resulting from cysteine-glutamate heteroexchange. Detection of
Figure 7. EAAT3 dependent release of [3H]-L-glutamate or[35S]-L-cysteine. A and B) Release of [35S]-L-Cysteine (A) or [3H]-L-Glutamate (B) from oocytes co-expressing EAAT3 and ASCT, in responseto different buffers and conditions C) Averaged current-voltagerelationships recorded from oocytes expressing EAAT3 alone (n = 6) orco-expressed with ASCT1 (n = 4) in response to a family of voltagepulses in the absence (black symbols) and the presence of 1 mM serine(blue symbols) or 1 mM glutamate (red symbols). The solid linerepresents un-injected oocytes in the presence of 1 mM glutamate and1 mM serine (n = 3).doi:10.1371/journal.pone.0109245.g007
EAAT3 Cysteine Transport
PLOS ONE | www.plosone.org 10 October 2014 | Volume 9 | Issue 10 | e109245
this pHi increase using mEGFPpH, which was not seen using
BCECF [7], may have been due to use of the membrane attached
mEGFPpH positioned proximal to the site of ion flux which may
provide additional sensitivity compared to the cytoplasmically-
distributed BCECF. These results highlight the advantages of
using a membrane localized biosensor for monitoring transported
mediated ionic fluxes in real time [27].
The mechanism of cysteine deprotonation prior to transport
suggests that the thiol form of cysteine would require an additional
step prior to translocation whereas the thiolate form would bind as
do the other acidic substrates. This is supported by our
observations of the effect of pH on glutamate inhibition of
cysteine transport (Figure 4). We observed that 300 mM cysteine
transport at pH 6.9 (4% thiolate) was more effectively inhibited by
glutamate than at pH 8.5 (61% thiolate). The thiolate would
readily interact with the residues of the substrate-binding site,
particularly R447, while the cysteine thiol would require
additional steps to form the proper interactions and may be
readily displaced by acidic substrates such as glutamate. This
would also provide an explanation for the very low affinity of
serine for the transporters, as serine is fully protonated at neutral
pH. However, when R447 is replaced by an uncharged cysteine
residue, serine and alanine are readily transported by EAAT3/
EAAC1 [17].
Our results also demonstrate that selenocysteine is transported
by the plasma membrane excitatory amino acid transporters
(EAATs). This is the first evidence identifying specific plasma
membrane transporters of the essential amino acid selenocysteine.
Characterization of the transport properties of selenocysteine show
that it is a high affinity substrate for the human isoforms EAATs
1–3, with properties similar to other acidic EAAT substrates and
in contrast to its structural analog cysteine, which is efficiently and
selectively transported through EAAT3. Selenocysteine forms the
active site in a number of cellular proteins such as glutathione
peroxidase, a critical peroxide scavenging enzyme. Free cytoplas-
mic selenocysteine is not specifically incorporated into the active
site of this and other enzymes but can be randomly incorporated
into cysteine sites as a result of non-specific incorporation into the
Cys tRNA (tRNACys) (for review, see [40]). Elemental selenium
derived from selenocysteine, can be incorporated through a
selenophosphate intermediate into special selenocysteine tRNAs
(tRNAsSec) which are used during translation of selenoproteins
[23]. Transport of selenocysteine into the cell by EAATs may play
an important role to facilitate the production of tRNASec by
working to maintain the intracellular pool of selenocysteine for this
process.
Cysteine transport by EAAT3 has been proposed to be critical
in vivo for maintaining a sufficient intracellular pool of free
cysteine for glutathione synthesis [4]. The expression of EAAT3 in
neurons and the unique cysteine transport properties compared to
the reduced cysteine transport by the glial expressed EAATs
support this idea. As we observed, EAAT3 readily transports
cysteine into cells with little detectable release due to EAAT3
transport activity. The absence of significant cysteine release by
EAAT3 is likely the result of a much lower substrate affinity at the
intracellular binding site [11,12], low intracellular cysteine
concentrations (,200 mM) maintained by cells [4], or local
environment surrounding the intracellular binding site that is
not conducive to thiolate formation. Also, other substrates such as
glutamate are present at concentrations above 1 mM [7] and thus
more likely to participate in the exchange process. This is in
contrast to ASCT1, which transports neutral amino acids in an
obligate exchange mode and which we observed to facilitate the
release of intracellular cysteine in the presence of extracellular
serine (Figure 7). In neurons, loss of cysteine due to ASCT1
transport activity could be mitigated by reuptake through EAAT3.
Release of cysteine by glial-localized ASCT1 could provide a
mechanism to facilitate the transfer of cysteine into neurons. In
both cases it would be advantageous for the glial carriers, EAAT1
and EAAT2, to transport cysteine poorly thus increasing the
probability of capture by neuronal EAAT3.
Acknowledgments
We thank Dr. Susan Ingram (OHSU) for critical experimental support and
comments on the manuscript. We thank Dr. Horacio Poblete for help with
the final format of the Figures.
Author Contributions
Conceived and designed the experiments: SDW DTS CBD SGA.
Performed the experiments: SDW DTS. Analyzed the data: SDW DTS
CBD SGA. Contributed reagents/materials/analysis tools: SDW DTS
SGA. Contributed to the writing of the manuscript: SDW DTS SGA.
References
1. Danbolt NC (2001) Glutamate uptake. Prog Neurobiol 65: 1–105.
2. Amara SG, Fontana AC (2002) Excitatory amino acid transporters: keeping up
with glutamate. Neurochem Int 41: 313–318.
3. Arriza JL, Fairman WA, Wadiche JI, Murdoch GH, Kavanaugh MP, et al.
(1994) Functional comparisons of three glutamate transporter subtypes cloned
from human motor cortex. J Neurosci 14: 5559–5569.
4. Aoyama K, Nakaki T (2013) Neuroprotective properties of the excitatory amino
acid carrier 1 (EAAC1). Amino Acids 45: 133–142.
5. Seal RP, Amara SG (1999) Excitatory amino acid transporters: a family in flux.
Annu Rev Pharmacol Toxicol 39: 431–456.
6. Kanai Y, Nussberger S, Romero MF, Boron WF, Hebert SC, et al. (1995)
Electrogenic properties of the epithelial and neuronal high affinity glutamate
transporter. J Biol Chem 270: 16561–16568.
7. Zerangue N, Kavanaugh MP (1996) Flux coupling in a neuronal glutamate
transporter. Nature 383: 634–637.
8. Levy LM, Warr O, Attwell D (1998) Stoichiometry of the glial glutamate
transporter GLT-1 expressed inducibly in a Chinese hamster ovary cell line
selected for low endogenous Na+-dependent glutamate uptake. J Neurosci 18:
9620–9628.
9. Billups B, Rossi D, Attwell D (1996) Anion conductance behavior of the
glutamate uptake carrier in salamander retinal glial cells. J Neurosci 16: 6722–
6731.
10. Poitry-Yamate CL, Vutskits L, Rauen T (2002) Neuronal-induced and
glutamate-dependent activation of glial glutamate transporter function.
J Neurochem 82: 987–997.
11. Watzke N, Rauen T, Bamberg E, Grewer C (2000) On the mechanism of proton
transport by the neuronal excitatory amino acid carrier 1. J Gen Physiol 116:
609–622.
12. Zhang Z, Tao Z, Gameiro A, Barcelona S, Braams S, et al. (2007) Transport
direction determines the kinetics of substrate transport by the glutamate
transporter EAAC1. Proc Natl Acad Sci U S A 104: 18025–18030.
13. Zerangue N, Kavanaugh MP (1996) Interaction of L-cysteine with a human
excitatory amino acid transporter. J Physiol 493 (Pt 2): 419–423.
14. Levi G, Raiteri M (1993) Carrier-mediated release of neurotransmitters. Trends
Neurosci 16: 415–419.
15. Koch HP, Kavanaugh MP, Esslinger CS, Zerangue N, Humphrey JM, et al.
(1999) Differentiation of substrate and nonsubstrate inhibitors of the high-
affinity, sodium-dependent glutamate transporters. Mol Pharmacol 56: 1095–
1104.
16. Grewer C, Gameiro A, Zhang Z, Tao Z, Braams S, et al. (2008) Glutamate
forward and reverse transport: from molecular mechanism to transporter-
mediated release after ischemia. IUBMB Life 60: 609–619.
17. Bendahan A, Armon A, Madani N, Kavanaugh MP, Kanner BI (2000) Arginine
447 plays a pivotal role in substrate interactions in a neuronal glutamate
transporter. J Biol Chem 275: 37436–37442.
18. Scopelliti AJ, Ryan RM, Vandenberg RJ (2013) Molecular determinants for
functional differences between alanine-serine-cysteine transporter 1 and other
glutamate transporter family members. J Biol Chem 288: 8250–8257.
EAAT3 Cysteine Transport
PLOS ONE | www.plosone.org 11 October 2014 | Volume 9 | Issue 10 | e109245

19. Utsunomiya-Tate N, Endou H, Kanai Y (1996) Cloning and functional
characterization of a system ASC-like Na+-dependent neutral amino acidtransporter. J Biol Chem 271: 14883–14890.
20. Kryukov GV, Castellano S, Novoselov SV, Lobanov AV, Zehtab O, et al. (2003)
Characterization of mammalian selenoproteomes. Science 300: 1439–1443.21. Hawkes WC, Alkan Z (2010) Regulation of redox signaling by selenoproteins.
Biol Trace Elem Res 134: 235–251.22. Lobanov AV, Hatfield DL, Gladyshev VN (2009) Eukaryotic selenoproteins and
selenoproteomes. Biochim Biophys Acta 1790: 1424–1428.
23. Lacourciere GM, Stadtman TC (2001) Utilization of selenocysteine as a sourceof selenium for selenophosphate biosynthesis. Biofactors 14: 69–74.
24. Aoyama K, Suh SW, Hamby AM, Liu J, Chan WY, et al. (2006) Neuronalglutathione deficiency and age-dependent neurodegeneration in the EAAC1
deficient mouse. Nat Neurosci 9: 119–126.25. Berman AE, Chan WY, Brennan AM, Reyes RC, Adler BL, et al. (2011) N-
acetylcysteine prevents loss of dopaminergic neurons in the EAAC12/2 mouse.
Ann Neurol 69: 509–520.26. Elsliger MA, Wachter RM, Hanson GT, Kallio K, Remington SJ (1999)
Structural and spectral response of green fluorescent protein variants to changesin pH. Biochemistry 38: 5296–5301.
27. Watts SD, Suchland KL, Amara SG, Ingram SL (2012) A sensitive membrane-
targeted biosensor for monitoring changes in intracellular chloride in neuronalprocesses. PLoS One 7: e35373.
28. Kozak M (1987) An analysis of 59-noncoding sequences from 699 vertebratemessenger RNAs. Nucleic Acids Res 15: 8125–8148.
29. Skene JH, Virag I (1989) Posttranslational membrane attachment and dynamicfatty acylation of a neuronal growth cone protein, GAP-43. J Cell Biol 108: 613–
624.
30. Seal RP, Shigeri Y, Eliasof S, Leighton BH, Amara SG (2001) Sulfhydrylmodification of V449C in the glutamate transporter EAAT1 abolishes substrate
transport but not the substrate-gated anion conductance. Proc Natl Acad
Sci U S A 98: 15324–15329.
31. Wadiche JI, Amara SG, Kavanaugh MP (1995) Ion fluxes associated with
excitatory amino acid transport. Neuron 15: 721–728.
32. Zerangue N, Kavanaugh MP (1996) ASCT-1 is a neutral amino acid exchanger
with chloride channel activity. J Biol Chem 271: 27991–27994.
33. Torres-Salazar D, Fahlke C (2007) Neuronal glutamate transporters vary in
substrate transport rate but not in unitary anion channel conductance. J Biol
Chem 282: 34719–34726.
34. Chen Y, Swanson RA (2003) The glutamate transporters EAAT2 and EAAT3
mediate cysteine uptake in cortical neuron cultures. J Neurochem 84: 1332–
1339.
35. Renner EL, Lake JR, Persico M, Scharschmidt BF (1989) Na+-H+ exchange
activity in rat hepatocytes: role in regulation of intracellular pH. Am J Physiol
256: G44–52.
36. Galietta LJ, Springsteel MF, Eda M, Niedzinski EJ, By K, et al. (2001) Novel
CFTR chloride channel activators identified by screening of combinatorial
libraries based on flavone and benzoquinolizinium lead compounds. J Biol
Chem 276: 19723–19728.
37. Erecinska M, Troeger MB (1986) Amino acid neurotransmitters in the CNS.
Characteristics of the acidic amino acid exchange. FEBS Lett 199: 95–99.
38. Arriza JL, Kavanaugh MP, Fairman WA, Wu YN, Murdoch GH, et al. (1993)
Cloning and expression of a human neutral amino acid transporter with
structural similarity to the glutamate transporter gene family. J Biol Chem 268:
15329–15332.
39. Nothmann D, Leinenweber A, Torres-Salazar D, Kovermann P, Hotzy J, et al.
(2011) Hetero-oligomerization of neuronal glutamate transporters. J Biol Chem
286: 3935–3943.
40. Stadtman TC (1996) Selenocysteine. Annu Rev Biochem 65: 83–100.
EAAT3 Cysteine Transport
PLOS ONE | www.plosone.org 12 October 2014 | Volume 9 | Issue 10 | e109245