CYCLOXYDIM (179)
124
Cycloxydim 261 CYCLOXYDIM (179) First draft prepared by Prof. Eloisa Dutra Caldas, University of Brasilia, Brasilia, Brazil EXPLANATION Cycloxydim is a post-emergence cyclohexene oxime herbicide that inhibits the acetylcoenzyme A carboxylase (ACCase) in chloroplasts of sensitive weeds. ACCase catalyses the first step of the de novo biosynthesis of fatty acids in plants. Cycloxydim was firstly evaluated by JMPR in 1992 (T, R). In 2009, within the periodic re-evaluation of toxicology, an ADI of 0–0.07 mg/kg bw and an ARfD of 2 mg/kg bw for women of childbearing age were established; ARfD was unnecessary for the general population. Cycloxydim was scheduled for the periodic re-evaluation of residues by the 2012 JMPR. Data on physical and chemical properties of cycloxydim, metabolism in plants and livestock animals, environmental fates and analytical methods were submitted for evaluation. The manufacturer submitted residue supervised trials on pome fruit, stone fruit, grapes, strawberries, potatoes, carrots, celeriac, onions, tomatoes, peppers, cauliflower, Brussels sprouts, head cabbage, curly kale/ Chinese cabbage, lettuce, spinach, green beans and peas, leeks, sugar beet roots, sugar beet tops, dry beans and peas, oilseed rape, sunflower, soya bean, rice and maize, in addition to animal feeding studies and processing studies. IDENTITY Common name: Cycloxydim IUPAC nomenclature: (5RS)-2-[(EZ)-1-(ethoxyimino) butyl]-3-hydroxy-5-[(3RS)-thian-3-yl] cyclohex-2- en-1-one CA nomenclature: 2-[1-(ethoxyimino) butyl]-3-hydroxy-5-(tetrahydro-2H-thiopyran-3-yl)-2- cyclohexen-1-one CAS: 101 205-02-1 CIPAC: 510 ELINCS: 405-230-9 Molecular formula C 17 H 27 NO 3 S Chemical structure PHYSICAL AND CHEMICAL PROPERTIES The pure active ingredient (ai) is a colourless and odourless solid. The technical compound (TC) is a yellow paste with a moderate aromatic odour. Cycloxydim is chemically a weak acid of unpolar nature. It is very soluble in most of the organic solvents. Under neutral and acidic conditions cycloxydim is poorly soluble in water, but of better solubility in a basic environment. Cycloxydim technical is highly flammable but has a high auto-ignition temperature of 295 °C. Cycloxydim is manufactured as cycloxydim TK 42%, a yellow liquid of moderate aromatic odour. The physical and chemical properties of cycloxydim are shown in detail in Table 1.
Transcript of CYCLOXYDIM (179)

Cycloxydim
261
CYCLOXYDIM (179)
First draft prepared by Prof. Eloisa Dutra Caldas, University of Brasilia, Brasilia, Brazil
EXPLANATION
Cycloxydim is a post-emergence cyclohexene oxime herbicide that inhibits the acetylcoenzyme A carboxylase (ACCase) in chloroplasts of sensitive weeds. ACCase catalyses the first step of the de novo biosynthesis of fatty acids in plants. Cycloxydim was firstly evaluated by JMPR in 1992 (T, R). In 2009, within the periodic re-evaluation of toxicology, an ADI of 0–0.07 mg/kg bw and an ARfD of 2 mg/kg bw for women of childbearing age were established; ARfD was unnecessary for the general population. Cycloxydim was scheduled for the periodic re-evaluation of residues by the 2012 JMPR. Data on physical and chemical properties of cycloxydim, metabolism in plants and livestock animals, environmental fates and analytical methods were submitted for evaluation. The manufacturer submitted residue supervised trials on pome fruit, stone fruit, grapes, strawberries, potatoes, carrots, celeriac, onions, tomatoes, peppers, cauliflower, Brussels sprouts, head cabbage, curly kale/ Chinese cabbage, lettuce, spinach, green beans and peas, leeks, sugar beet roots, sugar beet tops, dry beans and peas, oilseed rape, sunflower, soya bean, rice and maize, in addition to animal feeding studies and processing studies.
IDENTITY Common name: Cycloxydim
IUPAC nomenclature: (5RS)-2-[(EZ)-1-(ethoxyimino) butyl]-3-hydroxy-5-[(3RS)-thian-3-yl] cyclohex-2-en-1-one
CA nomenclature: 2-[1-(ethoxyimino) butyl]-3-hydroxy-5-(tetrahydro-2H-thiopyran-3-yl)-2-cyclohexen-1-one
CAS: 101 205-02-1
CIPAC: 510
ELINCS: 405-230-9
Molecular formula C17H27NO3S
Chemical structure
PHYSICAL AND CHEMICAL PROPERTIES
The pure active ingredient (ai) is a colourless and odourless solid. The technical compound (TC) is a yellow paste with a moderate aromatic odour. Cycloxydim is chemically a weak acid of unpolar nature. It is very soluble in most of the organic solvents. Under neutral and acidic conditions cycloxydim is poorly soluble in water, but of better solubility in a basic environment. Cycloxydim technical is highly flammable but has a high auto-ignition temperature of 295 °C. Cycloxydim is manufactured as cycloxydim TK 42%, a yellow liquid of moderate aromatic odour. The physical and chemical properties of cycloxydim are shown in detail in Table 1.

Cycloxydim
262
Table 1 Physical and chemical properties of pure cycloxydim, technical compound (TC) and technical scale (TK)
Property Guideline and method Findings and comments Reference
Melting point solidification point
EEC A1. 1.4.4.2, DSC, OECD 102
Pure 99.6%: 37.1–41.2 °C TK, 42.0%: days at 0 °C cause no solidification or sedimentation
Tuerk, 1996a; Daum, 2006a; Kaestel, 1997a
Boiling point
EEC A2. 1.4.7, DSC, OECD 103
Pure 99.6%: endothermic effect other than the melting point.
Tuerk, 1996a,
Temperature of decomposition
EEC A2. 1.4.7, DSC, OECD 103
Pure 99.6%: composition is observed at approx. 200 °C
Tuerk, 1996a,
Relative density
EEC A3. 1.4.4, OECD 109
Pure, 99.6%: 1.165. TK 42.0%: 0.99
Kaestel, 1997b Kaestel, 1997a,
Vapour pressure EEC A.4 Pure 99.6%: 1.0 × 10⁻⁵ Pa at 20 °C. Kaestel, 1997b Henry’s law constant and volatility
based on vapour pressure, MW and water solubility
Henry’s Law constant at 20 °C: H = 6.1 × 10⁻⁸ (kPa × m3/mol.)
Ohnsorge, 2000a,
Colour and physical state
Visual examination
Pure 99.6%: white crystals TC, 92.3%: yellow liquid, a viscous paste TK, 42.0% : yellow liquid
Tuerk, 1996a, Kaestel, 1997c Kaestel, 1997a
Odour Organoleptic Pure, 99.6%: odourless TC, 92.3%: moderate aromatic odour. TK, 42%: moderate aromatic odour.
Tuerk, 1996a Kaestel, 1997c Kaestel, 1997a,
UV/VIS, IR, NMR, MS spectra (as)
OECD 101
Pure 99.6%: UV molar extinction coefficient [l× mol-1 × cm-1]: 210 nm: 7.2 × 10³ 227 nm: 4.1 × 10³ 259 nm: 1.0 × 10⁴ 278 nm: 9.3 × 10³ 290 nm: 7.9 × 10³ 300 nm: 4.4 ×10³ UV molar extinction coefficient under acidic conditions (pH1.4) [l × mol-1 × cm-1]: 228 nm: 6753 260 nm: 13788 290 nm: 4199 310 nm: 2930 UV molar extinction coefficient under basic conditions (pH12.1) [l × mol-1 × cm–1]: 215 nm :4983 234 nm: 2140 283 nm: 122105 290 nm: 18079
Tuerk, 1996b Kroehl, 2007a Kroehl, 2008a
Solubility in water
EEC A.6.1.4.2, flask method OECD 105
Pure 99.6%, 53 mg/L at 20 °C: The saturated solution is acidic (pH 4.3). 50% w/w of pure ai is soluble as sodium salt at pH 10.7. pH 4: 0.05 g/L (phthalate buffer) pH 7: 0.9 g/L (phosphate buffer) pH 9: 8 g/L (borate buffer)
Tuerk, 1996c Pawliczek, 1988a Class, 2008a
Solubility in organic solvents
Visual classification. CIPAC MT 181 [formerly CIPAC Document No. 3869/M]
Pure 99.6%, in g/100 mL solvent: n-heptane: > 25 toluene: > 25 dichloromethane: > 25 methanol: > 25 acetone: > 25 ethyl acetate > 25
Daum, 1998a, CIPAC MT 181, 1997a
n-octanol/water partition coefficient
OECD 107 flask method
Pure ai, 99.3% log POW at 25 °C: 3.09 at pH 5,
Redeker, 1988a

Cycloxydim
263
Property Guideline and method Findings and comments Reference
1.36 at pH 7, –0.42 at pH 9
Hydrolysis rate at pH 4,7 and 9 under sterile conditions in the absence of light
US-EPA, N, § 161-1; OECD 111, 2004, SETAC, March 1995
[14C] ai, > 95%; Half-lives at 25 °C: pH 4: 2.1 days pH 5: 12.2 days pH 7: 264 days (extrapolated) pH 9: 958 days (extrapolated)
Hassink, J., 2009a
Direct photo- transformation
FAO, Rev. 3; US-EPA, Subdivision N, § 161-2
[14C] ai, 92% Half-lives at 22 °C: pH 5: 5.8 h pH 7: 17.6 h pH 9: 22.3 h
Goetz, v N, 2000a
Quantum yield of direct photo- transformation
FAO, Rev. 3; US-EPA, Subdivision N, § 161-2
[14C] ai, 92%quantum yield pH 5: 5.68 × 10⁻³ pH 7: 1.87 × 10⁻⁴ pH 9: 2.02 × 10⁻⁴
Goetz, v N, 2000a
Dissociation constant
OECD 112 Pure, 99.4%: pKa 4.17 at 20 °C. TK, 42.0%: pH = 4.1; 1% emulsion in CIPAC H2O D
Redeker, J, 1988b Kaestel, R, 1997a
Photochemical oxidative degradation
BBA guideline part IV, 6-1
T ½ = 6.3 h (Atkinson’s method) Sarafin, R 1991a]
Flammability (upon contact with water)
EEC A.10 EEC A.11 EEC A.12
TC, 92.3%: highly flammable, observed after 31 sec. TK, 42.0%: Not applicable for liquid. TK batch 707: 3 not highly flammable
Loeffler, U, 1997a, Loeffler, U, 1997b Bitterlich, S 2007a
Relative self-ignition temperature
EEC A.15 TC, 92.9%: Auto-ignition at 295 °C TK, 42.0%: Auto-ignition at 360 °C.
Loeffler, U, 2000a Loeffler, U, 1997b
Flash point
EEC A9.1.6.3.2
TC, 92.9%: 89.5 °C TK, 42.0%: 62 °C.
Loeffler, U, 2000a Kaestel, R, 1997a
Explosive properties
EEC A.14 DSC
TC, 92.9%: Not explosive TK, 42.0%: Not applicable TK, batch 7073: not explosive
Loeffler, 2000a; Loeffler, 1997b; Petersen-Thiery, 2006a; Bitterlich, 2007a
Surface tension
EEC A.5
Pure 99.6%: 58.0 mN/m at 0.5% and 57.0 mN/m at 2.0% TC, 92.3%: 56.2 mN/m at 1.0% TK, 42.0%: 52.4 mN/m at 1%
Kaestel, R, 1997b Kaestel, R, 1997c Kaestel, R, 1997a
Oxidizing properties
EEC A.17 EEC A.21
TC, 92.9%: Not applicable TK, 42.0%: Not applicable TK batch 7073: not an oxidizing agent.
Loeffler, U, 2000a Loeffler, U, 1997b Bitterlich, S 2007a
METABOLISM AND ENVIRONMENTAL FATE
E/Z isomerization of cycloxydim at the C=N bond
The chemical structure of the active substance cycloxydim contains an ethoxyimino group including a C = N double bond. It has been observed that an E/Z isomerisation occurs frequently and easily. The ratio of isomers depends on the physical state of the compound and the polarity of solvents.
S
O
O
NOH
S
O
O
NOH
S
O
O
NOH
E-Isomer Hypothetical transition state Z-Isomer

Cycloxydim
264
The 14C-labelled cycloxydim, stored in toluene, is almost exclusively present as E-isomer
(Grosshans, 2006a). The EC formulation contains a mixture of aromatic hydrocarbons, and cycloxydim is also exclusively present as E-isomer. In the water spray emulsion, the Z-isomer may have been built to a certain extent. The parent compound and all metabolites containing the oxime ether chain can isomerize in its physiological environment in plants and in solution dependent on polarity, temperature and pH and therefore double peaks can occur in the chromatograms. During the course of the metabolism studies, the individual isomer concentration could also be influenced by extraction, solution, or elution solvents used for work-up and analysis. Therefore it is not avoidable that one or the other isomer is detected in higher concentrations which do not exactly represent the E/Z-ratio in the biological matrix.
The metabolites identified in the different metabolism studies are summarized in Table 2.
Table 2 Identified cycloxydim and cycloxydim-5-OH-TSO metabolites in animal and plants
Name Chemical Name Metabolite Identity Matrix where found Cycloxydim
2-[1-(ethoxyimino)butyl]-3-hydroxy-5-(3-thianyl)-2-cyclohexen-1-one
sugar beet soya bean hen goat rat
Cycloxydim- TSO
2-[1-(ethoxyimino)butyl]-3-hydroxy-5-(3-thianyl)-2-cyclohexen-1-one S-oxide
sugar beet soya bean maize hen goat rat rotational crop
Cycloxydim- TSO2
2-[1-(ethoxyimino)butyl]-3-hydroxy-5-(3-thianyl)-2-cyclohexen-1-one S-dioxide
sugar beet soya bean maize hen goat rat rotational crop
Cycloxydim- T1S
2-(1-iminobutyl)-3-hydroxy-5-(3-thianyl)-cyclohex-2-en-1-one
goat (liver) rat
Cycloxydim- T1SO
2-(1-iminobutyl)-3-hydroxy-5-(3-thianyl)-cyclohex-2-en-1-one S-oxide
sugar beet soya bean maize goat (milk, liver, kidney) hen rat rotational crop
Cycloxydim- T1SO2
2-(1-iminobutyl)-3-hydroxy-5-(3-thianyl)-cyclohex-2-en-1-one S-dioxide
sugar beet soya bean maize goat rat
Cycloxydim- T2S
2-propyl-6-(3-thianyl)-4,5,6,7-tetrahydrobenzoxazol-4-one
hen (fat, liver) rat
N
OH
OO
S
S
O
OH
O
NO
NO
OH
O
SO O
O
OH
NH
S
S
O
OH
O
NH
S
O
OH
O O
NH
N
O
O
S

Cycloxydim
265
Name Chemical Name Metabolite Identity Matrix where found Cycloxydim- T2SO
2-propyl-6-(3-thianyl)-4,5,6,7-tetrahydrobenzoxazol-4-one S-oxide
sugar beet soya bean maize goat hen rat rotational crop
Cycloxydim- T2SO2
2-propyl-6-(3-thianyl)-4,5,6,7-tetrahydrobenzoxazol-4-one S-dioxide
sugar beet soya bean goat (milk, liver)
Cycloxydim- 5-OH-TS
2-[1-(ethoxyimino)butyl]-3,5-dihydroxy-5-(3-thianyl)-2-cyclohexen-1-one
goat hen
Cycloxydim- 5-OH-TSO
2-[1-(ethoxyimino)butyl]-3,5-dihydroxy-5-(3-thianyl)-2-cyclohexen-1-one S-oxide
soya bean
Cycloxydim- 5-OH-TSO2
2-[1-(ethoxyimino)butyl]-3,5-dihydroxy-5-(3-thianyl)-2-cyclohexen-1-one S-dioxide
soya bean
Cycloxydim- 5-OH-T1SO
2-(1-iminobutyl)-3,5-dihydroxy-5-(3-thianyl)-2-cyclohexen-1-one S-oxide
maize (grain) goat
Cycloxydim- 6-OH-T2SO
2-propyl-6-hydroxy- 6-(3-thianyl)-4,5,6,7-tetrahydrobenzoxazol-4-one S-oxide
soya bean maize goat
Cycloxydim- 6-OH-T2SO2
2-propyl-6-hydroxy- (3-thianyl)-4,5,6,7-tetrahydrobenzoxazol-4-one S-dioxide
soya bean maize
Cycloxydim- TGSO
3-(3-thianyl)-glutaric acid S-oxide
soya bean maize
N
O
O
S
O
N
O
O
SO O
NO
OHOH
S
O
NO
OH
OHS
O
O
NO
OHOH
SO
O
O
S
O
OH
O
NH
OH
N
O
O
SO
OH
N
O
O
SO
OH
O
S
OH
O
OHO
O

Cycloxydim
266
Name Chemical Name Metabolite Identity Matrix where found Cycloxydim- TGSO2
3-(3-thianyl)-glutaric acid S-dioxide
sugar beet soya bean maize rotational crop
The metabolism and distribution of [14C] cycloxydim and metabolites in animal and or plants
was investigated using the test substance labelled in the cyclohexenone ring; * position of the 14C-label (Figure 1).
[14C] Cycloxydim
[14C] Cycloxydim-5-OH-TSO
14C-Cycloxydim-TSO
Figure 1 Labelled cycloxydim and metabolite used in the metabolism studies
Animal metabolism
Lactating goats
[14C] cycloxydim was investigated in two lactating goats following repeated oral administration for 7 days at an actual dose of 15 mg/kg feed or 24 mg/animal/day (Leibold & Hoffmann, 2001a; Hafemann & Knoell, 2003a). Excreta were collected in 24-hour intervals and milk collected in the morning before dosing and in the evening. The portion from the evening was combined with that of the next morning to form the daily pool. Muscle, fat, liver and kidney were pooled from both goats at the day of sacrifice. The total radioactive residues were determined in milk by direct liquid scintillation counting while the other matrices were combusted for this purpose. Milk, liver, and kidney were extracted with methanol and in case of the organs, subsequently with water. Non-extracted residues > 10% TRR were solubilised by pronase treatment. Metabolite patterns were obtained by HPLC analysis.
About 85% of the total administered dose was recovered, mainly in urine (72%) and faeces (12%), and 0.09% in milk. Radioactivity in milk was constant during the 7 days dosing period. More than 96% TRR in milk was extracted with methanol (Table 3). Post-extraction solid contained 64.1%TRR from liver and 49.5%TRR from kidney, most of it solubilised by pronase treatment (57% and 42% of the TRR for liver and kidney, respectively). TRR in muscle and fat were low (0.006 and 0.005 mg/kg, respectively) and further investigations in these matrices were not reported.
Table 3 Extractability of goat matrices after dosing with 14C/13C-cycloxydim
Matrix TRR Methanol Water ERR a PES b Recovery
mg/kg mg/kg % TRR mg/kg % TRR mg/kg % TRR mg/kg % TRR % Milk 0.023 0.022 96.5 – – 0.022 96.5 < 0.001 1.4 97.9 Liver 0.076 0.023 30.5 0.003 4.0 0.026 34.5 0.048 64.1 98.6 Kidney 0.062 0.030 48.8 0.002 3.7 0.032 52.5 0.031 49.5 102.0 a ERR = Extractable Radioactive Residue (sum of Methanol and Water)
S
OH
O
OHOO O
S
O
N
OH
O*
(*)
NO
OH
S
O
O
OH
(*)
*

Cycloxydim
267
b PES = Post-Extraction Solid
The major metabolites were identified as cycloxydim-T1SO and cycloxydim-TSO in milk,
liver and kidney (Table 4). Cycloxydim-T1S, cycloxydim-TSO2 and cycloxydim-T2SO2 were detected as minor metabolites. The post-extraction solids of liver and kidney were solubilised by pronase treatment and showed a complex peak pattern after HPLC analysis with each peak below 0.01 mg/kg eq.. None of these HPLC peaks could be correlated with the metabolite identities found in the organic extracts of liver and kidney.
Table 4 Identified and quantified metabolites in methanol extracts of edible matrices of lactating goats after dosing with 14C/13C-cycloxydim at a nominal dose level of 12 mg/kg ppm feed
Metabolite
Milk mg/kg (%TRR)
Liver mg/kg (%TRR)
Kidney mg/kg (%TRR)
Cycloxydim – 0.008 (10.8) – cycloxydim-T1SO a 0.004 (16.4) 0.001 (1.8) 0.002 (4.1) cycloxydim-TSO a 0.003 (14.8) 0.006 (8.1) 0.008 (12.4) cycloxydim-T2SO2 < 0.001 (0.5) 0.001 (2.0) – cycloxydim-TSO2 – < 0.001 (0.6) – cycloxydim-T1S – < 0.001 (0.5) – Total idenfified, mg/ kg 0.006 0.018 0.010 Non- idendified residues, mg/kg 0.016 0.005 0.020 a Sum of isomers
Storage stability investigations were conducted with milk, liver and faeces. Organic extracts
of these matrices were produced at the beginning and at the end of the study. The extracts were further analysed by two different HPLC systems. The storage stability investigations with milk, liver and faeces extracts covered a time period of up to 18 months. Within this time period it could be shown that the metabolite composition was sufficiently stable.
The main route of biotransformation of cycloxydim was the stepwise oxidation of the sulphur of the thiopyrane ring to cycloxydim-TSO (major metabolite) and to cycloxydim-TSO2 (Figure 2). Another metabolic route was the degradation of the oxime ether group by N-de-ethoxylation forming cycloxydim-T1S. Cycloxydim-T1S was further oxidized to the sulfoxide cycloxydim-T1SO. In addition, cycloxydim-TSO was transformed abiotically to the oxazole cycloxydim-T2SO by a Beckmann rearrangement followed by ring closure. This transformation product was further oxidized to the sulphur dioxide cycloxydim-T2SO2. All metabolites containing the intact oxime ether group produced E/Z isomers at the C = N double bond. Metabolites with the sulfoxide group generated additional diastereomers with the sulphur and the 3-yl position as chirality centres.
A lactating goat (50 kg, age 1–2 years) was dosed with gelatine capsules containing [14C] cycloxydim-TSO at 200 mg per day for five days, equivalent to 4 mg/kg body weight (Hawkins et al. 1985a). Assuming a standard feed consumption of 2 kg/day, this dose level corresponds to a dietary concentration of 100 mg/kg feed. Urine and faeces were collected separately in 24 hour intervals. The animals were milked twice daily, immediately prior to dosing and at approximately 6 hours after dosing. The treated goat and the control animal were sacrificed 24 hours after the final dose. The livers and kidneys were removed, along with samples of muscle (loin and leg) and omental and back fat. Milk and liver were extracted with methanol. Further samples of liver were also extracted with methanol/water (4:1), ethanol and ethyl acetate and an additional sample incubated with β-glucuronidase/sulphatase and subsequently extracted with methanol. The methanol extracts were analysed by TLC. Metabolites in urine, milk and liver extracts were identified by co-chromatography with reference compounds.
At sacrifice, 89.1% of the administered dose was recovered, mostly in urine (78.5%) and faeces (10%). TRR in milk accounted for 0.11% of the dose. Liver and kidney had the highest residues (Table 5). Mean daily milk concentrations immediately reached a plateau of 0.09–0.12 mg/kg. Concentrations in morning milk were considerably lower than corresponding plasma concentrations.

Cycloxydim
268
Table 5 Total radioactive residues after dosing of a lactating goat with [14C] cycloxydim-TSO at a dose level of 100 mg/kg feed
Matrix % of the dose TRR, mg/kg Milk (Day 1–Day 5) a 0.11 0.09–0.12 Liver 0.035 0.46 Kidney 0.007 0.52 Muscle – 0.04 Omental fat – 0.04 Back fat – 0.04 a Morning and afternoon milk combined
Over 90% of the radioactivity present in milk was extracted in methanol. Extraction of liver
with methanol, methanol/water and ethyl acetate removed < 50% of the radioactive residues. After enzyme incubation, three subsequent extractions with methanol removed 63.7% of the liver radioactivity. Unchanged cycloxydim-TSO accounted for more than 50% of radioactivity excreted in urine. In milk and liver extracts cycloxydim-TSO was the major component, followed by cycloxydim-T1SO (Table 6).
Table 6 Summary of metabolites in milk and liver of goats which had received [14C] cycloxydim-TSO at a 100 mg/kg nominal dose level (based on feed intake)
Metabolite Milk a mg/kg (% TRR)
Liver mg/kg (% TRR)
cycloxydim-T1SO 0.06 (22.8) 0.05 (9.9) cycloxydim-T2SO 0.02 (7.8) – cycloxydim-TSO 0.06 (23.1) 0.10 (21.7) cycloxydim-T1SO2 0.01 (5.0) – cycloxydim-TSO2 < 0.01 (2.7) – Unidentified ≤0.11 b (38.7) ≤ 0.16 c (32.1) a Collected 6 hours after the fourth daily dose b 4 TLC peaks in the range of 1.1–23.7% TRR c 5 TLC peaks in the range of 0.5–22.5% TRR
The metabolism and distribution of [14C] cycloxydim-OH-TSO was investigated in two
lactating goats following repeated oral administration at one dose level of 12 mg/kg feed on nine consecutive days (Leibold & Ravenzwaay, 2002c; Tilting, 2003a,b). Faeces and urine were collected daily. Milk was sampled in the morning before dose administration and in the afternoon. Animals were sacrificed 23 hours after the last dosing. Liver, kidney, fat, muscle and milk (days 3 to 7) were pooled and analysed. Milk and tissues were extracted with methanol, followed by extraction with water, and clean-up by acetonitrile/iso-hexane partition (milk) or SPE column clean-up. The extraction residue of liver was subjected to enzymatic digestion with a protease (pronase). Characterisation and identification of metabolites was performed by LC-MS.
On average, 97.1% of the administered dose was recovered in the experiment, from which 75% in urine and 15.7% in faeces. In average, 0.11 to 0.12% was recovered in liver and muscle, 0.07% in milk and 0.02% in kidney and fat. TRR ranged from 0.02 mg/kg in milk to 0.26 mg/kg in kidney (Table 7). The radioactivity in milk remained constant, so that the plateau was reached almost immediately. Methanol extracts contained 88.6% to 96.9% TRR except for liver, where a protease treatment was necessary to achieve an addition 11.6% TRR. The non-extracted residues accounted for up to 10.2% TRR in muscle (Table 7).
Table 7 Extractability after dosing lactating goats with [14C] cycloxydim-5-OH-TSO
Matrix TRR Methanol Water ERR a PES b Recovery c mg/kg mg/kg (%TRR) mg/kg (%TRR) mg/kg (%TRR) mg/kg(%TRR) mg/kg(% TRR)
Milk 0.0197 0.018 (91.38) 0.0002 (0.76) 0.018(92.14) 0.0006(3.06) 0.0187(95.2) Muscle 0.0245 0.023 (94.9) n.p. 0.023(94.9) 0.0025(10.2) 0.0257(105.1)

Cycloxydim
269
Matrix TRR Methanol Water ERR a PES b Recovery c mg/kg mg/kg (%TRR) mg/kg (%TRR) mg/kg (%TRR) mg/kg(%TRR) mg/kg(% TRR)
Liver 0.203 0.159 (78.4) 0.016 (8.0) 0.199(98.0) 0.004(1.7) 0.203(99.7) Kidney 0.259 0.251 (96.9) 0.004 (1.5) 0.255(97.1) 0.016(6.2) 0.271(103.3) Fat 0.0237 0.0211 (88.6) n.p. 0.0211(89.0) 0.00144(6.1) 0.0225(95.1) a ERR = Extractable Radioactive Residue, include 11.6% extracted after protease b PES Post Extraction Solids (residue after all extraction steps)
c Sum of all extracts and the final residue n.p. = Not performed
Over 70% TRR was identified and characterized was in milk and tissues (Table 8).
Cycloxydim-5-OH-TSO was the main compound detected, excepted in liver where cycloxydim-5-OH-TS was the main detected. Other metabolites identified were cycloxydim-5-OH-T1SO and cycloxydim-6-OH-T2SO (Table 8). Many minor metabolites, which could not be identified, were formed.
Table 8 Summary of identified and quantified metabolites in edible matrices of lactating goats after dosing with [14C] cycloxydim-5-OH-TSO at a nominal dose level of 12 mg/kg
Metabolite
Milk mg/kg (%TRR)
Muscle mg/kg (%TRR)
Liver mg/kg (%TRR)
Kidney mg/kg (%TRR)
Fat mg/kg (%TRR)
cycloxydim-5-OH-TSO 0.0067 (33.9) 0.0086 (35.1) 0.0216 (10.6) 0.0978 (37.8) 0.0073 (30.9)
cycloxydim-5-OH-TS 0.0008 (3.8) 0.0010 (4.3) 0.0354 (17.4) 0.0654 (25.3) 0.0026 (10.7) cycloxydim-6-OH-T2SO 0.0012 (6.1) 0.0031 (12.7) 0.0043 (2.1) 0.0080 (3.1) n.d.
cycloxydim-5-OH-T1SO 0.0016 (8.4) 0.001 (3.7) n.d. n.d. 0.0009 (3.8)
n.d.: Not detected
Storage stability investigations were performed in urine and liver. At the beginning and at the
end of the study liver samples were extracted and the methanol extracts were analysed by HPLC. Both extraction efficiency and metabolite pattern were absolutely comparable. A decline of cycloxydim-5-OH-TS could be observed probably due to oxidation by air to form cycloxydim-5-OH-TSO.
Figure 2 shows the metabolic pathways of cycloxydim in goats, hens and rats after feeding with cycloxydim and/cycloxydim-TSO and cycloxydim-5-OH-TSO)
Laying hens
The metabolism and distribution of [14C] cycloxydim (14C:13C:12C, 30:50:20) was investigated in laying hens following daily oral administration to a group of ten hens for 10 days at a nominal dose level of 12 mg/kg feed (Leibold & Ravenzwaay, 2002b; Fabian & Knoell, 2003a). Excreta were collected daily and eggs twice a day, in the morning before administration of the test substance and in the afternoon, except for the weekends, where records on egg production were only made once per day. Within 23 hours after the last administration, animals were sacrificed and liver, adipose tissue, chest and leg muscles, and the gastrointestinal (GI) tract (skin and contents) were taken for determination of radioactivity. Eggs and each tissue type were pooled over all animals. Excreta, GI contents and fat were treated with tissue solubiliser after suspending in methanol and freeze-drying. Total radioactive residues in tissues were determined by combustion. Eggs were directly measured after mixing with scintillation fluid. Excreta, muscle and liver samples were extracted with methanol while fat and eggs were extracted with a mixture of methanol/iso-hexane. The extracts were further purified by partition with iso-hexane and in some cases additionally cleaned-up with solid phase extraction (SPE) cartridges or fractionated by HPLC. The extraction residues of liver, muscle, fat, and eggs were subjected to an enzymatic digestion with an unspecific protease (pronase). The purified methanol extracts of eggs and tissues were investigated by radio-HPLC on at least two different

Cycloxydim
270
HPLC systems either with synthetic reference substances or metabolite samples identified by LC/MS/MS.
The overall recovery of radioactivity amounted to 80.05% of the administered dose, mostly in the excreta (78.0%), 0.33% in eggs. 0.11% in muscle, 0.07% in liver and 0.02% in fat. Total radioactive residue (TRR) in eggs ranged from 0.052 mg/kg at day 1 to 0.142 mg/kg at day 10 (mean of 0.121 mg/kg), starting to plateau at day 8. In tissues, TRR ranged from 0.051 to 0.281 mg/kg (Table 9). From 11 to 45%TRR was extracted in methanol, and non-extracted residues (post-extraction solids, PES) were in the range of 54 to 91% TRR.
Table 9 Total radioactive residues (TRR) after dosing of laying hens with [14C] cycloxydim
Matrix TRR Methanol Hexane ERR a PES b Recovery c
mg/kg mg/kg (% TRR) mg/kg(% TRR) mg/kg (%TRR) mg/kg (%TRR)
mg/kg (%TRR)
Egg, pool 0.121 0.055 (45.0) 0.002 (1.6) 0.057 (46.6) 0.065 (53.9) 100.5 Muscle 0.053 0.006 (11.1) n.p. 0.006 (11.1) 0.049 (91.0) 102.1 Fat 0.051 0.015 (30.3) 0.001 (2.2) 0.016 (32.5) 0.035 (69.0) 101.5 Liver 0.281 0.075 (26.8) 0.021 (7.6) d 0.097 (34.4) 0.201 (71.6) 106.0 a ERR = Extracted Radioactive Residue (sum of solvents 1 and 2) b PES = Post-Extraction Solid c Sum of all extracts and the residue d sum of different organic solvents n.p.: Not performed
Identification and quantification of parent compound and metabolites in the edible matrices of
laying hens are shown in Table 10. In all matrixes, the main residue was cycloxydim-TSO (30.9% TRR in eggs). Parent compound represented < 5%TRR and cycloxydim-T2S was present only in fat and liver (≤ 1%TRR). Protease digestion released about 50% TRR in eggs and 66.2%TRR in fat. Unextracted residues in muscle accounted for 4.5% TRR (0.002 mg/kg). Up to eight unknown minor peaks were detected in the matrices, all at levels ≤ 0.001 mg/kg.
Table 10 Summary of identified and quantified metabolites in edible matrices of laying hens after dosing with [14C] cycloxydim at a nominal dose level of 12 mg/kg (based on feed intake)
Metabolite Eggs mg/kg (% TRR)
Muscle mg/kg (% TRR)
Fat mg/kg (% TRR)
Liver mg/kg (% TRR)
Cycloxydim 0.004 (3.4) < 0.001 (0.5) – 0.005 (1.7) cycloxydim-TSO a 0.037 (30.9) < 0.002 (3.0) 0.008 (18.0) 0.020 (7.4) cycloxydim-TSO2 a 0.008 (6.4) 0.001 (0.9) < 0.001 (0.4) 0.002 (0.6) cycloxydim-T2S – – < 0.001 (0.7) 0.003 (1.0) a Sum of diastereomers
All samples used in this study for metabolite identification were extracted and analysed
within 16.4 months after sampling. To confirm storage stability, new sub-samples of egg, muscle, fat, and liver were extracted about 16.1 to 16.4 months after sampling and were compared to the HPLC chromatograms obtained at the beginning of the study (within 1.2 months after sampling). For all matrices, the re-extraction of samples showed no significant differences with regard to extractability and metabolite pattern. None of the major peaks were subject to degradation.
The metabolic pathway of cycloxydim in hens was characterized by two main routes: oxidation to cycloxydim-TSO and subsequently to cycloxydim-TSO2 and Beckmann re-arrangement with subsequent ring closure forming the oxazol cycloxydim-T2S.
[14C] Cycloxydim sulfoxide ([14C] cycloxydim-TSO) was administered in gelatine capsules to laying hens once daily for 7 days at a dose level of 5 mg/bird/day, equivalent to an intake of total diet containing residues of 50 mg/kg (Hawkins et al. 1986a). The treated animals were sacrificed between 6 and 48 h hours after the last dose administration. Radioactivity was measured in eggs laid during and after the dosing period and in tissues at 6, 24 and 48 hours after the final dose. Excretion of

Cycloxydim
271
radioactivity was measured during the dosing period and up to 48 hours after the last dose. Pooled eggs from Group 4 laid on Day 5 were freeze-dried and extracted with methanol. The extract was purified by C18 SPE and analysed by TLC. A portion of pooled livers from Group 3 was extracted with methanol and another incubated with glucuronidase/sulphatase, extracted with methanol, purified by SPE and analysed by TLC. TRR in eggs increased rapidly to an apparent plateau value of 0.07–0.10 mg/kg from Day 2 onwards. Radioactive residues in tissues were highest 6 h post dose and declined rapidly with time (Table 11).
Table 11 Mean Total Radioactive Residues in tissues 6 h, 24 h and 48 h after dosing of laying hens with [14C] cycloxydim-TSO
Matrix TRR, mg/kg Group 2 (6 h Post Dose)
Group 3 (24 h Post Dose)
Group 4 (48 h Post Dose)
Egg (Days 2–7) – – 0.07, 0.08, 0.09, 0.08, 010,- 0.10
Muscle 0.10 0.06 < 0.01 Fat + skin 0.15 0.15 0.04 Liver 0.57 0.35 0.07 Kidney 0.99 0.62 0.08
Excretion of radioactivity was almost complete by 48 hours after the final dose, with 92.3% of the administered dose recovered in the excreta and a mean of 0.08% in eggs (Group 4). Methanol extraction removed 79.1% TRR from eggs and 76.0% TRR from liver. With preceding enzyme incubation, 90% TRR in liver were extracted with methanol. Cycloxydim-TSO was the major identified component in eggs and liver. Major metabolites in liver were cycloxydim-T2SO and cycloxydim-T1SO. In total, 23.6% TRR of the egg radioactivity remained unidentified (Table 12).
Table 12 Metabolites in eggs and liver of laying hens after dosing with [14C] cycloxydim-TSO
Metabolite Eggs, group 4, day 5, mg/kg (% TRR) Liver, group 2, 6 h post sacrifice, mg/kg (% TRR)
cycloxydim-TSO 0.12 (41.4) 0.19 (32.7) cycloxydim-T2SO 0.02 (5.5) 0.14 (24.3) cycloxydim-T1SO – 0.10 (16.6) cycloxydim-TSO2 0.03 (8.8) 0.03 (5.3) Unidentified 0.06 a (23.6) 0.07 b (11.5) a 7 components (0.7–12.1% TRR) b 4 components (1.6–6.8% TRR)
Primary pathways of metabolism of cycloxydim-TSO involved oxidation to the sulfone
(cycloxydim-TSO2), de-ethoxylation to yield the imine (cycloxydim-T1SO) and Beckmann rearrangement to yield the cyclic cycloxydim-T2SO.
[14C] cycloxydim-5-OH-TSO was administered to a group of twelve hens daily on 11 consecutive days at a nominal dose level of 12 mg/kg feed (Leibold &Ravenzwaay van, 2002a; Seiferlein, 2003a). Excreta were collected each 24 hours and eggs were sampled twice a day. Animals were sacrificed 23 hours after the last dose and tissues taken for determination of radioactivity. Eggs from Day 2 to Day 11 as well as each tissue type were pooled over all animals. Total radioactive residues in tissues were determined by combustion except for fat, which was treated with tissue solubiliser. Eggs were directly measured after mixing with scintillation fluid. Eggs, muscle and liver were extracted with methanol and fat with methanol/iso-hexane (1:1, v/v). The extracts were further purified by partition with iso-hexane, cleaned-up with SPE and subjected to an enzymatic digestion with protease. Extracts were investigated by radio-HPLC. All samples used in metabolite identification were extracted and analysed within 9 months after sampling, period during which no differences was found in extractability and metabolite pattern.
The radioactivity was rapidly excreted within 24 hours after the last dose, with 92.7% of the applied dose recovered, mainly on excreta (89.7%). Only 0.21% of the dose was found in eggs, with

Cycloxydim
272
levels ranging from 0.046 to 0.066 mg/kg from day 1 to 11. The highest concentration of radioactivity was found in the gastrointestinal tract (0.605 mg/kg, 0.56% of the dose), followed by muscle (0.08%, 0.028 mg/kg), liver (0.03%, 0.11 mg/kg) and fat (0.01%, 0.017 mg/kg).
Methanol extracted 88.8% of the TRR present in eggs and 80.5% TRR in fat (Table 13). The final non-extracted residues (post-extraction solids) were in the range of 24 to 38% TRR. Protease released over 80% of the residues in PES.
Table 13 Extractability of edible matrices after dosing of laying hens with [14C] cycloxydim-5-OH-TSO
Matrix TRR mg/kg
Methanol mg/kg (% TRR)
Hexane mg/kg (% TRR)
ERR a
mg/kg (% TRR) PES b
mg/kg (% TRR) Recovery c
mg/kg (% TRR)
Egg 0.066 0.059 (88.8) n.p. 0.059 (88.8) 0.017 (26.4) 0.076 (115.2) Muscle 0.028 0.017 (62.8) n.p. 0.017 (62.8) 0.010 (37.9) 0.028 (100.7) Fat 0.017 0.014 (80.5) 0.001 (3.8) 0.014 (84.3) 0.004 (24.1) 0.019 (108.4) Liver 0.110 0.071 (64.6) n.p. 0.071 (64.6) 0.036 (32.3) 0.107 (96.9) a ERR = Extractable Radioactive Residue (sum of solvents 1 and 2) b PES = Post-Extraction Solid c Sum of all extracts and the residue n.p.: not performed
Cycloxydim-5-OH-TSO was metabolized to cycloxydim-5-OH-TS in all matrices, accounting
with 19.4%TRR in liver to 50.7%TRR in eggs (Table 14). In addition, five to eight unknown minor peaks were seen in the metabolite pattern, each of them in concentrations < 0.01 mg/kg.
Table 14 Summary of identified and quantified metabolites in edible matrices of laying hens after dosing with [14C] cycloxydim-5-OH-TSO at a nominal dose level of 12 mg/kg
Metabolite Eggs mg/kg (% TRR)
Muscle mg/kg (% TRR)
Fat mg/kg (% TRR)
Liver mg/kg (% TRR)
cycloxydim-5-OH-TSO a 0.01 (14.7) 0.007 (23.7) 0.005 (29.0) 0.027 (24.4) cycloxydim-5-OH-TS 0.034 (50.7) 0.006 (21.9) 0.004 (21.0) 0.021 (19.4) a Sum of Z and E-isomers

Cycloxydim
273
Figure 2 Metabolic pathways of cycloxydim in animals. * cycloxydim
S
OH
O
CH3
NH
O
S
O
O
N
O
CH3
S
O
O
N
O
OH
CH3
S
OH
O
CH3
NH
O O
S
O
O
NOH
S
O
O
NOH
O
S
O
O
N OH
OO
S
O
O
NOH
O
OH
S
O
O
NOH
OH
S
OH
O
CH3
NH
O
OH
S
O
O
N CH3
S
O
O
N
O
CH3
O
S
O
O
N
O
OH
H O
S
O
O
N
O
H O
S
O
O
N
OO
H O
S
O
O
NH O
S
O NH
CH3
*T1SO
*T1SO2
Cycloxydim
E
*6-OH-T2SO
*5-OH-TS
*5-OH-T1SO
*T2SO
*TSO2
*5-OH-TSO
*TSO
*T2S
(goat, hen, rat)(goat, hen, rat)
(goat, hen, rat) (goat, hen, rat)
(goat, rat)
(goat, after feeding of 5-OH-TSO)
(hen, rat)
*T2SO2(goat)
(major soybean metabolite)
E Z
EZ
E Z
E-isomeronly
Z
*T1S(goat, rat)
E-isomeronly
(goat, after feeding of 5-OH-TSO)
(goat and hen, after feeding of 5-OH-TSO)

Cycloxydim
274
Plant metabolism
Potatoes
A potato study was performed with [14C] cycloxydim EC formulation applied once to potato plants at an exaggerated rate of 2 kg ai/ha (Beutel, 1987a). The plants (variety: Grata-Mittelfruehe) were grown in a mixture of loam/compost and peat under natural Limburgerhof conditions in a glass roof and treated 37 days after sowing. Samples were taken 0 and 24 days after treatment and at crop maturity (73 DAT). Samples were extracted with a mixture of isopropanol and water and the radioactivity determined by LSC. The residual radioactive residue was quantified by combustion analysis. After oxidation with H2O2 under alkaline conditions, a methylation step was performed on charcoal. Prior to GC quantitation, the resulting analytes cycloxydim-TDME and cycloxydim-OH-TDME were further purified by liquid/liquid partition and chromatography. No metabolite identification was provided in this report.
TRR accounted for 5.35 mg/kg in potato tubers and 11.54 mg/kg in potato tops (Table 15). Extraction with iso-propanol/water released 96.6% TRR from tubers and 85.5% TRR from tops. The final eluate analysed by GC and quantified using external standard calibration showed cycloxydim-TDME and cycloxydim-OH-TDME at 2.4 and 1.2 mg/kg in the tubers and 2.73 and 1.88 mg/kg, in the tops, respectively.
Table 15 Potatoes: Investigations on extractability and accountability
Potato Tubers Potato Tops Plant Matrix [mg/kg] [% TRR] [mg/kg] [% TRR] TRR 5.35 100 11.54 100 Isopropanol/water extract 5.17 96.6 9.87 85.5 Non-extractable residue 0.18 3.4 1.67 14.5 Sum: Waste fractions 0.91 17.0 4.64 42.1 Finale eluate for GC determination 3.59 67.1 4.92 42.6 Overall balance (extractable radioactivity) 87 99
Soya beans, cotton and sugar beet
A study on the uptake and transport of [14C] cycloxydim was performed under controlled climatic conditions in a growth chamber with seedlings of soya beans, cotton and sugar beet (Hamm, 1985a). Two application forms were tested: In one treatment, the plants were cultivated in a nutrient solution containing 5 mg/L of [14C] cycloxydim to evaluate root uptake. To evaluate the uptake by the leaf, 10 µg [14C] cycloxydim was applied to the upper leaf surface of one leaf (soya bean, sugar beet) or one cotyledon (cotton). Samples were taken 3 and 7 days (soya bean and cotton) or 4 and 8 days (sugar beets) after the application, respectively. The plants were divided in two sections, at least, and dried between several layers of filter paper for a week at room temperature. The plant parts were stuck on paper and exposed to X-ray film for about 10 days and the autoradiograms compared with the dried plants. Plant parts were combusted in a sample oxidiser, 14CO2/CO2 absorbed in a liquid scintillation cocktail and radioactivity measured in the liquid scintillation spectrometer. TRRs or metabolite identification were not provided in the report
[14C] cycloxydim was taken up by the soya bean roots and transported acropetally to the cotyledons, stem and the remaining leaves. The highest radioactivity was detected in the primary leaves and roots (Table 16). [14C] cycloxydim was also taken up fast by the cotton and sugar beet roots and transported acropetally to all upper plant parts. The compound was taken up fast within 4 days by the sugar beets roots and transported acropetally to all upper plant parts (Table 16).

Cycloxydim
275
Table 16 Translocation behaviour of [14C] cycloxydim after root application, in µg [14C] cycloxydim/ 14C-equiv
Plant Part Soya bean Cotton Sugar Beet 3 DAT 7 DAT 3 DAT 7 DAT 4 DAT 8 DAT
Roots 10.8 26.3 8.3 7.8 8.2 8.6 Stem 3.3 3.7 1.2 5.7 – – Cotyledons 3.1 4.6 8.4 14.5 2.5 1.6 First pair of leaves 17.8 24.9 – – 13.7 16.7 Shoot tip/top 4.7 14.6 1.5 1.7 – – Balance 39.7 74.1 19.4 29.7 24.4 26.9
Table 17 shows the results for the leaf application. Radioactivity is distributed through the soya bean plant within three days. The preferred translocation is acropetal to the shoot tip. About 23% of the total radioactivity is translocated from the treated primary leaf to the untreated plant parts. A leaf application results in a weak distribution of the labelled compound in the cotton seedlings, with 5% of the applied radioactivity found in untreated plant parts after 3 days. A similar distribution behaviour of the sugar beet seedlings compared to the soya bean and cotton seedlings can be seen.
Table 17 Translocation behaviour of [14C] cycloxydim after leaf application, in µg [14C] cycloxydim/ 14C-equivalents
Plant Part Soya bean Cotton Sugar Beet 3 DAT 7 DAT 3 DAT 7 DAT 4 DAT 8 DAT
Treated leaf 6.4 7.3 5.9 6.0 9.7 7.6 Untreated plant part 1.9 2.2 0.3 0.5 0.7 0.9 Stem 0.4 0.4 0.1 0.1 Shoot tip 0.7 1.1 n.d. 0.1 Cotyledons 0.2 0.3 – – 0.1 0.2 Roots 0.3 0.1 0.03 0.02 Balance 8.3 9.5 6.2 6.5 10.4 8.5 Transport rate % 23 23 5 3 7 11
Sugar beets
Sugar beet plants were cultivated in a growth chamber simulating European climatic conditions (Huber and Schepers, 1986a). At the 3-leaves stage, the seedlings were treated with [14C] cycloxydim at 0.2 kg ai/ha. Samples were taken at 0, 7, 22, 46 and 77 days after treatment and after 119 days the mature plant was harvested. The samples were extracted with aqueous methanol, and radioactivity characterized by liquid/liquid partition using dichloromethane at pH 13 and pH 2. The quantitation of the individual metabolites in tops is based on radio TLC/HPLC of the dichloromethane phases and the metabolites were characterized by mass spectrometry. Due to the low amounts of radioactivity in roots, no further investigations were carried out.
TRRs (extractable and non-extractable) of tops and roots are summarized in Table 18. Immediately after application, 8.48 mg/kg were found in tops and 0.13 mg/kg at harvest. In roots, only small amounts were present at harvest. Extractability with aqueous methanol ranged from 66.2 to 99.3% TRR. Partition of the tops (0 DAT) methanol extracts with dichloromethane at pH 2 yielded 90.2% TRR. At later sampling intervals, the aqueous solubles were predominant.
Table 18 Sugar beet total radioactive residues and extraction behaviour
Plant matrix (DAT)
TRR Methanol Residue DCM (pH 2) DCM (pH 13) Aqueous Phase mg/kg mg/kg (%TRR) mg/kg (%TRR) mg/kg
(%TRR) mg/kg (%TRR) mg/kg (%TRR)
Tops (0) 8.48 8.42 (99.3) 0.06 (0.7) 7.65 (90.2) 0.13 (1.5) 0.34 (4.0) Tops (7) 4.39 4.28 (97.5) 0.11 (2.5) 3.18 (72.4) 0.05 (1.1) 0.89 (20.3) Tops (22) 1.28 1.20 (93.8) 0.08 (6.3) 0.59 (46.1) 0.11 (8.6) 0.56 (43.8) Roots (22) 0.31 0.28 (90.3) 0.03 (9.7) 0.11 (35.5) 0.03 (9.7) 0.08 (25.8) Tops (46) 0.67 0.62 (92.5) 0.05 (7.5) 0.23 (34.3) 0.02 (3.0) 0.40 (59.7)

Cycloxydim
276
Plant matrix (DAT)
TRR Methanol Residue DCM (pH 2) DCM (pH 13) Aqueous Phase mg/kg mg/kg (%TRR) mg/kg (%TRR) mg/kg
(%TRR) mg/kg (%TRR) mg/kg (%TRR)
Roots (46) 0.12 0.10 (83.3) 0.02 (16.7) 0.03 (25.0) 0.01 (8.3) 0.04 (33.3) Tops (77) 0.27 0.25 (92.6) 0.02 (7.4) 0.07 (25.9) 0.01 (3.7) 0.12 (44.4) Roots (77) 0.23 0.22 (95.6) 0.01 (4.4) 0.01 (6.1) 0.01 (4.8) 0.02 (8.7) Tops (119) 0.13 0.086 (66.2) 0.045 (34.6) 0.026 (20.0) 0.004 (3.1) 0.075 (57.7) Roots (119) 0.015 0.011 (73.3) 0.004 (26.7
The identification/characterisation of the metabolites present in the dichloromethane phases of tops (0–46 DAT) are shown in Table 19. In samples taken immediately after application and at 7 DAT, only trace amounts of the parent molecule was detected. At early sampling intervals the metabolites cycloxydim-TSO and cycloxydim-TSO2 formed the major part of the radioactivity identified. At later sampling points, the cleavage products cycloxydim-T1SO, cycloxydim-T1SO2 and the oxazole derivatives cycloxydim-T2SO and cycloxydim-T2SO2 resulting from a Beckmann re-arrangement were found. No hydroxylated metabolites have been detected in any sugar beet sample.
Table 19 Identification and characterisation of extractable radioactivity in unripe sugar beet tops
Metabolite Tops (0 DAT) Tops (7 DAT) Tops (22 DAT) Tops (46 DAT) mg/kg (% TRR) mg/kg (% TRR) mg/kg (% TRR) mg/kg (% TRR)
Cycloxydim 0.32 (3.8) 0.08 (1.8) n.d. n.d. cycloxydim-TSO 6.14 (72.4) 1.47 (33.5) n.d. 0.023 (3.5) cycloxydim-TSO2 0.87 (10.3) 0.88 (20.0) 0.18 (13.9) n.d. cycloxydim-T1SO n.d. n.d. n.d. 0.014 (2.2) cycloxydim-T2SO n.d. n.d. 0.14 (10.8) 0.005 (0.9) cycloxydim-T2SO2 n.d. n.d. 0.007 (5.5) 0.0026 (4.0) cycloxydim-T1SO2 n.d. n.d. n.d. 0.013 (2.0) Polar n.d. n.d. n.d. 0.022 (3.3)
Sugar beet plants (variety Victoria) were grown in a loamy sand soil under natural Limburgerhof conditions (Veit, 2002a). Cycloxydim was applied in form of the EC formulation to the plants at a rate of 650 g ai/ha 2 months after sowing (BBCH growth stage 17/18, before row closure). Samples were taken 1 day after treatment and at crop maturity (94 DAT). TRR radioactive residues were determined after combustion. The samples were extracted with methanol and water followed by ammonia treatment. For further characterisation of the radioactivity present in the methanol extracts liquid/liquid partition experiments were performed with dichloromethane and ethyl acetate at two different pH values. The mature sugar beet leaf sample was additionally extracted with methanol/aqueous buffer solution for quantitation of cycloxydim-TSO. In sugar beet root (94 DAT) the residual radioactive residues (post extraction solid) were further analysed by treatment with an aqueous ammonia solution. Identification of metabolites was based on LC-MS and HPLC retention time. A very polar peak detected in ripe roots was characterized by yeast digestion.
TRRs and extraction behaviour are summarized in Table 20. One day after application, 24 mg/kg and 4 mg/kg were detected in tops and roots, mostly extracted in methanol. These levels decreased considerably at 94 DAT. Up to 12.2%TRR remained unextracted in both samples at harvest.
Table 20 Sugar beet total radioactive residues and extraction behaviour
Matrix (DAT)
TRR a MeOH Extract Aqueous Extract ERR Residue (RRR) [mg/kg] [mg/kg] [% TRR] [mg/kg] [% TRR] [mg/kg] [% TRR] [mg/kg] [% TRR]
Leaf (1 DAT) 24.0 22.83 95.1 0.572 2.4 23.40 97.5 0.594 2.5
Root (1 DAT) 3.98 3.86 96.8 0.083 2.1 3.94 98.9 0.044 1.1
Leaf (94 DAT) 2.236 1.98 88.6 0.100 4.5 2.081 93.1 0.155 6.9
Root (94 DAT) 0.116 0.093 80.5 0.008 7.3 0.101 87.8 0.014 12.2

Cycloxydim
277
a TRR calculated: TRR = ERR + RRR
The methanol extracts were further characterized by liquid/liquid partition experiments. One
day after treatment, most of the radioactivity was found in the dichloromethane phase (Table 21). At harvest, the amounts of radioactivity in the dichloromethane phase significantly decreased in roots (13.7%); the ethyl acetate phases accounted for approximately 20% of the TRR. The highest concentrations were detected in the aqueous phase (44.7% TRR).
Table 21 Sugar beet: Partition behaviour
Plant Matrix (DAT)
MeOH, mg/kg
DCM, a mg/kg (% TRR)
Ethyl acetate (pH 7), mg/kg (% TRR)
Ethyl acetate (pH 2), mg/kg (% TRR)
Water, mg/kg (% TRR)
Leaf (1 DAT) 22.831 15.221 (63.4) 0.982 (4.1) 1.986 (8.3) 4.659 (19.4) Root (1 DAT) 3.856 3.278 (82.3) 0.124 (3.1) 0.282 (7.1) 0.179 (4.5) Leaf (94 DAT) 1.981 0.198 (8.8) 0.129 (5.8) 0.311 (13.9) 1.296 (58.0) Root (94 DAT) 0.093 0.016 (13.7) 0.006 (4.9) 0.018 (15.7) 0.052 (44.7) a Dichloromethane
A summary of the metabolites identified in the extracts is shown in Table 22. Cycloxydim
was not detected in any of the samples taken. One day after treatment, residues mainly consisted of the oxidation products cycloxydim-TSO (sulfoxide) and cycloxydim-TSO2 (sulphone). At harvest, both metabolites were still present, but the predominant metabolites were formed by cleavage of the oxime ether side chain. Metabolites as the imines cycloxydim-T1SO, cycloxydim-T1SO2 and cycloxydim-T2SO were present in amounts greater than 10% of the TRR. The subsequent cleavage of the cyclohexenone ring system resulted in the glutaric acid cycloxydim-TGSO2 which was detected in all samples investigated. In the samples harvested at crop maturity, a very polar peak eluting with the void volume from the HPLC column was identified as sugar (most likely as [14C] glucose). No hydroxylation in position 5 of the cyclohexenone ring system was observed.
Table 22 Identification and characterisation of extractable radioactivity in sugar beet samples
Metabolite Tops (1 DAT) Roots (1 DAT) Tops (94 DAT) Roots (94 DAT) mg/kg (% TRR) mg/kg (% TRR) mg/kg (% TRR) mg/kg (% TRR)
cycloxydim-TSO 7.584 (31.6) 2.392 (60.1) 0.049 (2.1) 0.008 (7.3) cycloxydim-TSO2 3.863 (16.1) 0.710 (17.8) 0.017 (0.7) 0.002 (1.8) cycloxydim-T1SO 3.327 (13.9) 0.029 (0.7) 0.423 (18.9) 0.017 (14.5) cycloxydim-T2S 2.746 a (11.4) 0.392 a (9.8) 0.306 (13.7) 0.001 (1.0) cycloxydim-T1SO2 0.118 (5.2) 0.005 (4.7) cycloxydim-TGSO2 1.734 (5.7) 0.034 (0.8) 0.160 (7.1) 0.010 (8.8) Sugar fraction n.d. n.d. 0.002 (0.1) 0.010 (8.8) a Due to peak overlapping in the HPLC chromatograms, the sum is given n.d.=not detected
Soya beans
The metabolism of [14C] cycloxydim in soya beans was investigated by Huber and Hamm (1986a) using four different treatment groups. In three trials, the EC formulation at 0.2 kg ai/ha was applied to the plant (variety: SRF 450) two to eight weeks after sowing and cultivated in a growth chamber in a mixture of Limburgerhof soil and peat. In one trial, the soya bean plants (variety: Pfitzer) were treated with 1 kg ai/ha two months after sowing and cultivated in a greenhouse located in a mixture of Limburgerhof soil and peat.
Plant and straw samples taken were extracted with aqueous methanol. Seed samples extraction was first performed with hexane (for defatting) followed by methanol extraction. The aqueous methanol extracts were adjusted to pH = 9 and evaporated. The remaining aqueous extracts were partitioned between dichloromethane and water. After acidification (pH = 2) a further partition was performed. The remaining aqueous phase of plant and straw samples was evaporated to dryness

Cycloxydim
278
prior to methylation and liquid/liquid partition to convert metabolites as cycloxydim-TGSO2 in the corresponding methyl esters. For the characterisation of the residual radioactive residue after solvent extraction, several procedures were used, including acid and/or base digestion and refluxing and derivatisation with phenyl hydrazine (cellulose, lignin). The remaining aqueous phase from seed samples was concentrated, adjusted to pH 2 and partitioned between ethyl acetate and water. Another aliquot of the aqueous MeOH extract was used for a precipitation reaction with phosphoric acid, selective for proteins. Identification of metabolites was based on radio-TLC analysis of the dichloromethane phase (seed), LC-MS and HPLC.
TRR of the different treatment groups calculated from the extractable residue (ERR) and the non-extractable residue (RRR) are summarized in Table 23. In most plant samples, more than 85% of the TRR were extracted with aqueous methanol. Only minor amounts of radioactivity were soluble in hexane, which was used for removing fats from the seeds. In case of straw, slightly lower amounts were dissolved in aqueous methanol (approximately 70% of the TRR). Organo soluble metabolites were only predominant in plant samples taken 0 DAT. At later sampling intervals, considerable amounts of radioactivity were detected in the aqueous phase. In straw, about 50% of the TRR were found in these phases whereas for seeds about 20% were characterized as aqueous solubles (Table 24).
Table 23 Soya bean total radioactive residues and extraction behaviour
Plant Matrix TRR a Hexane Extracts MeOH Extracts RRR (DAT) [mg/kg] mg/kg (% TRR) [mg/kg] [% TRR] [mg/kg] [% TRR] Treatment group 1 (V 43/84): 0.2 kg ai/ha Plant (0 DAT) 11.11 n.a. 10.86 97.7 0.25 2.3 Plant (7 DAT) 8.47 n.a. 8.06 95.2 0.41 4.8 Straw (45 DAT) 12.52 n.a. 9.83 78.5 2.69 21.5 Seed (45 DAT) 20.03 0.35 (1.7) 18.31 91.4 1.37 6.8 Treatment group 2 (V 45/84): 0.2 kg ai/ha Plant (0 DAT) 43.65 n.a. 42.51 97.4 1.14 2.6 Plant (35 DAT) 3.27 n.a. 2.79 85.3 0.48 14.7 Straw (71 DAT) 0.76 n.a. 0.54 71.1 0.22 28.9 Seed (71 DAT) 2.30 0.12 (5.2) 2.06 89.6 0.12 5.2 Treatment group 3 (V 45/84A): 0.2 kg ai/ha Plant (0 DAT) 16.61 n.a. 16.44 99.0 0.17 1.0 Plant (7 DAT) 6.46 n.a. 6.00 92.9 0.46 7.1 Plant (14 DAT) 3.32 n.a. 2.90 87.3 0.42 12.7 Plant (21 DAT) 2.88 n.a. 2.48 86.1 0.40 13.9 Plant (40 DAT) 0.72 n.a. 0.61 84.7 0.11 15.3 Leaves (82 DAT) 5.63 n.a. 4.08 72.5 1.55 27.5 Stalks (82 DAT) 0.31 n.a. 0.22 71.0 0.09 29.0 Pods (82 DAT) 0.53 n.a. 0.36 67.9 0.17 32.1 Seeds (82 DAT) 0.46 0.02 (4.4) 0.39 84.8 0.05 10.9 Treatment group 4 (V 49/84): 1 kg ai/ha Straw (69 DAT) 91.00 n.a. 73.10 80.3 17.90 19.7 Seeds (69 DAT) 38.40 0.09 (0.3) 37.62 98.0 0.69 1.8 a TRR calculated: TRR = ERR + RRR, ERR: extractable radioactive residue, RRR: residual radioactive residue n.a. Not applicable
Table 24 Soya bean partition behaviour
Plant Matrix MeOH DCM (pH 9) DCM (pH 2) Aqueous Phase (DAT) [mg/kg] [mg/kg] [% TRR] [mg/kg] [% TRR] [mg/kg] [% TRR] Treatment group 1 (V 43/84): 0.2 kg ai/ha Plant (0 DAT) 10.86 0.35 3.2 9.45 85.1 0.42 3.8 Plant (7 DAT) 8.06 0.68 8.0 5.10 60.2 1.74 20.5 Straw (45 DAT) 9.83 1.28 10.2 1.11 8.9 6.64 53.0 Seed (45 DAT) 18.31 8.86 44.2 4.47 22.3 3.59 17.9 Treatment group 2 (V 45/84): 0.2 kg ai/ha Plant (0 DAT) 42.51 2.89 6.6 33.58 76.9 1.54 3.5

Cycloxydim
279
Plant Matrix MeOH DCM (pH 9) DCM (pH 2) Aqueous Phase (DAT) [mg/kg] [mg/kg] [% TRR] [mg/kg] [% TRR] [mg/kg] [% TRR] Plant (35 DAT) 2.79 0.37 11.3 0.81 24.8 1.36 41.6 Straw (71 DAT) 0.54 0.04 5.3 0.06 7.9 0.41 53.9 Seed (71 DAT) 2.06 0.16 7.0 0.75 32.6 0.35 15.2 Treatment group 3 (V 45/84A): 0.2 kg ai/ha Plant (0 DAT) 16.44 1.19 7.2 14.02 84.4 0.66 4.0 Plant (7 DAT) 6.00 0.78 12.1 3.41 52.8 1.58 24.5 Plant (14 DAT) 2.90 0.34 10.2 1.14 34.3 0.97 29.2 Plant (21 DAT) 2.48 0.29 10.1 0.71 24.7 1.09 37.9 Plant (40 DAT) 0.61 0.05 6.9 0.14 19.4 0.40 55.6 Leaves (82 DAT) 4.08 0.67 11.9 0.27 4.8 3.21 57.0 Stalks (82 DAT) 0.22 - - 0.02 6.5 0.18 58.1 Pods (82 DAT) 0.36 0.05 9.4 0.05 9.4 0.19 35.9 Seeds (82 DAT) 0.39 0.10 21.7 0.13 28.3 0.11 23.9 Treatment group 4 (V 49/84): 1 kg ai/ha Straw (69 DAT) 73.10 12.80 14.1 11.80 13.0 48.30 53.1 Seeds (69 DAT) 37.62 2.47 6.4 22.63 58.9 6.75 17.6
Straw from treatment group 4 was used for the characterisation of the non-extracted radioactivity (RRR), which corresponded to 19.7%TRR. Most of the radioactivity released was found in the lignin fractions (67.8%).
The parent molecule was detected only at the day of application (Tables 25–28). It rapidly degraded and formed various metabolites. Hydroxylated metabolites were a major part of the radioactivity identified in seed. For plant and straw, the aqueous phases after partition were predominant at later sampling intervals. In treatment group 4, incorporation into the protein pool occurred to a low extent (2.03 mg/kg, 5.3% TRR).
Table 25 Identification and characterisation of the extractable radioactivity in soya bean samples (treatment group 1, 0.2 kg ai/ha), mg/kg (% TRR)
Metabolite Plant (0 DAT) Plant (7 DAT) Straw (45 DAT) Seeds (45 DAT) Cycloxydim 1.40 (12.6) n.d. n.d. n.d. cycloxydim-TSO 8.03 (72.3) 4.13 (48.7) 1.30 (10.4) 2.38 (11.9) cycloxydim-TSO2 n.d. 0.32 (3.8) n.d. 0.24 (1.2) cycloxydim-T1SO n.d. n.d. 0.22 (1.8) 0.65 (3.2) cycloxydim-T1SO2 0.09 (0.8) 0.27 (3.2) 0.26 (2.0) 0.19 (0.9) cycloxydim-T2SO 0.05 (0.5) 0.30 (3.5) 0.85 (7.7) 3.70 (18.5) cycloxydim-T2SO2 n.d. 0.14 (1.7) 0.32 (2.6) 0.95 (4.7) cycloxydim-5-OH-TSO n.d. n.d. 0.26 (2.1) 1.28 (6.4) cycloxydim-5-OH-TSO2 n.d. n.d. n.d. 0.90 (4.5) cycloxydim-6-OH-T2SO n.d. n.d. n.d. 0.88 (4.4) cycloxydim-6-OH-T2SO2 n.d. n.d. n.d. 0.90 (4.5) cycloxydim-TGSO a n.p. 0.3 (3.5) 1.63 (13.0) n.p. cycloxydim-TGSO2 a n.p. 0.18 (2.1) 0.96 (7.7) n.p. Aqueous phase, polar n.p. 0.77 (9.1) 3.22 (25.7) n.p.
n.d .= Not detected n.p .= Further characterisation/methylation not performed a determined as methyl ester.
Table 26 Identification and characterisation of the extractable radioactivity in soya bean samples (treatment group 2, 0.2 kg ai/ha), mg/kg (% TRR)
Metabolite Plant (0 DAT) Plant (35 DAT) Seeds (71 DAT) Cycloxydim 0.09 (0.2) n.d. n.d. cycloxydim-TSO 35.11 (80.4) 0.70 (21.4) 0.42 (18.3) cycloxydim-TSO2 n.d. 0.16 (4.9) 0.07 (3.0) cycloxydim-T1SO 0.41 (0.9) 0.06 (1.8) 0.02 (0.9) cycloxydim-T1SO2 n.d. 0.04 (1.2) n.d.

Cycloxydim
280
Metabolite Plant (0 DAT) Plant (35 DAT) Seeds (71 DAT) cycloxydim-T2SO 0.86 (2.0) 0.07 (2.2) 0.11 (4.8) cycloxydim-5-OH-TSO n.d. 0.11 (3.4) 0.20 (8.7) cycloxydim-5-OH-TSO2 n.d. n.d. 0.26 (11.3)
Table 27 Identification and characterisation of the extractable radioactivity in unripe soya bean plant samples (treatment group 3, 0.2 kg ai/ha), (% TRR)
Metabolite 0 DAT 7 DAT a 14 DAT 21 DAT 40 DAT a Cycloxydim 0.11 (0.7) n.d. n.d. n.d. n.d. cycloxydim-TSO 14.60 (87.9) 0.10 (1.5) 1.09 (32.8) 0.67 (23.3) 0.14 (19.4) cycloxydim-TSO2 n.d. n.d. 0.08 (2.4) 0.06 (2.1) n.d. cycloxydim-T1SO 0.15 (0.9) 0.33 (5.1) 0.16 (4.8) 0.11 (3.8) n.d. cycloxydim-T1SO2 0.10 (0.6) 0.06 (0.9) 0.02 (0.6) 0.02 (0.7) n.d. cycloxydim-T2SO 0.25 (1.5) 0.11 (1.7) 0.06 (1.8) 0.04 (1.4) n.d. a Only one DCM phase was investigated/reported
Table 28 Identification and characterisation of the extractable radio-activity in ripe soya bean samples
Metabolite Group 3, 0.2 kg ai/ha, mg/kg (% TRR) Group 4, 1 kg ai/ha, mg/kg (% TRR) Leaves (82 DAT) Seeds (82 DAT) Straw (69 DAT) Seeds (69 DAT)
cycloxydim-TSO 0.27 (4.8) 0.078 (17.0) 9.67 (10.6) 10.29 (26.8) cycloxydim-TSO2 n.d. 0.012 (2.6) 3.18 (3.5) 2.75 (7.2) cycloxydim-T1SO 0.12 (2.1) n.d. 1.66 (1.8) 0.08 (0.2) cycloxydim-T1SO2 0.06 (1.1) 0.003 (0.7) 1.62 (1.8) 0.05 (0.1) cycloxydim-T2SO 0.29 (5.2) 0.029 (6.3) 3.25 (3.6) 0.65 (1.7) cycloxydim-T2SO2 n.d. 0.30 (0.8) cycloxydim-5-OH-TSO n.d. 0.041 (8.9) n.d. 8.35 (21.8) cycloxydim-5-OH-TSO2 n.d. 0.055 (12.0) n.d. 5.80 (15.1) cycloxydim-6-OH-T2SO n.d. 0.05 (0.1) cycloxydim-6-OH-T2SO2 n.d. 0.28 (0.7) cycloxydim-TGSO 17.3 (19.0) n.p. cycloxydim-TGSO2 8.3 (9.1) n.p. Remaining aqueous phase 17.3 (19.0) n.p. Polar metabolites 23.4 (25.7) n.p.
For additional characterisation, selected extracts, phases and samples were subjected to a comparable oxidation procedure. The results confirm the findings and the identification of the metabolites (Table 29).
Table 29 Characterisation of the extracted radioactivity by derivatisation (oxidation and methylation), mg/kg (% TRR)
Plant a 0 DAT
Plant a 7 DAT
Plant a 45 DAT
Seed b 69 DAT
Straw b 69 DAT
TRR 11.11 8.47 12.52 17.72 91.00 Radioactivity in extract/phase/sample 10.86 (97.6) 8.06 (95.2) 9.83 (78.5) 17.72 (100) 48.3 (53.1) Radioactivity after oxidation procedure 10.82 (97.2) 8.16 (96.3) 9.65 (77.1) 17.33 (97.8) 48.00 (52.7) Organo solubles after methylation 9.43 (84.7) 7.52 (88.8) 7.40 (59.1) 13.11 (74.0) 32.1 (35.3) cycloxydim-T-DME 9.32 (83.7) 6.96 (82.2) 6.66 (53.2) 10.13 (57.2) 26.6 (29.2) cycloxydim-OH-TDME n.d. 0.56 (6.6) 0.74 (5.9) 2.44 (13.8) 3.90 (4.3) Remaining aqueous phase 0.62 (5.6) 0.54 (6.4) 1.18 (10.2) 2.45 (13.8) 11.00 (12.1) a Treatment group 1 b Treatment group 4

Cycloxydim
281
Tolerant maize
The metabolism of cycloxydim in maize (variety: Scarlet) was investigated using two different use patterns (Hofmann, 1997a,b; Bross, 1998a). In the first study, cycloxydim was applied as an EC formulation at a rate of 0.4 kg ai/ha at BBCH growth stage 22-23 (4–5 leaves unfolded). In the second study the post emergence application was performed with an exaggerated rate (0.8 kg ai/ha) during flowering (BBCH 61-67). In both studies, the maize plants were grown in pots filled with loamy sand in a chamber simulating the climate at 50 ° latitude. At harvest, the plant samples were separated into leaves, straw, flags, cobs and seeds. After homogenisation, TRR was determined by combustion analysis. The sample material was extracted with methanol, water, and mixtures thereof. Prior to methanol extraction, grain was defatted with cyclohexane. The methanol and the aqueous extracts were further characterized by liquid/liquid partition with ethyl acetate at two different pH values (neutral, acid).
The identification and characterisation of extractable radioactivity was based on LC-MS of isolated fractions or methylation products and HPLC retention time. During the study, an accountability experiment was performed using the ethyl acetate phases (neutral, acid) of straw and grain (0.8 kg ai/ha) to determine the amounts of organo soluble radioactivity covered by the common moiety method 407, which includes the oxidation of oxydim and its metabolites to cycloxydim-TGSO2 and cycloxydim-5-OH-TGSO2. Selected aqueous phases were incubated with a mixture of β-glucosidase and hesperidinase. The non-released radioactivity was characterized by ammonia extraction and enzyme treatment. The data are summarized in Table 30. In the normal use rate, residue levels in the harvest samples ranged from 0.060 to 0.168 mg/kg and in the exaggerated rate samples, the TRRs were considerably higher. ERR ranged from 63.7 to 86.1% TRR for the exaggerated rate and higher than 60% TRR only for forage
Table 30 Tolerant maize: Total radioactive residues and extraction behaviour
Plant Matrix TRR a Hexane MeOH Aqueous ERR RRR
(DAT) [mg/kg] [mg/kg] (% TRR)
[mg/kg] (% TRR)
[mg/kg] (% TRR) [mg/kg] [% TRR] [mg/kg] [%
TRR] Normal use rate: 0.4 kg ai/ha Forage (72 DAT) 31.381 n.a. 25.0 (79.8) 2.78 (8.9) 27.818 88.7 3.564 11.4
Grain (96 DAT) 0.123 0.007 (6.1) 0.012 (9.2) 0.011 (8.9) 0.030 24.2 0.094 75.9
Straw (96 DAT) 0.168 n.a. 0.087(52.2) 0.011(6.6) 0.098 58.8 0.069 41.1 Husks (96 DAT) 0.118 n.a. 0.033(28.5) 0.007(5.9) 0.040 34.4 0.076 64.6 Cobs (96 DAT) 0.060 n.a. 0.017(29.4) 0.003(3.9) 0.020 33.3 0.040 66.0 Exaggerated use rate: 0.8 kg ai/ha Grain (54 DAT) 4.928 0.37 (7.6) 2.54 (51.6) 1.33 (26.9) 4.236 86.1 0.693 14.1 Straw (54 DAT) 13.023 n.a. 8.96 (68.8) 1.63 (12.4) 10.590 81.2 2.433 18.7 Husks (54 DAT) b 9.478 n.a. 7.180 (75.8) 2.298 24.2 Cobs (54 DAT) b 4.296 n.a. 2.735 (63.7) 1.560 36.3 a TRR calculated: TRR = ERR + RRR, ERR: Extractable radioactive residue, RRR: Residual radioactive residue b Extraction was performed with methanol/water (1:1) n.a.= Not applicable
The methanol and/or aqueous extracts of selected samples were partitioned between water
and ethyl acetate at neutral and acid pH. In case of grain and forage, the organo soluble metabolites were predominant whereas for straw most of the radioactivity was found in the aqueous phase (Table 31).
Table 31 Tolerant maize: Partition behaviour
Plant Matrix Organo Soluble Aqueous Soluble (DAT) mg/kg % TRR mg/kg % TRR Normal use rate: 0.4 kg ai/ha Forage (72 DAT) 13.912 44.3 11.483 36.6 Grain (96 DAT) 0.020 16.1 0.012 9.1 Straw (96 DAT) 0.028 16.1 0.059 34.9

Cycloxydim
282
Plant Matrix Organo Soluble Aqueous Soluble (DAT) mg/kg % TRR mg/kg % TRR Exaggerated use rate: 0.8 kg ai/ha Grain (54 DAT) 2.716 55.1 1.588 32.2 Straw (54 DAT) 4.353 33.6 6.186 47.5
In Table 32, the results of the attempts to solubilise the residual radioactive residues (RRR) are summarized. From 4.3 to 8.4% TRR was solubilised by ammonia extraction. HPLC analysis of these extracts showed that they consisted of the same metabolites as the methanol and aqueous extracts. Treatment with the starch cleaving enzymes amyloglucosidase (to glucose) and amylase (to maltose and iso-maltose) 57.0% TRR could be dissolved from the grain RRR. In the case of straw (400 g ai/ha), An additional 22.6% TRR was dissolved by NaOH extraction, specific to lignin and cellulose, from straw. Most of the non-organoextractable radioactivity was associated with carbohydrates. Up to 18.6% TRR still remained unextracted in grain.
Table 32 Characterisation of non-released radioactivity in tolerant maize
0.4 kg ai/ha, mg/kg (% TRR) 0.8 kg ai/ha, mg/kg (% TRR) Forage Grain Straw Grain Straw a RRR 3.564 (11.4) 0.094 (75.9) 0.069 (41.1) 0.693 (14.1) 1.580 (17.3) Ammonia 1.355 (4.3) 0.008 (6.1) 0.014 (8.4) 0.352 (7.2) 0.681 (7.5) Amyloglucosidase n.a. 0.043 (34.4) n.a. n.a. n.a. Amylase n.a. 0.028 (22.6) n.a. n.a. n.a. NaOH n.a. n.a. 0.038 (22.6) n.a. n.a. Final residue 2.182 (7.0) 0.023 (18.6) 0.016 (9.5) 0.328 (6.7) 0.812 (8.9) n.a. Not applicable a Additional work-up
The identified metabolites of both treatment groups are shown in Table 33. Cycloxydim was
rapidly and extensively metabolized in all samples under investigation and was not detected in any sample. The metabolite patterns were qualitatively similar for the different application rates. In the exaggerated rate grain sample, metabolites cycloxydim-TSO and cycloxydim-TSO2 were the most prominent peaks in the HPLC chromatogram. In all normal use rate samples except forage, the most prominent peak was very polar and eluted with the void volume from the HPLC column. All other metabolites were only present in trace amounts. The metabolites formed were further degraded. It could be shown that incorporation into the carbohydrate pool occurred.
Table 33 Identification and characterisation of the radioactivity in cycloxydim tolerant maize
0.4 kg ai/ha, mg/kg (% TRR) 0.8 kg ai/ha, mg/kg (% TRR) Metabolite Forage Grain Straw Husks Grain Straw Husks Cobs cycloxydim-TSO 1.34 (4.3) 0.001 (0.6) n.d. n.d. 0.529 (10.6) 0.288 (1.6) 0.106 (1.1) 0.025 (0.6) cycloxydim-TSO2 1.13 (3.6) 0.0 (0.4) n.d. n.d. 0.352 (7.0) n.d. 0.076 (0.8) 0.020 (0.5) cycloxydim-5-OH-T1SO n.d. + T1SO2
0.001 (1.0) n.d. n.d. 0.383 (7.7) n.d. n.d. n.d.
cycloxydim-6-OH-T2SO/T2SO2 n.d. 0.001 (0.8) n.d. n.d. 0.241 (4.8) n.d. 0.890 (9.4) 0.324 (7.6)
cycloxydim-T1SO 3.61 (11.5) 0.001(0.5) 0.003(1.8) n.d. + T2SO2 0.712(14.2) 1.33 (7.3) 0.750(7.9) 0.226(5.3)
cycloxydim-T1SO2 2.32 (7.4) +5-OH-T1SO
0.001(1.0) 0.004(2.5) n.d. 0.263(5.2) 1.77 (9.8) 0.503(5.3) 0.163(3.8)
cycloxydim-T2SO 1.28 (4.1) 0.000(0.3) 0.002(1.3) n.d. 0.238(4.8) 0.863(4.8) 1.28 (13.5) 0.217(5.0) cycloxydim-T2SO2 n.d. 0.000(0.2) n.d. n.d. + T1SO
0.712(14.2) n.d. n.d. n.d.
cycloxydim-TGSO 2.37 (7.5) n.d. 0.015(8.7)
n.d. n.d. 1.25 (6.9) 0.331(3.5) 0.20(4.7) cycloxydim-TGSO2 1.28 (4.1) n.d. n.d. n.d. 1.09 (6.0) 0.350(3.7) 0.153(3.6)
n.d. Not determined

Cycloxydim
283
Cycloxydim is degraded by mainly four key transformation steps:
(a) Oxidation at the sulphur of the thiopyrane ring to the sulfoxide and to the sulphone
(b) Cleavage of the oxime ether group (loss of the alkyl side chain)
(c) Hydroxylation at the 5-position of the cyclohexenone ring system
(d) Oxidative cleavage of the cyclohexenone ring resulting in substituted glutaric acid derivatives.
The combination of these reactions, together with the presumably non-enzymatic Beckmann rearrangement leads to a huge number of metabolites. In addition to the parent molecule, eight of them were present in amounts > 0.050 mg/kg and 10% TRR. The proposed metabolic pathway of cycloxydim in plants is shown in Figure 3.
Environmental fate and behaviour in soil
Degradation under aerobic conditions
The aerobic degradation and metabolism of [14C] cycloxydim was studied in a loamy sand (Speyer standard soil; 84% sand, 8% silt, 6.1% humus, 13.8 mVal/100 g cation exchange capacity (CAC), 6.1 pH, 40% maximum water holding capacity (MWC), 26.7 mg C/100 g dry soil) (Huber, 1987a). A 10 mg/kg dry soil was used, equivalent to a maximum single application rate of about 7.5 kg ai/ha, and to a multiple dose of 0.6 kg ai/ha. The soil was incubated at 22 ± 2 °C for 90 day. The soil samples were extracted with dichloromethane (DCM), water and methanol and the extracts analysed by radio-TLC.
Most of the radioactivity was found in the DCM extracts. The distribution of radioactivity (sum of DCM and methanol extracts) over the total incubation period is shown in Table 34. About 14% of the total radioactive residue (TRR: radioactivity in the extract + residual radioactive residues) was detected as cycloxydim at day 0, decreasing to less than 1%TRR after 14 days. A half-life of 3 days was estimated. Two peak clusters were attributable, one to the series cycloxydim-TSO/ cycloxydim-T1SO/ cycloxydim-T2SO, the other to cycloxydim-T1S/ cycloxydim-T2S/ cycloxydim-TSO2. Mass spectrometry, after HPLC purification, showed that the peak cluster 1 of the 56 day DCM extract consisted mainly of cycloxydim-TSO and cycloxydim-T2SO. Bound residues accounted for about 40% TRR after three months and mineralization rate to CO2 was 38% TRR.
Table 34 % TRR (total radioactive residue) and distribution of metabolites after application of [14C] cycloxydim to loamy sand soil and incubation under aerobic conditions
DAT, days 14CO2 Cycloxydim
Peak cluster 1 a (TSO, T1SO, T2SO)
Peak cluster 2 b (T1S, T2S, TSO2)
cycloxydim-T2SO2
TLC-start
b H2O-extract
Bound residues Total
0 0.0 14.1 31.9 5.8 0.0 10.4 8.0 8.9 79.1 1 0.0 9.5 44.6 6.4 0.0 9.8 7.1 10.7 88.1 3 0.4 4.6 49.1 0.3 0.0 10.9 7.7 12.9 85.9 7 2.6 1.2 49.7 0.0 0.0 10.1 9.5 18.4 91.5 14 8.9 0.9 28.9 2.1 2.3 17.2 11.7 19.9 91.9 28 18.1 0.8 28.7 2.7 4.0 16.2 12.6 23.7 106.8 56 29.5 0.0 16.0 0.0 4.9 13.9 13.6 40.0 117.9 90 38.1 0.0 24.3 0.0 9.7 4.7 9.1 38.8 124.7 a Peaks in each cluster could not be separated unambiguously on TLC b Radioactivity remained at start of TLC (Rf = 0)
The degradation and mineralisation of [14C] cycloxydim was studied in two freshly collected
field soils, a loamy sand (Limburgerhof; 0.52% OC, 14.8 mVal/100 g CAC, 15.9% microbial biomass) and a loam soil (Ruchheim; 1.54% OC, 5.2 mVal/100 g CAC, 85.7% microbial biomass)

Cycloxydim
284
(Huber, 1988a). Nominal application rate, study condition and sample extraction procedure were the same as in the previous study (Huber, 1987a).
Figure 3 Metabolic pathway of cycloxydim in plants; *cycloxydim
S
OH
O
CH3
NH
O
S
O
O
N
OO
CH3
S
O
O
N
O
CH3
S
O
O
N
O
OH
CH3
S
O
O
N
OH
OO
CH3
S
OH
O
CH3
NH
O O
S
CO2H
CO2H
OO
S
O
O
NOH
S
O
O
NOH
S
O
O
NOH
OS
O
O
NOH
O
S
O
O
N OH
OO S
O
O
NOH
OO
S
O
O
NOH
O
OH
S
O
O
NOH
O
OH*T1S
*T2SO
*6-OH-T2SO2
*T1SO2
*TGSO
*TGSO2
Carbohydrates, Bound Residues
*5-OH-TSO2
Cycloxydim
EZ
E (main isomerin maize) Z (main isomer
in sugar beet)
EZ
Z (main isomerin sugar beet)
E (mainisomerin maize)
(soybean)
(soybean,maize)
(soybean,maize)
(soybean,maize,sugar beet)
(soybean,maize,sugar beet)
(soybean,maize,sugar beet)
(soybean,maize,sugar beet)
E-isomeronly
E and Z-isomer
E and Z-isomer
E and Z-isomer
E and Z-isomer
*6-OH-T2SO(soybean,maize)
*T2SO2(soybean,maize)
*5-OH-TSO(soybean)
*TSO2(soybean)
*TSO(soybean)

Cycloxydim
285
The distribution of radioactivity over the 90 day overall incubation period is shown in Table 35. Only the dichloromethane extracts were analysed by radio-TLC as radioactivity in the water and methanol extracts were low. Cycloxydim accounted for over 90% TRR at day 0, decreasing to 4.6%TRR at day 21 in loamy sand field soil and to 0%TRR in loam soil. To differentiate between cycloxydim-TSO and cycloxydim-T2SO a partition experiment of the DCM residues of the 7 d sample (loamy sand and loam) between water and ethylacetate in alkaline pH was performed. Cycloxydim-TSO is a "vinylogous" acid and remained in the water phase whereas cycloxydim-T2SO would be extracted into the organic phase. By this procedure it could be shown that cluster 1 consisted mainly (≥ 90%) of cycloxydim-TSO.
Table 35 % TRR (total radioactive residue) and distribution of metabolites after application of [14C] cycloxydim to a loamy sand field soil and incubation under aerobic conditions
DAT 14CO2 Cycloxydim Peak cluster 1
a (TSO, T1SO, T2SO)
T1SO2 Peak cluster 2
a (TSO2, T2SO2)
Peak cluster 3 a (T1S, T2S)
TLC-start b
MeOH-extract
H2O-extract
Bound residues
Total
Loamy sand field soil 0 0.0 91.7 2.7 0.9 0.0 2.1 1.5 0.5 0.3 0.1 99.8 7 0.4 14.6 39.4 0.0 0.0 0.0 13.4 5.1 7.8 13.9 94.6 21 3.6 4.6 39.5 0.0 2.7 0.0 2.4 10.9 11.7 17.9 93.3 43 16.1 0.0 18.6 0.0 5.5 0.0 9.2 9.0 9.9 23.2 91.5 90 36.2 0.0 11.1 1.1 3.0 1.7 4.2 1.9 7.4 30.7 97.3 Loam field soil 0 0.0 93.1 3.3 0.0 0.0 2.8 0.0 0.4 0.2 0.2 100.0 7 4.3 0.3 48.2 0.5 3.6 0.0 1.9 4.0 4.2 19.2 86.2 21 23.4 0.0 21.0 1.5 10.5 0.0 0.0 6.1 3.8 28.8 95.1 43 45.7 0.0 3.7 2.0 7.4 0.0 0.0 2.3 5.9 28.6 95.6 90 59.3 0.0 0.9 1.1 1.3 0.4 0.0 0.8 2.3 30.6 96.7 a Peaks in each cluster could not be separated unambiguously on TLC b Radioactivity remained at start of TLC (Rf = 0)
The aerobic soil degradation and metabolism of [14C] cycloxydim was investigated with
various batches of soils treated at 0.8 mg/kg dry soil (Bayer, H 2000a). The soils characteristics are shown in Table 36. The actual application rates (TAR = total applied radioactivity) were calculated as the sum of extractable radioactive residues (ERR) and non-extracted bound residues (RRR = residual radioactive residues) for each soil at day 0. The soils were incubated for 119 days in the dark at 20 °C and 40% maximum water holding capacity. A system with continuous aeration and trapping of volatiles was used. Soil samples were extracted with acetonitrile and acetonitrile/water (1:1) and the extracts analysed by radio-HPLC.
Table 36 Soil characteristics
LUFA 2.2 F20899 99/736/01
LUFA 2.2 F20899 99/736/02
Bruch West 99/060/01
Bruch West 99/060/02
Li 35 b 99/145/01
Li 35 b 99/145/02
Li 35 b 99/145/04
USDA scheme: (%)
loamy sand loamy sand sandy loam sandy loam loamy sand loamy sand loamy sand
< 2 µm (clay) 3.80 3.84 9.80 7.67 7.68 5.60 7.20 2–50 µm (silt) 16.57 14.98 25.05 29.36 19.31 16.09 20.5 50–2000 µm (sand)
79.62 81.18 65.14 62.97 73.0 78.31 72.2
German scheme: (%)
loamy sand loamy sand silty loam silty loam loamy sand loamy sand loamy sand
< 2 µm (clay) 5.39 7.08 8.07 9.88 6.31 7.29 5.1 2–63 µm (silt) 3.58 4.91 4.28 7.41 4.75 4.49 4.6 63–2000 µm (sand)
91.03 88.02 87.65 82.71 88.93 88.23 90.3
Organic carbon (%)
1.96 1.88 1.63 1.91 1.24 1.16 1.13
NO3-N (mg/100 g dry soil)
13.5 5.5 0.3 0.6 0.4 0.5 0.9

Cycloxydim
286
LUFA 2.2 F20899 99/736/01
LUFA 2.2 F20899 99/736/02
Bruch West 99/060/01
Bruch West 99/060/02
Li 35 b 99/145/01
Li 35 b 99/145/02
Li 35 b 99/145/04
NH4-N (mg/100 g dry soil)
0.9 1.5 0.7 0.5 0.7 0.8 0.5
pH (CaCl2) 5.4 5.6 7.2 7.5 6.5 6.5 6.6 CEC (mVal/100 g) 9.8 10.9 12.7 13.9 7.1 7.7 8.5 MWC (g H2O/100 g dry soil)
43.4 46.4 40.7 44.5 34.0 36.7 34.0
Microbial biomass (mg C/100 g dry soil)
36.0 29.4 27.9 22.4 26.8 18.8 20.2
The peak pattern of the soils Bruch West and Li 35 b was very similar (Table 37). The
degradation of cycloxydim was very fast in both soils, with less than 10% of the applied ai found at 0 DAT. The detected metabolites were identified by mass spectrometry and co-chromatography as cycloxydim-TSO, cycloxydim-TSO2, and cycloxydim-T2SO.
Table 37 % TAR (total applied radioactivity) and distribution of metabolites in soil after application of [14C] cycloxydim under aerobic conditions
DAT Cycloxydim
cycloxydim-TSO a
cycloxydim- T2SO
cycloxydim- TSO2
Unknown (3.6 min)
Others b (Sum)
Bound residues
Total
sandy loam (Bruch West) 0 8.5 86.7 0.1 – 1.6 1.3 1.9 100.1 1 0.1 87.3 4.7 – 2.7 3.2 6.2 104.2 3 – 72.3 2.3 4.7 3.0 3.2 6.4 91.9 7 – 49.7 0.6 7.4 4.4 6.7 7.9 76.7 14 – 35.6 6.8 8.9 4.9 2.6 15.1 73.9 30 – 17.0 4.6 7.4 4.8 1.9 19.7 55.4 60 – 6.3 0.8 2.8 4.4 0.8 22.5 37.6 93 – 2.6 0.3 0.9 5.0 0.6 19.2 28.6 119 – 1.9 0.3 0.3 4.7 1.0 22.0 30.2 loamy sand (Li 35 b) 0 9.9 87.1 0.1 – 0.9 0.9 1.1 100.0 1 – 90.4 3.8 – 2.8 4.3 4.1 105.4 3 – 79.9 4.1 2.9 2.2 2.3 5.4 96.8 7 – 61.7 3.0 4.1 2.8 2.6 10.7 84.9 14 – 31.4 5.3 9.5 5.3 2.9 12.3 66.7 30 – 17.0 2.5 4.1 5.7 2.3 17.4 49.0 60 – 5.4 1.3 1.5 5.6 1.0 21.8 36.6 93 – 2.6 – 0.3 5.7 1.1 17.7 27.4 119 – 1.7 – 0.2 4.6 1.4 21.1 29.0 a Sum of isomers b Each individual peak < 5% TAR at any sampling time
Soil Lufa 2.2 showed a slightly different peak pattern, with 17.9% TAR detected as
cycloxydim at day 0 (Table 38). Cycloxydim-TSO with its isomer was the major metabolite in all soils. A further study conducted in soil Bruch West under the same conditions indicated that the polar fraction at 3.6 min consisted of several compounds, each of them significantly below 5% TAR (Hassink, 2008a).
Table 38 Recovery of radioactivity in% TAR (total applied radioactivity) and distribution of metabolites after application of [14C] cycloxydim to a loamy sand (Lufa 2.2) and incubation under aerobic conditions
DAT Cycloxydim -TSO a
-T1SO -T2SO -
T1SO2 -T2SO2
-T1S -TSO2 -T2S Unknown (10.7 min)
Others b (Sum)
Bound residues
Total
0 17.9 57.0 2.4 0.3 – – 0.7 – 0.3 2.4 8.9 1.4 91.3 1 2.4 56.9 3.9 1.9 – – 0.2 1.1 – 2.9 9.5 5.4 84.2

Cycloxydim
287
DAT Cycloxydim -TSO a
-T1SO -T2SO -
T1SO2 -T2SO2
-T1S -TSO2 -T2S Unknown (10.7 min)
Others b (Sum)
Bound residues
Total
3 1.6 50.5 3.2 2.1 – – – 2.4 – 3.1 10.7 8.9 82.5 7 1.6 27.1 4.2 4.4 1.2 3.5 0.6 4.5 – 2.8 10.0 10.8 70.7 14 1.3 25.7 2.7 3.8 0.5 1.4 – 2.4 – 2.4 6.9 14.1 61.2 30 – 8.5 2.3 8.1 2.3 8.2 – 3.6 – 2.2 4.4 14.5 54.1 60 – 3.1 2.0 6.9 2.6 9.2 – 1.0 – 2.5 4.1 15.8 47.2 93 – 2.2 2.1 6.1 2.0 9.9 – 0.4 – 1.8 3.0 13.3 40.8 119 – 1.4 2.2 7.3 2.0 9.4 – 0.7 – 1.8 1.8 14.3 40.9 a Sum of isomers b each individual peak < 5% TAR at any sampling time
Due to technical problems with the incubation device, the mineralisation rates in the three
soils and accordingly the material balances could not be determined properly. Therefore, a second trial was started with the same soils and under the same incubation conditions but with a slightly modified incubation apparatus (Table 39). The mineralisation rates ranged from 42.3 to 53.7% TAR and the material balance from 84.5% to 100% TAR.
Table 39 Mineralisation rate and material balance after application of [14C] cycloxydim [% TAR] to three different soils
Sandy loam -Bruch West, TAR = 0.779 mg/kg
Loamy sand Li 35 b, TAR = 0.759 mg/kg
Loamy sand Lufa 2.2, TAR = 0.782 mg/kg
DAT TRR CO2 TRR CO2 TRR CO2 0 100.0 n.d. 100.0 n.d. 100.0 n.d. 7 83.6 8.1 76.5 14.0 76.2 15.3 14 68.8 21.1 61.1 30.7 65.2 27.2 30 51.5 36.1 45.3 44.1 49.0 35.5 60 43.4 48.0 39.7 50.2 45.1 40.4 93 35.7 52.4 36.0 52.2 43.6 41.9 119 34.5 53.7 34.0 52.7 46.4 42.3
TAR = total applied radioactivity (ERR + RRR 0 days) TRR = total radioactive residues n.d. = Not determined
In all three soils both the E-isomer and the Z-isomer of cycloxydim-TSO were detected
(Bayer, 2006a). However, only in one soil (Lufa 2.2) the Z-isomer of cycloxydim-TSO could be separated as pure peak by the HPLC system. It was shown that this isomer represented 3.4 to 6.7% TAR and could only be detected within the first 2 weeks after application.
Bayer (2000a) investigated the rate of degradation of cycloxydim and its metabolites in Bruch West, Li 35 b and Lufa 2.2 soils at 20 oC and 40% MWC in the laboratory in the dark. Soils were treated with 0.8 mg/kg dry, corresponding to an application rate of 0.6 kg/ha. Samples were taken at 0, 1, 3, 7, 14, 30, 60, 93 and 119 days after treatment and extracted with acetonitrile and acetonitrile/water. Extractability decreased from > 98% TAR to < 26.2%TAR at the end of the incubation period.
Half-lives were determined using a compartment model given in Figure 4. Degradation was very fast, with half-lives < 9 hours. Mineralization represented > 42%TAR at the end of the incubation period, and up to 22.5%TAR were bound residues. Half-lives of the main metabolites formed are given in Table 40. The metabolite T2SO2 was only observed in one out of three soils. But no degradation rate could be estimated.
Table 40 Degradation rate of cycloxydim metabolites in soil in the dark
DegT50 Bruch West Li 35 b Lufa 2.2 TSO [d] 10.6 10.1 9.3 TSO2 [d] 12.6 10.8 8.8 T2SO [d] 19.6 a 17.9 a 291.7 b

Cycloxydim
288
a Derived by conservative fit of the residues from the day of maximum concentration b Not significant
Figure 4 Compartment model considered in the kinetic evaluation
The proposed route of degradation of cycloxydim in aerobic soil considering also the different
isomers is shown in Figure 5.
Cycloxydim
TSO
T2SOTSO2
T2SO2
Sink
flow parent_TSO
flow parent_Sink
flow TSO_T2SO
flowT2SO_Sink
flowT2SO_T2SO2
flowTSO2_T2SO2
flowT2SO2_Sink
flowTSO2_Sink
flow TSO_Sink
flow TSO_TSO2

Cycloxydim
289
Figure 5 Proposed route of degradation of cycloxydim (BAS 517 H) in aerobic soil
O
OH
NH
S
S
O
OH
O
NH
S
O
OH
O O
NH
N
O
O
S
N
O
O
S
O
N
O
O
SO O
BH 517-T1S
BH 517-T1SO
BH 517-T1SO2
E/Z BH 517-TSO
BH 517-T2S
BH 517-T2SO
BH 517-T2SO2
CO2
and
Bound Residues
S
N
O
OOH
N
O
O
S
H O
E/Z Cycloxydim
SO
N
O
OOH
N
O
O
S
H O
O
N
O
OOH
S OO
N
O
O
S OO
H O
E/Z BH 517-TSO2
only E isomer
only E isomer
only E isomer

Cycloxydim
290
Photolysis on soil surface
The photolytic degradation of cycloxydim on soil surface was studied on a loamy sand soil (Speyer standard soil 2.2) using a Hanau Suntest apparatus equipped with a Xenon burner and a filter system suppressing UV light below 290 nm (Keller, 1985c). The soil was treated with 10 mg [14C] cycloxydim/kg dry, adjusted to 40% MWC and incubated at 30 ± 5 °C for 8 hours. Soil samples were extracted with dichloromethane and water and analysed by radio-TLC.
The formation of bound residues was in the same order of magnitude with and without irradiation (Table 41). Polar degradation products did not accumulate in the course of the study. Radioactive balance was between 86.5 and 108.5% TAR.
Table 41 Distribution of radioactivity in soil photolysis of [14C] cycloxydim [% TAR]
Irradiation time (hours) Cycloxydim
Peak cluster 1 a (-TSO, -T2SO)
Peak cluster 2 a (-TSO2, -T2SO2)
cycloxydim-T1S
cycloxydim-T2S
H2O-extract
Bound residues Total
0 77.7 17.3 – – – 0.8 2.8 98.6 1 33.7 47.4 3.3 – 1.5 6.1 7.0 99.0 2 29.0 44.8 4.5 1.9 5.3 7.4 7.7 100.6 3 4.1 77.4 8.2 – – 5.4 11.5 106.6 4 1.1 62.0 5.7 – 0.5 5.9 11.3 86.5 6 6.6 63.2 8.1 1.4 1.7 7.5 10.9 99.4 8 2.0 81.4 3.7 – – 6.5 14.9 108.5 8 (dark control)
15.1 78.8 – – – 4.0 8.2 106.1
a Peaks in each cluster could not be separated unambiguously on TLC.
The DCM extract of the 8 h irradiated sample was further analysed by HPLC and parent
compound, cycloxydim-TSO, cycloxydim-T1SO and cycloxydim-T2SO could be identified. Cycloxydim-TSO and cycloxydim-T2SO contributed each to about 40% TAR. Cycloxydim-TSO and cycloxydim-T2SO were confirmed by MS-analysis.
Residues in rotational crops
Confined Rotational Crop
The residue levels and the nature of the residues in three representative succeeding crops were investigated following application of [14C] cycloxydim at an application rate equivalent to 0.65 kg ai/ha (Veit, 2002b). The treated soil was aged for 30 days (simulating an emergency plant back; 30 DAT, radish and lettuce), 80 days (only wheat), 120 days (simulating a fall plant back; 120 DAT) and 365 days (365 DAT). After 30 and 80 days of treatment, ploughing was simulated by mixing the treated with the untreated soil layers. At the later replant intervals, the soil was mixed after harvest of the ripe crops and before replanting using a spade. For 120 and 365 days, the plants were cultivated using the containers of the 30 DAT replant interval. After mixing, the crops radish, lettuce and wheat were sowed or planted. The aging of the soil and the cultivation of the crops took place in a glass roofed vegetation hall, in phytotrons or in the glass house depending on the climatic conditions outside.
After homogenization, TRR of each sample were determined by combustion analysis. All samples were first extracted three times with methanol followed by an additional water extraction. The extracts were combined and measured by LSC. The identification of the metabolites is based on HPLC. A polar peak eluting with the void volume from the HPLC column was identified/characterized as sugar by yeast digestion. For further characterization of the metabolites, liquid/liquid partitioning of the MeOH extracts was performed using dichloromethane. The residual radioactive residue (RRR) was freeze-dried and subjected to combustion analysis. To release the non-soluble radioactivity, the remaining residual radioactive residues were treated with different solvents

Cycloxydim
291
(ammonia, DMSO/water 9:1 and sodium hydroxide) and/or enzymes (cellulase, macerozyme, amylases and/ or amyloglucosidase).
The total radioactive residues reached 0.139 mg/kg in wheat straw (Table 41). After a plant back interval of 30 days, TRR in lettuce and radish samples ranged from 0.032–0.051 mg/kg and decreased to 0.003–0.011 mg/kg after 120 and 365 days. The residue levels in wheat grain ranged from 0.098 mg/kg after a plant back interval of 120 days to 0.039 mg/kg after a plant back interval of 365 days.
The residue levels in the soil decreased from 4.84 mg/kg at 0 DAT to 0.057 mg/kg at 365 DAT (Table 42). After a plant back interval of 30 days and harvest of lettuce and radish, residues in soil decreased significantly compared with those after ploughing, but no difference were observed after harvesting at 365 day plant back interval.
Table 42 Total radioactive residues in crops after treatment with [14C] cycloxydim
Crop Parts (Days after planting, DAP) TRR in the plant (mg/kg)
TRR in the soil (mg/kg), at 0 day = 4.84 After aging/ploughing After harvesting
Plant back interval: 30 DAT 0.092 Lettuce Head (67) 0.051 0.054 White Radish Root (86) 0.032 0.046 White Radish Top (86) 0.050 Plant back interval: 80 DAT 0.136 Wheat Forage (53) 0.031 0.143 Wheat Straw (118) 0.131 Wheat Chaff (118) 0.086 Wheat Grain (118) 0.014 Plant back interval: 120 DAT 0.083 Lettuce Head (70) 0.007 0.034 White Radish Root (81) 0.008 0.097 White Radish Top (81) 0.011 Wheat Forage (57) 0.021 0.023 Wheat Straw (169) 0.139 Wheat Chaff (169) 0.143 Wheat Grain (169) 0.098 Plant back interval: 365 DAT 0.057 Lettuce Head (59) 0.003 0.061 White Radish Root (82) 0.003 0.046 White Radish Top (82) 0.003 Wheat Forage (70) 0.008 0.041 Wheat Straw (160) 0.059 Wheat Chaff (160) 0.044 Wheat Grain (160) 0.039
The extractability (ERR) of radioactive residues in rotational crop is shown in Table 43. Most of the residues were recovered in the methanol extracts. Residual radioactive residues (RRR) reached over 85%TRR in wheat grain at plant back interval of 120 or 365 days DAT.
Table 43 Extractability of radioactive residues in rotational crop after [14C] cycloxydim treatment after plant back intervals of 30, 80, 120 and 365 days
Crop Parts (DAP)
TRR (mg/kg)
MeOH H2O ERR a RRR b (mg/kg) (% TRR) (mg/kg) (% TRR) (mg/kg) (% TRR) (mg/kg) (% TRR)
Plant back interval: 30 DAT Lettuce Head 0.051 0.032 63.6 0.003 5.0 0.035 68.6 0.014 28.5 Radish Root 0.032 0.020 62.2 0.001 3.2 0.021 65.4 0.011 33.4 Radish Top 0.050 0.025 49.7 0.003 5.7 0.028 55.4 0.015 30.1 Plant back interval: 80 DAT Wheat Forage 0.031 0.026 84.3 0.001 2.8 0.027 87.1 0.004 11.5 Wheat Straw 0.131 0.063 48.5 0.030 23.1 0.093 71.6 0.022 16.5

Cycloxydim
292
Crop Parts (DAP)
TRR (mg/kg)
MeOH H2O ERR a RRR b (mg/kg) (% TRR) (mg/kg) (% TRR) (mg/kg) (% TRR) (mg/kg) (% TRR)
Wheat Chaff 0.086 0.034 39.3 0.027 31.0 0.061 70.3 0.021 23.9 Wheat Grain 0.014 0.003 20.7 0.003 20.7 0.006 41.4 0.009 62.6 Plant back interval: 120 DAT Lettuce Head 0.007 0.003 45.9 < 0.001 4.4 0.004 50.3 0.003 36.9 Radish Root 0.008 0.005 67.0 < 0.001 3.1 0.006 70.1 0.002 26.6 Radish Top 0.011 0.005 48.1 0.001 6.5 0.006 54.6 0.003 31.9 Wheat Forage 0.021 0.010 46.9 0.001 3.3 0.011 50.2 0.008 36.5 Wheat Straw 0.139 0.056 40.5 0.014 10.3 0.070 50.8 0.055 39.9 Wheat Chaff 0.143 0.046 31.9 0.018 12.7 0.064 44.6 0.082 57.5 Wheat Grain 0.098 0.017 17.5 0.007 7.1 0.024 24.6 0.086 88.3 Plant back interval: 365 DAT Lettuce Head 0.003 n.d. n.d. n.d. n.d. n.d. n.d. n.d. n.d. Radish Root 0.003 n.d. n.d. n.d. n.d. n.d. n.d. n.d. n.d. Radish Top 0.003 n.d. n.d. n.d. n.d. n.d. n.d. n.d. n.d. Wheat Forage 0.008 n.d. n.d. n.d. n.d. n.d. n.d. n.d. n.d. Wheat Straw 0.059 0.015 25.6 0.005 8.8 0.020 34.4 0.023 38.6 Wheat Chaff 0.044 0.010 23.4 0.005 12.2 0.015 35.6 0.029 65.8 Wheat Grain 0.039 0.003 6.4 0.003 7.6 0.006 14.0 0.034 86.3 a ERR = extractable radioactive residue b RRR = residual radioactive residue n.d. = Not determined
Ammonia treatment released 16.4% TRR from wheat grain at 120 DAT and enzyme
treatment released from 15 to 24.5% TRR from lettuce and radish at 30 DAT (Table 44).
Table 44 Quantitative distribution of the non-released radioactivity in rotational crops after treatment with [14C] cycloxydim
Crop parts (DAP) RRR, mg/kg (% TRR)
NH3 Extract mg/kg (% TRR)
Macerozyme mg/kg (% TRR)
Further treatments, mg/kg (% TRR)
Final Residue
Plant back interval: 30 DAT Lettuce Head 0.014 (28.5) n.p. 0.008 (15.0) n.p. 0.007 (14.0) Radish Root 0.011 (33.4) n.p. 0.008 (24.5) 0.001 (2.6) 0.002 (5.5) Radish Top 0.015 (30.1) n.p. 0.010 (19.0) n.p. 0.006 (11.4) Plant back interval: 120 DAT Wheat Straw 0.055 (39.9) 0.005 (3.4) 0.010 (7.1) 0.022 (15.5) n.p. Wheat Chaff 0.082 (57.5) 0.010 (6.9) n.p. n.p. 0.070 (48.9) Wheat Grain 0.086 (88.3) 0.016 (16.4) 0.011 (11.4) 0.036 (36.7) n.p.
n.p. = Not performed
All the HPLC analysis of extracts of the different matrices showed that parent was not
detected anymore and a range of degradation products could be seen depending on the matrix (Tables 45–46). At 30 DAT, cycloxydim-TSO and cycloxydim-TSO2 were the major components of the residues in lettuce head and radish root and top. At 120 DAT, only cycloxydim-TGSO2 could be detected as a single compound (in radish).
Table 45 Summary of major components in lettuce and radish as rotational crops after [14C] cycloxydim treatment and plant back intervals of 30 and 120 days, in mg/kg (% TRR)
cycloxydim-TSO cycloxydim-TSO2 cycloxydim-TGSO2
minor components
Polar 'Sugar' Fraction
Plant back interval: 30 DAT Lettuce Head 0.008 (16.1) 0.007 (13.1) nd 3: 0.001–0.004 0.011 (21.9) Radish Root 0.002 (6.3) 0.001 (2.9) nd 2: 0.001 0.016 (48.6) Radish Top 0.006 (12.5) 0.001 (1.9) nd 4: 0.001–0.003 0.011 (21.0) Plant back interval: 120 DAT Lettuce Head nd nd nd 2: ≤ 0.001 0.002 (25.8) Radish Root nd nd 0.001 (9.8) 3: ≤ 0.001 0.004 (52.7)

Cycloxydim
293
cycloxydim-TSO cycloxydim-TSO2 cycloxydim-TGSO2
minor components
Polar 'Sugar' Fraction
Radish Top nd nd 0.001(10.0) 13: ≤ 0.001 0.001 (7.8)
Cycloxydim-TGSO2 was the major metabolite in wheat forage, but no residues were detected in wheat grain (Table 46).
Table 46 Summary of major components in wheat as rotational crops after [14C] cycloxydim treatment and plant back intervals of 80 to 365 days, in mg/kg (% TRR)
Cycloxydim-TSO
Cycloxydim-T1SO
Cycloxydim-T2SO
Cycloxydim-TGSO2
Minor components
Unknown Polar 'Sugar' Fraction
Plant back interval: 80 DAT Forage 0.008 (26.5) 1: 0.002 0.016(52.0) n.d Straw 0.019 (16.1) 0.026 (20.2) 0.014 (10.6) 0.011 +
0.014 0.006 (5.0)
Chaff 0.005 (5.8) 0.010 (12.1) 0.046 (52.5) nd Grain 8: < 0.002 < 0.01 (5.7) Plant back interval: 120 DAT Forage 0.001 (2.4) 0.001 (4.8) 3: < 0.001 0.003 (16.4) 0.003 (13.0) Straw 0.009 (6.9) 3: 0.005–0.077 0.033 (23.9) 0.010 (7.4) Chaff 5: 0.002–0.005 0.012 (8.3) 0.033 (23.1) Grain 6: 0.001–0.003 Plant back interval: 365 DAT Straw 0.003 (5.9) 4: 0.001–0.004 0.009 (15.5) Chaff 2: 0.001 0.013 (31.6) Grain 1: 0.001 0.005 (11.5)
The storage stability investigations for lettuce head 30 DAT/ 67 DAP demonstrated that within a storage time of approximately 18.5 month no noticeable changes in the metabolite pattern could be observed. For wheat straw 120 DAT/ 169 DAP, the storage stability investigations demonstrated that within a storage time of 388 days no major changes in the metabolite pattern could be observed. Under the chosen conditions, the radioactive residues were stable in the original matrix.
In general, the metabolic pathway of cycloxydim in rotational plants can be seen in Figure 6. The metabolite cycloxydim-TSO was the oxidation product at the thioether group of the thiopyran ring system. A second oxidation step leads to cycloxydim-TSO2. The metabolites cycloxydim-T2SO and cycloxydim-T1SO were the results of a cleavage of the oxime ether in the side chain and presumably some non-enzymatic Beckmann rearrangements. Subsequent oxidative cleavage of the cyclohexenone ring system leads to glutaric acid derivatives like cycloxydim-1-dicarboxylic acid. The very polar ‘sugar’ fraction, as one of the major components in most of the matrices was identified by yeast fermentation. 14CO2 and radiolabelled alcohol were the results of that fermentation process. The glutaric acid derivatives were further metabolized to a small unit, which could be incorporated into the carbohydrate pool of the plants.

Cycloxydim
294
Figure 6 Metabolic pathway of cycloxydim in rotational crops
Residue Analysis
Analytical methods for plant matrices
The residue analytical methods 263 (Beutel, 1987; Beutel, 1988a), 263/1, 263/2 (Herb 1988a) and 263/3 (Tilting, 2002a; Tilting, 2004a) allow the determination of cycloxydim and its metabolite cycloxydim-5-OH-TSO2 in various crop matrices. The residues are extracted with a mixture of isopropanol, water and hydrogen peroxide and oxidized with perhydrol to form the corresponding pentane acids (cycloxydim-TGSO2 and cycloxydim-5-OH-TGSO2; Figure 7). A precipitation step with calcium hydroxide may be introduced before oxidation (Herb, 1988a). After reduction and phase
S
OH
O
CH3
NO CH3
S
OH
O
CH3
NH
O
S
OH
O
CH3
NO CH3
O
S
O
O
N
OO
CH3
S
O
O
N
O
CH3
S
OH
O
CH3
NH
O O
S
CO2H
CO2H
OO
S
OH
O
CH3
NO CH3
O O
Cycloxydim
T1SO
TSO
T2SO2
T2SO
T1SO2
BH 517-TGSO2
Carbohydrates, Bound Residues
TSO2

Cycloxydim
295
separation, the acids are isolated from the water phase by activated charcoal adsorption and converted into the dimethyl esters (cycloxydim-TDME and cycloxydim-5-OH-TDME). Subsequently, a clean-up is carried out in a silica gel column and in some cases by an additional HPLC separation. The final determination is made by GC/S-FPD.
Cycloxydim cycloxydim-TGSO2 cycloxydim-TDME
Cycloxydim-5-OH-TSO2 cycloxydim-5-OH-TGSO2 cycloxydim-TDME
Figure 7 Oxidation and methylation steps of cycloxydim and cycloxydim-OH-TSO2 on method 263
Cycloxydim and its metabolite were shown to be stable in standard solution (100 µg/mL in
methanol) over a period of 90 days. Good linearity was observed in the range of 10 to 30 ng/mL with a correlation coefficient > 0.99. Interference with the oxidation step leads to low recoveries. Furthermore, the presence of reducing substances and complex formation may require longer reaction times for oxidation. The validation data are shown in Table 47. The method was independently validated by Tillkes (1993a), Schulz (1995a), Schulz (1995b), Bross & Lehmann (2000a) and Grosshans (2009a) in various crops (Table 47).
Table 47 Validation data for analytical method 263 for cycloxydim residues in food of plant origin
Level [mg/kg]
Cycloxydim, % Cycloxydim-OH-TSO2, % Matrix N Mean recovery RSD Mean recovery RSD Reference Sugar beet roots 10 0.05 65.4 13.7 64.7 13.3 Beutel, 1987a 7 0.5 75.0 21.17 76.7 19.71 9 5.0 73.4 7.94 74.2 9.33 Sugar beet forage 4 0.05 67.7 5.87 54.4 2.05 Sugar beet young plants
3 0.5 90.7 N/A 83.6 N/A 7 5.0 76.1 12.62 76.1 8.43
Sugar beet leaves 5 0.05 88.1 22.49 66.7 7.16 1 0.5 66.1 N/A 66.9 N/A 5 5.0 69.5 7.46 72.5 5.85 Potatoes tubers 8 0.05 83.3 17.73 78.2 14.72 4 0.50 79.5 27.70 77.7 21.94 4 5.00 85.1 5.80 79.2 2.63 Potatoes forage 6 0.5 86.3 4.38 87.2 4.23 7 5.00 75.7 10.23 76.8 6.88 Peanuts 8 0.05 86.7 15.34 84.6 17.84

Cycloxydim
296
Level [mg/kg]
Cycloxydim, % Cycloxydim-OH-TSO2, % Matrix N Mean recovery RSD Mean recovery RSD Reference 4 5.00 62.8 11.96 67.5 7.79 Peanuts forage 5 0.05 95.5 4.84 63.2 19.50 4 5.00 67.5 3.54 54.6 7.32 Rape seed grains 4 0.05 109 7.83 118.9 6.44 8 0.5 84.6 8.89 74.5 14.70 6 5.00 73.8 7.62 66.4 10.60 Rape seed forage 2 0.50 82.3 N/A 73.7 N/A 1 1.00 76.4 N/A 82.5 N/A 5 5.00 67.7 4.70 61.5 3.92 2 10.00 82.5 N/A 86.5 N/A Rape seed straw 5 0.5 93.2 3.89 86.0 2.65 1 5.0 89.7 N/A 82.2 N/A Soya beans 4 0.05 101.7 5.97 97.5 5.99 1 0.5 101.4 N/A 75.5 N/A 4 5.00 83.1 2.34 75.8 3.15 Soya beans forage 1 0.5 84.7 N/A 71.3 N/A 1 5.0 74.3 N/A 70.1 N/A Green Beans 4 0.05 80.6 4.87 70.6 8.10 Green Beans kernels 5 0.05 82.9 8.30 89.8 5.63
5 5.00 87.2 3.59 84.9 3.87 Green Beans forage 2 0.50 72.6 N/A 76.8 N/A
1 2.0 65.0 N/A 65.5 N/A 2 5.0 67.8 N/A 75.5 N/A 1 20.0 82.2- N/A 63.2 N/A
Green Beans leaves 5 0.05 56.4 20.48 95.7 7.94 5 5.0 76.0 10.86 76.7 16.27 2 10.0 73.8 N/A 76.3 N/A 2 100.0 71.8 N/A 73.4 N/A
Peas kernels 4 0.05 74.7 13.61 64.4 21.20 4 5.0 78.2 3.82 72.6 3.19 Peas forage 6 5.0 83.4 9.23 71.0 7.34 Grass hay 7 0.5 78.2 11.81 80.3 9.37 4 5.0 71.1 3.86 66.7 3.44 Swedish turnips Young plants
4 0.2 64.9 7.02 74.7 13.29 Beutel, 1988a 4 5.0 84.2 2.52 70.2 2.65
Swedish turnips leaves
4 0.2 78.3 3.19 65.6 2.64 4 5.0 90.2 2.0 78.0 1.96
Brussels sprouts leaves
4 0.25 97.7 18.37 59.1 14.85 4 5.0 97.5 11.94 74.0 10.69
Brussels sprouts 4 0.25 73.4 9.19 62.6 9.08 4 0.5 76.7 10.81 69.5 16.86 4 5.0 78.5 3.3 71.3 5.0 Cotton seed 4 0.05 78.6 6.03 89.8 6.87 4 5.0 81.9 1.27 73.3 2.34 Cotton leaves 4 0.5 59.7 19.55 90.5 9.92 4 5.0 82.2 5.36 78.0 5.12 Carrots 4 0.05 60.7 14.42 73.0 13.22 4 5.0 83.4 3.88 75.2 2.89 Rape seed oil 4 0.05 82.6 3.38 69.4 9.23 4 5.0 74.0 5.23 62.0 4.15 Rape seed meal 4 0.5 82.2 10.26 104.9 9.42 4 5.0 89.3 1.24 83.0 2.39 Lettuce leaves 4 0.05 74.1 8.89 73.3 7.18 4 5.0 84.9 7.75 76.0 7.33 Celeriac roots 4 0.05 87.3 7.54 77.5 9.27 4 5.0 78.1 3.97 61.3 3.95 Pineapple fruit 4 0.05 95.1 3.0 78.9 1.5 Herb, 1988a 4 5.0 82.9 2.4 66.2 2.1 Apple fruit 4 0.05 68.2 14.0 69.2 14.2 4 5.0 77.1 5.4 67.4 4.5

Cycloxydim
297
Level [mg/kg]
Cycloxydim, % Cycloxydim-OH-TSO2, % Matrix N Mean recovery RSD Mean recovery RSD Reference Pear fruit 4 0.05 71.9 1.7 66.2 2.7 4 5.0 71.4 1.7 61.9 3.4 Cauliflower head 4 0.05 61.7 3.9 74.2 5.1 4 5.0 86.6 1.8 67.1 1.6 Cauliflower plant 4 0.05 88.3 7.9 86.6 9.0 4 5.0 86.1 1.0 73.4 4.1 Beans seeds 4 0.1 82.9 9.6 75.1 5.6 4 5.0 83.2 2.6 69.8 2.4 Citrus fruit 4 0.05 86.3 9.1 68.9 9.3 4 5.0 86.6 2.9 71.7 4.0 Flax seeds 4 0.05 62.3 3.9 70.1 2.9 4 5.0 58.5 2.4 65.9 5.0 Grass hay 4 0.5 90.9 3.9 79.2 5.9 4 5.0 76.2 5.2 66.5 4.9 Potato tuber 4 0.05 71.8 3.4 65.4 3.7 4 5.0 83.8 3.3 65.8 5.1 Pumpkin fruit 4 0.05 68.1 7.2 60.8 7.1 4 5.0 72.3 3.1 59.4 2.7 Leek plant 4 0.05 86.4 3.3 111.5 4.1 4 5.0 79.1 3.1 70.8 4.1 Lucerne green mass 4 0.05 90.7 5.6 80.3 7.6
4 5.0 68.9 4.5 61.9 4.7 Papaya fruit 4 0.05 86.3 3.8 72.9 1.6 4 5.0 93.6 4.1 67.7 3.6 Vine 4 0.05 81.6 2.5 71.0 5.5 4 5.0 73.2 7.2 61.4 7.6 Garlic 4 0.5 76.7 4.0 79.9 5.3 Tilting, 2002a 4 5.0 81.9 5.5 71.2 6.8 Eggplant 4 0.05 89.8 2.8 86.9 2.3 4 5.0 91.3 4.9 89.8 4.7 Rice grain 4 0.05 62.8 14.1 56.2 4.3 4 5.0 89.7 4.1 66.8 7.4 Red beet 4 0.5 74.1 8.7 62.9 6.6 4 5.0 71.3 6.8 66.6 6.8 Peas, seeds and pods 4 0.05 58.2 3.0 62.9 16.3
4 5.0 82.5 4.9 68.2 4.8 Melon 5 0.05 58.6 6.5 71.4 5.7 5 5.0 73.1 6.6 63.5 5.4 Peppers 4 0.05 80.7 2.3 71.2 3.6 4 5.0 80.9 4.8 68.0 6.1 Savoy cabbage 4 0.05 86.2 10.5 81.9 13.5 4 5.0 84.1 5.9 72.7 5.0 Celeriac (green plant) 4 0.05 87.7 2.6 84.4 3.1
4 5.0 78.8 7.3 74.9 5.7 Chick pea 4 0.05 64.8 2.4 70.1 3.7 4 5.0 69.8 3.9 61.5 4.5 Spinach 4 0.5 71.6 4.1 62.0 4.4 4 5.0 69.6 3.0 62.5 5.0 Currant 4 0.5 88.0 5.0 63.6 6.2 4 5.0 77.7 2.8 66.4 3.6 Raspberry 4 0.05 72.8 10.9 68.7 11.9 4 5.0 75.2 2.9 63.5 2.5 Rhubarb 4 0.05 67.7 5.5 54.4 5.1 4 5.0 70.7 3.5 56.1 2.7 Horseradish 4 0.5 69.2 13.3 66.4 12.9 4 5.0 69.4 7.5 63.0 6.8 Strawberry (green plant)
4 0.5 83.0 4.5 61.8 4.2 5 5.0 74.3 4.4 56.8 8.7
Carrot (green plant) 4 0.1 85.4 6.8 72.6 6.6 Maize whole plant 5 0.05 84 6.2 70 20 Beck, 1997a

Cycloxydim
298
Level [mg/kg]
Cycloxydim, % Cycloxydim-OH-TSO2, % Matrix N Mean recovery RSD Mean recovery RSD Reference and rest plant without root
2 5.0 87 N/A 63 N/A 2 20 91 N/A 75 N/A
Maize cobs with husk 2 0.05 87 N/A 78 N/A 2 5.0 63 N/A 65 N/A
Maize grain 1 0.05 90 N/A 85 N/A 1 5.0 89 N/A 73 N/A Maize straw 1 0.05 99 N/A 88 N/A 1 5.0 85 N/A 72 N/A Maize whole plant 1 0.05 103 N/A 75 N/A Schulz, 1997a
1 5.0 91 N/A 87 N/A Maize grain 1 0.05 92 N/A 76 N/A 1 5.0 77 N/A 63 N/A Maize whole plant and rest plant without root
5 0.05 90 8.2 79 6.8 Beck & Schulz, 1997b 3 5.0 73 8.2 59 8.3
1 20 74 N/A 59 N/A Maize cobs with husk 2 0.05 90 N/A 79 N/A
1 5.0 95 N/A 75 N/A Maize grain 1 0.05 98 N/A 86 N/A 1 5.0 75 N/A 54 N/A Maize straw 1 0.05 127 N/A 109 N/A 1 0.1 94 N/A 80 N/A 1 5.0 105 N/A 85 N/A Maize whole plant 1 0.05 93 N/A 82 N/A Schulz 1997c
1 15 85 N/A 71 N/A Maize grain 1 0.05 97 N/A 83 N/A 1 5.0 70 N/A 60 N/A
Extractability/accountability investigations were performed to determine the % TRR measured in soya bean and canola matrices by method 263 in plants treated with cycloxydim (Beutel, 1987c; Beutel, 1987b). The radioactivity present in all extracts (including waste fractions) was determined by LSC and residual radioactive quantified by combustion analysis. The results are summarized in Table 48. Extraction with iso-propanol/water released from 66 to 94%TRR. Final eluate containing cycloxydim and cycloxydim-TDME gave similar results either when measured by LSC or GC-FPD.
Table 48 Extractability and accountability of method 263 in soya bean and canola matrices
Soya bean, mg/kg (%TRR) Canola, mg/kg (%TRR) Plant Matrix Seeds Forage Straw) Seed Forage TRR 2.27 (100) 3.75 (100) 0.89 (100) 3.96 (100) 1.76 (100) Isopropanol/water extract 2.09 (92.1) 3.22 (85.9) 0.59 (66.3) 2.64 (66.7) 1.65 (93.7) Finale eluate, by LSC 1.09 (48.0) 1.78 (47.5) 0.29 (32.6) 1.69 (42.7) 1.08 (61.4) Finale eluate, by GC 1.07 (47.1) 1.44 (38.4) 0.35 (39.9 1.66 (41.9) 119 (67.8)
Method No. 407/0 and 407/1 is a modification of Method No. 263 for onion that allows the determination of cycloxydim, cycloxydim-5-OH-TSO2 and all metabolites that can be oxidized to cycloxydim-TGSO2 (cycloxydim-1) or cycloxydim-5-OH-TGSO2 (cycloxydim-2) with H2O2 under alkaline conditions in plant matrices (Sasturain, 1997b; Lehmann and Mackenroth, 2003b; Jones, 2001b ). The residues are extracted from the matrices using an isopropanol/distilled water mixture, the fruit acids removed by precipitation using Ca(OH)2. Afterwards the active substance and all relevant metabolites are oxidized using hydrogen peroxide/KOH to yield the two di-acids cycloxydim-TGSO2 and cycloxydim-5-OH-TGSO2, the excess of oxidizing agent is eliminated using a C18-column and after a NH2-column clean-up, residues are determined by HPLC-MS/MS. The validation data are shown in Tables 49–51. In most of the studies, the validation was performed by fortifying the samples with cycloxydim and cycloxydim-OH-SO2 as representative analytes for the non-hydroxylated and hydroxylated compounds, respectively. In one study (Table 50, Richter, 2011a), validation was performed using other metabolites that could be oxidized to the cycloxydim-1 and cycloxydim-2.

Cycloxydim
299
Table 49 Validation data for method 407/0 for the determination of cycloxydim residues (Sasturain, 1997b; Lehmann & Mackenroth, 2003b). N = 5 in each case
Level [mg/kg]
Cycloxydim, % Cycloxydim-OH-TSO2, % Matrix Mean recovery RSD Mean recovery RSD Onion bulbs 0.05 88.8 11.3 83.0 12.4 5.0 94.8 6.3 80.0 10.2 Onion stems 0.05 86.8 7.1 68.5 3.0 5.0 93.2 6.5 78.3 5.7 Maize seed 0.05 100.2 9.1 90.0 4.6 0.5 103.7 5.0 88.3 4.8 Lettuce 0.05 102.5 4.9 93.3 4.6 0.5 98.7 3.0 88.7 6.9 Oilseed rape seed 0.05 93.8 5.7 76.2 4.3 2.5 98.7 2.1 87.5 5.3 Oilseed rape forage 0.05 81.3 5.9 97.0 5.1 5.0 96.5 5.0 95.3 9.2 Bean 0.05 87.1 9.3 102.6 3.4 1.0 102.3 3.3 91.7 2.9 Orange 0.05 94.7 9.6 91.6 8.8 0.5 101.2 5.6 96.6 8.1 Potato tuber 0.05 92.0 10.5 95.8 3.9 1.0 101.2 5.1 95.3 3.2 Sugar beet leaves 0.05 78.8 9.8 77.2 4.6 5.0 92.9 3.4 82.3 6.3 Carrot 0.05 90.0 10.4 90.7 7.3 0.5 93.6 7.3 83.8 7.3 White cabbage 0.05 97.0 9.9 93.5 7.0 1.0 96.3 5.3 96.2 5.2 Onion 0.05 82.5 6.4 76.1 3.4 0.5 101.7 3.0 81.5 5.8
Table 50 Recovery data (%) for method 407/1 (L0018/1) for the determination of cycloxydim residues. N = 5 in all case. In parenthesis, the m/z transition in the LC-MS/MS (Richter, 2011a).
Level, mg/kg
Lettuce Rape seed Orange Potato Onion Substance Mean RSD Mean RSD Mean RSD Mean RSD Mean RSD cycloxydim-TSO (263/155) a
0.05 0.50
104 95.5
1.2 3.3
109 105
4.0 4.0
97.3 93.5
6.5 5.0
103 101
2.3 3.3
101 102
5.6 2.0
cycloxydim-TSO (263/219)
0.05 0.50
107 96.1
4.4 3.1
109 110
3.0 7.4
92.1 96.0
3.6 4.6
100 107
3.3 2.6
97.4 104
2.1 3.0
cycloxydim-T1SO (263/155) a
0.05 0.50
86.9 76.2
2.7 4.0
96.2 94.5
5.2 3.2
91.1 75.3
4.7 6.6
89.1 85.0
7.3 4.4
90.7 88.3
4.5 3.4
cycloxydim-T1SO (263/219)
0.05 0.50
89.2 75.3
3.0 6.2
96.0 93.9
3.6 1.7
92.2 71.4
3.3 3.5
94.4 91.9
4.8 7.2
95.0 88.5
3.7 4.0
cycloxydim -T2SO (263/155) a
0.05 0.50
84.4 82.5
3.6 6.3
79.9 75.6
7.9 4.8
cycloxydim -T2SO (263/219)
0.05 0.50
88.3 82.4
1.7 3.0
85.2 82.9
2.2 3.6
cycloxydim -5-OH-TSO (279/175) a
0.05 0.50
95.4 89.1
2.4 2.0
100 94.1
3.9 2.8
84.0 84.4
2.9 3.8
95.7 93.7
3.7 2.9
88.3 93.0
3.0 2.9
cycloxydim-5-OH-TSO (279/217)
0.05 0.50
98.1 87.9
4.6 5.2
94.0 92.6
6.9 11.0
83.4 91.5
2.5 7.7
93.6 91.6
3.4 6.0
90.3 97.5
5.4 6.3
a Used for quantification
Table 51 Recovery data (%) for method 407/1(SOP-PA.0271) for the determination of cycloxydim residues. N = 5 in all case. In parenthesis, the m/z transition in the LC-MS/MS (Jones, 2006b).
Level, mg/kg
cycloxydim (263/155)
cycloxydim (263/219)
cycloxydim-5-OH-TSO2 (279/217)
cycloxydim-5-OH-TSO2 (279/175)
Crop Mean RSD Mean RSD Mean RSD Mean RSD

Cycloxydim
300
Level, mg/kg
cycloxydim (263/155)
cycloxydim (263/219)
cycloxydim-5-OH-TSO2 (279/217)
cycloxydim-5-OH-TSO2 (279/175)
Crop Mean RSD Mean RSD Mean RSD Mean RSD Tomato 0.05 96 3 87 9 98 4 94 4 5 92 14 94 12 78 8 76 11 25 100 3 100 2 81 5 82 3 Pepper 0.05 88 6 82 7 103 9 100 11 5 87 4 88 6 78 3 77 3 25 101 5 100 3 83 5 81 4 Beans 0.05 88 8 103 5 97 6 5 108 11 81 9 81 8 50 104 8 81 9 80 8 Grape 0.05 102 4 94 2 76 3 73 4 25 102 7 102 7 75 6 76 6 Sunflower 0.05 93 4 93 5 72 2 76 3 25 88 8 91 7 84 15 87 17 Green Peas 0.05 81 8 80 4 76 12 74 6
25 88 2 85 4 71 2 71 3 Soya bean 0.05 90 5 89 9 92 11 5 92 3 72 2 73 2 25 102 5 77 4 81 5 Kale (Leaf) 0.05 83 13 77 3 84 8
25 93 9 75 5 78 11 Onion 0.05 92 2 73 4 71 3 5 99 12 80 17 81 15 Carrot 0.05 91 5 100 3 78 3 81 4 25 102 6 103 5 81 4 81 4 Strawberry 0.05 101 6 102 5 89 3 91 5 25 102 9 99 8 83 8 84 8 Lettuce (Head)
0.05 81 11 76 10 76 5 76 8 25 101 4 98 4 76 5 75 4
Spinach 0.05 73 5 74 6 76 13 25 93 13 87 17 86 15 80 90 6 78 4 75 7
The ethyl acetate phases of maize grain and straw from the 0.8 kg ai/ha treatment were analysed according to the LC/MS/MS method 407/0 with external calibration. The LSC data/radio-HPLC chromatograms were compared with the data following the common moiety method. Approximately 75% recovery (LSC) was found in grain after applying the residue analytical method (Hofmann, 1997a,b; Bross, 1998a).
Method No. 493/0 was developed to selectively determine cycloxydim-TSO in plant matrices (Bross & Mackenroth, 2003b). Cycloxydim-TSO is extracted from vegetables and fruit with a methanol/water/buffer mixture. After addition of saturated NaCl-solution, a partition with dichloromethane is performed. The aqueous phase is acidified with concentrated formic acid, partitioned with isooctane/dichloromethane mixture and the extract washed with saturated NaCl-solution (pH 3 + 0.1% formic acid). A re-extraction is done with saturated NaCl-solution containing 1% of ammonium hydroxide, the aqueous phase purified by C18SPE and residues determined by HPLC/UV. Validation data is shown in Table 52. The method was independently validated by Schulz (2003b).
Table 52 Validation data method 493/0 for cycloxydim-TSO residues in food of plant origin, N =5 in all cases (Bross & Mackenroth, 2003b)
Matrix Level [mg/kg] Means recovery [%] RSD [%] Maize seed 0.05 79.5 2.9
0.5 78.5 1.8 Lettuce 0.05 88.1 1.3
1.0 80.7 2.3 Rape seed 0.05 74.1 3.9
5.0 73.4 3.6

Cycloxydim
301
Matrix Level [mg/kg] Means recovery [%] RSD [%] Rape seed forage 0.05 81.9 1.4
5.0 82.4 1.6 Bean 0.05 84.6 3.9
2.0 82.5 4.3 Orange 0.05 83.0 1.2
0.5 77.0 2.8 Potato tuber 0.05 88.9 2.9
2.0 81.8 1.1 Sugar beet leaves 0.05 91.9 4.7
5.0 81.2 1.8 Carrot 0.05 85.5 3.3
0.5 82.2 2.3 White cabbage 0.05 90.7 2.3
2.0 85.5 1.7 Onion 0.05 83.1 2.6
1.0 78.1 1.3
Analytical methods for animal matrices
Method No. 982/0 determines cycloxydim, cycloxydim-5-OH-TSO2 and all metabolites that can be oxidized with H2O2 under alkaline conditions and methylated to cycloxydim-TDME and cycloxydim-5-OH-TDME in matrices of animal origin (Kampke-Thiel, 1998b). The residues are extracted with isopropanol/water, oxidized with hydrogen peroxide/KOH to yield a substituted glutaric acid. After removing the isopropanol, the analyte is adsorbed on charcoal and methylated by refluxing with methanol/sulphuric acid. Partitioning and silica gel column chromatography are used for clean-up. Quantitation is achieved by GC-MS. Minor modifications to the validation method were made in the independent validation. Validation data are presented in Table 53.
Table 53 Validation data for Method 982/0 for the determination of cycloxydim residues in animal matrices
Level [mg/kg] Cycloxydim, % Cycloxydim-OH-TSO2, % Matrix Mean recovery RSD Mean recovery RSD Validation Report, N = 6 Eggs 0.05 87.0 13.9 75.6 12.0 0.5 80.7 9.0 72.7 12.5 Milk 0.01 105.5 3.3 85.5 8.6 0.1 99.3 8.9 84.5 4.4 Meat 0.05 74.8 8.7 71.6 7.7 0.5 78.4 12.9 67.2 13.5 Fat 0.05 81.2 7.5 69.4 17.6 0.5 81.0 14.7 74.4 20.0 Kidney 0.05 72.9 12.3 76.1 17.4 0.5 75.2 9.0 77.0 14.8 Liver 0.05 74.7 15.8 71.4 16.1 0.5 81.6 10.4 83.6 10.1 Independent validation, N = 5 Eggs 0.05 82.3 5.5 73.6 7.1 0.5 86.2 10.9 58.0 16.8 Milk 0.01 61.6 11.1 66.5 15.9 0.1 100.6 9.8 73.1 12.1 Meat 0.05 86.8 4.8 58.5 7.1 0.5 88.9 5.7 69.8 5.6 Fat 0.05 75.7 6.2 56.0 5.0 0.5 83.6 4.2 65.2 5.3. Kidney 0.05 84.2 11.0 62.4 16.7 0.5 71.8 12.8 58.1 15.7 Liver 0.05 71.7 10.6 59.4 11.6 0.5 76.0 8.9 67.2 3.7

Cycloxydim
302
Method No. 513/0 allows the determination of cycloxydim-TSO, cycloxydim-5-OH-TSO and
cycloxydim-5-OH-TS in foodstuffs of animal origin (Grosshans, 2003b). The sample is extracted with acetonitrile/hexane (4:3), the acetonitrile extract acidified with formic acid and a liquid/liquid partition with dichloromethane is carried out. The final determination is performed by HPLC/MSD or LC-MS/MS (independent validation; Class, 2002b). Validation data are presented in Table 54.
Table 54 Validation data for analytical method 513/0 for the determination of cycloxydim residues in animal matrices (Grosshans, 2003b)
Level [mg/kg]
Cycloxydim-TSO, % Cycloxydim-5-OH-TS cycloxydim-5-OH-TSO, % a
Matrix N Mean recovery RSD Mean recovery RSD Eggs 5 0.01 78.5 3.4 70.9 3.1 5 0.1 93.6 2.8 80.7 4.5 Milk 5 0.003 82.8 5.0 66.5 6.7 5 0.03 96.5 3.7 89.0 5.7 Meat 5 0.01 87.2 4.5 76.0 3.9 5 0.1 78.7 8.3 74.8 12.7 Fat 5 0.01 75.4 10.7 61.7 3.0 5 0.1 93.9 6.2 77.2 11.8 Kidney 5 0.01 103.3 3.6 93.0 4.0 4 0.1 82.5 8.2 82.6 8.1 Liver 5 0.01 95.3 5.8 89.8 7.0 5 0.1 84.5 3.6 90.1 9.7 Eggs 5 0.01 91 15 78 8 5 0.1 78 4 67 5 Milk 5 0.003 101 13 78 7 5 0.03 91 5 78 6 Meat 5 0.01 105 3 85 8 5 0.1 93 3 80 4 a Sum OH-metabolites
The efficiency of the acetonitrile/hexane (4:3) extraction of cycloxydim and its metabolites
used in Method No. 513/0 was investigated within hen metabolism studies (Fabian & Knoell, 2003a, Seiferlein, 2003a). The samples were extracted, the radioactivity determined by LSC counting and analysed by HPLC. The extractabilities achieved with the residue method are compared with the results of the metabolism studies, except for liver, where acetonitrile/hexane only extracts about 50% of the radioactivity (Tables 55 and 56).
Table 55 Extractability of residues in the analytical method vs. hen metabolism study (Fabian & Knoell, 2003a).
Matrix TRR mg/kg
Methanol (Metabolism Study)a, mg/kg (% TRR)
ACN/Hexane (Residue Method), mg/kg (% TRR)
Total extract cycloxydim-TSO b Total extract cycloxydim-TSO b Eggs 0.121 0.056 (46.3) 0.037 (31.0) 0.051 (41.8) 0.031 (25.6) Muscle 0.053 0.006 (10.8) 0.002 (3.5) 0.004 (8.0) 0.003 (5.4) Liver 0.281 0.087 (31.1) 0.015 (4.8) 0.041 (14.7) 0.16 .7) a For eggs, extraction was performed with methanol + isohexane and for liver and muscle the extract was partitioned with isohexane, so the methanol phase was analysed b Sum of isomers
Table 56 Extractability of egg and liver with the residue analytical method vs. hen metabolism study (Seiferlein, 2003a)
Methanol (Metabolism Study) mg/kg (% TRR)
ACN/Hexane (Residue Method) mg/kg (% TRR)
Matrix TRR, mg/kg Total extract cycloxydim-5-
OH-TSO cycloxydim- 5-OH-TS Total extract cycloxydim-
5-OH-TSO cycloxydim-5-OH-TS
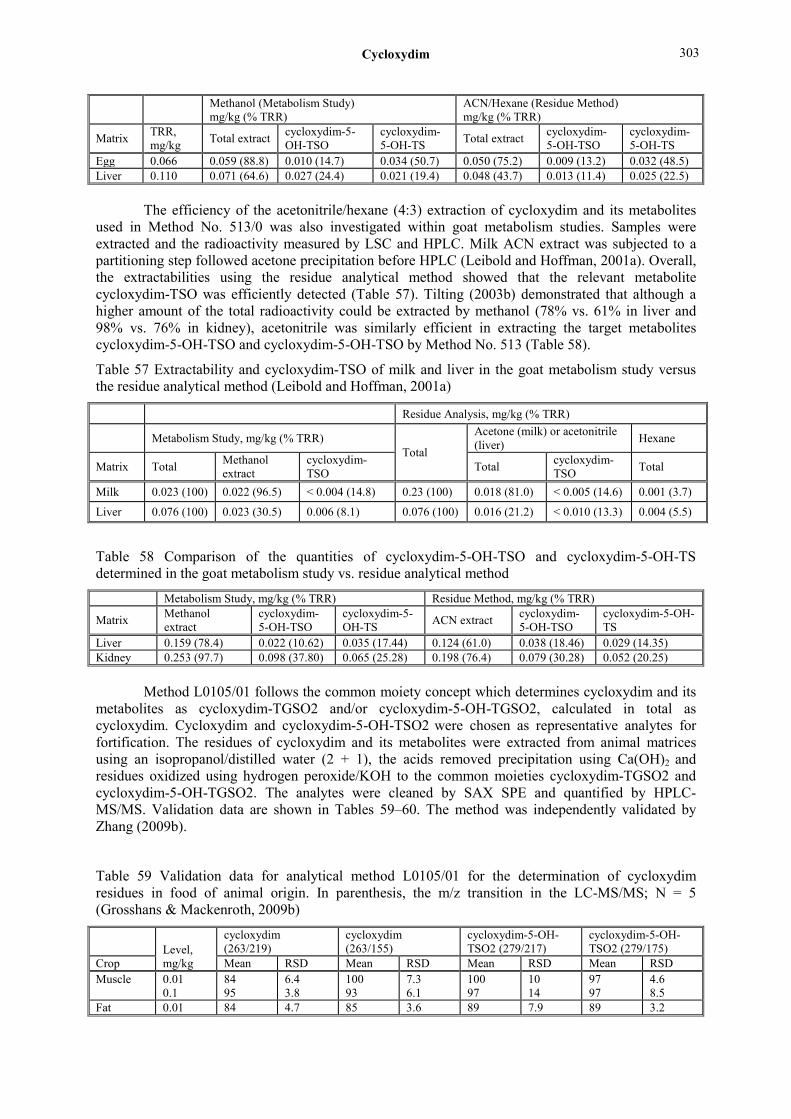
Cycloxydim
303
Methanol (Metabolism Study) mg/kg (% TRR)
ACN/Hexane (Residue Method) mg/kg (% TRR)
Matrix TRR, mg/kg Total extract cycloxydim-5-
OH-TSO cycloxydim- 5-OH-TS Total extract cycloxydim-
5-OH-TSO cycloxydim-5-OH-TS
Egg 0.066 0.059 (88.8) 0.010 (14.7) 0.034 (50.7) 0.050 (75.2) 0.009 (13.2) 0.032 (48.5) Liver 0.110 0.071 (64.6) 0.027 (24.4) 0.021 (19.4) 0.048 (43.7) 0.013 (11.4) 0.025 (22.5)
The efficiency of the acetonitrile/hexane (4:3) extraction of cycloxydim and its metabolites used in Method No. 513/0 was also investigated within goat metabolism studies. Samples were extracted and the radioactivity measured by LSC and HPLC. Milk ACN extract was subjected to a partitioning step followed acetone precipitation before HPLC (Leibold and Hoffman, 2001a). Overall, the extractabilities using the residue analytical method showed that the relevant metabolite cycloxydim-TSO was efficiently detected (Table 57). Tilting (2003b) demonstrated that although a higher amount of the total radioactivity could be extracted by methanol (78% vs. 61% in liver and 98% vs. 76% in kidney), acetonitrile was similarly efficient in extracting the target metabolites cycloxydim-5-OH-TSO and cycloxydim-5-OH-TSO by Method No. 513 (Table 58).
Table 57 Extractability and cycloxydim-TSO of milk and liver in the goat metabolism study versus the residue analytical method (Leibold and Hoffman, 2001a)
Residue Analysis, mg/kg (% TRR)
Metabolism Study, mg/kg (% TRR) Total
Acetone (milk) or acetonitrile (liver) Hexane
Matrix Total Methanol extract
cycloxydim-TSO Total cycloxydim-
TSO Total
Milk 0.023 (100) 0.022 (96.5) < 0.004 (14.8) 0.23 (100) 0.018 (81.0) < 0.005 (14.6) 0.001 (3.7)
Liver 0.076 (100) 0.023 (30.5) 0.006 (8.1) 0.076 (100) 0.016 (21.2) < 0.010 (13.3) 0.004 (5.5)
Table 58 Comparison of the quantities of cycloxydim-5-OH-TSO and cycloxydim-5-OH-TS determined in the goat metabolism study vs. residue analytical method
Metabolism Study, mg/kg (% TRR) Residue Method, mg/kg (% TRR)
Matrix Methanol extract
cycloxydim-5-OH-TSO
cycloxydim-5-OH-TS ACN extract cycloxydim-
5-OH-TSO cycloxydim-5-OH-TS
Liver 0.159 (78.4) 0.022 (10.62) 0.035 (17.44) 0.124 (61.0) 0.038 (18.46) 0.029 (14.35) Kidney 0.253 (97.7) 0.098 (37.80) 0.065 (25.28) 0.198 (76.4) 0.079 (30.28) 0.052 (20.25)
Method L0105/01 follows the common moiety concept which determines cycloxydim and its metabolites as cycloxydim-TGSO2 and/or cycloxydim-5-OH-TGSO2, calculated in total as cycloxydim. Cycloxydim and cycloxydim-5-OH-TSO2 were chosen as representative analytes for fortification. The residues of cycloxydim and its metabolites were extracted from animal matrices using an isopropanol/distilled water (2 + 1), the acids removed precipitation using Ca(OH)2 and residues oxidized using hydrogen peroxide/KOH to the common moieties cycloxydim-TGSO2 and cycloxydim-5-OH-TGSO2. The analytes were cleaned by SAX SPE and quantified by HPLC-MS/MS. Validation data are shown in Tables 59–60. The method was independently validated by Zhang (2009b).
Table 59 Validation data for analytical method L0105/01 for the determination of cycloxydim residues in food of animal origin. In parenthesis, the m/z transition in the LC-MS/MS; N = 5 (Grosshans & Mackenroth, 2009b)
Level, mg/kg
cycloxydim (263/219)
cycloxydim (263/155)
cycloxydim-5-OH-TSO2 (279/217)
cycloxydim-5-OH-TSO2 (279/175)
Crop Mean RSD Mean RSD Mean RSD Mean RSD Muscle 0.01
0.1 84 95
6.4 3.8
100 93
7.3 6.1
100 97
10 14
97 97
4.6 8.5
Fat 0.01 84 4.7 85 3.6 89 7.9 89 3.2

Cycloxydim
304
Level, mg/kg
cycloxydim (263/219)
cycloxydim (263/155)
cycloxydim-5-OH-TSO2 (279/217)
cycloxydim-5-OH-TSO2 (279/175)
Crop Mean RSD Mean RSD Mean RSD Mean RSD 0.1 99 2.1 93 5.0 105 2.2 94 5.5
Kidney 0.01 0.1
95 101
18 4.9
101 106
8.3 5.4
101 96
9.9 5.1
86 99
6.0 6.4
Liver 0.01 0.1
96 98
2.1 0.8
89 97
6.0 4.7
103 96
1.3 2.3
94 96
6.4 5.8
Milk 0.01 0.1
92 85
7.5 3.3
91 87
4.8 3.1
92 94
8.9 3.9
95 96
3.5 3.2
cream 0.01 0.1
90 96
9.3 6.2
85 95
8.4 6.3
91 98
19 5.6
85 92
11 8.6
Skim milk 0.01 0.1
95 90
8.9 4.9
92 93
5.1 4.4
102 95
14 5.4
92 91
7.1 7.0
Egg 0.01 0.1
77 93
5.1 4.2
77 93
6.0 4.3
94 107
5.1 4.4
92 107
5.8 1.9
Table 60 Validation data for analytical method L0105/01 for the determination of cycloxydim residues in food of animal origin. In parenthesis, the m/z transition in the LC-MS/MS; N=5 (Richter, 2011b)
Level, mg/kg
Muscle Liver Fat milk Egg Substance Mean RSD Mean RSD Mean RSD Mean RSD Mean RSD cycloxydim-TSO (263/155) a
0.01 0.10
73.7 98.5
5.6 3.4
91.8 107
6.3 6.3
121 117
6.3 4.8
125 111
6.6 2.5
114 105
2.3 4.0
cycloxydim-TSO (263/219)
0.01 0.10
80.6 97.5
3.7 1.9
98.4 99.2
4.2 7.0
106 124
5.8 2.6
118 105
4.3 3.5
105 107
4.2 1.2
cycloxydim-T1SO (263/155) a
0.01 0.10
78.5 95.9
6.1 4.8
123 96.5
13 4.3
93.1 104
2.5 2.7
102 97.2
2.2 2.6
113 102
0.9 3.1
cycloxydim-T1SO (263/219)
0.01 0.10
89.3 95.1
8.4 2.7
116 99.6
3.1 2.0
102 110
2.9 2.6
113 95.9
1.8 5.4
112 105
3.8 4.8
cycloxydim-TSO2 (263/155 a
0.01 0.10
88 106
9.0 6.1
105 105
3.9 4.7
89.5 103
6.8 6.6
99.1 98.6
4.0 3.3
112 108
3.9 4.7
cycloxydim-TSO2 (263/219)
0.01 0.10
92.4 100
6.4 3.2
118 100
3.2 5.3
84.0 105
6.7 3.6
103 100
5.0 3.8
121 110
2.7 2.9
cycloxydim -T2SO (263/155) a
0.01 0.10
74.5 76.1
6.6 5.2
105 92.2
4.3 2.3
88.0 77.9
1.8 11
84.7 80.5
2.2 6.1
88.8 87.0
3.1 3.0
cycloxydim-T2SO (263/219)
0.01 0.10
77.6 77.1
3.5 1.8
99.2 94.0
2.4 2.4
86.0 82.8
4.0 12
103 84.6
1.1 1.4
101 86.5
3.2 3.9
cycloxydim-T1SO2 (263/155 a
0.01 0.10
97.7 106
5.4 4.0
97.2 101
6.1 4.4
101 109
6.0 2.4
105 106
11 3.8
94.8 99.6
2.3 5.1
cycloxydim-T1SO2 (263/219)
0.01 0.10
92.2 98.2
2.5 2.6
102 98.4
4.1 3.8
106 103
4.0 4.5
84.0 100
17 4.3
96.4 102
2.2 2.0
cycloxydim -5-OH-TSO (279/175) a
0.01 0.10
117 101
3.0 2.1
98.0 88.2
8.9 2.1
83.0 96.0
4.2 3.8
100 98.5
6.7 4.0
91.1 90.0
3.5 2.6
cycloxydim-5-OH-TSO (279/217)
0.01 0.10
111 97.7
5.1 4.7
92.0 80.2
4.9 2.3
79.7 100
13 3.4
102 92.7
2.3 2.9
88.0 89.9
4.9 3.1
cycloxydim-5-OH-TS (279/175) a
0.01 0.10
105 88.8
4.7 5.3
91.9 79.2
3.4 4.0
91.0 89.2
5.6 2.0
75.7 78.4
2.3 5.4
98.8 101
3.4 1.1
cycloxydim-5-OH-TS (279/217)
0.01 0.10
101 93.4
2.1 7.0
89.2 79.9
5.5 6.7
98.2 89.5
3.1 2.3
77.2 78.2
7.8 5.1
95.9 99.3
2.7 3.1
a Used for quantification
Stability of residues in stored analytical samples
For investigating the storage stability of cycloxydim residues in plant matrices (sugar beet, pineapple, oilseed rape seed), the sample material was fortified with a mixture of cycloxydim-TSO + cycloxydim-T2SO2 and cycloxydim-5-OH-TSO2 (Tilting, 1992a). The samples were stored at -20 °C over a period of 2 years. Samples were taken and analysed immediately after spiking, 30, 90, 180, 360 and 720 days thereafter using Method 263. The results are shown in Table 61.

Cycloxydim
305
Table 61 Storage stability investigations, in % remaining a
Crop Day Cycloxydim-TSO + cycloxydim-T2SO2 (0.5 mg/kg) Cycloxydim-5-OH-TSO2 (0.435 mg/kg)
Sugar beet 0 103.0 90.8 32 81.3 72.8 89 91.9 94.7 179 124.0 121.6 357 125.0 119.1 718 90.2 90.8 Rape seed 0 101.1 88.7 32 95.6 99.3 90 103.5 103.9 181 120.5 119.1 358 113.0 110.8 719 92.4 86.2 Pineapple 0 88.0 84.7 29 104.0 104.7 90 88.6 84.4 180 94.4 87.1 361 121.0 119.5 720 92.6 80.2
a from duplicate analysis
The deep freeze stability of cycloxydim and cycloxydim-5-OH-TSO2 in different plant
matrices was investigated over a period of about two years at -20 °C (Lehmann & Mackenroth, 2003a).The samples were spiked at a concentration level of 0.45–0.5 mg/kg and analysed after different storing intervals with Method No. 407/1. The residue data are shown in Tables 62 and 63.
Table 62 Storage stability investigations in maize matrices, in % remaining
Forage Seed Straw
Days Cycloxydim Cycloxydim-5-OH-TSO2 Cycloxydim Cycloxydim-5-
OH-TSO2 Cycloxydim Cycloxydim-5-OH-TSO2
0 100 100 100 100 100 100 32 90 110 113 134 102 116 82 73 95 89 119 96 119 186 84 90 94 112 92 106 747 98 80 82 79 78 96
Table 63 Storage stability investigations in plant matrices, in % remaining
Oilseed Rape Pea seed Strawberry
Days Cycloxydim Cycloxydim-5-OH-TSO2 Cycloxydim Cycloxydim-5-
OH-TSO2 Cycloxydim Cycloxydim-5-OH-TSO2
0 100 100 100 100 100 100 32 111 87 96 110 97 92 82 116 95 88 95 99 92 186 86 83 81 90 97 96 747 86 72 91 80 101 76
Selected samples from animal metabolism studies with [14C] cycloxydim or its metabolite
[14C] cycloxydim-5-OH-TSO were re-extracted with methanol or extracted with the solvent mixture used in the common moiety method in order to investigate their stability in animal matrices (Grosshans & Kloeppner, 2009a). The% remaining rates of cycloxydim and its metabolites over 78–89 months of storage at -20 °C are shown in Table 64.

Cycloxydim
306
Table 64 Stability of [14C] cycloxydim and its metabolites in samples of goat liver and milk re-extracted after 78–89 months of storage determined by HPLC-radio detector
Hafernann & Knoell, 2003 78–89 months
mg/kg % TRR mg/kg % TRR % Remaining a Liver (methanol extract) cycloxydim-T1SO, sum of diastereomers 0.001 1.8 0.004 5.4 300 cycloxydim-TSO, sum of diastereomers 0.006 8.1 0.007 9.1 112 cycloxydim-T2SO2 0.001 2.0 0.001 1.5 75 cycloxydim 0.008 10.8 0.004 5.3 49 Milk (SPE eluate of methanol extract) cycloxydim-T1SO, sum of diastereomers 0.004 16.5 0.003 14.9 90 cycloxydim-TSO, sum of diastereomers 0.003 14.9 0.004 18.0 121 Tilting, 2003 78–89 months Liver (methanol extract) mg/kg % TRR mg/kg % TRR % Remaining cycloxydim-5-OH-TSO 0.022 10.6 0.031 14.9 141 cycloxydim-5-OH-T2SO 0.004 2.1 0.014 6.9 330 cycloxydim-5-OH-TS 0.035 17.4 0.021 10.1 58 Milk (acetonitrile phase of methanol extract) cycloxydim-5-OH-TSO 0.007 33.9 0.004 19.5 58 cycloxydim-5-OH-T1SO 0.002 8.4 0.002 9.7 116 cycloxydim-5-OH-T2SO 0.001 6.1 0.004 20.4 400 a % TRR current study / % TRR metabolism study;
USE PATTERN
Cycloxydim is only registered as solo formulation to control annual and perennial grass weeds on a variety of crops. It is used as a post-emergence herbicide before the crop canopy prevents adequate spray penetration. The product is registered to be used in various countries in Europe, Africa and the Middle East. Table 65 shows the registered used of cycloxydim in countries and crops that are relevant to this evaluation.
Table 65 Registered use(s) of cycloxydim
Crop Country No. per crop season
kg ai/hL
Water L/ha kg ai/ha PHI
[days] Apple Italy 1 0.125–0.3 200–400 0.5–0.6 60 Apple Portugal 1 0.2–0.4 28 Apricot Italy 1 0.125–0.3 200–400 0.5–0.6 30 Beans, except broad bean and soya bean Albania 1 – – 0.5 –
Beans, except broad bean and soya bean Czech Republic – 0.133–0.2 200–300 0.4 –
Beans, except broad bean and soya bean Greece 1 0.1–0.2 200–400 0.4 28
Beans, except broad bean and soya bean Slovakia – 0.133–0.4 100–300 0.4 –
Beans, except broad bean and soya bean Slovenia 1 0.075–0.2 200–400 0.3–0.4 28
Beans, except broad bean and soya bean Sweden 1 0.2–0.6 100–200 0.4–0.6 60
Bean, dwarf Bean, dwarf (dry) United Kingdom 1 0.136–0.225 200–330 0.45 35
Bean, scarlet runner (pods & seeds) Austria 1 0.167–025 200–300 0.5 100
Beans, shelled Albania 1 – – 0.5 – Beans, shelled Czech Republic – 0.133–0.2 200–300 0.4 –

Cycloxydim
307
Crop Country No. per crop season
kg ai/hL
Water L/ha kg ai/ha PHI
[days] Beans, shelled Norway 2 3.3–6 20–30 0.5–0.6 – Beans, shelled Slovakia – 0.133–0.4 100–300 0.4 – Beans, shelled Slovenia 1 0.075–0.2 200–400 0.3–0.4 28 Beans, shelled Sweden 1 0.2–0.6 100–200 0.4–0.6 60 Beans (dry) Albania 1 – – 0.5 – Beans (dry) Czech Republic – 0.133–0.2 200–300 0.4 –
Beans (dry) France 1 0.133–0.4 100–300 0.4 b
Beans (dry) Greece 1 0.1–0.2 200–400 0.4 56 Beans (dry) Italy 1 0.125–0.3 200–400 0.5–0.6 60 Beans (dry) Slovakia – 0.133–0.4 100–300 0.4 –
Beans (dry) Slovenia 1 0.075–0.2 200–400 0.3–0.4 b
Brassica vegetables, head cabbages, flowerhead brassicas
Czech Republic – 0.133–0.2 (aerial appl.: 0.5–1.0)
200–300 aerial: 40–80 0.4 –
Brassica vegetables, head cabbages, flowerhead brassicas
Slovakia – 0.133–0.2 100–300 0.4 –
Brassica vegetables, head cabbages, flowerhead brassicas
Spain 1 – – 0.3–0.4 a
Brassica vegetables, head cabbages, flowerhead brassicas
Switzerland 1 – – 0.5–0.6 28
Brassica leafy vegetables Switzerland 1 – – 0.5–0.6 28
Broad bean Broad bean (dry) Belgium 1 0.13–0.4 150–300 0.4–0.6 28
Broad bean Broad bean (dry) Ireland 1 0.133–0.4 100–300 0.4 56
Broad bean Luxembourg 1 0.133–0.4 150–300 0.4–0.6 28 Broad bean Broad bean (dry) Netherlands 1–2 0.1–0.3 200–400 0.4–0.6 28
Broad bean Broad bean (dry) Spain 1 – – 0.3–0.4
a
Broad bean, shelled Belgium 1 0.13–0.4 150–300 0.4–0.6 28 Brussels sprouts Ireland 1 0.133–0.4 100–300 0.4 56 Brussels sprouts Norway 2 3.3–6 20–30 0.5–0.6 – Brussels sprouts United Kingdom 1 0.136–0.225 200–330 0.45 56 Brussels sprouts Portugal 1 0.2–0.4 56 Cabbages, head Austria 1 0.167–025 200–300 0.5 28 Cabbages, head Belgium 1 0.13–0.4 150–300 0.4–0.6 28 Cabbages, head France 1 0.133–0.4 100–300 0.4 60 Cabbages, head Ireland 1 0.133–0.4 100–300 0.4 28 Cabbages, head Italy 1 0.125–0.3 200–400 0.5–0.6 60 Cabbages, head Luxembourg 1 0.133–0.4 150–300 0.4–0.6 28 Cabbages, head Norway 2 3.3–6 20–30 0.5–0.6 – Cabbages, head Portugal 1 0.067–0.2 200–600 0.4 28 Cabbages, head Slovenia 1 0.075–0.2 200–400 0.3–0.4 28 Cabbages, head Sweden 1 0.2–0.6 100–200 0.4–0.6 60 Cabbages, head United Kingdom 1 0.136–0.225 200–330 0.45 28

Cycloxydim
308
Crop Country No. per crop season
kg ai/hL
Water L/ha kg ai/ha PHI
[days] Carrot Albania 1 – – 0–5 – Carrot Austria 1 0.167–025 200–300 0.5 28 Carrot Belgium 1 0.13–0.4 150–300 0.4–0.6 28 Carrot France 1 0.133–0.4 100–300 0.4 42
Carrot Ireland 1 0.133–0.4 100–300 0.4 a
Carrot Italy 1 0.125–0.3 200–400 0.5–0.6 60 Carrot Luxembourg 1 0.133–0.4 150–300 0.4–0.6 28 Carrot Netherlands 1–2 0.1–0.3 200–400 0.4–0.6 42 Carrot Norway 2 2.6–5 20–30 0.4–0.5 – Carrot Portugal 1 0.067–0.2 200–600 0.4 49 Carrot Slovenia 1 0.075–0.2 200–400 0.3–0.4 28 Carrot Sweden 1 0.2–0.6 100–200 0.4–0.6 60 Carrot Switzerland 1 – – 0.5–0.6 28 Carrot United Kingdom 1 0.136–0.225 200–330 0.45 42 Cauliflower Ireland 1 0.133–0.4 100–300 0.4 28 Cauliflower Portugal 1 0.2–0.4 56 Cauliflower Slovenia 1 0.075–0.2 200–400 0.3–0.4 28 Cauliflower Sweden 1 0.2–0.6 100–200 0.4–0.6 60 Cauliflower United Kingdom 1 0.136–0.225 200–330 0.45 28 Celeriac France 1 0.133–0.4 100–300 0.4 48 Celeriac Norway 2 3.3–6 20–30 0.5–0.6 – Celeriac Sweden 1 0.2–0.6 100–200 0.4–0.6 60 Celeriac Switzerland 1 – – 0.5–0.6 56 Field bean Field bean (dry) Austria 1 0.167–025 200–300 0.5 56
Field bean Field bean (dry) Belgium 1 0.13–0.4 150–300 0.4–0.6 28
Field bean France 1 0.133–0.4 100–300 0.4 56 Field bean Germany 1 0.25 200 0.5 56 Field bean Field bean (dry) Ireland 1 0.133–0.4 100–300 0.4 56
Field bean Luxembourg 1 0.133–0.4 150–300 0.4–0.6 28 Field bean Field bean (dry) Netherlands 1–2 0.1–0.3 200–400 0.4–0.6 28
Field bean Field bean (dry) Portugal 1 0.067–0.2 200–600 0.4 49
Field bean Field bean (dry) Romania – 0.15–0.8 50–200 0.3–0.4 –
Field bean Field bean (dry) Spain 1 – – 0.3–0.4
a
Field bean Field bean (dry) Switzerland 1 – – 0.5–0.6 21
Field bean Field bean (dry) United Kingdom 1 0.136–0.225 200–330 0.45 56
Field pea (dry) Belgium 1 0.13–0.4 150–300 0.4–0.6 b
Field pea (dry) Germany 1 0.167–0.333 150–300 0.5 b
Field pea (dry) Luxembourg 1 0.133–0.4 150–300 0.4–0.6 b
Field pea (dry) Netherlands 1–2 0.1–0.3 200–400 0.4–0.6 b

Cycloxydim
309
Crop Country No. per crop season
kg ai/hL
Water L/ha kg ai/ha PHI
[days] Fodder beet Albania 1 – – 0.5 – Fodder beet Austria 1 0.167–025 200–300 0.5 56 Fodder beet Belgium 1 0.13–0.4 150–300 0.4–0.6 90 Fodder beet Czech Republic – 0.133–0.2 200–300 0.4 –
Fodder beet Germany 1 0.167–0.25 200–300 0.5 a
Fodder beet Ireland 1 0.133–0.4 100–300 0.4 56 Fodder beet Luxembourg 1 0.133–0.4 150–300 0.4–0.6 90 Fodder beet Netherlands 1–2 0.1–0.3 200–400 0.4–0.6 21 Fodder beet Slovakia – 0.133–0.4 100–300 0.4 – Fodder beet Slovenia 1 0.15–0.222 180–200 0.3–0.4 56 Fodder beet Switzerland 1 – – 0.5–0.6 56 Fodder beet United Kingdom 1 0.136–0.225 200–330 0.45 56 Garden pea Belgium 1 0.13–0.4 150–300 0.4–0.6 56 Garden pea, shelled Belgium 1 0.13–0.4 150–300 0.4–0.6 56 Garden peas, shelled Germany 1 0.167–0.333 150–300 0.5 35 Garden peas, shelled Hungary 1 0.15–0.4 100–200 0.3–0.4 60 Garden peas, shelled Ireland 1 0.133–0.4 100–300 0.4 35 Garden peas, shelled Italy 1 0.125–0.3 200–400 0.5–0.6 60
Garden peas, shelled Spain 1 – – 0.3–0.4 a
Garden peas, shelled United Kingdom 1 0.136–0.225 200–330 0.45 35 Grapes Croatia 1 0.175–0.4 100–200 0.35–0.4 42 Grapes France 1 0.133–0.4 100–300 0.4 90 Grapes Greece 1 0.1–0.2 200–400 0.4 42 Grapes Italy 1 0.125–0.3 200–400 0.5–0.6 60 Grapes Serbia 1 0.075–0.2 200–400 0.3–0.4 –
Grapes Spain 1 – – 0.3–0.4 a
Grapes Switzerland 1 – – 0.5–0.6 a
Green bean Austria 1 0.167–025 200–300 0.5 28 Green bean Belgium 1 0.13–0.4 150–300 0.4–0.6 28 Green bean Italy 1 0.125–0.3 200–400 0.5–0.6 30 Green bean Portugal 1 0.067–0.2 200–600 0.4 49
Green bean Spain 1 – – 0.3–0.4 a
Leek Austria 1 0.167–025 200–300 0.5 28 Leek France 1 0.133–0.4 100–300 0.4 42
Leek Ireland 1 0.133–0.4 100–300 0.4 a
Leek Italy 1 0.125–0.3 200–400 0.5–0.6 60 Leek Netherlands 1–2 0.1–0.3 200–400 0.4–0.6 42 Leek Norway 2 2.7–6 20–30 0.4–0.6 – Leek Portugal 1 0.067–0.2 200–600 0.4 42 Leek Slovenia 1 0.075–0.2 200–400 0.3–0.4 28 Leek Switzerland 1 – – 0.5–0.6 56 Leek United Kingdom 1 0.136–0.225 200–330 0.45 56 Linseed Czech Republic – 0.133–0.2 200–300 0.4 – Linseed France 1 0.133–0.4 100–300 0.4 90

Cycloxydim
310
Crop Country No. per crop season
kg ai/hL
Water L/ha kg ai/ha PHI
[days]
Linseed Ireland 1 0.133–0.4 100–300 0.4 a
Linseed Latvia 1–2 0.075–0.2 100–200 0.15–0.2 40 Linseed Lithuania 1 0.075–0.2 100–200 0.15–0.2 –
Linseed Luxembourg 1 0.133–0.4 150–300 0.4–0.6 a
Linseed Norway 2 3.3–6 20–30 0.5–0.6 – Linseed Slovakia – 0.133–0.4 100–300 0.4 –
Linseed Sweden 1 0.2–0.6 100–200 0.4–0.6 a
Linseed United Kingdom 1 0.136–0.225 200–330 0.45 84 Lettuce, leaf France 1 0.133–0.4 100–300 0.4 21 Lettuce, leaf Greece 1 0.1–0.2 200–400 0.4 28 Lettuce, leaf Italy 1 0.125–0.3 200–400 0.5–0.6 30 Lettuce, leaf Portugal 1 0.067–0.2 200–600 0.4 42 Lettuce, leaf Slovenia 1 0.075–0.2 200–400 0.3–0.4 14
Maize Belgium 1 0.26–0.4 150–300 0.4 a
Maize Czech Republic 1 0.133 300 0.4 –
Maize France 1 0.133–0.4 100–300 0.4 70 grain: 90
Maize Germany 1 0.16–0.2 200–250 0.4 a
Maize Hungary 1 0.1–0.16 250–300 0.3–0.4 –
Maize Luxembourg 1 0.133–0.267 150–300 0.4 a
Maize Poland 1 0.033–0.2 200–300 0.1–0.4 14
Maize Switzerland 1 – – 0.2–0.4 a
Onion Albania 1 – – 0.5 – Onion Austria 1 0.167–025 200–300 0.5 56 Onion Belgium 1 0.13–0.4 150–300 0.4–0.6 28
Onion Ireland 1 0.133–0.4 100–300 0.4 a
Onion Italy 1 0.125–0.3 200–400 0.5–0.6 60 Onion Luxembourg 1 0.133–0.4 150–300 0.4–0.6 28 Onion Netherlands 1–2 0.1–0.3 200–400 0.4–0.6 21 Onion Norway 2 2.7–6 20–30 0.4–0.6 – Onion Slovenia 1 0.075–0.2 200–400 0.3–0.4 21
Onion Spain 1 – – 0.3–0.4 a
Onion Sweden 1 0.2–0.6 100–200 0.4–0.6 40 Onion Switzerland 1 – – 0.5–0–6 56 Onion United Kingdom 1 0.136–0.225 200–330 0.45 42 Peach Italy 1 0.125–0.3 200–400 0.5–0.6 30 Peach Portugal 1 0.067–0.2 200–600 0.4 28 Peach Slovenia 1 – – 0.3–0.4 100 Peas Albania 1 – – 0.5 – Peas Austria 1 0.167–025 200–300 0.5 56 Peas Czech Republic – 0.133–0.2 200–300 0.4 – Peas France 1 0.133–0.4 100–300 0.4 42 Peas Portugal 1 0.067–0.2 200–600 0.4 49

Cycloxydim
311
Crop Country No. per crop season
kg ai/hL
Water L/ha kg ai/ha PHI
[days] Peas Slovakia – 0.133–0.4 100–300 0.4 – Peas Slovenia 1 0.075–0.2 200–400 0.3–0.4 35
Peas Sweden 1 0.2–0.6 100–200 0.4–0.6 a
Peas Switzerland 1 – – 0.5–0.6 28 Peas (dry) Albania 1 – – 0.5 – Peas (dry) France 1 0.133–0.4 100–300 0.4 56
Peas (dry) Hungary 1 0.15–0.4 100–200 0.3–0.4 b
Peas (dry) Ireland 1 0.133–0.4 100–300 0.4 b
Peas (dry) Italy 1 0.125–0.3 200–400 0.5–0.6 60 Peas (dry) Norway 2 3.3–6 20–30 0.5–0.6 Peas (dry) Slovakia – 0.133–0.4 100–300 0.4 –
Peas (dry) Slovenia 1 0.075–0.2 200–400 0.3–0.4 b
Peas (dry) Spain 1 – – 0.3–0.4 a
Peas (dry) Sweden 1 0.2–0.6 100–200 0.4–0.6 a
Peas (dry) Switzerland 1 – – 0.5–0.6 b
Peas (dry) United Kingdom 1 0.136–0.225 200–330 0.45 b
Peas, shelled Albania 1 – – 0.5 – Peas, shelled Austria 1 0.167–025 200–300 0.5 56 Peas, shelled Czech Republic – 0.133–0.2 200–300 0.4 – Peas, shelled France 1 0.133–0.4 100–300 0.4 42 Peas, shelled Portugal 1 0.067–0.2 200–600 0.4 49 Peas, shelled Slovakia – 0.133–0.4 100–300 0.4 – Peas, shelled Slovenia 1 0.075–0.2 200–400 0.3–0.4 35
Peas, shelled Sweden 1 0.2–0.6 100–200 0.4–0.6 a
Pear Italy 1 0.125–0.3 200–400 0.5–0.6 60 Pear Portugal 1 0.067–0.2 200–600 0.4 28 Pear Slovenia 1 – – 0.3–0.4 100 Peppers, Chilli, sweet Italy 1 0.125–0.3 200–400 0.5–0.6 20
Pome fruits Croatia 1 0.175–0.4 100–200 0.35–0.4 42
Pome fruits Switzerland 1 – – 0.5–0.6 a
Oil poppy France 1 0.133–0.4 100–300 0.4 90 Poppy seed Slovakia – 0.133–0.4 100–300 0.4 – Potato Belgium 1 0.13–0.4 150–300 0.4–0.6 56 Potato Croatia 1 0.15–0.4 100–200 0.3–0.4 56 Potato Czech Republic – 0.133–0.2 200–300 0.4 – Potato Estonia 1 0.2–0.6 100–200 0.4–0.6 – Potato Finland 1 0.2–0.4 150–200 0.4–0.6 55 Potato France 1 0.133–0.4 100–300 0.4 70 Potato Greece 1 0.1–0.2 200–400 0.4 – Potato Hungary 1 0.15–0.4 100–200 0.3–0.4 45 Potato Ireland 1 0.133–0.4 100–300 0.4 56 Potato Italy 1 0.125–0.3 200–400 0.5–0.6 100

Cycloxydim
312
Crop Country No. per crop season
kg ai/hL
Water L/ha kg ai/ha PHI
[days] Potato Luxembourg 1 0.133–0.4 150–300 0.4–0.6 56 Potato Netherlands 1–2 0.1–0.3 200–400 0.4–0.6 56 Potato Norway 2 3.3–6 20–30 0.5–0.6 – Potato Portugal 1 0.067–0.2 200–600 0.4 84 Potato Serbia 1 0.075–0.2 200–400 0.3–0.4 – Potato Slovakia – 0.133–0.4 100–300 0.4 – Potato Slovenia 1 0.15–0.222 180–200 0.3–0.4 77
Potato Spain 1 – – 0.3–0.4 a
Potato Sweden 1 0.2–0.6 100–200 0.4–0.6 a
Potato Switzerland 1 – – 0.5–0.6 56 Potato United Kingdom 1 0.136–0.225 200–330 0.45 56 Rape seed Austria 1 0.167–025 200–300 0.5 84 Rape seed Belgium 1 0.13–0.4 150–300 0.4–0.6 28 Rape seed Croatia 1 0.15–0.4 100–200 0.3–0.4 – Rape seed Czech Republic – 0.133–0.2 200–300 0.4 – Rape seed Estonia 1 0.2–0.6 100–200 0.4–0.6 – Rape seed France 1 0.133–0.4 100–300 0.4 90
Rape seed Germany 1 0.167–0.333 150–300 0.5 a
Rape seed Hungary 1 0.15–0.4 100–200 0.3–0.4 120 Rape seed Ireland 1 0.133–0.4 100–300 0.4 84 Rape seed Italy 1 0.125–0.3 200–400 0.5–0.6 100 Rape seed Luxembourg 1 0.133–0.4 150–300 0.4–0.6 28 Rape seed Norway 2 3.3–6 20–30 0.5–0.6 –
Rape seed Portugal 1 0.067–0.2 200–600 0.4 a
Rape seed Slovakia – 0.133–0.4 100–300 0.4 – Rape seed Slovenia 1 0.15–0.222 180–200 0.3–0.4 100
Rape seed Sweden 1 0.2–0.6 100–200 0.4–0.6 a
Rape seed Switzerland 1 – – 0.5–0.6 84 Rape seed United Kingdom 1 0.136–0.225 200–330 0.45 84 Red beet Belgium 1 0.13–0.4 150–300 0.4–0.6 90 Red beet Norway 2 2.6–5 20–30 0.4–0.5 –
Red beet Spain 1 – – 0.3–0.4 a
Red beet Switzerland 1 – – 0.5–0.6 56
Rice Italy 1 0.1–0.2 200–400 0.4 a
Soya bean Albania 1 – – 0.5 – Soya bean Austria 1 0.167–025 200–300 0.5 56 Soya bean Croatia 1 0.15–0.4 100–200 0.3–0.4 – Soya bean France 1 0.133–0.4 100–300 0.4 56
Soya bean Germany 1 0.167–0.25 200–300 0.5 a
Soya bean Hungary 1 0.15–0.4 100–200 0.3–0.4 90 Soya bean Romania – 0.15–0.8 50–200 0.3–0.4 – Soya bean Serbia 1 0.075–0.2 200–400 0.3–0.4 – Soya bean Slovakia – 0.133–0.4 100–300 0.4 – Soya bean Slovenia 1 0.075–0.2 200–400 0.3–0.4 35

Cycloxydim
313
Crop Country No. per crop season
kg ai/hL
Water L/ha kg ai/ha PHI
[days]
Soya bean Spain 1 – – 0.3–0.4 a
Soya bean Switzerland 1 – – 0.5–0.6 56 Spinach Cyprus 1 0.0875–0.225 200–400 0.35–0.45 28 Spinach Cyprus 1 0.0875–0.225 200–400 0.35–0.45 28 Spinach France 1 0.133–0.4 100–300 0.4 42 Spinach Italy 1 0.125–0.3 200–400 0.5–0.6 30 Spinach Slovenia 1 0.075–0.2 200–400 0.3–0.4 28 Stone fruits Croatia 1 0.175–0.4 100–200 0.35–0.4 42
Stone fruits Switzerland 1 – – 0.5–0.6 a
Strawberry Czech Republic – 0.133–0.2 200–300 0.4 – Strawberry Norway 2 4–6 20–30 0.6 – Strawberry Romania – 0.15–0.8 50–200 0.3–0.4 – Strawberry Slovakia – 0.133–0.4 100–300 0.4 – Strawberry Slovenia 1 0.15–0.222 180–200 0.3–0.4 100 Strawberry Switzerland 1 – – 0.5–0.6 42 Strawberry United Kingdom 1 0.136–0.225 200–330 0.45 42 Sugar beet Austria 1 0.167–025 200–300 0.5 56 Sugar beet Belgium 1 0.13–0.4 150–300 0.4–0.6 90 Sugar beet Croatia 1 0.15–0.4 100–200 0.3–0.4 77 Sugar beet Czech Republic – 0.133–0.2 200–300 0.4 – Sugar beet Estonia 1 0.2–0.6 100–200 0.4–0.6 – Sugar beet France 1 0.133–0.4 100–300 0.4 70
Sugar beet Germany 1 0.167–0.25 200–300 0.5 a
Sugar beet Greece 1 0.1–0.2 200–400 0.4 – Sugar beet Hungary 1 0.15–0.4 100–200 0.3–0.4 60 Sugar beet Ireland 1 0.133–0.4 100–300 0.4 56 Sugar beet Italy 1 0.125–0.3 200–400 0.5–0.6 100 Sugar beet Luxembourg 1 0.133–0.4 150–300 0.4–0.6 90
Sugar beet Netherlands 1–2 0.1–0.3 200–400 0.4–0.6 a
Sugar beet Portugal 1 0.067–0.2 200–600 0.4 84 Sugar beet Romania – 0.2–0.9 50–200 0.4–0.45 – Sugar beet Serbia 1 0.075–0.2 200–400 0.3–0.4 – Sugar beet Slovakia – 0.133–0.4 100–300 0.4 – Sugar beet Slovenia 1 0.15–0.222 180–200 0.3–0.4 77 Sugar beet Spain 1 – – 0.3–0.4 a
Sugar beet Switzerland 1 – – 0.5–0.6 56 Sugar beet United Kingdom 1 0.136–0.225 200–330 0.45 56 Sunflower seed Albania 1 – – 0.5 – Sunflower seed Austria 1 0.167–025 200–300 0.5 56 Sunflower seed Croatia 1 0.15–0.4 100–200 0.3–0.4 – Sunflower seed Czech Republic – 0.133–0.2 200–300 0.4 – Sunflower seed France 1 0.133–0.4 100–300 0.4 a
Sunflower seed Germany 1 0.167–0.333 150–300 0.5 100 Sunflower seed Hungary 1 0.15–0.4 100–200 0.3–0.4 90 Sunflower seed Italy 1 0.125–0.3 200–400 0.5–0.6 80 Sunflower seed Portugal 1 0.067–0.2 200–600 0.4 98

Cycloxydim
314
Crop Country No. per crop season
kg ai/hL
Water L/ha kg ai/ha PHI
[days] Sunflower seed Romania – 0.15–0.8 50–200 0.3–0.4 – Sunflower seed Serbia 1 0.075–0.2 200–400 0.3–0.4 – Sunflower seed Slovakia – 0.133–0.4 100–300 0.4 – Sunflower seed Slovenia 1 0.15–0.222 180–200 0.3–0.4 100 Sunflower seed Switzerland 1 – – 0.5–0.6 56 Swedes United Kingdom 1 0.136–0.225 200–330 0.45 56 Tomato Albania 1 – – 0.5 – Tomato France 1 0.133–0.4 100–300 0.4 60 Tomato Greece 1 0.1–0.2 200–400 0.4 35 Tomato Italy 1 0.125–0.3 200–400 0.5–0.6 60 Tomato Serbia 1 0.075–0.2 200–400 0.3–0.4 – Tomato Switzerland 1 – – 0.5–0.6 56 Turnip Slovenia 1 0.075–0.2 200–400 0.3–0.4 56 a Application at the growing stage of 2–5 weed leaf for annual weeds or when the perennial weed are 20–30 cm high b Beans or peas could be harvested at the stage of mature seeds, but the worst case scenario is covered by the harvest of immature seeds.
RESIDUES RESULTING FROM SUPERVISED TRIALS ON CROPS
Four hundred and eighty one (481) supervised residue trials conducted with cycloxydim on a variety of crops in Europe were submitted to the Meeting. Table 66 summarizes the data. Studies were conducted according to GLP, with the exception of those conducted in the late 80s and early 90s. Unless specified concurrent determination of residues in untreated crops gave residues < LOQ. All trials were conducted in Europe using EC formulation as a soil or broadcast application in early post-emergence.
In all trials, samples were analysed using common moiety methods. In the LC methods, residues of cycloxydim-TGSO2 and cycloxydim-5-OH-TGSO2 were calculated as cycloxydim (factor of 1.23) and cycloxydim-5-OH-TSO2 (factor of 1.33), respectively. In the GC methods, residues of cycloxydim-TDME and cycloxydim-5-OH-TDME were calculated as cycloxydim (factor of 1.11) and cycloxydim-5-OH-TSO2 (factor of 1.21), respectively.
The results of the supervised trials in the tables are expressed as Cy1 to indicate the residues of cycloxydim and all metabolites that can be oxidized cycloxydim-TGSO2, calculated as cycloxydim, and as Cy2 to indicate the residues of cycloxydim-5-OH-TSO2 and all metabolites that can be oxidized to cycloxydim-5-OH-TGSO2, calculated as cycloxydim-5-OH-TSO2. Total residues arriving from the use of cycloxydim are the sum of Cy1 and Cy2 (Total cycloxydim), calculated as cycloxydim (factor of 0.87). In some samples, residues of cycloxydim-TSO (Cy-TSO) were also estimated using a specific method, and residues expressed as cycloxydim (factor of 0.95).
Residues of cycloxydim arising from use patterns where rate or PHI or ± 25% of GAP are underlined and considered for estimation of maximum residue levels, STMRs and HRs. When residues in samples harvested at a later stage were higher than those found at the critical PHI, they were used for the estimations. When a GAP with no specified PHI was used to support a trial, the highest residue found in the trials, except that of 0 day PHI, was selected for the estimation. In the tables, DAT means days after treatment.
Table 66 Summary or the residue trials conducted with cycloxydim in Europe
Table number Crop Number of trials Period 67 Apple/pears 4 2006 68 Apricot/peach 5 1990–1991 69 Grape 16 2005–2006 70 Strawberry 16 1989–2008

Cycloxydim
315
Table number Crop Number of trials Period 71 Onion 19 1995–2005 72 Leek 14 1989–2007 73 Brussels sprouts 12 2005–2007 74 Cabbage 14 2001–2006 75 Cauliflower 14 2001–2006 76 Pepper 8 1991–2006 77 Tomato 16 2005–2006 78 Kale, curly 22 2005 79 Lettuce 8 2001–2008 80 Spinach 8 2005 81 Green beans 15 1988–2008 82 Green peas 14 2006 83 Dry beans 21 2001–2006 84 Dry peas 14 1987–2002 85 Soya beans 13 2005–2007 86 Carrots 15 2001–2007 87 Celeriac 8 2006–2007 88 Potato 18 1986–2002 89 Turnips 6 1987–1989 90 Sugar beet 18 1988–2001 91 Maize 14 1995–1996 92 Rice 11 1993–1996 93 Rape seed 15 1987–2008 94 Sunflower 19 1993–2008 Feed commodities 95 Beans 33 2001–2008 96 Peas 25 2005–2006 97 Sugar beet tops 16 1986–2001 98 Maize straw 19 1995–1996 99 Rice straw 8 1995–1996 100 Rape seed forage 3 1989
Pome fruits
Four residue trials were conducted in apples and pears in Spain and Italy in 2006. Samples were analysed according to method 407/1. The results are shown in Table 67.
Table 67 Results of residue trials conducted with cycloxydim on apples and pears
Country, year
Crop Variety
Application
DAT, days
Residues, mg/kg Study Trial No No kg ai/ha
kg ai/hL Cy1 Cy2
Total cycloxydim
Italy, 2006 Apple Granny Smith
1 0.500 0.125 0 22 28 35
< 0.05 < 0.05 < 0.05 < 0.05
< 0.04 < 0.04 < 0.04 < 0.04
< 0.09 < 0.09 < 0.09 < 0.09
2007/ 1020716 06IT/006R
Spain, 2006
Apple Golden
1 0.500 0.125 0 22 28 35
< 0.05 < 0.05 < 0.05 < 0.05
< 0.04 < 0.04 < 0.04 < 0.04
< 0.09 < 0.09 < 0.09 < 0.09
2007/ 1020716 06ES/005R
Italy, 2006 Pear William
1 0.500 0.125 0 22 28 35
< 0.05 < 0.05 < 0.05 < 0.05
< 0.04 < 0.04 < 0.04 < 0.04
< 0.09 < 0.09 < 0.09 < 0.09
2007/ 1020716 06IT/006R
Spain, 2006
Pear Tosca
1 0.500 0.125 0 22 28 35
< 0.05 < 0.05 < 0.05 < 0.05
< 0.04 < 0.04 < 0.04 < 0.04
< 0.09 < 0.09 < 0.09 < 0.09
2007/ 1020716 06ES/005R

Cycloxydim
316
Stone fruits
Five residue trials were conducted in apricots and peaches in Italy in 1990–1991. Residues were determined using Method 263. The results are shown in Table 68. Table 68 Results of residue trials conducted with cycloxydim on apricots and peaches
Country, year
Crop Variety
Application DAT, days
Residues, mg/kg Study Trial No No kg
ai/ha kg ai/hL
Cy1 Cy2 Total cycloxydim
Italy, 1991
Apricot Precoce di Colomer
1 0.600 0.200 25 50 75
0.050 < 0.05 < 0.05
< 0.04 < 0.04 < 0.04
< 0.09 < 0.09 < 0.09
1991/ 11589 IT5/037
Italy, 1991
Apricot Reale d'Imola
1 0.600 0.200 25 50 75
< 0.05 < 0.05 < 0.05
< 0.04 < 0.04 < 0.04
< 0.09 < 0.09 < 0.09
1991/ 11589 IT5/038
Italy, 1990
Peach Fayette
1 0.600 0.200 25 50 73
< 0.05 < 0.05 < 0.05
< 0.04 < 0.04 < 0.04
< 0.09 < 0.09 < 0.09
1991/ 11588 IT5/083
Italy, 1990
Peach Baby
1 0.600 0.200 24 49 74
< 0.05 < 0.05 < 0.05
< 0.04 < 0.04 < 0.04
< 0.09 < 0.09 < 0.09
1991/ 11588 IT5/086
Italy, 1991
Peach Fayette
1 0.600 0.200 24 49 72
< 0.05 < 0.05 < 0.05
< 0.04 < 0.04 < 0.04
< 0.09 < 0.09 < 0.09
1991/ 11588 IT5/062
Grapes
Sixteen residue trials were conducted in grapes in Europe in 2005–2006. Residues were determined using Method 407/1. The results are shown in Table 69. Table 69 Results of residue trials conducted with cycloxydim on grapes
Application Residues, mg/kg Country, year Variety No kg
ai/ha kg ai/hL
DAT, days
Cy1 Cy2 Total cycloxydim
Cy- TSO Study Trial No.
France, 2005 Centre
Grape Chenin
1 0.500 0.167 0 35 42 49
< 0.05 < 0.05 < 0.05 < 0.05
< 0.04 < 0.04 < 0.04 < 0.04
< 0.09 < 0.09 < 0.09 < 0.09
– – – –
2006/ 1030352 05 H VI FR P16
France, 2005 North
Grape Pinot Meunier
1 0.500 0.167 0 34 41 49
< 0.05 < 0.05 0.14 < 0.05
< 0.04 < 0.04 < 0.04 < 0.04
< 0.09 < 0.09 0.18 < 0.09
– – – –
2006/ 1030352 05 H VI FR P17
France, 2005 South
Grape Merlot
1 0.500 0.167 0 35 42
< 0.05 < 0.05 < 0.05
< 0.04 < 0.04 < 0.04
< 0.09 < 0.09 < 0.09
– – –
2006/ 1030352 05 H VI FR P15
France, 2006 North
Grape Chardonnay
1 0.500 0.167 0 35 42
0.07 < 0.05 0.09
< 0.04 < 0.04 < 0.04
0.11 < 0.09 0.13
– – < 0.05
2007/ 1020717 06FR/022R
France, 2006 North
Grape Chenin
1 0.500 0.167 0 35 42 49
< 0.05 0.09 0.08 0.08
< 0.04 < 0.04 < 0.04 < 0.04
< 0.09 0.13 0.12 0.12
– – < 0.05 < 0.05
2007/ 1020717 06FR/023R
France, 2006 South
Grape Carignan
1 0.500 0.167 0 35 42 49
< 0.05 < 0.05 < 0.05 < 0.05
< 0.04 < 0.04 < 0.04 < 0.04
< 0.09 < 0.09 < 0.09 < 0.09
– – – –
2007/ 1020717 06FR/020R
Greece, 2005 Grape Muscat
1 0.500 0.167 0 35 42 49
< 0.05 < 0.05 < 0.05 < 0.05
< 0.04 < 0.04 < 0.04 < 0.04
< 0.09 < 0.09 < 0.09 < 0.09
– – – –
2006/ 1030352 05RF036
Greece, 2006 Grape Muschat
1 0.500 0.167 0 35
< 0.05 < 0.05
< 0.04 < 0.04
< 0.09 < 0.09
– –
2007/ 1020717 06GR/021R

Cycloxydim
317
Application Residues, mg/kg Country, year Variety No kg
ai/ha kg ai/hL
DAT, days
Cy1 Cy2 Total cycloxydim
Cy- TSO Study Trial No.
42 49
< 0.05 < 0.05
< 0.04 < 0.04
< 0.09 < 0.09
– –
Germany, 2006 Grape Kerner
1 0.500 0.167 0 35 42 49
< 0.05 < 0.05 < 0.05 < 0.05
< 0.04 < 0.04 < 0.04 < 0.04
< 0.09 < 0.09 < 0.09 < 0.09
– – – –
2007/ 1020717 06GE/024R
Germany, 2006 Grape Riesling
1 0.500 0.167 0 35 42 49
< 0.05 0.07 < 0.05 0.09
< 0.04 < 0.04 < 0.04 0.09
< 0.09 0.11 < 0.09 0.18
– – – < 0.05
2007/ 1020717 06GE/025R
Germany, 2005 Grape Silvaner
1 0.500 0.167 0 36 44 50
< 0.05 < 0.05 < 0.05 < 0.05
< 0.04 < 0.04 < 0.04 < 0.04
< 0.09 < 0.09 < 0.09 < 0.09
– – – –
2006/ 1030352 AT-07/004-1
Germany, 2005 Grape Silvaner
1 0.500 0.167 0 35 42 48
< 0.05 < 0.05 < 0.05 < 0.05
< 0.04 < 0.04 < 0.04 < 0.04
< 0.09 < 0.09 < 0.09 < 0.09
– – – –
2006/ 1030352 AT-07/004-2
Italy, 2005 Grape Trebbiano Romagnolo
1 0.500 0.167 0 35 42 49
< 0.05 < 0.05 < 0.05 < 0.05
< 0.04 < 0.04 < 0.04 < 0.04
< 0.09 < 0.09 < 0.09 < 0.09
– – – –
2006/ 1030352 0542R
Italy, 2006 Grape Trebbiano
1 0.500 0.167 0 36 42 49
< 0.05 < 0.05 < 0.05 < 0.05
< 0.04 < 0.04 < 0.04 < 0.04
< 0.09 < 0.09 < 0.09 < 0.09
– – – –
2007/ 1020717 06IT/019R
Spain, 2006 Grape Merlot
1 0.500 0.167 0 35 42 49
0.10 < 0.05 < 0.05 < 0.05
< 0.04 < 0.04 < 0.04 < 0.04
0.14 < 0.09 < 0.09 < 0.09
– – – –
2007/ 1020717 06ES/017R
Spain, 2006 Grape Airen
1 0.500 0.167 0 35 42 49
< 0.05 < 0.05 < 0.05 < 0.05
< 0.04 < 0.04 < 0.04 < 0.04
< 0.09 < 0.09 < 0.09 < 0.09
– – – –
2007/ 1020717 06ES/018R
Strawberries
Sixteen residue trials were conducted in strawberries in Europe from 1989 to 2008. Residues were determined using Methods 407/1 or 493/0. The results are shown in Table 70. Table 70 Results of residue trials conducted with cycloxydim on strawberries
Application Residues, mg/kg Country, year Variety No kg
ai/ha kg ai/hL
DAT, days
Cy1 Cy2 Total cycloxydim
Cy- TSO Study Trial No.
France, 2005 South
Aromas 1 0.500 0.167 35 42 49
0.45 0.21 0.16
0.12 0.05 0.04
0.57 0.26 0.20
– – –
2006/ 1026946 05FR/035R
France, 2006 South
Naiad 1 0.500 0.167 35 41 49
0.21 0.14 0.13
0.14 0.12 0.15
0.35 0.26 0.28
– < 0.05 < 0.05
2007/ 1020730 06FR/092R
Germany, 2008 Elsanta 1 0.500 0.333 34 42 49
0.08 0.08 0.12
0.08 0.11 0.22
0.16 0.19 0.34
– 0.08 < 0.05
2009/ 1069375 L080155
Greece, 2005 Toulda 1 0.500 0.167 35 42 49
0.32 0.26 0.21
0.17 0.16 0.12
0.49 0.42 0.33
– – –
2006/ 1026946 05GR/038R
Greece, 2006 Aroma 1 0.500 0.167 35 42 48
1.1 0.45 0.31
0.30 0.27 0.12
1.4 0.72 0.43
– < 0.05 < 0.05
2007/ 1020730 06GR/093R
Italy, 2005 Tetis 1 0.500 0.167 35 0.54 0.20 0.74 – 2006/ 1026946

Cycloxydim
318
Application Residues, mg/kg Country, year Variety No kg
ai/ha kg ai/hL
DAT, days
Cy1 Cy2 Total cycloxydim
Cy- TSO Study Trial No.
42 49
0.29 0.10
0.07 < 0.04
0.36 0.14
– –
05IT/036R
Italy, 2006 Tetis 1 0.500 0.167 0 36 43 50
14.7 0.62 0.45 0.81
0.04 0.32 0.16 0.43
15 0.94 0.61 1. 4
– – 0.09 0.07
2007/ 1020730 06IT/091R
Netherlands, 2008
Elsanta 1 0.500 0.333 35 42 49
0.10 0.06 < 0.05
0.12 0.11 0.07
0.22 0.17 0.12
– < 0.05 –
2009/ 1069375 L080156
Spain, 2005 Camarosa 1 0.500 0.167 36 43 49
0.19 0.14 0.13
0.10 0.07 0.06
0.29 0.21 0.19
– – –
2006/ 1026946 05ES/037R
Spain, 2005/2006
Camarosa 1 0.500 0.167 0 35 42 48
0.55 0.21 0.11 0.11
< 0.04 0.12 0.06 0.06
0.59 0.33 0.17 0.17
– – < 0.05 < 0.05
2007/ 1020730 06ES/090R
Sweden, 1989 Senga Sengang
1 0.600 0.120 39 0.35 0.28 0.63 – 1992/ 12145 89/18E
United Kingdom, 1995
Elsanta 1 0.500 0.215 42 0.23 0.24 0.47 – 1997/ 10554 OAT/32/95
United Kingdom, 1995
Elsanta 1 0.500 0.215 41 0.15 0.18 0.33 – 1997/ 10554 OAT/33/95
United Kingdom, 1995
Elsanta 1 0.500 0.215 42 0.14 0.15 0.29 – 1997/ 10554 OAT/34/95
United Kingdom, 1995
Pegasus 1 0.500 0.215 42 0.12 0.07 0.19 – 1997/ 10554 OAT/35/95
United Kingdom, 2008
Florence 1 0.500 0.333 35 43 50
0.31 0.25 0.17
0.30 0.27 0.21
0.61 0.52 0.38
– 0.17 0.06
2009/ 1069375 L080154
Onions
Twenty three residue trials were conducted on onions in Europe from 1995 to 2005. Residues were determined with Methods 407/1 or 493/0. The results are shown in Table 71.
Table 71 Results of residue trials conducted with cycloxydim on onions
Application Residues, mg/kg Country, year Variety No kg
ai/ha kg ai/hL
Portion analysed
DAT, days
Cy1 Cy2 Total cycloxydim
Cy- TSO
Study Trial No.
France, 2005 North
Onion Hyfield
1 0.500 0.333 plant a bulb bulb bulb
0 21 28 35
2.2 0.27 0.21 0.18
< 0.04 < 0.04 < 0.04 < 0.04
2.2 0.31 0.25 0.22
– – – –
2006/ 1029595 05 H CL FR P07
France, 2005 South
Onion Elody
1 0.500 0.333 plant a bulb bulb bulb
0 20 27 34
4.2 0.24 0.23 0.28
< 0.04 < 0.04 < 0.04 < 0.04
4.2 0.28 0.27 0.32
– – – –
2006/ 1029595 05 H CL FR P08
Greece, 2001 Onion Regina
1 0.611 0.195 wh. plant shallots bulb bulb bulb
0 42 28 42 55
2.25 0.74 0.24 0.24 0.2
< 0.04 < 0.04 < 0.04 < 0.04 < 0.04
2.3 0.78 0.28 0.28 0.24
2.36 0.06 0.07 < 0.05 < 0.05
2003/ 1001289 01RF020
Greece, 2005 Onion Bermuda
1 0.500 0.333 plant a bulb bulb bulb
0 20 28 35
3.9 1.3 0.92 0.94
< 0.04 < 0.04 < 0.04 < 0.04
3.9 1.3 0.96 0.98
– – – –
2006/ 1029595 05RF038

Cycloxydim
319
Application Residues, mg/kg Country, year Variety No kg
ai/ha kg ai/hL
Portion analysed
DAT, days
Cy1 Cy2 Total cycloxydim
Cy- TSO
Study Trial No.
Italy, 2001 Onion Globix
1 0.587 0.200 wh. plant shallots bulb bulb bulb
0 28 28 42 56
3.13 0.51 0.27 0.24 0.15
< 0.04 < 0.04 < 0.04 < 0.04 < 0.04
3.2 0.55 0.31 0.28 0.19
2.5 0.07 0.13 < 0.05 < 0.05
2003/ 1001289 0138R
Italy, 2005 Onion Alix
1 0.500 0.333 plant a bulb bulb bulb
0 21 28 35
3.3 0.21 0.18 0.13
< 0.04 < 0.04 < 0.04 < 0.04
3.3 0.25 0.22 0.17
– – – –
2006/ 1029595 0544R
Netherlands, 2005
Onion Stuttgarter Riesen
1 0.500 0.333 plant a bulb bulb bulb
0 21 29 35
3.6 0.17 0.17 0.16
< 0.04 < 0.04 < 0.04 < 0.04
3.6 0.21 0.21 0.2
– – – –
2006/ 1029595 AGR/50/05
Spain, 2001 Onion Grano
1 0.600 0.200 wh. plant leaves bulbs bulbs skinned b. dried b.
0 30 30 42 63 63
5.97 5.04 0.21 0.17 0.12 0.14
< 0.04 0.12 < 0.04 < 0.04 < 0.04 < 0.04
6.0 5.16 0.25 0.21 0.16 0.18
– – – – – –
2005/ 1007586 01/V01/HR/ 001
Spain, 2001 Onion Grano
1 0.600 0.200 wh. plant leaves leaves bulbs bulbs skinned b. dried b.
0 29 41 29 41 62 62
6.75 0.52 0.07 0.08 < 0.05 0.07 < 0.05
< 0.04 < 0.04 < 0.04 < 0.04 < 0.04 < 0.04 < 0.04
6.79 0.56 0.11 0.12 < 0.09 0.11 < 0.09
– – – – – – –
2005/ 1007586 01/V02/HR/ 001
Spain, 2001 Onion Grano
1 0.600 0.200 wh. plant leaves bulbs leaves bulbs peeled b. dried b.
0 28 28 43 43 64 64
6.48 0.75 0.46 0.44 0.11 0.14 0.19
< 0.04 < 0.04 < 0.04 < 0.04 < 0.04 < 0.04 < 0.04
6.5 0.79 0.50 0.48 0.15 0.18 0.23
– – – – – – –
2005/ 1007586 01/V03/HR/ 001
Spain, 2002 Onion Reka
1 0.600 0.200 plant a
plant a plant a bulb bulb bulb dried o. peeled o.
0 28 42 28 42 56 63 63
3.08 0.11 0.05 < 0.05 < 0.05 < 0.05 < 0.05 < 0.05
< 0.04 < 0.04 < 0.04 < 0.04 < 0.04 < 0.04 < 0.04 < 0.04
3.1 0.15 0.09 < 0.09 < 0.09 < 0.09 < 0.09 < 0.09
– – – – – – – –
2003/ 1001250 ALO/06/02
Spain, 2002 Onion Vaquero
1 0.600 0.200 plant a plant a plant a bulb bulb bulb dried o. peeled o.
0 28 42 28 42 56 63 63
7.87 0.28 0.12 0.06 < 0.05 < 0.05 < 0.05 < 0.05
< 0.04 < 0.04 < 0.04 < 0.04 < 0.04 < 0.04 < 0.04 < 0.04
7.9 0.32 0.16 0.10 < 0.09 < 0.09 < 0.09 < 0.09
– – – – – – – –
2003/ 1001250 AYE/05/02
Spain, 2005 Onion Elody
1 0.500 0.333 plant a bulb bulb bulb
0 21 28 36
2.1 0.13 0.12 0.09
< 0.04 < 0.04 < 0.04 < 0.04
2.1 0.17 0.16 0.13
– – – –
2006/ 1029595 05ES/089R
Sweden, 2005 Onion Hytech
1 0.500 0.333 plant a bulb bulb bulb
0 21 28 35
2.5 0.29 0.27 0.24
< 0.04 < 0.04 < 0.04 < 0.04
2.5 0.33 0.31 0.28
– – – –
2006/ 1029595 HUS/19502-01
United Kingdom, 2005
Onion Sturon
1 0.500 0.333 plant a bulb bulb bulb
0 21 28 35
3.8 0.53 0.35 0.37
< 0.04 < 0.04 < 0.04 < 0.04
3.8 0.57 0.39 0.41
– – – –
2006/ 1029595 774/ONI/1
United Kingdom, 1995
Onion White
2 0.505 0.223
0.215 0.096
wh. plant bulb
0 26
10.5 < 0.05
0.08 < 0.04
11 < 0.09
– –
1997/ 10561 OAT/37/95

Cycloxydim
320
Application Residues, mg/kg Country, year Variety No kg
ai/ha kg ai/hL
Portion analysed
DAT, days
Cy1 Cy2 Total cycloxydim
Cy- TSO
Study Trial No.
Lisbon stem 26 0.05 < 0.04 0.09 – 1 0.476 0.214 wh. plant
bulb stem
0 26 26
29.9 < 0.05 < 0.05
0.09 < 0.04 < 0.04
30 < 0.09 < 0.09
– – –
United Kingdom, 1995
Onion Guardsman
2 0.480 0.228
0.215 0.095
wh. plant bulb stem
0 28 28
5 < 0.05 0.05
0.11 < 0.04 < 0.04
5.1 < 0.09 0.09
– – –
1997/ 10561 OAT/38/95
1 0.437 0.215 wh. plant bulb stem
0 28 28
11.5 < 0.05 0.06
0.12 < 0.04 < 0.04
12 < 0.09 0.10
– – –
United Kingdom, 1995
Onion Guardsman
2 0.471 0.204
0.215 0.095
wh. plant bulb stem
0 29 29
11.4 < 0.05 0.07
0.08 < 0.04 < 0.04
12 < 0.09 0.11
– – –
1997/ 10561 OAT/39/95
1 0.500 0.216 wh. plant bulb stem
0 29 29
3.4 < 0.05 0.09
< 0.04 < 0.04 < 0.04
3.4 < 0.09 0.15
– – –
United Kingdom, 1995
Onion Hikasi
2 0.514 0.226
0.215 0.095
wh. plant bulb stem
0 26 26
3.9 < 0.05 < 0.05
0.09 < 0.04 < 0.04
4.0 < 0.09 < 0.09
– – –
1997/ 10561 OAT/44/95
1 0.501 0.215 wh. plant bulb stem
0 26 26
1.9 < 0.05 0.07
< 0.04 < 0.04 < 0.04
1.9 < 0.09 0.11
– – –
a Without root
Leeks
Fourteen residue trials were conducted on leeks in Europe from 1989 to 2007. Residues were determined with Methods 407/1 or 493/0. The results are shown in Table 72. Table 72 Results of residue trials conducted with cycloxydim on leeks (plants without roots)
Application Residues, mg/kg Country, year Variety No kg
ai/ha kg ai/hL
DAT, days
Cy1 Cy2 Total cycloxydim
Cy– TSO Study Trial No.
Belgium, 2007 Harston 1 0.500 0.170 0 34 41 49
3.9 0.24 0.22 0.13
< 0.04 < 0.04 < 0.04 < 0.04
4.0 0.28 0.26 0.17
N/A N/A 0.07 0.06
2009/ 1075171 L070355
Denmark, 2007 Pandora 1 0.500 0.170 0 35 42 49
8.1 0.29 0.13 0.08
< 0.04 < 0.04 < 0.04 < 0.04
8.1 0.33 0.17 0.12
N/A N/A < 0.05 < 0.05
2009/ 1075171 L070353
France, 2006 South
Azur 1 0.500 0.170 0 35 42 49
1.4 0.08 < 0.05 < 0.05
< 0.04 < 0.04 < 0.04 < 0.04
1.4 0.12 < 0.09 < 0.09
– – – –
2007/ 1020726 06FR/039R
France, 2007 North
Fahrenheit 1 0.500 0.170 0 35 42 49
4.8 0.34 0.35 0.25
< 0.04 < 0.04 < 0.04 < 0.04
4.9 0.38 0.39 0.29
N/A N/A 0.07 0.07
2009/ 1075171 L070354
Germany, 2007 Puristo 1 0.500 0.170 0 35 42 49
8.8 2.2 2.1 0.99
< 0.04 0.06 0.05 < 0.04
8.8 2.3 2.2 1.0
N/A N/A 0.79 0.56
2009/ 1075171 L070350
Greece, 2006 Demi 1 0.500 0.170 0 35 42 49
5.1 0.06 < 0.05 < 0.05
< 0.04 < 0.04 < 0.04 < 0.04
5.2 0.10 < 0.09 < 0.09
– – – –
2007/ 1020726 06GR/040R
Italy, 2006 Lungo Riviera
1 0.500 0.170 0 35
5.6 0.06
< 0.04 0.09
5.7 0.15
– –
2007/ 1020726 06IT/038R

Cycloxydim
321
Application Residues, mg/kg Country, year Variety No kg
ai/ha kg ai/hL
DAT, days
Cy1 Cy2 Total cycloxydim
Cy– TSO Study Trial No.
42 49
< 0.05 < 0.05
< 0.04 < 0.04
< 0.09 < 0.09
– –
Netherlands, 1989
Arkona 1 0.600 0.106 42 0.07 < 0.04 0.11
– 1992/12153; NL4/025 517 01H 89/76 E
Netherlands, 1989
Portant 1 0.600 0.106 42 0.20 < 0.04 0.24 – 1992/ 12153 NL4/024 517 01H 89/75 E
Netherlands, 1989
Portant 1 0.600 0.106 42 0.166 < 0.04 0.21 – 1992/ 12146 NL4/024 517 22H 89/30 E
Netherlands, 1989
Arkona 1 0.600 0.106 42 0.066 0.053 0.12 – 1992/ 12146; NL4/025 517 22H 89/31 E
Netherlands, 2007
Shelton 1 0.500 0.170 0 35 42 49
1.2 0.58 0.48 0.34
< 0.04 < 0.04 < 0.04 < 0.04
1.2 0.62 0.52 0.38
N/A N/A 0.20 0.17
2009/ 1075171 L070351
Spain, 2006 Arial 1 0.500 0.170 0 36 41 48
4.8 < 0.05 0.05 < 0.05
< 0.04 < 0.04 < 0.04 < 0.04
4.9 < 0.09 0.09 < 0.09
– – – –
2007/ 1020726 06ES/037R
United Kingdom, 2007
Roxton 1 0.500 0.170 0 35 42 49
5.8 0.09 0.09 < 0.05
< 0.04 < 0.04 < 0.04 < 0.04
5.8 0.13 0.13 < 0.09
N/A N/A < 0.05 N/A
2009/ 1075171 L070352
Brussels sprouts
Twelve residue trials were conducted on Brussels sprouts in Europe from 2005 to 2007. Residues were determined with Methods 407/1 or 493/0. The results are shown in Table 73. Table 73 Results of residue trials conducted with cycloxydim on Brussels sprouts
Application Residues, mg/kg Country, year Variety No kg
ai/ha kg ai/hL
Portion analysed
DAT, days
Cy1 Cy2 Total cycloxydim
Cy- TSO
Study Trial No.
Belgium, 2005/2006
Brussels sprouts Maximus
1 0.500 0.333 plant a sprouts sprouts sprouts
0 35 42 49
4.2 1.5 1.4 1.1
0.10 0.26 0.18 0.19
4.3 1.8 1.6 1.3
– – – –
2006/ 1034211 G021-05 H
France, 2006 South
Brussels sprouts Ambitus F1
1 0.500 0.333 plant a sprouts sprouts sprouts
0 35 42 51
8.2 1.4 1.8 0.28
0.05 0.12 0.11 < 0.04
8.2 1.5 1.9 0.32
– – 1.06 < 0.05
2007/ 1020722 06FR/058R
France, 2005/2006 North
Brussels sprouts Cumulus
1 0.500 0.333 plant a sprouts sprouts sprouts
0 35 42 49
3.2 0.84 0.97 0.97
0.04 0.05 0.05 0.06
3.2 0.89 1.0 1.0
– – – –
2006/ 1034211 05 H CL FR P06
France, 2006 North
Brussels sprouts Cumulus
1 0.500 0.333 plant a sprouts sprouts sprouts
0 35 42 50
2.9 3.08 2.66 3.25
0.08 0.35 0.28 0.32
3.0 3.4 2.9 3.6
– – 1.94 2.40
2007/ 1020722 06FR/059R
Germany, 2006
Brussels sprouts Cyrus
1 0.500 0.333 plant a sprouts sprouts sprouts
0 35 42 49
7.7 0.84 0.86 0.51
0.14 0.17 0.21 0.18
7.8 1.0 1.1 0.69
– – 0.25 0.22
2007/ 1020722 06GE/060R
Greece, 2005 Brussels sprouts Ikaros
1 0.500 0.333 plant a sprouts sprouts sprouts
0 36 42 49
5.4 2.5 3.1 2.6
0.16 0.30 0.44 0.36
5.6 2.8 3.5 3.0
– – – –
2006/ 1034211 05RF037

Cycloxydim
322
Application Residues, mg/kg Country, year Variety No kg
ai/ha kg ai/hL
Portion analysed
DAT, days
Cy1 Cy2 Total cycloxydim
Cy- TSO
Study Trial No.
Italy, 2005/2006
Brussels sprouts Mezzo Nano
1 0.500 0.333 plant a sprouts sprouts sprouts
0 35 41 49
8.6 2.2 2.1 1.7
0.44 0.41 0.33 0.22
9.0 2.6 2.4 1.9
– – – –
2006/ 1034211 0541R
Netherlands, 2006
Brussels sprouts Lunet
1 0.500 0.333 plant a sprouts sprouts sprouts
0 35 41 50
6.2 1.6 1.2 0.82
< 0.04 0.37 0.29 0.26
6.3 2.0 1.5 1.1
– – 0.52 0.47
2007/ 1020722 06NL/061R
Sweden, 2005 Brussels sprouts Rudius
1 0.500 0.333 plant a sprouts sprouts sprouts
0 36 42 50
9.1 1.0 0.52 0.75
0.16 0.14 0.07 0.10
9.3 1.1 0.59 0.85
– – – –
2006/ 1034211 HUS/190503-01
Spain, 2006/2007
Brussels sprouts Sanda
1 0.500 0.333 plant a sprouts sprouts sprouts
0 35 42 50
20 5.7 2.3 1.7
0.31 0.37 0.33 0.24
20 6.0 2.6 1.9
– – 1.15 1.21
2007/ 1020722 06ES/057R
United Kingdom, 2005
Brussels sprouts Abacus
1 0.500 0.333 plant a sprouts sprouts sprouts
0 35 42 49
8.1 2.4 1.8 2.0
0.32 0.46 0.53 0.61
8.4 2.9 2.3 2.6
– – – –
2006/ 1034211 754/SPR/1
United Kingdom, 2006
Brussels sprouts Maximus
1 0.500 0.333 plant a sprouts sprouts sprouts
0 36 42 48
7.4 1.5 1.0 1.3
0.30 0.38 0.34 0.37
7.7 1.8 1.3 1.7
– – 0.80 0.74
2007/ 1020722 06UK/062R
a Without root
Cabbage
Eighteen residue trials were conducted on cabbages in Europe in 2001 and 2006. Residues were determined with Methods 407/1 or 493/0.The results are shown in Table 74. Table 74 Results of residue trials conducted with cycloxydim on cabbage head
Application Residues, mg/kg Country, year Variety No kg
ai/ha kg ai/hL
DAT, days
Cy1 Cy2 Total cycloxydim
Cy- TSO Study Trial No.
Belgium, 2001 Lion F1 1 0.600 0.200 0 28 42 57
2.5 1.1 0.75 1.14
0.16 0.17 0.14 0.10
2.7 1.3 0.89 1.2
– – – –
2002/ 1004111 AGR/21/01
Belgium, 2006 Destinny 1 0.500 0.170 0 20 28 34
0.12 0.38 0.26 0.40
< 0.04 0.10 0.05 0.10
0.16 0.48 0.31 0.50
– – 0.23 0.26
2007/ 1020721 06BE/065R
France, 2001 (south)
Calidor 1 0.600 0.200 28 43 56
0.94 0.55 0.38
0.33 0.14 0.11
1.2 0.67 0.48
– – –
2002/ 1007718 FTL/28/01
France, 2001 (north)
Atria 1 0.600 0.200 0 28 42 56
< 0.05 0.46 0.33 0.29
< 0.04 < 0.04 < 0.04 < 0.04
< 0.09 0.50 0.37 0.33
– – – –
2002/ 1004111 FBM/11/01
France, 2006 (north)
Atria 1 0.500 0.170 0 21 28 35
0.14 0.65 < 0.05 < 0.05
< 0.04 0.07 < 0.04 < 0.04
0.18 0.72 < 0.09 < 0.09
– – – –
2007/ 1020721 06FR/063R
Germany, 2006
Kalorama 1 0.500 0.170 0 21 27 35
0.17 1.0 0.69 0.55
< 0.04 0.07 0.05 0.08
0.21 1.1 0.74 0.63
– – 0.35 0.19
2007/ 1020721 06GE/064R
Greece, 2001 Grass Plant 1 0.600 0.200 28 42
0.99 0.92
0.10 0.12
1.0 1.0
– –
2002/ 1007718 HEL/11/01

Cycloxydim
323
Application Residues, mg/kg Country, year Variety No kg
ai/ha kg ai/hL
DAT, days
Cy1 Cy2 Total cycloxydim
Cy- TSO Study Trial No.
56 1.25 0.17 1.4 – Italy, 2001 Concerto 1 0.600 0.200 27
41 55
1.1 1.6 0.86
0.11 0.17 0.11
1.2 1.7 0.96
– – –
2002/ 1007718 ITA/39/01
Spain, 2001 Castello 1 0.600 0.200 28 42 55
0.75 0.52 0.35
0.15 0.14 0.10
0.88 0.64 0.44
– – –
2002/ 1007718 ALO/34/01
Spain, 2001 Bronco 1 0.600 0.200 28 42 56
0.93 0.30 0.27
0.14 0.07 0.07
1.05 0.36 0.33
– – –
2002/ 1007718 ALO/35/01
Sweden, 2001 Cabbage Carlton
1 0.600 0.200 0 28 42 57
0.36 0.43 0.56 0.48
< 0.04 0.05 0.07 0.07
0.40 0.48 0.63 0.55
– – – –
2002/ 1004111 HUS/04/01
United Kingdom, 2001
Cabbage Colt
1 0.600 0.200 0 28 42 56
32 0.24 0.10 0.12
0.46 0.16 0.06 0.05
33 0.40 0.16 0.17
– – – –
2002/ 1004111 OAT/05/01
United Kingdom, 2001
Cabbage Savoy
1 0.600 0.200 0 29 43 55
15 2.9 2.4 2.2
0.32 0.16 0.10 0.10
15 3.0 2.5 2.3
– – – –
2002/ 1004111 OAT/06/01
United Kingdom, 2006
Cabbage Stonehead
1 0.500 0.170 0 22 29 35
2.7 3.9 0.93 0.80
0.04 0.07 0.11 0.14
2.7 4.0 1.0 0.94
– – 0.91 0.74
2007/ 1020721 06UK/066R
Cauliflower
Fourteen residue trials were conducted on cauliflower in Europe in 2001 and 2006. The results are shown in Table 75. Table 75 Results of residue trials conducted with cycloxydim on cauliflower
Application Residues, mg/kg Country, year Variety No kg ai/ha kg ai/hL DAT,
days Cy1 Cy2 Total
cycloxydim Cy- TSO
Study Trial No.
Belgium, 2001
Cauliflower Siria
1 0.600 0.200 0 29 42 57
2.4 1.7 1.7 1.5
0.29 0.15 0.14 0.11
2.7 1.8 1.9 1.6
– – – –
2002/ 1004111 AGR/20/01
France, 2001 South
Cauliflower Aviso
1 0.600 0.200 0 29 42 57
7.1 0.86 0.6 0.34
0.24 0.13 0.11 0.08
7.3 0.97 0.7 0.41
– – – –
2002/ 1007718 FTL/26/01
France, 2001 North
Cauliflower Space Star
1 0.600 0.200 0 28 42 56
4.2 1.4 0.69 0.45
0.23 0.08 0.05 0.06
4.4 1.5 0.74 0.51
– – – –
2002/ 1004111 FBM/04/01
France, 2006 North
Cauliflower Space-star
1 0.500 0.170 0* 21 29 35
12 3.0 1.7 1.56
0.41 0.23 0.15 0.13
12 3.2 1.6 1.7
– – 1.37 1.17
2007/ 1020720 06FR/067R
Germany, 2006
Cauliflower Delfino
1 0.500 0.170 0* 21 28 34
3.5 1.6 1.4 1.2
0.04 0.18 0.16 0.14
3.5 1.8 1.5 1.3
– – 1.26 1.09
2007/ 1020720 06GE/068R
Greece, 2001 Cauliflower Siria
1 0.600 0.200 0 28 42 56
3.7 2.9 2.7 2.9
0.45 0.15 0.37 0.22
4.1 3.0 3.0 3.1
– – – –
2002/ 1007718 HEL/07/01

Cycloxydim
324
Application Residues, mg/kg Country, year Variety No kg ai/ha kg ai/hL DAT,
days Cy1 Cy2 Total
cycloxydim Cy- TSO
Study Trial No.
Italy, 2001 Cauliflower Frimon
1 0.600 0.200 0 30 42 56
12 1.75 0.72 0.46
0.13 0.17 0.08 0.06
12 1.9 0.79 0.51
– – – –
2002/ 1007718 ITA/35/01
Sweden, 2006
Cauliflower Fremont
1 0.500 0.170 0* 22 29 36
15 1.3 0.09 0.17
1.0 0.34 < 0.04 0.1
16 1.6 0.13 0.27
– – 0.07 < 0.05
2007/ 1020720 06SE/069R
Spain, 2001 Cauliflower Fremu
1 0.600 0.200 0 28 42 55
5.4 0.6 0.47 0.39
0.09 0.07 0.12 0.1
5.5 0.66 0.57 0.48
– – – –
2002/ 1007718 ALO/47/01
Sweden, 2011
Cauliflower Aviso
1 0.600 0.200 0 29 41
1.8 0.65 2.19
0.15 < 0.04 0.13
2.0 0.69 2.3
– – –
2002/ 1004111 HUS/03/01
United Kingdom, 2001
Cauliflower Thalassa
1 0.600 0.200 0 29 41 55
6.9 0.48 0.31 0.18
0.58 0.11 0.1 0.05
7.4 0.59 0.41 0.23
– – – –
2002/ 1004111 OAT/17/01
United Kingdom, 2006
Cauliflower Freemont
1 0.500 0.170 0* 21 27 35
10 3.4 2.0 1.04
0.19 0.24 0.13 0.10
10 3.6 2.1 1.1
– – 1.5 0.78
2007/ 1020720 06UK/070R
a Whole plant
Peppers
Eight residue trials were conducted on peppers in Europe in 1991 and 2005/2006. Residues were determined with Methods 263, 407/1 or 493/0. The results are shown in Table 76. Table 76 Results of residue trials conducted with cycloxydim on peppers
Application DAT, days
Residues, mg/kg Study Trial No. Country, year Variety No kg
ai/ha kg ai/hL
Cy1 Cy2 Total cycloxydim
Cy- TSO
France, 2006 South
Mariner F1 1 0.600 0.200 0 14 21 28
6.5 1.6 1.6 2.8
< 0.04 0.12 0.14 0.29
6.5 1.8 1.8 3.1
– – 0.62 0.76
2007/ 1020719 06FR/028R
Greece, 2005 Pepper Raiko
1 0.500 0.167 0 14 21 28
18 1.8 1.4 1.2
< 0.04 0.10 0.10 0.07
18 1.9 1.5 1.3
– – – –
2006/ 1025871 05GR/045R
Italy, 1991 Eldo 1 0.600 0.200 0 7 15 30
0.33 0.83 0.63 0.13
< 0.04 < 0.04 0.05 < 0.04
0.37 0.87 0.68 0.17
– – – –
1993/11315 IT6/024/91
Italy, 1991 Quadrato d'Asti
1 0.600 0.200 0 7 15 30
0.26 0.26 3.0 0.66
< 0.04 0.10 0.07 0.09
0.30 0.36 3.0 0.75
– – – –
1993/11315 IT6/025/91
Italy, 2005 Quadrato 1 0.500 0.167 0 14 21 28
8.6 2.1 1.4 1.5
0.04 0.13 0.12 0.15
8.6 2.2 1.5 1.6
– – – –
2006/ 1025871 05IT/044R
Italy, 2006 Corno di toro 1 0.600 0.200 0 14 21 28
47 4.5 4.9 4.3
0.13 0.60 0.46 0.47
47 5.1 5.3 4.7
– – 1.78 1.10
2007/ 1020719 06IT/027R
Spain, 2005 Piquillo del negrillo
1 0.500 0.167 0 14
14 1.4
< 0.04 0.07
14 1.5
– –
2006/ 1025871 05ES/043R

Cycloxydim
325
Application DAT, days
Residues, mg/kg Study Trial No. Country, year Variety No kg
ai/ha kg ai/hL
Cy1 Cy2 Total cycloxydim
Cy- TSO
21 28
1.1 0.76
0.10 0.10
1.2 0.86
– –
Spain, 2006 Tilon 1 0.600 0.200 0 14 22 27
28 1.4 0.69 0.47
< 0.04 0.13 0.09 0.07
28 1.5 0.78 0.54
– – 0.50 0.24
2007/ 1020719 06ES/026R
Tomatoes
Sixteen residue trials were conducted on tomatoes in Europe in 2005/2006. Residues were determined with Methods 407/1 or 493/0. The results are shown in Table 77. Table 77 Results of residue trials conducted with cycloxydim on tomatoes
Application Residues, mg/kg Country, year Variety No kg ai/ha kg
ai/hL DAT, days Cy1 Cy2 Total
cycloxydim Cy- TSO Study
Trial No. France, 2005 (north)
Felicia 1 0.500 0.167 0 28 35 42
8.5 0.42 0.45 0.36
0.10 0.10 0.14 0.10
8.6 0.52 0.59 0.46
– – – –
2006/ 1024331 05FR/062R
France, 2005 (north)
Pyros 1 0.500 0.167 0 28 35 42
6.30 0.36 0.40 0.34
0.07 0.11 0.12 0.10
6.37 0.47 0.52 0.44
– – – –
2006/ 1024331 05FR/063R
France, 2005 (south)
Promo 1 0.500 0.167 35 42
0.21 0.16
0.05 0.04
0.26 0.20
– –
2006/ 1024331 05FR/066R
France, 2006 (south)
Promo 1 0.500 0.167 0 28 35 42
2.0 0.08 0.06 0.13
< 0.04 < 0.04 < 0.04 < 0.04
2.0 0.12 0.10 0.17
– – < 0.05 < 0.05
2007/ 1020718 06FR/011R
France, 2006 (north)
Pyros 1 0.500 0.167 0 28 35 42
9.9 0.94 0.65 0.65
0.16 0.19 0.18 0.19
10 1.13 0.83 0.84
– – 0.19 0.16
2007/ 1020718 06FR/013R
Germany, 2005
Viper 1 0.500 0.167 0 28 35 42
5.0 0.54 0.43 0.41
< 0.04 0.07 0.09 0.09
5.0 0.61 0.52 0.50
– – – –
2006/ 1024331 05GE/064R
Germany, 2006
Viper 1 0.500 0.167 0 28 35 42
4.8 0.62 0.35 0.36
< 0.04 0.10 0.09 0.09
4.8 0.72 0.44 0.45
– – 0.06 0.09
2007/ 1020718 06GE/014R
Germany, 2006
Viper 1 0.500 0.167 0 28 35 42
12 0.22 0.31 0.31
0.06 0.04 0.08 0.08
12 0.26 0.39 0.39
– – 0.06 0.06
2007/ 1020718 06GE/015R
Greece, 2005 Super Gali 1 0.500 0.167 0 28 35 43
8.4 0.26 0.21 0.14
0.31 0.10 0.10 0.07
8.7 0.36 0.31 0.21
– – – –
2006/ 1024331 05GR/069R
Greece, 2006 Belladonna 1 0.500 0.167 0 28 36 43
22 0.15 0.08 0.07
0.14 < 0.04 < 0.04 < 0.04
22 0.19 0.12 0.11
– – < 0.05 < 0.05
2007/1020718 6GR/012R
Italy, 2005 Podium 1 0.500 0.167 0 28 35 41
11 0.27 0.21 0.15
0.07 0.05 0.04 0.04
11 0.32 0.25 0.19
– – – –
2006/ 1024331 05IT/068R
Italy, 2006 Galeon 1 0.500 0.167 0 28
4.6 0.35
< 0.04 0.08
4.6 0.43
– –
2007/ 1020718 06IT/010R

Cycloxydim
326
Application Residues, mg/kg Country, year Variety No kg ai/ha kg
ai/hL DAT, days Cy1 Cy2 Total
cycloxydim Cy- TSO Study
Trial No. 35 42
0.35 0.18
0.08 < 0.04
0.43 0.22
0.11 < 0.05
Netherlands, 2006
Viper 1 0.500 0.167 0 28 35 42
4.2 0.27 0.28 0.29
0.10 0.07 0.09 0.10
4.3 0.34 0.37 0.39
– – 0.12 0.10
2007/ 1020718 06NL/016R
Netherlands, 2005
Viper 1 0.500 0.167 0 28 35 42
5.70 0.22 0.13 0.17
< 0.04 < 0.04 < 0.04 < 0.04
5.74 0.26 0.17 0.21
– – – –
2006/ 1024331 05NL/065R
Spain, 2006 Juncal 1 0.500 0.167 0 29 36 41
14 0.47 0.51 0.30
0.13 < 0.04 < 0.04 < 0.04
14 0.51 0.55 0.34
– – 0.08 < 0.05
2007/ 1020718 06ES/009R
Spain, 2005 Don Benito 1 0.500 0.167 0 27 36 41
22 0.34 0.31 0.32
0.18 0.05 0.07 0.07
23 0.39 0.38 0.39
– – – –
2006/ 1024331 05ES/067R
Kale, curly/ Chinese cabbage
Eight residue trials were conducted on Chinese cabbage in Europe in 2005. Residues were determined using Methods 407/1 or 493/0. The results are shown in Table 78. Table 78 Results of residue trials conducted with cycloxydim on curly/Chinese cabbage and kale Application Residues, mg/kg Country, year Variety No kg
ai/ha kg ai/hL
DAT, days
Cy1 Cy2 Total cycloxydim
Cy- TSO Study Trial No.
Greece, 2007 Chinese cabbage Yuki
1 0.500 0.170 0 35 42 50
15.60 0.10 0.19 0.08
1.61 < 0.04 0.04 < 0.04
17.21 0.14 0.23 0.12
– – – –
2009/ 1075174 L070373
Italy, 2007 Chinese cabbage Capoko
1 0.500 0.170 0 35 42 49
14 < 0.05 < 0.05 < 0.05
0.40 < 0.04 < 0.04 < 0.04
15 < 0.09 < 0.09 < 0.09
– – – –
2009/ 1075174 L070372
France, 2006 (north)
Curly kale Coleor
1 0.500 0.170 0 35 42 49
5.9 0.70 0.42 0.42
0.13 0.20 0.19 0.16
6.1 0.90 0.61 0.58
– – 0.19 0.20
2007/ 1020723 06FR/055R
France, 2006 (south)
Curly kale Proteor
1 0.500 0.170 0 36 43 50
11 0.73 0.68 0.21
0.10 0.25 0.26 0.06
11 0.98 0.94 0.27
– – – –
2007/ 1020723 06FR/054R
Germany, 2007 Curly kale Winnetou
1 0.500 0.170 0 35 42 49
2.8 0.64 0.73 0.67
< 0.04 0.13 0.11 0.10
2.8 0.77 0.84 0.97
– – 0.60 0.50
2009/ 1075174 L070370
Netherlands, 2006
Curly kale Reflex
1 0.500 0.170 0 35 41 49
20 1.3 1.4 0.87
0.28 0.35 0.41 0.20
21 1.7 1.8 1.1
– – 0.85 0.72
2007/ 1020723 06NL/056R
Spain, 2006 Curly kale Veronsa
1 0.500 0.170 0 34 42 49
18 1.0 0.79 0.68
0.18 0.07 0.10 0.09
19 1.1 0.89 0.77
– – 0.35 0.25
2007/ 1020723 06ES/053R
United Kingdom, 2007
Curly kale Winnetou
1 0.500 0.170 0 36 42 50
0.42 < 0.05 < 0.05 < 0.05
< 0.04 < 0.04 < 0.04 < 0.04
0.46 < 0.09 < 0.09 < 0.09
– – – –
2009/ 1075174 L070371

Cycloxydim
327
Lettuce
Twenty two residue trials were conducted on lettuce in Europe from 2001–2008. Residues were determined with Methods 407/1 or 493/0. The results are shown in Table 79. Table 79 Results of residue trials conducted with cycloxydim on lettuce
Application Residues, mg/kg Country, year
Variety No kg ai/ha
kg ai/hL
DAT, days
Cy1 Cy2 Total cycloxydim
Cy- TSO Study Trial No.
Denmark, 2001
Roxette RZ 1 0.500 0.167 0 6 22
2.1 0.30 0.08
< 0.04 < 0.04 < 0.04
2.1 0.34 0.12
– – –
2002/ 1008792 ALB/05/01
Denmark, 2001
Elinas 1 0.500 0.167 0 7 20
4.8 0.330 0.070
< 0.04 < 0.04 < 0.04
4.8 0.37 0.11
– – –
2002/ 1008792 ALB/06/01
Denmark, 2003
Stallion 1 0.500 0.167 0 7 14 21
9.7 1.0 0.61 0.42
< 0.04 < 0.04 < 0.04 < 0.04
9.8 1.1 0.65 0.46
– – – –
2004/ 1015935 ALB/10/03
France, 2001 (north)
Pantheon 1 0.500 0.167 0 7 21
9.4 1.1 0.30
< 0.04 < 0.04 < 0.04
9.5 1.2 0.34
– – –
2002/ 1008792 FAN/04/01
France, 2001 (north)
Nadine 1 0.500 0.167 0 7 21
4.74 1.34 0.170
< 0.04 < 0.04 < 0.04
4.8 1.4 0.21
– – –
2002/ 1008792 FBM/05/01
France, 2003 (north)
Triathion 1 0.500 0.167 0 6 14 21
10 0.95 0.24 0.13
< 0.04 < 0.04 < 0.04 < 0.04
10 0.99 0.28 0.17
– – – –
2004/ 1015935 FAN/14/03
France, 2003 (north)
Daguan 1 0.500 0.167 0 7 14 20
7.6 1.6 0.65 0.31
< 0.04 < 0.04 < 0.04 < 0.04
7.6 1.6 0.69 0.35
– – – –
2004/ 1015935 FBM/07/03
France, 2005 (centre)
Campionas 1 0.500 0.333 0 14 21
13 0.24 0.22
< 0.04 < 0.04 < 0.04
13 0.28 0.26
– – –
2006/ 1029325 05FR/046R
France, 2005 (north)
Nobellan 1 0.500 0.333 0 14 21 28
12 0.67 0.22 0.08
< 0.04 < 0.04 < 0.04 < 0.04
12 0.71 0.26 0.12
– – – –
2006/ 1029325 05FR/047R
France, 2005 (south)
Lettuce Jordane
1 0.500 0.333 0 14 21 28
14 0.27 0.170 0.09
< 0.04 < 0.04 < 0.04 < 0.04
14 0.31 0.21 0.13
– – – –
2006/ 1029325 05FR/050R
France, 2006 (south)
Lettuce Querido
1 0.500 0.333 0 14 21 28
27 0.20 < 0.05 < 0.05
0.080 < 0.04 < 0.04 < 0.04
27 0.24 < 0.09 < 0.09
– – – –
2007/ 1020724 06FR/051R
Germany, 2005
Ponchito 1 0.500 0.333 0 15 20 27
13 0.07 0.30 0.08
< 0.04 < 0.04 < 0.04 < 0.04
13 0.11 0.34 0.12
– – – –
2006/ 1029325 05GE/048R
Germany, 2005
Estelle 1 0.500 0.333 0 15 20 27
9.3 0.44 0.17 0.08
< 0.04 < 0.04 < 0.04 < 0.04
9.3 0.48 0.21 0.12
– – – –
2006/ 1029325 05GE/049R
Greece, 2005
Lettuce Samson
1 0.500 0.333 0 14 22 28
25 0.96 0.69 0.43
< 0.04 < 0.04 < 0.04 < 0.04
25 1.0 0.73 0.47
– – – –
2006/ 1029325 05GR/052R
Greece, 2006
Lettuce Paris Island
1 0.500 0.333 0 14
15 0.37
< 0.04 < 0.04
15 0.41
– –
2007/ 1020724 06GR/052R

Cycloxydim
328
Application Residues, mg/kg Country, year
Variety No kg ai/ha
kg ai/hL
DAT, days
Cy1 Cy2 Total cycloxydim
Cy- TSO Study Trial No.
Cos 21 28
0.06 < 0.05
< 0.04 < 0.04
0.10 < 0.09
< 0.05 –
Italy, 2005 Lettuce Romana
1 0.500 0.333 0 14 21 28
7.9 0.34 < 0.05 < 0.05
< 0.04 < 0.04 < 0.04 < 0.04
7.9 0.38 < 0.09 < 0.09
– – – –
2006/ 1029325 05IT/051R
Italy, 2006 Lettuce Gentile
1 0.500 0.333 0 15 21 28
18 0.27 0.08 < 0.05
< 0.04 < 0.04 < 0.04 < 0.04
18 0.31 0.12 < 0.09
– – < 0.05 –
2007/ 1020724 06IT/050R
Italy, 2008 Justine open leaf
1 0.500 0.333 0 14 21 28
39 0.05 < 0.05 < 0.05
0.060 < 0.04 < 0.04 < 0.04
39 0.09 < 0.09 < 0.09
– – – –
2009/ 1069374 L080152
Spain, 2008 Francesca open leaf
1 0.500 0.333 0 15 21 28
30 0.07 < 0.05 < 0.05
< 0.04 < 0.04 < 0.04 < 0.04
30 0.11 < 0.09 < 0.09
– – – –
2009/ 1069374 L080153
Spain, 2006 Filipus 1 0.500 0.333 0 15 20 28
18 0.32 0.19 0.07
< 0.04 < 0.04 < 0.04 < 0.04
18 0.36 0.23 0.11
– – < 0.05 < 0.05
2007/ 1020724 06ES/049R
Spain, 2005 Filipus 1 0.500 0.333 0 15 22 28
160 0.37 < 0.05 < 0.05
< 0.04 < 0.04 < 0.04 < 0.04
16 0.41 < 0.09 < 0.09
– – – –
2006/ 1029325 05ES/053R
Sweden, 2003
Maximus 1 0.500 0.167 0 7 14 21
5.9 0.46 0.14 < 0.05
< 0.04 < 0.04 < 0.04 < 0.04
5.9 0.50 0.18 < 0.09
– – – –
2004/ 1015935 HUS/06/03
Spinach
Eight residue trials were conducted on spinach in Europe in 2005. Residues were determined using Method 407/1. The results are shown in Table 80. Table 80 Results of residue trials conducted with cycloxydim on spinach
Country, year Crop Variety
Application DAT, days
Residues, mg/kg Study Trial No No kg ai/ha kg
ai/hL Cy1 Cy2 Total
cycloxydim
France, 2005 (north)
Boing 1 0.500 0.333 0 21 28 35
69 0.07 < 0.05 < 0.05
0.10 0.05 < 0.04 < 0.04
69 0.12 < 0.09 < 0.09
2006/ 1029326 05FR/054R
France, 2005 (north)
Correnta 1 0.500 0.333 0 21 28 35
45.2 0.20 0.08 0.06
0.30 0.10 0.04 < 0.04
46 0.30 0.12 0.10
2006/ 1029326 05FR/055R
France, 2005 (south)
Correnta 1 0.500 0.333 0 21 28 35
70 1.8 2.2 0.87
0.06 0.17 0.23 0.11
70 2.0 2.4 0.98
2006/ 1029326 05FR/058R
Germany, 2005 Cheethu 1 0.500 0.333 0 20 27 34
52 < 0.05 < 0.05 < 0.05
0.17 < 0.04 < 0.04 < 0.04
52 < 0.09 < 0.09 < 0.09
2006/ 1029326 05GE/056R
Germany, 2005 Ventuf
1 0.500 0.333 0 20 27 34
53 0.08 < 0.05 < 0.05
0.12 < 0.04 < 0.04 < 0.04
53 0.12 < 0.09 < 0.09
2006/ 1029326 05GE/057R

Cycloxydim
329
Country, year Crop Variety
Application DAT, days
Residues, mg/kg Study Trial No No kg ai/ha kg
ai/hL Cy1 Cy2 Total
cycloxydim
Greece, 2005 Ikos 1 0.500 0.333 0 20 28 35
27.80 0.15 0.10 0.07
0.15 0.14 0.09 0.06
28 0.29 0.19 0.13
2006/ 1029326 05GR/061R
Italy, 2005 Chica 1 0.500 0.333 0 21 28 35
27 0.08 < 0.05 < 0.05
0.14 < 0.04 < 0.04 < 0.04
27 0.12 < 0.09 < 0.09
2006/ 1029326 05IT/060R
Spain, 2005 EPI-9703F1 1 0.500 0.333 0 21 28 34
32 0.27 0.14 < 0.05
0.30 0.10 0.06 < 0.04
32 0.37 0.20 < 0.09
2006/ 1029326 05ES/059R
Green beans
Fifteen residue trials were conducted on green beans in Europe from 1988 to 2008. Residues were determined using Methods 407/1 or 493/0. The results are shown in Table 81. Table 81 Results of residue trials conducted with cycloxydim on green beans with pods Application Residues, mg/kg Country, year Variety No kg ai/ha kg
ai/hL DAT, days
Cy1 Cy2 Total cycloxydim
Cy- TSO Study Trial No.
Belgium, 2005 Proton 1 0.500 0.330 21 28 35
0.82 0.30 0.15
0.10 0.10 0.13
0.92 0.40 0.28
– – –
2006/ 1031719 G020-05 H
Belgium, 2008 Cadillac 1 0.520 0.330 29 35
0.18 0.08
< 0.04 0.04
0.22 0.12
0.086 –
2008/ 1067444 L080147
France, 2008 North
Cantare 1 0.500 0.330 21 28 35
0.14 0.18 0.07
0.06 0.12 0.09
0.20 0.30 0.16
– 0.08 –
2008/ 1067444 L080150
France, 2005 North
Albany 1 0.500 0.330 28 36
< 0.05 < 0.05
< 0.04 < 0.04
< 0.09 < 0.09
– –
2006/ 1031719 05 H CL FR P11
France, 2005 South
Montayo 1 0.500 0.330 22 28 36
0.52 0.31 0.12
0.04 0.04 0.06
0.56 0.37 0.18
– – –
2006/ 1031719 05 H CL FR P12
France, 2001 South
Big Borlotto 1 0.500 0.167 28 42 57
0.06 0.23 2.8
0.34 0.07 1.6
0.40 0.30 4.4
0.08 0.46 0.38
2003/ 1001265 X0106203
Greece, 1989 –
1 0.500 0.167 30 41 56
0.25 < 0.05 < 0.05
< 0.04 < 0.04 < 0.04
0.29 < 0.09 < 0.09
< 0.05 < 0.05 < 0.05
2000/ 1013496 51701H89/ 23E
Greece , 2005 Zargana 1 0.500 0.330 21 28 35
4.3 2.2 0.82
7.1 3.0 0.96
11 5.2 1.8
– – –
2006/ 1031719 05 RF041
Italy, 1988 – 1 0.500 0.125 26 0.17 0.07 0.24 – 2000/ 1013496 51701H88/ 71E
Italy, 1989 – 1 0.500 0.167 40 – – < 0.05 – 2000/ 1013496 51701H89/ 23E
Italy, 1990 – 1 0.500 0.167 11 18 24 31
0.30 0.14 0.10 0.10
0.05 < 0.04 < 0.04 0.05
0.35 0.14 0.10 0.15
– – – –
2000/ 1013496 51701H90/ 35A
Italy, 2001 Festival 1 0.500 0.167 27 42 55
0.13 0.05 0.08
0.08 0.05 0.06
0.20 0.10 0.14
< 0.05 < 0.05 < 0.05
2003/ 1001265 0135R
Italy, 2005 Festina 1 0.500 0.330 21 27 35
0.47 0.10 0.05
0.05 0.04 0.05
0.52 0.14 0.10
– – –
2006/ 1031719 0539R
Netherlands, 1990
– 1 0.600 0.180 27 0.60 0.64 1.2 a – 2000/ 1013496 51722H90/3E

Cycloxydim
330
Application Residues, mg/kg Country, year Variety No kg ai/ha kg
ai/hL DAT, days
Cy1 Cy2 Total cycloxydim
Cy- TSO Study Trial No.
Netherlands, 1990
– 1 0.600 0.180 23 0.40 0.34 0.73 a – 2000/ 1013496 51722H90/4E
Netherlands, 2008
Speedy 1 0.500 0.330 21 29 35
0.24 0.18 0.09
0.07 0.08 0.06
0.31 0.26 0.15
– 0.08 –
2008/ 1067444 L080151
Sweeden, 2005
Montayo 1 0.500 0.330 21 28 35
0.93 0.42 0.44
0.84 0.71 0.90
1.8 1.1 1.3
– – –
2006/ 1031719 HUS/190504-1
Spain, 2005
Cilena 1 0.500 0.330 28 36
0.24 0.17
0.17 < 0.04
0.41 0.21
– –
2006/ 1031719 05ES/080R
Spain, 2001 Festival 1 0.500 0.167 26 40 54
0.13 0.06 < 0.05
0.08 < 0.04 < 0.04
0.20 0.10 < 0.09
< 0.05 < 0.05 < 0.05
2003/ 1001265 01S025R
United Kingdom, 2005
Nerina 1 0.500 0.330 21 27 34
0.70 0.42 0.29
0.24 0.22 0.18
0.94 0.64 0.47
– – –
2006/ 1031719 776/GBE/1
United Kingdom, 2008
Torpedo 1 0.530 0.330 29 36
0.16 0.09
0.05 0.05
0.21 0.14
– –
2008/ 1067444 L080149
a Mean of four samples
Green peas
Fourteen residue trials were conducted on green peas in Europe in 2006. Residues were determined using Methods 407/1 or 493/0. The results are shown in Table 82. Table 82 Results of residue trials conducted with cycloxydim on green pea seeds Application Residues, mg/kg Country, year Variety No kg
ai/ha kg ai/hL
DAT, days
Cy1 Cy2 Total cycloxydim
Cy- TSO
Study Trial No.
France, 2006 North
Cepia 1 0.500 0.250 28 35 41
2.1 1.1 2.6
2.4 1.4 3.4
4.5 2.5 5.9
– 0.71 1.3
2007/ 1020725 06FR/045R
France, 2005 North
Barley 1 0.500 0.250 27 34 42
1.5 1.4 1.7
1.1 1.7 2.7
2.6 3.1 4.4
– – –
2006/ 1034132 05 H CL FR P14
France, 2006 South
Frediro 1 0.500 0.250 28 35 42
2.43 1.23 0.64
0.7 0.7 0.44
3.1 1.9 1.1
– 1.05 0.47
2007/ 1020725 06FR/043R
France, 2005 South
Milan 1 0.500 0.250 29 35 41
1.10 0.61 0.31
1.20 0.78 0.66
2.3 1.4 0.97
– – –
2006/ 1034132 05 H CL FR P13
Germany, 2006 Riger 1 0.500 0.250 28 35 41
2.9 1.1 1.1
0.96 0.51 0.68
3.8 1.6 1.8
– 0.66 0.65
2007/ 1020725 06GE/046R
Greece, 2005 Ambassadeur 1 0.500 0.250 28 35 42
2.2 1.4 1.3
3.7 2.5 2.1
5.9 3.9 3.4
– – –
2006/ 1034132 05RF042
Greece, 2006 Lotus 1 0.500 0.250 28 35 42
0.47 0.43 0.25
0.37 0.37 0.23
0.84 0.80 0.48
– 0.37 0.11
2007/ 1020725 06GR/044R
Italy, 2005 Atlas 1 0.500 0.250 42 49
0.21 0.28
0.14 0.17
0.35 0.45
– –
2006/ 1034132 0546R
Italy, 2006 Budget 1 0.500 0.250 28 35 42
1.41 0.48 0.22
0.69 0.37 0.26
2.1 0.85 0.48
– 0.4 0.19
2007/ 1020725 06IT/042R
Netherlands, 1988
–
1 0.600 0.083 21 2.2 3.7 5.9 – 1988/10697 51701H88/33
Netherlands, 1988
– 1 0.600 0.083 21 1.6 2.7 4.3 – 1988/10697 51701H88/34

Cycloxydim
331
Application Residues, mg/kg Country, year Variety No kg
ai/ha kg ai/hL
DAT, days
Cy1 Cy2 Total cycloxydim
Cy- TSO
Study Trial No.
Netherlands, 1988
– 1 0.600 0.083 21 1.9 3.1 5.0 – 1988/10697 51701H88/35
Netherlands, 1988
– 1 0.600 0.083 21 2.1 3.6 5.6 – 1988/10697 51701H88/36
Netherlands, 1988
– 1 0.600 0.083 21 2.0 3.6 5.6 – 1988/10698 51701H88/37
Netherlands, 1988
– 1 0.600 0.083 21 2.3 3.7 6.0 – 1988/10698 51701H88/38
Netherlands, 1988
– 1 0.600 0.083 21 2.0 3.5 5.5 – 1988/10698 51701H88/39
Netherlands, 1988
– 1 0.600 0.083 21 2.2 3.7 6.0 – 1988/10698 51701H88/40
Netherlands, 2005
Arabelle 1 0.500 0.250 28 35 42
0.36 0.21 0.06
0.60 0.59 0.14
0.96 0.80 0.20
– – –
2006/ 1034132 AGR/51/05
Spain, 2005 Jumbo 1 0.500 0.250 34 42
2.3 2.7
4.9 5.8
7.2 8.5
– –
2006/ 1034132 05ES/081 R
Spain, 2006 Lincoln 1 0.500 0.250 28 34 42
2.1 1.4 2.3
2.3 2.1 3.0
4.3 3.5 5.3
– 1.1 1.9
2007/ 1020725 06ES/041R
Sweden, 2005 S7 1 0.500 0.250 28 35 42
2.4 1.5 1.3
4.1 3.2 3.4
6.5 4.7 4.7
– – –
2006/ 1034132 05HUS 1190505-01
United Kingdom, 2005
Onward 1 0.500 0.250 27 34 41
1.9 0.60 0.32
2.0 0.65 0.60
3.9 1.2 0.92
– – –
2006/ 1034132 777/PEA1
UK, 2006
Legacy 1 0.500 0.250 28 35 42
2.1 1.8 0.96
1.0 1.4 0.7
3.2 3.2 1.7
– 1.6 0.81
2007/ 1020725 06UK/048R
Dry beans
Twenty one residue trials were conducted on dry beans in Europe from 2001 to 2006. Residues were determined using Methods 407/1 or 493/0. The results are shown in Table 83. Table 83 Results of residue trials conducted with cycloxydim on dry bean seeds Application Residues, mg/kg Country, year Variety No kg
ai/ha kg ai/hL DAT,
days Cy1 Cy2 Total
cycloxydim Cy- TSO
Study Trial No.
Denmark, 2005 Dry beans Vroma
1 0.500 0.330 49 56 63
2.6 3.0 2.7
1.4 1.4 1.2
4.0 4.4 3.9
– – –
2006/ 1024330 ALB/190501-01
France, 2005 North
Dry beans Lingots du Nord
1 0.500 0.330 49 56 63
0.34 0.3 0.14
0.17 0.19 0.06
0.51 0.49 0.2
– – –
2006/ 1024330 05 H CL FR P 10
France, 2005 South
Dry beans Linix
1 0.500 0.330 49 56 63
0.30 0.13 0.39
0.17 0.08 0.31
0.47 0.21 0.70
– – –
2006/ 1024330 05 H CL FR P09
France, 2006 North
Dry beans Irena
1 0.500 0.330 49 57 62
3.4 3.6 3.3
0.81 0.75 0.58
4.2 4.4 3.9
– 1.15 1.98
2007/ 1020731 06FR/086R
France, 2006 South
Dry beans Diva
1 0.500 0.330 49 56 63
3.3 3.1 0.72
0.85 0.9 0.1
4.1 4.0 0.82
– 0.96 0.71
2007/ 1020731 06FR084R
Germany, 2006 Dry beans Danko
1 0.500 0.330 49 56 63
11 9.3 3.2
3.3 3.0 2.7
15 12 6.0
– 6.6 4.2
2007/ 1020731 06GE/087R
Germany, 2006 Dry beans Danko
1 0.500 0.330 49 56 63
7.1 7.0 7.3
2.57 2.54 2.54
9.7 9.5 9.8
– 3.5 2.8
2007/ 1020731 06GE/088R

Cycloxydim
332
Application Residues, mg/kg Country, year Variety No kg
ai/ha kg ai/hL DAT,
days Cy1 Cy2 Total
cycloxydim Cy- TSO
Study Trial No.
Greece, 2002 Dry beans Express
1 0.500 0.330 54 68
0.16 0.14
< 0.04 < 0.04
0.20 0.18
0.12 0.13
2003/ 1001266 02RF003
Greece, 2005
Dry beans Express
1 0.500 0.330 49 56 63
0.28 0.40 0.51
0.04 0.05 0.06
0.32 0.45 0.57
– – –
2006/ 1024330 05/RF040
Greece, 2006
Dry beans super Aguadulce
1 0.500 0.330 48 55 62
1.4 1.5 1.6
0.45 0.42 0.44
1.9 1.9 2.0
– 0.61 1.5
2007/ 1020731 06GR085R
Italy, 2006
Dry beans Listra
1 0.500 0.330 48 56 63
0.73 2.8 2.0
0.41 0.7 0.4
1.1 3.6 2.4
– 1.31 1.5
2007/ 1020731 06IT/083R
Italy, 2001
Dry beans Siconia
1 0.500 0.330 55 0.78 0.30 1.1 0.36 2003/ 1001266 0130R
Italy, 2001
Dry beans Siviglia
1 0.500 0.330 55 4.9 1.14 6.1 1.7 2003/ 1001266 0131R
Italy, 2005
Dry beans Vesuvio
1 0.500 0.330 49 57 63
1.0 1.9 1.9
0.26 0.35 0.44
1.3 2.2 2.4
– – –
2006/ 1024330 0540R
Netherlands, 2006
Dry beans Danko
1 0.500 0.330 49 56 63
12 6.1 4.5
0.34 1.8 1.1
12 7.9 5.6
– 2.9 2.8
2007/ 1020731 06NL/089R
Spain, 2006
Dry beans Aguadulce
1 0.500 0.330 48 56 62
3.5 2.7 2.8
0.91 0.82 0.7
4.4 3.5 3.5
– 0.86 0.76
2007/ 1020731 06ES/082R
Sweden, 2005 Dry beans Vroma
1 0.500 0.330 50 57 64
1.1 1.0 0.38
0.43 0.43 0.17
1.5 1.5 0.55
– – –
2006/ 1024330 HUS/190501-02
Spain, 2001
Dry beans Alameda
1 0.500 0.330 56 2.0 0.95 3.0 1.3 1.1
2003/ 1001266 01S023R
Spain, 2001
Dry beans Corsario
1 0.500 0.330 56 3.0 1.4 4.5 1.4 2003/ 1001266 01S024R
Spain, 2005
Dry beans Luz de Olono
1 0.500 0.330 49 55 62
0.23 0.22 0.09
0.09 0.09 < 0.04
0.32 0.31 0.13
– – –
2006/ 1024330 05ES/079R
United Kingdom, 2005
Dry beans Compass
1 0.500 0.330 49 56 63
2.0 0.97 2.02
0.84 0.38 0.79
2.8 1.4 2.8
– – -
2006/ 1024330 775/DBE/1
Dry Peas
Fourteen residue trials were conducted on dry peas in Europe from 1987 to 2002. Residues were determined using Methods 263, 407/1 or 493/0. The results are shown in Table 84. Table 84 Results of residue trials conducted with cycloxydim on dry pea seeds Application Residues, mg/kg Country, year No kg
ai/ha kg ai/hL
DAT, days
Cy1 Cy2 Total cycloxydim
Cy- TSO Study Trial No.
France, 2001, South 1 0.600 0.300 56 0.45 1.16 1.6 0.3 2003/ 1001251; FBD/17/01
France, 2001, south 1 0.600 0.300 57 0.55 1.11 1.6 – 2003/ 1001252; FBD/13/02
Greece, 2001 1 0.600 0.300 57 0.10 0.20 0.30 – 2003/ 1001251; HEL/10/01
Greece, 2002 1 0.600 0.200 57 2.97 0.28 3.2 – 2003/ 1001263; 02RF025/1
Greece, 2002 1 0.600 0.200 56 2.9 0.28 3.2 0.49 2003/ 1001263; 02RF025/2
Italy, 2001 1 0.600 0.300 56 0.22 0.47 0.69 – 2003/ 1001251; ITA/36/01 Italy, 2002 1 0.600 0.300 56 0.29 0.55 0.84 – 2003/ 1001252; ITA/20/02

Cycloxydim
333
Application Residues, mg/kg Country, year No kg
ai/ha kg ai/hL
DAT, days
Cy1 Cy2 Total cycloxydim
Cy- TSO Study Trial No.
Netherlands 1987 1 0.600 0.200 55 0.28 1.04 1.2 b – 2006/ 1009633; 51701H87/66E
Netherlands, 1987 1 0.600 0.200 56 0.8 3.36 3.4 b – 2006/ 1009633; 51701H87/71E
Spain, 2001 1 0.600 0.300 56 2.35 3.58 5.9 1.43
2003/ 1001251; ALO/31/01
Spain, 2002 1 0.600 0.300 56 1.23 2.35 3.6 – 2003/ 1001252; ALO/20/02
Spain, 2002 1 0.600 0.300 55 2.19 2.28 5.5 – 2003/ 1001252; AYE/15/02
United Kingdom, 1989
1 0.45 0.180 56 2.43 5.49 7.9 a – 2006/ 1009633; R517/14/89
United Kingdom, 1989
1 0.450 0.180 56 4.31
7.69
12
– 2006/ 1009633; R517/14/89
a Mean of 3 values b Mean of 4 values
Soya beans
Thirteen residue trials were conducted on soya beans in Europe from 2005 to 2007. Residues were determined using Methods 407/1 or 493/0. The results are shown in Table 85. Table 85 Results of residue trials conducted with cycloxydim in soya bean seeds Application Residues, mg/kg Country, year Variety No kg ai/ha kg ai/hL DAT,
days Cy1 Cy2 Total
cycloxydim Cy- TSO Study
Trial No. France, 2005 Center
OAC Erin 1 0.50 0.33 49 56 63
19.4 18.4 16.8
10.1 8.96 8.11
30 27 25
– – –
2006/ 1030315 05 H SO FR P05
France, 2005 South
Dekabig 1 0.50 0.33 49 56 64
23.8 18 13.8
15.9 12.4 9.66
40 30 23
– – –
2006/ 1030315 05 H SO FR P04
France, 2006 South
Lanka 1 0.50 0.33 49 56 63
9.98 8.68 8.07
2.78 3.16 2.5
13 12 11
– 3.53 4.44
2007/ 1020732 06FR/079R
Germany, 2005 Dolores 1 0.50 0.33 48 54 62
14.6 11.2 15.9
11.4 10.9 16.8
26 22 33
– – –
2006/ 1030315 AC/05/084
Germany, 2006 Merlin 1 0.50 0.33 49 56 63
0.49 0.47 0.58
0.34 0.36 0.23
0.83 0.83 0.81
– 0.29 0.26
2007/ 1020732 06GE/080R
Greece, 2007 PR92B63- 1026
1 0.50 0.33 49 57 64
1.4 1.89 1.62
0.5 0.9 1.03
1.9 2.8 2.6
– 0.66 0.6
2009/ 1075175 L070368
Italy, 2006 Cresir 1 0.50 0.33 49 56 64
26.6 14.78 21.07
3.25 4.55 4.61
30 19 26
– 2.58 1.47
2007/ 1020732 06IT/078R
Italy, 2005 Dekabig 1 0.50 0.33 49 56 63
1.44 2.81 4.72
0.81 2.71 4.49
2.2 5.5 9.2
– – –
2006/ 1030315 0543R
Italy, 2007 Pedro 1 0.50 0.33 49 56 63
7.03 7.56 8.78
3.25 4.96 5.44
10 12 14
– 3.47 3.71
2009/ 1075175 L070367
Netherlands, 2006
Merlin 1 0.50 0.33 49 56 63
0.7 0.55 0.76
0.3 0.46 0.48
1.0 1.0 1.2
– 0.29 0.46
2007/ 1020732 06NL/081R
Spain, 2005 Osumi 1 0.50 0.33 49 56 63
18.9 19.1 17.2
6.46 6.87 8.52
25 26 26
– – –
2006/ 1030315 05ES/076R

Cycloxydim
334
Application Residues, mg/kg Country, year Variety No kg ai/ha kg ai/hL DAT,
days Cy1 Cy2 Total
cycloxydim Cy- TSO Study
Trial No. Spain 2006 Osaka 1 0.50 0.33 50
56 63
0.1 0.09 0.14
0.05 0.05 0.09
0.15 0.14 0.23
– 0.07 0.04
2007/ 1020732 06ES/077R
Spain, 2007 Safrane 1 0.50 0.33 48 56 63
2.23 2.39 2.62
0.24 0.44 0.75
2.5 2.8 3.4
– 1.27 1.08
2009/ 1075175 L070369
Carrots
Fifteen residue trials were conducted on carrots in Europe from 2001 to 2007. Residues were determined using Methods 407/1 or 493/0. The results are shown in Table 86. Table 86 Results of residue trials conducted with cycloxydim in carrot roots Application Residues, mg/kg Country, year Variety No kg
ai/ha kg ai/hL
DAT, days
Cy1 Cy2 Total cycloxydim
Cy- TSO Study Trial No.
Belgium, 2007 Carrots Nerac
1 0.500 0.300 28 35 42
0.39 0.34 0.27
0.05 0.04 0.04
0.44 0.38 0.31
– 0.15 0.15
2009/ 1075173 L070360
France, 2005 South
Carrots Biotek
1 0.500 0.330 28 35 42
0.97 0.76 0.59
0.10 0.09 0.07
1.1 0.85 0.66
– – –
2006/ 1025865 05FR/040R
France, 2007 North
Carrots Maestro
1 0.500 0.300 28 35 42
0.38 0.31 0.29
< 0.04 < 0.04 < 0.04
0.42 0.35 0.33
– 0.11 0.15
2009/ 1075173 L070361
Germany, 2007 Carrots Nebula
1 0.500 0.300 28 38 42
0.60 0.49 0.42
< 0.04 < 0.04 < 0.04
0.64 0.53 0.46
– 0.27 0.23
2009/ 1075173 L070362
Greece, 2005 Carrots Heltas
1 0.500 0.330 28 35 42
2.90 1.10 1.20
0.09 0.08 0.10
3.0 1.2 1.3
– – –
2006/ 1025865 05GR/042R
Greece, 2007 Carrots Tempo F1
1 0.500 0.300 28 35 42
0.24 0.21 0.17
0.05 0.06 0.05
0.29 0.27 0.22
0.07 0.05 –
2009/ 1075173 L070366
Italy, 2005 Carrots Agroblu SRL
1 0.500 0.330 28 35 42
0.36 0.22 0.20
0.11 0.09 0.08
0.47 0.31 0.28
– – –
2006/ 1025865 05IT/041R
Italy, 2007 Carrots Calibra
1 0.500 0.300 28 35 42
0.14 0.10 0.07
< 0.04 < 0.04 < 0.04
0.18 0.14 0.11
– < 0.05 < 0.05
2009/ 1075173 L070364
Netherlands, 2007
Carrots Nerac
1 0.500 0.300 28 35 42
0.28 0.18 0.16
< 0.04 < 0.04 < 0.04
0.32 0.22 0.20
– 0.10 0.08
2009/ 1075173 L070363
Spain, 2005 Carrots Agrologia
1 0.500 0.330 29 36 43
0.26 0.11 0.13
0.07 < 0.04 0.04
0.33 0.15 0.17
– – –
2006/ 1025865 05ES/039R
Spain, 2007 Carrots Nevis F 1
1 0.500 0.300 28 35 42
0.38 0.22 0.24
0.06 < 0.04 0.04
0.44 0.26 0.28
– 0.10 0.10
2009/ 1075173 L070365
Celeriac
Eight residue trials were conducted on celeriac in Europe in 2006 and 2007. Residues were determined using Methods 407/1 or 493/0. The results are shown in Table 87. Table 87 Results of residue trials conducted with cycloxydim on celeriac Application Residues, mg/kg

Cycloxydim
335
Country, year Variety No kg ai/ha kg ai/hL
Portion analysed
DAT, days
Cy1 Cy2 Total cycloxydim
Cy- TSO Study Trial No.
France, 2006 North
Celeriac Prinz
1 0.600 0.200 plants a tubers tubers tubers leaves leaves leaves
0 49 56 63 49 56 63
7.10 0.10 0.09 0.06 0.11 0.08 0.060
< 0.04 < 0.04 < 0.04 < 0.04 < 0.04 < 0.04 < 0.04
7.1 0.14 0.13 0.10 0.15 0.12 0.10
– – 0.05 < 0.05 – < 0.05 < 0.05
2007/ 1020727 06FR/035R
France, 2007 South
Celeriac Rowena
1 0.600 0.200 plants a tubers tubers tubers leaves leaves leaves
0 49 56 63 49 56 63
16.39 0.08 0.06 0.06 0.21 0.18 0.13
< 0.04 0.04 0.07 0.08 < 0.04 < 0.04 < 0.04
16.4 0.12 0.13 0.14 0.25 0.22 0.17
– – < 0.05 < 0.05 – < 0.05 < 0.05
2009/ 1075172 L070359
Germany, 2006 Celeriac Prinz
1 0.600 0.200 plants a tubers tubers tubers leaves leaves leaves
0 49 55 63 49 55 63
14.30 0.09 0.09 0.05 0.13 0.05 0.050
< 0.04 < 0.04 < 0.04 0.04 < 0.04 0.08 0.050
14 0.13 0.13 0.09 0.17 0.13 0.10
– – < 0.05 < 0.05 – < 0.05 < 0.05
2007/ 1020727 06GE/036R
Greece, 2007 Celeriac Magnisias
1 0.600 0.200 plants a tubers tubers tubers leaves leaves leaves
0 50 57 64 50 57 64
23.38 0.05 0.05 0.08 0.05 < 0.05 0.06
0.04 < 0.04 < 0.04 0.05 < 0.04 < 0.04 < 0.04
23 0.09 0.09 0.13 0.09 < 0.09 0.09
– < 0.05 < 0.05 < 0.05 < 0.05 – –
2009/ 1075172 L070358
Italy, 2006 Celeriac Cisko
1 0.600 0.200 plants a tubers tubers tubers leaves leaves leaves
0 49 56 64 49 56 64
16.60 0.10 0.07 0.05 0.15 0.06 0.05
< 0.04 0.09 0.04 < 0.04 < 0.04 0.04 < 0.04
17 0.19 0.11 0.09 0.19 0.1 0.09
– – < 0.05 < 0.05 – < 0.05 < 0.05
2007/ 1020727 06IT/034R
Netherlands, 2007
Celeriac Briljanft
1 0.600 0.200 plants a tubers tubers tubers leaves leaves leaves
0 50 56 64 50 56 64
14.10 0.24 0.32 0.23 0.18 0.19 0.11
< 0.04 0.20 0.32 0.20 0.09 0.13 0.10
14 0.44 0.64 0.43 0.27 0.32 0.21
– – 0.10 0.08 – 0.07 0.06
2009/ 1075172 L070357
Spain, 2006 Celeriac Cisko
1 0.600 0.200 plants a tubers tubers tubers leaves leaves leaves
0 50 55 63 50 55 63
29.00 0.05 < 0.05 < 0.05 0.07 < 0.05 0.050
0.05 0.07 0.05 0.04 < 0.04 < 0.04 0.040
29 0.12 0.10 0.09 0.11 < 0.09 0.090
– – – – – – < 0.05
2007/ 1020727 06ES/033R
United Kingdom, 2007
Celeriac Kojak
1 0.600 0.200 plants a tubers tubers tubers leaves leaves leaves
0 50 56 63 50 56 63
11.60 0.10 0.06 0.06 < 0.05 < 0.05 < 0.05
< 0.04 0.07 0.04 0.04 < 0.04 < 0.04 < 0.04
12 0.17 0.10 0.10 < 0.09 < 0.09 < 0.09
– – < 0.05 < 0.05 – – –
2009/ 1075172 L070356
a Whole plant without roots
Potatoes
Eighteen residue trials were conducted on potatoes in Europe from 1986 and 2007. Residues were determined using Methods 263, 407/1 or 493/0. The results are shown in Table 88.

Cycloxydim
336
Table 88 Results of residue trials conducted with cycloxydim on potatoes Application Residues, mg/kg Country, year Variety No kg
ai/ha kg ai/hL
Portion analysed
DAT, days
Cy1 Cy2 Total cycloxydim
Cy- TSO
Study Trial No.
Belgium, 2007 Potato Victoria
1 0.600 0.200 plants a tubers tubers tubers
0 50 56 62
11.3 0.85 0.75 0.76
0.09 0.39 0.37 0.42
11 1.2 1.1 1.2
– – 0.44 0.51
2008/ 1090754 AF/11680/BA/3
Denmark, 2007 Potato Sava
1 0.600 0.200 plants a tubers tubers tubers
0 49 56 63
24.8 0.22 0.30 0.32
0.10 0.05 0.08 0.09
25 0.27 0.38 0.41
– – 0.22 0.18
2008/ 1090754 AF/11680/BA/1
France, 2001 South
Potato Sprinta
1 0.600 0.200 plants a tubers tubers
0 56 98
31.8 < 0.05 < 0.05
0.71 < 0.04 < 0.04
32 < 0.09 < 0.09
– – –
2002/ 1005446 FBD/18/01
France, 2001 South
Potato Monalisa
1 0.600 0.200 plants a tubers tubers
0 57 99
11.5 0.48 0.36
0.07 0.15 0.10
12 0.63 0.46
– – 0.22
2002/ 1005446 FTL/27/01
France, 2006 North
Potato Mona Lisa
1 0.574 0.200 plants a tubers tubers tubers
0 48 56 63
19.0 0.58 0.62 0.19
0.16 0.07 0.10 < 0.04
19 0.65 0.72 0.23
– – 0.47 0.10
2007/ 1020729 06FR/029R
Germany, 2006 Potato Marabel
1 0.592 0.200 plants a tubers tubers tubers
0 49 56 63
19.20 0.48 0.54 0.44
0.16 0.21 0.11 0.08
19 0.69 0.65 0.52
– – 0.30 0.33
2007/ 1020729 06GE/030R
Germany, 2007 Potato Cilena
1 0.600 0.200 plants a tubers tubers tubers
0 49 56 62
24.8 1.78 1.21 1.12
0.10 0.40 0.34 0.32
25 2.2 1.6 1.4
– – 0.51 0.38
2008/ 1090754 AF/11680/BA/2
Italy, 2007 Potato Romanze
1 0.600 0.200 plants a tubers tubers tubers
0 49 56 63
14.8 0.19 0.12 0.19
0.12 0.23 0.15 0.23
15 0.42 0.27 0.42
– – 0.05 0.07
2008/ 1090754 AF/11680/BA/5
Netherlands, 1986
Potato
1 0.600 0.200 tubers 51 0.30 0.71 1.0 b – 2000/ 1013495 51701H86/65E-68E
Netherlands, 2006
Potato Cilena
1 0.578 0.194 plants a tubers tubers tubers
0 49 55 63
16.1 0.88 0.57 0.69
< 0.04 0.10 0.08 0.10
16 0.98 0.65 0.79
– – 0.46 0.52
2007/ 1020729 06NL/031R
Netherlands, 1987
Potato
1 0.600 0.200 tubers 56 0.21 0.24 0.75 b –
2000/ 1013495 51701H87/74E-77E
Spain, 2001 Potato Spunta
1 0.600 0.200 plants a tubers tubers
0 56 84
22.5 0.06 0.10
0.39 0.08 0.17
23 0.15 0.27
– – –
2002/ 1005446 ALO/32/01
Spain, 2001 Potato Berbe
1 0.600 0.200 plants a tubers tubers
0 56 84
35.1 0.14 < 0.05
0.53 0.26 0.05
36 0.40 0.10
– – –
2002/ 1005446 ALO/33/01
Spain, 2007 Potato Romana
1 0.600 0.200 plants a tubers tubers tubers tubers
0 49 56 63 83
15.4 0.29 < 0.05 0.30 0.20
0.17 0.23 < 0.04 0.33 0.24
15 0.52 < 0.09 0.63 0.44
– – < 0.05 0.14 0.07
2008/ 1090754 AF/11680/BA/6
United Kingdom, 2007
Potato Maris Piper
1 0.600 0.200 plants a tubers tubers tubers
0 49 55 63
19.8 0.19 0.16 0.13
0.23 0.16 0.15 0.07
20 0.35 0.31 0.20
– – 0.44 0.51
2008/ 1090754 AF/11680/BA/4
United Kingdom, 2006
Potato Marquis
1 0.575 0.200 plants a tubers tubers tubers
0 49 56 62
7.58 0.34 0.31 0.48
< 0.04 0.06 0.08 0.07
7.6 0.40 0.39 0.55
– – 0.16 0.10
2007/ 1020729 06UK/032R
Greece, 2001 Potato 1 0.600 0.200 plants a 0 21.4 0.27 22 – 2002/ 1005446

Cycloxydim
337
Application Residues, mg/kg Country, year Variety No kg
ai/ha kg ai/hL
Portion analysed
DAT, days
Cy1 Cy2 Total cycloxydim
Cy- TSO
Study Trial No.
Spuda tubers tubers
56 96
0.12 0.11
0.15 0.10
0.27 0.21
– < 0.05
HEL/10/01
Italy, 2001 Potato Monalisa
1 0.600 0.200 plants a tubers tubers
0 57 98
22.1 0.06 < 0.05
0.16 < 0.04 < 0.04
22 0.10 < 0.09
– – –
2002/ 1005446 ITA/38/01
a Without roots b Mean of four values
Turnips
Six residue trials were conducted on turnips in Europe in 1987 and 1989. Residues were determined using Method 263. The results are shown in Table 89. Table 89 Results of residue trials conducted with cycloxydim on turnips Country, year Variety Application Portion DAT,
days Residues, mg/kg Study
Trial No No kg ai/ha kg ai/hL
Cy1 Cy2 Total cycloxydim
Norway, 1987 Bangholm
1 0.600 0.120 roots 91 0.09
< 0.04
0.13 1987/10712 Norway 05.11.010
Norway, 1987 Gry 1 0.600 0.240 roots 103 0.06 < 0.04
0.10 1987/10702 Norway 04.91.013
Norway, 1989 Barke 1 0.600 0.240 roots 77 < 0.05
< 0.04
< 0.09 1993/11354 NO-H-XXA-89
Norway, 1989 Barke 1 0.600 0.240 leaves 77 n.r.
n.r.
0.12 a 1993/11354 NO-H-XXC-89
Norway, 1989 Barke 1 0.600 0.240 roots 77 < 0.05 < 0.04 < 0.09 1993/11355 NO-H-XXA-89
Norway, 1989 Barke 1 0.600 0.240 leaves 77 n.r. n.r. 0.10 1993/11355 NO-H-XXC-89
a Residue in untreated control 0.12 mg/kg
Sugar beet
Eighteen residue trials were conducted on sugar beet in Europe in 1988 and 2001. Residues were determined using Methods 263, 407/1 or 493/0. The results are shown in Table 90. Table 90 Results of residue trials conducted with cycloxydim on sugar beet root Application Residues, mg/kg Country, year No kg
ai/ha kg ai/hL
DAT, days
Cy1 Cy2 Total cycloxydim
Cy- TSO Study Trial No.
Germany, 1986 1 0.500 0.125 25 55 87 126
< 0.05 < 0.05 < 0.05 < 0.05
< 0.04 < 0.04 < 0.04 < 0.04
< 0.09 < 0.09 < 0.09 < 0.09
– – – –
2000/ 1013494 51701H86/ 26A
Germany, 1986 1 0.500 0.200 36 64 107 132
< 0.05 < 0.05 < 0.05 < 0.05
< 0.04 < 0.04 < 0.04 < 0.04
< 0.09 < 0.09 < 0.09 < 0.09
– – – –
2000/ 1013494 51701H86/ 27A
Germany, 1986 1 0.500 0.152 24 51 84 132
< 0.05 < 0.05 < 0.05 < 0.05
< 0.04 < 0.04 < 0.04 < 0.04
< 0.09 < 0.09 < 0.09 < 0.09
– – – –
2000/ 1013494 51701H86/ 28A
Germany, 1986 1 0.500 0.250 30 61 90 118
< 0.05 < 0.05 < 0.05 < 0.05
< 0.04 < 0.04 < 0.04 < 0.04
< 0.09 < 0.09 < 0.09 < 0.09
– – – –
2000/ 1013494 51701H86/ 29A

Cycloxydim
338
Application Residues, mg/kg Country, year No kg
ai/ha kg ai/hL
DAT, days
Cy1 Cy2 Total cycloxydim
Cy- TSO Study Trial No.
Germany, 1986 1 0.500 0.125 35 64 107 129
< 0.05 < 0.05 < 0.05 < 0.05
< 0.04 < 0.04 < 0.04 < 0.04
< 0.09 < 0.09 < 0.09 < 0.09
– – – –
2000/ 1013494 51701H86/ 30A
Germany, 1987 1 0.500 0.250 52 71 100 140
< 0.05 < 0.05 < 0.05 < 0.05
< 0.04 < 0.04 < 0.04 < 0.04
< 0.09 < 0.09 < 0.09 < 0.09
– – – –
2000/ 1013494 51701H87/ 8A
Germany, 1987 1 0.500 0.125 42 72 112 142
< 0.05 < 0.05 < 0.05 < 0.05
< 0.04 < 0.04 < 0.04 < 0.04
< 0.09 < 0.09 < 0.09 < 0.09
– – – –
2000/ 1013494 51701H87/ 10A
Germany, 1987 1 0.500 0.250 35 64 95 127
< 0.05 < 0.05 < 0.05 < 0.05
< 0.04 < 0.04 < 0.04 < 0.04
< 0.09 < 0.09 < 0.09 < 0.09
– – – –
2000/ 1013494 51701H87/ 11A
Greece, 1993 1 0.500 0.143 76 < 0.05 < 0.04 < 0.09 – 2000/ 1013494; 51701H93/ 1E
Greece, 2001 1 0.593 0.200 55 97
< 0.05 < 0.05
< 0.04 < 0.04
< 0.09 < 0.09
< 0.05 < 0.05
2003/ 1001264 01RF024/1
Greece, 2001 1 0.629 0.200 56 99
< 0.05 < 0.05
< 0.04 < 0.04
< 0.09 < 0.09
< 0.05 < 0.05
2003/ 1001264 01RF024/2
Italy, 1987 1 0.600 0.120 100 < 0.05 < 0.04 < 0.09 – 2000/ 1013494; 51701H87/ 116E
Italy, 1987 1 0.600 0.150 84 < 0.05 < 0.04 < 0.09 – 2000/ 1013494; 51701H87/ 118E
Italy, 1988 1 0.500 0.125 105 < 0.05 < 0.04 < 0.09 – 2000/ 1013494; 51701H88/ 68E
Italy, 2001 1 0.563 0.200 56 96
< 0.05 < 0.05
< 0.04 < 0.04
< 0.09 < 0.09
< 0.05 < 0.05
2003/ 1001264 132R
Italy, 2001 1 0.582 0.200 56 96
< 0.05 < 0.05
< 0.04 < 0.04
< 0.09 < 0.09
< 0.05 < 0.05
2003/ 1001264 133R
Netherlands, 1987
1 0.600 0.126 58 0.065 < 0.04 0.10 a
– 2000/ 1013494 51701H87/33-36E
Netherlands, 1987
1 0.600 0.126 58 < 0.05 < 0.04 < 0.09 a –
2000/ 1013494 51701H87/37-40E
a Mean of 4 values
Maize
Eight residue trials were conducted on maize grain in Europe in 1997. Residues were determined using Method 263/1. The results are shown in Table 91. Table 91 Results of residue trials conducted with cycloxydim on maize grain Country, year
Application DAT, mg/kg
Residues, mg/kg Study Trial number No kg
ai/ha kg ai/hL Cy1 Cy2 Total
cycloxydim France, North 1995 1 0.400 0.133 132 < 0.05 < 0.04 < 0.09 1997/10456; FR8/07/95 France, North 1995 1 0.400 0.133 100 < 0.05 < 0.04 < 0.09 1997/10456; FR4/05/95 France, North 1996 1 0.400 0.133 122 < 0.05 < 0.04 < 0.09 1997/10518; FR4/02/96 Germany, 1995 1 0.400 0.133 132 < 0.05 < 0.04 < 0.09 1997/10456; D07/03/95 Germany, 1995 1 0.400 0.133 91 < 0.08 < 0.04 0.12 1997/10456; DU2/07/95 Germany, 1995 1 0.400 0.133 135 < 0.05 < 0.04 < 0.09 1997/10456; D07/03/96 Italy, 1995 1 0.400 0.133 100 < 0.05 < 0.04 < 0.09 1997/10417; IT10-95-H368 Italy, 1995 1 0.400 0.133 112 < 0.05 < 0.04 < 0.09 1997/10417; IT10-95-H369 Italy, 1996 1 0.400 0.133 121 < 0.05 < 0.04 < 0.09 1997/10403; IT10-96-R366 Italy, 1996 1 0.400 0.133 125 < 0.05 < 0.04 < 0.09 1997/10403; IT10-96-R367 Spain, 1995 1 0.400 0.133 85 < 0.05 < 0.04 < 0.09 1997/10456; AC/10/95 Spain, 1995 1 0.400 0.133 95 < 0.05 < 0.04 < 0.09 1997/10456; AC/11/95

Cycloxydim
339
Spain, 1996 1 0.400 0.133 98 < 0.05 < 0.04 < 0.09 1997/10518;AC/08/96 Spain, 1996 1 0.400 0.133 96 < 0.05 < 0.04 < 0.09 1997/10518; AC/09/93
Rice
Eleven residue trials were conducted on rice in Europe in 1993 to 1996. Residues were determined using Methods 263. The results are shown in Table 92. Table 92 Results of residue trials conducted with cycloxydim on rice in Italy Application Residues, mg/kg Country, year Variety No kg
ai/ha kg ai/hL
DAT, days
Cycloxydim
Cy2 Total cycloxydim
Study Trial No.
Italy, 1996 Loto 1 0.400 0.100 137 < 0.05 < 0.04 < 0.09 1997/10302; IT10-96-H362 Italy, 1996 Loto 1 0.400 0.100 133 < 0.05 < 0.04 < 0.09 1997/10302; IT10-96-H363 Italy, 1996 Selenio 1 0.400 0.100 147 < 0.05 < 0.04 < 0.09 1997/10302; IT10-96-H364 Italy, 1996 Loto 1 0.400 0.100 145 < 0.05 < 0.04 < 0.09 1997/10302; IT10-96-H365 Italy, 1995 Loto 1 0.300 0.075 136 < 0.05 < 0.04 < 0.09 1997/10290; IT10-95-H364 Italy, 1995 Koral 1 0.300 0.075 147 < 0.05 < 0.04 < 0.09 1997/10290; IT10-95-H365 Italy, 1995 Baldo 1 0.300 0.075 142 < 0.05 < 0.04 < 0.09 1997/10290; IT10-95-H366 Italy, 1995 Cigalon 1 0.300 0.075 143 < 0.05 < 0.04 < 0.09 1997/10290; IT10-95-H367 Italy, 1993 Senia 1 0.400 0.100 162 < 0.05 < 0.04 < 0.09 1993/11603; ES4-60 Italy, 1993 Tebre 1 0.400 0.100 162 < 0.05 < 0.04 < 0.09 1993/11604; ES4-61 Italy, 1993 Bahia 1 0.400 0.100 162 < 0.05 < 0.04 < 0.09 1993/11605; ES4-62
Rape seed
Eighteen residue trials were conducted on rape seed in Europe in 1987–2008. Residues were determined using Methods 263, 407/1 or 493/0. The results are shown in Table 93. Table 93 Results of residue trials conducted with cycloxydim on rape seed Country, year Variety Application DAT,
days Residues, mg/kg Study
Trial No. No kg ai/ha
kg ai/hL
Cy1 Cy2 Total cycloxydim
Cy- TSO
Belgium, 2008 Monalisa 1 0.600 0.400 90 104
4.63 3.72
0.65 0.74
5.3 4.5
– 1.01
2008/ 1067445 L080119
Germany, 2008 Billy 1 0.600 0.400 93 99
1.75 0.76
0.16 0.13
1.9 0.89
– 0.20
2008/ 1067445 L080115
France, 2001 South
1 0.600 0.200 98 2.35 0.5 2.8 – 1.0
2003/ 1001267 X 01 062 01
France, 2001 South
1 0.600 0.200 98 3.32 0.66 4.0 0.94 2003/ 1001267 X 01 062 02
France, 2002 North
1 0.600 0.200 98 0.59 0.18 0.77 0.48 2003/ 1001253 FTL/05/02
France, 2008 North
Astrid 1 0.600 0.400 100 110
2.14 1.28
0.39 0.15
2.5 1.4
– 0.19
2008/ 1067445 L080117
Italy, 2001
1 0.600 0.200 96 0.386 0.153 0.54 0.071 2003/ 1001267 0134R
Netherlands, 2008
Standard 1 0.600 0.400 85 92
0.89 0.87
0.13 0.11
1.0 0.98
– 0.16
2008/ 1067445 L080116
Spain, 2001
1 0.600 0.200 79 2.48 0.609 3.1 0.629 2003/ 1001267 01S021R
Spain, 2001
1 0.600 0.200 79 2.17 0.599 2.8 0.68 2003/ 1001267 01S022R
Spain, 2002 1 0.600 0.200 98 1.33 0.28 1.6 1.1 2003/ 1001253 ALO/07/02
United Kingdom, 1987
1 0.500 0.250 93 1.76 < 0.04 1.8 – –
2000/ 1013493 51701H87/32A
United Kingdom, 1987
1 0.500 0.250 93 1.51 < 0.04 1.6 – –
2000/ 1013493 51701H87/34A
United 1 0.500 0.250 93 2.15 < 0.04 2.2 – 2000/ 1013493

Cycloxydim
340
Country, year Variety Application DAT, days
Residues, mg/kg Study Trial No. No kg
ai/ha kg ai/hL
Cy1 Cy2 Total cycloxydim
Cy- TSO
Kingdom, 1987 94 95
1.46 1.90
< 0.04 < 0.04
1.5
1.9 – –
51701H87/36A
United Kingdom, 2008
Castille 1 0.600 0.400 91 110
1.38 1.26
0.11 0.13
1.5 1.4
– 0.16
2008/ 1067445 L080118
Sunflower
Fifteen residue trials were conducted on sunflower seeds in Europe in 2006–2008. Residues were determined using Method 407/1 or 493/0. The results are shown in Table 94. Table 94 Results of residue trials conducted with cycloxydim on sunflower Country, year Variety Application Portion
analysed DAT, days
Residues, mg/kg Study Trial No. No kg ai/ha kg
ai/hL Cy1 Cy2 Total
cycloxydim Cy- TSO
Belgium, 2008
Sunflower Marquis
1 0.500 0.333 plant a seeds seeds seeds seeds
0 90 101 110 119
37.40 < 0.05 < 0.05 < 0.05 < 0.05
0.14 < 0.04 < 0.04 < 0.04 < 0.04
38 < 0.09 < 0.09 < 0.09 < 0.09
– – – – –
2009/ 1069373 L080746
France, 2002 South
Sunflower PR64A70
1 0.600 0.200 plant a plant a seeds seeds
0 56 98 105
45.81 0.142 < 0.05 < 0.05
0.211 < 0.04 0.068 0.060
46 0.18 0.12 0.11
– – < 0.05 < 0.05
2004/ 1015930 X 02 062 01
France, 2005 South
Sunflower Caramba
1 0.600 0.400 plant a seeds seeds seeds
0 89 101 110
45.40 < 0.05 < 0.05 < 0.05
0.52 < 0.04 < 0.04 < 0.04
46 < 0.09 < 0.09 < 0.09
– – – –
2006/ 1034026 05 H TO FR P02
France, 2006 South
Sunflower Melodie
1 0.600 0.400 plant a seeds seeds seeds
0 90 100 110
21.3 0.09 0.09 0.09
0.13 0.23 0.24 0.29
21 0.32 0.33 0.38
– – < 0.05 < 0.05
2006/1020733 06FR/073R
Germany, 2008
Sunflower Kronosol
1 0.500 0.333 plant a seeds seeds seeds
0 91 100 109
9.82 0.84 0.81 0.91
< 0.04 1.71 1.55 1.85
9.9 2.6 2.4 2.8
– – 0.13 0.13
2009/ 1069373 L080745
Greece, 2001 Sunflower Turquoise
1 0.600 0.200 plant a plant a seeds
0 55 98
22.34 2.755 0.704
0.128 0.496 1.048
22 3.2 1.8
– – 0.095
2004/ 1015931 01RF021
Greece, 2002 Sunflower Turquoise
1 0.600 0.200 plant a plant a seeds
0 54 98
27.54 0.313 < 0.05
0.142 0.056 0.095
28 0.37 0.14
– – < 0.05
2004/ 1015930 02RF028
Greece, 2005 Sunflower Turquoiz
1 0.600 0.400 plant a seeds seeds seeds
0 90 100 110
30.00 0.25 0.47 0.42
0.24 0.27 0.47 0.45
30 0.52 0.94 0.87
– – – –
2006/ 1034026 05RF039
Greece, 2006 Sunflower Alhaja
1 0.600 0.400 plant a seeds seeds seeds
0 90 99 109
21.8 0.11 0.14 0.14
0.17 0.17 < 0.04 0.23
22 0.28 0.18 0.37
– – < 0.05 < 0.05
2006/ 1020733 06GR/074R
Italy, 1993 Sunflower Isoleic
1 0.600 0.150 plant a seeds
0 84
17.70 < 0.05
< 0.04 0.04
18 0.09
– –
1995/10368 IT 10-93-H 364
Italy, 1993 Sunflower Trisun 849
1 0.600 0.150 plant a seeds
0 99
26.90 < 0.05
< 0.04 < 0.04
27 < 0.09
– –
1995/10368 IT10-93-H 363
Italy, 2001 Sunflower Moreno
1 0.600 0.200 plant a plant a seeds
0 56 99
22.86 0.056 < 0.05
0.051 < 0.04 < 0.04
23 0.10 < 0.09
– – < 0.05
2004/ 1015931 0136R
Italy, 2001 Sunflower Floralie
1 0.600 0.200 plant a plant a seeds
0 56 98
24.98 0.223 0.108
< 0.04 0.076 0.144
25 0.30 0.25
– – < 0.05
2004/ 1015931 0137R
Italy, 2005 Sunflower 1 0.600 0.400 plant a 0 23.30 0.09 24 – 2006/ 1034026

Cycloxydim
341
Country, year Variety Application Portion analysed
DAT, days
Residues, mg/kg Study Trial No. No kg ai/ha kg
ai/hL Cy1 Cy2 Total
cycloxydim Cy- TSO
Proleic seeds seeds seeds
89 99 109
0.13 0.10 0.14
0.37 0.28 0.31
0.50 0.38 0.45
– – –
0537R
Italy, 2006 Sunflower Panther
1 0.600 0.400 plant a seeds seeds seeds
0 91 100 110
22.0 0.11 0.14 0.15
0.17 0.19 0.24 0.24
22 0.30 0.38 0.39
– – 0.10 0.08
2007/ 1020733 06IT/072R
Netherlands, 2006
Sunflower Sanluca
1 0.600 0.400 plant a seeds seeds seeds
0 90 100 111
21.7 0.11 0.13 0.14
0.15 0.17 < 0.04 0.23
22 0.28 0.17 0.37
– – 0.08 < 0.05
2007/ 1020733 06NL/075R
Spain, 2005 Sunflower Latino
1 0.600 0.400 plant a seeds seeds seeds
0 90 98 109
34.80 < 0.05 < 0.05 < 0.05
0.17 < 0.04 < 0.04 < 0.04
35 < 0.09 < 0.09 < 0.09
– – – –
2006/ 1034026 05ES/078R
Spain, 2006 Sunflower Latino
1 0.600 0.400 plant a seeds seeds seeds
0 89 101 111
19.9 0.09 0.11 0.15
0.22 0.17 0.17 0.20
20 0.26 0.28 0.35
– – < 0.05 < 0.05
2007/ 1020733 06ES/071R
United Kingdom, 2006
Sunflower Blizar
1 0.600 0.400 plant a seeds seeds seeds
0 91 99 108
21.3 0.12 0.13 0.15
0.17 0.18 0.23 0.23
22 0.30 0.36 0.38
– – < 0.05 < 0.05
2007/ 1020733 06UK/076R
a Without roots
Animal feed commodities
In some trials reported in the previous tables, commodities for animal consumption were analysed for cycloxydim residues and its metabolites. The results are shown in Tables 95–100.
Table 95 Results of residue trials conducted with cycloxydim on bean vines Application Residues, mg/kg Country, year
Variety No kg ai/ha
kg ai/hL
Portion analysed DAT, days
Cy1 Cy2 Total cycloxydim
Cy- TSO
Study Trial No.
Belgium, 2005
Green bean Proton
1 0.500 0.330 wh. plant rest plant rest plant rest plant
0 21 28 35
20.60 0.88 0.93 0.67
< 0.04 0.06 0.06 0.05
21 0.94 0.99 0.72
– – – –
2006/ 1031719 G020–05 H
Belgium, 2008
Green bean Cadillac
1 0.520 0.330 wh. plant wh. plant rest plant rest plant
0 21 29 35
41.5 1.99 0.85 0.61
< 0.04 0.06 0.05 0.04
42 2.0 0.9 0.65
– – – –
2008/ 1067444 L080147
Denmark, 2005
Dry beans Vroma
1 0.500 0.330 plant straw straw straw
0 49 56 63
12.1 2.82 1.53 1.24
< 0.04 0.4 0.29 0.24
12 3.2 1.8 1.5
– – – –
2006/ 1024330 ALB/190501-01
France, 2001 South
Green bean Big Borlotto
1 0.500 0.167 wh. plant rest plant rest plant rest plant
0 28 42 57
15.50 1.17 0.70 0.32
< 0.04 0.05 0.05 0.06
16 1.2 0.75 0.39
– – – –
2003/ 1001265 X0106203
France, 2005 North
Green bean Albany
1 0.500 0.330 wh. plant wh. plant rest plant rest plant
0 21 28 36
42.90 0.26 0.23 0.06
< 0.04 < 0.04 < 0.04 < 0.04
43 0.30 0.27 0.10
– – – –
2006/ 1031719 05 H CL FR P11
France, 2005 North
Dry beans Lingots du Nord
1 0.500 0.330 plant straw straw straw
0 49 56 63
11 1.5 1.31 1.26
< 0.04 1.47 2.01 1.51
11.0 3.0 3.3 2.8
– – – –
2006/ 1024330 05 H CL FR P 10
France, 2005
Dry beans Linix
1 0.500 0.330 plant straw
0 49
11.3 1.42
< 0.04 2.47
11 3.9
– –
2006/ 1024330

Cycloxydim
342
Application Residues, mg/kg Country, year
Variety No kg ai/ha
kg ai/hL
Portion analysed DAT, days
Cy1 Cy2 Total cycloxydim
Cy- TSO
Study Trial No.
South
straw straw
56 63
1.3 0.67
2.63 1.47
3.9 2.1
– –
05 H CL FR P09
France, 2006 North
Dry beans Irena
1 0.500 0.330 plant straw straw straw
0 49 57 62
10.02 1.36 0.35
< 0.04 0.33 1.57 0.1
10 1.7 3.0 0.45
– – – –
2007/ 1020731 06FR/086R
France, 2006 South
Dry beans Diva
1 0.500 0.330 plant straw straw straw
0 49 56 63
4.03 0.76 0.79 0.47
< 0.04 0.1 0.07 0.05
4.1 0.86 0.86 0.52
– – – –
2007/ 1020731 06FR084R
France, 2008 North
Green bean Cantare
1 0.500 0.330 wh. plant wh. plant rest plant rest plant
0 21 28 35
43.59 1.42 0.93 0.6
< 0.04 0.06 0.04 < 0.04
44 1.5 0.97 0.64
– – – –
2008/ 1067444 L080150
Greece, 2005
Dry beans Express
1 0.500 0.330 plant straw straw straw
0 49 56 63
24.5 0.27 0.2 1.13
< 0.04 < 0.04 < 0.04 < 0.04
25 0.31 0.24 1.2
– – – –
2006/ 1024330 05/RF040
Greece, 2006
Dry beans super Aguadulce
1 0.500 0.330 plant straw straw straw
0 48 55 62
28.2 0.29 0.29 0.35
< 0.04 < 0.04 < 0.04 < 0.04
28 0.33 0.33 0.39
– – – –
2007/ 1020731 06GR085R
Germany, 2006
Dry beans Danko
1 0.500 0.330 plant straw straw straw
0 49 56 63
20.3 3.25 3.66 4.91
< 0.04 0.41 0.79 1.1
20 3.7 4.4 6.0
– – – –
2007/ 1020731 06GE/087R
Germany, 2006
Dry beans Danko
1 0.500 0.330 plant straw straw straw
0 49 56 63
15.59 3.25 3.58 2.53
< 0.04 1.19 1.16 0.51
16 4.4 4.7 3.0
– – – –
2007/ 1020731 06GE/088R
Greece, 2002
Dry beans Express
1 0.500 0.330 plant pods w/ seed pods w/o seed pods w/o seed rest plant rest plant rest plant
0 28 54 68 28 54 68
17.9 0.694 < 0.05 1.6 1.18 0.121 0.069
< 0.04 < 0.04 < 0.04 0.44 < 0.04 < 0.04 < 0.04
18 0.73 < 0.09 2.0 1.2 0.16 0.11
– 0.784 – – – – –
2003/ 1001266 02RF003
Italy, 2001 Green bean Festival
1 0.500 0.167 wh. plant rest plant rest plant rest plant
0 27 42 55
19.50 0.35 0.08 0.19
< 0.04 < 0.04 < 0.04 < 0.04
20 0.39 0.12 0.12
– – – –
2003/ 1001265 0135R
Italy, 2005 Green bean Festina
1 0.500 0.330 wh. plant#
rest plant#
rest plant#
rest plant#
0 21 27 35
30.90 0.71 0.37 0.37
< 0.04 0.06 < 0.04 0.04
31 0.77 0.41 0.41
– – – –
2006/ 1031719 0539R
Italy, 2001
Dry beans Siconia
1 0.500 0.330 plant pods w/ seed pods w/o seed rest plant rest plant
0 29 55 29 55
92.5 0.843 0.676 0.629 0.19
< .04 0.077 0.125 < .04 < .04
92 0.92 0.80 0.67 0.23
– 0.815 – – –
2003/ 1001266 0130R
Italy, 2001
Dry beans Siviglia
1 0.500 0.330 plant pods w/ seed pods w/o seed rest plant rest plant
0 28 55 28 55
237.4 0.871 4.12 0.548 0.62
< 0.04 0.189 0.448 0.049 0.093
240 1.1 4.6 0.60 0.71
– 0.952 – – –
2003/ 1001266 0131R
Italy, 2005
Dry beans Vesuvio
1 0.500 0.330 plant straw straw straw
0 49 57 63
11.7 0.18 0.39 0.23
< 0.04 0.05 0.09 0.05
12 0.23 0.48 0.28
– – –
2006/ 1024330 0540R
Italy, 2006
Dry beans Listra
1 0.500 0.330 plant straw straw
0 48 56
9.12 2.79 3.52
< 0.04 0.58 0.61
9.2 3.4 4.1
– – –
2007/ 1020731 06IT/083R

Cycloxydim
343
Application Residues, mg/kg Country, year
Variety No kg ai/ha
kg ai/hL
Portion analysed DAT, days
Cy1 Cy2 Total cycloxydim
Cy- TSO
Study Trial No.
straw 63 2.49 0.26 2.8 – Netherlands, 2006
Dry beans Danko
1 0.500 0.330 plant straw straw straw
0 49 56 63
15.68 8.94 7.64 4.58
< 0.04 0.69 0.23 1.53
16 9.6 7.8 6.1
– – – –
2007/ 1020731 06NL/089R
Netherlands, 2008
Green bean Speedy
1 0.500 0.330 wh. plant wh. plant rest plant rest plant
0 21 29 35
19.95 0.75 0.75 0.46
0.05 0.07 0.09 0.05
20 0.82 0.84 0.51
– – – –
2008/ 1067444 L080151
Spain, 2001 Green bean Festival
1 0.500 0.167 wh. plant rest plant rest plant rest plant
0 26 40 54
34.90 0.39 0.18 0.14
< 0.04 < 0.04 < 0.04 < 0.04
35 0.43 0.22 0.18
– – – –
2003/ 1001265 01S025R
Spain, 2001
Dry beans Alameda
1 0.500 0.330 plant pods w/ seed pods w/o seed rest plant rest plant
0 28 56 28 56
5.73 1.16 1.59 1.27 0.633
< 0.04 0.315 0.552 0.065 < 0.04
5.8 1.5 2.1 1.3 0.67
– 1.32 – – –
2003/ 1001266 01S023R
Spain, 2001
Dry beans Corsario
1 0.500 0.330 plant pods w/ seed pods w/o seed rest plant rest plant
0 28 56 28 56
127.4 0.856 2.07 1.97 0.883
< 0.04 0.238 0.702 0.059 0.187
130 1.1 2.8 2.0 1.1
– 1.01 – – –
2003/ 1001266 01S024R
Spain, 2005
Dry beans Luz de Olono
1 0.500 0.330 plant straw straw straw
0 49 55 62
20.6 0.11 0.06 0.06
< 0.04 < 0.04 < 0.04 < 0.04
21 0.15 0.10 0.10
– – –
2006/ 1024330 05ES/079R
Spain, 2006
Dry beans Aguadulce
1 0.500 0.330 plant straw straw straw
0 48 56 62
15.34 2.58 0.95 1.28
< 0.04 0.35 0.14 0.1
15 3.0 1.1 1.4
– – – –
2007/ 1020731 06ES/082R
Sweden, 2005
Dry beans Vroma
1 0.500 0.330 plant straw straw straw
0 50 57 64
6.29 0.17 0.24 0.17
< 0.04 < 0.04 < 0.04 < 0.04
6.3 0.21 0.28 0.21
– – – –
2006/ 1024330 HUS/190501-02
United Kingdom, 2005
Green bean Nerina
1 0.500 0.330 wh. plant rest plant rest plant rest plant
0 21 27 34
29.70 0.99 0.60 0.58
0.08 0.20 0.15 0.14
30 1.2 0.75 0.72
– – – –
2006/ 1031719 776/GBE/1
United Kingdom, 2005
Dry beans Compass
1 0.500 0.330 plant straw straw straw
0 49 56 63
9.96 0.45 1.16 0.31
< 0.04 0.1 0.12 0.06
10 0.55 1.3 0.37
– – – –
2006/ 1024330 775/DBE/1
United Kingdom, 2008
Green bean Torpedo
1 0.530 0.330 wh. plant wh. plant rest plant rest plant
0 22 29 36
29.92 1.33 0.6 0.37
< 0.04 < 0.04 < 0.04 < 0.04
30 1.4 0.64 0.41
– – 0.66 0.65
2008/ 1067444 L080149
Table 96 Results of residue trials conducted with cycloxydim on peas
Application Residues, mg/kg Country, year Variety No kg
ai/ha kg ai/hL
Portion analysed
DAT, days
Cy1 Cy2 Total cycloxydim
Cy- TSO
Study Trial No.
France, 2001 South
1 0.600 0.300 plant plant w/o pod a pods w. seed pods w/o seed rest of plant
0 35 35 56 56
15.33 0.79 0.69 0.21 1.49
< 0.04 0.08 0.75 0.05 0.3
15 0.87 1.4 0.26 1.8
– – – –
2003/ 1001251 FBD/17/01
France, 2001 North
1 0.600 0.300 plant plant w/o pod
0 35
14.16 3.02
< 0.04 0.07
14 3.1
– –
2003/ 1001252

Cycloxydim
344
Application Residues, mg/kg Country, year Variety No kg
ai/ha kg ai/hL
Portion analysed
DAT, days
Cy1 Cy2 Total cycloxydim
Cy- TSO
Study Trial No.
pods w. seed pods w/o seed rest of plant
35 57 57
0.53 0.55 2.87
1.2 0.39 0.65
1.7 0.94 3.5
– – –
FBD/13/02
France, 2005 South
Green pea Milan
1 0.500 0.250 plant b
rest plant b
rest plant b
rest plant b
0 29 35 41
15.60 1.20 0.58 0.31
< 0.04 1.10 0.85 0.69
16 2.3 1.4 1.0
– – – –
2006/ 1034132 05 H CL FR P13
France, 2005 North
Green pea Barley
1 0.500 0.250 plant b
rest plant b
rest plant b
rest plant b
0 27 34 42
13.60 2.3 1.5 0.99
< 0.04 0.16 0.10 0.36
14 2.5 1.6 1.4
– – – –
2006/ 1034132 05 H CL FR P14
France, 2006 North
Green pea Cepia
1 0.500 0.250 plant b
rest plant b
rest plant b
rest plant b
0 28 35 41
11.68 0.9 0.9 2.14
< 0.04 0.17 0.32 0.47
12 1.1 1.2 2.6
– – – –
2007/ 1020725 06FR/045R
Germany, 2006 Green pea Riger
1 0.500 0.250 plant b
rest plant b
rest plant b
rest plant b
0 28 35 41
15.81 0.71 0.56 0.53
< 0.04 0.09 0.07 0.1
16 0.80 0.63 0.63
– – – –
2007/ 1020725 06GE/046R
France, 2006 South
Green pea Frediro
1 0.500 0.250 plant b
rest plant b
rest plant b
rest plant b
0 28 35 42
11.07 1.11 0.93 0.44
< 0.04 < 0.04 < 0.04 < 0.04
11 1.1 0.97 0.48
– – – –
2007/ 1020725 06FR/043R
Greece, 2002 1 0.600 0.200 plant plant w/o pod pods w. seed pods w/o seed rest of plant
0 34 34 57 57
14.28 0.46 0.33 0.87 0.2
< 0.04 < 0.04 0.48 0.67 < 0.04
14 0.50 0.81 1.5 0.24
– – 0.55 – –
2003/ 1001263 02RF025/1
Greece, 2002 1 0.600 0.200 plant plant w/o pod pods w. seed pods w/o seed rest of plant
0 36 36 56 56
6.58 1.34 0.34 1.11 0.17
< 0.04 0.1 0.49 0.87 < 0.04
6.6 1.4 0.82 2.0 0.21
– – – – –
2003/ 1001263 02RF025/2
Greece, 2005 Green pea Ambassadeur
1 0.500 0.250 plant b
rest plant b
rest plant b
rest plant b
0 28 35 42
17.10 2.20 1.40 1.30
< 0.04 3.70 2.60 2.20
17 5.9 4.0 3.5
– – – –
2006/ 1034132 05RF042
Greece, 2006 Green pea Lotus
1 0.500 0.250 plant b
rest plant b
rest plant b
rest plant b
0 28 35 42
24.37 0.05 0.09 0.1
< 0.04 < 0.04 < 0.04 < 0.04
24 0.09 0.13 0.14
– – – –
2007/ 1020725 06GR/044R
Greece, 2001 1 0.600 0.300 plant plant w/o pod pods w. seed pods w/o seed rest of plant
0 35 35 57 57
17.44 0.47 0.44 1.05 0.12
< 0.04 < 0.04 < 0.04 0.96 < 0.04
17 0.51 0.48 2.0 0.16
– – – – –
2003/ 1001251 HEL/10/01
Italy, 2001 1 0.600 0.300 plant plant w/o pod pods w. seed pods w/o seed rest of plant
0 34 34 56 56
14.21 0.35 0.39 2.08 2.06
< 0.04 < 0.04 0.23 1.41 0.12
14 0.39 0.62 3.5 2.2
– – – – –
2003/ 1001251 ITA/36/01
Italy, 2002 1 0.600 0.300 plant plant w/o pod pods w. seed pods w/o seed rest of plant
0 35 35 56 56
14.77 0.47 0.3 0.47 2.03
< 0.04 < 0.04 0.45 0.25 0.06
15 0.51 0.75 0.72 2.1
– – – – –
2003/ 1001252 ITA/20/02
Italy, 2005 Green pea Atlas
1 0.500 0.250 plant b
plant b
pods rest plant b
rest plant b
rest plant b
0 28 35 35 42 49
17.30 0.14 0.23 0.22 0.20 0.27
< 0.04 < 0.04 < 0.04 < 0.04 0.14 0.18
17 0.18 0.27 0.26 0.34 0.45
– – – – – –
2006/ 1034132 0546R

Cycloxydim
345
Application Residues, mg/kg Country, year Variety No kg
ai/ha kg ai/hL
Portion analysed
DAT, days
Cy1 Cy2 Total cycloxydim
Cy- TSO
Study Trial No.
Italy, 2006 Green pea Budget
1 0.500 0.250 plant b
rest plant b
rest plant b
rest plant b
0 28 35 42
9.43 0.23 0.18 0.08
< 0.04 < 0.04 0.04 < 0.04
9.5 0.27 0.22 0.12
– – – –
2007/ 1020725 06IT/042R
Netherlands, 2005
Green pea Arabelle
1 0.50 0.250 plant b
rest plant b
rest plant b
rest plant b
0 28 35 42
27.50 0.35 0.15 0.06
< 0.04 0.57 0.38 0.14
28 0.92 0.53 0.20
– – – –
2006/ 1034132 AGR/51/05
Spain, 2006 Green pea Lincoln
1 0.50 0.250 plant b
rest plant b
rest plant b
rest plant b
0 28 34 42
20.47 1.32 3.66 3.91
< 0.04 0.29 0.34 1.55
20 1.6 4.0 5.5
– – – –
2007/ 1020725 06ES/041R
Spain, 2005 Green pea Jumbo
1 0.50 0.250 plant b
pod w. seed rest plant b
rest plant b
rest plant b
0 28 28 34 42
10.40 2.60 2.70 2.30 2.60
< 0.04 0.82 0.79 5.00 5.80
10 3.4 3.5 7.3 8.4
– – – – –
2006/ 1034132 05ES/081 R
Spain, 2001 1 0.60 0.300 plant plant w/o pod pods w. seed pods w/o seed rest of plant
0 35 35 56 56
8.91 3.55 2.82 1.28 1.5
< 0.04 0.44 4.83 0.92 0.28
9.0 4.0 7.6 2.2 1.8
– – – – –
2003/ 1001251 ALO/31/01
Spain, 2002 1 0.60 0.300 plant plant w/o pod pods w. seed pods w/o seed rest of plant
0 36 36 56 56
16.88 1.17 1.77 1.89 5.14
< 0.04 0.08 1.97 1.59 0.92
17 1.3 3.7 3.5 6.1
– – – – –
2003/ 1001252 ALO/20/02
Spain, 2002 1 0.60 0.300 plant plant w/o pod pods w. seed pods w/o seed rest of plant
0 34 34 55 55
11.38 6.63 1.63 3.44 8.18
< 0.04 0.69 4.04 0.62 0.78
11 7.3 5.7 4.1 9.0
– – – – –
2003/ 1001252 AYE/15/02
Sweden, 2005 Green pea S7
1 0.50 0.250 plant b
rest plant b
rest plant b
rest plant b
0 28 35 42
16.10 3.40 2.30 1.80
< 0.04 0.21 0.10 0.08
16 3.6 2.4 1.9
– – – –
2006/ 1034132 05HUS 1190505-01
United Kingdom, 2005
Green pea Onward
1 0.50 0.250 plant b
rest plant b
rest plant b
rest plant b
0 27 34 41
18.00 1.90 0.54 0.32
< 0.04 2.00 0.68 0.58
18 3.9 1.2 0.90
– – – –
2006/ 1034132 777/PEA1
United Kingdom, 2006
Green pea Legacy
1 0.50 0.250 plant b
rest plant b
rest plant b
rest plant b
0 28 35 42
12.05 1.5 2.27 0.29
< 0.04 0.09 0.15 0.09
12 1.6 2.4 0.38
– – – –
2007/ 1020725 06UK/048R
a Without pods b Without roots
Table 97 Results of residue trials conducted with cycloxydim on sugar beet tops
Application Residues, mg/kg
Country, year No kg ai/ha
kg ai/hL Portion analysed DAT, days
Cy1 Cy2 Total cycloxydim
Study Trial No.
Germany, 1986 1 0.500 0.125 Plants w/o root leaf leaf leaf leaf
0 25 55 87 126
17.8 < 0.05 < 0.05 < 0.05 < 0.05
< 0.04 < 0.04 < 0.04 < 0.04 < 0.04
18 < 0.09 < 0.09 < 0.09 < 0.09
2000/ 1013494 51701H86/ 26A
Germany, 1986 1 0.500 0.200 Plants w/o root leaf leaf
0 36 64
18 < 0.05 < 0.05
< 0.04 < 0.04 < 0.04
18. < 0.09 < 0.09
2000/ 1013494 51701H86/ 27A

Cycloxydim
346
Application Residues, mg/kg
Country, year No kg ai/ha
kg ai/hL Portion analysed DAT, days
Cy1 Cy2 Total cycloxydim
Study Trial No.
leaf leaf
107 132
< 0.05 < 0.05
< 0.04 < 0.04
< 0.09 < 0.09
Germany, 1986 1 0.500 0.152 Plants w/o root leaf leaf leaf leaf
1 24 51 84 132
7.46 0.12 < 0.05 < 0.05 < 0.05
< 0.04 < 0.04 < 0.04 < 0.04 < 0.04
7.5 0.16 < 0.09 < 0.09 < 0.09
2000/ 1013494 51701H86/ 28A
Germany, 1986 1 0.500 0.250 Plants w/o root leaf leaf leaf leaf
0 30 61 90 118
11.1 0.05 < 0.05 < 0.05 < 0.05
< 0.04 < 0.04 < 0.04 < 0.04 < 0.04
11 0.09 < 0.09 < 0.09 < 0.09
2000/ 1013494 51701H86/ 29A
Germany, 1986 1 0.500 0.125 Plants w/o root leaf leaf leaf leaf
0 35 64 107 129
13.6 < 0.05 < 0.05 < 0.05 < 0.05
< 0.04 < 0.04 < 0.04 < 0.04 < 0.04
14 < 0.09 < 0.09 < 0.09 < 0.09
2000/ 1013494 51701H86/ 30A
Germany, 1987 1 0.500 0.250 Plants w/o root leaf leaf leaf leaf
0 52 71 100 140
21.6 < 0.05 < 0.05 < 0.05 < 0.05
< 0.04 < 0.04 < 0.04 < 0.04 < 0.04
22 < 0.09 < 0.09 < 0.09 < 0.09
2000/ 1013494 51701H87/ 8A
Germany, 1987 1 0.500 0.125 Plants w/o root leaf leaf leaf leaf
0 42 72 112 142
14.8 < 0.05 < 0.05 < 0.05 < 0.05
< 0.04 < 0.04 < 0.04 < 0.04 < 0.04
15 < 0.09 < 0.09 < 0.09 < 0.09
2000/ 1013494 51701H87/ 10A
Germany, 1987 1 0.500 0.250 Plants w/o root leaf leaf leaf leaf
0 35 64 95 127
8.99 < 0.05 < 0.05 < 0.05 < 0.05
< 0.04 < 0.04 < 0.04 < 0.04 < 0.04
9.0 < 0.09 < 0.09 < 0.09 < 0.09
2000/ 1013494 51701H87/ 11A
Greece, 2001 1 0.593 0.200 Plants w/o root leaf w. top leaf w. top
0 55 97
7.53 :< 0.05 < 0.05
< 0.04 < 0.04 < 0.04
7.6 < 0.09 < 0.09
2003/ 1001264 01RF024/1
Greece, 2001 1 0.629 0.200 Plants w/o root leaf w. top leaf w. top
0 56 99
5.91 0.057 < 0.05
< 0.04 < 0.04 < 0.04
6.0 0.10 < 0.09
2003/ 1001264 01RF024/2
Italy, 1987 1 0.600 0.120 leaf 100 < 0.05 < 0.04 < 0.09 2000/ 1013494 51701H87/ 116E
Italy, 1987 1 0.600 0.150 leaf 84 < 0.05 < 0.04 < 0.09 2000/ 1013494 51701H87/ 118E
Italy, 2001 1 0.563 0.200 Plants w/o root leaf w. top leaf w. top
0 56 96
10.3 0.133 < 0.05
< 0.04 0.049 < 0.04
10 0.18 < 0.09
2003/ 1001264 132R
Italy, 2001 1 0.582 0.200 Plants w/o root leaf w. top leaf w. top
0 56 96
11.7 0.155 < 0.05
< 0.04 0.053 < 0.04
12 0.21 < 0.09
2003/ 1001264 133R
Netherlands, 1987
1 0.600 0.126 leaf 58 n.r. n.r. 0.50 2000/ 1013494 51701H86/ 26A
Netherlands, 1987
1 0.600 0.126 leaf 58 n.r. n.r. 0.33
2000/ 1013494 51701H86/ 26A

Cycloxydim
347
Table 98 Results of residue trials conducted with cycloxydim on maize fodder
Country, year
Application Portion analysed DAT, mg/kg
Residues, mg/kg Study Trial number No kg
ai/ha kg ai/hL
Cy1 Cy2 Total cycloxydim
Germany, 1995 1 0.400 0.133 Plants w/o roots Plants w/o roots cobs a rest pl. w/o roots straw
0 35 119 119 132
13.6 < 0.05 < 0.05 < 0.05 < 0.05
n.e. < 0.04 < 0.04 < 0.04 < 0.04
14 < 0.09 < 0.09 < 0.09 < 0.09
1997/10456 D07/03/95
Germany, 1995 1 0.400 0.133 Plants w/o roots Plants w/o roots cobs w. husk rest pl. w/o roots
0 22 83 83
8.74 0.20 < 0.05 0.074
n.e. < 0.04 < 0.04 < 0.04
8.7 0.24 < 0.09 0.11
1997/10456 D08/04/95
Germany, 1995 1 0.400 0.133 Plants w/o roots Plants w/o roots cobs w. husk rest pl. w/o roots cob wo/ husk straw
0 10 63 63 91 91
3.53 0.77 0.06 0.32 0.08 0.22
0.74 < 0.04 < 0.04 0.09 < 0.04 < 0.04
4.3 0.81 0.10 0.41 0.12 0.26
1997/10456 DU2/07/95
France, 1995 North
1 0.400 0.133 Plants w/o roots Plants w/o roots cobs w.husk rest pl. w/o roots
0 26 84 84
16.9 0.152 < 0.05 < 0.05
0.05 < 0.04 < 0.04 < 0.04
17 0.19 < 0.09 < 0.09
1997/10456 FR2/05/95
France, 1995 North
1 0.400 0.133 Plants w/o roots Plants w/o roots cobs w.husk rest pl. w/o roots straw
0 14 62 62 100
12.7 0.37 < 0.05 0.26 0.23
< 0.04 < 0.04 < 0.04 < 0.04 < 0.04
13 0.41 < 0.09 0.30 0.27
1997/10456 FR4/05/95
Germany, 1996 1 0.400 0.133 Plants w/o roots Plants w/o roots cobs w.husk rest pl. w/o roots cob w/o husk straw
0 48 104 104 135 135
12.0 < 0.05 < 0.05 < 0.05 < 0.05 < 0.05
< 0.04 < 0.04 < 0.04 < 0.04 < 0.04 < 0.04
12 < 0.09 < 0.09 < 0.09 < 0.09 < 0.09
1997/10518 D07/03/96
Germany, 1996 1 0.400 0.133 Plants w/o roots Plants w/o roots cobs rest pl. w/o roots
0 43 128 128
20.2 0.13 < 0.05 < 0.05
< 0.04 < 0.04 < 0.04 < 0.04
20 0.17 < 0.09 < 0.09
1997/10518 D08/02/96
France, 1996 North
1 0.400 0.133 Plants w/o roots Plants w/o roots cobs w. husk rest pl. w/o roots
0 31 106 106
13.9 < 0.05 < 0.05 < 0.05
< 0.04 < 0.04 < 0.04 < 0.04
14 < 0.09 < 0.09 < 0.09
1997/10518 FR2/02/96
France, 1996 North
1 0.400 0.133 Plants w/o roots Plants w/o roots cobs w/husk rest pl. w/o roots cob wo/ husk straw
0 21 98 98 122 122
19.0 0.26 < 0.05 < 0.05 < 0.05 < 0.05
< 0.04 < 0.04 < 0.04 < 0.04 < 0.04 < 0.04
19 0.30 < 0.09 < 0.09 < 0.09 < 0.09
1997/10518 FR4/02/96
Spain, 1995
1 0.400 0.133 Plants w/o roots Plants w/o roots cobs w. husk rest pl. w/o roots straw
0 24 51 51 85
7.10 0.153 < 0.05 0.085 1.05
< 0.04 < 0.04 < 0.04 < 0.04 0.06
7.1 0.19 < 0.09 0.13 1.1
1997/10456 AC/10/95
Spain, 1995 1 0.400 0.133 Plants w/o roots Plants w/o roots cobs w. husk rest pl. w/o roots straw
0 34 55 55 95
14.0 < 0.05 < 0.05 < 0.05 0.06
< 0.04 < 0.04 < 0.04 < 0.04 < 0.04
14 < 0.09 < 0.09 < 0.09 0.10
1997/10456 AC/11/95
France, 1995 North
1 0.400 0.133 Plants w/o roots Plants w/o roots cobs w/husk rest pl. w/o roots cob w/o husk straw
0 29 83 83 132 132
11.5 0.053 < 0.05 < 0.05 < 0.05 < 0.05
< 0.04 < 0.04 < 0.04 < 0.04 < 0.04 < 0.04
12 0.093 < 0.09 < 0.09 < 0.09 < 0.09
1997/10456 FR8/07/95
Italy, 1995 1 0.400 0.133 Plants w/o roots 0 16.0 0.06 16 1997/10417

Cycloxydim
348
Country, year
Application Portion analysed DAT, mg/kg
Residues, mg/kg Study Trial number No kg
ai/ha kg ai/hL
Cy1 Cy2 Total cycloxydim
Plants w/o roots 71 < 0.05 < 0.04 < 0.09 IT10-95-H368 Italy, 1995 1 0.400 0.133 Plants w/o roots
Plants w/o roots 0 70
18.6 < 0.05
< 0.04 < 0.04
19 < 0.09
1997/10417 IT10-95-H369
Spain, 1996 1 0.400 0.133 Plants w/o roots Plants w/o roots cobs w/husk rest pl. w/o roots cob w/o husk straw
0 22 50 50 98 98
16.2 0.057 < 0.05 0.085 < 0.05 0.22
< 0.04 < 0.04 < 0.04 < 0.04 < 0.04 0.072
16 0.06 < 0.09 0.12 < 0.09 0.29
1997/10518 AC/08/96
Spain, 1996 1 0.400 0.133 Plants w/o roots Plants w/o roots cobs w/husk rest pl. w/o roots cob w/o husk straw
0 21 48 48 96 96
16.9 0.72 < 0.05 0.089 < 0.05 0.074
< 0.04 < 0.04 < 0.04 < 0.04 < 0.04 < 0.04
17 0.76 < 0.09 0.13 < 0.09 0.11
1997/10518 AC/09/96
Italy, 1996 1 0.400 0.133 Plants w/o roots Plants w/o roots
0 85
18.9 < 0.05
0.10 < 0.04
19 < 0.09
1997/10403 IT10-96-R366
Italy, 1996 1 0.400 0.133 Plants w/o roots Plants w/o roots
0 91
10.6 < 0.05
< 0.04 < 0.04
11 < 0.09
1997/10403 IT10-96-R367
Table 99 Results of residue trials conducted with cycloxydim in rice straw Application Residues, mg/kg Country, year Variety No kg ai/ha kg ai/hL DAT,
days Cy1 Cy2 Total
cycloxydim Study Trial No.
Italy, 1996 Loto 1 0.400 0.100 137 < 0.05 < 0.04 < 0.09 1997/10302; IT10-96-H362
Italy, 1996 Loto 1 0.400 0.100 133 < 0.05 < 0.04 < 0.09 1997/10302; IT10-96-H363
Italy, 1996 Selenio 1 0.400 0.100 147 < 0.05 < 0.04 < 0.09 1997/10302; IT10-96-H364
Italy, 1996 Loto 1 0.400 0.100 145 < 0.05 < 0.04 < 0.09 1997/10302; IT10-96-H365
Italy, 1995 Loto 1 0.300 0.075 136 < 0.05 < 0.04 < 0.09 1997/10290; IT10-95-H364
Italy, 1995 Koral 1 0.300 0.075 147 < 0.05 < 0.04 < 0.09 1997/10290; IT10-95-H365
Italy, 1995 Baldo 1 0.300 0.075 142 < 0.05 < 0.04 < 0.09 1997/10290; IT10-95-H366
Italy, 1995 Cigalon 1 0.300 0.075 143 < 0.05 < 0.04 < 0.09 1997/10290; IT10-95-H367
Table 100 Results of residue trials conducted with cycloxydim in rape seed forage (Study 2000/ 1013493)
Country, year Variety Application DAT, days
Residues, mg/kg Study Trial No. No kg ai/ha kg ai/hL Cy1 Cy2 Total
cycloxydim Cy- TSO
Norway, 1989 Emerald 1 0.600 0.250 76 n.r. n.r. 0.25 – 51701H89/39E Norway, 1989 Emerald 1 0.600 0.250 76 n.r. n.r. 0.24 – 51722H89/1E Norway, 1989 Emerald 1 0.500 0.250 55 n.r. n.r. 0.26 – 51722H89/2E
Fates of residue in storage and processing
Hydrolysis
Cyclohexene-4,(6)-14C-cycloxydim was dissolved in aqueous buffer solutions of different pH-values (Goetz, 2000a). To simulate pasteurisation, the test solution at pH 4 was heated for 20 min at 90 °C in

Cycloxydim
349
a round-bottom flask under reflux. To simulate baking, brewing and boiling, the test solution at pH 5 was treated in a round-bottom flask under reflux at 100 °C for 60 min. Sterilisation was performed at pH 6 at about 120 °C in autoclave for 20 minutes. Aliquots were taken right before starting and at the end of a test and measured by LSC and HPLC. The overall radioactivity before and after each test performed is given in Table 101. Cycloxydim degraded mainly to cycloxydim-T2S (oxazol).
Table 101 Material balance before and after processing simulation tests with 14C-BAS 517 H, in % total applied radioactivity (TAR)
pH 4, 90 °C pH 5, 100 °C pH 6, 120 °C Compound before after before after before after cycloxydim 92.0 0.0 93.5 3.4 92.4 12.9 T2S 0.00 93.5 2.4 86.8 3.0 75.0 TSO 8.0 0.0 4.0 0.0 4.6 0.0 T2SO 0.0 6.4 0.0 4.7 0.0 11.0 Total recovery 99.9 94.9 99.0
Strawberries
Residue levels of cycloxydim were determined in strawberries after processing from field trials at 0.650 kg ai/ha in Germany (Harant, 2009a). Samples were collected 42 ± 1 days after application and processed into washed fruits, jam and canned fruit. Samples were analysed with Method No. 407/1, in which cycloxydim and all its metabolites are oxidised to and measured as cycloxydim-TGSO2 and/or cycloxydim-OH-TGSO2 and residues expressed as cycloxydim. The results are shown in Table 102.
Table 102 Cycloxydim total residues on strawberry process fractions and processing factors
Portion Analysed Cycloxydim total, (mg/kg) Processing factor Trial 1 2 3 4 1 2 3 4 Mean Strawberry fruit (RAC) 0.21 1.06 0.90 0.20 1 1 1 1 1 washed fruits 0.67 0.75 0.78 0.44 3.19 0.71 0.87 2.20 1.74 jam before cooking 0.50 0.46 0.55 0.16 2.38 0.43 0.61 0.80 1.06 jam after cooking 0.22 0.35 0.23 0.12 1.05 0.33 0.25 0.56 0.55 canned fruits 0.40 0.36 0.39 0.20 1.90 0.34 0.43 0.92 0.90 vegetable stock 0.20 0.22 0.40 0.11 0.95 0.21 0.44 0.54 0.54
Onion
Two field trials were conducted on onions in Italy and Greece at 0.6 L/ha and bulb samples taken after 56 days of application (Schulz, 2003a). After drying in the sun for 8 days, about 2.5 kg of the dried onions were peeled. Samples were analysed using Method 407/1. Residues in onion were 0.19 and 0.24 mg/kg, in dried onion were 0.22 and 0.33 mg/kg. Residues in peeled onions were 0.17 and 0.31 mg/kg, with processing factors of 0.88 and 1.32 (mean of 1.1).
Cabbage
Four field trials were conducted with cabbage in Germany and France when cycloxydim was applied once at a rate equivalent to 1.2 kg ai/ha and cabbage heads were collected 26 to 28 days thereafter (Reichert, 2006a). The samples were processed and the analysis for cycloxydim and its metabolites was carried out according to Method No. 407/1. The results are shown in Table 103.
Table 103 Cycloxydim total residues on raw and processed cabbage and its processing factors
Portion Analysed Cycloxydim total, (mg/kg) Processing factor Trial Total BH 517-TSO 1 2 3 4 Mean white cabbage head 0.87–2.63 0.95–2.93 1 1 1 1 1 outer leaves 0.71–2.22 not analysed 0.70 0.82 0.75 1.41 0.92 outer stalks 1.11–1.64 not analysed 1.43 1.28 0.49 1.04 1.06 inner leaves 0.60–2.71 not analysed 1.26 0.75 0.23 1.72 0.99

Cycloxydim
350
Portion Analysed Cycloxydim total, (mg/kg) Processing factor Trial Total BH 517-TSO 1 2 3 4 Mean inner stalks 0.72–2.72 not analysed 0.76 0.83 0.46 1.72 0.94 cooked white cabbage head 0.37–1.33 not analysed 0.70 0.43 0.27 0.84 0.56 non-past. juice of sauerkraut 0.88–2.02 not analysed 1.02 1.01 0.36 1.28 0.92 pasteurised sauerkraut 0.70–1.51 not analysed 1.05 0.80 0.30 0.96 0.78 pasteurised juice of sauerkraut 0.78–1.59 not analysed 0.99 0.99 0.30 1.01 0.82
Tomatoes
Cycloxydim was foliar-applied once to tomato plants in Germany at 0.65 kg ai/ha (Harant, 2009b). Tomatoes were harvested on 35 ± 1 days after application, processed and the tomato specimens and their processed products analysed using Method No. 407/1. The results are shown in Table 104.
Table 104 Cycloxydim total residues on raw and processed tomato and processing factors
Portion Analysed Cycloxydim total, (mg/kg) Processing factor Trial 1 2 3 4 1 2 3 4 Mean fruit (RAC) 0.58 0.60 0.55 1.17 1 1 1 1 1 washed tomatoes 0.50 0.76 0.81 1.63 0.86 1.27 1.47 1.39 1.25 blanched tomatoes 0.53 0.59 0.93 0.96 0.91 0.98 1.69 0.82 1.10 peel 0.79 1.38 1.18 1.38 1.36 2.30 2.15 1.18 1.75 peeled tomatoes 0.74 0.69 0.88 1.11 1.28 1.15 1.60 0.95 1.25 canned tomatoes 0.17 0.40 0.40 0.69 0.29 0.67 0.73 0.59 0.57 raw mash 0.53 0.73 0.85 1.44 0.91 1.22 1.55 1.23 1.23 heated mash 0.34 0.50 0.41 0.77 0.59 0.83 0.75 0.66 0.71 wet pomace 0.70 1.14 0.70 1.34 1.21 1.90 1.27 1.15 1.38 raw juice 0.48 0.77 0.71 1.19 0.83 1.28 1.29 1.02 1.11 pasteurised juice 0.44 0.83 0.61 1.04 0.76 1.38 1.11 0.89 1.04 raw ketchup after concentration 0.65 0.96 1.06 2.12 1.12 1.60 1.93 1.81 1.62 raw ketchup after seasoning 0.58 1.10 1.46 2.00 1.00 1.83 2.65 1.71 1.80 ketchup after pasteurisation 0.62 0.65 1.53 1.59 1.07 1.08 2.78 1.36 1.57 puree after concentration 2.11 2.01 1.97 2.99 3.64 3.35 3.58 2.56 3.28 puree after pasteurisation 2.02 2.27 2.38 3.82 3.48 3.78 4.33 3.26 3.71
Lettuce
In four field trials conducted with lettuce in Denmark and Sweden at 1× 0.5 kg ai/ha, samples harvested at 14 days after treatment were processed and analysed by Method No. 407/1 (Schulz, 2005a). The samples were analysed for cycloxydim and cycloxydim-OH-TSO2 with. The results are shown in Table 105.
Table 105 Cycloxydim total residues on raw and processed lettuce and its processing factors
Portion Analysed Cycloxydim total, (mg/kg) Processing factor Trial 1 2 3 4 1 2 3 4 Mean heads 0.28 0.69 0.65 0.18 1 1 1 1 1 outer leaves 0.56 1.35 1.61 0.40 2.0 1.9 2.5 2.2 2.2 inner leaves 0.28 0.30 0.44 0.24 1.0 0.4 0.7 1.3 0.9 washed outer leaves 0.36 1.33 1.13 0.30 1.3 1.9 1.7 1.6 1.6 washed inner leaves 0.15 0.30 0.36 0.20 0.5 0.4 0.6 1.1 0.7
Peas
Four field trials were conducted in Great Britain with cycloxydim on peas at 0.450 kg ai/ha (Beck et al., 2000a). The mature seed samples were harvested approximately 56 days after treatment and further processed. All samples were analysed with Method No. 263. Four trials were conducted in Germany and Southern France at 1.2 kg ai/ha and green seeds without pods were collected 34 to 36 days thereafter (Reichert, 2003a). For the processing, green peas were first cleaned and sorted out and
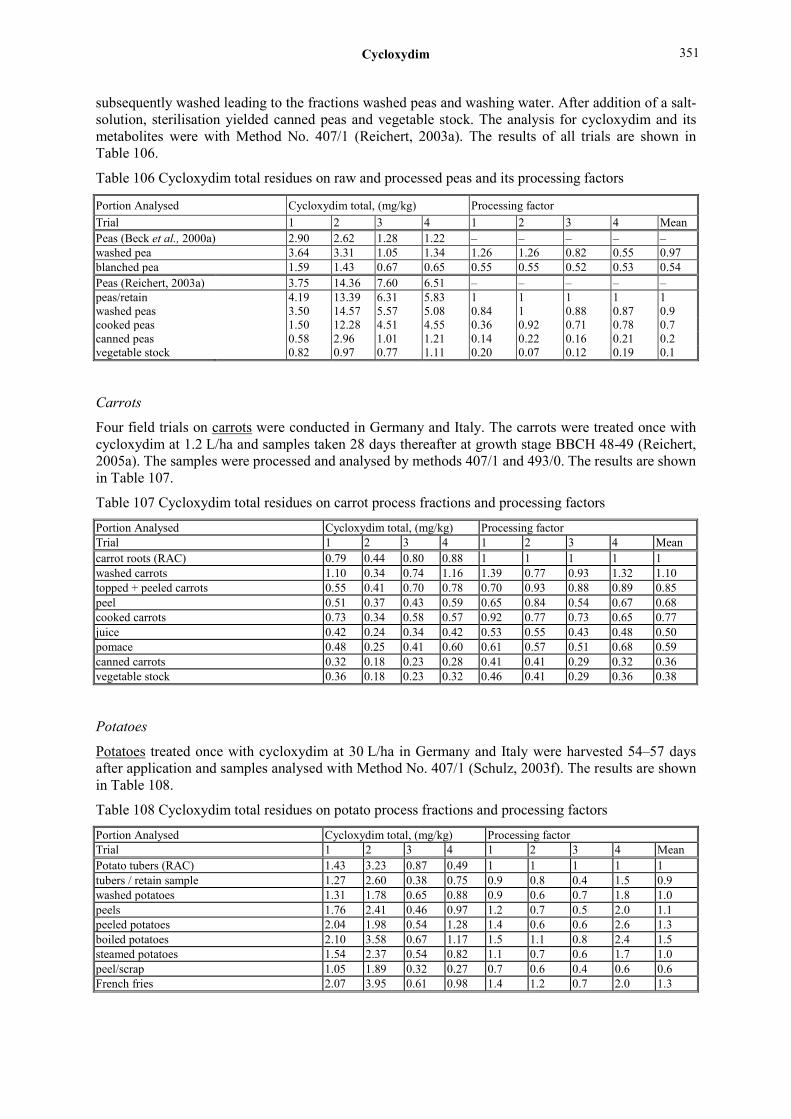
Cycloxydim
351
subsequently washed leading to the fractions washed peas and washing water. After addition of a salt-solution, sterilisation yielded canned peas and vegetable stock. The analysis for cycloxydim and its metabolites were with Method No. 407/1 (Reichert, 2003a). The results of all trials are shown in Table 106.
Table 106 Cycloxydim total residues on raw and processed peas and its processing factors
Portion Analysed Cycloxydim total, (mg/kg) Processing factor Trial 1 2 3 4 1 2 3 4 Mean Peas (Beck et al., 2000a) 2.90 2.62 1.28 1.22 – – – – – washed pea 3.64 3.31 1.05 1.34 1.26 1.26 0.82 0.55 0.97 blanched pea 1.59 1.43 0.67 0.65 0.55 0.55 0.52 0.53 0.54 Peas (Reichert, 2003a) 3.75 14.36 7.60 6.51 – – – – – peas/retain 4.19 13.39 6.31 5.83 1 1 1 1 1 washed peas 3.50 14.57 5.57 5.08 0.84 1 0.88 0.87 0.9 cooked peas 1.50 12.28 4.51 4.55 0.36 0.92 0.71 0.78 0.7 canned peas 0.58 2.96 1.01 1.21 0.14 0.22 0.16 0.21 0.2 vegetable stock 0.82 0.97 0.77 1.11 0.20 0.07 0.12 0.19 0.1
Carrots
Four field trials on carrots were conducted in Germany and Italy. The carrots were treated once with cycloxydim at 1.2 L/ha and samples taken 28 days thereafter at growth stage BBCH 48-49 (Reichert, 2005a). The samples were processed and analysed by methods 407/1 and 493/0. The results are shown in Table 107.
Table 107 Cycloxydim total residues on carrot process fractions and processing factors
Portion Analysed Cycloxydim total, (mg/kg) Processing factor Trial 1 2 3 4 1 2 3 4 Mean carrot roots (RAC) 0.79 0.44 0.80 0.88 1 1 1 1 1 washed carrots 1.10 0.34 0.74 1.16 1.39 0.77 0.93 1.32 1.10 topped + peeled carrots 0.55 0.41 0.70 0.78 0.70 0.93 0.88 0.89 0.85 peel 0.51 0.37 0.43 0.59 0.65 0.84 0.54 0.67 0.68 cooked carrots 0.73 0.34 0.58 0.57 0.92 0.77 0.73 0.65 0.77 juice 0.42 0.24 0.34 0.42 0.53 0.55 0.43 0.48 0.50 pomace 0.48 0.25 0.41 0.60 0.61 0.57 0.51 0.68 0.59 canned carrots 0.32 0.18 0.23 0.28 0.41 0.41 0.29 0.32 0.36 vegetable stock 0.36 0.18 0.23 0.32 0.46 0.41 0.29 0.36 0.38
Potatoes
Potatoes treated once with cycloxydim at 30 L/ha in Germany and Italy were harvested 54–57 days after application and samples analysed with Method No. 407/1 (Schulz, 2003f). The results are shown in Table 108.
Table 108 Cycloxydim total residues on potato process fractions and processing factors
Portion Analysed Cycloxydim total, (mg/kg) Processing factor Trial 1 2 3 4 1 2 3 4 Mean Potato tubers (RAC) 1.43 3.23 0.87 0.49 1 1 1 1 1 tubers / retain sample 1.27 2.60 0.38 0.75 0.9 0.8 0.4 1.5 0.9 washed potatoes 1.31 1.78 0.65 0.88 0.9 0.6 0.7 1.8 1.0 peels 1.76 2.41 0.46 0.97 1.2 0.7 0.5 2.0 1.1 peeled potatoes 2.04 1.98 0.54 1.28 1.4 0.6 0.6 2.6 1.3 boiled potatoes 2.10 3.58 0.67 1.17 1.5 1.1 0.8 2.4 1.5 steamed potatoes 1.54 2.37 0.54 0.82 1.1 0.7 0.6 1.7 1.0 peel/scrap 1.05 1.89 0.32 0.27 0.7 0.6 0.4 0.6 0.6 French fries 2.07 3.95 0.61 0.98 1.4 1.2 0.7 2.0 1.3

Cycloxydim
352
Rape seed
Rape seed was treated at rates of 0.450 to 0.90 kg ai/ha at four different locations in the UK and seed samples taken 89–98 days after application were further processed into oil and meal (press cake) simulating commercial processing (Steggles, 1992a). All samples were analysed with Method No. 263. In four trials conducted in Germany and Spain, cycloxydim was applied once with a 1.2 kg ai/ha, and seeds collected 79 to 116 days thereafter were processed into oil and meal. The analysis for cycloxydim and its metabolites was carried out according to Method No. 407/1 (Schulz, 2003g). The results of all trials are shown in Table 109.
Table 109 Cycloxydim total residues on raw and processed oilseed rape and its processing factors
Portion Analysed Cycloxydim total, (mg/kg) Processing factor Trial 1 2 3 4 1 2 3 4 Mean whole plant w/o root (Steggles, 1992a) 2.13 3.37 oil 0.54 0.33 0.25 0.10 0.18 meal 3.67 3.51 1.72 1.04 1.38 rape seed (RAC) (Schulz, 2003g) 1.74 1.05 2.91 3.87 rape seed/retain sample 1.35 1.02 1.89 3.84 0.8 1.0 0.6 1.0 0.9 press cake 1.99 1.30 2.08 5.80 1.1 1.2 0.7 1.5 1.1 oil meal 2.07 2.18 4.63 7.53 1.2 2.1 1.6 1.9 1.7 crude oil 0.25 0.17 0.28 0.41 0.1 0.2 0.1 0.1 0.1 filter cake 0.09 < 0.09 < 0.09 0.12 0.05 < 0.09 < 0.03 0.03 0.05 fatty acids < 0.09 < 0.09 < 0.09 < 0.09 < 0.05 < 0.09 < 0.03 < 0.02 < 0.05 refined rape oil < 0.09 < 0.09 < 0.09 < 0.09 < 0.05 < 0.09 < 0.03 < 0.02 < 0.05
Sunflower
Two trials were carried out with cycloxydim on sunflowers in Italy at 0.30 or 0.6 kg ai/ha, and seed samples taken at 99 or 84 DALA, respectively, were processed to oil (Schulz, 1995a). All samples were analysed with Method No. 263. The results are shown in Table 110.
Table 110 Cycloxydim total residues in raw and processed oilseed rape and its processing factors
Portion Analysed Cycloxydim total, (mg/kg) Processing factor Trial a 1 2 1 2 Mean seed 300 g ai/ha < 0.9 < 0.9 n.a. 1 1 seed 600 g ai/ha < 0.9 0.9 n.a. 1 1 oil 300 g ai/ha < 0.09 0.09 n.a. 0.1 0.1 oil 600 g ai/ha < 0.09 < 0.09 n.a. < 0.1 < 0.1 expeller cake 300 g ai/ha 0.12 b– 0.67 n.a. 0.74 0.74 expeller cake 600 g ai/ha 0.11 b– 1.26 n.a. 1.4 1.4 a Trial 1: IT 10-93-H 363, Trial 2: IT 10-93-H 364 b Not exactly evaluable because of a disturbing peak. The chromatograms of the fortified samples showed that the residue concentrations must be close to LOQ.
Livestock feeding studies
Poultry
In a laying hen feeding study, cycloxydim and cycloxydim-OH-TSO at a ratio of 1:1 was administered orally to groups of three cages of four Leghorn hens by gelatine capsule for 28 days (Hopf et al., 2011a). The nominal daily doses per animal were 0.15 mg, 0.45 mg, and 15 mg, corresponding to 2.29 mg/kg, 6.71 mg/kg and 23.2 mg/kg feed for the 1×, 3× and 10× dose level, respectively. Eggs were collected twice daily and pooled on a daily basis per cage for 28 days. Hens were scarified 23 hours after the last dose, liver, kidney, muscle and fat collected and samples of all animals from one cage were pooled. Samples were analysed using method L0105/01 in which non-hydroxylated metabolites and hydroxylated metabolites were oxidized to cycloxydim-TGSO2 and cycloxydim-5-OH-TGSO2, with H2O2 under alkaline conditions in animal matrices. The final

Cycloxydim
353
determinations of the two acids were performed by HPLC-MS/MS. Mean results of each treatment group are summarized in Table 111 for eggs.
Table 111 Group mean residues in eggs (sum of non-hydroxylated and hydroxylated metabolites; expressed as parent equivalents)
Group Mean (and Maximum Individual), mg/kg Day of Study Group 1 (Control) Group 2 (1×) Group 3 (3×) Group 4 (10×) 0 n.a. n.a. < 0.02 0.023 (0.035) 2 n.a. n.a. < 0.02 (0.021) 0.077 (0.102) 4 n.a. n.a. 0.021 (0.024) 0.076 (0.100) 6 n.a. < 0.02 0.021 (0.024) 0.069 (0.093) 9 n.a. n.a. < 0.02 0.071 (0.081) 13 < 0.02 < 0.02 0.021 (0.022) 0.069 (0.082) 20 n.a. n.a. 0.024 (0.032) 0.063 (0.098) 23 n.a. n.a. 0.033 (0.058) 0.061 (0.068) 27 < 0.02 < 0.02 0.021 (0.023) 0.076 (0.090) 28 (1 DOW) – – – 0.031 a (0.041) 29 (2 DOW) – – – < 0.02 a 30 (3 DOW) – – – < 0.02 b 31 (4 DOW) – – – < 0.02 b 33 (5 DOW) – – – < 0.02 b a Results for cages 13 and 14 b Individual results cage 14; DOW: day of withdrawal (depuration)
Residues were not detected in muscle and fat at any dose group. In liver, residues were
detected only at 10× dose group (Table 112).
Table 112 Group mean residues in tissues (sum of non-hydroxylated and hydroxylated metabolites; expressed as parent equivalents)
Group Mean (and Maximum Individual) [mg/kg] Treatment Group Muscle Fat Liver 1 (Control) < 0.02 < 0.02 < 0.02 2 (1×) < 0.02 < 0.02 < 0.02 3 (3×) < 0.02 < 0.02 < 0.02 4 (10×) < 0.02 < 0.02 0.022 (0.030) 10×, 3 days of withdrawal < 0.02 < 0.02 < 0.02 10×, 7 days of withdrawal) < 0.02 < 0.02 < 0.02
In order to determine the magnitude of the residues in chicken tissues and eggs following dietary exposure to cycloxydim and cycloxydim-5-OH-TSO (1:1 ratio), a feeding study was conducted on 56 laying hens in 14 cages with four animals (Grosshans & Kampke-Thiel, 2003a). For 28 days, laying hens were administered the mixture at a target dose level of 2.5, 7.5 and 25 ppm. Eggs from each cage were collected twice daily and combined as one pooled sample. Animals were sacrificed within 23 hours after the final morning dose and tissue samples were taken, except for hens in two cages of the 10× group, which were sacrificed three and seven days after the final morning dose to determine residue decline. Analysis of the samples was carried out according to Method No. 513/0. The results are shown in Table 113.
Table 113 Summary of residues in eggs and tissues
Treatment Group Group Mean (Maximum Individual), sum of cycloxydim-TSO, cycloxydim-5-OH-TS and cycloxydim-5-OH-TSO Muscle Liver Fat Eggs (days 2 to 27)
Control < 0.03 (< 0.03) < 0.03 (< 0.03) < 0.03 (< 0.03) < 0.03 (< 0.03) 1× < 0.03 (< 0.03) < 0.03 (< 0.03) < 0.03 (< 0.03) < 0.03 (< 0.03) 3× < 0.03 (< 0.03) < 0.03 (< 0.03) < 0.03 (< 0.03) < 0.03 (0.041) 10× < 0.03 (< 0.03) < 0.03 (< 0.03) < 0.03 (< 0.03) 0.046 (0.069) 10×, 3 days withdrawal < 0.03 < 0.03 < 0.03 < 0.03 10×, 7 days withdrawal < 0.03 < 0.03 < 0.03 < 0.03

Cycloxydim
354
Cattle
In a dairy cattle feeding study, cycloxydim and cycloxydim-5-OH-TSO at a ratio of 2:1 was administered orally to groups of three Holstein cattle by gelatine capsule (with one control group of three, fed capsules only) for 28 days (Grosshans, 2009a). The actual dose levels were 5.1 mg/kg, 15.2 mg/kg and 50.2 mg/kg feed for the 1×, 3× and 10× dose level, respectively. Milk was collected in the morning and afternoon and pooled on a daily basis for 28 days. Animals were sacrificed 22–24 hours after the last dose. In milk, a plateau was rapidly reached and residues in milk and tissues were eliminated from the animals in less than one week (Table 114). Residues were detected in muscle only at the 3× dose level (Table 115).
Table 114 Group mean residues in milk generated (sum of non-hydroxylated and hydroxylated metabolites; expressed as parent equivalents)
Group Mean (and Maximum Individual), mg/kg Day of Study Group A (control) Group B 1× Group C 3× Group D 10× 1 < 0.019 < 0.019 < 0.019 0.035 (0.054) 5 n.a. n.a. < 0.019 0.042 (0.064) 10 n.a. n.a. < 0.019 0.042 (0.064) 14 < 0.019 < 0.019 n.a. n.a. 17 n.a. n.a. n.a. 0.044 (0.061) 21 n.a. n.a. < 0.019 0.054 (0.080) 24 n.a. n.a. n.a. 0.046 (0.068) 28 < 0.019 < 0.019 < 0.019 0.038 (0.057) 2 DOW – – – < 0.019 a 4 DOW – – – < 0.019 b 6 DOW – – – < 0.019 b 7 DOW – – – < 0.019 b Skim Milk (21 d) < 0.019 < 0.019 < 0.019 0.044 (0.057) Cream (21 d) < 0.019 < 0.019 < 0.019 0.033 (0.043)
n.a. = Not analysed a Results cow 13 b results cow 14 DOW: Day of withdrawal (depuration)
Table 115 Group mean residues in tissues (Sum of non-hydroxylated and hydroxylated metabolites; expressed as parent equivalents)
Treatment Group Group Mean (and Maximum Individual), mg/kg Muscle Liver Kidney Fat
A (control) < 0.019 (< 0.019) < 0.019 (< 0.019) < 0.019 (< 0.019) < 0.019 (< 0.019) B (1× dose level) < 0.019 (< 0.019) 0.043 (0.045) 0.068 (0.073) < 0.019 (< 0.019) C (3× dose level) 0.023 (0.026) 0.128 (0.151) 0.202 (0.239) 0.025 (0.030) D (10× dose level) 0.073 (0.088) 0.336 (0.381) 0.593 (0.727) 0.119 (0.138) D 2 days withdrawal < 0.019 0.079 0.057 0.020 D 7 days withdrawal < 0.019 < 0.019 < 0.019 < 0.019
In another study, 14 lactating dairy cows were administered a 2:1 ratio of cycloxydim and cycloxydim-5-OH-TSO for 28 days at a target dose level of 5.0 mg/kg (1×), 15.0 mg/kg (3×) and 50 mg/kg (10×) (Seiferlein & Kampke-Thiel, 2003a). Milk samples from each animal were collected twice daily for 28 days and combined as one pooled sample. On Day 21, milk was also separated into cream and skim milk. Animals were sacrificed within 23 hours after the final morning dose and tissue samples were taken, except for two cows of the 10× group, which were sacrificed two and seven days after the final morning dose to determine residue decline. Analysis of the samples was carried out according to Method No. 513/0. The results are shown in Table 116.

Cycloxydim
355
Table 116 Summary of residues in milk and tissues
Treatment Group Muscle Liver Kidney Fat
Milk (days 3 to 28)
Skim Milk Cream
1 (control) < 0.03 (< 0.03)
< 0.03 (< 0.03)
< 0.03 (< 0.03) < 0.03 (< 0.03) < 0.009 < 0.009 < 0.009
2 (1×) < 0.03 (< 0.03) 0.03 (0.04) 0.05 (0.06) < 0.03 (< 0.03) < 0.009 < 0.009 < 0.009
3 (3×) < 0.03 (< 0.03) 0.12 (0.15) 0.14 (0.18) < 0.03 (< 0.03) < 0.009 < 0.009 < 0.009
4 (10×) 0.06 (0.07) 0.29 (0.31) 0.44 (0.51) 0.10 (0.12) 0.020 0.020 0.016 4 (10×, 2 days withdrawal)
< 0.03 0.06 0.05 < 0.03 < 0.009 – –
4 (10×, 7 days withdrawal)
< 0.03 < 0.03 < 0.03 < 0.03 < 0.009 – –
APPRAISAL
Cycloxydim is a post-emergence cyclohexene oxime herbicide that inhibits the acetylcoenzyme A carboxylase (ACCase) in chloroplasts of sensitive weeds. Cycloxydim was firstly evaluated by JMPR in 1992 (T, R). In 2009, an ADI of 0–0.07 mg/kg bw and an ARfD of 2 mg/kg bw for women of childbearing age were established; an ARfD was unnecessary for the general population. Cycloxydim was scheduled at the 43rd session of the CCPR (2011) for the periodic re-evaluation of residues by the 2012 JMPR.
Data on physical and chemical properties, metabolism in plants and livestock animals, environmental fate and analytical methods, animal feeding studies and processing studies were submitted. Residue supervised trials were submitted on pome fruits, stone fruits, grapes, strawberries, potatoes, carrots, celeriac, onions, tomatoes, peppers, cauliflower, Brussels sprouts, head cabbage, curly kale, lettuce, spinach, green beans and peas, leek, sugar beet roots, sugar beet tops, dry beans and peas, oilseed rape, sunflower, soya bean, rice and maize.
Metabolism studies
Cycloxydim is a racemic mixture. In the [14C]labelled cycloxydim stored in toluene, the compound is almost exclusively present as E-isomer, but E/Z isomerisation in the ethoxyimino group may occurs on in plants and in solution depending on solvent polarity, temperature and pH. In all metabolism studies, residues were reported as the sum of the two isomers.
The positions of the radiolabel compounds used in the metabolism studies and the structures of the main metabolites found in animals and plants are shown next.
S
O
O
NOH
S
O
O
NOH
S
O
O
NOH
E-Isomer Hypothetical transition state Z-Isomer

Cycloxydim
356
Name Structure Name Structure 14C-
Cycloxydim
Cycloxydim-
5-OH-TS
14C-Cycloxydim-
TSO
14C-Cycloxydim-5-OH-TSO
Cycloxydim-
TSO2
Cycloxydim-
5-OH-TSO2
Cycloxydim-
T1S
Cycloxydim-
5-OH-T1SO
Cycloxydim-
T1SO
Cycloxydim-
6-OH-T2SO
Cycloxydim-
T1SO2
Cycloxydim-
6-OH-T2SO2
Cycloxydim-
T2S
Cycloxydim-
TGSO
S
O
N
OH
O*
(*)
NO
OHOH
S
O
NO
OH
S
O
O
OH
(*)
*
NO
OH
O
SO O
NO
OHOH
SO
O
O
O
OH
NH
S
S
O
OH
O
NH
OH
S
O
OH
O
NH N
O
O
SO
OH
S
O
OH
O O
NH N
O
O
SO
OH
O
N
O
O
S
S
OH
O
OHO
O

Cycloxydim
357
Name Structure Name Structure
Cycloxydim-
T2SO
Cycloxydim-
TGSO2
Cycloxydim-
T2SO2
Animal metabolism
Rats
Metabolism studies conducted in rats were evaluated by the JMPR 2009. The studies were conducted after oral administration of the vinylogus acid [14C]cycloxydim-TS and its sodium salt and after intravenous administration of the sodium salt, at a nominal dose of 10 mg/kg bw (no-effect level) or 300 mg/kg bw (toxic effect level). The major metabolite found in urine was cycloxydim-TSO, followed by cycloxydim-T1SO and cycloxydim-TSO. In addition to unchanged parent, other metabolites were cycloxydim-T1SO2, cycloxydim-T2SO, and the metabolite hydroxylated at the 5-position of the cyclohexene ring of the parent. Patterns of metabolites in the bile were similar after the administration of either the free acid or the sodium salt of cycloxydim.
Lactating goats
[14C]cycloxydim was administrated for 7 days to goats at 15 ppm feed. About 85% of the dose was recovered at the end of the experiment, mainly in urine (72%) and faeces (12%), and 0.09% in milk. Radioactivity in milk was constant during the 7 days dosing period (mean of 0.023 mg/kg). Total radioactive residue (TRR) was 0.005–0.006 mg/kg eq. in fat and muscle, and fat to 0.062–0.076 mg/kg eq. in liver and kidney, respectively. Non-extracted residues accounted for up to 64.1%TRR in liver, most of it solubilised by pronase. The major metabolite identified in milk was cycloxydim-T1SO (16%TRR). Cycloxydim-TSO represented 15%TRR in milk, 8%TRR in liver and 12%TRR in kidney. Parent compound was only detected in liver (10.8%TRR, 0.008 mg/kg). Minor metabolites found are cycloxydim-T1S, cycloxydim-TSO2 in liver (up to 2%TRR, 0.001 mg/kg) and cycloxydim-T2SO2 in milk (up to 2%TRR, < 0.001 to < 0.001 mg/kg).
A lactating goat was dosed with [14C]cycloxydim-TSO at 100 ppm feed for five days. At sacrifice, 89.1% of the administered dose was recovered, mostly in urine (78%) and faeces (10%). TRR in milk accounted for 0.11% of the dose (0.09–0.12 mg/kg). Liver and kidney had the highest residues, 0.46, 0.52 and, 0.52 mg/kg eq., respectively. Concentrations in fat and muscle were 0.04 mg/kg, and were not further identified. Cycloxydim-TSO and cyclodixim-T1SO were the major components in milk (about 23%TRR, 0.06 mg/kg and the only residues identified in liver (22%TRR, 0.10 mg/kg; and 10%TRR, 0.05 mg/kg, respectively). Cycloxydim-T2SO cycloxydim-T1SO2 (5%TRR, 0.01 mg/kg) and cycloxydim-TSO2 (2.7%TRR, < 0.01 mg/kg) were also found in milk. Residues in kidney were not characterized.
The [14C]cycloxydim-5-OH-TSO was administrated to goats at a dose level of 12 ppm feed on nine consecutive days. In average, 97% of the administered dose was recovered in the experiment, of which 75% was in urine and 15.7% in faeces. TRR was about 0.02 mg/kg eq. in milk, 0.024 in fat and 0.025 in muscle, 0.203 in liver and 0.26 mg/kg eq. in kidney. Non-extracted residues accounted for up
N
O
O
S
O
S
OH
O
OHOO O
N
O
O
SO O

Cycloxydim
358
to 10.2% TRR in muscle. Cycloxydim-5-OH-TSO was the main residue in milk, muscle, kidney and fat (31 to 38%TRR; 0.007 to 0.10 mg/kg). In liver, the main residue was cycloxydim-5-OH-TS (17.4%TRR, 0.03 mg/kg), followed by cycloxydim-5-OH-TSO (11%TRR, 0.02 mg/kg). Cycloxydim-5-OH-TS was also a significant residue in kidney (25%TRR, 0.06 mg/kg) and fat (11%TRR, 0.003 mg/kg). Cycloxydim-6-OH-T2SO residues reached 13%TRR in muscle and cycloxydim-5-OH-T1SO represented < 10%TRR in all matrices.
Laying hens
The metabolism and distribution of [14C]cycloxydim was investigated in laying hens following oral administration at 12 ppm feed for 10 days. About 80% of the administered dose was recovered at the end of the experiment, mostly in the excreta (78.0%), 0.33% in eggs. 0.11 % in muscle, 0.07 % in liver and 0.02% in fat. TRR in eggs ranged from 0.05 mg/kg eq. at day 1 to 0.14 mg/kg at day 10 (mean of 0.12 mg/kg eq.), starting to plateau at day 8. In tissues, TRR was 0.051–0.053 mg/kg eq. in fat and muscle and 0.28 mg/kg eq. in liver. Unextracted residues in muscle accounted for 4.5% TRR. Residues in eggs were mostly cycloxydim-TSO (0.04 mg/kg eq., 30.9%TRR), followed by cycloxydim-TSO2 (0.008 mg/kg eq., 6.4%TRR) and the parent compound (0.004 mg/kg eq., 3.4%TRR). In muscle, only cycloxydim-TSO2 was detected (0.001 mg/kg eq., 0.9%TRR) and in fat only cycloxydim-TSO (0.008 mg/kg, 18%TRR). In liver, the main residue detected was also cycloxydim-TSO (0.02 mg/kg eq., 7.4%TRR), followed by cycloxydim (0.005 mg/kg eq., 1.7%TRR) and cycloxydim-TSO2 (0.002 mg/kg eq., 0.6%TRR).
The [14C]cycloxydim-TSO was administered to laying hens at a dose level of 50 ppm feed for 7 days. Treated animals were sacrificed 6 (group 2), 24 (group 3) and 48 hours (group 4) after the last dose. About 94% of the administered dose was recovered in group 4, mostly (92.3%) in the excreta, and 0.08% in eggs. In this group, TRR in eggs increased rapidly to an apparent plateau of 0.08–0.10 mg/kg after day 2. TRR from group 2 ranged from 0.10 mg/kg eq. in muscle to 0.99 mg/kg eq. in kidney, and were < 0.1 mg/kg in all tissues from group 4. Residues were only identified in eggs and liver. In eggs, cycloxydim-TSO (0.12 mg/kg, 41.4%TRR) was the major residue, followed by cycloxydim-TSO2 (0.03 mg/kg, 8.8 %TRR) and cycloxydim-T2SO (0.02 mg/kg, 5.5%TRR). In liver, cycloxydim-TSO was the major residue (0.19 mg/kg, 33%TRR), followed by cycloxydim-T2SO (0.14 mg/kg, 24%TRR) and cycloxydim-T1SO (0.10 mg/kg, 17%TRR).
The [14C]cycloxydim-5-OH-TSO was administered to hens at a dose of 12 ppm feed for 11 days. The radioactivity was rapidly excreted within 24 hours after the last dose, with 93% of the applied dose recovered, mainly on excreta (89.7%). In eggs, mean residues were 0.066 mg/kg eq. (0.21% of the applied dose). In tissues, the highest radioactivity was found in liver (0.11 mg/kg eq.), followed by muscle (0.028 mg/kg eq.), and fat (0.02 mg/kg eq.). Non-extracted residues ranged from 24.1%TRR in fat to 38% TRR in muscle, with over 80% being released by protease. Cycloxydim-5-OH-TSO accounted for 15% TRR in eggs (0.01 mg/kg) to 29%TRR in fat (0.005 mg/kg). Cycloxydim-5-OH-TS accounted for about 19–22%TRR in muscle, fat and liver (0.004–0.021 mg/kg) and 50.7%TRR in eggs (0.034 mg/kg).
In summary, studies conducted with cycloxydim or its metabolites cycloxydim-TSO and cycloxydim-5-OH-TSO showed that the primary metabolic pathway of cycloxydim in animals involves two main routes: 1) oxidation to cycloxydim-TSO and subsequently to cycloxydim-TSO2, and 2) Beckmann re-arrangement with subsequent ring closure to form the oxazol cycloxydim-T2S, which can be oxidized further to cycloxydim-T2SO and cycloxydim-T2SO2. Cycloxydim was a minor component in eggs and tissues from dosed hens and was only detected in goat liver (11%TRR).
Plant metabolism
Soya beans, cotton and sugar beet
The metabolism of [14C]cycloxydim was studied in soya beans, cotton and sugar beet using two different treatments. To evaluate root uptake, the plants were cultivated in a nutrient solution containing 5 mg/L [14C]cycloxydim. To evaluate the uptake by the leaf, 10 µg [14C]cycloxydim was

Cycloxydim
359
applied to the upper leaf surface (soya bean, sugar beet) or one cotyledon (cotton). Samples were taken 3 and 7 days (soya bean and cotton) or 4 and 8 days (sugar beets) after the application, respectively. [14C] cycloxydim was taken up by the roots and transported acropetally to the cotyledons, stem and the remaining leaves. The highest radioactivity was detected in the primary leaves and roots (25–26 µg [14C]cycloxydim/[14C]equiv at 7 DAT in soya beans). After leaf application, about 30% of the total radioactivity is translocated to the untreated soya bean plant parts at 7 days DAT, 8.3% to untreated cotton parts and 11.8% to untreated sugar beet parts.
In another study conducted with sugar beet at the 3-leaves stage, the seedlings were treated with [14C]cycloxydim at 0.2 kg ai/ha. Immediately after application, TRR was 8.48 mg/kg eq.in the tops. At harvest (119 DAT), TRR was 0.13 mg/kg eq. in the tops and 0.015 mg/kg eq. in roots. At 22 DAT, cycloxydim-TSO2 and cycloxydim-T2SO were found in the tops at 0.18 mg/kg eq. (13.9% TRR) and 0.14 mg/kg eq. (11% TRR), respectively. At 46 DAT, various metabolites were found in the tops at low levels (0.0026 to 0.023 mg/kg eq., up to 4%TRR). No hydroxylated metabolites where detected in any sample.
In a third study on sugar beet, [14C]cycloxydim was applied at 0.65 kg ai/ha 2 months after sowing and samples taken 1 day after treatment and at crop maturity (94 DAT). At 1 DAT, TRR were 23 and 4 mg/kg eq. in leaves and roots, respectively, mostly extracted in methanol and dichloromethane. At harvest, residues were 2.2 and 0.16 mg/kg eq. in tops and roots, respectively. Cycloxydim was not detected in any of the top and root samples taken. At 1 DAT, residues mainly of cycloxydim-TSO, with 7.6 mg/kg(31.6%) in the tops and 2.4 mg/kg (60.1%) in roots. Cycloxydim-TSO2 accounted for 16–18%TRR. At harvest, both metabolites were still present (< 10%TRR), but cycloxydim-T1SO was the predominant metabolite (0.42–0.02 mg/kg, 19–14%TRR in tops and roots, respectively). Only cycloxydim-T2S was present in amounts greater than 10%TRR (13.7%). No hydroxylated metabolite was observed.
[14C]cycloxydim was applied to soya beans at 0.2 kg ai/ha two to eight weeks after sowing (three trials, group 1) or at 1 kg ai/ha two months after sowing (one trial, group 2). TRR were 20, 2.3 and 0.46 mg/kg eq. at 45, 71 and 82 DAT in seeds from the group 1 and 12.5, 0.76 and 0.31 mg/kg eq. in straw and stalk. TRR in straw and seed from group 2 were 91 and 38.4 mg/kg eq., respectively. In most plant samples, more than 85% of the TRR were extracted with aqueous methanol and at later sampling intervals, considerable amounts of radioactivity were detected in the aqueous phase. The parent molecule was detected only at the day of application in all trials. The major metabolites found in seed samples were cycloxydim-TSO (0.078 to 0.42 mg/kg, 11.9 to 18.3%TRR), cycloxydim-T2SO (0.11 to 3.7 mg/kg, 4.8 to 18%TRR), cycloxydim-5-OH-TSO (0.2 to 1.3 mg/kg, 6.4 to 8.7% TRR) and cycloxydim-5-OH-TSO2 (0.06 to 0.90 mg/kg, 4.5 to 12%TRR). In straw the hydroxylated metabolites were detected at low levels (up to 3.4%TRR).
Maize
In two studies conducted in tolerant maize, [14C]cycloxydim was applied at 0.4 kg ai/ha (normal rate) at BBCH growth stage 22–23 or at 0.8 kg ai/ha during flowering (BBCH 61-67). In the normal use rate, TRR at harvest (96 DAT) were 0.123 mg/kg eq. in grain, 0.06 mg/kg eq.in cobs, 0.118 mg/kg eq.in husks and 0.17 mg/kg in straw; residues in forage at 72 DAT were 31 mg/kg eq. In the exaggerated rate samples, the TRRs ranged from 4.9 mg/kg eq. in grain to 13 mg/kg in straw eq.. Cycloxydim was not detected in any sample from any trial. In the normal rate trials, metabolite levels accounted for up to 1%TRR in grain, up to 8.7%TRR in straw (0.015 mg/kg cycloxydim-TGS + cycloxydim-TGSO2) and up to 11%TRR in forage (3.6 mg/kg cycloxydim-T1SO). In grain from the exaggerated rate trial, cycloxydim-TSO (0.53 mg/kg, 10.6%TRR), cycloxydim-T1S0 + cycloxydim-T2SO2 and cycloxydim-T2S02 + cycloxydim-T1SO2 (0.71 mg/kg, 14%TRR each) were the major metabolites. Only cycloxydim-T2SO accounted for higher than 10%TRR in straw, husks and cobs. In all normal use rate samples except forage, the most prominent peak was very polar and eluted with the void volume from the HPLC column. The metabolites formed were further degraded and radioactivity incorporated into the carbohydrate pool.

Cycloxydim
360
In summary, cycloxydim is metabolized in plants mainly by four steps: 1) oxidation at the sulphur of the thiopyrane ring to the sulfoxide and to the sulphone, 2) cleavage of the oxime ether group (loss of the alkyl side chain), 3) hydroxylation at the 5-position of the cyclohexenone ring system and 4) oxidative cleavage of the cyclohexenone ring resulting in substituted glutaric acid derivatives. Cycloxydim was not present in any of the samples from treated crops at harvest, with the main metabolites being cycloxydim-TSO, cycloxydim-T2SO, cycloxydim-T1SO (sugar beet root) and cycloxydim-5-OH-TSO (soya bean).
Environmental fate in soil
The aerobic degradation and metabolism of [14C]cycloxydim was studied in a loamy sand soil treated with 10 mg/kg dry soil, equivalent to a maximum single application rate of about 7.5 kg ai/ha, and to a multiple dose of 0.6 kg ai/ha. The soil was incubated at 22 ± 2 °C for 90 day. About 14% TRR was detected as cycloxydim at day 0, decreasing to 0.9%TRR after 14 days. Cycloxydim-TSO/cycloxydim-T1SO/cycloxydim-T2SO represented 16% TRR at 56 DAT and cycloxydim-T1S/cycloxydim-T2S/cycloxydim-TSO2 represented 2.7% TRR at 28 DAT. After three months, bound residues accounted for about 40% TRR and CO2 to 38% TRR. In another study conducted under the same conditions with loamy sand and a loam soils, cycloxydim accounted for over 90% TRR at day 0, decreasing to 4.6 and 0%TRR at day 21, respectively. Cycloxydim-TSO was the major metabolite found in soils (up to 39.5%TRR at 21 DAT and to 11% TRR at 90 DAT). In another study conducted with seven batches of sandy loam and loam sandy soils treated at 0.8 mg/kg, the soils were incubated for 119 days in the dark at 20 °C and 40% maximum water holding capacity. The degradation of cycloxydim was very fast in the soils (DT50 < 9 hours), with up to 18% of the applied radioactivity (TAR) found at 0 DAT. Cycloxydim-TSO (5–6%TAR), cycloxydim-TSO2 (1.5–2.8%TAR) and cycloxydim-T2SO (about 1%TAR) were the major metabolites at 60 DAT, with DT50 of 9.3–1.6 days, 8.8–13 days and 19–291 days, respectively.
The photolytic degradation of cycloxydim was studied on loamy sand soil treated with 10 mg/kg dry and incubated at 30 ± 5 °C for 8 hours. Bound residues were similar with and without irradiation (maximum about 8–15% TAR). Polar degradation products did not accumulate in the course of the study. Cycloxydim residues dropped to 2% TAR at 8 hours. Cycloxydim-TSO/cycloxydim-T2SO accounted to 77–81% TAR after 3 to 8 hours of incubation.
Confined rotational studies were conducted with [14C]cycloxydim applied to soils at 0.65 kg ai/ha. The treated soils were aged for 30 days (radish and lettuce), 80 days (wheat), 120 days and 365 days. Residues in soil were 4.84 mg/kg eq. at day 0 and 0.034 to 0.136 mg/kg eq. after aging and harvesting in all cases. At 30 DAT, TRRs in lettuce (67 days after planting, DAP) and radish root and top (86 DAP) ranged from 0.032 to 0.051 mg/kg eq. At 120 and 365 DAT they ranged from 0.003 to 0.011 mg/kg. At 80, 120 and 365 DAT (118 to 169 DAP) residues ranged from 0.014 to 0.098 mg/kg eq. in wheat grain, from 0.07 to 0.14 mg/kg in straw and from 0.05 to 0.14 mg/kg in chaff. In wheat forage (57 to 70 DAP), they ranged from 0.008 to 0.031 mg/kg. At 30 DAT, cycloxydim-TSO and cycloxydim-TSO2 were the major metabolites in lettuce (0.008 mg/kg, 16%TRR), radish root (0.002 mg/kg, 6.3% TRR) and top (0.006 mg/kg, 12% TRR). At 120 DAT, only cycloxydim-TSO2 could be detected as a single compound (in radish, 10%TRR, 0.001 mg/kg). At 80 DAT, cycloxydim-TGSO2 was the major metabolite in wheat forage (0.008 mg/kg, 26% TRR), and cycloxydim-T2SO (0.03 mg/kg, 20% TRR) and cycloxydim-T1SO (0.02 mg/kg, 16% TRR) in straw. No single residues > 10%TRR were found in wheat commodities at 120 and 365 DAT.
In summary, cycloxydim is extensively and rapidly degraded in soil (DT50 < 9 hours), mainly to cycloxydim-TSO, cycloxydim-T1SO and cycloxydim-T2SO. Cycloxydim-TSO and cycloxydim-TSO2 were found in lettuce and radish planted on aged treated soil. Cycloxydim-TGSO2 (cycloxydim-1-dicarboxylic acid) was the main residue in succeeding wheat forage, and cycloxydim-T1S0 and cycloxydim-T2SO in wheat straw (80 DAT). No single residues were detected in wheat grain planted in aged treated soil.

Cycloxydim
361
Methods of analysis
Two common moiety analytical methods were developed, allowing the determination of cycloxydim, cycloxydim-5-OH-TSO2 and all metabolites that can be oxidized to cycloxydim-TGSO2 or cycloxydim-5-OH-TGSO2 with H2O2 under alkaline conditions in various plant matrices. In the LC-MS/MS method, the residues are extracted with isopropanol/water and hydrogen peroxide to form the corresponding pentane acids, the acids removed by precipitation with Ca(OH)2, the excess of oxidizing agent eliminated using a C18-column and, after a NH2-column clean-up, cycloxydim-TGSO2 and cycloxydim-5-OH-TGSO2 are analysed. In the GC method, the acids are converted into the dimethyl esters cycloxydim-TDME and cycloxydim-OH-TDME, cleaned up in silica gel and analysed by GC/FPD or GC/MS. [14C]cycloxydim studies showed that extraction with isopropanol/water released from 66 to 94%TRR. Both GC and LC methods were satisfactorily validated at 0.05 mg/kg (LOQ) or higher levels (up to 5 mg/kg), using cycloxydim and cycloxydim-OH-SO2 as representative analytes for the non-hydroxylated and hydroxylated compounds, respectively, or with different metabolites.
Cycloxydim-TSO can be selectively analysed in plant matrices after extraction with methanol/water buffer, saturation with NaCl-solution and partitioned with dichloromethane. The aqueous phase is acidified, residues extracted with isooctane/dichloromethane, the extract washed with saturated NaCl-solution, re-extracted with NaCl-solution, the aqueous phase purified by C18SPE and residues determined by HPLC/UV. LOQ was 0.05 mg/kg.
Common moiety methods were also validated in matrices of animal origin, with an LOQ of 0.05 mg/kg for tissues and eggs and 0.01 mg/kg for milk (GC method) or 0.01 mg/kg (tissues and eggs) and 0.003 mg/kg (milk) in the LC methods. Efficiency of the acetonitrile/hexane extraction was comparable with the results from hen metabolism studies (methanol extraction) for eggs and muscle, but not for liver, where acetonitrile/hexane only extracts about 50–70% of the radioactivity. The efficiency of the acetonitrile/hexane extraction of liver, kidney and milk was also comparable with the results obtained in the goat metabolism studies.
Stability of residues in stored analytical samples
The stability of cycloxydim, cycloxydim-TSO + cycloxydim-T2SO2 and/or cycloxydim-5-OH-TSO2 residues was investigated in various plant matrices fortified at 0.4 to 0.5 mg/kg levels stored at -20 °C over a period of up to 2 years. Samples were analysed immediately after spiking and after different storing intervals using the common moiety methods. The results showed that the residues were stable (70–110% remaining) for at least 2 years of storage in most cases.
Liver and milk samples from animal metabolism studies with [14C]cycloxydim or [14C]cycloxydim-5-OH-TSO were re-extracted with methanol or acetonitrile/hexane (4:3) in order to investigate their stability in animal matrices stored for a period of 78–89 month at -20 ºC. The results showed that cycloxydim levels decreased over time while its metabolites increased (cycloxydim-T1SO and cycloxydim-5-OH-T2SO). This degradation is not relevant when the common moiety method is used to analyse the samples in the trials.
Residue definition
Metabolism studies conducted in hens and goats with cycloxydim showed that the parent compound was only detected in liver (0.008 mg/kg, 10.8%TRR). The main metabolites found were cycloxydim-TSO, cycloxydim-TSO2 (hens and goats) and cycloxydim-T1SO (up to 14.8%TRR in milk). Residues were present in fat and muscle at about the same level.
Metabolism studies conducted in soya bean, cotton, sugar beet and maize with cycloxydim have showed that the parent compound was not present in any of the samples at harvest, with the main metabolites being cycloxydim-TSO, cycloxydim-T2SO, cycloxydim-TSO2, cycloxydim-T1SO and cycloxydim-5-OH-TSO.
In all the supervised trials and animal feeding studies submitted to the Meeting, residues were measured using one of the common moiety methods, where residues present in the samples are

Cycloxydim
362
oxidized to cycloxydim-TGSO2 (including cycloxydim-TSO, cycloxydim-T2SO, cycloxydim-TSO2, cycloxydim-T1SO) and/or cycloxydim-5-OH-TGSO2 (including cycloxydim-5-OH-TSO) and analysed by LC-MS/MS or further methylated to cycloxydim-TMDE and/or cycloxydim-5-OH-TMDE for analysis by GC/FPD or GC/MS.
The Meeting agreed that the common moiety analytical methods analyse all the relevant residues formed when cycloxydim is applied on the field or when residues present in feed are ingested by farm animals.
The residue definition for animal and plant commodities for enforcement and risk assessment purposes is: Cycloxydim, metabolites and degradation products which can be oxidized to 3-(3-thianyl) glutaric acid S-dioxide and 3-hydroxy-3-(3-thianyl) glutaric acid S-dioxide, expressed as cycloxydim.
The residue is not fat-soluble
Results of supervised residue trials on crops
In some countries, cycloxydim label does not specify the PHI, indicating that the product should be applied when the weeds are actively growing. When a GAP with no specified PHI was used to support the trials, the highest residue found in the trials at any DAT, except the 0 day, was selected for the estimation.
The OECD MRL calculator was used to assist in the estimation of maximum residue levels from the selected residue data set obtained from the supervised residue trials. The Meeting reviewed the trial conditions and other relevant factors related to each dataset to arrive at a best estimate of the maximum residue level using expert judgment. When the OECD calculator suggested a different value, an explanation on the discrepancy was included in the text.
Pome fruits and stone fruits
Cycloxydim is registered to be used by direct spraying to control weeds in apple and pear orchards in Portugal using one application at 0.4 kg ai/ha and 28 days PHI. Two trials were conducted with apples and two with pears in Italy and Spain, matching the GAP of Portugal, gave residues of cycloxydim < 0.09 mg/kg (4).
Cycloxydim is registered to be used by direct spraying to control weeds in Italy in apricot and peach orchards up to 0.6 kg ai/ha with a 30 day PHI. In three trials in peaches and two in apricots conducted in Italy, at GAP, residues were < 0.09 mg/kg (5).
The Meeting concluded that on the basis of the data from these nine trials that the application of cycloxydim to the orchard floor, matching GAP, does not result in residues in the fruit.
The Meeting estimated a maximum residue level of 0.09* mg/kg, a HR of 0.09 mg/kg and a STMR of 0.09 mg/kg for cycloxydim in pome fruits and stone fruits
Grapes
The critical application rate of cycloxydim used for directed spraying to control weeds in grapes is a single application at 0.4 kg ai/ha in Spain and 0.6 kg ai/ha in Switzerland, with no specified PHI.
Eight trials were conducted in northern/central France and Germany, matching the GAP of Switzerland, gave residues of (n = 8) < 0.09 (4), 0.13 (2) and 0.18 (2) mg/kg.
In eight trials conducted in Italy, Greece and Spain according to Spanish GAP, residues were < 0.09 mg/kg (8).
Based on the residue data from trials conducted in northern Europe, the Meeting estimated a maximum residue level of 0.3 mg/kg, a HR of 0.18 mg/kg and a STMR of 0.11 mg/kg for cycloxydim in grape.
The Meeting withdrew its previous recommendation of 0.5 mg/kg for cycloxydim in grapes.

Cycloxydim
363
Strawberry
Cycloxydim is registered for use in strawberries in Switzerland at 1 × 0.6 kg ai/ha with a 42 day PHI and in Slovakia at 1 × 0.4 kg ai/ha and no PHI specified. The product is also registered in Romania at 1 × 0.4 kg ai/ha with no PHI specified.
Seven trials conducted according to Slovakian GAP in France (north), the Netherlands, Germany and the UK, gave total cycloxydim residues of 0.19, 0.22, 0.29, 0.33, 0.34 0.47 and 0.61 mg/kg. One trial conducted in Sweden according to the GAP of Switzerland gave residues of 0.63 mg/kg.
Eight trials were conducted in southern France, Greece, Italy and Spain matching Romanian GAP, gave residues of 0.29, 0.33, 0.35, 0.49, 0.57, 0.74, 1.2 1.4 and 1.4 mg/kg
Based on the residue data from trials conducted in southern Europe, the Meeting estimated a maximum residue level of 3 mg/kg, a HR of 1.4 mg/kg and a STMR of 0.53 mg/kg for cycloxydim in strawberries.
The Meeting withdrew its previous recommendation of 0.5 mg/kg for cycloxydim in strawberries.
Onion, Bulb
Cycloxydim is registered in the Netherlands at up to 2 × 0.6 kg ai/ha with a 21 day PHI. In Belgium, the GAP is for 1 × 0.6 kg ai/ha and a 28 day PHI. In Italy, the GAP is for 1 × 0.6 kg ai/ha and a 60 day PHI. In Spain, it is 1 × 0.4 kg ai/ha with no PHI specified.
In four trials conducted in the UK matching the GAP of the Netherlands, residues were < 0.09 (4).
In seven trials conducted in France, the Netherlands, Sweden and the UK, complying with Belgian GAP, residues were: < 0.09 (3), 0.21, 0.25, 0.31 and 0.39 mg/kg.
In four trials conducted in Greece, Spain and Italy matching Italian GAP, residues were < 0.09 (2), 0.19 and 0.24 mg/kg.
In four trials conducted in France (south), Italy, Greece and Spain according to Spanish GAP residues were: 0.17, 0.25, 0.32 0.98, and 1.3 mg/kg
Based on the residue trials conducted according to GAP in Spain, and with the results from the other trials conducted in Europe used as supporting data, the Meeting estimated a maximum residue level of 3 mg/kg, a HR 1.3 mg/kg and a STMR of 0.285 mg/kg for cycloxydim in bulb onions.
Leek
Cycloxydim is registered for use in leeks in Portugal with a GAP of 1 × 0.4 kg ai/ha and a 42 day PHI. In Ireland, the rate is the same but no PHI is specified. In Switzerland, GAP consists of 1 × 0.6 kg ai/ha and a 56 day PHI
In six trials conducted in Belgium, Denmark, Germany and the UK matching Irish GAP, residues were 0.13, 0.28, 0.33, 0.39, 0.62 and 2.3 mg/kg.
In four trials conducted in the Netherlands according to the GAP of Switzerland, residues were 0.11, 0.12, 0.21 and 0.24 mg/kg.
In three trials conducted in southern France, Italy and Spain according to Portuguese GAP, residues were < 0.09 (2) and 0.09 mg/kg.
Based on the residue trials conducted according to the GAP in Ireland, the Meeting estimated a maximum residue level of 4 mg/kg, a HR of 2.3 mg/kg and a STMR of 0.36 mg/kg for cycloxydim in leek.

Cycloxydim
364
Brassica vegetables
Cycloxydim is registered in Brassica vegetables in Switzerland at 1 × 0.6 kg ai/ha and a 28 day PHI, and in Spain at 1 × 0.4 kg ai/ha with no specified PHI.
Twelve trials were conducted in Brussels sprouts in Europe at 0.5 kg ai/ha. Residues from seven trials conducted in Belgium, France (north), Germany, the Netherlands and the UK according to the GAP in Switzerland were: 1.0, 1.1, 1.8 (2), 2.0, 2.9 and 3.6 mg/kg.
Four trials conducted in France (south), Italy, Spain and Greece according to Spanish GAP gave residues of 1.9, 2.6, 3.5 and 6.0 mg/kg.
Residues in Brussels sprouts from trials matching comparable GAP in northern and southern Europe were considered similar and could be combined, were (n = 12): 1.0 (2), 1.1, 1.8 (2), 1.9, 2.0, 2.6, 2.9, 3.5, 3.6 and 6.0 mg/kg.
Fourteen trials were conducted in cabbages at 0.5–0.6 kg ai/ha. In nine trials conducted in France (north), Germany, Sweden, Belgium and the UK according to the GAP of Switzerland, residues were: < 0.09, 0.40, 0.50 (2), 0.63, 0.74, 1.0, 1.3 and 3.0 mg/kg. In five trials conducted in Spain, France (south), Greece and Italy according to Spanish GAP (sample taken at 28 days after application), residues were: 0.88, 1.0, 1.2, 1.4 and 1.7 mg/kg.
Twelve trials were conducted in Europe in cauliflower at 0.5–0.6 kg ai/ha. In eight trials conducted in Belgium, France (north), Sweden and the UK according to the GAP of Switzerland, residues were: 0.27, 0.59, 1.5 (2), 1.7, 1.9, 2.1 and 2.3 mg/kg. Four trials conducted in southern Europe did not match the GAP.
Based on the residue data for Brussels sprouts the Meeting estimated a maximum residue level of 9 mg/kg, a HR of 6 mg/kg and a STMR of 5 mg/kg for cycloxydim in Brassica (Cole or Cabbage) Vegetables, Head Cabbage and Flowerhead Brassicas
The Meeting withdrew its previous recommendations.
Peppers
Cycloxydim is registered in peppers (chili and sweet) in Italy at 1 × 0.60 kg ai/ha and a 20 day PHI. In eight trials conducted peppers in southern Europe according to this GAP, residues were: 0.68, 0.78, 1.2, 1.5, 1.6, 3.0, 3.1, and 5.3 mg/kg.
The Meeting estimated a maximum residue level of 9 mg/kg, a HR of 5.3 mg/kg and a STMR of 1.55 mg/kg for cycloxydim in peppers.
The Meeting also estimated a maximum residue level of 90 mg/kg, a HR-P of 53 mg/kg and a STMR-P of 15.5 mg/kg for cycloxydim in dried chili peppers, by applying a factor of 10 to the MRL, HR and STMR values estimated for peppers.
Tomatoes
Cycloxydim is registered in tomatoes at 1 × 0.4 kg ai/ha and a 35 day PHI in Greece, and at 0.6 kg ai/ha and a 56 day PHI in Switzerland.
In eight trials conducted in southern Europe according to Greek GAP, residues were: 0.12, 0.17, 0.25, 0.26, 0.31, 0.39, 0.43 and 0.55 mg/kg.
In eight trials conducted in northern Europe according to the GAP of Switzerland, residues were: 0.21, 0.39 (2), 0.44, 0.45, 0.46, 0.50 and 0.84 mg/kg.
Based on the residue trial population in North of Europe, the Meeting estimated a maximum residue level of 1.5 mg/kg, a HR of 0.84 mg/kg and a STMR of 0.445 mg/kg for cycloxydim in tomatoes.

Cycloxydim
365
Chinese cabbage
Cycloxydim is registered for brassica vegetables in Spain at 1 × 0.4 kg ai/ha with no specified PHI.
In two trials conducted in Greece and Italy according to this GAP, residues were < 0.09 and 0.23 mg/kg
The Meeting agreed that there were insufficient data complying with GAP with which to estimate a maximum residue level for cycloxydim in Chinese cabbage.
Kale
Cycloxydim is registered for brassica vegetables in Switzerland at 1 × 0.6 and a 28 day PHI and in Spain at 1 × 0.4 kg ai/ha with no specified PHI.
In four trials conducted in kale, curly in France (north), Germany and the Netherlands according to the GAP of Switzerland, residues were: 0.77, 0.90 and 1.8 mg/kg.
In four trials conducted in France (south), Greece, Italy and Spain according to Spanish GAP, residues were: < 0.09, 0.23, 0.98 and 1.1 mg/kg.
Based on the residue data from trials conducted in south of Europe, the Meeting estimated a maximum residue level of 3 mg/kg, a HR of 1.1 mg/kg and a STMR of 0.65 mg/kg for cycloxydim in kale.
Lettuce
Cycloxydim is registered in lettuce (leaf and head) in Austria at 1 × 0.5 kg ai/ha and a 14 day PHI, in France at 0.4 kg ai/ha and a 21 day PHI and in Slovenia at 0.4 kg ai/ha with a 14 day PHI. Twenty two trials were conducted in lettuce in Europe at 0.5 kg ai/ha, matching GAP rate in northern and southern Europe.
Six trials were conducted in northern Europe according to Austrian GAP, giving residues of 0.18, 0.28, 0.48, 0.65, 0.69 and 0.71 mg/kg.
Six trials were conducted in northern Europe according to French GAP, giving residues of 0.11, 0.12, 0.21, 0.28 and 0.34 (2) mg/kg.
In ten trials conducted in southern Europe according to Slovenian GAP, residues were: 0.09, 0.11, 0.24, 0.31 (2), 0.36, 0.38, 0.41 (2) and 1.0 mg/kg
Based on the residue trial population in southern Europe, the Meeting estimated a maximum residue level of 1.5 mg/kg, a HR of 1 mg/kg and a STMR of 0.335 mg/kg for cycloxydim in lettuce, head and lettuce, leaf.
The Meeting withdrew its previous recommendation of 0.2 mg/kg for cycloxydim in lettuce, head and lettuce, leaf.
Spinach
Cycloxydim is registered in spinach at 1 × 0.4 kg ai/ha in Slovenia and in France, with PHIs of 28 days and 42 days, respectively. Eight trials were conducted in Europe at 0.5 kg ai/ha.
In four trials conducted in north of Europe according to French GAP, residues were: < 0.09 (3) and 0.10 mg/kg
In four trials conducted in south of Europe according to Slovenian GAP, residues were: < 0.09, 0.19, 0.20 and 2.4 mg/kg.
The Meeting agreed that there were insufficient trials according to GAP to estimate a maximum residue level of cycloxydim in spinach.

Cycloxydim
366
Green beans with pods
Cycloxydim is registered in green beans at 1 × 0.6 kg ai/ha in Belgium with a 28 day PHI. In Spain, the rate is 0.4 kg ai/ha with no PHI specified.
In ten trials conducted in northern Europe according to Belgian GAP, residues were: < 0.09, 0.21, 0.22, 0.26, 0.30, 0.40, 0.64, 0.73, 1.2 and 1.3 mg/kg
In eleven trials conducted in southern Europe according to Spanish GAP, residues were: < 0.05, 0.20 (2), 0.24, 0.29, 0.35, 0.41, 0.52, 0.56, 4.4 and 11 mg/kg.
Based on the residue trial population from southern Europe (statistically higher), the Meeting estimated a maximum residue level of 15 mg/kg, a HR of 11 mg/kg and a STMR of 0.35 mg/kg for cycloxydim in beans except broad bean & soya bean (green pods & immature seeds).
The Meeting withdrew its previous recommendation of 1 mg/kg for cycloxydim in common bean (pods and/or immature seeds).
Peas, Shelled (succulent seeds)
Cycloxydim is registered in green peas at 1 × 0.5 kg ai/ha in Germany with a 35 day PHI. In Spain, the rate is up to 0.4 kg ai/ha and no PHI is specified.
In seven trials conducted in northern Europe according to German GAP, residues in peas (seeds) were: 0.80, 1.2, 1.8, 2.5, 3.2, 4.4 and 4.7 mg/kg.
In eight trials conducted in south of Europe according to Spanish GAP rate (PHI from 28 to 49 days) were: 0.45, 0.84, 2.1, 2.3, 3.1, 5.3, 5.9 and 8.5 mg/kg.
Based on the residue trials in southern Europe, the Meeting estimated a maximum residue level of 15 mg/kg, and a STMR of 2.7 mg/kg for cycloxydim in peas, shelled (succulent seeds). The Meeting withdrew its previous recommendation of 2 mg/kg for cycloxydim in peas, shelled (succulent seeds) and of 1 mg/kg in peas (pods and succulent = immature seeds).
Dry beans
Cycloxydim is registered in dry beans at 1 × 0.45 kg ai/ha in France, with no PHI specified. Twenty one trials were conducted in Europe matching this GAP.
In eight trials conducted in northern Europe, residues were: 0.51, 1.5, 2.8, 4.4 (2), 7.9, 9.8 and 15 mg/kg.
In thirteen trials conducted in southern Europe, residues were: 0.20, 0.31, 0.57, 0.70, 1.1, 2.0, 2.4, 3.0, 3.5, 3.6, 4.0, 4.5 and 6.1 mg/kg
Based on the trials conducted in northern Europe the Meeting estimated a maximum residue level of 30 mg/kg, and a STMR of 4.4 mg/kg for cycloxydim in beans, dry.
The Meeting withdrew its previous recommendation of 2 mg/kg for cycloxydim in beans (dry).
Dry peas
Cycloxydim is registered in peas at 1 × 0.60 kg ai/ha in Sweden with no PHI specified. In Italy, the rate is the same with a 60 day PHI.
In four trials conducted in the Netherlands and the UK matching the GAP rate in Sweden, residues at 55 days PHI were: 1.2, 3.4, 5.9 and 12 mg/kg.
In ten trials conducted in south of Europe according to Italian GAP, residues were: 0.30, 0.69, 0.84, 1.6 (2), 3.2 (2), 3.6, 5.5 and 5.9 mg/kg.
The Meeting estimated a maximum residue level of 30 mg/kg, and a STMR of 5.6 mg/kg for cycloxydim in peas, dry.

Cycloxydim
367
Soya beans
Cycloxydim is registered in soya beans at 1 × 0.40 kg ai/ha in France with a 56 day PHI. In Spain, the rate is the same, with no PHI specified,
In thirteen trials conducted in Europe at 0.5 kg ai/ha and PHI of 49–63, matching GAP in France and Spain, residues were: 0.23, 0.83, 1.2, 2.8, 3.4, 9.2, 13, 14, 26, 30 (2), 33 and 40 mg/kg.
The Meeting estimated a maximum residue level of 80 mg/kg, and a STMR of 13 mg/kg for cycloxydim in soya bean, dry.
The Meeting withdrew its previous recommendation of 2 mg/kg for cycloxydim in soya beans.
Carrots
Cycloxydim is registered in carrots in Belgium at a single application up to 0.60 kg ai/ha and in Portugal at 0.40 kg ai/ha, with a PHI of 28 days. Eleven trials were conducted in Europe at 0.50 kg ai/ha, matching both the GAP rates of Belgium and Portugal.
Residues, at the 28 day PHI, from northern European trials according to Belgian GAP were: 0.32, 0.42, 0.44 and 0.64 mg/kg.
Trials from southern Europe, according to Portuguese GAP at the 28 day PHI, gave residues of: 0.18, 0.29, 0.33, 0.44, 0.47, 1.1 and 3.0 mg/kg.
Based on the residue trials from southern Europe, the Meeting estimated a maximum residue level of 5 mg/kg, a HR of 3 mg/kg and a STMR of 0.44 mg/kg for cycloxydim in carrots.
The Meeting withdrew its previous recommendation of 0.5 mg/kg for cycloxydim in carrots.
Celeriac
Cycloxydim is registered in celeriac in France at 1× 0.60 kg ai/ha and a 48 day PHI.
In eight trials conducted in Europe according to this GAP, residues were: 0.10, 0.12, 0.13 (3), 0.14, 0.19 and 0.64 mg/kg.
The Meeting estimated a maximum residue level of 1 mg/kg, a HR of 0.64 mg/kg and a STMR of 0.13 mg/kg for cycloxydim in celeriac.
Potatoes
Cycloxydim is registered in potatoes at 1 × 0.60 kg ai/ha in Belgium and the Netherlands with a 56 day PHI. In Italy, the rate is the same with a 100 day PHI. In ten trials conducted in northern Europe according to Belgian GAP, residues were: 0.31, 0.41, 0.55, 0.65, 0.72, 0.75, 0.79, 1.0, 1.2 and 1.6 mg/kg.
Seven trials conducted in southern Europe, according to Italian GAP, residues were: < 0.09 (2), 0.10, 0.21, 0.27, 0.44 and 0.46 mg/kg.
Based on the residue trials in north of Europe, the Meeting estimated a maximum residue level of 3 mg/kg, a HR of 1.6 mg/kg and a STMR of 0.735 mg/kg for cycloxydim in potatoes.
The Meeting withdrew its previous recommendation of 2 mg/kg for cycloxydim in potatoes.
Turnips
From six trials on turnips conducted in Norway at a rate of 0.6 kg ai/ha residues in turnip roots 77 to 103 days post application were: < 0.09 to 0.13 mg/kg. The GAP rate in Europe is up to 0.4 kg ai/ha.
As no trials were conducted according to GAP, the Meeting did not estimate a maximum residue level for cycloxydim in turnips.

Cycloxydim
368
Sugar beet
Cycloxydim is registered in sugar beet at 1 × 0.50 and 0.60 kg ai/ha in Germany and the Netherlands, respectively, no PHI specified. In Italy, the rate is 0.60 kg ai/ha and 100 days PHI. GAP for swede in THE UK is 0.45 kg ai/ha with 56 days PHI and for beetroot in Switzerland is 0.60 kg ai/ha with 56 days PHI.
In ten trials conducted in north of Europe according to German GAP, residues were < 0.09 (9) and 0.10 mg/kg.
In eight trials conducted in south of Europe according to Italian GAP, residues were < 0.09 (8) mg/kg.
Based on the residue trials in north of Europe, the Meeting estimated a maximum residue level of 0.2 mg/kg, a HR of 0.1 mg/kg and a STMR of 0.09 mg/kg for cycloxydim in sugar beet.
The Meeting agreed to extrapolate these estimations to beetroot and swede.
The Meeting confirms its previous recommendation of 0.2 mg/kg for cycloxydim in sugar beet.
Maize
Cycloxydim is registered in Germany for use in maize at 1 × 0.40 kg ai/ha (no PHI specified) and France (90 days PHI).
In six trials conducted in northern Europe, matching German GAP, residues were: < 0.09 (5) and 0.12 mg/kg.
In eight trials conducted in southern Europe, according to French GAP, residues were: < 0.09 (8) mg/kg.
Based on trials conducted in northern Europe, the Meeting estimated a maximum residue level of 0.2 mg/kg, and a STMR of 0.09 mg/kg for cycloxydim in maize grain.
Rice
Cycloxydim is registered in rice in Italy at 1 × 0.40 two days before sowing, with no PHI specified. In 11 trials conducted in the country according to GAP, residues found in grain, 133 to 162 days after treatment, were: < 0.09 (11) mg/kg.
The Meeting estimated a maximum residue level of 0.09* mg/kg, and a STMR of 0.09 mg/kg for cycloxydim in rice.
Rape seed
Cycloxydim is registered in rape seed at 1 × 0.60 kg ai/ha in Italy, with a PHI of 100 days. In Germany the rate is 0.50 kg ai/ha with no PHI specified.
In nine trials conducted in northern Europe, according to German GAP, residues at PHIs from 85 to 100 days PHI were: 0.77, 1.0, 1.5, 1.6, 1.8, 1.9, 2.2, 2.5 and 5.3 mg/kg
In six trials conducted in southern Europe, according to Italian GAP residues were: 0.54, 1.6, 1.8, 2.8, 3.1 and 4.0 mg/kg
The fifteen trials conducted according to the same GAP in the south and north of Europe belonged to the same residue population and were combined: 0.54, 0.77, 1.0, 1.5, 1.6 (2), 1.8, 1.9, 2.2, 2.5, 2.8 (2), 3.1, 4.0 and 5.3 mg/kg.
The Meeting estimated a maximum residue level of 7 mg/kg, and a STMR of 1.9 mg/kg for cycloxydim in rape seed.
The GAP for linseed in Sweden is 0.6 kg ai/ha with no PHI specified. The Meeting agreed to extrapolate the rape seed estimates to linseed.

Cycloxydim
369
The Meeting withdrew its previous recommendation of 2 mg/kg for cycloxydim in rape seed.
Sunflower
Cycloxydim is registered in sunflower at 1 × 0.60 kg ai/ha in Italy, with a PHI of 80 days. In Germany the rate is 0.50 kg ai/ha with a 100 day PHI.
In four trials conducted in northern Europe according to German GAP, residues were: < 0.09, 0.37, 0.38 and 2.8 mg/kg.
In 15 trials conducted in southern Europe, according to Italian GAP, residues were: < 0.09 (4), 0.09, 0.12, 0.14, 0.25, 0.28, 0.37, 0.38, 0.39, 0.50, 0.94 and 1.8 mg/kg.
Based on the data coming from northern Europe, and with the support of the other trials conducted in Europe, the Meeting estimated a maximum residue level of 6 mg/kg, and a STMR of 0.375 mg/kg for cycloxydim in sunflower seed.
Feed commodities
Maximum residue levels will not be estimated for forage commodities as it is understood that the international trade of such commodities is unlikely. Highest residue and/or STMR will be estimated for commodities listed in the OECD feeding table for animal dietary burden calculation purposes.
Bean vines
Residues of cycloxydim in bean vine (whole plant or rest of the plant) from trials conducted in northern Europe, according to GAP (0.4–0.45 kg ai/ha, no PHI specified), were (n = 7): 0.3, 0.84, 0.9, 0.99, 1.2, 1.4 and 1.5 mg/kg.
Residues of cycloxydim in bean vine from trials conducted in southern Europe, according to GAP, were (n = 9): 0.34, 0.43, 0.67, 0.71, 0.77, 1.2 (2), 1.3 and 2.0 mg/kg.
Based on the southern European trials, which gave the highest residues, the Meeting estimated a highest residue of 2 mg/kg and a STMR of 0.77 mg/kg for cycloxydim in bean vines.
Pea vines
Residues of cycloxydim in pea vine (whole plant or without the seed, or rest of the plant) from trials conducted in northern Europe, according to GAP (0.6 kg ai/ha, no PHI specified) were (n = 8): 0.8, 0.93, 2.4, 2.5, 2.6, 3.5, 3.6 and 3.9 mg/kg.
Residues of cycloxydim in pea vine from trials conducted in southern Europe, according to GAP (0.6 kg ai/ha, 60 day PHI or 0.4 kg ai/ha no PHI specified), were (n = 17): 0.14, 0.16, 0.21, 0.24, 0.27, 0.45, 1.1, 1.8 (2), 2.1, 2.2, 2.3, 5.5, 5.9, 6.1, 8.4 and 9.0 mg/kg.
Based on the southern European trials, which gave the highest residues, the Meeting estimated a highest residue of 9 mg/kg and a STMR of 1.48 mg/kg for cycloxydim in pea vines.
The Meeting also recommends a maximum residue level of 60 mg/kg for pea vines (dry) (25% DM).
Sugar beet leaves or tops
In ten trials conducted in northern Europe, according to GAP (0.5 kg ai/ha, no PHI specified), residues in the leaves (tops) were: < 0.09 (6), 0.09, 0.16, 0.33 and 0.50 mg/kg.
In six trials conducted in southern Europe according to GAP (0.6 kg ai/ha, 100 day PHI), residues were: < 0.09 (6) mg/kg.
Based on the northern European trials, the Meeting estimated a highest residue of 0.50 mg/kg and a STMR of 0.09 mg/kg for cycloxydim in sugar beet leaves or tops.

Cycloxydim
370
Maize fodder
In ten trials conducted with cycloxydim in northern Europe according to GAP (0.4 kg ai/ha, no PHI specified), residues in fodder were: < 0.09 (7), 0.11, 0.3 and 0.41 mg/kg.
In four trials conducted in south of Europe according to GAP (0.4 kg a.i./ha, 90 days PHI), residues were 0.10, 0.11, 0.29 and 1.1 mg/kg
Based on the trials conducted in southern Europe and with the support of the trials conducted in northern Europe the Meeting estimated a highest residue of 1.1 mg/kg and a STMR of 0.247 mg/kg for cycloxydim in maize fodder.
The Meeting also estimated a maximum residue level of 2 mg/kg in maize fodder, dry (85% DM).
Rice straw and fodder
In eight trials conducted with cycloxydim in Italy, according to GAP, residues in rice straw were: < 0.09 (8) mg/kg.
The Meeting estimated a maximum residue level of 0.09* mg/kg, a HR of 0.09 mg/kg and a STMR of 0.09 mg/kg for cycloxydim rice straw (DM=90%).
Rape forage
In three trials conducted in Norway according to GAP, residues in rape seed forage were 0.24, 0.25 and 0.26 mg/kg.
The Meeting agreed that three trials according to GAP was sufficient to estimate a highest residue for cycloxydim in rape forage.
Fate of residues in processing
The [14C]-cycloxydim was dissolved in aqueous buffer solution at pH 4 and heated for 20 minutes at 90 °C to simulate pasteurization, at pH 5 and refluxed at 100 °C for 60 minutes to simulate baking, brewing and boiling, and at pH 6 at about 120 °C in an autoclave for 20 minutes to simulate pasteurization. Cycloxydim degraded mainly to cycloxydim-T2S, which accounted for 93.5, 86.8 and 75% of the total applied radioactivity (TAR), respectively. T2SO accounted for up to 11% TAR (at pH 6).
A variety of processing studies were conducted with crops treated with cycloxydim. Processing factors (PF) in commodities with relevance for dietary exposure assessment and for animal dietary burden calculation are shown in the Table below. The estimated PFs were multiplied by the estimated HR and STMR of the raw commodity to estimate the HR-P and STMR-P for the processed commodity.
Processing factor (PF) and estimations for processed commodities
Commodity Best estimate PF (n)* STMR-P, mg/kg HR-
P, mg/kg Strawberry, STMR= 0.53 mg/kg, HR=1.4 mg/kg Strawberry jam 0.55 (4) 0.291 Strawberry canned 0.90 (4) 0.447 1.26 Onion, STMR=0.285 mg/kg, HR= 1.3 mg/kg Onion, peeled 1.1 (2) 0.31 1.43 Cabbage, STMR=1.95 mg/k, HR= 9.0 mg/kg Cabbage, cooked 0.56 (4) 1.09 5.04 Pasteurized sauerkraut 0.78 (4) 1.17 Tomato, STMR=0.445mg/kg , HR= 0.89 mg/kg Tomato, canned 0.57 (4) 0.254 0.51 Tomato juice 1.1 (4) 0.49

Cycloxydim
371
Commodity Best estimate PF (n)* STMR-P, mg/kg HR-
P, mg/kg Ketchup 1.8 (4) 0.801 Tomato pure, pasteurized 3.7 (4) 1.65 Pea, STMR=5.6 mg/kg Pea, cooked 0.7 (4) 3.92 Pea, canned 0.2 (4) 1.12 Carrot, STMR= 0.44 mg/k, HR= 3.0 mg/kg Carrot, cooked 0.77 (4) 0.339 2.31 Carrot, juice 0.50 (4) 0.22 Carrot, canned 0.36 (4) 0.158 1.08 Potato, STMR= 0.735 mg/kg, HR= 1.6 mg/kg Potato, peeled 1.3 (4) 0.960 2.08 Potato, boiled 1.5 (4) 1.10 2.4 Potato, steamed 1 (4) 0.735 1.6 French fries 1.3 (4) 0.956 2.08 Rape seed, STMR= 1.9 mg/kg Rape oil, refined < 0.05 (4) 0.095 Rape oil meal 1.5 (6) 2.85 Sunflower, STMR=0.05 mg/kg Sunflower oil 0.1 (2) 0.00 a number of processing studies
Residues in animal commodities
Farm animal dietary burden
The Meeting estimated the dietary burden of cycloxydim in farm animals on the basis of the diets listed in Annex 6 of the 2006 JMPR Report (OECD Feedstuffs Derived from Field Crops), the STMR, STMR-Ps or highest residue levels estimated at the present Meeting (see Table below). Dietary burden calculations are provided in Annex 6 of the 2012 JMPR Report.
Livestock dietary burden for cycloxydim, ppm of dry matter diet US-Canada EU Australia Japan Max Mean Max Mean Max Mean Max Mean Beef cattle 3.54 2.09 22.4 7.26 26.8a 8.5 c 2.28 2.28 Dairy cattle 8.1 2.96 22.6b 7.55d 20.4 7.0 1.55 1.55 Poultry - broiler 3.47 3.47 6.06 3.92 5.1 5.1 0.07 0.07 Poultry - layer 3.47 3.47 10.89 e 4.32 5.1f 5.1 0.08 0.08 a Highest maximum beef or dairy cattle dietary burden suitable for maximum residue level estimated for mammalian tissues b Highest maximum dairy cattle dietary burden suitable for maximum residue level estimated for mammalian milk c Highest mean beef or dairy cattle dietary burden suitable for STMR estimated for mammalian tissues. d Highest mean dairy cattle dietary burden suitable for STMR estimated for milk. e Highest maximum poultry dietary burden suitable for maximum residue level estimated for poultry tissues and eggs. f Highest mean poultry dietary burden suitable for STMR estimated for poultry tissues and eggs.
Animal feeding studies
Cattle
A mixture of cycloxydim and cycloxydim-5-OH-TSO (2:1) was administered orally to cattle for 28 days at 5.1, 15.2 and 50.2 ppm feed levels. Residues (sum of non-hydroxylated and hydroxylated metabolites; expressed as parent equivalents) in milk was only detected at the highest dose, with a

Cycloxydim
372
mean of 0.044 mg/kg. Mean residues in skim milk and cream (from day 21) were similar (0.044 and 0.033 mg/kg, respectively).
In muscle, residues were not detected at the lowest dose. Mean and highest residues were 15.2 ppm of 0.023 and 0.026 mg/kg, respectively. Mean and highest residues at 50.2 ppm were 0.073 and 0.088 mg/kg, respectively
In liver, mean residues were 0.043, 0.128 and 0.336 mg/kg were at feeding levels of 5.1, 15.2 and 50.2 ppm, respectively, with the highest residues of 0.045, 0.151 and 0.381 mg/kg, respectively. Residue 2 days after the dose withdrawal was 0.079 mg/kg.
In kidney, mean residues were 0.068, 0.202 and 0.593 mg/kg at feeding levels of 5.1, 15.2 and 50.2 ppm, respectively, with the highest residues of 0.073, 0.239 and 0.727 mg/kg, respectively. The residue 2 days after dose withdrawal was 0.057 mg/kg.
In fat, mean residues were < 0.019, 0.025 and 0.119 mg/kg at feeding levels of 5.1, 15.2 and 50.2 ppm, respectively, with the highest residues of < 0.019, 0.030 and 0.138 mg/kg, respectively. The residue 2 days after dose withdrawal was 0.020 mg/kg.
In another study conducted at the same dose levels, residues in milk (total, skin and cream), muscle and fat were only detected at the highest dose: mean of 0.020 mg/kg in milk and skim milk and 0.016 mg/kg in cream; mean and highest in muscle of 0.06 and 0.07 mg/kg, respectively and in fat of 0.10 and 0.12 mg/kg.
In liver, mean residues were 0.03, 0.12 and 0.29 mg/kg at 5, 15 and 50 mg/kg dose levels, respectively, with the highest residues of 0.04, 0.15 and 0.31 kg/kg, respectively. The residue 2 days after dose withdrawal was 0.06 mg/kg.
In kidney, mean residues were 0.05, 0.14 and 0.44 mg/kg at 5, 15 and 50 mg/kg dose levels, respectively, with the highest residues of 0.06, 0.18 and 0.51 kg/kg, respectively. The residue 2 days after dose withdrawal was 0.05 mg/kg.
Poultry
A mixture of cycloxydim and cycloxydim-OH-TSO (1:1) was administered orally to groups of hens for 28 days at doses of 2.29, 6.71 and 23.2 ppm in the feed. Mean and highest residues in eggs detected at 6.71 ppm dose were 0.022 and 0.058 mg/kg, respectively (n = 9). At the highest dose, mean and highest values were 0.065 and 0.102 mg/kg, respectively (n = 9). Residues were < 0.02 mg/kg during the depuration phase (between 29 and 33 days). Residues were not detected above the LOQ in muscle and fat in any dose group. In liver, residues were detected only at the highest dose group (mean of 0.022 mg/kg and highest of 0.03 mg/kg).
In another study, cycloxydim and cycloxydim-OH-TSO (1:1) was administered to laying hens at a target dose level of 2.5, 7.5 and 25 ppm. Residues were not detected in muscle, liver and fat at any dose level. In eggs, residues were detected at the 7.5 ppm (mean of < 0.03 mg/kg, highest of 0.041 mg/kg) and at the 25 mg/kg dose (mean of 0.046 mg/kg, highest of 0.069 mg/kg). Residues during the depuration phase (3–7 days) were < 0.03 mg/kg.
Animal commodity maximum residue levels
The residues expected in animal commodities based on the calculated animal burden and the feeding studies are shown in Table 3. The levels which the estimations were based are in bold.
Residues in kidney and liver at the expected dietary burden are outlined below. Feed level, ppm, for Residue, mg/kg Milk
residues Tissues and eggs residues
Milk Muscle Liver Kidney Fat Eggs
Highest residue level, cattle Feeding study 50 15
50 0.032 0.026
0.088 0.151 0.381
0.239 0.727
0.030 0.138
Burden and 22.6 26.8 0.014 0.047 0.228 0.40 0.066

Cycloxydim
373
Feed level, ppm, for Residue, mg/kg Milk
residues Tissues and eggs residues
Milk Muscle Liver Kidney Fat Eggs
residue STMR, cattle Feeding study 50 5
15 0.032 < 0.019
0.026 0.036 0.124
0.059 0.171
< 0.019 0.027
Burden and residue
7.55 8.5 0.0054 0.021 0.067 0.0984 0.022
Highest residue level, hens Feeding study 6.7/7.5
23.2
< 0.02 0.03
< 0.02/< 0.03
0.058/0.041
Burden and residue
10.8 < 0.03 0.014 < 0.03 0.092/0.023
STMR, hens Feeding study 6.7/7.5
23.5
< 0.02 0.022
< 0.03
0.022/0.03
Burden and residue
5.1 0 0.0054 0 0.02/0.017
Based on the results obtained for cattle, the Meeting estimated for cycloxydim a maximum
residue level of 0.02 mg/kg and a STMR of 0.005 mg/kg in milks; a maximum residue level of 0.06 mg/kg, a HR of 0.047 mg/kg and a STMR of 0.021 mg/kg in meat (from mammalian other than marine mammals); a maximum residue of 0.1 mg/kg, a HR of 0.066 mg/kg and a STMR of 0.021 mg/kg for mammalian fats (except milk fats); and a maximum residue level of 0.5 mg/kg, a HR of 0.403 mg/kg and a STMR of 0.098 mg/kg in edible offal (mammalian).
Based on the results obtained for hens, the Meeting estimated for cycloxydim a maximum residue level of 0.15 mg/kg, a HR of 0.092 mg/kg, and a STMR of 0.018 mg/kg in eggs; a maximum residue level of 0.03* mg/kg, a HR of 0.03 mg/kg and a STMR of 0 mg/kg in poultry meat and poultry fats; and a maximum residue level of 0.02 mg/kg, a HR of 0.014 mg/kg and a STMR of 0.005 mg/kg for cycloxydim in poultry edible offal.
RECOMMENDATIONS
On the basis of the data from supervised trials the Meeting concluded that the residue levels listed below are suitable for establishing maximum residue limits and for IEDI and IESTI assessment.
Definition of the residue for compliance with maximum residue levels and estimation of dietary intake in plant and animal commodities: Cycloxydim, metabolites and degradation products which can be oxidized to 3-(3-thianyl) glutaric acid S-dioxide and 3-hydroxy-3-(3-thianyl) glutaric acid S-dioxide, expressed as cycloxydim.
The residue is not fat-soluble
Maximum residue level (mg/kg)
STMR (P) HR (P)
CCN Commodity name New Previous mg/kg mg/kg VD 0071 Beans, dry 30 2 4.4 VP 0061 Beans except broad bean & soya bean (green pods &
immature seeds) 15 0.35 11
VR 0574 Beetroot 0.2 0.09 0.10 VB 0040 Brassica (Cole or Cabbage) Vegetables, Head
Cabbage, Flowerhead Brassicas 9 2 1.95 6
VR 0577 Carrot 5 0.5 0.44 3 VR 0578 Celeriac 1 0.13 0.64 MO 0105 Edible offal (Mammalian) 0.5 0.098 0.403 PE 0112 Eggs 0.15 0.018 0.092 FB 0269 Grapes 0.3 0.5 0.11 0.18

Cycloxydim
374
Maximum residue level (mg/kg)
STMR (P) HR (P)
CCN Commodity name New Previous mg/kg mg/kg VL 0480 Kale 3 0.65 1.1 VA 0384 Leek 4 0.36 2.3 VL 0482 Lettuce, head 1.5 0.2 0.335 1 VL 0483 Lettuce, leaf 1.5 0.2 0.335 1 SO 0693 Linseed 7 1.9 MF 0100 Mammalian fats (except milk fats) 0.1 0.021 0.066 GC 0645 Maize 0.2 0.09 AS 0645 Maize fodder 3 0.247 1.1 MM 0095 Meat (from mammals other than marine mammals) 0.06 0.021 0.047 ML 0106 Milks 0.02 0.005 VA 0385 Onion, bulb 3 0.31 1.43 VP 0063 Peas (pods and succulent=immature seeds) W 1 VP 0072 Pea, dry 30 5.6 VP 0064 Peas, Shelled (succulent seeds) 15 2 2.7 VO 0051 Peppers 9 1.55 5.3 Peppers, chilli dried 90 15.5 53 FP 009 Pome fruits 0.09* 0.09 0.09 VR 0589 Potato 3 2 0.735 1.6 PM 0110 Poultry meat 0.03* 0 0.03 PF 0111 Poultry fats 0.03* 0 0.03 PO 0111 Poultry, edible offal of 0.02 0.005 0.014 SO 0495 Rape seed 7 2 1.9 GC 0649 Rice 0.09* 0.09 AS 0649 Rice straw or fodder 0.09 0.09 0.09 VD 4521 Soya bean (dry) 80 2 13 FS0012 Stone fruits 0.09* 0.09 0.09 FB 0275 Strawberry 3 0.5 0.53 1.4 VR 0596 Sugar beet 0.2 0.2 0.09 0.10 SO 0702 Sunflower seed 6 0.375 VR 0497 Swede 0.2 0.09 0.10 VO 0448 Tomato 1.5 0.445 0.84
Commodities for which no maximum residue levels were recommended
Commodity name STMR, mg/kg Highest residue, mg/kg Bean vines 0.77 2 Pea vines 1.8 9.0 Rape seed meal 2.85 Sugar beet leaves 0.09 0.50
DIETARY RISK ASSESSMENT
Long-term intake
The ADI for cycloxydim is 0–0.07 mg/kg bw. The International Estimated Daily Intakes (IEDI) for cycloxydim was estimated for the 13 GEMS/Food cluster diets using the STMR or STMR-P values estimated by the current JMPR. The results are shown in Annex 3 of the 2012 JMPR Report. The IEDI ranged from 7–50% of the maximum ADI. The Meeting concluded that the long-term intake of residues of cycloxydim from uses that have been considered by the JMPR is unlikely to present a public health concern.
Short-term intake
An ARfD for cycloxydim for women of childbearing age is 2 mg/kg bw; ARfD was unnecessary for the general population. The International Estimated Short-Term Intake (IESTI) for cycloxydim was calculated for the plant commodities for which STMRs, HRs and maximum residue levels were

Cycloxydim
375
estimated by the current Meeting and for which consumption data were available. The results are shown in Annex 4 of the 2012 JMPR Report. The IESTI represented a maximum of 10% of the ARfD for peppers, chili dried. The Meeting concluded that the short-term intake of cycloxydim residues from uses considered by the current Meeting was unlikely to present a public health concern.
REFERENCES Code Author(s) Year Title, Institute, Report reference 10961
Tuerk, W 1996a Determination of the appearance, the melting point and thermal conversions of Reg. No. 172 999 (PAI). BASF AG Agrarzentrum Limburgerhof, Germany. GLP, unpublished
1019582
Daum, A 2006a Amendment No. 1: Determination of the appearance, the melting point and thermal conversions of Reg. No. 172 999 (PAI). BASF AG Agrarzentrum Limburgerhof; Limburgerhof; Germany. GLP, unpublished
10654
Kaestel, R 1997a Physical and chemical properties report for BAS 517 23 H. BASF AG Agrarzentrum Limburgerhof; Limburgerhof; Germany. GLP, unpublished
10238
Kaestel, R 1997b Physical properties report for 172 999. BASF AG Agrarzentrum Limburgerhof; Limburgerhof; Germany. GLP, unpublished
10385
Kaestel, R 1997c Physical properties report for Cycloxydim. BASF AG Agrarzentrum Limburgerhof; Limburgerhof; Germany. GLP, unpublished
1013164
Ohnsorge, U 2000a Henry’s Law constant for Cycloxydim. BASF AG Agrarzentrum Limburgerhof; Limburgerhof; Germany. No GLP, unpublished
1017028
Kroehl, T 2007a UV/VIS spectrum in acidic medium of Cycloxydim PAI (Reg. No. 172 999, BAS 517 H) BASF AG Agrarzentrum Limburgerhof; Germany. GLP, unpublished
1009861
Kroehl, T 2008a UV/VIS spectrum in basic medium of Cycloxydim PAI (Reg. No. 172 999, BAS 517 H) BASF SE; Limburgerhof; Germany. GLP, unpublished
11669
Pawliczek, JB 1988a Determination of the solubility of Cycloxydim in water at various pH values. BASF AG Agrarzentrum Limburgerhof; Germany. GLP, unpublished
1021518
Class, T 2008a Cycloxydim (BAS 517 H): Determination of solubility in water at pH 4, pH 7 and pH 9. PTRL Europe GmbH; Ulm; Germany. GLP, unpublished
10949 Daum, A 1998a Determination of the solubility of BAS 517. H (Reg. No. 172 999) pure active ingredient (PAI) in organic solvents at 20 °C. BASF AG Agrarzentrum Limburgerhof; Germany. GLP, unpublished
1002594
Anonymous 1997a MT 181 solubility in organic solvents. CIPAC—Collaborative International Pesticides Analytical Council; Harpenden Hertfordshire AL5 2HG; United Kingdom. No GLP, unpublished
10545
Redeker, J 1988a Partition coefficient of Cycloxydim in the system n-octanol/water BASF AG Agrarzentrum Limburgerhof; Germany. GLP, unpublished
1090871
Hassink, J 2009a Aqueous hydrolysis of BAS 517 H. BASF SE; Limburgerhof; Germany. GLP, unpublished
1000143
von Goetz, N 2000a Aqueous photolysis of Cycloxydim (BAS 517 H). BASF AG Agrarzentrum Limburgerhof; Limburgerhof; Germany. GLP, unpublished
10557
Redeker, J 1988b Determination of the dissociation constant of Cycloxydim in water, BASF AG Agrarzentrum Limburgerhof; Germany. GLP, unpublished
10319
Sarafin, R 1991a Photochemical oxidative degradation of Cycloxydim (Atkinson) BASF AG Agrarzentrum Limburgerhof; Germany. No GLP, unpublished
10446 Loeffler, U 1997a Safety characteristics of the active ingredient Cycloxydim. BASF AG; Ludwigshafen/Rhein; Germany. GLP, unpublished
10655
Loeffler, U 1997b Safety characteristics of the crop protection product BAS 517 23 H BASF AG; Ludwigshafen/Rhein; Germany. GLP, unpublished
1013215
Loeffler, U 2000a Safety characteristics according to directive 92/69/EEC, annex A9-A17 BASF AG; Ludwigshafen/Rhein; Germany. GLP, unpublished
1013309 Bitterlich, S 2007a BAS 517 23 H: Evaluation of physical and chemical properties according to Directive 94/37/EC (67/548/EC Annex V). BASF AG; Ludwigshafen/Rhein; Germany. GLP, unpublished
0447
Halkins et al. 1985a The biokinetics and metabolism of 14C BAS 517 H sulphoxide in goats Huntingdon Research Centre Ltd.; Huntingdon Cambridgeshire PE18 6ES; United Kingdom. GLP, unpublished
1020044
Leibold & Hofmann
2001a 14C-BAS 517 H—Absorption, distribution and excretion after repeated oral administration in lactating goats. BASF AG; Ludwigshafen/Rhein; Germany. GLP, unpublished
1004484
Hafemann & Knoell
2003a The metabolism of 14C-BAS 517 H (Cycloxydim) in lactating goats BASF AG Agrarzentrum Limburgerhof; Limburgerhof; Germany. GLP, unpublished

Cycloxydim
376
Code Author(s) Year Title, Institute, Report reference 1004485
Leybold & Ravenzwaay
2002c 14C-BH 517-5-OH-TSO (Metabolite of BAS 517 H)—Absorption, distribution and excretion after repeated oral administration in lactating goats. BASF AG; Ludwigshafen/Rhein; Germany. GLP, unpublished
1013374
Tilting 2003b Report amendment No. 01 to final report: The metabolism of 14C-BH 517-5-OH-TSO (metabolite of BAS 517 H) in lactating goats. BASF AG Agrarzentrum Limburgerhof; Limburgerhof; Germany. GLP, unpublished
1004486
Tilting 2003a The metabolism of 14C-BH 517-5-OH-TSO (metabolite of BAS 517 H) in lactating goats. BASF AG Agrarzentrum Limburgerhof; Limburgerhof; Germany. GLP, unpublished
0441
Halkins et al. 1986a The biokinetics and metabolism of 14C-BAS 517 H sulphoxide in laying hens. Huntingdon Research Centre Ltd.; Huntingdon Cambridgeshire PE18 6ES; United Kingdom. GLP, unpublished
1005467 Leybold & Ravenzwaay
2002b 14C-BAS 517 H—Absorption, distribution and excretion after repeated oral administration in laying hens. BASF AG; Ludwigshafen/Rhein; Germany. GLP, unpublished
1004487
Fabian & Knoell
2003a The metabolism of 14C-BAS 517 H (Cycloxydim) in laying hens. BASF AG Agrarzentrum Limburgerhof; Limburgerhof; Germany. GLP, unpublished
1008435
Leybold & Ravenzwaay
2002a 14C-BH 517-5OH-TSO (Metabolite of BAS 517 H)—Absorption, distribution and excretion after repeated oral administration in laying hens. BASF AG; Ludwigshafen/Rhein; Germany. GLP, unpublished
1004488
Seiferlein 2003a The metabolism of 14C-BH 517-5-OH-TSO (Reg. No. 217 383), a metabolite of BAS 517 H, in laying hens. BASF AG Agrarzentrum Limburgerhof; Limburgerhof; Germany. GLP, unpublished
0443
Hamm 1985a Uptake and transport of BAS 517 H by soya bean, cotton and sugar beet seedlings. BASF AG Agrarzentrum Limburgerhof; Limburgerhof; Germany.No GLP, unpublished
0445
Huber & Schepers
1986a Investigations of the metabolism of BAS 517 H in sugar beets. BASF AG Agrarzentrum Limburgerhof; Limburgerhof; Germany. No GLP, unpublished
1005231
Veit 2002a Metabolism of 14C-BAS 517 H in sugar beet. BASF AG Agrarzentrum Limburgerhof; Limburgerhof; Germany. GLP, unpublished
0097
Beutel 1987a BAS 517 H—Accountability in potatoes. BASF AG Agrarzentrum Limburgerhof; Germany. No, unpublished
10990
Beutel 1987b BAS 517 H—Accountability in canola. BASF AG Agrarzentrum Limburgerhof; Germany. No GLP, unpublished
10989
Beutel 1987c BAS 517 H—Accountability in soy beans. BASF AG Agrarzentrum Limburgerhof; Germany. No GLP, unpublished
0444
Huber & Hamm
1986a Investigation of the metabolism of BAS 517 H (Cycloxydim) in soya beans. BASF AG Agrarzentrum Limburgerhof; Germany. No, unpublished
11209
Hofmann 1997b Plant uptake study with 14C-BAS 517 H [cyclohexene-14C] and maize (use rate: 400 g ai/ha, early application). BASF AG Agrarzentrum Limburgerhof; Germany. GLP, unpublished
11210
Hofmann 1997a Plant uptake study with 14C-BAS 517 H [cyclohexene-14C] and maize (use rate: 800 g ai/ha, late application). BASF AG Agrarzentrum Limburgerhof; Germany. GLP, unpublished
10282
Bross 1998a The metabolism of 14C-BAS 517 H (14C-Reg. No. 172 999) in Cycloxydim tolerant corn. BASF AG Agrarzentrum Limburgerhof; Germany. GLP, unpublished
1021185
Grosshans 2006a Cycloxydim (BAS 517 H): Summary information on plant metabolism studies regarding the E/Z-isomerization at the C = N bond. BASF AG Agrarzentrum Limburgerhof; Germany. No GLP, unpublished
0363
Huber 1987a The aerobic soil metabolism of BAS 517 H. BASF AG Agrarzentrum Limburgerhof; Limburgerhof; Germany. No GLP, unpublished
10160
Huber 1988a 1. Addendum to lab report 2432: The mineralization and additional metabolism investigations of Cycloxydim (BAS 517 H) in two freshly collected field soils. BASF AG Agrarzentrum Limburgerhof; Germany. GLP, unpublished
1000141
Bayer 2000a Aerobic degradation of Cycloxydim (BAS 517 H) in 3 different soils. BASF AG Agrarzentrum Limburgerhof; Germany. GLP, unpublished
1021374
Bayer 2006a Additional comments on study: Aerobic degradation of Cycloxydim (BAS 517 H) in 3 different soils, BASF Reg. Doc# 2000/1000141. BASF AG Agrarzentrum Limburgerhof; Germany. No GLP, unpublished
1005565
Hassink 2008a Metabolism of BAS 517 H in soil under aerobic conditions—Verification of unknown polar degradation products. BASF SE; Limburgerhof; Germany. GLP, unpublished
0444
Keller 1985c Soil photolysis of BAS 517 H. BASF AG Agrarzentrum Limburgerhof; Germany. No GLP, unpublished

Cycloxydim
377
Code Author(s) Year Title, Institute, Report reference 1012082
Veit 2002b Confined rotational crop study with 14C-BAS 517 H. BASF AG Agrarzentrum Limburgerhof; Germany. GLP, unpublished
0576
Beutel 1987 Cycloxydim—total method GLC final determination: Sugar beets, rapeseed, beans, potatoes, soya beans, peanuts, peas, grass/ soil. BASF AG Agrarzentrum Limburgerhof; Germany, no GLP, unpublished
10446
Beutel 1988a Cycloxydim—Total method GC final determination. BASF AG Agrarzentrum Limburgerhof; Germany. GLP, unpublished
10511
Herb 1988a Total Cycloxydim analysis method using calcium hydroxide precipitation BASF AG; Ludwigshafen/Rhein; Germany. GLP, unpublished
1007914
Tilting 2002a Validation of method 263/3: GC method for the determination of Cycloxydim (BAS 517 H) and its metabolites in various plant matrices. BASF AG Agrarzentrum Limburgerhof; Germany. GLP, unpublished
1010482
Tilting 2004a Amendment No. 1 to final report: Validation of method 263/3 GC method for the determination of Cycloxydim (BAS 517 H) and its metabolites in various plant matrices. BASF AG Agrarzentrum Limburgerhof; Germany. GLP, unpublished
1012387
Bross & Lehmann
2000a Independent lab validation of method 263 for the determination of Cycloxydim (BAS 517 H) and its metabolites in plant matrices. BASF AG Agrarzentrum Limburgerhof; Limburgerhof; Germany. unpublished
10774
Tillkes 1993a Validation of BASF-method 263 resp 263/1 for the residue determination of Cycloxydim and its metabolite 5-OH-TSO2 in scorzonera and chicory. Dr. Specht & Partner Chemische Laboratorien GmbH; Hamburg; Germany. GLP, unpublished
10068
Schulz 1995a Determination of residues of Cycloxydim in plant material and oil—Validation of the method. Institut Fresenius Chemische und Biologische Laboratorien GmbH; Taunusstein; Germany Fed. Rep. GLP, unpublished
10270
Schulz 1995b Addendum No. 1 to report: Determination of the residues of Cycloxydim in plant material and oil—Validation of the method. Institut Fresenius Chemische und Biologische Laboratorien GmbH; Taunusstein; Germany Fed. Rep. GLP, unpublished
1030173 Grosshans 2009a BASF method 263 for the determination of Cycloxydim (BAS 517 H) and its metabolites in various plant matrices: Summary of recovery data generated during analysis of sample material from supervised residue trials BASF SE; Limburgerhof; Germany. No GLP, unpublished
10830
Sasturain 1997b Validation of BASF method 407/0: Determination of Cycloxydim (Reg. No. 172 999) in onion matrices using HPLC-MS/MS determination. BASF AG Agrarzentrum Limburgerhof; Limburgerhof; Germany. GLP, unpublished
1000953
Lehmann & Mackenroth
2003b Validation of the analytical method 407/1: Method for the determination of BAS 517 H and its metabolite BH 517-5-OH-TSO2 in plant matrices. BASF AG Agrarzentrum Limburgerhof; Limburgerhof; Germany. GLP, unpublished
1035849
Richter 2011a Validation of BH 517-TSO, BH 517-T1SO, BH 517-T2SO and BH 517-5-OH-TSO with BASF Method No. L0018/01 in plant matrices. BASF SE; Limburgerhof; Germany. GLP, unpublished
1019855
Jones 2006b Validation study of the SOP-PA.0271 for determination of Cycloxydim and its metabolite residues in tomato, pepper, bean, grape, sunflower seed, green peas, soya bean, kale, onion, carrot, strawberry, lettuce and spinach. BASF SA; Resende; Brazil. GLP, unpublished
1000949
Bross & Mackenroth
2003b Validation of the analytical method 493/0: Determination of BH 517-TSO (Lab 211 725) in plant matrices by LC/LC/UV. BASF AG Agrarzentrum Limburgerhof; Germany. GLP, unpublished
1001416
Schylz 2003b Determination of BH 517-TSO (LAB 211725) in plant matrices by LC/LC/UV—Validation of the method no. 493/0. Institut Fresenius Chemische und Biologische Laboratorien AG; Taunusstein; Germany. GLP, unpublished
11342
Kampke-Thiel
1998b The independent validation of BASF method 982/0 for the determination of Cycloxydim (BAS 517 H) in matrices of animal origin. BASF AG Agrarzentrum Limburgerhof; Germany. GLP, unpublished
1004482
Grosshans 2003b Validation of BASF method 513/0: The determination of BH 517-TSO, BH 517-5-OH-TSO and BH 517-5OH-TS (metabolites of BAS 517 H) in animal matrices. BASF AG Agrarzentrum Limburgerhof; Limburgerhof; Germany. GLP, unpublished
1004483
Class 2002b Independent laboratory validation (ILV) of BASF method No. 513/0 for the determination of BH 517-TSO, BH 517-5-OH-TSO and BH 517-5-OH-TS (metabolites of BAS 517 H) in animal matrices. PTRL Europe GmbH; Ulm; Germany. GLP, unpublished

Cycloxydim
378
Code Author(s) Year Title, Institute, Report reference 1090650
Grosshans & Mackenroth
2009b Validation of BASF method L0105/01: Method for the determination of Cycloxydim (BAS 517 H) and its metabolites in animal matrices BASF SE; Limburgerhof; Germany. GLP, unpublished
1025505
Richter 2011b Validation of BH 517-TSO, BH 517-T1SO, BH 517-TSO2, BH 517-T2SO, BH 517-T1SO2, BH 517-5-OH-TSO and BH 517-5-OH-TS with BASF Method No. L0105/01 in animal matrices. BASF SE; Limburgerhof; Germany.. GLP, unpublished
7019237
Zhang 2009b Independent laboratory validation of BASF method number L0105/01: Method for the determination of Cycloxydim (BAS 517 H, Reg. No. 172999) in animal matrices. Alliance Pharma Inc.; Malvern PA; United States of America. GLP, unpublished
11454
Tilting 1992a Two years storage stability study of Cycloxydim metabolites. BASF AG Agrarzentrum Limburgerhof; Limburgerhof; Germany. GLP, unpublished
1004113
Lehmann & Mackenroth
2003a Investigation of the storage stability of BAS 517 H (Cycloxydim) residues in plant matrices under usual storage conditions. BASF AG Agrarzentrum Limburgerhof; Germany. GLP, unpublished
1090653
Grosshans & Kloeppner
2009a Stability of BAS 517 H and its metabolites in representative samples generated during animal metabolism studies. BASF SE; Limburgerhof; Germany. GLP, unpublished
1020716
2007a Study on the residue behavior of Cycloxydim in apple and pear after soil application of BAS 517 24 H under field conditions in Italy and Spain, 2006 Agrologia SL; Palomares; Spain. GLP, unpublished
11589 Specht, W 1993b Residues of Cycloxydim in apricots. Dr. Specht & Partner Chemische Laboratorien GmbH; Hamburg; Germany. GLP, unpublished
1991/11588
Specht W. 1993a Residues of Cycloxydim in peaches. Dr. Specht & Partner Chemische Laboratorien GmbH; Hamburg; Germany. GLP, unpublished
1020717
Schroth, E & Martin, T
2007b Study on the residue behavior of Cycloxydim in grape after soil application of BAS 517 24 H under field conditions in France (North and South), Germany, Greece, Italy, and Spain, 2006. Agrologia SL; Palomares; Spain. GLP unpublished
1030352
Schulz, H 2006a Study on the residue behaviour of Cycloxydim and its metabolites in grapes after soil treatment with BAS 517 24 H under field conditions in France (N & S), Germany, Italy and Greece, 2005. SGS Institut Fresenius GmbH; Taunusstein; Germany Fed. Rep. GLP, unpublished
1069375 Schaeufele, M
2009a Residue study (decline) with BAS 517 24 H applied to strawberries (field) in the UK, Germany and the Netherlands in 2008. Huntingdon Life Sciences Ltd.; Huntingdon Cambridgeshire PE28 4HS; United Kingdom. GLP, unpublished
1020730
Schroth, E & Martin, T
2007c Study on the residue behavior of Cycloxydim in strawberry after the application of BAS 517 24 H under field conditions in France (South), Greece, Italy and Spain, 2006. Agrologia SL; Palomares; Spain. GLP, unpublished
1102127
Schroth, E 2009c Amendment No. 1: Study on the residue behavior of Cycloxydim in strawberry after the application of BAS 517 24 H under field conditions in France (South), Greece, Italy and Spain, 2006. Agrologia SL; Palomares; Spain. GLP unpublished
1026946
Schroth, E 2006a Study on the residue behavior of Cycloxydim (BAS 517 H) in strawberries after the application of BAS 517 24 H under field conditions in France, Greece, Italy and Spain, 2005. Agrologia SL; Palomares; Spain. GLP, unpublished
10554
Beck, J & Sasturain, J
1997a Study on the residue behaviour of Cycloxydim in strawberries after treatment with Laser (BAS 517 01 H) under field conditions in Great Britain, 1995 BASF AG Agrarzentrum Limburgerhof; Limburgerhof; Germany. GLP. unpublished
12145
Regenstein, H 1992a Residues of Cycloxydim in strawberries. BASF AG Agrarzentrum Limburgerhof; Limburgerhof; Germany. GLP, unpublished
1029595
Schulz, H 2006b Study on the residue behaviour of Cycloxydim and its metabolites in bulb onions (field) after treatment with BAS 517 24 H under field conditions in France (N & S), England, Sweden, The Netherlands, Italy, Spain and Greece, 2005. SGS Institut Fresenius GmbH; Taunusstein; Germany Fed. Rep. GLP, unpublished
1007586
Perez, J & Lehmann, A
2004a Study on the residue of Cycloxydim after post-emergency treatment with BAS 517 24 H in onions under field test conditions in Spain, 2001. BASF AG Agrarzentrum Limburgerhof; Limburgerhof; Germany. GLP, unpublished
1001289
Schulz, H 2003a Determination of the residues of Cycloxydim and its metabolite in onions and processed products following treatment with BAS 517 24 H under field conditions in Italy and Greece 2001. Institut Fresenius Chemische und Biologische Laboratorien AG; Taunusstein; Germany. GLP, unpublished

Cycloxydim
379
Code Author(s) Year Title, Institute, Report reference 1001250
Smalley, R 2003b Field residue and processing study on BAS 517 H in onions after application of BAS 517 24 H under field conditions in Spain, 2002. BASF plc; Gosport Hampshire PO13 0AU; United Kingdom. GLP, unpublished
10561 Beck, J & Sasturain, J
1997b Study on the residue behaviour of BAS 517 H (Cycloxydim) in salad-onions after treatment with Laser (BAS 517 01 H) under field conditions in Great Britain, 1995. BASF AG Agrarzentrum Limburgerhof; Germany. GLP, unpublished
1075171
Oxspring, S 2009e Study on the residue behaviour of BAS 517 H in leek after treatment with BAS 517 24 H under field conditions in Northern Europe during 2007. Agrisearch UK Ltd.; Melbourne Derbyshire DE73 8AG; United Kingdom. GLP, unpublished
1020726
Schroth, E & Martin, T
2007m Study on the residue behavior of Cycloxydim in leek after the application of BAS 517 24 H under field conditions in France (South), Greece, Italy and Spain, 2006. Agrologia SL; Palomares; Spain. GLP, unpublished
12153
Regenstein, H 1992a Residues of Cycloxydim in leeks—BAS 517 01 H. BASF AG Agrarzentrum Limburgerhof; Germany. No GLP, unpublished
12146 Regenstein, H 1992b Residues of Cycloxydim in leeks. BASF AG Agrarzentrum Limburgerhof; Germany. GLP, unpublished
1020721
Schroth, E & Martin, T
2007j Study on the residue behavior of Cycloxydim in head cabbage after the application of BAS 517 24 H under field conditions in Belgium, France (North), Germany and United Kingdom, 2006. Agrologia SL; Palomares; Spain. GLP, unpublished
1007718
Jones, S 2002a Study on the residue behaviour of BAS 517 H in cauliflower and cabbages after application of BAS 517 24 H under field conditions in Spain, France (S), Italy, Greece, 2001.BASF plc; Gosport Hampshire PO13 0AU; United Kingdom. GLP, unpublished
1004111
Trewhitt, J et al.
2002a Study on the residue behaviour of Cycloxydim in white cabbage and cauliflower after application of BAS 517 24 H under field conditions in Belgium, France (N), United Kingdom and Sweden, 2001. BASF AG Agrarzentrum Limburgerhof; Germany. GLP, unpublished
1012095
Trewhitt, J et al.
2002b Report amendment No. 1 to final report: Study on the residue behaviour of Cycloxydim in white cabbage and cauliflower after application of BAS 517 24 H under field conditions in Belgium, France (N), United Kingdom and Sweden, 2001. BASF AG Agrarzentrum Limburgerhof; Limburgerhof; Germany. GLP, unpublished
1020722
Schroth, E & Martin, T
2007i Study on the residue behavior of Cycloxydim in Brussels sprouts after the application of BAS 517 24 H under field conditions in France (North and South), Germany, Netherlands, Spain and United Kingdom, 2006 Agrologia SL; Palomares; Spain. GLP, unpublished
1034211 Schulz, H 2007a Study on the residue behaviour of Cycloxydim and its metabolite in Brussels sprouts (field) after treatment with BAS 517 24 H under field conditions in France (N), England, Sweden, Belgium, Italy and Greece, 2005. SGS Institut Fresenius GmbH; Taunusstein; Germany Fed. Rep. GLP, unpublished
1020720
Schroth, E & Martin, T
2007h Study on the residue behavior of Cycloxydim in cauliflower after the application of BAS 517 24 H under field conditions in France (North), Germany, Sweden and United Kingdom, 2006. Agrologia SL; Palomares; Spain. GLP, unpublished
1075174
Oxspring, S 2009d Study on the residue behaviour of BAS 517 H in curly kale and Chinese cabbage after treatment with BAS 517 24 H under field conditions in Northern and Southern Europe during 2007. Agrisearch UK Ltd.; Melbourne Derbyshire DE73 8AG; United Kingdom. GLP, unpublished
1020723
Schroth, E & Martin, T
2007k Study on the residue behavior of Cycloxydim in curly kale after the application of BAS 517 24 H under field conditions in France (North and South), Netherlands and Spain 2006. Agrologia SL; Palomares; Spain. GLP, unpublished
1020719
Schroth, E & Martin, T
2007g Study on the residue behavior of Cycloxydim in pepper after the application of BAS 517 24 H under field conditions in France (South), Italy and Spain 2006 Agrologia SL; Palomares; Spain. GLP, unpublished
1025871
Schroth, E 2006c Study on the residue behavior of Cycloxydim (BAS 517 H) in peppers after the application of BAS 517 24 H under field conditions in Greece, Italy and Spain, 2005. Agrologia SL; Palomares; Spain. GLP, unpublished
11315
Regenstein, H 1993c Residues of Cycloxydim in peppers. BASF AG Agrarzentrum Limburgerhof; Limburgerhof; Germany. GLP, unpublished
Cycloxydim
380
Code Author(s) Year Title, Institute, Report reference 1020718
Schroth, E & Martin, T
2007f Study on the residue behavior of Cycloxydim in tomato after the application of BAS 517 24 H under field conditions in France (North and South), Germany, Greece, Italy, Netherlands and Spain 2006. Agrologia SL; Palomares; Spain GLP, unpublished
1024331
Schroth, E 2006d Study on the residue behavior of Cycloxydim (BAS 517 H) in tomato after the application of BAS 517 24 H under field conditions in France, Germany, Greece, Italy, Netherlands and Spain, 2005. Agrologia SL; Palomares; Spain GLP, unpublished
1069374
Schaeufele, M
2009b Residue study (decline) with BAS 517 24 H applied to lettuces in Italy and Spain in 2008. Huntingdon Life Sciences Ltd.; Huntingdon Cambridgeshire PE28 4HS; United Kingdom. GLP, unpublished
1102131
Schroth, E 2009d Amendment No. 1: Study on the residue behavior of Cycloxydim in head lettuce after the application of BAS 517 24 H under field conditions in France (South), Greece, Italy and Spain, 2006. Agrologia SL; Palomares; Spain GLP, unpublished
1020724 Schroth, E & Martin, T
2007l Study on the residue behavior of Cycloxydim in head lettuce after the application of BAS 517 24 H under field conditions in France (South), Greece, Italy and Spain, 2006. Agrologia SL; Palomares; Spain. GLP, unpublished
1029325
Schroth, E 2007a Study on the residue behavior of Cycloxydim (BAS 517 H) in head lettuce after the application of BAS 517 24 H under field conditions in France, Germany, Greece, Italy and Spain, 2005. Agrologia SL; Palomares; Spain GLP, unpublished
1015935
Schulz, H 2005a Processing and field residue study on the residue behaviour of Cycloxydim in lettuce after application of BAS 517 24 H under field conditions in North France, Denmark and Sweden, 2003. SGS Institut Fresenius GmbH; Taunusstein; Germany Fed. Rep. GLP, unpublished
1008792
Trewhitt, J et al.
2002c Study on the residue behaviour of Cycloxydim in head lettuce after application of BAS 517 24 H under field conditions in Denmark and France (N), 2001 BASF AG Agrarzentrum Limburgerhof; Germany. GLP, unpublished
1029326
Schroth, E 2007b Study on the residue behavior of Cycloxydim (BAS 517 H) in spinach after the application of BAS 517 24 H under field conditions in France, Germany, Greece, Italy and Spain, 2005. Agrologia SL; Palomares; Spain. GLP, unpublished
1067444
Schaeufel, M 2009c Residue study (decline) with BAS 517 24 H applied to fresh beans (dwarf french) in Belgium, Germany, The UK, Northern France and The Netherlands in 2008. Huntingdon Life Sciences Ltd.; Huntingdon Cambridgeshire PE28 4HS; United Kingdom. GLP, unpublished
1001265
Schulz, H 2003b Determination of the residues of Cycloxydim and its metabolite in beans following treatment with BAS 517 24 H under field conditions in Italy, Spain, Southern France and Greece 2001. Institut Fresenius Chemische und Biologische Laboratorien AG; Taunusstein; Germany. GLP, unpublished
1031719
Schulz, H 2006c Study on the residue behaviour of Cycloxydim and its metabolite in green beans (Phaseolus, field) after treatment with BAS 517 24 H under field conditions in France (N & S), England, Sweden, Belgium, Italy, Spain and Greece, 2005. SGS Institut Fresenius GmbH; Taunusstein; Germany Fed. Rep. GLP, unpublished
1013496
Mayer, F 2000b Summary of residue data: Cycloxydim in beans. BASF AG Agrarzentrum Limburgerhof; Germany. No GLP, unpublished
1102116
Schroth, E 2009e Amendment No. 1: Study on the residue behavior of Cycloxydim in green peas after the application of BAS 517 24 H under field condtions in France (North and South), Greece, Germany, Italy, Netherlands, Spain and United Kingdom, 2006. Agrologia SL; Palomares; Spain.GLP, unpublished
1020725
Schroth, E &, Martin, T
2007q Study on the residue behavior of Cycloxydim in green peas after the application of BAS 517 24 H under field conditions in France (North and South), Greece, Germany, Italy, Netherlands, Spain and United Kingdom, 2006. Agrologia SL; Palomares; Spain. GLP, unpublished
1034132
Schulz, H 2007b Study on the residue behaviour of Cycloxydim and its metabolite in green peas (field) after treatment with BAS 517 24 H under field conditions in France (N & S), England, Sweden, The Netherlands, Italy, Spain and Greece, 2005 SGS Institut Fresenius GmbH; Taunusstein; Germany Fed. Rep. GLP, npublished
10698
Anonymous 1989d Pflanzenschutzmittel-Rueckstaende–Erbsen. BASF AG Agrarzentrum Limburgerhof; Limburgerhof; Germany. No GLP, unpublished
10697
Anonymous 1989e Pflanzenschutzmittel-Rueckstaende–Erbsen. BASF AG Agrarzentrum Limburgerhof; Limburgerhof; Germany. No GLP, unpublished

Cycloxydim
381
Code Author(s) Year Title, Institute, Report reference 1102124
Schroth, E 2009f Amendment No. 2: Study on the residue behavior of Cycloxydim in dry beans (Vicia faba) after the application of BAS 517 24 H under field conditions in France (North and South), Germany, Greece, Italy, Netherlands and Spain, 2006. Agrologia SL; Palomares; Spain., GLP, unpublished
1019231
Schroth, E 2009a Amendment No. 1: Study on the residue behavior of Cycloxydim in dry beans (Vica faba) after the application of BAS 517 24 H under field conditions in France (North and South), Germany, Greece, Italy, Netherlands and Spain, 2006. Agrologia SL; Palomares; Spain. GLP, unpublished
1020731
Schroth, E & Martin, T
2007n Study on the residue behavior of Cycloxydim in dry beans (Vicia faba) after the application of BAS 517 24 H under field conditions in France (North and South), Germany, Greece, Italy, Netherlands and Spain, 2006. Grologia SL; Palomares; Spain. GLP, unpublished
1024330
Schulz, H 2006d Study on the residue behaviour of Cycloxydim and its metabolite in dry beans (Vicia faba) after treatment with BAS 517 24 H under field conditions in France (N & S), England, Sweden, Denmark, Italy, Spain and Greece, 2005 SGS Institut Fresenius GmbH; Taunusstein; Germany Fed. Rep. GLP, unpublished
1001266
Schulz, H 2003c Determination of the residues of Cycloxydim and its metabolite in dry beans (Vicia faba) following treatment with BAS 517 24 H under field conditions in Italy and Spain 2001 and in Greece 2002. Institut Fresenius Chemische und Biologische Laboratorien AG; Taunusstein; Germany. GLP, unpublished
1013496
Mayer, F 2000b Summary of residue data: Cycloxydim in beans. BASF AG Agrarzentrum Limburgerhof; Limburgerhof; Germany. No GLP, unpublished
1009633
Grosshans, F 2006b Summary of residue data: Cycloxidim in peas. BASF AG Agrarzentrum Limburgerhof; Germany. No GLP, unpublished
1001263
Schulz, H 2004a Determination of the residues of Cycloxydim and its metabolites in dry peas following treatment with BAS 517 24 H under field conditions in Greece 2002 Institut Fresenius Chemische und Biologische Laboratorien AG; Taunusstein; Germany. GLP, unpublished
1001252
Smalley, R 2003c Study on the residue behaviour of BAS 517 H in dry peas after application of BAS 517 24 H under field conditions in Italy, France South and Spain, 2002 BASF plc; Gosport Hampshire PO13 0AU; United Kingdom. GLP, unpublished
1001251
Smalley, R 2003d Study on the residue behaviour of Cycloxidim in peas after application of BAS 517 24 H under field conditions in France (S), Spain, Italy and Greece, 2001 BASF plc; Gosport Hampshire PO13 0AU; United Kingdom. GLP unpublished
1075175
Oxspring, S 2009f Study on the residue behaviour of BAS 517 H in soya bean after treatment with BAS 517 24 H under field conditions in Southern Europe during 2007 Agrisearch UK Ltd.; Melbourne Derbyshire DE73 8AG; United Kingdom. GLP unpublished
1020732
Schroth, E & Martin, T
2007p Study on the residue behavior of Cycloxydim in soya beans after the application of BAS 517 24 H under field conditions in France (South), Germany, Italy, Netherlands and Spain, 2006. Agrologia SL; Palomares; Spain. GLP, unpublished
1030315
Schulz, H 2006f Study on the residue behaviour of Cycloxydim and its metabolite in soya bean after treatment with BAS 517 24 H under field conditions in France (N & S), Germany, Italy and Spain, 2005. SGS Institut Fresenius GmbH; Taunusstein; Germany Fed. Rep. GLP, unpublished
1075173
Oxspring, S 2009b Study on the residue behaviour of BAS 517 H in carrot after treatment with BAS 517 24 H under field conditions in Northern and Southern Europe during 2007. Agrisearch UK Ltd.; Melbourne Derbyshire DE73 8AG; United Kingdom. GLP, unpublished
1025865
Schroth, E 2006b Study on the residue behavior of Cycloxydim (BAS 517 H) in carrots after the application of BAS 517 24 H under field conditions in France, Greece, Italy and Spain, 2005. Agrologia SL; Palomares; Spain. GLP, unpublished
1004555
Jones, S 2003a Study on the residue behaviour of BAS 517 H in carrots after application of BAS 517 24 H under field conditions in France (S), Italy, Greece, 2001 BASF plc; Gosport Hampshire PO13 0AU; United Kingdom. GLP, unpublished
1075172
Oxspring, S 2009c Study on the residue behaviour of BAS 517 H in celeriac after treatment with BAS 517 24 H under field conditions in Northern and Southern Europe during 2007. Agrisearch UK Ltd.; Melbourne Derbyshire DE73 8AG; United Kingdom. GLP, unpublished
1020727 Schroth, E & Martin, T
2007e Study on the residue behavior of Cycloxydim in celeriac after the application of BAS 517 24 H under field conditions in France (North), Germany, Italy and Spain, 2006. Agrologia SL; Palomares; Spain. GLP, unpublished

Cycloxydim
382
Code Author(s) Year Title, Institute, Report reference 1020729
Schroth, E & Martin, T
2007d Study on the residue behavior of Cycloxydim in potato after the application of BAS 517 24 H under field conditions in France (North), Germany, Netherlands and United Kingdom, 2006. Agrologia SL; Palomares; Spain. GLP, unpublished
1090754
Oxspring, S 2009a Study on the residue behaviour of BAS 517 H in potato after treatment with BAS 517 24 H under field conditions in Northern and Southern Europe during 2007. Agrisearch UK Ltd.; Melbourne Derbyshire DE73 8AG; United Kingdom. GLP, unpublished
1013495
Mayer, F 2000a Summary of residue data: Cycloxydim in potatoes. BASF AG Agrarzentrum Limburgerhof; Germany. No GLP, unpublished
1005446
Smalley, R 2003a Study on the residue behaviour of Cycloxydim in potatoes after application of BAS 517 24 H under field conditions in France (S), Spain, Italy and Greece, 2001. BASF plc; Gosport Hampshire PO13 0AU; United Kingdom. GLP, unpublished
11354
Regenstein, H 1993a Residues of Cycloxydim in turnips. BASF AG Agrarzentrum Limburgerhof; Limburgerhof; Germany. GLP, unpublished
11355
Regenstein, H 1993b Residues of Cycloxydim in turnips. BASF AG Agrarzentrum Limburgerhof; Germany. GLP, unpublished
10712
Anonymous 1988e Pesticide residue analysis—Swedish turnip. BASF AG Agrarzentrum Limburgerhof; Germany. No GLP, unpublished
10702
Anonymous 1988f Pesticide residue analysis—Swedish turnip. BASF AG Agrarzentrum Limburgerhof; Germany. No GLP, unpublished
1001264
Schulz, H 2003e Determination of the residues of Cycloxydim and its metabolite in sugar-beets following treatment with BAS 517 24 H under field conditions in Italy and Greece 2001. Institut Fresenius Chemische und Biologische Laboratorien AG; Taunusstein; Germany. GLP, unpublished
1013494 Mayer, F 2000d Summary of residue data: Cycloxydim in sugar beet. BASF AG Agrarzentrum Limburgerhof; Germany. No GLP, unpublished
10456
Beck, J et al. 1997a Study on the residue behaviour of BAS 517 H (Cycloxydim) in Cycloxydim tolerant maize after one application with BAS 517 22 H under field conditions in France, Germany and Spain, 1995. BASF AG Agrarzentrum Limburgerhof; Germany. GLP, unpublished
10417
Schulz, H .
1997a Determination of the residues of BAS 517 H in Cycloxydim-tolerant maize following treatment with BAS 517 22 H under field conditions in Italy 1995 Institut Fresenius Chemische und Biologische Laboratorien GmbH; Taunusstein; Germany Fed. Rep. GLP, unpublished
10518
Beck, J & Schulz, H
1997a Study on the residue behaviour of BAS 517 H (Cycloxydim) in Cycloxydim-tolerant maize after one application with BAS 517 22 H under field conditions in France, Germany and Spain, 1996. BASF AG Agrarzentrum Limburgerhof; Germany. GLP, unpublished
10403
Schulz, H 1997b Determination of the residues of BAS 517 H in Cycloxydim-tolerant maize following treatment with BAS 517 22 H under field conditions in Italy 1996 Institut Fresenius Chemische und Biologische Laboratorien GmbH; Taunusstein; Germany Fed. Rep. GLP, unpublished
10302
Schulz, H 1997c Determination of the residues of Cycloxydim in rice following a pre-sowing treatment of the test field with BAS 517 22 H under field conditions in Italy 1996. Institut Fresenius Chemische und Biologische Laboratorien GmbH; Taunusstein; Germany Fed. Rep. GLP, unpublished
10290
Schulz, H 1997d Determination of the residues of Cycloxydim in rice following a pre-sowing treatment of the test field with BAS 517 22 H under field conditions in Italy 1995. Institut Fresenius Chemische und Biologische Laboratorien GmbH; Taunusstein; Germany Fed. Rep. GLP, unpublished
11605 Anonymous 1994e Pesticide residue analysis—Rice. BASF AG Agrarzentrum Limburgerhof; Limburgerhof; Germany. No GLP, unpublished
11604
Anonymous 1994f Pesticide residue analysis—Rice. BASF AG Agrarzentrum Limburgerhof; Germany. No GLP, unpublished
11603
Anonymous 1994g Pesticide residue analysis—Rice. BASF AG Agrarzentrum Limburgerhof; Limburgerhof; Germany. No GLP, unpublished
1067445
Schaeufele, M
2009e Residue study (decline) with BAS 517 24 H applied to winter oilseed rape in the UK, Northern France, Belgium, The Netherlands and Germany in 2008 Huntingdon Life Sciences Ltd.; Huntingdon Cambridgeshire PE28 4HS; United Kingdom. GLP, unpublished
1001253
Smalley, R 2003e Study on the residue behaviour of BAS 517 H in winter rape after application of BAS 517 24 H under field conditions in Italy, France South and Spain, 2002 BASF plc; Gosport Hampshire PO13 0AU; United Kingdom. GLP, unpublished

Cycloxydim
383
Code Author(s) Year Title, Institute, Report reference 1001267
Schulz, H 2003d Determination of the residues of Cycloxydim and its metabolite in winter rape following treatment with BAS 517 24 H under field conditions in Italy, Spain and Southern France 2001. Institut Fresenius Chemische und Biologische Laboratorien AG; Taunusstein; Germany. GLP, unpublished
1013493
Mayer, F 2000c Summary of residue data: Cycloxydim in oilseed rape. BASF AG Agrarzentrum Limburgerhof; Limburgerhof; Germany. No GLP, unpublished
1069373
Schaeufele, M
2009d Residue study (decline) with BAS 517 24 H applied to sunflowers in Belgium and Germany in 2008. Huntingdon Life Sciences Ltd.; Huntingdon. Bridgeshire PE28 4HS; United Kingdom. GLP, unpublished
1020733
Schroth, E & Martin, T
2007o Study on the residue behavior of Cycloxydim in sunflower after the application of BAS 517 24 H under field conditions in France (South), Greece, Italy, Netherlands, Spain and United Kingdom, 2006. Agrologia SL; Palomares; Spain. GLP, unpublished
1034026
Schulz, H 2006e Study on the residue behaviour of Cycloxydim and its metabolite in sunflower after treatment with BAS 517 24 H under field conditions in France (N & S), Italy, Spain and Greece, 2005. SGS Institut Fresenius GmbH; Taunusstein; Germany Fed. Rep. GLP, unpublished
1015931
Schulz, H 2004b Determination of the residues of Cycloxydim and its metabolites in sunflower following treatment with BAS 517 24 H under field conditions in Italy, Southern France and Greece 2001. Institut Fresenius Chemische und Biologische Laboratorien AG; Taunusstein; Germany. GLP, unpublished
1015930
Schulz, H 2004c Determination of the residues of Cycloxydim and its metabolites in sunflower following treatment with BAS 517 24 H under field conditions in Southern France and Greece 2002. Institut Fresenius Chemische und Biologische Laboratorien AG; Taunusstein; Germany. GLP, unpublished
10368
Schulz, H 1995a Determination of the residues of Cycloxydim in sunflowers following treatment with BAS 517 01 H under field conditions in Italy 1993 Institut Fresenius Chemische und Biologische Laboratorien GmbH; Taunusstein; Germany Fed. Rep. GLP, unpublished
10419
Schulz, H 1995b Addendum No. 1 to the report: Determination of the residues of Cycloxydim in sunflowers following treatment with BAS 517 01 H under field conditions in Italy 1993. Institut Fresenius Chemische und Biologische Laboratorien GmbH; Taunusstein; Germany Fed. Rep. GLP, unpublished
1000144 von Goetz, N 2000a Hydrolysis of BAS 517 H (Cycloxydim) at 90 °C, 100 °C, and 120 °C. BASF AG Agrarzentrum Limburgerhof; Limburgerhof; Germany. GLP, unpublished
1065669
Harant, H 2009a Determination of residues of BAS 517 H in strawberries and its processed products after one application of BAS 517 24 H in Germany. BioChem agrar Labor fuer biologische und chemische Analytik GmbH; Gerichshain; Germany. GLP unpublished
1001268
Schulz, H 2003f Determination of the residues of Cycloxydim and its metabolite in potatoes and processed products following treatment with BAS 517 24 H under field conditions in Germany and Italy 2001 Institut Fresenius Chemische und Biologische Laboratorien AG; Taunusstein; Germany. GLP, unpublished
1026923 Reichert, N 2005a Determination of the residues of Cycloxydim and its metabolites in carrots and processed products following treatment with BAS 517 24 H under field conditions in Germany and Italy 2001. SGS Institut Fresenius GmbH; Taunusstein; Germany Fed. Rep. GLP, unpublished
1001289
Schulz, H 2003a Determination of the residues of Cycloxydim and its metabolite in onions and processed products following treatment with BAS 517 24 H under field conditions in Italy and Greece 2001. Institut Fresenius Chemische und Biologische Laboratorien AG; Taunusstein; Germany. GLP, unpublished
1065670
Harant, H 2009b Determination of residues of BAS 517 H in tomato and its processed products after one application of BAS 517 24 H in Germany. BioChem agrar Labor fuer biologische und chemische Analytik GmbH; Gerichshain; Germany. GLP, unpublished
1015935
Schulz, H 2005a Processing and field residue study on the residue behaviour of Cycloxydim in lettuce after application of BAS 517 24 H under field conditions in North France, Denmark and Sweden, 2003. SGS Institut Fresenius GmbH; Taunusstein; Germany Fed. Rep. GLP, unpublished
1000247
Beck, J et al. 2000a Determination of residues of Cycloxydim in raw and processed commodities of combining peas following treatment with BAS 517 01 H (= Laser) under field conditions in Great Britain, 1994. BASF AG Agrarzentrum Limburgerhof; Germany. GLP, unpublished

Cycloxydim
384
Code Author(s) Year Title, Institute, Report reference 1001269
Reichert, N 2003a Determination of the residues of Cycloxydim and its metabolite in peas and processed products following treatment with BAS 517 24 H under field conditions in Germany and Southern France 2001. Institut Fresenius Chemische und Biologische Laboratorien AG; Taunusstein; Germany. GLP, unpublished
10658
Steggles, HA 1992a Residues of Cycloxydim in oilseed rape seed, oil, meal and whole plant following the application of two different formulations of BAS 517 H in the UK in 1990. BASF UK; Hadleigh Suffolk IP7 6BQ; United Kingdom. No GLP, unpublished
1001270
Schulz, H 2003g Determination of the residues of Cycloxydim and its metabolite in rape and processed products following treatment with BAS 517 24 H under field conditions in Germany and Spain 2001. Institut Fresenius Chemische und Biologische Laboratorien AG; Taunusstein; Germany. GLP, unpublished
10368
Schulz, H 1995a Determination of the residues of Cycloxydim in sunflowers following treatment with BAS 517 01 H under field conditions in Italy 1993. Institut Fresenius Chemische und Biologische Laboratorien GmbH; Taunusstein; Germany Fed. Rep. GLP, unpublished
10419
Schulz, H 1995b Addendum No. 1 to the report: Determination of the residues of Cycloxydim in sunflowers following treatment with BAS 517 01 H under field conditions in Italy 1993. Institut Fresenius Chemische und Biologische Laboratorien GmbH; Taunusstein; Germany Fed. Rep. GLP, unpublished
1008084
Reichert, N 2006a Determination of the residues of Cycloxydim and its metabolite in white cabbage and processed products following treatment with BAS 517 24 H under field conditions in Germany and Southern France 2001. SGS Institut Fresenius GmbH; Taunusstein; Germany Fed. Rep. GLP, unpublished
1177209 Hopf, B et al. 2011a A meat and egg magnitude of the residue study with BAS 517 H (Cycloxydim) and its metabolite BH 517-5-OH-TSO in laying hens; reanalysis of specimen using the common moiety method. BASF SE; Limburgerhof; Germany. GLP, unpublished
1004490
Grosshans, F & Kampke-Thiel, K
2003a A meat and egg magnitude of the residue study with BAS 517 H (Cycloxydim) and BH 517-5-OH-TSO (Reg. No. 217 383, metabolite of BAS 517 H) in laying hens. BASF AG Agrarzentrum Limburgerhof; Germany. GLP, unpublished
1090651
Grosshans, F 2009a A meat and milk magnitude of the residue study with BAS 517 H. Cycloxydim) and its metabolite BH 517-5-OH-TSO in lactating dairy cows—Reanalysis of specimen using the common moiety method. BASF SE; Limburgerhof; Germany. GLP, unpublished
1004489
Seiferlein, M & Kampke-Thiel, K
2003a A meat and milk magnitude of the residue study with BAS 517 H (Cycloxydim) and BH 517-5-OH-TSO (Reg. No. 217 383, a metabolite of BAS 517 H) in lactating dairy cows. BASF AG Agrarzentrum Limburgerhof; Germany. GLP, unpublished


![Proposal for Harmonised Classification and Labelling - ECHAecha.europa.eu/documents/10162/13626/clh_cycloxydim_en.pdf · CLH REPORT FOR [CYCLOXYDIM] 5 Part A. 1 PROPOSAL FOR HARMONISED](https://static.fdocuments.us/doc/165x107/5e1d9a7be43ffb58fc14c228/proposal-for-harmonised-classification-and-labelling-clh-report-for-cycloxydim.jpg)