Cycling of a Lithium‐Ion Battery with a Silicon Anode ... · Drives Large Mechanical Actuation...
8
© 2016 WILEY-VCH Verlag GmbH & Co. KGaA, Weinheim 10236 wileyonlinelibrary.com COMMUNICATION Cycling of a Lithium-Ion Battery with a Silicon Anode Drives Large Mechanical Actuation Jialiang Lang, Bin Ding, Ting Zhu, Hanxiao Su, Hao Luo, Longhao Qi, Kai Liu, Ke Wang, Naveed Hussain, Chunsong Zhao, Xiaoyan Li,* Huajian Gao, and Hui Wu* J. Lang, H. Su, Prof. L. Qi, Prof. K. Liu, Prof. K. Wang, N. Hussain, C. Zhao, Prof. H. Wu State Key Laboratory of New Ceramics and Fine Processing School of Materials Science and Engineering Tsinghua University Beijing 100084, China E-mail: [email protected] B. Ding, Prof. H. Gao School of Engineering Brown University Providence, RI 02912, USA B. Ding, Prof. X. Li Centre for Advanced Mechanics and Materials CNMM, Applied Mechanics Laboratory Department of Engineering Mechanics Tsinghua University Beijing 100084, China E-mail: [email protected] Prof. T. Zhu, H. Luo Woodruff School of Mechanical Engineering Georgia Institute of Technology Atlanta, GA 30332, USA DOI: 10.1002/adma.201603061 materials, Si has received the most attention. While Si has attracted great research interest as a promising high-energy anode mate- rial due to its high specific capacity (theoretically, 4200 mA h g –1 ) and low potential versus Li (0.4 V), [11] its huge volume change (≈300%) due to lithium insertion and extraction leads to an undesirable cyclic performance. [10,12] While most studies have focused on mitigating problems caused by the large volume expansion, [13–16] so far little attention has been paid to the pos- sibility of utilizing the strains associated with the remarkable volume changes. [17] If we consider such structural changes for the purpose of low-voltage-driven actuation applications, the volume changes of Si during lithiation/delithiation cycles can be considered enormous compared to those in most traditional actuation materials, [18] for example, on the order of 0.1% for piezoelectric materials under a high driving voltage. [19] Herein, we demonstrated that the small charge/discharge voltage drive large volume expansion of Si anode during electrochemical Li-ion insertion/extraction reactions and achieve significant mechanical actuation and energy output. The LiFePO 4 cathode material exhibits no obvious volume changes during charge/discharge cycles, whereas at the same time the Si anode experiences massive volume expansion and contraction (Supporting Information, Figure S1). Therefore, the LiFePO 4 ||Si full-cell device experiences significant volume expansion/contraction in charging/discharging the battery (Figure 1a). We designed and fabricated a soft-packaged LIB containing LiFeO 4 as cathode and Si as anode (Supporting Information, Figure S2 and S3). The device was used to drive a large mechanical load during cycling, thanks to the high modulus of inorganic Si anode. [20] Therefore, in the LiFePO 4 ||Si full-battery device, a small voltage propelled the lithiation of Si, thus generating an external mechanical energy output based on the expansion of Si. Meanwhile, discharging the battery led to a large volume reduction of anode, resulting in the releasing of the strain. We use the 2.1 Ah LiFePO 4 ||Si full-battery device for lifting an object, as shown in Figure 1b. A beaker of water weighing 637.5 g was lifted by charging the cells, and the force was unloaded almost completely during the discharging process (Supporting Information, Video S1). The discharging process took roughly the same time as the charging process. The lifting test demonstrated that the battery can drive a mechanical load during charging and unload during discharging. The energy equation during the charging process can be written as follows: d d UI t F s E ∫ ∫ δ = + + (1) where U is the charging voltage, I the charging current, F the load, E the energy stored in the battery, and δ the energy loss. Materials frequently experience dramatic phases and structural changes associated with electrochemical reactions. Such elec- trochemically driven changes could lead to internal strain and stress, as well as dramatic volume alterations in the involved system. [1] As a typical and intensely studied electrochemical reac- tion system, lithium-ion batteries (LIBs) have experienced tre- mendous progress in the past several decades. [2–5] A rich variety of electrode materials and corresponding electrochemical reac- tions have been explored for LIB applications. [5] The main reac- tions running in LIBs are the insertion and extraction of lithium ions in electrode materials. Such voltage-controlled ion insertion and extraction could possibly drive two distinct phenomena: i) one phenomenon involves an inconspicuous strain/stress and minor volume changes of materials. For instance, Li 4 Ti 5 O 12 shows a nearly zero volume variation during lithium intercala- tion and deintercalation. [6] In LiFePO 4 materials, the unit cell volume exhibits a minor decrease by less than 7% in the trans- formation of LiFePO 4 to FePO 4 during lithium extraction. [7] Graphite anode undergoes ≈10% volume changes between its charged and discharged states. [8,9] ii) The other phenomenon comprises significant strain/stress changes and massive volume alterations in materials. In particular, alloy-type anode materials, such as silicon, germanium, and tin, typically exhibit dramatic volume expansion during the lithiation process. [10] Among these Adv. Mater. 2016, 28, 10236–10243 www.advmat.de www.MaterialsViews.com
Transcript of Cycling of a Lithium‐Ion Battery with a Silicon Anode ... · Drives Large Mechanical Actuation...

© 2016 WILEY-VCH Verlag GmbH & Co. KGaA, Weinheim10236 wileyonlinelibrary.com
Co
mm
un
iCati
on Cycling of a Lithium-Ion Battery with a Silicon Anode
Drives Large Mechanical Actuation
Jialiang Lang, Bin Ding, Ting Zhu, Hanxiao Su, Hao Luo, Longhao Qi, Kai Liu, Ke Wang, Naveed Hussain, Chunsong Zhao, Xiaoyan Li,* Huajian Gao, and Hui Wu*
J. Lang, H. Su, Prof. L. Qi, Prof. K. Liu, Prof. K. Wang, N. Hussain, C. Zhao, Prof. H. WuState Key Laboratory of New Ceramics and Fine ProcessingSchool of Materials Science and EngineeringTsinghua UniversityBeijing 100084, ChinaE-mail: [email protected]. Ding, Prof. H. GaoSchool of EngineeringBrown UniversityProvidence, RI 02912, USAB. Ding, Prof. X. LiCentre for Advanced Mechanics and MaterialsCNMM, Applied Mechanics LaboratoryDepartment of Engineering MechanicsTsinghua UniversityBeijing 100084, ChinaE-mail: [email protected]. T. Zhu, H. LuoWoodruff School of Mechanical EngineeringGeorgia Institute of TechnologyAtlanta, GA 30332, USA
DOI: 10.1002/adma.201603061
materials, Si has received the most attention. While Si has attracted great research interest as a promising high-energy anode mate-rial due to its high specific capacity (theoretically, 4200 mA h g–1) and low potential versus Li (0.4 V),[11] its huge volume change (≈300%) due to lithium insertion and extraction leads to an undesirable cyclic performance.[10,12] While most studies have focused on mitigating problems caused by the large volume expansion,[13–16] so far little attention has been paid to the pos-sibility of utilizing the strains associated with the remarkable volume changes.[17] If we consider such structural changes for the purpose of low-voltage-driven actuation applications, the volume changes of Si during lithiation/delithiation cycles can be considered enormous compared to those in most traditional actuation materials,[18] for example, on the order of 0.1% for piezoelectric materials under a high driving voltage.[19] Herein, we demonstrated that the small charge/discharge voltage drive large volume expansion of Si anode during electrochemical Li-ion insertion/extraction reactions and achieve significant mechanical actuation and energy output.
The LiFePO4 cathode material exhibits no obvious volume changes during charge/discharge cycles, whereas at the same time the Si anode experiences massive volume expansion and contraction (Supporting Information, Figure S1). Therefore, the LiFePO4||Si full-cell device experiences significant volume expansion/contraction in charging/discharging the battery (Figure 1a). We designed and fabricated a soft-packaged LIB containing LiFeO4 as cathode and Si as anode (Supporting Information, Figure S2 and S3). The device was used to drive a large mechanical load during cycling, thanks to the high modulus of inorganic Si anode.[20] Therefore, in the LiFePO4||Si full-battery device, a small voltage propelled the lithiation of Si, thus generating an external mechanical energy output based on the expansion of Si. Meanwhile, discharging the battery led to a large volume reduction of anode, resulting in the releasing of the strain. We use the 2.1 Ah LiFePO4||Si full-battery device for lifting an object, as shown in Figure 1b. A beaker of water weighing 637.5 g was lifted by charging the cells, and the force was unloaded almost completely during the discharging process (Supporting Information, Video S1). The discharging process took roughly the same time as the charging process. The lifting test demonstrated that the battery can drive a mechanical load during charging and unload during discharging. The energy equation during the charging process can be written as follows:
d dUI t F s E∫ ∫ δ= + + (1)
where U is the charging voltage, I the charging current, F the load, E the energy stored in the battery, and δ the energy loss.
Materials frequently experience dramatic phases and structural changes associated with electrochemical reactions. Such elec-trochemically driven changes could lead to internal strain and stress, as well as dramatic volume alterations in the involved system.[1] As a typical and intensely studied electrochemical reac-tion system, lithium-ion batteries (LIBs) have experienced tre-mendous progress in the past several decades.[2–5] A rich variety of electrode materials and corresponding electrochemical reac-tions have been explored for LIB applications.[5] The main reac-tions running in LIBs are the insertion and extraction of lithium ions in electrode materials. Such voltage-controlled ion insertion and extraction could possibly drive two distinct phenomena: i) one phenomenon involves an inconspicuous strain/stress and minor volume changes of materials. For instance, Li4Ti5O12 shows a nearly zero volume variation during lithium intercala-tion and deintercalation.[6] In LiFePO4 materials, the unit cell volume exhibits a minor decrease by less than 7% in the trans-formation of LiFePO4 to FePO4 during lithium extraction.[7] Graphite anode undergoes ≈10% volume changes between its charged and discharged states.[8,9] ii) The other phenomenon comprises significant strain/stress changes and massive volume alterations in materials. In particular, alloy-type anode materials, such as silicon, germanium, and tin, typically exhibit dramatic volume expansion during the lithiation process.[10] Among these
Adv. Mater. 2016, 28, 10236–10243
www.advmat.dewww.MaterialsViews.com

10237wileyonlinelibrary.com© 2016 WILEY-VCH Verlag GmbH & Co. KGaA, Weinheim
Co
mm
un
iCatio
n
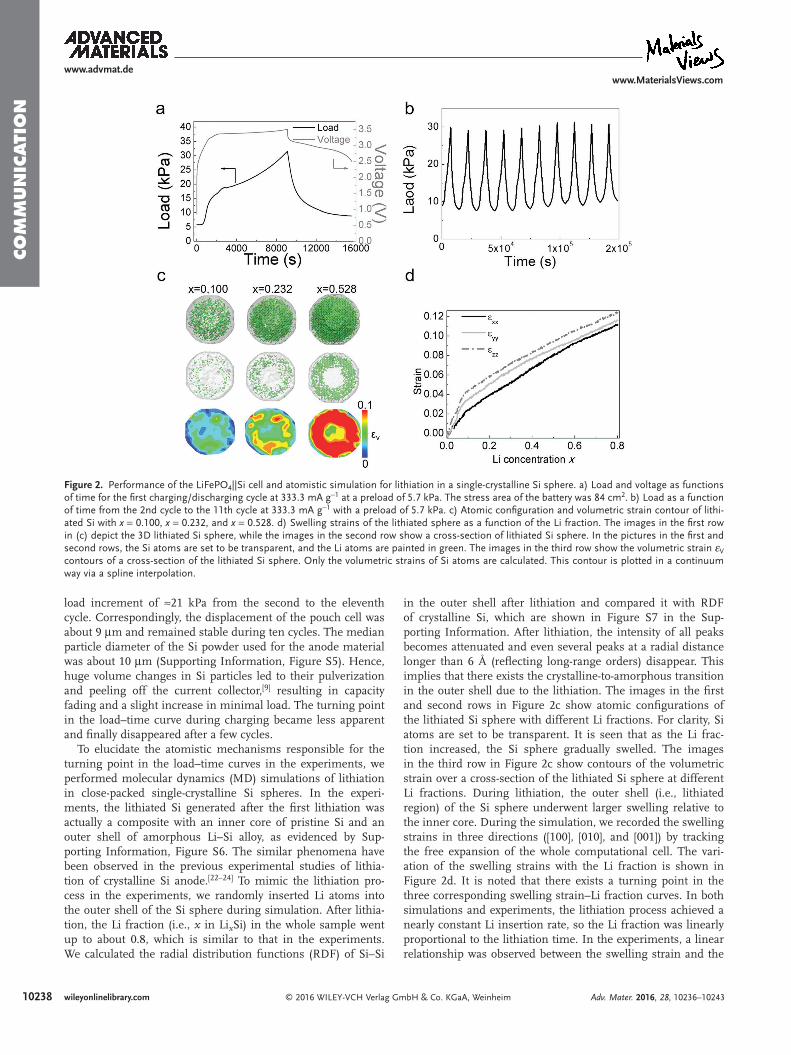
We set up a LiFePO4||Si full-battery device linked with a force transducer system to characterize the mechanical response of the battery device (Supporting Information, Figure S4). According to performance parameters of the sensor, the load driven by the cell is linearly related to its displacement. The LiFePO4||Si battery has an initial charging capacity of 2.5 A h with anode containing 3 g of Si as active material. At a preload
of 5.7 kPa, the load increased by 25.8 kPa at full charging, as shown in Figure 2a. During the first 1000 s of charging, the load increased at a low rate, corresponding to the formation of solid–electrolyte interphases.[21] There is an obvious turning point in the load–time curve at about 3000 s during charging, which will be addressed shortly. As shown in Figure 2b, the bat-tery exhibited a capacity of ≈2.1 A h and generated an average
Adv. Mater. 2016, 28, 10236–10243
www.advmat.dewww.MaterialsViews.com
Figure 1. Mechanical response of batteries based on the charging/discharging process. a) Battery volume change during the charging/discharging process. The battery can drive a large load during the charging process and unload during the discharging process. b) Schematic of the device used for the lifting test. c) Voltage as a function of time at 333.3 mA g−1 for the whole charging/discharging cycle, and balance readings at corresponding time points for the lifting test.
10238 wileyonlinelibrary.com © 2016 WILEY-VCH Verlag GmbH & Co. KGaA, Weinheim
Co
mm
un
iCati
on
load increment of ≈21 kPa from the second to the eleventh cycle. Correspondingly, the displacement of the pouch cell was about 9 μm and remained stable during ten cycles. The median particle diameter of the Si powder used for the anode material was about 10 μm (Supporting Information, Figure S5). Hence, huge volume changes in Si particles led to their pulverization and peeling off the current collector,[9] resulting in capacity fading and a slight increase in minimal load. The turning point in the load–time curve during charging became less apparent and finally disappeared after a few cycles.
To elucidate the atomistic mechanisms responsible for the turning point in the load–time curves in the experiments, we performed molecular dynamics (MD) simulations of lithiation in close-packed single-crystalline Si spheres. In the experi-ments, the lithiated Si generated after the first lithiation was actually a composite with an inner core of pristine Si and an outer shell of amorphous Li–Si alloy, as evidenced by Sup-porting Information, Figure S6. The similar phenomena have been observed in the previous experimental studies of lithia-tion of crystalline Si anode.[22–24] To mimic the lithiation pro-cess in the experiments, we randomly inserted Li atoms into the outer shell of the Si sphere during simulation. After lithia-tion, the Li fraction (i.e., x in LixSi) in the whole sample went up to about 0.8, which is similar to that in the experiments. We calculated the radial distribution functions (RDF) of Si–Si
in the outer shell after lithiation and compared it with RDF of crystalline Si, which are shown in Figure S7 in the Sup-porting Information. After lithiation, the intensity of all peaks becomes attenuated and even several peaks at a radial distance longer than 6 Å (reflecting long-range orders) disappear. This implies that there exists the crystalline-to-amorphous transition in the outer shell due to the lithiation. The images in the first and second rows in Figure 2c show atomic configurations of the lithiated Si sphere with different Li fractions. For clarity, Si atoms are set to be transparent. It is seen that as the Li frac-tion increased, the Si sphere gradually swelled. The images in the third row in Figure 2c show contours of the volumetric strain over a cross-section of the lithiated Si sphere at different Li fractions. During lithiation, the outer shell (i.e., lithiated region) of the Si sphere underwent larger swelling relative to the inner core. During the simulation, we recorded the swelling strains in three directions ([100], [010], and [001]) by tracking the free expansion of the whole computational cell. The vari-ation of the swelling strains with the Li fraction is shown in Figure 2d. It is noted that there exists a turning point in the three corresponding swelling strain–Li fraction curves. In both simulations and experiments, the lithiation process achieved a nearly constant Li insertion rate, so the Li fraction was linearly proportional to the lithiation time. In the experiments, a linear relationship was observed between the swelling strain and the
Adv. Mater. 2016, 28, 10236–10243
www.advmat.dewww.MaterialsViews.com
Figure 2. Performance of the LiFePO4||Si cell and atomistic simulation for lithiation in a single-crystalline Si sphere. a) Load and voltage as functions of time for the first charging/discharging cycle at 333.3 mA g−1 at a preload of 5.7 kPa. The stress area of the battery was 84 cm2. b) Load as a function of time from the 2nd cycle to the 11th cycle at 333.3 mA g−1 with a preload of 5.7 kPa. c) Atomic configuration and volumetric strain contour of lithi-ated Si with x = 0.100, x = 0.232, and x = 0.528. d) Swelling strains of the lithiated sphere as a function of the Li fraction. The images in the first row in (c) depict the 3D lithiated Si sphere, while the images in the second row show a cross-section of lithiated Si sphere. In the pictures in the first and second rows, the Si atoms are set to be transparent, and the Li atoms are painted in green. The images in the third row show the volumetric strain εV contours of a cross-section of the lithiated Si sphere. Only the volumetric strains of Si atoms are calculated. This contour is plotted in a continuum way via a spline interpolation.

10239wileyonlinelibrary.com© 2016 WILEY-VCH Verlag GmbH & Co. KGaA, Weinheim
Co
mm
un
iCatio
n
load due to lithiation-induced swelling. Therefore, the turning point in the swelling-strain–Li-fraction curves from MD simu-lation should correspond to that in the load–time curves from the experiments. At the initial stage of lithiation, Li insertion led to a pronounced expansion of the Si lattice, as evidenced by the volumetric strain contour in Figure 2c (left column). As the Li fraction gradually increased, Si bonds in the lithiated state were elongated and a few of them even broke up. As Li fraction exceeded a critical value, most Si lattices in the lithiated region became expanded and even disrupted. Subsequently, more Li atoms could be readily inserted into the expanded lattices, with a short SiSi bond elongation (i.e., a small swelling/volumetric strain). This suggests the existence of a turning point in the volumetric-strain–Li-fraction curve. The similar phenomenon has been indicated by the previous first-principle calculation of lithium-assisted elongation and breakage of SiSi bonds during lithiation.[25] During lithiation, the outer shell of the Si sphere gradually became amorphous as the Si lattice structures were disrupted, but the inner core of the Si sphere remained crystalline (Supporting Information, Figure S6). As shown by the volumetric strain contours in Figure 2c (right column), the inner core suffered considerable swelling due to strain compat-ibility. During the next cycle of lithiation, the inner core became partially amorphous, leading to the appearance of a similar turning point. After a few cycles of lithiation–delithiation, the whole sample was transformed into an amorphous structure, and the turning point disappeared. The above mentioned results indicate that the turning point is associated with the lattice transformation of crystalline Si during lithiation.
During the lithiation process before the turning point, the lithiated Si particle exhibited a relatively large rate of increase of the swelling strain, which was caused by the dominant response of lithiation-induced disruption of the crystalline Si lattice.[22–24] In contrast, during the lithiation process beyond the turning point, more Li atoms were added into the system. Some of these Li atoms served to move the phase boundary (in between the Si core and the amorphous Li–Si shell) toward the center of the Si particle.[22–24] However, some other Li atoms were trapped in the amorphous lithiated shell, causing smaller expansion than the disruption process of the Si lattice. As a result, the overall rate of increase of the swelling strain slows down. The above atomistic insights provide a possible explana-tion of the turning point. These results also indicate that the turning point is associated with the lattice transformation of crystalline Si during lithiation. Such transformation involves the elongation and breakage of SiSi bonds, as well as crys-talline-to-amorphous transition, which are consistent with the previous experimental observations[22–24] of microstructure evolution during lithiation.
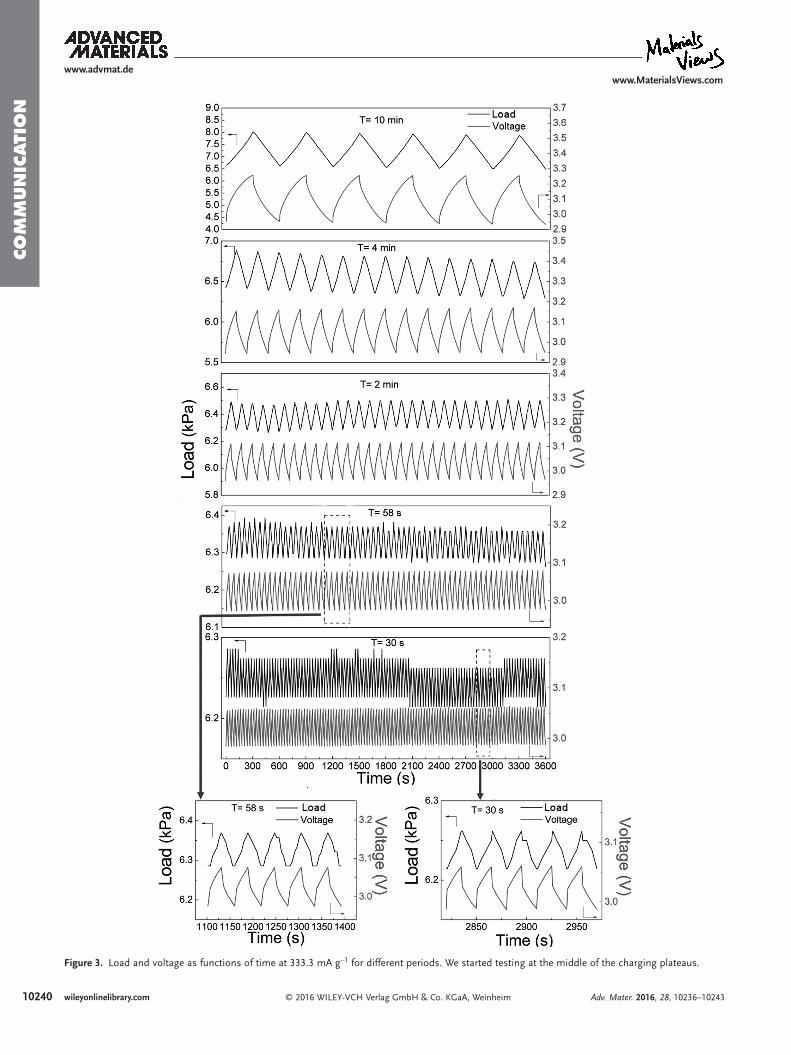
Rapid response time can be a critical factor for electric-mechanical coupling. To measure the response time of the device, we conducted a test with short period charging and discharging cycles, as shown in Figure 3. The changes in load and voltage were nearly synchronous and the response time was less than one second. Therefore, the displacement direc-tion can be switched rapidly during charge and discharge. We demonstrated that the cell exhibited a rapid response to elec-trical pulses. Moreover, there was a linear relationship between the load and the charging/discharging time. The linear change
in displacement is an asset for micro-positioning applications, which makes the control of displacement easy. The loading slope was measured to be remarkably stable, and the displace-ment speed was ≈1.6 nm s–1, which indicates that the cell can be used for accurate nanopositioning.[26] We conducted the same kind of test at the discharge plateaus and obtained similar results (Supporting Information, Figure S8). At the discharge plateaus, the displacement speed was roughly the same as that at the charge plateaus. For the lifting test, the cell was charged/discharged at 2 A g−1 for short periods of time (Supporting Information, Video S2). The reading of the balance changed periodically in a stable range and the response time remained less than 1 s (Supporting Information, Figure S9).
To demonstrate that the batteries can drive a large mechan-ical load, we reduced the stress area from 84 to 0.64 cm2 and increased the preload. Figure 4a shows that the battery can drive a load larger than 17 MPa. At the middle of a charging plateau, the load and displacement began to both increase then decrease linearly for the same durations, indicating that the displacement speed can be constant for more than half an hour even under a load larger than 10 MPa. For the large load (about 17 MPa in Figure 4a), the displacement speed was up to about 1.6 nm s–1, which is identical to the case of the small load (about 6–8 kPa in Figure 3). The displacement speed of the current actuators is associated with the areal density of Si anode, thickness of battery, and current density. A previous study already confirmed that the volume of amorphous Si thin film changes linearly with Li content in the electrode during lithiation/delithiation.[27] The amorphous Si particles exhibited similar performance. We calculated the mechanical energy gen-erated by the cell during the charging process. Our results sug-gest that the energy density of Si was 778.5 mJ cm–3 (Figure 4b and Supporting Information Text). Correspondingly, the strain of the anode layer was about 2.5%. Since the tapped density of Si anode was 1.2 g cm–3, which is much smaller than the theoretical density, the interiors of the battery was not com-pletely rigid. And the volume change of Si can be cushioned by the elastic components such as the separators, so the real-ized strain of the anode materials was much lower than the theoretical limit.[28,29] Figure 4c shows that the cell exhibited not only a rapid response to electrical pulses but also an excel-lent cyclic performance under a large load. We also conducted a short period test at different current densities. The load not only stayed linear with time, but changed faster at a larger cur-rent density (Supporting Information, Figure S10). Our results demonstrate that we can control the speed of displacement by setting different current densities. We calculated the power density using the same data as Figure 4b, and found that after 4000 s, the power density was about 0.2 mW cm–3 and stable. Although the power density was lower than other actuation materials, we can improve the present system by increasing the areal density of Si and the current density.
The previous experimental studies[30–32] showed that the lithiated Si with high Li fraction exhibit a certain room tem-perature creep due to Li diffusion and/or viscoplasticity. Hence, it is necessary to test the influence of creep on our Si-anode-based actuator. With a large preload, we charged the battery for 6000 s, then stopped charging, and kept this state for 4000 s (Supporting Information, Figure S11). The results showed that
Adv. Mater. 2016, 28, 10236–10243
www.advmat.dewww.MaterialsViews.com
10240 wileyonlinelibrary.com © 2016 WILEY-VCH Verlag GmbH & Co. KGaA, Weinheim
Co
mm
un
iCati
on
Adv. Mater. 2016, 28, 10236–10243
www.advmat.dewww.MaterialsViews.com
Figure 3. Load and voltage as functions of time at 333.3 mA g−1 for different periods. We started testing at the middle of the charging plateaus.

10241wileyonlinelibrary.com© 2016 WILEY-VCH Verlag GmbH & Co. KGaA, Weinheim
Co
mm
un
iCatio
n
Adv. Mater. 2016, 28, 10236–10243
www.advmat.dewww.MaterialsViews.com
after the charging is terminated, there was a slight decrease (0.22%) of load, which is attributed to the creep of lithiated Si. In the current study, the Li fraction is as low as 0.8, and the creep is not as pronounced as previous studies. Therefore, the creep of lithiated Si did not show significant impact on the performance of the actuators we designed. Nontheless, it is a critical issue for the application of actuators and warrants an in-depth study in the future.
During charging, there were no obvious improvements of charging voltage, indicating that the load had no significant impact on the performance of the cell. Since the largest load was less than 20 MPa, the results are consistent with a recent experimental measurement.[33] In addition, due to the low capacity of cathode materials, the realized specific capacity of Si anode is less than 800 mA h g−1, which is much lower than
the theoretical specific capacity (4200 mA h g−1). Hence, there is still room for improvement of the performance of the cell.
We propose that the LiFePO4||Si batteries can be used as an actuator. Figure 5 shows the comparison between different actuator materials. Theoretically, alloy-type anode materials have the highest actuation strain and stress. Although there are still large differences between our results and the theoretical level, our system has other advantages, such as low driving voltage and high energy density (Supporting Information, Table S1). Moreover, LiFePO4||Si batteries can be applied for nanopositioning, and its speed of displacement is controllable.
In summary, we have demonstrated, for the first time, a significant mechanical response up to 10 MPa by charging/discharging a Li-ion battery device constructed from a Si anode and a LiFePO4 cathode. We showed that such a LiFePO4||Si bat-tery can drive a large load with a rapid response to the elec-trochemical process, due to the dramatic volume changes associated with Li+ insertion and extraction in the Si anode. Therefore, the LiFePO4||Si battery has key potentials in broad applications, such as in the field of actuators. Furthermore, such batteries show promise in their use for in situ monitoring of the electrochemically induced mechanical changes and associated degradation.
Experimental SectionPreparation of Electrode Materials: All materials used were of high
purity (>99.9%). Cathode materials were prepared by mixing 88 wt% of lithium iron phosphate (LiFePO4) (Hangzhou Dongjian Energy Science and Technology Co., Ltd) (Supporting Information, Figure S12), 5 wt% of Super-P (Shanghai FEO International Trading Co., Ltd), 2 wt% of KS-6 (Shanghai Huiping Chemical Co., Ltd (SCM)), and 5 wt% of poly(vinylidene fluoride) (PVDF) (SCM). Anode materials were prepared by mixing 80 wt% of silicon (Sinopharm Chemical Reagent Co., Ltd)
Figure 4. Performance of the LiFePO4||Si cell under a large load. a) Load and voltage as functions of time at 333.3 mA g−1 with a preload of 13.6 MPa. b) Energy density and voltage as functions of time at 333.3 mA g−1 with a preload of 13.6 MPa during the charging process. c) Load and voltage as functions of time at 2000 mA g−1 with a preload of 12.96 MPa. One cycle lasts for 2 min, and the data involve 300 cycles.
Figure 5. Comparison between different actuator materials. Actuation stress as a function of actuation strain. Data are from refs. [18,34].

10242 wileyonlinelibrary.com © 2016 WILEY-VCH Verlag GmbH & Co. KGaA, Weinheim
Co
mm
un
iCati
on
Adv. Mater. 2016, 28, 10236–10243
www.advmat.dewww.MaterialsViews.com
(Supporting Information, Figure S5), 10 wt% of Super-P (SFEP), and 10 wt% of PVDF (SCM). The electrode materials were dissolved in 60 wt% of 1-methyl-2-pyrrolidone (NMP) (Suzhou Refine Co., Ltd) and stirred into the blender (XFZH-15, HUGEST) step-by-step for 7 h respectively. For the cathode materials, PVDF dissolved in NMP first and stirred for 2 h, then combined and stirred with Super-P and KS-6 for 2 h, and finally with LiFePO4 for 3 h. The final viscosity of the slurry was 12000 mPa s–1. The process was similarly conducted for the anode materials and the final viscosity of the corresponding slurry was 4300 mPa s–1.
Assembly of Batteries: The cathode materials were coated on aluminum foil (Qinhuangdao Xingheng Aluminum-Tech Co., Ltd), whereas the anode materials were coated on a copper foil (United Copper Foils Co., Ltd) by the coater (CLG-TB-500-19, Guangzhou CLG Electric Equipment Co., Ltd). The thickness of aluminum foil was 15 μm and the thickness of copper foil was 9 μm. Subsequently, the electrode-coated foils were dried in a vacuum drier (DZF-6050, HASUC) at 100 °C for 10 h. After rolling (CLG-ZM-500Y, Guangzhou CLG Electric Equipment Co., Ltd) and cutting, we measured the width of the resultant electrode slices to be 120 mm and calculated the areal densities of the cathode and anode to be 120 and 15 g m−2, respectively. Each battery contained 3 g of Si as anode material. The electrode slices and separators (poly ethylene, Xunteng Electronic Technology Co., Ltd) were then wound together with a coiler (YHWP-23080-S, Shenzhen Yinghe Science and Technology Co., Ltd), and the prepared materials were hot pressed at 65 °C for 90 s and cold pressed for 60 s with a hot-pressing machine (YLPC-1S, Dongguan Yalan Electronic Equipment Manufacturers). Finally, the batteries were filled with 45 g of electrolyte (DJY-320, Xinyi Chemical Factory) and packaged with aluminum films (ALPA40L, YCC). The final length of the batteries was 70 mm and the thickness was 10 mm.
Atomistic Simulations: To reveal the underlying mechanism behind the turning point during lithiation, MD simulations were carried out for lithiation in single-crystalline Si spheres via LAMMPS.[35] The real lithiation process involves the physical diffusion of Li and the chemical reaction between Li and Si. Since the accessible time scale of atomistic simulation is much smaller than the typical time scale of Li diffusion, it is very difficult for atomistic simulations to mimic the Li diffusion into Si sphere. In the current atomistic simulations, the lithiation was mimicked by randomly inserting the Li only in the outer shell of Si sphere. The Si sphere had a radius of 4.33 nm and consisted of 17 217 Si atoms, with [100], [010], and [001] crystal orientations oriented along the x, y, and z axes, respectively. Periodic boundary conditions were imposed on all three directions, mimicking close packed Si spheres in an anode. The interatomic interaction is described by a reactive force field,[36] which has been demonstrated to be capable of characterizing the mechanical properties of the Li–Si alloy.[36] The integration time step was set as 0.5 fs to ensure high accuracy and good convergence. The simulated sample was initially equilibrated at room temperature (300 K) for 50 ps. Then one Li atom was randomly inserted into the outer shell (with thickness of about 2 nm) of the sphere, followed by a long relaxation to allow substantial volume expansion of the sphere. During relaxation, the stresses in all three directions were kept at zero via a Parrinello–Rahman barostat.[37] This process of insertion and relaxation was repeated until the average Li fraction (i.e., x in LixSi) for the whole sphere reached a prescribed level of 0.8, the same as that in the experiments. After lithiation, nearly all Li were concentrated in the outer shell, leading to high local Li fraction in the outer shell. During the simulations, free expansion in three directions ([100], [010], and [001]) of the whole computational cell was tracked to calculate the corresponding swelling strains.
Characterization: The microstructure of all the samples was analyzed by scanning electron microscopy with a MERLIN Compact Zeiss scanning electron microscope. The X-ray diffraction patterns of all the samples were analyzed using a D-Max-2500 Rigaku XRD Analyzer. The size distributions of the silicon particles were studied using a Mastersize-2000 Malvern laser granularity analyzer. The sensor used for the measurement of load and displacement was an LTL-S3-1KN load sensor from Longxiangtianli Technology Co., Ltd. All the electrochemical
tests were conducted using the BTS-5V6A NEWARE battery-testing system.
Supporting InformationSupporting Information is available from the Wiley Online Library or from the author.
AcknowledgementsJ.L. and B.D. contributed equally to this work. H.W. acknowledges the support from the National Basic Research of China (Grants Nos. 2015CB932500 and 2013CB632702) and NSF of China (Grant No. 51302141). H.G. acknowledges the support from the US Department of Energy through the DOE EPSCoR Implementation (Grant No. DE-SC0007074) at Brown University.
Received: June 10, 2016Revised: July 23, 2016
Published online: October 10, 2016
[1] E. Martin, M. Federica, S. Marco, M. Vanessa, Science 2013, 342, 716.[2] J. M. Tarascon, M. Armand, Nature 2001, 414, 359.[3] M. Armand, J.-M. Tarascon, Nature 2008, 451, 652;
DOI: 10.1038/451652a.[4] J. B. Goodenough, K. S. Park, J. Am. Chem. Soc. 2013, 135, 1167.[5] D. Larcher, J. M. Tarascon, Nat. Chem. 2015, 7, 19.[6] T. Ohzuku, A. Ueda, N. Yamamoto, J. Electrochem. Soc. 1995, 142,
1431.[7] A. K. Padhi, K. Nanjundaswamy, J. Goodenough, J. Electrochem. Soc.
1997, 144, 1188.[8] D. Billaud, E. McRae, A. Hérold, Mater. Res. Bull. 1979, 14, 857.[9] T. E. Chin, U. Rhyner, Y. Koyama, S. R. Hall, Y. M. Chiang, Electro-
chem. Solid-State Lett. 2006, 9, A134.[10] L. Y. Beaulieu, K. W. Eberman, R. L. Turner, L. J. Krause, J. R. Dahn,
Electrochem. Solid-State Lett. 2001, 4, A137.[11] H. Li, X. Huang, L. Chen, Z. Wu, Y. Liang, Electrochem. Solid-State
Lett. 1999, 2, 547.[12] K. Rhodes, N. Dudney, E. Lara-Curzio, C. Daniel, J. Electrochem. Soc.
2010, 157, A1354.[13] G. Liu, S. Xun, N. Vukmirovic, X. Song, P. Olalde-Velasco,
H. Zheng, V. S. Battaglia, L. Wang, W. Yang, Adv. Mater. 2011, 23, 4679.
[14] A. Magasinski, P. Dixon, B. Hertzberg, A. Kvit, J. Ayala, G. Yushin, Nat. Mater. 2010, 9, 353.
[15] N. Liu, Z. Lu, J. Zhao, M. T. McDowell, H. W. Lee, W. Zhao, Y. Cui, Nat. Nanotech. 2014, 9, 187.
[16] C. K. Chan, H. Peng, G. Liu, K. Mcllwrath, X. F. Zhang, R. A. Huggins, Y. Cui, Nat. Nanotech. 2008, 3, 31.
[17] S. Kim, S. J. Choi, K. Zhao, H. Yang, G. Gobbi, S. Zhang, J. Li, Nat. Commun. 2016, 7, 10146.
[18] S. A. Wilson, R. P. J. Jourdain, Q. Zhang, R. A. Dorey, C. R. Bowen, M. Willander, Q. UI. Wahab, M. Willander, S. M. Al-Hilli, O. Nur, E. Quandt, C. Johansson, E. Pagounis, M. Kohl, J. Matovic, B. Samel, W. Wijingaart, E. W. H. Jager, D. Carlasson, Z. Djinovic, M. Wegener, C. Moldovan, Mater. Sci. Eng. R 2007, 56, 1.
[19] A. H. Rajabi, M. Jaffe, T. L. Arinzeh, Acta Biomater. 2015, 24, 12.
[20] S. C. Yong, M. Pharr, K. H. Oh, J. J. Vlassak, J. Power Sources 2015, 294, 159.

10243wileyonlinelibrary.com© 2016 WILEY-VCH Verlag GmbH & Co. KGaA, Weinheim
Co
mm
un
iCatio
n
Adv. Mater. 2016, 28, 10236–10243
www.advmat.dewww.MaterialsViews.com
[21] Y. Horowitz, H. L. Han, P. N. Ross, G. A. Somorjai, J. Am. Chem. Soc. 2016, 138, 726.
[22] S. W. Lee, M. T. McDowell, J. W. Choi, Y. Cui, Nano Lett. 2011, 11, 3034.[23] M. Pharr, K. Zhao, X. Wang, Z. Suo, J. J. Vlassak, Nano Lett. 2012,
12, 5039.[24] M. J. Chon, V. A. Sethuraman, A. McCormick, V. Srinivasan,
P. R. Guduru, Phys. Rev. Lett. 2011, 107, 045503.[25] K. Zhao, W. L. Wang, J. Gregoire, M. Pharr, Z. Suo, J. J. Vlassak,
E. Kaxiras, Nano Lett. 2011, 11, 2962.[26] A. J. Fleming, Sens. Actuators, A 2013, 190, 106.[27] L. Y. Beaulieu, T. D. Hatchard, A. Bonakdarpour, M. D. Dahn,
J. R. Fleischauer, J. Electrochem. Soc. 2003, 150, A1457.[28] S. Huang, T. Zhu, J. Power Sources 2011, 196, 3664.[29] J. W. Wang, Y. He, F. Fan, X. H. Liu, S. Xia, Y. Liu, C. T. Harris, H. Li,
J. Y. Huang, S. X. Mao, T. Zhu, Nano Lett. 2013, 13, 709.
[30] S. T. Boles, C. V. Thompson, O. Kraft, Appl. Phys. Lett. 2013, 103, 263906.
[31] M. Pharr, Z. Suo, J. J. Vlassak, J. Power Sources 2014, 270, 569.
[32] L. A. Berla, S. W. Lee, Y. Cui, W. D. Nix, J. Power Sources 2015, 273, 41.
[33] V. A. Sethuraman, V. Srinivasan, A. F. Bower, P. R. Guduru, J. Electrochem. Soc. 2011, 157, A1253.
[34] J. E. Huber, N. A. Fleck, M. F. Ashby, Proc. R. Soc. London 1997, 453, 2185.
[35] S. Plimpton, J. Comp. Phys. 1995, 117, 1.[36] F. Fan, S. Huang, H. Yang, M. Raju, D. Datta, V. B. Shenoy,
A. C. T. Van-Duin, S. Zhang, T. Zhu, Modelling Simul. Mater. Sci. Eng. 2013, 21, 074002.
[37] M. Parrinello, A. Rahman, J. Appl. Phys. 1981, 52, 7182.