Cyclic tests of engineered shearwalls considering different ......middle studs split from bottom...
27
OSU Shearwall Testing Report for AF&PA, May 2004 [FINAL] page 1 Cyclic tests 1 of engineered shearwalls considering different plate washer sizes Prepared for: American Forest & Paper Association (AF&PA) Prepared by: David Rosowsky, Lori Elkins, and Cameron Carroll Oregon State University Rev. 5/19/2004 Summary Table Wall designation P max (lbs) ∆ @ P max (in.) load @ 0.8P max (lbs) Energy (1) (in.-lbs) A1 10428 3.44 9500 84370 A2 11334 3.07 10487 76433 A3 11815 2.96 10895 78042 Avg. A 11192 3.16 10294 79615 Avg. A (excl. A1) 11575 3.02 10691 77238 B1 11156 2.81 10084 79779 B2 12053 2.98 11229 90002 B3 11682 2.84 10652 80577 Avg. B 11630 2.88 10655 83453 C1 11774 2.58 10062 58339 C2 11421 2.69 10593 64979 C3 11943 2.83 11219 67161 Avg. C 11713 2.70 10625 63493 D1 11600 2.81 10863 77540 D2 11407 2.81 10611 76369 D3 10148 2.85 9150 71434 Avg. D 11052 2.82 10208 75114 A: 2.5 in. square × 1/4 in. plate washer (1) Area under hysteresis loops up to the first complete loop beyond P max B: 3 in. square × 3/8 in. plate washer C: standard round washer (1.75 in. diam. × 1/8 in.) D: 2 in. square × 3/16 in. plate washer (tested March 2004) Note: washers tightened to approximately 40 ft-lbs torque Summary Conclusion This study examined the effect of washer size (used at the anchorage) on the performance of engineered wood shearwalls built with a treated sole plate (bottom plate). Complete framing details of the wall specimens are shown on the following pages. No statistically significant differences in performance, as measured by peak capacity and deflection capacity, were observed 2 . 1 The test setup was in accordance with methods in ASTM E2126 Standard Test Methods for Cyclic (Reversed) Load Test for Shear Resistance of Framed Walls for Buildings. The cyclic loading protocol is shown in Appendix A. 2 Analysis of variance (ANOVA) was performed. The mean peak capacities were found to have no statistical differences at the 5% significance level. The means of the corresponding deflections (at P max ) were found to have no statistical differences at the 2% significance level.
Transcript of Cyclic tests of engineered shearwalls considering different ......middle studs split from bottom...

OSU Shearwall Testing Report for AF&PA, May 2004 [FINAL] page 1
Cyclic tests1 of engineered shearwalls considering different plate washer sizes
Prepared for: American Forest & Paper Association (AF&PA)
Prepared by: David Rosowsky, Lori Elkins, and Cameron Carroll Oregon State University
Rev. 5/19/2004
Summary Table
Wall designation Pmax (lbs) ∆ @ Pmax (in.) load @ 0.8Pmax (lbs) Energy(1) (in.-lbs) A1 10428 3.44 9500 84370 A2 11334 3.07 10487 76433 A3 11815 2.96 10895 78042
Avg. A 11192 3.16 10294 79615 Avg. A (excl. A1) 11575 3.02 10691 77238
B1 11156 2.81 10084 79779 B2 12053 2.98 11229 90002 B3 11682 2.84 10652 80577
Avg. B 11630 2.88 10655 83453 C1 11774 2.58 10062 58339 C2 11421 2.69 10593 64979 C3 11943 2.83 11219 67161
Avg. C 11713 2.70 10625 63493 D1 11600 2.81 10863 77540 D2 11407 2.81 10611 76369 D3 10148 2.85 9150 71434
Avg. D 11052 2.82 10208 75114 A: 2.5 in. square × 1/4 in. plate washer (1) Area under hysteresis loops up to the first complete loop beyond Pmax B: 3 in. square × 3/8 in. plate washer C: standard round washer (1.75 in. diam. × 1/8 in.) D: 2 in. square × 3/16 in. plate washer (tested March 2004) Note: washers tightened to approximately 40 ft-lbs torque Summary Conclusion This study examined the effect of washer size (used at the anchorage) on the performance of engineered wood shearwalls built with a treated sole plate (bottom plate). Complete framing details of the wall specimens are shown on the following pages. No statistically significant differences in performance, as measured by peak capacity and deflection capacity, were observed2.
1 The test setup was in accordance with methods in ASTM E2126 Standard Test Methods for Cyclic (Reversed)
Load Test for Shear Resistance of Framed Walls for Buildings. The cyclic loading protocol is shown in Appendix A.
2 Analysis of variance (ANOVA) was performed. The mean peak capacities were found to have no statistical differences at the 5% significance level. The means of the corresponding deflections (at Pmax) were found to have no statistical differences at the 2% significance level.

OSU Shearwall Testing Report for AF&PA, May 2004 [FINAL] page 2
Summary Notes/Observations:
Wall designation
Washer type Notes/observations: Dominant failure mode
A1 Sheathing separated from studs at center of wall. Fastener failure
A2 Interior studs separated from sole plate. Sheathing separated from studs at center of the wall.
Fastener failure
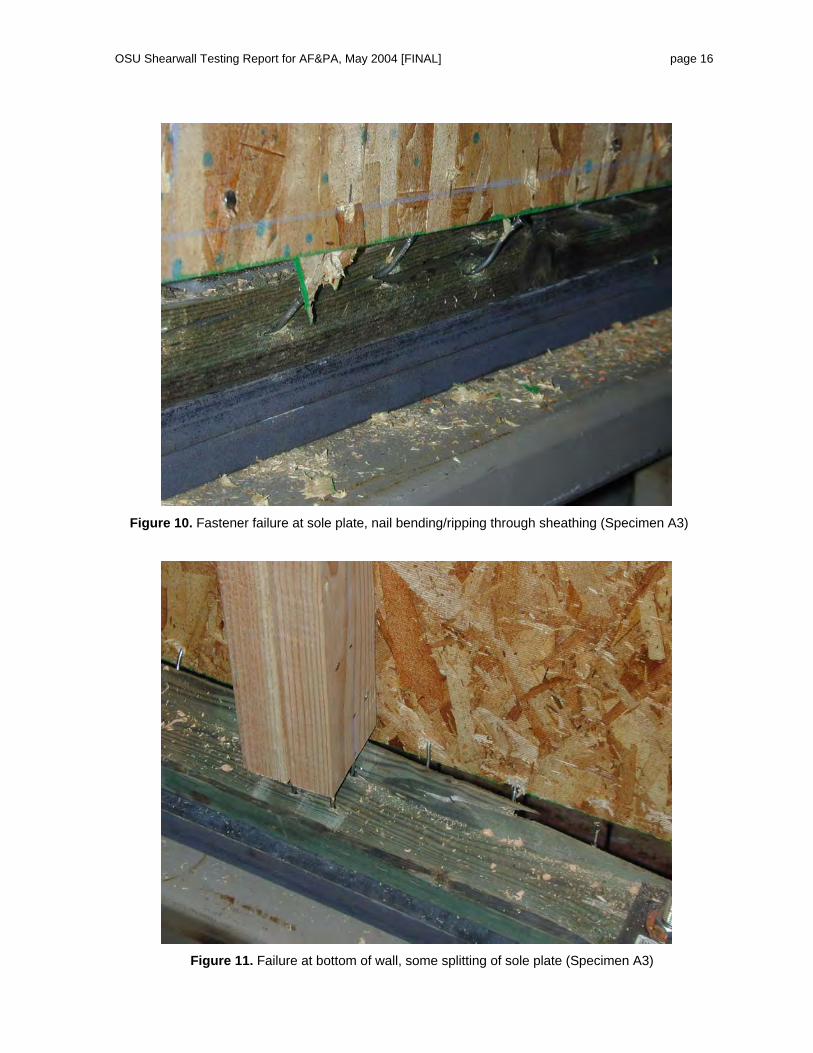
A3
2.5 in. square plate washer
Same as A2 (with some splitting of sole plate). Fastener failure
B1 Sole plate split at hold-downs. One hold-down completely ripped from end studs (bent screws). Separation at middle double stud. Fewer failures of edge sheathing fasteners.
Fastener failure
B2 Sheathing separated from studs at outside and bottom edges of wall, however middle seam intact. End studs started to split at hold-down. Sole plate had little damage.
Fastener failure
B3
3 in. square plate washer
Fastener failure at sheathing edges at ends of wall. Bottom edge of sheathing pulled away from sole plate along interior studs. (Some superficial splitting of sole plates.) Bottom of end studs (near sole plate) split.
Fastener failure
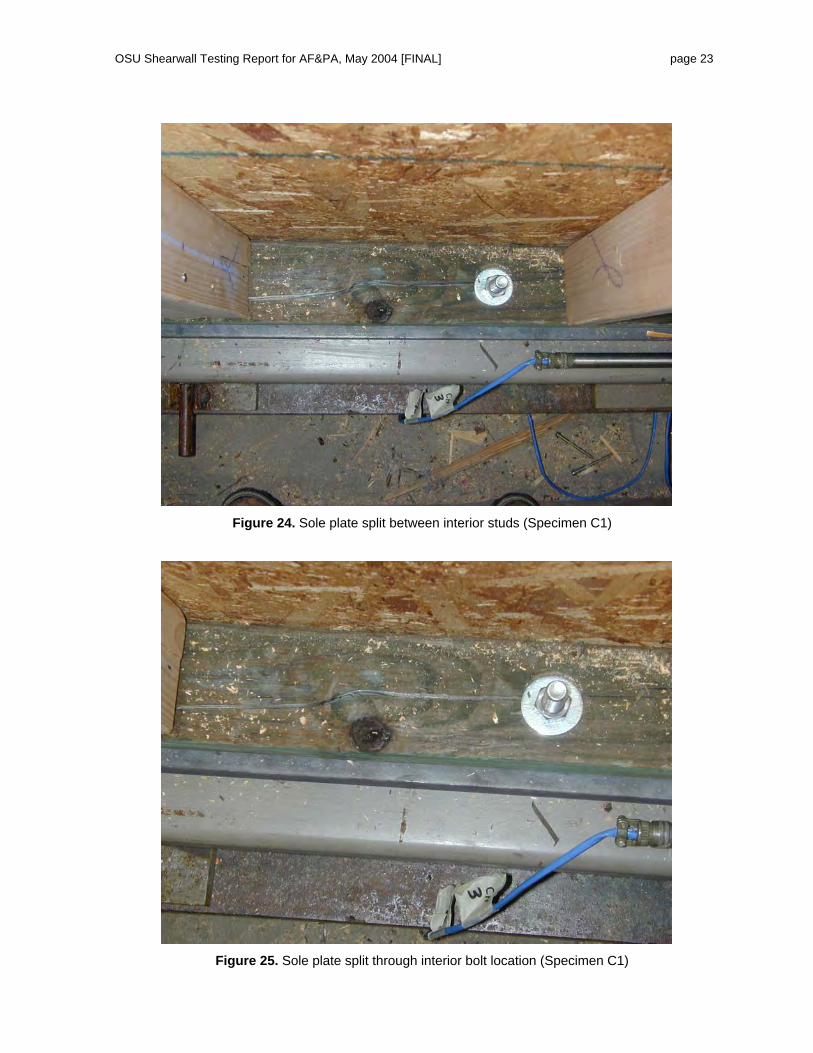
C1 Sole plate failed (split) along ¾ of length. Bottom of sheathing pulled away from sole plate. Little damage on other edges. End stud split along hold-down screws. Interior studs separated from sole plate.
Sole plate failure (splitting)
C2 Sole plate failed along ½ of length. One of the middle studs split from bottom plate (up about 12”) and from top plate (down about 30”). One sheathing panel pulled away from studs along edge and bottom of wall, with less damage along middle seam. The other panel had complete failure along middle seam, some failure along bottom, and little failure at end.
Sole plate failure (splitting)
C3
standard round washer
Sole plate failed. Similar to C2. Middle double stud split at end near sole plate. One end stud split along (one line of) hold-down screws. Sheathing pulled away from bottom half of end studs, and along sole plate. Middle seam intact.
Sole plate failure (splitting)

OSU Shearwall Testing Report for AF&PA, May 2004 [FINAL] page 3
(continued on next page) Summary Notes/Observations (continued):
Wall designation
Washer type Notes/observations: Dominant failure mode
D1 Edges of sheathing separated from studs. Small split in sole plate from sheathing nail pulling out. Little/no sole plate damage.
Fastener failure
D2 End stud separated from top plate. One edge of sheathing separated from stud. Little/no sole plate damage.
Fastener failure
D3
2 in. square plate washer
Middle stud had some splitting near sole plate. One edge of sheathing separated from stud. Little/no sole plate damage.
Fastener failure

OSU Shearwall Testing Report for AF&PA, May 2004 [FINAL] page 4
Drawing A-1: Specifications for shearwall test specimen

OSU Shearwall Testing Report for AF&PA, May 2004 [FINAL] page 5
Drawing A-2: Specifications (cont’d.) for shearwall test specimen

OSU Shearwall Testing Report for AF&PA, May 2004 [FINAL] page 6
Drawing A-3: Calculations for shearwall test specimen

OSU Shearwall Testing Report for AF&PA, May 2004 [FINAL] page 7
-15000
-10000
-5000
0
5000
10000
15000
-5 -3 -1 1 3 5
Deflection (In)
Forc
e (L
b-F)
Wall A1 (2.5 in. plate washer)∆ref = 2.4 in.
Monotonic pushover at end of cyclic test
Backbone curve
-15000
-10000
-5000
0
5000
10000
15000
-5 -3 -1 1 3 5
Deflection (In)
Forc
e (L
b-F)
A2
A1
Wall A2 (2.5 in. plate washer)∆ref = 3.3 in.Wall A1 backbone shown for comparison
-15000
-10000
-5000
0
5000
10000
15000
-5 -3 -1 1 3 5
Deflection (In)
Forc
e (L
b-F)
A3
A1
Wall A3 (2.5 in. plate washer)∆ref = 3.3 in.Wall A1 backbone shown for comparison
Figure 1. Hysteresis results for Walls A1-A3 (2.5 in. plate washer)

OSU Shearwall Testing Report for AF&PA, May 2004 [FINAL] page 8
-15000
-10000
-5000
0
5000
10000
15000
-5 -3 -1 1 3 5
Deflection (In)
Forc
e (L
b-F)
A3
A1
Wall B1 (3 in. plate washer) ∆ref = 3.3 in.Wall A1 and A3 backbones shown for comparison
-15000
-10000
-5000
0
5000
10000
15000
-5 -3 -1 1 3 5
Deflection (In)
Forc
e (L
b-F)
A3
A1 B1
B2
Wall B2 (3 in. plate washer) ∆ref = 3.3 in.Wall A1, A3, B1 and B2 backbones shown for comparison
-15000
-10000
-5000
0
5000
10000
15000
-5 -3 -1 1 3 5
Deflection (In)
Forc
e (L
b-F)
A3
A1 B1
B2 B3
Wall B3 (3 in. plate washer)∆ref = 3.3 in.Wall A1, A3, B1, and B2 backbones shown for comparison
Figure 2. Hysteresis results for Walls B1-B3 (3 in. plate washer)

OSU Shearwall Testing Report for AF&PA, May 2004 [FINAL] page 9
-15000
-10000
-5000
0
5000
10000
15000
-5 -3 -1 1 3 5
Deflection (In)
Forc
e (L
b-F)
A3
A1B1
B2
B3
Wall C1 (standard round washer)∆ref = 3.3 in.Wall A1, A3, B1, B2, and B3 backbones shown for comparison
-15000
-10000
-5000
0
5000
10000
15000
-5 -3 -1 1 3 5
Deflection (In)
Forc
e (L
b-F)
A3
A1B1
B2
B3
C2
Wall C2 (standard round washer)∆ref = 3.3 in.Wall A1, A3, B1, B2, and B3 backbones shown for comparison
-15000
-10000
-5000
0
5000
10000
15000
-5 -3 -1 1 3 5
Deflection (In)
Forc
e (L
b-F)
A3
A1B1
B2
B3
C2
Wall C3 (standard round washer)∆ref = 3.3 in.Wall A1, A3, B1, B2, and B3 backbones shown for comparison
Figure 3. Hysteresis results for Walls C1-C3 (standard round washer)

OSU Shearwall Testing Report for AF&PA, May 2004 [FINAL] page 10
-15000
-10000
-5000
0
5000
10000
15000
-5 -3 -1 1 3 5
Deflection (in)
Forc
e (lb
-F)
A3
A1
B1
B2
B3
C2
Wall D1 (2 in. plate washer)∆ref = 3.3 in.A1, A3, B1, B2, B3, and C2 backbones shown for comparison
-15000
-10000
-5000
0
5000
10000
15000
-5 -3 -1 1 3 5
Deflection (In)
Forc
e (L
b-F)
A3
A1B1
B2
B3
C2
Wall D2 (2 in. plate washer)∆ref = 3.3 in.A1, A3, B1, B2, B3, and C2 backbones shown for comparison
-15000
-10000
-5000
0
5000
10000
15000
-5 -3 -1 1 3 5
Deflection (In)
Forc
e (L
b-F)
A3
A1
B1
B2
B3
C2
Wall D3 (2 in. plate washer)∆ref = 3.3 in.A1, A3, B1, B2, B3, and C2 backbones shown for comparison
Figure 4. Hysteresis results for Walls D1-D3 (2 in. plate washer)

OSU Shearwall Testing Report for AF&PA, May 2004 [FINAL] page 11
Figure 1. Hydraulic actuator located at top of wall
Figure 2. Shearwall assembly in test fixture

OSU Shearwall Testing Report for AF&PA, May 2004 [FINAL] page 12
Figure 3. Shearwall assembly showing top loading beam and coupling to actuator
Figure 4. Hold-down in corner of shearwall

OSU Shearwall Testing Report for AF&PA, May 2004 [FINAL] page 13
Figure 5. Fastener pull-out at panel edges along center stud (Specimen A1)

OSU Shearwall Testing Report for AF&PA, May 2004 [FINAL] page 14
Figure 6. Uplift of sole plate at hold-down (Specimen A1)
Figure 7. Sheathing pull-away at corner (Specimen A1)

OSU Shearwall Testing Report for AF&PA, May 2004 [FINAL] page 15
Figure 8. Sheathing edge pull-out (Specimen A2)
Figure 9. Sole plate after failure, no splitting (Specimen A2)
OSU Shearwall Testing Report for AF&PA, May 2004 [FINAL] page 16
Figure 10. Fastener failure at sole plate, nail bending/ripping through sheathing (Specimen A3)
Figure 11. Failure at bottom of wall, some splitting of sole plate (Specimen A3)

OSU Shearwall Testing Report for AF&PA, May 2004 [FINAL] page 17
Figure 12. Close-up of sole plate splitting (Specimen A3)
Figure 13. End stud failure at hold-down (Specimen B1)

OSU Shearwall Testing Report for AF&PA, May 2004 [FINAL] page 18
Figure 14. Failure showing split at end of sole plate (Specimen B1)
Figure 15. End stud failure (Specimen B1)

OSU Shearwall Testing Report for AF&PA, May 2004 [FINAL] page 19
Figure 16. Multiple failures, but no splitting of sole plate (Specimen B1)
Figure 17. Start of a split in sole plate (Specimen C1)

OSU Shearwall Testing Report for AF&PA, May 2004 [FINAL] page 20
Figure 18. Sole plate splitting at hold-down (Specimen C1)
Figure 19. Sole plate splitting from hold-down to first washer location; no bending of washer (Specimen C1)

OSU Shearwall Testing Report for AF&PA, May 2004 [FINAL] page 21
Figure 20. Top view of sole plate splitting from hold-down to first washer (Specimen C1)
Figure 21. End stud and sole plate failures (Specimen C1)

OSU Shearwall Testing Report for AF&PA, May 2004 [FINAL] page 22
Figure 22. Sole plate split along its length (Specimen C1)
Figure 23. Multiple slits at sole plate (Specimen C1)
OSU Shearwall Testing Report for AF&PA, May 2004 [FINAL] page 23
Figure 24. Sole plate split between interior studs (Specimen C1)
Figure 25. Sole plate split through interior bolt location (Specimen C1)

OSU Shearwall Testing Report for AF&PA, May 2004 [FINAL] page 24
Figure 26. Failure at end of wall showing sole plate splitting (Specimen C2)
Figure 27. Anchor bolt showing slight embedment (but no bending) of washer (Specimen C3)

OSU Shearwall Testing Report for AF&PA, May 2004 [FINAL] page 25
Figure 28. Sole plate (post-test) showing washer embedment (Specimen C2)
Figure 29. Sole plate (post-test) showing slight washer embedment (Specimen D2)

OSU Shearwall Testing Report for AF&PA, May 2004 [FINAL] page 26
Figure 30. Sheathing separation from framing (Specimen D2)
Figure 31. Sheathing separation from bottom plate, showing bolted anchor and hold-down (Specimen D3)

OSU Shearwall Testing Report for AF&PA, May 2004 [FINAL] page 27
APPENDIX A: CUREE Cyclic Loading Protocol
Technical Reference: Krawinkler, H., Parisi, F., Ibarra, L., Ayoub, A. and Medina, R. (2000), “Development of a Testing Protocol for Wood Frame Structures,” CUREE Publication No. W-02, Consortium of Universities for Research in Earthquake Engineering, Richmond, CA.
-40
-30
-20
-10
0
10
20
30
40
0 50 100 150 200
Tim e (se conds)
Sli
p (
mm
Ex amples of pr imary c y c les
Initiation c y c les
Ex amples of tra iling c y c les
Sec ond primary c y c le, us ed f or y ie ld point
Firs t pr imary c y c le, us ed f or initia l s tif f nes s
Slip
Time
1.0∆ref