Cyclic epidemics, population crashes, and irregular ...
22
Cyclic epidemics, population crashes, and irregular eruptions in simulated populations of the Mountain Pine Beetle, Dendroctonus ponderosae. Michael France Nelson 1 , John T. Murphy 2 , Christopher Bone 3 , Mark Altaweel 4 1 Corresponding author [email protected] University of Oregon Department of Geography 1251 University of Oregon Eugene OR 97403-1251 2 Argonne National Laboratory, [email protected] 3 Department of Geography, University of Victoria, [email protected] 4 University College London Institute of Archaeology, [email protected]
Transcript of Cyclic epidemics, population crashes, and irregular ...

Cyclic epidemics, population crashes, and irregular eruptions in simulated
populations of the Mountain Pine Beetle, Dendroctonus ponderosae.
Michael France Nelson1, John T. Murphy2, Christopher Bone3, Mark Altaweel4
1 Corresponding author
University of Oregon
Department of Geography
1251 University of Oregon
Eugene OR 97403-1251
2 Argonne National Laboratory, [email protected] 3 Department of Geography, University of Victoria, [email protected] 4 University College London Institute of Archaeology, [email protected]

Keywords
Mountain Pine Beetle; Dendroctonus ponderosae; agent-based model; cellular
model
Abstract
The native Mountain Pine Beetle infests numerous native pine species in North
America, and can cause extensive mortality when populations enter an epidemic
state. We used an agent based cellular model of coupled beetle and host tree
populations to investigate the effects on population dynamics of modifying three
model components, representing factors that land managers have varying degrees
of control over: number of host trees, health of host trees, and number of surviving
beetle offspring. By varying model parameters corresponding to these three factors,
we observed a range of population behaviors including regular spatially-spreading
cycles of epidemics, sporadic epidemics, and beetle population crashes. The largest,
recurring epidemics occurred in simulations with dense populations of mostly
vigorous trees and moderately high beetle offspring production. The fewest
epidemics occurred with low beetle reproduction, and low tree population density.
With all other factors held constant, reducing the tree population below a threshold
reduced the proportion of cells experiencing beetle population epidemics. These
results are consistent with field observations of reduced tree losses to beetle
epidemics in thinned forest stands.
1. Introduction
Native bark beetles with eruptive population dynamics, alternating between
low-density endemic populations and large, high-density epidemic populations, are
among the major disturbance types in temperate conifer forests (Bebi et al., 2003;
Raffa et al., 2008; Veblen et al., 1994). Although population eruptions of these
native insects may be viewed as part of the natural disturbance regime of forests,
large scale epidemics generate intense public concern because of the potential for
lost timber revenue (Dhar et al., 2016), impaired aesthetic and recreational value
(Rosenberger et al., 2013), increased atmospheric carbon (Kurz et al., 2008; Logan
and Powell, 2001), declining water quality (Mikkelson et al., 2013), and a perceived
risk of large forest fires (Hart et al., 2015). In addition, higher than average winter
temperatures in recent decades have increased overwinter survival, leading to
unprecedented outbreaks of several Dendroctonus species, exacerbating concerns
regarding the impacts of native insect disturbances. For example, synchronized
population eruptions of the mountain pine beetle (Dendroctonus ponderosae
Hopkins, hereafter MPB) in western North America have killed millions of hectares
of several species of pine trees in the United States and Canada since the most

recent outbreaks began around in the mid-1990s (Raffa et al., 2008; Safranyik and
Wilson, 2006).
Population eruptions that involve the transition from endemic to epidemic
states often follow other disturbances, such as drought, fire, or storms, which can
weaken trees and enhance the beetles’ ability to attack host trees (Elkin and Reid,
2004; Marini et al., 2013; Raffa et al., 2008). In northern European forests, for
example, after severe windstorms that cause large-scale tree death from windthrow,
Norway Spruce bark beetle (Ips typographicus) populations take advantage of felled
trees and transition into epidemics, resulting in the mortality standing healthy trees
(Wermelinger, 2004). In North American forests, epidemic outbreaks of bark
beetles with similar cyclical population dynamics in the genera Ips and
Dendroctonus can be facilitated by previous disturbances such as drought and fire
(Perrakis et al., 2011; Raffa et al., 2008). Recent large epidemics in western North
America may also be related to climate trends such as warmer winters (Chapman et
al., 2012).
The timing of MPB lifecycle events is heavily influenced by climatic factors,
principally temperature (Bentz et al., 1991). In much of the MPB species range, low
winter temperatures are the most prominent constraint on MPB survival. In some
areas of the MPB range, minimum winter temperatures below -40˚C and
unseasonably cold temperatures during critical periods in the fall and spring cause
widespread MPB mortality (Bentz et al., 1991; Safranyik and Carroll, 2006;
Safranyik and others, 1978). Unusually mild winters can result in greater survival
and larger populations of emerging beetles. Since the success of a MPB mass attack
of a vigorous tree depends on the confluence of large numbers of beetles in a small
area, beetle overwinter survival rates are critical to the transition of endemic
populations to epidemics.
At low population levels, MPBs show preference for vigor-impaired trees that
do not have the resources to fend of attacking beetles. When enough impaired trees
are present, beetles can reproduce and increase their population sufficiently so that
they are able to employ successful mass attacks on larger, more vigorous trees.
These trees provide them with higher quality food and overwinter shelter, and
hence help to further increase population numbers. Thinning forests at opportune
times can halt the increase in beetle numbers by removing highly susceptible, vigor-
impaired trees (Gillette et al., 2014). Studies also suggest that thinning interferes
with the pheromone communication system used by MPBs. As beetles send
chemical pheromones to one another in order to attract additional beetles to a tree
already under attack, thinning may enhance wind flow through a stand, thereby
disrupting the effectiveness of pheromones as a form of communication(Bartos and
Amman, 1989; Logan et al., 1998).

Figure 1 Conceptual diagram of major components of the beetle/host system.
Temperature mediated changes to MPB population are beyond the direct
control of land managers. The primary tool available for the management of MPBs
is thinning, i.e. reducing the number of trees per hectare. It is an indirect method
that can increase the resistance of a tree, as well as a stand, to attack (Mitchell et al.,
1983; Waring and Pitman, 1985).
Numerous disturbances affecting the transition between endemic and
epidemic states in MPB populations, including temperature increase and drought
resulting from climate change, attack from other beetles, and wildfire, have been
studied via field observations, lab experiments, and modeling (e.g. Bentz and
Jönsson, 2015; Bone and Altaweel, 2014; Perez and Dragicevic, 2012; Powell and
Raffa, 2011; Trappe et al., 2009). While such studies provide insight into the drivers
of MPB outbreaks, the majority of studies focus efforts on beetles in the epidemic
state, and those that examine state transitions have only focused on the transition
from endemic to epidemic populations. Although Louis et al (2016) emphasize that
Tree Growth
BeetleDispersal
Attack Trees
Beetle Reproduction
Overwinter

understanding the dynamics of endemic populations that exist between outbreaks is
equally important for understanding the entire system, few papers have examined
the long-term cyclical nature of MPB.
The goal of this study is to characterize how stand-level tree and beetle
population dynamics potentially respond to changes in forest conditions, some of
which can be influenced by management practices, others of which are climatically
controlled. Specifically, we investigate how the interactions among the number of
surviving beetle offspring produced in vigor-impaired trees, the maximum number
of host trees per hectare, and the ratio of vigorous to vigor-impaired trees, could
affect the overall beetle and tree demographic patterns within a forest stand. We
build upon previous MPB simulation work, which has mostly focused on single
eruptions, by investigating temporal patterns of eruption dynamics over long time
intervals. To accomplish this goal, we developed an agent-based model (ABM) of
coupled MPB and host pine population to investigate regions of parameter space in
which global model behaviors, such as regular or irregular beetle population
eruption cycles, emerge from the interactions between MPBs and host trees.
2. Methods
2.1 The model
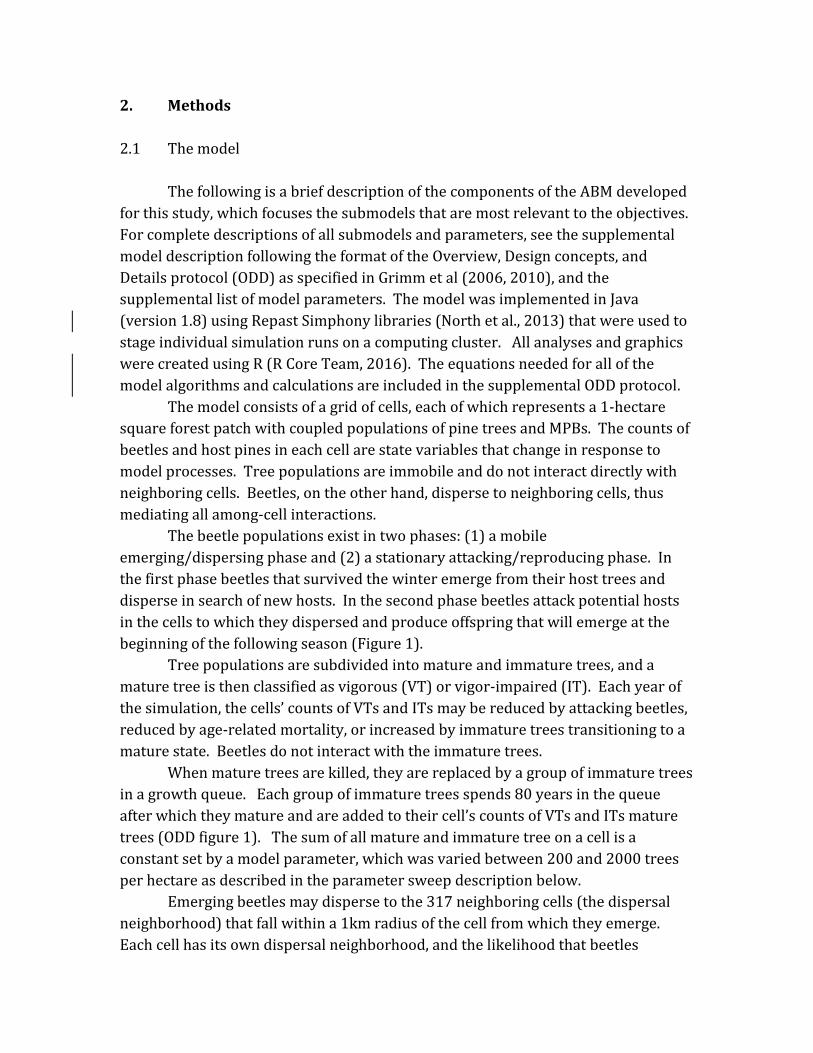
The following is a brief description of the components of the ABM developed
for this study, which focuses the submodels that are most relevant to the objectives.
For complete descriptions of all submodels and parameters, see the supplemental
model description following the format of the Overview, Design concepts, and
Details protocol (ODD) as specified in Grimm et al (2006, 2010), and the
supplemental list of model parameters. The model was implemented in Java
(version 1.8) using Repast Simphony libraries (North et al., 2013) that were used to
stage individual simulation runs on a computing cluster. All analyses and graphics
were created using R (R Core Team, 2016). The equations needed for all of the
model algorithms and calculations are included in the supplemental ODD protocol.
The model consists of a grid of cells, each of which represents a 1-hectare
square forest patch with coupled populations of pine trees and MPBs. The counts of
beetles and host pines in each cell are state variables that change in response to
model processes. Tree populations are immobile and do not interact directly with
neighboring cells. Beetles, on the other hand, disperse to neighboring cells, thus
mediating all among-cell interactions.
The beetle populations exist in two phases: (1) a mobile
emerging/dispersing phase and (2) a stationary attacking/reproducing phase. In
the first phase beetles that survived the winter emerge from their host trees and
disperse in search of new hosts. In the second phase beetles attack potential hosts
in the cells to which they dispersed and produce offspring that will emerge at the
beginning of the following season (Figure 1).
Tree populations are subdivided into mature and immature trees, and a
mature tree is then classified as vigorous (VT) or vigor-impaired (IT). Each year of
the simulation, the cells’ counts of VTs and ITs may be reduced by attacking beetles,
reduced by age-related mortality, or increased by immature trees transitioning to a
mature state. Beetles do not interact with the immature trees.
When mature trees are killed, they are replaced by a group of immature trees
in a growth queue. Each group of immature trees spends 80 years in the queue
after which they mature and are added to their cell’s counts of VTs and ITs mature
trees (ODD figure 1). The sum of all mature and immature tree on a cell is a
constant set by a model parameter, which was varied between 200 and 2000 trees
per hectare as described in the parameter sweep description below.
Emerging beetles may disperse to the 317 neighboring cells (the dispersal
neighborhood) that fall within a 1km radius of the cell from which they emerge.
Each cell has its own dispersal neighborhood, and the likelihood that beetles

emerging will travel to any cell in the neighborhood is determined by two factors:
the distance from the emerging cell (i.e. the distance score) and an occupancy score
calculated from the numbers of beetles and trees currently present in the cells. The
distance scores decrease with increasing distance from the neighborhood center
(ODD equation 5) representing the tendency for MPBs to preferentially disperse
short distances (Safranyik et al., 1992).
Empty cells are only weakly attractive to beetles, but as beetles begin to
arrive, the cells become more attractive to later-dispersing beetles. At first this
creates a positive feedback until an optimum within-cell population is reached, after
which point the arrival of additional beetles reduces the cell’s attractiveness
creating a negative feedback. These processes are a simplified representation of the
density-dependent aggregating and anti-aggregating communication used by real
MPBs (Safranyik and Carroll, 2006). Each cell’s occupancy score is calculated from
the counts of beetles and mature trees (ODD equations 4, 7, 8; ODD figure 2). The
overall attractiveness of neighborhood cells to dispersing beetles is a weighted
product of the distance and occupancy scores.
Mature trees are characterized by the minimum number of beetles required
to successfully attack them and their maximum carrying capacity of beetles. MPBs
begin the simulation attacking only the ITs (B-IT) but may transition to attacking
VTs (B-VT) if both VTs and MPBs are present in sufficient numbers. ITs, which
represent the weakened, resource-poor trees on which MPB populations subsist
when they are in an endemic state require 10 beetles and have a carrying capacity of
300. Fewer beetles are required to successfully attack ITs, but VTs are a better food
source, and therefore beetle reproduction is higher in VTs, which require 500
beetles to be attacked and have a carrying capacity of 1500 beetles. The beetles
employ a mass attack strategy, whereby arriving beetles amass on a single tree,
attempting to overcome its defenses. If too few beetles arrive to overcome the tree’s
attack threshold, the attack is unsuccessful, and the beetles die. If there are
sufficient arriving beetles, the beetles continue to attack the tree until it reaches its
carrying capacity, at which time the newly-arriving beetles select a new, empty tree
to attack.
MPB populations have been observed to change their pattern of host
selection when beetle population density is greater than approximately 300 – 500
beetles per hectare (Carroll et al., 2006). To mimic this transition, we defined a
threshold of 500 beetles per hectare. Below the threshold beetles only attack ITs. If
more than 500 attacking beetles arrive, and there are sufficient VTs, the cell will
transition to an epidemic state in which beetles only attack the VTs. Although MPBs
sometimes kill all host trees within stands during an epidemic, more commonly the
mortality is not total (Safranyik and Carroll, 2006). To simulate this aspect of MPB
epidemics, cells remained in an epidemic state until the density of VT hosts fell

below 10 per hectare, at which time the beetles transition back to only attacking ITs.
Vigor-impaired trees require the arrival of 10 beetles to be successfully attacked,
and have a carrying capacity of 300 beetles.
Dispersing beetles emerge from each cell in six daily batches, termed cohorts.
In between cohorts, each cell updates its occupancy score and recalculates the
relative attractiveness scores of all the cells in its dispersal neighborhood. The peak
emergence of mountain pine beetles from trees in a stand typically lasts between 7
to 10 days (Safranyik et al., 1975). To represent emergence over a relatively short
period, the daily dispersal of MPBs is for a dispersal period of 5 days, consisting of
30 total cohorts. Immigration of beetles from outside the area is mediated by a
long-distance dispersal submodel, in which approximately 1000 randomly chosen
cells receive packets of beetles, with an average size of 1000, each time step.
At the end of the active season, MPBs kill successfully attacked trees and
reproduce. Beetles in VTs (B-VT) produce a mean of 35 offspring while the mean
number of offspring in ITs was variable (Safranyik and Carroll, 2006; see parameter
sweep description below). Lodgepole pine stands typically become susceptible to
MPBs when the pines are between 80 to 100 years old (Safranyik and Carroll, 2006).
To simulate the regrowth of trees, each killed tree is placed into a maturation queue
and scheduled to become susceptible to MPBs between 78 and 80 years in the
future. Trees staged for regrowth in the queue are not visible to beetles until they
mature, at which time they are assigned a vigor status.
2.2 Parameter Sweeps
Three parameters were independently varied among simulations: the
number of surviving offspring in ITs (‘fert’), the proportion of newly maturing trees
that are IT (‘vig’), and the maximum number of trees per hectare (‘dens’).
Individual female beetles typically lay 60 – 80 eggs and mortality is typically within
the range of 85 – 98 % (Safranyik and others, 2003). We, therefore, varied mean
surviving offspring in ITs between 1.1 and 15 per beetle to bracket the observed
range of surviving beetles. The classification of pines as VT or IT in real forest
stands is difficult, however Carroll et al. (2006) estimated that approximately 30% –
70% of pines in lodgepole pine stands had at least one potential vigor-impairing
injury. We varied the proportion of ITs of 0% – 100% assuming that not all of those
putative vigor-impairing injuries affect the trees’ suitability to MPB reproduction.
Our range of potential mature trees per hectare (200 – 2000) brackets the range of
stems per hectare observed in lodgepole pine stands by Carroll et al. (2006).
For each simulation, values of each of the three parameters were chosen
uniformly and randomly from within the ranges described above. To gain a high-
resolution picture of model behavior in the 3-dimensional parameter space, 5000

independent simulations were run for 1000 yearly time steps. All simulations were
run on square grids of 200 x 200 cells (40,000 cells total). To avoid edge effects,
grid edges wrapped to create an edgeless toroidal surface.
2.3 Initial conditions
Each simulation was initialized with a pulse of new trees set to begin
regenerating in year 25 of the simulation (Figure ODD-2). This represented a forest
in which a stand-replacing disturbance happened approximately 55 years before the
beginning of the simulation. The cells in each patch were initialized with a
randomly generated Poisson number of beetles (λ = 50) attacking ITs.
2.4 Simulation Long-Term Behavior: Behavior Schemata
To characterize the types of long-term behavior observed in the model
simulations, we used three, non-mutually-exclusive, binary schemata to classify
model runs focusing on different aspects of the results. Schema 1 contrasted
simulation runs in which the mean number of MPBs attacking IM trees was lower
than the mean number of MPBs immigrating into the model from outside the area
(80000 MPBs per year; ‘crash’ runs) with simulations in which the mean number of
MPBs was higher than 80000 but in which MPBs never transitioned to attacking VTs
(‘endemic’ runs). Schema 2 concerned those simulation runs with recurring cycles
of transitions between beetles attacking ITs and VTs. Runs were classified by the
standard deviation of the inter-cycle period over the last 500 simulation years with
‘regular’ simulations having standard deviations of less than 12.0, while ‘erratic’
simulations had standard deviations above 12.0 (Figure 2). Schema 3 also
classified runs having cyclic dynamics but focused on the mean length of the cycle
length in the final 500 simulation years. In schema 3, ‘short’ cycles were classified
as having a mean period of 60 years, while ‘long’ cycles were greater than 60 years,
but shorter than 120 years (Figure 2).
[ Insert Figure 2 here]
Figure 2. Histograms of the mean and standard deviation of the inter-epidemic
cycle periods.
2.5 Summary Statistics: Population Indices
To summarize the patterns observed in the population dynamics in the
individual model simulations, we developed the following three indices: 1) An
epidemic index, EP, calculated as the number of cells with B-VT divided by the total
number of simulation cells (Equation 1). 2) An index of B-VT (BV; Equation 2). 3)

An index of B-IT (BI; Equation 3). When calculating BV and BI for individual
simulations, the values were normalized by the value of Dens for that simulation
and the total number of cells in the simulation (40000) to create an index analogous
to the number of beetles in each individual tree.
Equation 1
EP = (# cells with B-VT) / (40000)
Equation 2a
BV = (sum of B-VT in all cells) / (40000 * Dens)
Equation 2b
BI = (sum of B-IT trees in all cells) / (40000 * Dens)
Although model simulations were run for 1000 annual time steps, many
individual simulations required several hundred burn-in steps before settling into a
regular pattern. We thus treated the first 500 steps as a burn-in period and the
three indices were calculated for each of the final 500 years in each simulation. The
average values of the indices for each simulation over the final 500 simulation years
were used for visualization in the parameter space.
2.6 Analyses: Classification and Regression
To analyze the system behavior of the model simulations in the parameter
space, we used support vector machine (SVM) classification and regression models
(Meyer et al., 2017). To analyze the system behavior of the model simulations in the
parameter space, we used support vector machine (SVM) classification and
regression models. Support Vector Machines (SVMs) are machine learning
algorithms that were originally developed to classify samples into one of two
possible categories based on their characteristics, i.e. their features. SVMs have
since been extended for use with more than two categories as well as for regression
modeling of continuous responses. SVMs are useful for data that exhibit complex
and nonlinear patterns, which are not amenable to traditional regression
techniques.
We created SVM regression models to visualize the three population indices
in the 3-dimensional parameter space. To visualize the 3-dimensional decision
boundaries for the simulation types in the three schemata, we created SVM
classification models. In all SVMs, the predictors were the three variable model
parameters (fert, vig, and dens). The SVMs were trained using 75% of the model
simulation data and the remaining 25% was used to assess the models’
performance. Based on preliminary, exploratory model building, models using
Gaussian kernels and epsilon-regression or C-classification model types for the
population index regression and schemata classification, respectively, outperformed
other configurations, and so these were used for further analysis.
3 Results
3.1 Simulation Behavior Types: Schemata
Relatively few simulations, ca. 15%, met the criteria for Schema 1. Of these,
the majority were simulations resulting in population crashes (Table 1). In these
crash simulations, the only beetles present were those arriving via long-distance
immigration that did not establish breeding populations, and the tree populations
reached stable equilibria (Figure 3a). In the endemic simulations, immigrating
beetles had self-sustaining populations for some portions of the simulation,
resulting in fluctuations of the tree populations (Figures 3b, c). Although these
simulations did not have cyclic epidemic outbreaks, the population dynamics were
linked to the the tree time-to-maturity with population cycles having intervals of
approximately 80 years (Figures 3b, c). Population crashes occurred, not
surprisingly, when fert was below approximately 4.5, regardless of the values of the
other parameters (Figure 4). A few crashes also occurred near the plane vig = 100%
(Figure Schema 1 param. space). In the parameter space, the small number of
endemic simulations clustered near the vig = 0 plane, evenly distributed with
respect to the other two parameters.
[ Insert Figure 3 here]
Figure 3. Tree and Beetle population dynamics for selected, representative
individual simulations. (a) a typical ‘crash’ simulation. (b) an example of an
‘endemic’ simulation with cyclic population dynamics. (c) an ‘endemic’ simulation
with self-sustaining and non self-sustaining periods. The dotted line in the beetles
panel shows the mean number of beetles arriving via long-distance immigration
submodel (the self-sustaining threshold). The dotted line in the trees panel is at
40000, the number of cells in the simulation, corresponding to an average of 1 tree
per cell.
[Insert Figure 4 here]
Figure 4. 3D parameter space visualizations for Schema 1 simulations (top row)
and the indices of beetles per vigorous (BV) and vigor-impaired trees (BI). 2D plots
are slices of parameter space. Contour lines are either SVM decision boundaries
(black lines) or SVM regression isosurfaces (rainbow color lines).
[Insert Figure 5 here]
Figure 5. Selected individual simulation population dynamics plots. (a) a
simulation with regularly spaced (Schema 2), mid-length (Schema 3) epidemics. (b)
a simulation with irregular epidemics. (c) a simulation with regularly-spaced short
cycle epidemics.
[Insert Figure 6 here]
Figure 6. Spatiotemporal spread and collapse of an epidemic outbreak (black cells, in which beetles are attacking vigorous trees) through a simulated 100 by 100 toroidal grid.
Most of the simulations resulted in recurring cycles with periods of beetles
attacking ITs alternating with epidemics. Simulations with regularly-spaced
epidemic cycles tended to have epidemic outbreaks at approximately 80-year
periods (Figure 5a). In the simulations with recurrent epidemic cycles, the typical
outbreak was initiated by an increase in the numbers of ITs and/or VTs, followed
closely by an increase in B-IT that allowed their populations to overcome the VT
attack threshold some cells (Figures 5a, b). Following the initiation of an outbreak
phase in a cell or cluster of cells, the outbreak spread radially outward, eventually
exhausting the VTs in the center, forming an expanding donut shape that eventually
swept across the whole landscape (Figure 6). A subset of simulations that had
recurring epidemics were examined for the spatial characteristics of the spreading
epidemics, and in most cases the epidemics swept across the entire grid as in Figure

6 (not shown). Regularly-spaced epidemics generally occurred immediately
following the maturation of large numbers of trees.
In contrast, in the simulations with more erratically spaced epidemics the
mature trees persisted in large equilibrium populations for longer periods between
epidemics (Years 780 – 900 in Figure 5b). In these simulations, forest conditions
were perched at a critical state, vulnerable to stochastic events pushing the MPB
populations above the VT attack threshold in enough cells to start an epidemic. The
same pattern of increasing IT/VT populations followed by beetle population booms
and a transition from B-IT to B-VT were present in the Schema 3 simulations, the
key difference being that the mid-cycle simulations developed approximately 80-
year epidemic cycle (Figure 5a) while the short-cycle simulations usually had
secondary, often smaller, epidemic episode in between the 80-year cycles (contrast
Figures 5a, c).
The decision boundaries for the erratic/regular periods and mid/short
return intervals of epidemics were both complex 3D surfaces that differed from each
other (Figures 7, 8). Erratic return intervals tended to occur at mid to high values
of dens while regularly spaced intervals tended to occur in the regions where fert
was high and dens was low (Figure 7). High tree density was also associated with
short return intervals, while simulations near the plane at dens = 100 tended to have
periods closer to the tree regeneration time (Figure 8). Although high/low values of
dens were very generally associated with different sides of the boundaries, the
boundaries were not perfectly aligned with each other such that in different regions
of the parameter space, different combinations of the classes in schemata 2 and 3
were predicted. For example, a simulation with dens = 2000, fert = 15, and vig = 0.5
is expected to have short but erratically-spaced epidemic return intervals. Keeping
fert and vig the same, but changing dens to 200, the predicted outcome would be for
longer, but still erratic return intervals. Although the two decision boundaries were
different, they did share some general features, producing some regions in
parameter space with consistent characteristics. Both surfaces very roughly divided
the dens axis in two with short and erratic cycles occurring together at high
densities and mid length regular cycles at lower densities (Figures 7, 8). This
correspondence was strongest at mid to high values of fert.

[Insert Figure 7 here]
Figure 7. 3D parameter space views for simulations as classified under Schema 2.
Interpretation and symbols are as described in figure 4.
[Insert Figure 8 here]
Figure 8. 3D parameter space views for simulations as classified under Schema 3.
Interpretation and symbols are as described in figure 4.
[Insert Figure 9 here]
Figure 9. 3D parameter space views for the index of epidemic cells (Epi).
Interpretation and symbols are as described in figure 4.
Schema 1 2 3
SVM Model Prediction Accuracy 99% 72% 82%
Class crash endemic regular erratic short long
Count 660 105 1832 2329 2078 2014
Table 1. Summary of Support Vector Machine decision models
3.2 Simulation Summary Stats: Population Indices
The indices for B-VT and B-IT (BV and BI, respectively) were relatively
insensitive to changes in the density of host trees throughout much of the parameter
space, as illustrated by the parallel orientation of the isosurfaces with respect to the
tree density axis (Figure 4). BI was greatest at low values of vig and high values of
fert. As with BI, the BV isosurfaces were mostly parallel to the tree density axis,
indicating that the number of beetles attacking individual trees doesn’t vary with
the numbers of available trees, i.e. dens. (Figure 4). Intuitively, the main difference
between the surfaces for BI and BV were that there were the most beetles per
impaired tree when there was high beetle fertility and few vigorous trees, while the
greatest beetles per vigorous tree occurred when most trees were vigorous. The
shapes of the contours for the isosurfaces for BI and BV did not correspond to the
decision boundary curves for any of the Schema indicating that the mean number of
beetles per tree is not related to the long-term behavior of the system.
In contrast to the beetle indices, which were determined mostly by the
interaction of offspring counts and proportion of VTs, the proportion of epidemic
cells was determined by complex interactions of all three parameters as
demonstrated by the complex shapes of the isosurfaces in Figure 9. The epidemic
cell count was maximized at moderately high values of vig and high values of dens.

Not surprisingly, there were few epidemic cells when all three parameters were
low; but, notably, epidemic cells could be lowered at high levels of fert and vig by
reducing the density of trees per hectare. The lack of a maximum of EP when all
parameters were maximized since while there are many VTs available for MPB to
colonize, there were too few ITs in which an incipient MPB population could take
hold, so epidemics were relatively rare.
Unlike the patterns for BI and BV, there was some correspondence between
the Epi isosurfaces and the shapes of the decision boundaries for Schemata 2 and 3.
The regions of high Epi roughly corresponded to areas in parameter space where
short, erratically-spaced epidemic cycles were common. The region of greatest
overlap was with moderate to high proportions of vigorous trees (approx. 40 –
100%), moderate to high fert (> approx. 4) and densities above 1000 trees/ha.
Intuitively it is logical that these parameter combinations could result in shorter
cycles, because there are many vigorous trees available, from the combination of
high dens and vig, and beetles are quickly able to take advantage of spikes in
populations of ITs because of their high fert. The cycles in this may be more
irregular (and with shorter return intervals) because of the high number of
constantly maturing VTs means that there are often sufficient numbers of VTs to
support an epidemic, as opposed to simulations with a smaller number of VTs
maturing outside of the main pulses.
4 Discussion
Our model captured numerous aspects of the population dynamics seen in
the MPB/pine host system and was rich enough to generate very different long-term
behaviors among simulation runs. Real populations undergo transitions between
four phases (Carroll et al., 2006), resulting in cyclic epidemic outbreak populations
that spread outward from an origin in space and time, eventually collapsing to pre-
epidemic levels. The expanding epidemic fronts, with collapsing populations in the
center generated by the model (Figure 6) are idealized representations of the spatial
spread of MPB epidemics. The phases of the tree/MPB population dynamics with
brief incipient epidemic phases with increasing B-IT populations coupled to tree
maturation, followed by epidemic and population collapse phases are apparent in
the temporal evolution of the model’s coupled populations before, during, and after
the cyclic outbreaks (Figure 5). Varying parameters allowed the model to exhibit
different behavior regimes, with differences in regularity and length of epidemic
cycles occurring in the simulations (Figure 5).
Several insights, which are not captured in models of a single epidemic,
emerge from the long-term behavior of the model. In our formulation, the MPB and
tree populations were tightly coupled, but the initiation of individual epidemics was

completely driven by the tree population dynamics. Whether the period of the
epidemic outbreaks was highly regular or erratic, the initiation of the transition to
B-VT always required the high populations of both VTs and ITs that were only
present after many trees completed their maturation cycle. In the case of the
irregular epidemics, tree populations reached large populations, temporarily at
equilibrium. The system was then perched at a critical state, susceptible to
stochastic fluctuations in the B-IT populations, waiting for sufficient MPB to
accumulate in one or a few cells to transition to the B-VI state.
Another key insight was that in a model with only two tree classes, it was
very difficult for endemic populations of B-IT to exist for long periods. Out of 5000
simulations, only 25 met our criteria to be classified as endemic. However, even
within these few endemic simulations, the populations of MPB tended to spend
much of the time below the self-sustaining threshold, with only fleeting periods in
which the location population exceeded the number of immigrants (Figure 3).
These brief self-sustaining periods generally coincided with the simultaneous
maturation of large numbers of ITs (Figure 3). It is important to note that the
simulations in which these endemic populations persisted at all were situated at an
extreme of the parameter space (Figure 4). They could only exist when the
proportion of VTs remained near zero, a scenario easy to create and maintain in a
model, but probably an unrealistic long-term steady-state for real forests, managed
or unmanaged. In most of the parameter space, the positive feedback generated by
increasing MPB populations was too strong to avoid epidemics and allow beetle and
tree populations to maintain long-term equilibrium populations.
In addition to the tree maturation process, long-term dispersal of MPB into
the simulation area from outside the model was a critical driver of MPB population
dynamics in the model. Even in those simulations with recurrent epidemics, outside
immigration was required to supply sufficient MPBs when conditions became
favorable for the incipient-epidemic phase to begin. Prior to the parameter sweep,
during the model development phase, it was observed that without immigration,
most resulted in complete population crashes, either immediately or after one or
two epidemic cycles. This was the case even for parameter combinations that were
extremely favorable to MPB such as high values of fert and dens. This phenomenon
is apparent in the individual simulation population dynamic plots with recurrent
epidemics, in which the number of B-IT was below the number of immigrants, and
the numbers of trees per cell were very low, for much of the duration of simulations
(Figure 5).
Interpreting the model outputs in the context of real forests generates
several possible consequences for management. First, the three parameters varied
in the sweep represent aspects of the forest over which managers have varying
degrees of control. The density of trees per hectare, dens, is the easiest for managers

to manipulate, via thinning, while the proportion of vigorous trees may be indirectly
managed but is subject to many external factors, and it is probably not possible for
managers to influence the number of MPB offspring produced. Thinning, analogous
to reducing dens in the model, is recommended as a tool to reduce tree loss to MPBs
(Fettig et al., 2014; Gillette et al., 2014). These recommendations are supported by
observations of reduced tree mortality in thinned forests (e.g. (McGregor et al.,
1987; Mitchell et al., 1983; Whitehead and Russo, 2005).
The model results generally concur with these recommendations, and they
suggest that thinning is most effective in very dense forests (Figure 9). In the
simulated forests, decreasing dens generally reduced the epidemic index (Epi) when
tree density was greater than approximately 1000 trees per hectare across much of
the range of the vig and fert parameters. Below that density, however, further
thinning produced much smaller reductions in Epi, suggesting that resources spent
on thinning moderately dense forests may be better directed to dense forests. In
the model, reducing dens was most effective for values of fert greater than approx. 3
(Figure EPI c), but estimating this parameter directly in real forests would be
difficult for managers. Some factors, however, such as mild winters are understood
to increase MPB overwinter survival, and that information may help managers make
educated guesses about when and where thinning could be effective or not.
As with any model, care must be taken when not to overinterpret the results
in the context of real forests. In these simulations, we considered relatively small,
forested areas in isolation. The only interaction with areas outside the simulated
region was via the immigrating packets of beetles (via the Long-Distance Dispersal
submodel, see the supplemental ODD protocol). In addition, the simulated areas
were toroidal to avoid edge effects. However, in real forests MPB epidemics spread
via contagion and many managed forest patches of the sizes considered here exist in
the context of larger contiguous forested areas, which may have abrupt and/or
gradual boundaries. Expanding the maximum possible simulated area via further
model code optimization and parallel computing would enable investigation of
model behavior over greater spatial extents.
Incorporating spatial and temporal heterogeneity in the environmental
parameters of the model would allow to explore, for example, whether small refugia
in which MPB reproduction is always higher serve as sources for epidemics in
surrounding managed regions. In this situation, beetles may be able to enter the
managed patch in high enough numbers to surpass the requirement of an
incubation period in ITs and attack the VTs directly. This could result in major
losses, even though the results of the patch under consideration was in a state that
in this model would not have been a candidate for a beetle epidemic.
Like all models, ours makes numerous implicit and explicit assumptions and
simplifications, especially in the representation of trees. There is already a rich

tradition of mathematical and agent-based models of the MPB-pine system, each of
which focuses on different aspects. For example, Safranyik et al. (1999) created a
model of MPB population dynamics that explicitly considers host tree size classes,
rather than a simple VT/IT representation. A more sophisticated submodel of tree
growth taking into account tree sizes, such as a gap model (Pretzsch et al., 2015;
Shugart and West, 1977) could be developed within our model.
A key advantage of a modeling approach, however, is to be able to examine
how aspects of a real system are captured via simplified abstractions. Therefore,
comparing the behavior of this model to future versions that incorporate more
detailed submodels will provide a valuable opportunity to directly compare model
behavior with differing levels of detail in the tree growth submodel. It is important
to distinguish models that are designed to predict real phenomena from those that
are created to gain insight into how systems may work, such as the model we
present here (Epstein, 2008). From our simple model, a range of behaviors
reminiscent of the variability of MPB dynamics in real forests emerged. It provides a
stepping stone from which further model elaborations and refinements can help
focus on different aspects of the MPB-pine system.
5. Acknowledgments
This research is based on work supported by the National Science Foundation under
Grant No. 1414041
6. References
Adler, D., Murdoch, D., and others (2018). rgl: 3D Visualization Using OpenGL.
Bartos, D.L., and Amman, G.D.; (1989). Microclimate: an alternative to tree vigor as a basis for mountain pine beetle infestations (Ogden, UT, United States: USDA Forest Service Intermountain Research Station).
Bebi, P., Kulakowski, D., and Veblen, T.T. (2003). Interactions between fire and spruce beetles in a subalpine rocky mountain forest landscape. Ecology 84, 362–371.
Bentz, B.J., and Jönsson, A.M. (2015). Modeling bark beetle responses to climate change. Bark Beetles Biol. Ecol. Native Invasive Species Acad. Press San Diego CA 533–553.
Bentz, B.J., Logan, J.A., and Amman, G.D. (1991). Temperature-dependent development of the mountain pine beetle (Coleoptera: Scolytidae) and simulation of its phenology. Can. Entomol. 123, 1083–1094.

Bone, C., and Altaweel, M. (2014). Modeling micro-scale ecological processes and emergent patterns of mountain pine beetle epidemics. Ecol. Model. 289, 45–58.
Carroll, A.L., Aukema, B.H., Raffa, K.F., Linton, D.A., Smith, G.D., and Lindgren, B.S. (2006). Mountain pine beetle outbreak development: the endemic—incipient epidemic transition. Pac. For. Cent. Vic. BC 27.
Chapman, T.B., Veblen, T.T., and Schoennagel, T. (2012). Spatiotemporal patterns of mountain pine beetle activity in the southern Rocky Mountains. Ecology 93, 2175–2185.
Dhar, A., Parrott, L., and Heckbert, S. (2016). Consequences of mountain pine beetle outbreak on forest ecosystem services in western Canada. Can. J. For. Res. 46, 987–999.
Elkin, C.M., and Reid, M.L. (2004). Attack and Reproductive Success of Mountain Pine Beetles (Coleoptera: Scolytidae) in Fire-Damaged Lodgepole Pines. Environ. Entomol. 33, 1070–1080.
Epstein, J.M. (2008). Why Model? J. Artif. Soc. Soc. Simul. 11.
Feng, D., and Tierney, L. (2008). Computing and Displaying Isosurfaces in R. J. Stat. Softw. 28.
Fettig, C.J., Gibson, K.E., Munson, A.S., and Negrón, J.F. (2014). Cultural practices for prevention and mitigation of mountain pine beetle infestations. For. Sci. 60, 450–463.
Gillette, N.E., Wood, D.L., Hines, S.J., Runyon, J.B., and Negrón, J.F. (2014). The once and future forest: Consequences of mountain pine beetle treatment decisions. For. Sci. 60, 527–538.
Grimm, V., Berger, U., DeAngelis, D.L., Polhill, J.G., Giske, J., and Railsback, S.F. (2010). The ODD protocol: A review and first update. Ecol. Model. 221, 2760–2768.
Hart, S.J., Schoennagel, T., Veblen, T.T., and Chapman, T.B. (2015). Area burned in the western United States is unaffected by recent mountain pine beetle outbreaks. Proc. Natl. Acad. Sci. 112, 4375–4380.
Kurz, W.A., Dymond, C.C., Stinson, G., Rampley, G.J., Neilson, E.T., Carroll, A.L., Ebata, T., and Safranyik, L. (2008). Mountain pine beetle and forest carbon feedback to climate change. Nature 452, 987–990.
Logan, J., and Powell, J. (2001). Ghost Forests, Global Warming, and the Mountain Pine Beetle (Coleoptera : Scolytidae). Am. Entomol. 47, 160–173.

Logan, J.A., White, P., Bentz, B.J., and Powell, J.A. (1998). Model analysis of spatial patterns in mountain pine beetle outbreaks. Theor. Popul. Biol. 53, 236–255.
Louis, M., Toffin, E., Gregoire, J.-C., and Deneubourg, J.-L. (2016). Modelling collective foraging in endemic bark beetle populations. Ecol. Model. 337, 188–199.
Marini, L., Lindelöw, Å., Jönsson, A.M., Wulff, S., and Schroeder, L.M. (2013). Population dynamics of the spruce bark beetle: a long-term study. Oikos 122, 1768–1776.
McGregor, M.D., Amman, G.D., Schmitz, R.F., and Oakes, R.D. (1987). Partial cutting lodgepole pine stands to reduce losses to the mountain pine beetle. Can. J. For. Res. 17, 1234–1239.
Meyer, D., Dimitriadou, E., Hornik, K., Weingessel, A., and Leisch, F. (2017). e1071: Misc Functions of the Department of Statistics, Probability Theory Group (Formerly: E1071), TU Wien.
Mikkelson, K.M., Dickenson, E.R., Maxwell, R.M., McCray, J.E., and Sharp, J.O. (2013). Water-quality impacts from climate-induced forest die-off. Nat. Clim. Change 3, 218–222.
Mitchell, R.G., Waring, R.H., and Pitman, G.B. (1983). Thinning lodgepole pine increases tree vigor and resistance to mountain pine beetle. For. Sci. 29, 204–211.
North, M.J., Collier, N.T., Ozik, J., Tatara, E.R., Macal, C.M., Bragen, M., and Sydelko, P. (2013). Complex adaptive systems modeling with Repast Simphony. Complex Adapt. Syst. Model. 1, 3.
Perez, L., and Dragicevic, S. (2012). Landscape-level simulation of forest insect disturbance: Coupling swarm intelligent agents with GIS-based cellular automata model. Ecol. Model. 231, 53–64.
Perrakis, D.D., Agee, J.K., and Eglitis, A. (2011). Effects of prescribed burning on mortality and resin defenses in old growth ponderosa pine (Crater Lake, Oregon): Four years of post-fire monitoring. Nat. Areas J. 31, 14–25.
Powell, E.N., and Raffa, K.F. (2011). Fire Injury Reduces Inducible Defenses of Lodgepole Pine against Mountain Pine Beetle. J. Chem. Ecol. 37, 1184–1192.
Pretzsch, H., Forrester, D.I., and Rötzer, T. (2015). Representation of species mixing in forest growth models. A review and perspective. Ecol. Model. 313, 276–292.
R Core Team (2016). R: A Language and Environment for Statistical Computing (Vienna, Austria: R Foundation for Statistical Computing).
Raffa, K.F., Aukema, B.H., Bentz, B.J., Carroll, A.L., Hicke, J.A., Turner, M.G., and Romme, W.H. (2008). Cross-scale Drivers of Natural Disturbances Prone to Anthropogenic Amplification: The Dynamics of Bark Beetle Eruptions. BioScience 58, 501–517.
Rosenberger, R.S., Bell, L.A., Champ, P.A., and White, E.M. (2013). Estimating the economic value of recreation losses in Rocky Mountain National Park due to a mountain pine beetle outbreak. West. Econ. Forum 12, 31–39.
Safranyik, L., and Carroll, A.L. (2006). The biology and epidemiology of the mountain pine beetle in lodgepole pine forests. In The Mountain Pine Beetle: A Synthesis of Its Biology, Management and Impacts on Lodgepole Pine., (Pacific Forestry Centre, Victoria, British Columbia, Canada: Canadian Forest Service), pp. 3–66.
Safranyik, L., and others (1978). Effects of climate and weather on mountain pine beetle populations.
Safranyik, L., and others (2003). Mountain pine beetle epidemiology in lodgepole pine. In Mountain Pine Beetle Symposium: Challenges and Solutions, pp. 33–40.
Safranyik, L., and Wilson, W.R. (2006). The mountain pine beetle: a synthesis of biology, management, and impacts on lodgepole pine (Natural Resources Canada, Canadian Forest Service, Pacific Forestry Centre, Victoria, BC).
Safranyik, L., Shrimpton, D.M., Whitney, H.S., and others (1975). An interpretation of the interaction between lodgepole pine, the mountain pine beetle and its associated blue stain fungi in western Canada. Manag. Lodg. Pine Ecosyst. 1, 406–428.
Safranyik, L., Linton, D.A., Silversides, R., and McMullen, L.H. (1992). Dispersal of released mountain pine beetles under the canopy of a mature lodgepole pine stand. J. Appl. Entomol. 113, 441–450.
Safranyik, L., Barclay, H.J., Thomson, A., and Riel, W.G. (1999). A Population Dynamics Model for the Mountain Pine Beetle, Dendroctonus Ponderosae Hopk.(Coleoptera Scolytidae) (Pacific Forestry Centre Victoria, Canada).
Shugart, H.H., and West, D.C. (1977). Development of an Appalachian deciduous forest succession model and its application to assessment of the impact of the chestnut blight. J Env. Manage 5, 161–179.
Trappe, M.J., Cromack Jr, K., Trappe, J.M., Perrakis, D.D., Cazares-Gonzales, E., Castellano, M.A., Miller, S.L., and others (2009). Interactions among prescribed fire, soil attributes, and mycorrhizal community structure at Crater Lake National Park, Oregon, USA. Fire Ecol. 5, 30–50.

Veblen, T.T., Hadley, K.S., Nel, E.M., Kitzberger, T., Reid, M., and Villalba, R. (1994). Disturbance Regime and Disturbance Interactions in a Rocky Mountain Subalpine Forest. J. Ecol. 82, 125–135.
Waring, R.H., and Pitman, G.B. (1985). Modifying lodgepole pine stands to change susceptibility to mountain pine beetle attack. Ecology 889–897.
Wermelinger, B. (2004). Ecology and management of the spruce bark beetle Ips typographus—a review of recent research. For. Ecol. Manag. 202, 67–82.
Whitehead, R.J., and Russo, G. (2005). “Beetle-proofed” lodgepole pine stands in interior British Columbia have less damage from mountain pine beetle.