Cycle Turn Indicator Direction and Swing Summary of … Momentum Indicator Bullish *When this...
21
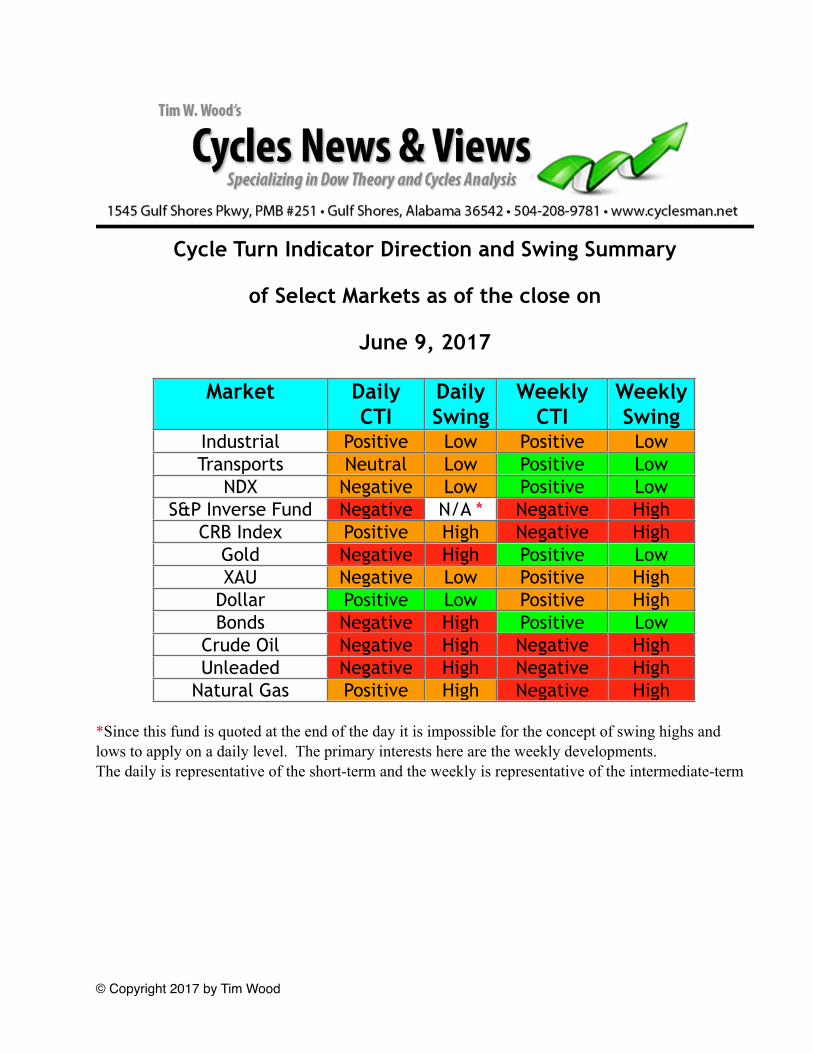
Cycle Turn Indicator Direction and Swing Summary of Select Markets as of the close on June 9, 2017 Market Daily CTI Daily Swing Weekly CTI Weekly Swing Industrial Positive Low Positive Low Transports Neutral Low Positive Low NDX Negative Low Positive Low S&P Inverse Fund Negative N/A * Negative High CRB Index Positive High Negative High Gold Negative High Positive Low XAU Negative Low Positive High Dollar Positive Low Positive High Bonds Negative High Positive Low Crude Oil Negative High Negative High Unleaded Negative High Negative High Natural Gas Positive High Negative High *Since this fund is quoted at the end of the day it is impossible for the concept of swing highs and lows to apply on a daily level. The primary interests here are the weekly developments. The daily is representative of the short-term and the weekly is representative of the intermediate-term © Copyright 2017 by Tim Wood
Transcript of Cycle Turn Indicator Direction and Swing Summary of … Momentum Indicator Bullish *When this...
Cycle Turn Indicator Direction and Swing Summary
of Select Markets as of the close on
June 9, 2017
Market Daily CTI
Daily Swing
Weekly CTI
Weekly Swing
Industrial Positive Low Positive LowTransports Neutral Low Positive Low
NDX Negative Low Positive LowS&P Inverse Fund Negative N/A * Negative High
CRB Index Positive High Negative HighGold Negative High Positive LowXAU Negative Low Positive High
Dollar Positive Low Positive HighBonds Negative High Positive Low
Crude Oil Negative High Negative HighUnleaded Negative High Negative High
Natural Gas Positive High Negative High
*Since this fund is quoted at the end of the day it is impossible for the concept of swing highs and lows to apply on a daily level. The primary interests here are the weekly developments. The daily is representative of the short-term and the weekly is representative of the intermediate-term
© Copyright 2017 by Tim Wood

Short-term Updates
Note on the Cycle Turn Indicator
The most important indicator we have is the Cycle Turn Indicator and the most important timeframe, at least in my mind, is the intermediate-term. This indicator has proven itself time and time again. In reality, this is all we really need to know. Everything else is secondary. That being said, please be sure to monitor the "Cycle Turn Indicator Direction and Swing Summary" above. Red indicates that a swing high and down turn of the Cycle Turn Indicator has occurred and lower prices should follow. The only exception here is that on the daily stock market signals we also want to see both the slow cycle Turn Indicator and the New High/New Low Differential in agreement with the original Cycle Turn Indicator, which is what is covered in this summary above. Yellow, is cautionary meaning that the Cycle Turn Indicator and the swing are not in agreement, which is typically indicative of a trend change. Green, means that a swing low has occurred and that the Cycle Turn Indicator is positive, which should be followed by higher prices. Again, the only exception here is the daily stock market signals in that we want to see both the slow Cycle Turn Indicator and the New High/New Low Differential in agreement with the original Cycle Turn Indicator, which is what is covered in this summary above. For everything else, all that matters is the formation of a swing and the direction of the Cycle Turn Indicator.
All subscribers who do not understand cyclical translation should click here "Notes for New Subscribers." It is important that you read and understand the content found in both of the PDF files that you will find at this link.
© Copyright 2017 by Tim Wood

June 11, 2017
StocksEnd of Week Weekly Indicator Summary Intermediate-Term Buy/NeutralEnd of Week Weekly Indicator Summary Intermediate-Term Buy/NeutralPrimary Indicators Primary Indicators Formation of a Weekly Swing Low BullishCycle Turn Indicator (CTI) BullishCTI on Rydex Tempest Fund * BearishConfirming IndicatorsConfirming IndicatorsTrend Indicator (TI) BullishAdvance/Decline Issues Diff BearishNew High New Low Diff BearishSecondary IndicatorsSecondary Indicators5 3 3 Stochastic BullishCycle Momentum Indicator Bullish*When this indictor is Bullish it is negative for the market and visa versa.*When this indictor is Bullish it is negative for the market and visa versa.
Daily Indicator Summary Short-Term Buy/NeutralDaily Indicator Summary Short-Term Buy/NeutralPrimary Indicators Primary Indicators Formation of a Daily Swing Low BullishCycle Turn Indicator (CTI) BullishSlow Cycle Turn Indicator (CTI) BullishNew High/New Low Differential BullishConfirming IndicatorsConfirming IndicatorsTrend Indicator (TI) BullishMcClellan Intermediate Term Breadth Momentum Oscillator (ITBM)
Bullish
McClellan Intermediate Term Volume Momentum Oscillator (ITVM)
Bullish
McClellan Summation Index BullishMcClellan Volume Summation Index Bullish
Secondary Short Term IndicatorsSecondary Short Term Indicators5 3 3 Stochastic BearishCycle Momentum Indicator BullishTrading Cycle Oscillator BullishMomentum Indicator BullishRatio Adjusted McClellan Oscillator Crossover
Bullish
Accumulation/Distribution Index Bearish
Gold’s decline out of its trading cycle top remains intact. The advance out of the dollar’s trading cycle low appears a bit weak so far, but remains intact. The short-term sell signal and decline into the trading cycle low on bonds remains intact and bonds have moved into the middle portion of the timing band for the now due trading cycle low. Equities continue to be a mixed bag. The Nasdaq 100 sold off 2.44% on Friday, but did not trigger a short-term sell signal, because they first moved higher, which prevented the formation of a daily swing high. We should at least have the trading cycle top in place there and any further weakness on Monday that completes the formation of a daily swing high will trigger a short-term sell signal. The short-term buy signal on the Industrials remains intact and price should be at or near the trading cycle top there as well. The overall price/oscillator picture in equities also continues to be suggestive of the trading cycle top, but until a daily swing high is formed and confirmed by a downturn of the Primary Short-Term Indicators, a short-term sell signal will not be triggered.
© Copyright 2017 by Tim Wood
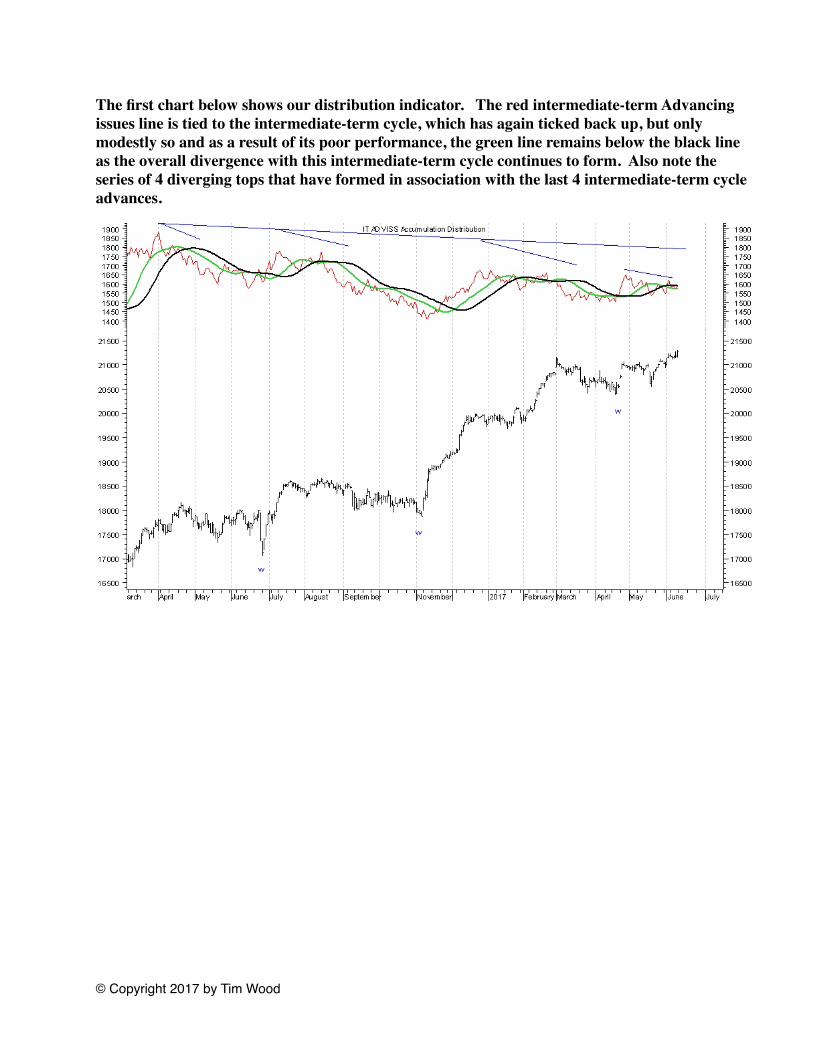
The first chart below shows our distribution indicator. The red intermediate-term Advancing issues line is tied to the intermediate-term cycle, which has again ticked back up, but only modestly so and as a result of its poor performance, the green line remains below the black line as the overall divergence with this intermediate-term cycle continues to form. Also note the series of 4 diverging tops that have formed in association with the last 4 intermediate-term cycle advances.
© Copyright 2017 by Tim Wood

The Trading Cycle Oscillator in the upper window has turned slightly back above it trigger line. The Momentum indicator has turned down, but is still sitting just above its zero line. The 5 3 3 stochastic in the middle window has turned up, but remains below its trigger line. The Trend Indicator remains positive. The first of our Primary Short-Term Indicators is the New High New Low Differential, plotted with price, which has turned back up.
© Copyright 2017 by Tim Wood
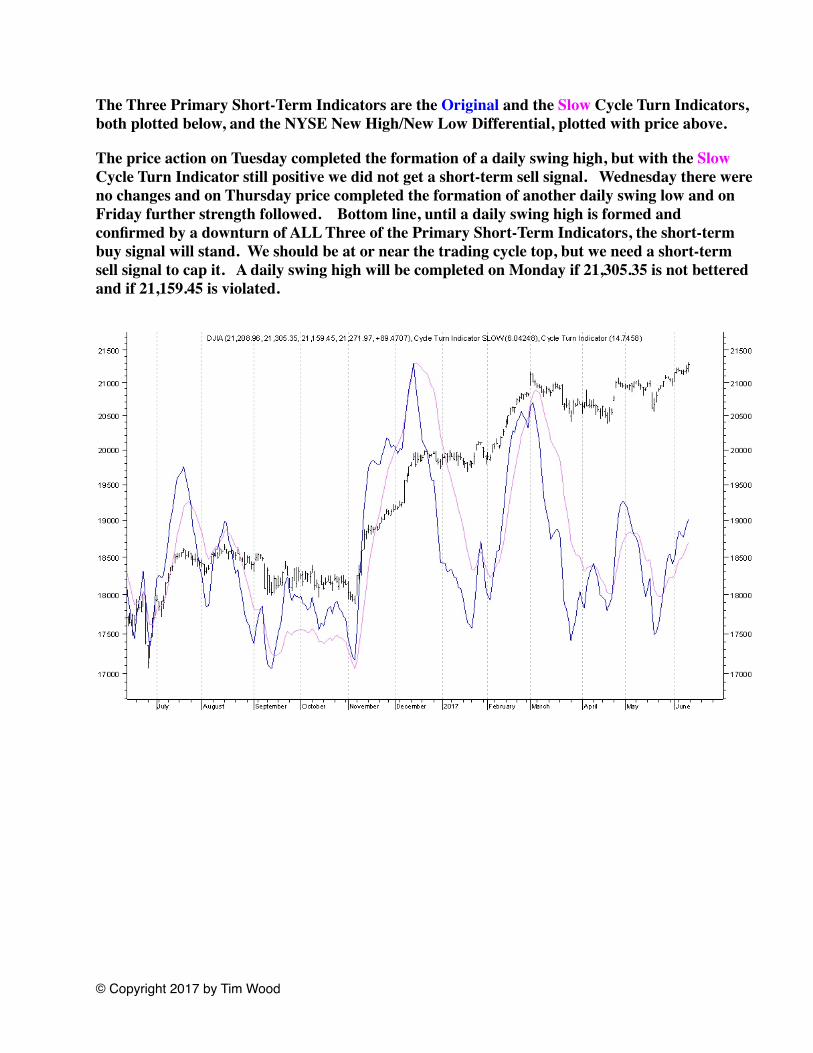
The Three Primary Short-Term Indicators are the Original and the Slow Cycle Turn Indicators, both plotted below, and the NYSE New High/New Low Differential, plotted with price above.
The price action on Tuesday completed the formation of a daily swing high, but with the Slow Cycle Turn Indicator still positive we did not get a short-term sell signal. Wednesday there were no changes and on Thursday price completed the formation of another daily swing low and on Friday further strength followed. Bottom line, until a daily swing high is formed and confirmed by a downturn of ALL Three of the Primary Short-Term Indicators, the short-term buy signal will stand. We should be at or near the trading cycle top, but we need a short-term sell signal to cap it. A daily swing high will be completed on Monday if 21,305.35 is not bettered and if 21,159.45 is violated.
© Copyright 2017 by Tim Wood

Both the Intermediate Term Breadth Momentum Oscillator and the Intermediate Term Volume Momentum Oscillator have turned slightly back above their trigger lines.
© Copyright 2017 by Tim Wood

The McClellan Oscillator and Summation Indexes are also used to measure the intermediate- term internals. The Ratio Adjusted McClellan Oscillator in the upper window is shorter-term in nature and is therefore used to help identify the shorter-term tops and bottoms, but it is also useful in identifying intermediate-term cycle tops and bottoms.
Both the McClellan Summation Index and the McClellan Volume Summation Index have ticked back up. The Ratio Adjusted McClellan Oscillator in the upper window is sitting right on its trigger line.
© Copyright 2017 by Tim Wood
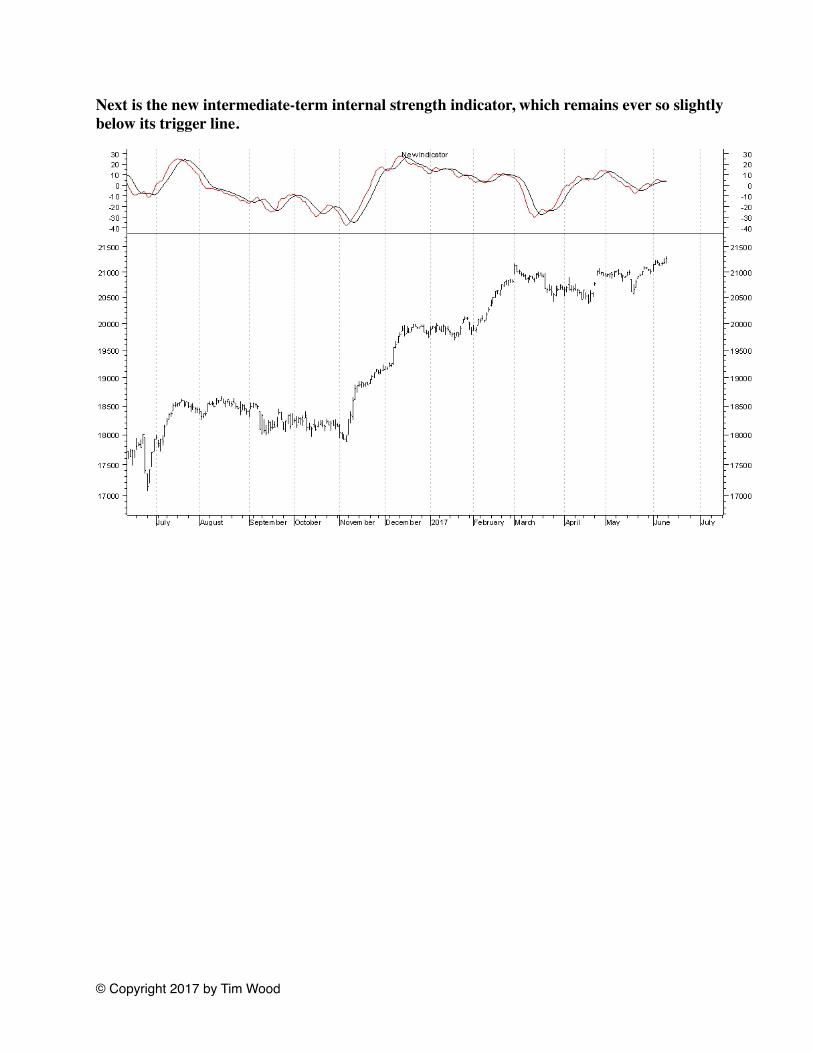
Next is the new intermediate-term internal strength indicator, which remains ever so slightly below its trigger line.
© Copyright 2017 by Tim Wood

The short-term Accumulation/Distribution Index has turned back down below its trigger line.
© Copyright 2017 by Tim Wood

Both the short-term Advancing/Declining volume line and the Advancing/Declining issues line have turned back up.
In Summary, the short-term buy signal remains intact. The overall short-term oscillator picture has improved slightly, but continues to be suggestive of the trading cycle top. Once a short-term sell signal is re-triggered this top should be in place. The current convergence of technicals continues to make for an important juncture. Stay Tuned!
© Copyright 2017 by Tim Wood

Next is our weekly chart of the Dow Jones Industrial Average. The timing band for the intermediate-term cycle low ran between February 23rd and April 27th. This low occurred on April 19th and the advance out of this low has struggled. The price action this past week did manage to turn the weekly CTI back up, which re-triggered an intermediate-term buy signal. That said, this buy signal is occurring with the weekly 5 3 3 stochastic at overbought levels, which has to make one cautious about the signal. Nonetheless, it is a signal and it will remain intact until it is reversed. Another weekly swing high will be completed in the coming week if 21,305.35 is not bettered and if 21,113.31 is violated.
© Copyright 2017 by Tim Wood
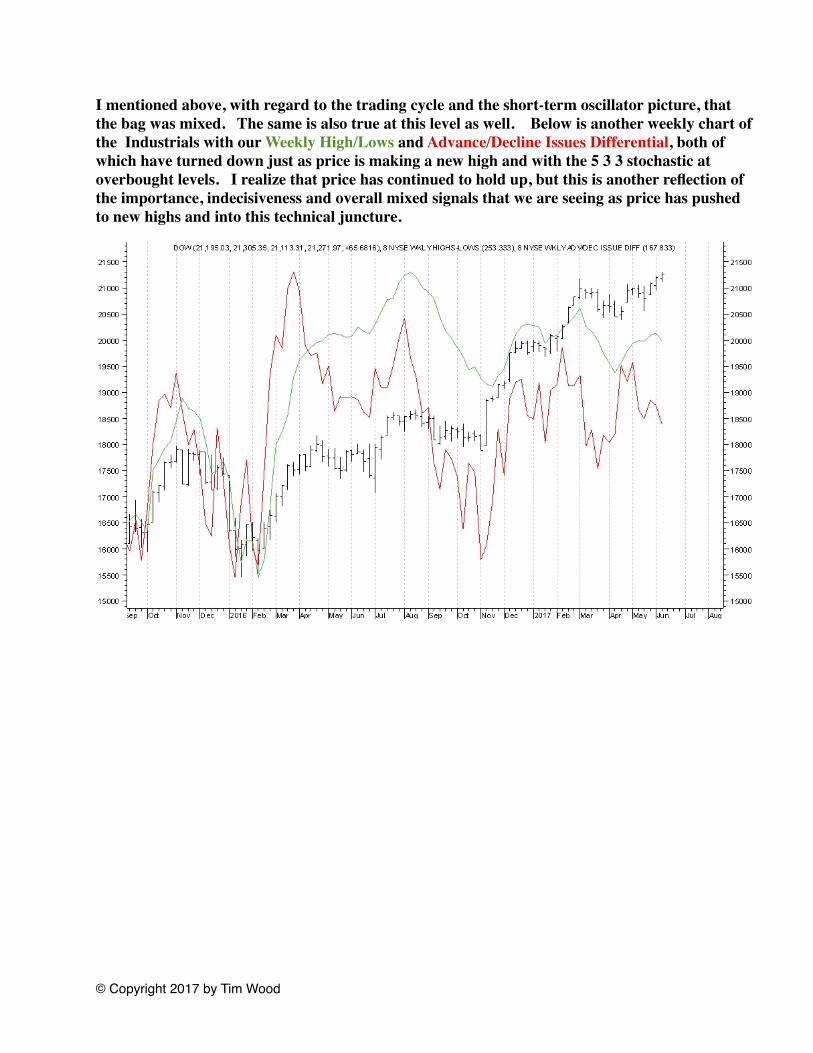
I mentioned above, with regard to the trading cycle and the short-term oscillator picture, that the bag was mixed. The same is also true at this level as well. Below is another weekly chart of the Industrials with our Weekly High/Lows and Advance/Decline Issues Differential, both of which have turned down just as price is making a new high and with the 5 3 3 stochastic at overbought levels. I realize that price has continued to hold up, but this is another reflection of the importance, indecisiveness and overall mixed signals that we are seeing as price has pushed to new highs and into this technical juncture.
© Copyright 2017 by Tim Wood

GoldEnd of Week Weekly Indicator Summary Intermediate-Term BuyEnd of Week Weekly Indicator Summary Intermediate-Term Buy
Primary Indicators Primary Indicators
Formation of a Weekly Swing Low BullishCycle Turn Indicator (CTI) BullishConfirming IndicatorsConfirming IndicatorsTrend Indicator (TI) BullishCycle Momentum Indicator BullishSecondary IndicatorsSecondary Indicators
5 3 3 Stochastic Bullish
Daily Indicator SummaryShort-Term SellDaily Indicator SummaryShort-Term Sell
Primary Indicators Primary Indicators
Formation of a Daily Swing High BearishCycle Turn Indicator (CTI) BearishConfirming IndicatorsConfirming IndicatorsTrend Indicator (TI) BullishCycle Momentum Indicator BearishSecondary Short Term IndicatorsSecondary Short Term Indicators
5 3 3 Stochastic Bearish
The timing band for the pending trading cycle low runs between June 2nd and June 16th. We knew that the trading cycle top was due and with the triggering of a short-term sell signal on Thursday that top should be in place. If the decline out of this trading cycle top completes the formation of a weekly swing high that is confirmed by a downturn of the weekly CTI, then we should prove to have the intermediate-term cycle top in place as well. However, we will ultimately need to also see a failed and/or left-translated trading cycle advance for additional confirmation. More on that once we get there. Based on the current price/oscillator picture, any advance from here should ideally not better the trading cycle top and should be followed by further weakness into the trading cycle low. A daily swing low will be completed on Monday if 1,266.70 holds and if 1,284.60 is bettered.
© Copyright 2017 by Tim Wood

Our weekly chart of gold is next. The timing band for the current intermediate-term cycle low ran between April 7th and May 26th and we have known that the advance out of the May 9th low has proven to have marked an intermediate-term cycle low. As of Friday’s close, this intermediate-term advance remains intact. The late week reversal relieved the extreme overbought reading at this level that was seen earlier in the week, but the price reversal is nonetheless suggestive of a potential top. As explained all along, as a result of the higher degree cyclical expectations of lower prices into the 9-year cycle low, the advance out of this intermediate-term cycle low was/is expected to be a counter-trend advance. Any further weakness in the coming week that completes the formation of a weekly swing high that is confirmed by a downturn of the weekly CTI, plotted with price, will trigger an intermediate-term sell signal, which should mark this top. We will then need to also see the completion of a failed and/or left-translated trading cycle advance for further confirmation. Until then, we cannot say that this intermediate-term cycle top is in place. A weekly swing high will be completed in the coming week if 1,298.90 is not bettered and if 1,266.70 is violated.
© Copyright 2017 by Tim Wood
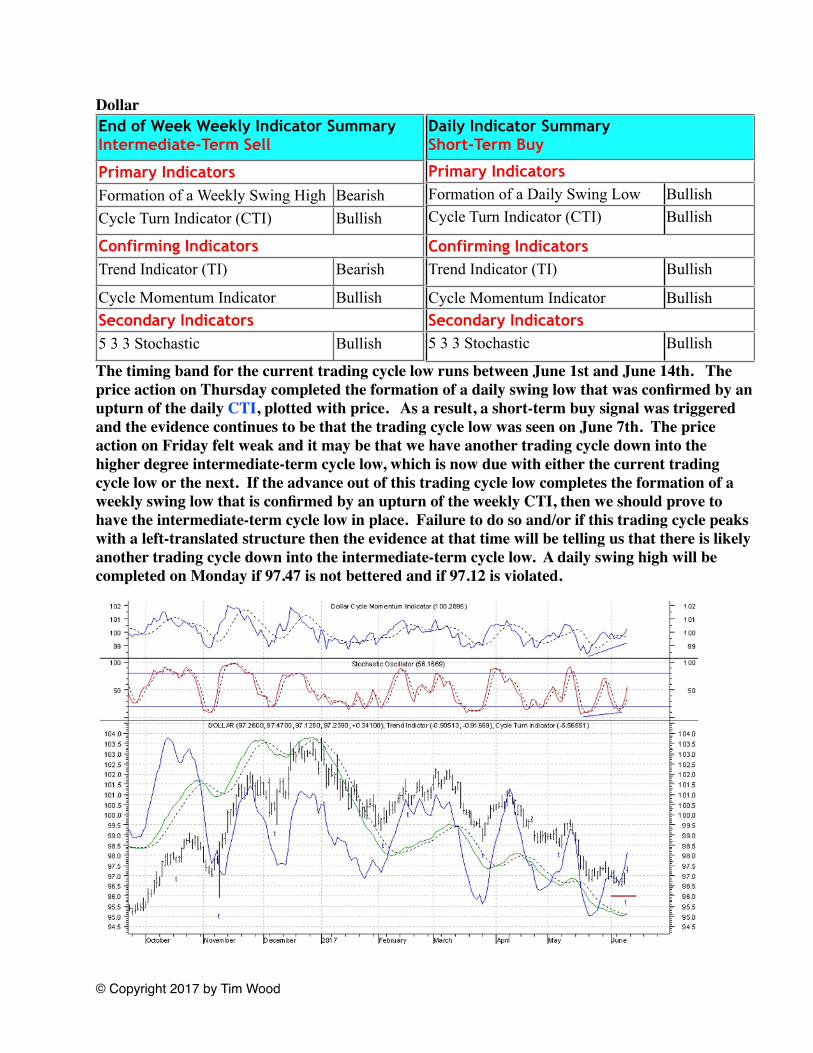
DollarEnd of Week Weekly Indicator Summary Intermediate-Term SellEnd of Week Weekly Indicator Summary Intermediate-Term Sell
Primary Indicators Primary Indicators Formation of a Weekly Swing High BearishCycle Turn Indicator (CTI) Bullish
Confirming IndicatorsConfirming IndicatorsTrend Indicator (TI) Bearish
Cycle Momentum Indicator BullishSecondary IndicatorsSecondary Indicators5 3 3 Stochastic Bullish
Daily Indicator SummaryShort-Term BuyDaily Indicator SummaryShort-Term Buy
Primary Indicators Primary Indicators Formation of a Daily Swing Low BullishCycle Turn Indicator (CTI) Bullish
Confirming IndicatorsConfirming IndicatorsTrend Indicator (TI) Bullish
Cycle Momentum Indicator BullishSecondary IndicatorsSecondary Indicators5 3 3 Stochastic Bullish
The timing band for the current trading cycle low runs between June 1st and June 14th. The price action on Thursday completed the formation of a daily swing low that was confirmed by an upturn of the daily CTI, plotted with price. As a result, a short-term buy signal was triggered and the evidence continues to be that the trading cycle low was seen on June 7th. The price action on Friday felt weak and it may be that we have another trading cycle down into the higher degree intermediate-term cycle low, which is now due with either the current trading cycle low or the next. If the advance out of this trading cycle low completes the formation of a weekly swing low that is confirmed by an upturn of the weekly CTI, then we should prove to have the intermediate-term cycle low in place. Failure to do so and/or if this trading cycle peaks with a left-translated structure then the evidence at that time will be telling us that there is likely another trading cycle down into the intermediate-term cycle low. A daily swing high will be completed on Monday if 97.47 is not bettered and if 97.12 is violated.
© Copyright 2017 by Tim Wood
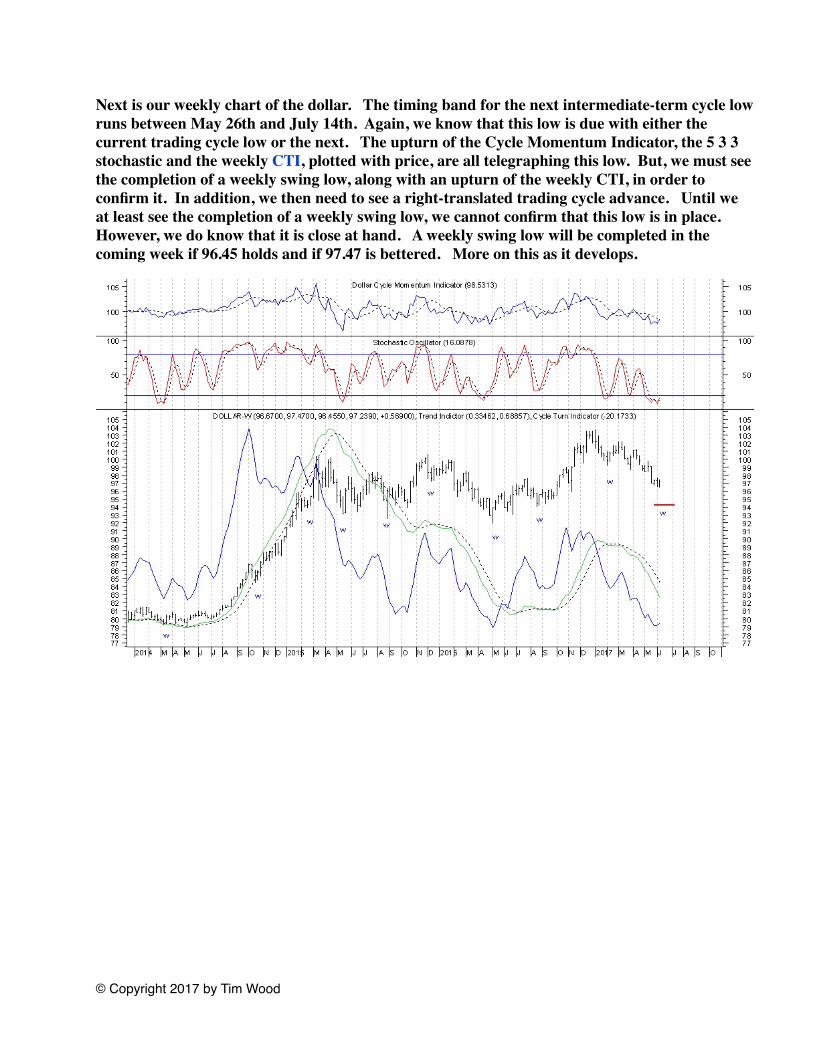
Next is our weekly chart of the dollar. The timing band for the next intermediate-term cycle low runs between May 26th and July 14th. Again, we know that this low is due with either the current trading cycle low or the next. The upturn of the Cycle Momentum Indicator, the 5 3 3 stochastic and the weekly CTI, plotted with price, are all telegraphing this low. But, we must see the completion of a weekly swing low, along with an upturn of the weekly CTI, in order to confirm it. In addition, we then need to see a right-translated trading cycle advance. Until we at least see the completion of a weekly swing low, we cannot confirm that this low is in place. However, we do know that it is close at hand. A weekly swing low will be completed in the coming week if 96.45 holds and if 97.47 is bettered. More on this as it develops.
© Copyright 2017 by Tim Wood

BondsEnd of Week Weekly Indicator Summary Intermediate-Term BuyEnd of Week Weekly Indicator Summary Intermediate-Term BuyPrimary Indicators Primary Indicators Formation of a Weekly Swing Low BullishCycle Turn Indicator (CTI) BullishConfirming IndicatorsConfirming IndicatorsTrend Indicator (TI) BullishCycle Momentum Indicator BullishSecondary IndicatorsSecondary Indicators5 3 3 Stochastic Bullish
Daily Indicator SummaryShort-Term SellDaily Indicator SummaryShort-Term SellPrimary Indicators Primary Indicators Formation of a Daily Swing High BearishCycle Turn Indicator (CTI) BearishConfirming IndicatorsConfirming IndicatorsTrend Indicator (TI) BullishCycle Momentum Indicator BearishSecondary Short Term IndicatorsSecondary Short Term Indicators5 3 3 Stochastic Bearish
Wednesday’s short-term sell signal remains intact and will until another daily swing low is formed and confirmed by an upturn of the daily CTI, plotted with price. We should ideally see further weakness into the trading cycle low as the oscillators should move toward oversold levels. But, based on the price action, I get the feeling that price is already trying to make the trading cycle low. Regardless, the completion of a daily swing low and upturn of the daily CTI is key. Once another short-term buy signal is triggered, the trading cycle low should be in place and higher overall prices are expected to follow in association with the upturn out of the higher degree cycle lows seen in March.
© Copyright 2017 by Tim Wood

Our weekly chart of bonds is next and there is no change at this level. The advance out of the March 13th intermediate-term and seasonal cycle low remains intact. Based on the timing for the higher degree 3-year cycle low, the evidence continues to also point toward this having marked the 3-year cycle low as well. Bottom line, this intermediate-term advance will remain intact until another weekly swing high is formed and confirmed by a downturn of the weekly CTI, plotted with price. Given the clustering of higher degree lows back in March, the decline out of the next/pending intermediate-term cycle top should be counter-trend and should be followed by higher prices in association with the higher degree cycle lows.
© Copyright 2017 by Tim Wood

Crude Oil
The short-term sell signal remains intact and the decline that has followed has carried price to oversold levels, per the 5 3 3 stochastic, which again makes conditions ripe for a bounce. But, until a daily swing low is formed and confirmed by an upturn of the daily CTI, the existing short-term sell signal will stand. A daily swing low will be completed on Monday if 45.20 holds and if 46.18 is bettered.
© Copyright 2017 by Tim Wood

Next is our weekly chart of crude oil and the intermediate-term sell signal also remains intact. Based on the higher degree price/oscillator picture, any advance from the current short-term oversold levels should prove to be counter-trend and should be followed by lower prices.
© 2017 Cycles News & Views; All Rights Reserved
Click Below To Contact the Web Master
© Copyright 2017 by Tim Wood