Cyber Source Fraud Report 2009 0 1
24
ONLINE FRAUD REPORT ONLINE FRAUD REPORT 10TH ANNUAL 2009 EDITION
-
Upload
guestf312ae1 -
Category
Economy & Finance
-
view
1.525 -
download
1
Transcript of Cyber Source Fraud Report 2009 0 1
ONLINEFRAUDREPORT
ONLINEFRAUDREPORT
1 0 T H A N N U A L
2 0 0 9 E D I T I O N
2
C Y B E R S O U R C E 1 0 T H A N N U A L O N L I N E F R A U D R E P O R T
Report amp Survey MethodologyThis report is based on a survey of US and Canadian online
merchants Decision makers who participated in this survey
represent a blend of small medium and large-sized organizations
based in North America Merchant experience levels range from
companies in their first year of online transactions to the largest
e-retailers and digital distribution entities in the world Merchants
participating in the survey reported a total estimate of $60 billion
for their 2008 online sales Survey respondents include both
non-CyberSource and CyberSource merchants
The survey was conducted via online questionnaire by Mindwave
Research Participating organizations completed the survey
between October 21st and November 11th 2008 All participants
were either responsible for or influenced decisions regarding risk
management in their companies
Get Tailored Views of Risk Management Pipelinetrade MetricsTo obtain customized fraud management benchmarks for your companyrsquos size and industry please contact CyberSource at
18883302300 or online at wwwcybersourcecomcontact_us
For additional information whitepapers and webinars or sales assistance
bull Contact CyberSource 18883302300 or wwwcybersourcecomcontact_us
bull Risk Management Solutions visit wwwcybersourcecomproducts_and_servicesrisk_management
bull Global Payment amp Security Solutions visit wwwcybersourcecomproducts_and_servicesglobal_payment_services
Summary of Participants ProfilesOnline Fraud Survey Wave 2003 2004 2005 2006 2007 2008
Total number of merchants participating 333 348 404 351 318 400
Annual Online Revenue
Less than $500K 29 34 50 37 29 31
$500K to Less than $10M 43 39 24 30 35 28
Over $10M 28 27 26 33 37 41
Duration of Online Selling
Less than One Year 10 12 14 11 5 11
1-2 Years 19 14 19 11 13 12
3-4 Years 44 30 23 18 18 13
5 or More Years 27 44 45 61 67 64
Risk Management Responsibility
Ultimately Responsible 49 50 60 54 55 58
Influence Decision 51 50 40 46 45 42
3
C Y B E R S O U R C E 1 0 T H A N N U A L O N L I N E F R A U D R E P O R T
3copy2009 CyberSource Corporation All rights reserved
EXECUTIVE SUMMARY 4
STAGE 1 AUTOMATED SCREENING 7Fraud Detection Tools Used During Automated Screening 7
Planned Automated Screening Tool Usage 2009 9
Automated DecisionRules Systems9
STAGE 2 MANUAL REVIEW 10Manual Order Review Rates 10
Review Tools amp Practices 10
Review Operations Efficiency13
Final Order Disposition 13
STAGE 3 ORDER DISPOSITIONING (ACCEPTREJECT) 14Post-Review Order Acceptance Rates 14
Overall Order Rejection Rates 15
International Orders Riskier16
STAGE 4 FRAUD CLAIM MANAGEMENT 17Fighting Chargebacks 17
Chargeback Management Tools 18
ChargebacksmdashOnly Half the Problem 18
Fraud Rate Metrics 19
TUNING amp MANAGEMENT 21Maintaining and Tuning Screening Rules 21
Global Fraud Portals 21
Merchant Budgets for Fraud Management 21
Budget Allocation 22
RESOURCES amp SOLUTIONS 23CyberSource Payment Management Solutions 23
ABOUT CYBERSOURCE 24For More Information 24
Table of Contents
4
C Y B E R S O U R C E 1 0 T H A N N U A L O N L I N E F R A U D R E P O R T
Managing online fraud continues to be a significant
and growing cost for merchants of all sizes To better
understand the impact of payment fraud for online
merchants CyberSource sponsors annual surveys
addressing the detection prevention and management of
online fraud This report summarizes findings from our
tenth annual survey
OverviewOver the past three years the percent of online revenues
lost to payment fraud has been stable Merchants have
consistently reported an average loss of 14 of revenues
to payment fraud However total dollar losses from online
payment fraud in the US and Canada have steadily
increased during this time as eCommerce has continued
to grow In 2008 we estimate that $4 billion in online
revenues were lost to payment fraud Just two years ago
in 2006 payment fraud reached the $3 billion revenue
loss milestone (see chart 1)
Key Fraud MetricsThe percent of accepted orders which are later determined
to be fraudulent has also been relatively stable In 2008
merchants reported an overall average fraudulent order rate
of 11 in the US and Canada Over the past six years
the average percent of accepted orders which turn out
to be fraudulent has varied from 10 to 13 Among
industry sectors Consumer Electronics reported the highest
fraudulent order rate averaging 2
The share of incoming orders merchants decline to accept
due to suspicion of payment fraud was down significantly
Put more simply merchants are accepting a higher
percentage of orders In 2008 the overall order rejection
rate due to suspicion of fraud dropped to 29 compared
to 42 in 2007
As the growth of online sales has slowed during 2008 it
appears merchants are now focusing even more attention
on sales conversion and reducing their order rejection
Executive Summary
20
10
05
15
25
35
30
40
0
$45
$00
Revenue Lost to Online Fraud
O
nlin
e R
even
ue L
ost
36
32
17 1
8
16
14
29
2000n=132
2002n=341
2001n=220
2003n=333
2004n=348
2005n=404
2006n=351
14
2007n=294
14
2008n=399
$30
$35
$40
$20
$15
$10
$05
$25
2000 20022001 2003 2004 2005 2006 2007 2008
Online Revenue Loss Due to Fraud
$4B in 2008
$ Lo
ss i
n B
illi
ons
Although the rate of revenue loss due to online payment fraud was stable in 2008 total dollars lost to fraud have increased
due to online sales growth
$15 $1
7 $19
$26 $2
8 $30
$36
$40
$21
1
5
C Y B E R S O U R C E 1 0 T H A N N U A L O N L I N E F R A U D R E P O R T
5copy2009 CyberSource Corporation All rights reserved
rates due to suspicion of fraud The survey results
indicate most merchants have successfully increased
their order acceptance rate with little or no increase in
fraud rates It remains to be seen if online merchants
can continue to control fraud rates while increasing order
acceptance in 2009
Chargebacks Understate Fraud Loss by as Much as 50This yearrsquos survey again probed the percent of fraud
losses accounted for by chargebacks Overall merchants
continue to report that chargebacks accounted for less
than half of fraud losses The remainder occurred when
merchants issued credit to reverse a charge in response to
a consumerrsquos claim of fraudulent account use
International Order Risk 3frac12 Times Higher Than Domestic OrdersOn average merchants now say the rate of fraud
associated with international orders is over three-and-
one-half times as high as domestic orders In 2008 fraud
rates on international orders continued to climb reaching
an average of 40 up from 24 in 2005 Merchants
also reject international orders at a rate three-and-one-half
times higher than domestic orders
Manual Review Rates Over the past six years the overall percent of online
orders that enter manual fraud review has fluctuated
between 22 and 27 about 1 out of 4 on average In
some segments fraud risk is low enough for merchants
to rely entirely on automated review which lowers the
aggregate review ratio But most merchants do manually
review orders for fraud risk and these merchants on
average review 1 out of every 3 orders Over the past
five years merchants who engage in manual order review
have maintained this average review rate Large online
merchants who typically employ more automation
continue to have much lower manual review rates Over
the past three years large merchants ($25M+ in online
sales) performing manual order review have on average
reviewed approximately 15 of orders Looking back over
the past several years of survey data we conclude that
most merchants have made little progress in reducing
their reliance on manual review and are likely reviewing
far more orders today than they were just a few years ago
Efficiency Gains RequiredAs eCommerce sales continue to grow and budgets and
resources remain relatively fixed merchants face the
challenge of screening more online orders while keeping
order rejection and fraud rates as low as possible to
maximize sales and profits Continued reliance on manual
review presents a serious challenge to scalability Can
merchants grow their review staffing sufficiently to keep
pace with fraud Only 13 of online merchants expect to
increase manual review staff in 2009 This is the lowest
level of planned staff increases we have seen in the
survey At the same time merchants reported increased
interest in implementing more automated fraud detection
tools in some cases two or three times higher than last
yearrsquos reporting
6
C Y B E R S O U R C E 1 0 T H A N N U A L O N L I N E F R A U D R E P O R T
Total Pipeline ViewBusinesses that focus solely on managing chargebacks
may not be seeing the complete financial picture Online
payment fraud impacts profits from online sales in
multiple ways Besides direct revenue losses the cost of
stolen goodsservices and associated deliveryfulfillment
costs there are the additional costs of rejecting valid
orders staffing manual review administration of fraud
claims as well as challenges associated with business
scalability Merchants can gain efficiency by taking a total
pipeline view of operations and costs While the fraud rate
is one metric to monitor (and contain within industry
and association limits) an end-to-end view is required to
arrive at the best possible financial outcome
In 2008 these ldquoprofit leaksrdquo in the Risk Management
Pipelinetrade impact as much as 40+ of orders for
mid-sized merchants and as much as 19+ of orders
for larger merchantsmdashrestricting profits operating
efficiency and scalability This report details key metrics
and practices at each point in the pipeline to provide you
with benchmarks and hopefully insight Custom views
of these benchmarks and practices are available through
CyberSourcemdashsee end of report for contact information
Automated
Screening1
Manual
Review2
Accept
Reject3
Fraud Claim
Management4
Risk Management Pipeline
ORDERRETAINED
REVENUE
PROFIT LEAKSStaffing ampScalability
LostSales
Fraud Loss ampAdministration
29 Avg Reject Rate
for USCanadian orders
(all merchants)
109 Avg Reject Rate
for Non-USCanadian
orders (merchants who
accept these orders)
Merchants review 32 of
orders on average
51 of fraud management
budget is spent on review
staff costs
81 of these merchants
have no plans to change
manual order review
staffing during 2009
14 Average Fraud Loss
42 from chargebacks
58 from issued credits
7
C Y B E R S O U R C E 1 0 T H A N N U A L O N L I N E F R A U D R E P O R T
7copy2009 CyberSource Corporation All rights reserved
Fraud Detection Tools Used During Automated ScreeningWe define detection tools as those used to identify the
probability of risk associated with a transaction or to validate
the identity of the purchaser Results of tests carried out
by detection tools are then interpreted by humans or rules
systems to determine if a transaction should be accepted
rejected or reviewed A wide variety of tools are available to
help merchants evaluate incoming orders for potential fraud
Merchants handling large online order volumes typically
employ an initial automated order evaluation to determine
if an incoming order might represent a fraud risk Some
merchants will allow this initial automated screen to
cancel orders without further human intervention 46 of
all merchants cancelled some orders as a result of their
automated screening process and 58 of large merchants
indicated they cancelled some orders at this stage (see
chart 2)
In 2008 two-thirds of merchants reported using three or
more fraud detection tools for automated screening with
47 tools being the average Larger merchants dealing
with higher order volumes reported using 63 detection
tools on average
The most popular tools used to assess online fraud risk are
shown in chart 3 which shows the current and planned
adoption of different tools Note that the tool usage profile
for merchants over $25M in online sales is different than
the overall average These larger merchants generally use
tools across all four dimensions of detection and more often
use their customer history and proprietary data during the
automated order screening process They have a higher use of
company-specific risk scoring models negative and positive
lists and sophisticated order velocity monitoring tools
Overall 96 of merchants use one or more validation tools
These tools are often provided by the card associations to
help authenticate cards and card holders The tool most
often mentioned by merchants is the Address Verification
Service (AVS) which compares numeric address
data with information on file from the cardholderrsquos
card issuing bank AVS is generally available for US
cardholders and for limited numbers of cardholders
in Canada and the UK AVS is subject to a significant
rate of ldquofalse positivesrdquo which may lead to rejecting
valid orders as well as missing fraudulent orders1 If
the cardholder has a new address or a valid alternate
address (such as seasonal vacation home) this
information may not be reflected in the records of
the cardholderrsquos issuing bank so the address would
be flagged as invalid Merchants typically do not rely
solely on AVS to accept or reject an order
Card Verification Number (CVN also known as
CVV2 for Visa CVC2 for MasterCard CID for
American Express and Discover) is the second most
Stage 1 Automated Screening
46
Yes Yes35
11
54
No
11
47 58
No
42
Base Those using automated servicestechnologies
Are Inbound Orders Rejected
Based On Automated Screening
n=315 n=96
No generally all suspicious orders are out-sorted for manual reviewYes if automated tests indicate too much risk OR customer is on our negative listYes but generally ONLY if customer is on our negative list
All Merchants Merchants $25M+ Online Revenue
2
Automated
Screening1
Manual
Review2
Accept
Reject3
Fraud Claim
Management4ORDER
RETAINED
REVENUE
Tuning and Management
1CyberSource analyzed 94 million credit card transactions where AVS
was used and the final status of the transaction was known If a merchant
were to reject orders based solely on an AVS ldquono matchrdquo they would reject
57 of their orders but fail to detect 83 of the fraudulent orders This
represents an 181 false positive ratio
8
C Y B E R S O U R C E 1 0 T H A N N U A L O N L I N E F R A U D R E P O R T
commonly used detection tool The purpose of CVN in a
card-not-present transaction is to attempt to verify that the
person placing the order has the actual card in his or her
possession Requesting the card verification number during
an online purchase can add a measure of security to the
transaction However CVN numbers can be obtained by
fraudsters just as credit card numbers are obtained CVN
usage by online merchants has significantly increased in
the last five years rising from 44 in 2003 to 74 today
Large merchants were asked to identify the three most
effective tools they use To eliminate the bias that the more
commonly used tools have the potential to receive more
mentions we normalize the data by looking at the percent
of merchants using a particular tool who cite that tool as
one of their top three choices
Company specific
fraud screens
received the
highest rating as
being an effective
tool by merchants
who use this tool
Half of the 42
of large merchants
who use custom
fraud models
rated them as
one of their three
most effective
tools These fraud
screens are risk
scoring models
which are tuned
using an individual
merchantrsquos
historical data on
factors associated
with online orders
Since fraudsters
learn over time and
vary their strategies
we typically find
most risk scoring
models need
regular tuning
with new analysis
and data in order
to maximize their
effectiveness
Out-of-wallet or
in-wallet challenge systems while used by only 7 of large
merchants today was rated by 43 of these merchants
as being one of their three most effective tools The use
of challenge systems tends to be limited to merchants
who have frequent repeat purchases by customers or bill
customers on a regular schedule
Device Fingerprinting (also used by only 7 of large
merchants today) was rated by 43 of these merchants
as being one of their three most effective tools These
favorable opinions may well contribute to the very high
intention by other large online merchants to add this tool in
the next twelve months
Automated Fraud Detection Tool Current Usage and Plans
All Merchants Merchants $25M+ Online Revenue
78 11
74 14
35 9
27 18
25 12
11 7
5 6
5 6
CurrentPlanning to implement (next 12 months)
Current n=359 Future Plans n=194 Current n=101 Future Plans n=70
VALIDATION SERVICES
CVN (Card Verification Number)
Paid for public records service
Out-of-wallet or in-wallet challengeresponse
Telephone number verificationreverse lookup
Credit history check
Address Verification Service
Postal address validation services
Verified by VisaMasterCard SecureCode
87 6
80 16
39 9
19 11
31 10
21 4
3 1
7 6
47 10
38 12
28 15
27 11
18 10
20 9
SINGLE MERCHANT PURCHASE HISTORY
Fraud scoring model ndash company specific
Customer order history
Order velocity monitoring
Valid customer behavior analysis
Positive lists
Negative lists (in-house lists)
58 13
67 10
54 17
42 20
30 14
22 13
6 25
35 19
PURCHASE DEVICE TRACING
Device Fingerprinting
IP geolocation information 48 27
7 47
14 14
9 2
MULTI-MERCHANT PURCHASE HISTORY
Multi-merchant fraud models
Shared negative lists ndash shared hotlists 18 24
9 9
3
9
C Y B E R S O U R C E 1 0 T H A N N U A L O N L I N E F R A U D R E P O R T
9copy2009 CyberSource Corporation All rights reserved
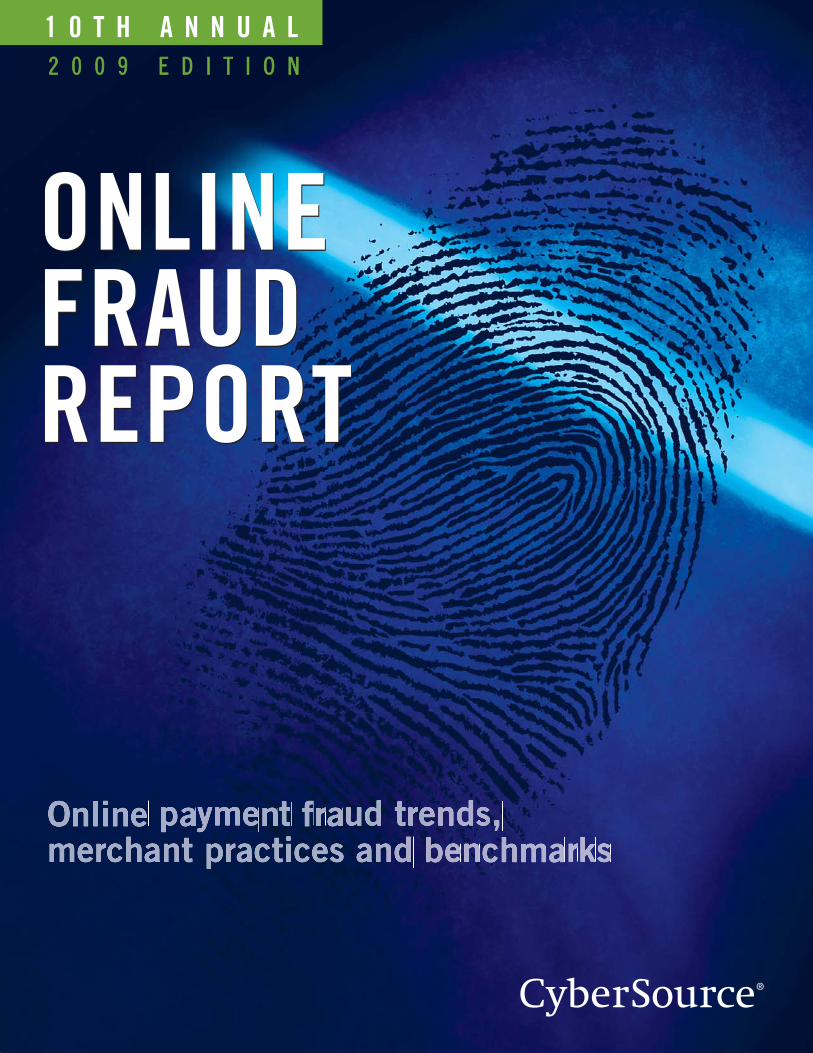
Planned Automated Screening Tool Usage 2009
Device Fingerprinting Highest on ldquoPlan to Buyrdquo Lists
Merchants showed an increased intent to implement every
one of the 14 detection tools we looked at in both 2007 and
2008 Some tools showed dramatic increases in the percent
of merchants who say they intend to implement them in
2009 Four tools had 15 or more of merchants planning
to adopt them in 2009 and for three of these four tools the
plans to implement them have more than doubled over last
year These tools are Device Fingerprinting IP Geolocation
and Order Velocity Monitoring
Device Fingerprinting examines and records details about
the configuration of the device from which the order is
being placed This can aid in flagging fraud attacks where
a variety of fraudulent orders are launched from a common
device or set of devices Nearly 50 of large online
merchants indicated they were planning to add Device
Fingerprinting in the next twelve months
IP geolocation tools also showed a dramatic increase
in merchant interest This tool attempts to identify the
geographic location of the device from which an online order
was placed It provides an additional piece of information
to compare against other order information and order
acceptance rules to help assess the fraud risk of an order
In some cases only an internet service providerrsquos address is
returned so the ultimate geographic location of the device
remains unknown Fraudsters may also employ anonymizers
proxy servers to hide their true IP address and location
As in several years past card association payer
authentication services (eg Verified by Visa MasterCard
SecureCode) figure prominently in many merchantsrsquo future
plans 2008 survey results show that one out of four
merchants currently use one or more of the available payer
authentication services 18 of respondents say they are
interested in deploying these systems in the next twelve
months as a new tool to manage fraud However despite
significant interest in implementing payer authentication
systems over the past few years we have seen relatively
slow actual adoption of payer authentication since we
started tracking this tool in 2003
Implementing payer authentication should reduce exposure
to card-not-present fraud loss either by authenticating
the buyerrsquos identity or by shifting fraud liability back
to the card issuing bank (interchange incentives also
apply) Further certain card types in some countries are
beginning to require that payer authentication solutions
be used as a condition of accepting the associated cards
(eg Maestro Cards in the United Kingdom) But if
merchants have a sufficiently high direct fraud loss rate
the card association may not permit the merchant to shift
liability even if the merchant has implemented a payer
authentication system Over the next few years these
systems may help reduce the incidence of online credit
card fraud if a critical mass of consumers register their
cards and accept the new checkout procedures
Successful adoption of payer authentication will require
merchants to put procedures in place to handle customers
who have not adopted verification services or who
use cards or payment types which are not supported
International expansion and the growing popularity of
online payment types such as electronic checks PayPaltrade
Bill Me Laterreg etc drive the need for alternative fraud
management techniques
Automated DecisionRules Systems
Automated Order Screening
Automated order decisioning screening systems are now
used by 56 of merchants (up from 25 in 2005) Eight
out of ten larger online merchants use such systems These
tools help companies automate order screening by applying
a merchantrsquos business rules in the real-time evaluation of
incoming orders
Decision and rules systems automate the evaluation of test
results generated by fraud detection tools and determine
whether the transaction should be accepted rejected or
suspended for review As the number of tools used grow
it is becoming increasingly important for merchants to
employ automated systems to interpret and weigh the
multiple results for each product or transaction profile
(versus a ldquoone size fits allrdquo screen) to optimize business
results Because fraud patterns are dynamic and the
introduction of new products services or markets often
requires a unique set of acceptance rules it is imperative
that these systems also quickly adapt to the changing
environment Half of large merchants say their screening
system allows business managers to create and modify
screening rules without assistance from external experts or
internal information technology staff
Results of Automated Screening
The automated order screening process generates three
outcomes 1) order acceptance without further review 2)
orders flagged for further review and 3) automatic order
rejection 46 of merchants indicated they reject some
orders based on automated screening tests and 58 of
large merchants indicated doing so
10
C Y B E R S O U R C E 1 0 T H A N N U A L O N L I N E F R A U D R E P O R T
Orders which do not pass the automated order screening
stage typically enter a manual review queue During this
stage additional information is collected to determine if
orders should be accepted or rejected due to excessive
fraud risk
Manual review represents a critical area of profit leakage
It is expensive limits scalability and impacts customer
satisfaction For many merchants it represents half of
their fraud management budget Only 13 of merchants
say they have budget available to increase review
staff now or in the next twelve months This presents
significant challenges to profit growth since even at a
stable percent of orders sent to review the total number
of orders that must be reviewed increases in step with the
total increase of online sales
Manual Order Review RatesIn what should be a highly automated sales environment
most merchants are manually checking orders In fact
during the past six years overall 1 out of every 4 orders
transacted online have been manually reviewed (see chart
4) Over the same period merchants who conduct manual
review typically reviewed 1 out of 3 orders they received
Merchants of all sizes use manual review to manage
payment fraud Chart 5 shows smaller merchants review
a higher percentage of orders (perhaps because lower
order volumes permit such practice) but even larger
merchants review a significant percentage of online
ordersmdashand likely devote more resources to this task than
is operationally scalable
One consequence of using more fraud detection tools
during automated screening is a greater chance of one
or more flags being raised resulting in an order being
selected for manual review Adding additional tools to
detect fraud may result in downstream impacts and
costs if these tools are not carefully integrated into a
merchantrsquos review process and tuned to a merchantrsquos
specific situation
Merchants expecting increased online sales will need to
take at least one of the following actions 1) divert more
staff time to the order review process 2) increase staffing
levels 3) allow more time to process orders and ship good
ones or 4) improve accuracy of initial automated sorting
and make the subsequent review process more efficient
Review Tools amp PracticesGiven the reported limitations on hiring additional manual
review staff there is increased focus on investing in tools
and systems to increase the productivity and effectiveness
of review staff While the primary focus should be on
improving initial automated sorting accuracy to decrease
need for review attention to streamlining the review
process is also warranted
Stage 2 Manual Review
Automated
Screening1
Manual
Review2
Accept
Reject3
Fraud Claim
Management4ORDER
RETAINED
REVENUE
Tuning and Management
40
0
2004 2005 2006
Manual Review Trends
2007 2008
30
20
10
5
15
25
35
Over the past 5 years on average 1 out of 4 online orders were
manually reviewed Merchants performing manual review have
on average reviewed 1 out of every 3 orders received
35
26
Orders Reviewed by Merchants Practicing Review Orders Reviewed Overall (Net Review)
23
28
27
33
22
32
27
34
4
11
C Y B E R S O U R C E 1 0 T H A N N U A L O N L I N E F R A U D R E P O R T
11copy2009 CyberSource Corporation All rights reserved
Use of Case Management Systems
Currently 1 out of 3 merchants report having a case
management system that supports their manual review
process and staff Over half of merchants either
currently use a case management system or
plan to implement one in 2009 For large
online merchants 65 report currently using
or planning to implement a case management
system
Merchants using a case management system
are also more likely to be able to track fraud
rates on orders which have gone through
manual review 74 of merchants using case
management systems report tracking fraud
rates for manually reviewed orders vs only
42 being able to do so when not using a
case management system Surprisingly 44
of merchants performing manual order review
say they do not track the fraud rates of orders
which have been manually reviewed and 24
of large merchants say they do not have this
information Without knowing the fraud rate
on orders going through manual review and
who reviewed them it is difficult to determine
training needs or other actions to improve the
effectiveness of manual review
Tools UsedPlanned During Manual Review
While many of the tools or detector results used
during automated screening can also be used
during manual review several additional tools
and processes are employed by manual reviewers
Attempting to validate an order by contacting the
customer is standard practice for 7 out of 10
merchants and 82 of large merchants However
most organizations have policies regarding how
quickly they must clear orders through manual
review and how long they will wait for customers
to respond to requests for additional information
Most merchants try to clear orders through manual
review in one business day and say they will not
wait more than three business days for a customer
to respond to a request for more information (see
charts 7 and 8)
Another practice used only in manual review is to
contact the card issuer This action is taken by
almost half of merchants overall and 60 of large
merchants Telephone number validation reverse
lookup is the third most popular tool with 56 of
merchants using it during manual review vs 25
during automated screening
In 2008 two-thirds of merchants reported using
four or more fraud detection tools for manual review with
49 tools being the average Larger merchants reported
using 61 detection tools on average
35
15
5
25
30
10
20
40
45
50
55
0
Average of Orders Manually Reviewed(for merchants engaged in review)
200620072008
lt$500K
36
43
51
$500K ndash lt$5M
36
45
35
$5M ndash lt$25M
25
40
34
$25M+
15
14
15
o
f O
rder
s
Annual Online Revenues
5
Currently usePlan to implement in 2009Do not use or plan to implement
Use or Plan to Implement Case Management System
to Support Manual Order Review Process
18
4933
n=227
All Merchants
35
39
26
n=84
Merchants $25M+
Base Those conducting manual review
6
12
C Y B E R S O U R C E 1 0 T H A N N U A L O N L I N E F R A U D R E P O R T
35
15
5
25
50
30
10
20
40
45
0
Time Allowed for Customer Response
Source 2008 CyberSource Fraud Report
Half day
or less
10
Same
business
day
10
Next
business
day
14
2-3
business
days
37
4-5
business
days
11
6 or more
business
days
19
8
Fraud Detection Tool Usage During Manual Review
All Merchants Merchants $25M+ Online Revenue
69 11
56 15
49 10
45 12
23 14
9 7
currently using planning to begin use (in 2009)
Current n=265 Future Plans n=109 Current n=89 Future Plans n=43
VALIDATION SERVICES
Telephone number verificationreverse lookup
Credit history check
Paid for public records service
Contact customer to verify order
Contact card issuerAmex CVP
Postal address validation services
82 5
74 5
60 14
46 7
45 14
6 12
72 8
49 14
35 13
22 17
SINGLE MERCHANT PURCHASE HISTORY
Positive lists
Customer order history
Valid customer website behavior analysis
Negative lists (in-house lists)
83 5
69 12
37 14
34 30
40 20
PURCHASE DEVICE TRACING
IP geolocation information 55 28
11 28
MULTI-MERCHANT PURCHASE HISTORY
Shared negative lists ndash shared hotlists 16 35
9
35
15
5
25
30
10
20
40
45
50
0
Time to Clear Orders in Manual Review (2008)
Over two-thirds of merchants clear
orders through manual review
in one business day72
1 hour
or less
26
2-4
hours
10
Same
business
day
36
Next
business
day
18
2-3
business
days
8
4-5
business
days
1
6 or more
business
days
1
n=259
7
13
C Y B E R S O U R C E 1 0 T H A N N U A L O N L I N E F R A U D R E P O R T
13copy2009 CyberSource Corporation All rights reserved
The most popular tools currently used in the manual
review process are shown in chart 9 including the
percent of merchants planning to add each tool in 2009
Review Operations Efficiency
Reviewer Efficiency
The average number of orders a reviewer processed in a
day ranged from 22 for small merchants to 124 for large
(see chart 10) Large merchants who typically have case
management systems achieve a 5X higher throughput
per reviewer in the manual review stage possibly due to
greater use of review systems and detection tools during
manual review On average reviewers spent 7 minutes
reviewing each order in 2008
Time to Ramp New Staff
New to this yearrsquos surveymdashmerchants were asked how
long it takes for an order reviewer to attain acceptable
proficiency in his or her job While the learning curve
varies by type and size of online merchant the median
time reported was 4 weeks Larger merchants reported a
median of 6 weeks for a reviewer to achieve acceptable
proficiency Chart 11 shows the distribution of learning
times reported
Staff Tenure
Given the cost and time required to recruit and train
new staff merchants need to focus on staff retention
Fraud rates or order rejection rates can increase if highly
experienced review staff leave an organization and are
either not replaced or replaced by less experienced
reviewers 85 of review staff have been on the job
for one year or more Merchants report on average that
15 of their review staff were new in 2008 For large
merchants 24 of their staff were new in 2008 (see
chart 12) Efficient training and methods to ensure
consistent and accurate disposition of orders will be key
as merchants seek to optimize operating efficiency
Final Order DispositionAutomated screening and manual order review ultimately
result in order acceptance or rejection A relatively high
percentage of orders manually reviewed are ultimately
accepted (see next section)mdashhighlighting the need for
merchants to improve automated screening accuracy and
reduce the need for review A look at order reject and
acceptance rates follows in Stage 3 of the pipeline review
Overall $500K ndash lt$5Mlt$500K $5M ndash lt$25M $25M+
Average Orders Reviewed Per DayReviewer(by merchant size)
n=185
124
46
2322
68
10
Median of Weeks
4
52
Number of Weeks Required to Train New Reviewer
lt1
3
1
11
2
10
3
11
4
21
5-9
28
10-14
11
15+
5
n=159
11
Overall $500K ndash lt$5Mlt$500K $5M ndash lt$25M $25M+
of Review Staff New in 2008
n=206
24
1413
7
15
12
14
C Y B E R S O U R C E 1 0 T H A N N U A L O N L I N E F R A U D R E P O R T
Post-Review Order Acceptance RatesMerchants who manually review orders indicated they
ultimately accepted nearly frac34 of the orders they manually
reviewed (see chart 13) This was similar to the
proportion reported in 2007 50 of merchants report
they accept 90 or more of orders they manually review
These merchants are incurring significant expense
to find the 10 of the review queue they believe to be
too risky to accept Clearly most merchants require better
methods to determine which orders are to be outsorted for
manual review so only truly suspicious orders receive
human attention
Stage 3 Order Dispositioning (AcceptReject)
Automated
Screening1
Manual
Review2
Accept
Reject3
Fraud Claim
Management4ORDER
RETAINED
REVENUE
Tuning and Management
of Merchants Reporting This Level
of Post-Review Acceptance
1380 ndash 89
4490 ndash 99
6100
970 ndash 79
360 ndash 69
750 ndash 59
140 ndash 49
330 ndash 39
420 ndash 29
510 ndash 19
51 ndash 9
20
50 accept 90+
Post-Review Acceptance Trends
70
30
10
50
100
60
20
40
80
90
0
Most orders that enter manual review are accepted
2003
66
2004
71
2005
69
2006
66
2007
75
2008
73
of Orders Accepted in Review
13
15
C Y B E R S O U R C E 1 0 T H A N N U A L O N L I N E F R A U D R E P O R T
15copy2009 CyberSource Corporation All rights reserved
Overall Order Rejection RatesOrder reject rates can reflect true fraud
risk or signal ldquoprofit leaksrdquo in terms of
valid order rejection or unnecessarily
high rates of manual review In 2008 for
the first time in several years merchants
participating in the survey reported a
significant drop in their order rejection
rates from 42 in 2007 to 29 (see
chart 14)
Order rejection rates dropped in 2008 for
almost every size of merchant (see chart
15) except the very smallest and for
every industry segment (see chart 16)
It is likely that as online sales growth
slows and merchants seek to sustain
revenue levels merchants will look for
ways to accept more orders and reduce
orders rejected due to suspicion of fraud
In 2008 merchants were able to successfully reduce order
rejection rates while holding fraud rates stable It remains
to be seen if order rejection rates can be reduced further
in 2009 without an increase in fraud rates or manual
order review
Order rejection rates also vary by type of product and
merchant profile Chart 16 shows that segments which
have high cost of goods sold andor lower gross margins
tend to have higher order rejection rates Each fraud loss
in this arena has a large negative profit impact Consumer
electronics and jewelryapparel are two examples of online
segments that tend to have higher-than-average order
rejection rates
Yet even within similar groups of online merchants we
see that some merchants achieve low order rejection rates
while still keeping fraudulent order rates under control
Examining the large consumer electronics merchants in
the sample we find that half of these merchants report
35
15
05
25
50
30
10
20
40
45
0
Order Rejection Trends
2005
39
2006
41
2007
42
2008
29
14
Average Orders Rejected Due to Suspicion of Fraud
2007 n=2392008 n=326
Overall $500K ndash lt$5Mlt$500K $5M ndash lt$25M $25M+0
6
4
2
1
3
5
7
8
9
10
45
26
43
64
24
39
27
262
9
42
Order Rejection Rates by Selected Online Segment20072008
n=23
9
n=32
6
n=64
n=95
n=63
n=62
n=35
n=57
n=62
n=85
n=62
n=85
Overall Media amp
Entertainment
Digital Goods
ServicesApparel
Jewelry
Consumer
Electronics
49
34
32
56
42
56
32
42
29
42
Household amp
General Merchandise
22
31
15
16
16
C Y B E R S O U R C E 1 0 T H A N N U A L O N L I N E F R A U D R E P O R T
order rejection rates of 2 or less while maintaining
fraudulent order rates at or even below the average for
their segment
International Orders RiskierMerchants consistently report a much higher level of
order rejection on international orders due to suspicion
of payment fraud In 2008 merchants report their
rejection rate on these orders is over three and one half
times that of domestic orders as shown in chart 17
The actual fraud rate experienced on international orders
supports this cautious approach as merchants report the
fraud risk on international orders is also over three and
one half times that of domestic orders
Order Rejection Trends
of total USCanadian orders rejected of international orders rejected
Historically international order rejection rates
average 32x higher than USCanadian rates
2005 20072006 2008
6
4
2
1
3
5
7
8
9
12
11
10
13
14
42
11
11
29
13
41
12
39
0
15
17
17
C Y B E R S O U R C E 1 0 T H A N N U A L O N L I N E F R A U D R E P O R T
17copy2009 CyberSource Corporation All rights reserved
Fighting ChargebacksThis yearrsquos survey once again examined online merchantsrsquo
practices associated with reviewing and contesting
chargebacks (ldquore-presentmentrdquo) Over the past four years
the share of fraud-coded chargebacks merchants contest
has averaged 43 to 53 with the 2008 average at
50 Medium and large merchants report contesting 52
and 46 respectively of their fraud-coded chargebacks
in 2008 However when we look at the distribution of
merchantsrsquo answers to this question we find that over one
third of merchants are disputing 90 or more of their
fraud chagebacks while three out of ten merchants are
disputing less than 10 of their fraud chargebacks (see
chart 18)
Merchants report that they win on average 44 of the
chargebacks they dispute which is very similar to the 42
win rate reported in 2006 and 40 in 2007 Simply using
the average percent of chargebacks that are disputed (50)
times the average win rate of 44 results in a net recovery
rate of 22 (meaning 22 of all fraud-coded chargebacks
are recovered) However given the wide disparity in the
chargeback re-presentment rate when these are calculated
on a merchant-by-merchant basis and then averaged the
re-presentment win rate rises to 28 (see chart 19 on
next page) the same recovery rate that was found in 2007
Therefore disputing most fraud chargebacks and having
an efficient re-presentment process can help enhance
profitability and reduce fraud loss
Stage 4 Fraud Claim Management
Automated
Screening1
Manual
Review2
Accept
Reject3
Fraud Claim
Management4ORDER
RETAINED
REVENUE
Tuning and Management
Average Total Fraud-Coded
Chargebacks Re-presented of Merchants Reporting
this Re-presentment Rate
480 ndash 89
790 ndash 99
100
370 ndash 79
460 ndash 69
450 ndash 59
540 ndash 49
130 ndash 39
520 ndash 29
810 ndash 19
1 ndash 9
0
C
harg
ebac
ks R
e-pr
esen
ted
Overall $500K ndash lt$5Mlt$500K $5M ndash lt$25M $25M+
Annual Online Revenue
2006 n=1612007 n=1002008 n=120
50
53
47
36
38
48 52
46
5863
56
56
46
45
53
15
15
28
18
18
C Y B E R S O U R C E 1 0 T H A N N U A L O N L I N E F R A U D R E P O R T
Chargeback Management ToolsOf course disputing chargebacks is not an easy or cost-
free process Merchants must manage and organize all
order delivery and payment information to successfully
dispute fraudulent orders with financial institutions
Merchants are beginning to adopt automated systems
for handling this aspect of the pipeline One out of five
merchants reported using chargeback management tools
in 2008 and 37 of large merchants reported using
these tools In our 2006 survey we asked merchants to
provide estimates of how many hours it takes on average
to handle a fraud chargeback The average time spent
overall was 18 hours with a median time of 10 hours
to handle a fraud chargeback (total time consumed
for research documentation submission) The largest
merchants reported a median time of 30 minutes per fraud
chargeback Clearly fraud chargeback management is a
significant expense for merchants
ChargebacksmdashOnly Half the Problem How a fraudulent order is handled can have a significant
impact on bottom line profits Fraudulent orders are
presented to the merchant via two main routes as a
chargeback or as a direct request from a consumer
for credit (they claim fraudulent use of their account)
Although chargebacks are the most often cited metric
merchants report that chargebacks actually account for less
than half of all fraud claims This is true for all sizes of
merchants (see chart 20)
In 2007 large ($25M+ online sales) merchants reported
that 57 of their fraud was presented in the form of a
fraud-coded chargeback but in 2008 this dropped back
to 48 Considering the financial impact of both fraud
claim routes (chargebacks and credit issuancereversal)
some merchants encourage direct consumer contact
to address fraud claims and thus avoid the additional
chargeback fees levied by the merchant bankprocessor If
a consumer contacts the merchant first then the decision
is in the merchantrsquos control to either handle the dispute
directly with the consumer or to advise them to initiate a
fraud chargeback process In any event if merchants are
evaluating fraud losses solely on the basis of chargebacks
the actual rate of fraud loss the business is experiencing
may be as much as two times higher due to direct credit
issuancecharge reversal
Overall $500K ndash lt$5Mlt$500K $5M ndash lt$25M $25M+
Fraud Chargeback Re-presentment
Win RateNet Recovery Rate
Annual Online Revenues
Challenged Net Recovery
44AVERAGEWINRATE
46AVERAGEWINRATE
43AVERAGEWINRATE
54AVERAGEWINRATE
32AVERAGEWINRATE
50
28
36
23
52
38
63
35
46
19
10
0
20
30
40
50
60
70
80
90
100
(Net Recovery Rate is expressed as a of all fraud-coded chargebacks)
19
Overall $500K ndash lt$5Mlt$500K $5M ndash lt$25M $25M+
of Fraud Claims
Chargebacks vs Credit Issued by Merchant
Credits IssuedChargebacks
58
42
76
24
57
43
52
48
52
48
n=25
n=14
7
n=27
n=30
n=55
Annual Online Revenue
n=147
10
0
20
30
40
50
60
70
80
90
100
20
19
C Y B E R S O U R C E 1 0 T H A N N U A L O N L I N E F R A U D R E P O R T
19copy2009 CyberSource Corporation All rights reserved
Fraud Rate MetricsWhen monitoring the level and trend of online
fraud loss we focus on three key metrics
1) Overall revenue lost as a percent of total
online sales 2) percent of accepted orders
which turn out to be fraudulent (domestic and
international) and 3) the average value of a
fraudulent order relative to a valid order Fraud
rates vary widely by merchant and depend on a
variety of factors such as online sales volume
type of products or services sold online and
how such productsservices are delivered and
paid for It is important that merchants track
key fraud metrics over time and evaluate their
performance relative to their peer group (both
size and industry) Note this report provides
benchmarks on total fraud rates (chargebacks +
credits issued directly to consumers by merchants)
As such these metrics tend to be higher
than those reported by banks and credit card
associations which generally base reported rates
on chargeback activity only
Depending on which products or services are being sold
online fraud loss risk tolerances and order rejection
rates can vary significantly Merchants selling high
cost goods with relatively low gross margins like most
consumer electronics products tend to err on the side
of rejecting more orders to avoid expensive fraud losses
Merchants who are less subject to fraud attacks can
achieve similar fraud loss rates while rejecting
relatively few orders Over the past few years
as fraud rates have remained relatively stable
we have compiled data on fraud practices and
benchmarks by industry
Direct Revenue Loss Rates
Very large merchants typically use more tools
and have more experience and resources to
manage online fraud so their fraud rates tend
to be lower than the overall rate Revenue loss
measurement includes not only the value of
orders on which fraudulent chargebacks are
received but also the cost of any credits issued
to avoid such chargebacks Figures include both
chargebacks and credits issued directly by the
merchant in response to fraud claims
Fraudulent Order Rate for Accepted Orders
Another key metric is the number of accepted orders that
later turn out to be fraudulent Expressed as a percent of total
orders this metric is typically lower than the revenue loss
percent since the average value of fraudulent orders tends
to be greater than the average value of valid orders which
causes the fraud rate as measured by revenues to be higher
Overall 38 of merchants reported experiencing a fraudulent
order rate of 1 or more in 2008 which was the same
percent reported in 2007
20072008
Average Online Revenue Lost to Payment Fraud
(chargebacks amp fraud-related credits)
Overall $500K ndash lt$5Mlt$500K $5M ndash lt$25M $25M+
Annual Online Revenue
0
12
08
04
02
06
10
14
16
18
14 1
5 16
15
121
3
13
15
14
14
20072008
Average Accepted Orders Resulting in Fraud Losses
Overall $500K ndash lt$5Mlt$500K $5M ndash lt$25M $25M+
Annual Online Revenue
0
12
08
04
02
06
10
14
16
18
16
11
13
12
11
13
11
13
11
13
A fraud chargeback was received on the orders OR a credit was issued directly to a customerwho claims not to have placed an order
21
22
20
C Y B E R S O U R C E 1 0 T H A N N U A L O N L I N E F R A U D R E P O R T
International Orders Carry Higher Risk
Fifty-two percent of merchants surveyed accepted orders
from outside the US amp Canada in 2008 International
sales accounted for an average of 17 of total orders
for these merchants That same group reported that the
actual direct fraud rate on international orders averaged
40 or more than 36 times the overall fraud rate for
domestic online orders Though international markets
represent an attractive opportunity online merchants must
make sure that their fraud detection and management
systems are robust enough to handle the additional risk
involved Merchants who sell online outside of the US
amp Canada report that they reject international orders due
to suspicion of fraud at a rate that is over three and one
half times the US and Canadian average rate of 29
mdash rejecting approximately 1 out of every 9 international
orders received
Average Value of Fraudulent Order Higher than a Valid Order
Historically fraudulent orders tend to have higher values
on average than valid orders In 2008 the median value
of a fraudulent order was $200 compared to $130 median
value reported for valid orders This relationship of higher
fraudulent order values vs valid order value was found for
all merchant size categories as chart 24 shows Since
fraudulent orders tend to be somewhat higher in value than
valid orders merchants will tend to outsort more high value
orders for manual review and verification Large online
merchants reported that the median value of an order
flagged for manual review was $245
Valid vs Fraudulent Order Value
Valid orderFraudulent order
Median used to minimize impact of outliers
Overall $500K ndash lt$5Mlt$500K $5M ndash lt$25M $25M+
Annual Online Revenue
0
$200
$50
$100
$150
$250
$300
$350
$120
$150
$200
$150
$250
$175
$150
$100
$200
$130
24
40
10
05
20
15
25
35
45
30
00
International Fraud Rateover 3x USCanadian rate
11
40
Location of Order Origination
Within USCanadan=326
Outside USCanadan=164
Frau
d R
ate
o
f O
rder
s
23
21
C Y B E R S O U R C E 1 0 T H A N N U A L O N L I N E F R A U D R E P O R T
21copy2009 CyberSource Corporation All rights reserved
Tuning amp Management
Maintaining and Tuning Screening Rules28 of merchants say they have an automated order
screening system in place that allows business managers
to modify decision rules without assistance from internal
IT staff or external parties (up from 16 found in 2006)
The ability to adjust automated order screening systems
quickly helps manage the order review flow tailor rules
to new products and adapt to new fraud trends as they
are encountered Without this ability merchants cannot
easily minimize reject rates review costs or fraud rates
Additionally giving business managers the capability of
adjusting business rules on-the-fly reduces the costs and
burden of IT support
Global Fraud Portals Some online merchants are integrating fraud tools
and strategies via fraud management portals These
portals employ a combination of flexible rules systems
that interact with a portfolio of ldquotruth servicesrdquo around
the globe allowing business managers to set payment
type product type and market-specific screens Case
management systems are being integrated with these
portals with accompanying enhancements to streamline
workflow Global fraud portals typically include hierarchical
management as companies strive to centralize fraud
management across multiple lines of business and
geographies
Merchant Budgets for Fraud Management How much are online merchants spending to mitigate
fraud risk In both 2008 and in 2007 survey results
show that 34 of merchants spend 05 or more of
their online revenues to manage online payment fraud
while 66 spend less than 05 In 2008 across
all merchants the median ratio of fraud management
expense to sales was 022 down from 028 in 2007
although some merchants in high risk categories are
spending significantly more These spending estimates
focus on the cost of managing fraud risk (internal and
external systems and services management development
and review staffs) Direct fraud loss (chargebacks lost
goods and associated shipping costs) as well as the
opportunity cost associated with valid order rejection are
not included here (see chart 25)
Automated
Screening1
Manual
Review2
Accept
Reject3
Fraud Claim
Management4ORDER
RETAINED
REVENUE
Tuning and Management
02ndash lt050ndash lt02 05ndash lt10 10ndash lt40 40+
How Much Merchants Spend
on Fraud Management
(percent of merchants operating at defined expense level)
of Annual Online Revenues Spent to Manage Fraud(staff etc excluding fraud loss)
2007 n=972008 n=108
41 44
6
14
24
22
12 16
16
4
Median2008 = 022
2007 = 028
0
60
40
20
25
title (title)
22
C Y B E R S O U R C E 1 0 T H A N N U A L O N L I N E F R A U D R E P O R T
Budget Allocation For the past three years merchants have consistently
spent just over half their fraud management budgets on
review staff (see chart 26) The remainder is allocated
as follows 25 for third party tools or services and 24
on internally developed tools and systems
Clearly review staff costs are the dominant factor and
only 13 of merchants cite plans to increase review
staffing in 2009 Reducing the need for manual review
and increasing the efficiency and effectiveness of
reviewers is key to growing online business profits and
managing the total cost of online payment fraud One
place to start is by improving the automated detection of
risky orders so as to reduce manual order review volumes
Clearly the continued reliance on manual review we have
seen in the data over the last few years is not an optimal
long term strategy for managing online fraud As budgets
come under increasing pressure merchants will need
to redouble their efforts to automate more of the fraud
management process while keeping valid order conversion
high and fraud loss low
Base Those with 1 or more full-time manual review staff
Average Spending Allocation
for Fraud Management 2008
n=400
3rd Party
Tools
23
24
Internal
Tools amp
System
3rd Party
Tools
25
Order
Review
Staff
51
Planned Staffing Levels
Increase
13
21
Same
81
71
2009
2008
Decrease
6
8
n=238 248
26
23
C Y B E R S O U R C E 1 0 T H A N N U A L O N L I N E F R A U D R E P O R T
23copy2009 CyberSource Corporation All rights reserved
Resources amp Solutions
3 Managed Services
2 Design amp Installation
1 Systems amp Services
PAYMENT SECURITY
Order
Screening
Collection amp
Reconciliation
Global Payment
Acceptance
Processing
Management
L A S E R
BankBankTrans f e rTrans f e r
Direct
Debit
ORDER
bull Onlinebull Call Centerbull IVRbull Kioskbull POSbull ERP
With Performance
Guarantees
To find information on CyberSourcersquos industry-leading risk
management solutions self-paced webinars on decision
management and other whitepapers on electronic payment
management visit our Resource Center at
wwwcybersourcecom For sales assistance phone
1-888-330-2300 or e-mail salescybersourcecom
CyberSource Payment Management Solutions CyberSource offers a comprehensive portfolio of modular
services and tools to help your company manage your entire
payment pipeline to optimize sales results All are available
via one connection to our web-based services
Accept All Popular Payment Types in 190+
Countries
Accept payments worldwide using a merchant account from
your preferred provider or CyberSource worldwide credit
and debit cards regional cards direct debit bank
transfers electronic checks and alternative payment
types such as Bill Me Later and PayPal CyberSource
also provides professional services to help you
integrate payment with front-end and back-office
systems
Risk ManagementOrder Screening
Global Fraud Management Portal with CyberSource Intelligent
Review Technology A hosted rules and case management
system that provides on-demand access to over 150
validation tests and services across all four dimensions of
detection Detectors include multi-merchant transaction
history checks worldwide delivery address and phone
verification device fingerprinting IP geolocation purchase
velocity identity morphing and custom data from your
systems Case management system provides consolidated
data review workflow management and built-in callouts to
validation services to streamline review
Managed Services CyberSource provides client services to
help you analyze design and manage your order screening
and fraud detection processesmdasheverything from screening
strategies and risk threshold optimization analysis
to ongoing monitoring order review and chargeback
managementrecovery Our managed services include
business performance guarantees
Payer Authentication Verified by Visa MasterCard
SecureCode
Processing Management
CyberSource processes your payments in our high
availability datacenters located in the US Europe and
Japan All datacenters are certified PCI-compliant and
include sophisticated processing management logic to help
prevent payment failures and rate downgrades
Collection amp Reconciliation
A full array of online and exportable payment reporting
capability is available to streamline reconciliation activity
Further systems can be installed to automate up to 90
of the tasks associated with payment reconciliation and
chargeback re-presentment
Payment Security
Remove Payment Data From Your Network CyberSource
provides secure storage and hosted payment acceptance
services that let you process without storing or even
transmitting payment data A great way to streamline PCI
compliance and mitigate security risk
Payment System Centralization Our team of experts will help
you consolidate multiple payment systems into a single easy
to manage system Optionally CyberSource will also host
support and manage these systems in our secure datacenters
PCI Planning amp Remediation CyberSource provides PCI
compliance consulting and remediation services to help
remedy PCI issues
Professional Services
CyberSource maintains a team of experienced payment
consultants to assist with payment systems planning
system and process design and implementation and
integration Our client services team is additionally
available to help you monitor tune or fully outsource
portions of your payment operations
C Y B E R S O U R C E 1 0 T H A N N U A L O N L I N E F R A U D R E P O R T
North America
CyberSource Corporation
1295 Charleston Road
Mountain View CA 94043
T 8883302300
T 6509656000
F 6506259145
Email infocybersourcecom
Europe
CyberSource Ltd
The Waterfront
300 Thames Valley Park Drive
Thames Valley Park
Reading RG6 1PT
United Kingdom
T +44 (0) 1189294840
F +44 (0) 8704601931
Email ukcybersourcecom
UK Fraud Report wwwcybersourcecoukukfraudreport
Japan
CyberSource KK (Japan)
3-11-11 Shibuya Shibuya-ku
Tokyo 150-0002 Japan
T +81357747733
F +81357747732
Email mailcybersourcecojp
CyberSource Corporation is a leading provider of
electronic payment risk and security management
solutions CyberSource provides payment management
solutions for electronic payments processed via Web
call center kiosk mobile and POS environments
Services include hosted systems to help you manage
electronic payments as well as professional services
to help design integrate and fully manage parts or all
of your payment operations Over 245000 businesses
worldwide use CyberSource solutions including half
the companies comprising the Dow Jones Industrial
Average and leading Internet brands The company
is headquartered in Mountain View California and
has sales and service offices in Japan the United
Kingdom and other locations in the United States
For More Information
bull Call 18883302300
bull Email infocybersourcecom
bull Visit wwwcybersourcecom
Get Tailored Views of Risk Management
Pipelinetrade MetricsTo get a view crafted for your companyrsquos size and industry
please contact CyberSource at 18883302300 or online at
wwwcybersourcecomcontact_us
For additional information whitepapers and webinars
or sales assistance
bull Contact CyberSource 18883302300 or
wwwcybersourcecomcontact_us
bull Risk Management Solutions visit wwwcybersourcecom
products_and_servicesrisk_management
bull Global Payment amp Security Solutions
visit wwwcybersourcecomproducts_and_services
global_payment_services
About CyberSource
C Y B E R S O U R C E 1 0 T H A N N U A L O N L I N E F R A U D R E P O R T

2
C Y B E R S O U R C E 1 0 T H A N N U A L O N L I N E F R A U D R E P O R T
Report amp Survey MethodologyThis report is based on a survey of US and Canadian online
merchants Decision makers who participated in this survey
represent a blend of small medium and large-sized organizations
based in North America Merchant experience levels range from
companies in their first year of online transactions to the largest
e-retailers and digital distribution entities in the world Merchants
participating in the survey reported a total estimate of $60 billion
for their 2008 online sales Survey respondents include both
non-CyberSource and CyberSource merchants
The survey was conducted via online questionnaire by Mindwave
Research Participating organizations completed the survey
between October 21st and November 11th 2008 All participants
were either responsible for or influenced decisions regarding risk
management in their companies
Get Tailored Views of Risk Management Pipelinetrade MetricsTo obtain customized fraud management benchmarks for your companyrsquos size and industry please contact CyberSource at
18883302300 or online at wwwcybersourcecomcontact_us
For additional information whitepapers and webinars or sales assistance
bull Contact CyberSource 18883302300 or wwwcybersourcecomcontact_us
bull Risk Management Solutions visit wwwcybersourcecomproducts_and_servicesrisk_management
bull Global Payment amp Security Solutions visit wwwcybersourcecomproducts_and_servicesglobal_payment_services
Summary of Participants ProfilesOnline Fraud Survey Wave 2003 2004 2005 2006 2007 2008
Total number of merchants participating 333 348 404 351 318 400
Annual Online Revenue
Less than $500K 29 34 50 37 29 31
$500K to Less than $10M 43 39 24 30 35 28
Over $10M 28 27 26 33 37 41
Duration of Online Selling
Less than One Year 10 12 14 11 5 11
1-2 Years 19 14 19 11 13 12
3-4 Years 44 30 23 18 18 13
5 or More Years 27 44 45 61 67 64
Risk Management Responsibility
Ultimately Responsible 49 50 60 54 55 58
Influence Decision 51 50 40 46 45 42
3
C Y B E R S O U R C E 1 0 T H A N N U A L O N L I N E F R A U D R E P O R T
3copy2009 CyberSource Corporation All rights reserved
EXECUTIVE SUMMARY 4
STAGE 1 AUTOMATED SCREENING 7Fraud Detection Tools Used During Automated Screening 7
Planned Automated Screening Tool Usage 2009 9
Automated DecisionRules Systems9
STAGE 2 MANUAL REVIEW 10Manual Order Review Rates 10
Review Tools amp Practices 10
Review Operations Efficiency13
Final Order Disposition 13
STAGE 3 ORDER DISPOSITIONING (ACCEPTREJECT) 14Post-Review Order Acceptance Rates 14
Overall Order Rejection Rates 15
International Orders Riskier16
STAGE 4 FRAUD CLAIM MANAGEMENT 17Fighting Chargebacks 17
Chargeback Management Tools 18
ChargebacksmdashOnly Half the Problem 18
Fraud Rate Metrics 19
TUNING amp MANAGEMENT 21Maintaining and Tuning Screening Rules 21
Global Fraud Portals 21
Merchant Budgets for Fraud Management 21
Budget Allocation 22
RESOURCES amp SOLUTIONS 23CyberSource Payment Management Solutions 23
ABOUT CYBERSOURCE 24For More Information 24
Table of Contents
4
C Y B E R S O U R C E 1 0 T H A N N U A L O N L I N E F R A U D R E P O R T
Managing online fraud continues to be a significant
and growing cost for merchants of all sizes To better
understand the impact of payment fraud for online
merchants CyberSource sponsors annual surveys
addressing the detection prevention and management of
online fraud This report summarizes findings from our
tenth annual survey
OverviewOver the past three years the percent of online revenues
lost to payment fraud has been stable Merchants have
consistently reported an average loss of 14 of revenues
to payment fraud However total dollar losses from online
payment fraud in the US and Canada have steadily
increased during this time as eCommerce has continued
to grow In 2008 we estimate that $4 billion in online
revenues were lost to payment fraud Just two years ago
in 2006 payment fraud reached the $3 billion revenue
loss milestone (see chart 1)
Key Fraud MetricsThe percent of accepted orders which are later determined
to be fraudulent has also been relatively stable In 2008
merchants reported an overall average fraudulent order rate
of 11 in the US and Canada Over the past six years
the average percent of accepted orders which turn out
to be fraudulent has varied from 10 to 13 Among
industry sectors Consumer Electronics reported the highest
fraudulent order rate averaging 2
The share of incoming orders merchants decline to accept
due to suspicion of payment fraud was down significantly
Put more simply merchants are accepting a higher
percentage of orders In 2008 the overall order rejection
rate due to suspicion of fraud dropped to 29 compared
to 42 in 2007
As the growth of online sales has slowed during 2008 it
appears merchants are now focusing even more attention
on sales conversion and reducing their order rejection
Executive Summary
20
10
05
15
25
35
30
40
0
$45
$00
Revenue Lost to Online Fraud
O
nlin
e R
even
ue L
ost
36
32
17 1
8
16
14
29
2000n=132
2002n=341
2001n=220
2003n=333
2004n=348
2005n=404
2006n=351
14
2007n=294
14
2008n=399
$30
$35
$40
$20
$15
$10
$05
$25
2000 20022001 2003 2004 2005 2006 2007 2008
Online Revenue Loss Due to Fraud
$4B in 2008
$ Lo
ss i
n B
illi
ons
Although the rate of revenue loss due to online payment fraud was stable in 2008 total dollars lost to fraud have increased
due to online sales growth
$15 $1
7 $19
$26 $2
8 $30
$36
$40
$21
1
5
C Y B E R S O U R C E 1 0 T H A N N U A L O N L I N E F R A U D R E P O R T
5copy2009 CyberSource Corporation All rights reserved
rates due to suspicion of fraud The survey results
indicate most merchants have successfully increased
their order acceptance rate with little or no increase in
fraud rates It remains to be seen if online merchants
can continue to control fraud rates while increasing order
acceptance in 2009
Chargebacks Understate Fraud Loss by as Much as 50This yearrsquos survey again probed the percent of fraud
losses accounted for by chargebacks Overall merchants
continue to report that chargebacks accounted for less
than half of fraud losses The remainder occurred when
merchants issued credit to reverse a charge in response to
a consumerrsquos claim of fraudulent account use
International Order Risk 3frac12 Times Higher Than Domestic OrdersOn average merchants now say the rate of fraud
associated with international orders is over three-and-
one-half times as high as domestic orders In 2008 fraud
rates on international orders continued to climb reaching
an average of 40 up from 24 in 2005 Merchants
also reject international orders at a rate three-and-one-half
times higher than domestic orders
Manual Review Rates Over the past six years the overall percent of online
orders that enter manual fraud review has fluctuated
between 22 and 27 about 1 out of 4 on average In
some segments fraud risk is low enough for merchants
to rely entirely on automated review which lowers the
aggregate review ratio But most merchants do manually
review orders for fraud risk and these merchants on
average review 1 out of every 3 orders Over the past
five years merchants who engage in manual order review
have maintained this average review rate Large online
merchants who typically employ more automation
continue to have much lower manual review rates Over
the past three years large merchants ($25M+ in online
sales) performing manual order review have on average
reviewed approximately 15 of orders Looking back over
the past several years of survey data we conclude that
most merchants have made little progress in reducing
their reliance on manual review and are likely reviewing
far more orders today than they were just a few years ago
Efficiency Gains RequiredAs eCommerce sales continue to grow and budgets and
resources remain relatively fixed merchants face the
challenge of screening more online orders while keeping
order rejection and fraud rates as low as possible to
maximize sales and profits Continued reliance on manual
review presents a serious challenge to scalability Can
merchants grow their review staffing sufficiently to keep
pace with fraud Only 13 of online merchants expect to
increase manual review staff in 2009 This is the lowest
level of planned staff increases we have seen in the
survey At the same time merchants reported increased
interest in implementing more automated fraud detection
tools in some cases two or three times higher than last
yearrsquos reporting
6
C Y B E R S O U R C E 1 0 T H A N N U A L O N L I N E F R A U D R E P O R T
Total Pipeline ViewBusinesses that focus solely on managing chargebacks
may not be seeing the complete financial picture Online
payment fraud impacts profits from online sales in
multiple ways Besides direct revenue losses the cost of
stolen goodsservices and associated deliveryfulfillment
costs there are the additional costs of rejecting valid
orders staffing manual review administration of fraud
claims as well as challenges associated with business
scalability Merchants can gain efficiency by taking a total
pipeline view of operations and costs While the fraud rate
is one metric to monitor (and contain within industry
and association limits) an end-to-end view is required to
arrive at the best possible financial outcome
In 2008 these ldquoprofit leaksrdquo in the Risk Management
Pipelinetrade impact as much as 40+ of orders for
mid-sized merchants and as much as 19+ of orders
for larger merchantsmdashrestricting profits operating
efficiency and scalability This report details key metrics
and practices at each point in the pipeline to provide you
with benchmarks and hopefully insight Custom views
of these benchmarks and practices are available through
CyberSourcemdashsee end of report for contact information
Automated
Screening1
Manual
Review2
Accept
Reject3
Fraud Claim
Management4
Risk Management Pipeline
ORDERRETAINED
REVENUE
PROFIT LEAKSStaffing ampScalability
LostSales
Fraud Loss ampAdministration
29 Avg Reject Rate
for USCanadian orders
(all merchants)
109 Avg Reject Rate
for Non-USCanadian
orders (merchants who
accept these orders)
Merchants review 32 of
orders on average
51 of fraud management
budget is spent on review
staff costs
81 of these merchants
have no plans to change
manual order review
staffing during 2009
14 Average Fraud Loss
42 from chargebacks
58 from issued credits
7
C Y B E R S O U R C E 1 0 T H A N N U A L O N L I N E F R A U D R E P O R T
7copy2009 CyberSource Corporation All rights reserved
Fraud Detection Tools Used During Automated ScreeningWe define detection tools as those used to identify the
probability of risk associated with a transaction or to validate
the identity of the purchaser Results of tests carried out
by detection tools are then interpreted by humans or rules
systems to determine if a transaction should be accepted
rejected or reviewed A wide variety of tools are available to
help merchants evaluate incoming orders for potential fraud
Merchants handling large online order volumes typically
employ an initial automated order evaluation to determine
if an incoming order might represent a fraud risk Some
merchants will allow this initial automated screen to
cancel orders without further human intervention 46 of
all merchants cancelled some orders as a result of their
automated screening process and 58 of large merchants
indicated they cancelled some orders at this stage (see
chart 2)
In 2008 two-thirds of merchants reported using three or
more fraud detection tools for automated screening with
47 tools being the average Larger merchants dealing
with higher order volumes reported using 63 detection
tools on average
The most popular tools used to assess online fraud risk are
shown in chart 3 which shows the current and planned
adoption of different tools Note that the tool usage profile
for merchants over $25M in online sales is different than
the overall average These larger merchants generally use
tools across all four dimensions of detection and more often
use their customer history and proprietary data during the
automated order screening process They have a higher use of
company-specific risk scoring models negative and positive
lists and sophisticated order velocity monitoring tools
Overall 96 of merchants use one or more validation tools
These tools are often provided by the card associations to
help authenticate cards and card holders The tool most
often mentioned by merchants is the Address Verification
Service (AVS) which compares numeric address
data with information on file from the cardholderrsquos
card issuing bank AVS is generally available for US
cardholders and for limited numbers of cardholders
in Canada and the UK AVS is subject to a significant
rate of ldquofalse positivesrdquo which may lead to rejecting
valid orders as well as missing fraudulent orders1 If
the cardholder has a new address or a valid alternate
address (such as seasonal vacation home) this
information may not be reflected in the records of
the cardholderrsquos issuing bank so the address would
be flagged as invalid Merchants typically do not rely
solely on AVS to accept or reject an order
Card Verification Number (CVN also known as
CVV2 for Visa CVC2 for MasterCard CID for
American Express and Discover) is the second most
Stage 1 Automated Screening
46
Yes Yes35
11
54
No
11
47 58
No
42
Base Those using automated servicestechnologies
Are Inbound Orders Rejected
Based On Automated Screening
n=315 n=96
No generally all suspicious orders are out-sorted for manual reviewYes if automated tests indicate too much risk OR customer is on our negative listYes but generally ONLY if customer is on our negative list
All Merchants Merchants $25M+ Online Revenue
2
Automated
Screening1
Manual
Review2
Accept
Reject3
Fraud Claim
Management4ORDER
RETAINED
REVENUE
Tuning and Management
1CyberSource analyzed 94 million credit card transactions where AVS
was used and the final status of the transaction was known If a merchant
were to reject orders based solely on an AVS ldquono matchrdquo they would reject
57 of their orders but fail to detect 83 of the fraudulent orders This
represents an 181 false positive ratio
8
C Y B E R S O U R C E 1 0 T H A N N U A L O N L I N E F R A U D R E P O R T
commonly used detection tool The purpose of CVN in a
card-not-present transaction is to attempt to verify that the
person placing the order has the actual card in his or her
possession Requesting the card verification number during
an online purchase can add a measure of security to the
transaction However CVN numbers can be obtained by
fraudsters just as credit card numbers are obtained CVN
usage by online merchants has significantly increased in
the last five years rising from 44 in 2003 to 74 today
Large merchants were asked to identify the three most
effective tools they use To eliminate the bias that the more
commonly used tools have the potential to receive more
mentions we normalize the data by looking at the percent
of merchants using a particular tool who cite that tool as
one of their top three choices
Company specific
fraud screens
received the
highest rating as
being an effective
tool by merchants
who use this tool
Half of the 42
of large merchants
who use custom
fraud models
rated them as
one of their three
most effective
tools These fraud
screens are risk
scoring models
which are tuned
using an individual
merchantrsquos
historical data on
factors associated
with online orders
Since fraudsters
learn over time and
vary their strategies
we typically find
most risk scoring
models need
regular tuning
with new analysis
and data in order
to maximize their
effectiveness
Out-of-wallet or
in-wallet challenge systems while used by only 7 of large
merchants today was rated by 43 of these merchants
as being one of their three most effective tools The use
of challenge systems tends to be limited to merchants
who have frequent repeat purchases by customers or bill
customers on a regular schedule
Device Fingerprinting (also used by only 7 of large
merchants today) was rated by 43 of these merchants
as being one of their three most effective tools These
favorable opinions may well contribute to the very high
intention by other large online merchants to add this tool in
the next twelve months
Automated Fraud Detection Tool Current Usage and Plans
All Merchants Merchants $25M+ Online Revenue
78 11
74 14
35 9
27 18
25 12
11 7
5 6
5 6
CurrentPlanning to implement (next 12 months)
Current n=359 Future Plans n=194 Current n=101 Future Plans n=70
VALIDATION SERVICES
CVN (Card Verification Number)
Paid for public records service
Out-of-wallet or in-wallet challengeresponse
Telephone number verificationreverse lookup
Credit history check
Address Verification Service
Postal address validation services
Verified by VisaMasterCard SecureCode
87 6
80 16
39 9
19 11
31 10
21 4
3 1
7 6
47 10
38 12
28 15
27 11
18 10
20 9
SINGLE MERCHANT PURCHASE HISTORY
Fraud scoring model ndash company specific
Customer order history
Order velocity monitoring
Valid customer behavior analysis
Positive lists
Negative lists (in-house lists)
58 13
67 10
54 17
42 20
30 14
22 13
6 25
35 19
PURCHASE DEVICE TRACING
Device Fingerprinting
IP geolocation information 48 27
7 47
14 14
9 2
MULTI-MERCHANT PURCHASE HISTORY
Multi-merchant fraud models
Shared negative lists ndash shared hotlists 18 24
9 9
3
9
C Y B E R S O U R C E 1 0 T H A N N U A L O N L I N E F R A U D R E P O R T
9copy2009 CyberSource Corporation All rights reserved
Planned Automated Screening Tool Usage 2009
Device Fingerprinting Highest on ldquoPlan to Buyrdquo Lists
Merchants showed an increased intent to implement every
one of the 14 detection tools we looked at in both 2007 and
2008 Some tools showed dramatic increases in the percent
of merchants who say they intend to implement them in
2009 Four tools had 15 or more of merchants planning
to adopt them in 2009 and for three of these four tools the
plans to implement them have more than doubled over last
year These tools are Device Fingerprinting IP Geolocation
and Order Velocity Monitoring
Device Fingerprinting examines and records details about
the configuration of the device from which the order is
being placed This can aid in flagging fraud attacks where
a variety of fraudulent orders are launched from a common
device or set of devices Nearly 50 of large online
merchants indicated they were planning to add Device
Fingerprinting in the next twelve months
IP geolocation tools also showed a dramatic increase
in merchant interest This tool attempts to identify the
geographic location of the device from which an online order
was placed It provides an additional piece of information
to compare against other order information and order
acceptance rules to help assess the fraud risk of an order
In some cases only an internet service providerrsquos address is
returned so the ultimate geographic location of the device
remains unknown Fraudsters may also employ anonymizers
proxy servers to hide their true IP address and location
As in several years past card association payer
authentication services (eg Verified by Visa MasterCard
SecureCode) figure prominently in many merchantsrsquo future
plans 2008 survey results show that one out of four
merchants currently use one or more of the available payer
authentication services 18 of respondents say they are
interested in deploying these systems in the next twelve
months as a new tool to manage fraud However despite
significant interest in implementing payer authentication
systems over the past few years we have seen relatively
slow actual adoption of payer authentication since we
started tracking this tool in 2003
Implementing payer authentication should reduce exposure
to card-not-present fraud loss either by authenticating
the buyerrsquos identity or by shifting fraud liability back
to the card issuing bank (interchange incentives also
apply) Further certain card types in some countries are
beginning to require that payer authentication solutions
be used as a condition of accepting the associated cards
(eg Maestro Cards in the United Kingdom) But if
merchants have a sufficiently high direct fraud loss rate
the card association may not permit the merchant to shift
liability even if the merchant has implemented a payer
authentication system Over the next few years these
systems may help reduce the incidence of online credit
card fraud if a critical mass of consumers register their
cards and accept the new checkout procedures
Successful adoption of payer authentication will require
merchants to put procedures in place to handle customers
who have not adopted verification services or who
use cards or payment types which are not supported
International expansion and the growing popularity of
online payment types such as electronic checks PayPaltrade
Bill Me Laterreg etc drive the need for alternative fraud
management techniques
Automated DecisionRules Systems
Automated Order Screening
Automated order decisioning screening systems are now
used by 56 of merchants (up from 25 in 2005) Eight
out of ten larger online merchants use such systems These
tools help companies automate order screening by applying
a merchantrsquos business rules in the real-time evaluation of
incoming orders
Decision and rules systems automate the evaluation of test
results generated by fraud detection tools and determine
whether the transaction should be accepted rejected or
suspended for review As the number of tools used grow
it is becoming increasingly important for merchants to
employ automated systems to interpret and weigh the
multiple results for each product or transaction profile
(versus a ldquoone size fits allrdquo screen) to optimize business
results Because fraud patterns are dynamic and the
introduction of new products services or markets often
requires a unique set of acceptance rules it is imperative
that these systems also quickly adapt to the changing
environment Half of large merchants say their screening
system allows business managers to create and modify
screening rules without assistance from external experts or
internal information technology staff
Results of Automated Screening
The automated order screening process generates three
outcomes 1) order acceptance without further review 2)
orders flagged for further review and 3) automatic order
rejection 46 of merchants indicated they reject some
orders based on automated screening tests and 58 of
large merchants indicated doing so
10
C Y B E R S O U R C E 1 0 T H A N N U A L O N L I N E F R A U D R E P O R T
Orders which do not pass the automated order screening
stage typically enter a manual review queue During this
stage additional information is collected to determine if
orders should be accepted or rejected due to excessive
fraud risk
Manual review represents a critical area of profit leakage
It is expensive limits scalability and impacts customer
satisfaction For many merchants it represents half of
their fraud management budget Only 13 of merchants
say they have budget available to increase review
staff now or in the next twelve months This presents
significant challenges to profit growth since even at a
stable percent of orders sent to review the total number
of orders that must be reviewed increases in step with the
total increase of online sales
Manual Order Review RatesIn what should be a highly automated sales environment
most merchants are manually checking orders In fact
during the past six years overall 1 out of every 4 orders
transacted online have been manually reviewed (see chart
4) Over the same period merchants who conduct manual
review typically reviewed 1 out of 3 orders they received
Merchants of all sizes use manual review to manage
payment fraud Chart 5 shows smaller merchants review
a higher percentage of orders (perhaps because lower
order volumes permit such practice) but even larger
merchants review a significant percentage of online
ordersmdashand likely devote more resources to this task than
is operationally scalable
One consequence of using more fraud detection tools
during automated screening is a greater chance of one
or more flags being raised resulting in an order being
selected for manual review Adding additional tools to
detect fraud may result in downstream impacts and
costs if these tools are not carefully integrated into a
merchantrsquos review process and tuned to a merchantrsquos
specific situation
Merchants expecting increased online sales will need to
take at least one of the following actions 1) divert more
staff time to the order review process 2) increase staffing
levels 3) allow more time to process orders and ship good
ones or 4) improve accuracy of initial automated sorting
and make the subsequent review process more efficient
Review Tools amp PracticesGiven the reported limitations on hiring additional manual
review staff there is increased focus on investing in tools
and systems to increase the productivity and effectiveness
of review staff While the primary focus should be on
improving initial automated sorting accuracy to decrease
need for review attention to streamlining the review
process is also warranted
Stage 2 Manual Review
Automated
Screening1
Manual
Review2
Accept
Reject3
Fraud Claim
Management4ORDER
RETAINED
REVENUE
Tuning and Management
40
0
2004 2005 2006
Manual Review Trends
2007 2008
30
20
10
5
15
25
35
Over the past 5 years on average 1 out of 4 online orders were
manually reviewed Merchants performing manual review have
on average reviewed 1 out of every 3 orders received
35
26
Orders Reviewed by Merchants Practicing Review Orders Reviewed Overall (Net Review)
23
28
27
33
22
32
27
34
4
11
C Y B E R S O U R C E 1 0 T H A N N U A L O N L I N E F R A U D R E P O R T
11copy2009 CyberSource Corporation All rights reserved
Use of Case Management Systems
Currently 1 out of 3 merchants report having a case
management system that supports their manual review
process and staff Over half of merchants either
currently use a case management system or
plan to implement one in 2009 For large
online merchants 65 report currently using
or planning to implement a case management
system
Merchants using a case management system
are also more likely to be able to track fraud
rates on orders which have gone through
manual review 74 of merchants using case
management systems report tracking fraud
rates for manually reviewed orders vs only
42 being able to do so when not using a
case management system Surprisingly 44
of merchants performing manual order review
say they do not track the fraud rates of orders
which have been manually reviewed and 24
of large merchants say they do not have this
information Without knowing the fraud rate
on orders going through manual review and
who reviewed them it is difficult to determine
training needs or other actions to improve the
effectiveness of manual review
Tools UsedPlanned During Manual Review
While many of the tools or detector results used
during automated screening can also be used
during manual review several additional tools
and processes are employed by manual reviewers
Attempting to validate an order by contacting the
customer is standard practice for 7 out of 10
merchants and 82 of large merchants However
most organizations have policies regarding how
quickly they must clear orders through manual
review and how long they will wait for customers
to respond to requests for additional information
Most merchants try to clear orders through manual
review in one business day and say they will not
wait more than three business days for a customer
to respond to a request for more information (see
charts 7 and 8)
Another practice used only in manual review is to
contact the card issuer This action is taken by
almost half of merchants overall and 60 of large
merchants Telephone number validation reverse
lookup is the third most popular tool with 56 of
merchants using it during manual review vs 25
during automated screening
In 2008 two-thirds of merchants reported using
four or more fraud detection tools for manual review with
49 tools being the average Larger merchants reported
using 61 detection tools on average
35
15
5
25
30
10
20
40
45
50
55
0
Average of Orders Manually Reviewed(for merchants engaged in review)
200620072008
lt$500K
36
43
51
$500K ndash lt$5M
36
45
35
$5M ndash lt$25M
25
40
34
$25M+
15
14
15
o
f O
rder
s
Annual Online Revenues
5
Currently usePlan to implement in 2009Do not use or plan to implement
Use or Plan to Implement Case Management System
to Support Manual Order Review Process
18
4933
n=227
All Merchants
35
39
26
n=84
Merchants $25M+
Base Those conducting manual review
6
12
C Y B E R S O U R C E 1 0 T H A N N U A L O N L I N E F R A U D R E P O R T
35
15
5
25
50
30
10
20
40
45
0
Time Allowed for Customer Response
Source 2008 CyberSource Fraud Report
Half day
or less
10
Same
business
day
10
Next
business
day
14
2-3
business
days
37
4-5
business
days
11
6 or more
business
days
19
8
Fraud Detection Tool Usage During Manual Review
All Merchants Merchants $25M+ Online Revenue
69 11
56 15
49 10
45 12
23 14
9 7
currently using planning to begin use (in 2009)
Current n=265 Future Plans n=109 Current n=89 Future Plans n=43
VALIDATION SERVICES
Telephone number verificationreverse lookup
Credit history check
Paid for public records service
Contact customer to verify order
Contact card issuerAmex CVP
Postal address validation services
82 5
74 5
60 14
46 7
45 14
6 12
72 8
49 14
35 13
22 17
SINGLE MERCHANT PURCHASE HISTORY
Positive lists
Customer order history
Valid customer website behavior analysis
Negative lists (in-house lists)
83 5
69 12
37 14
34 30
40 20
PURCHASE DEVICE TRACING
IP geolocation information 55 28
11 28
MULTI-MERCHANT PURCHASE HISTORY
Shared negative lists ndash shared hotlists 16 35
9
35
15
5
25
30
10
20
40
45
50
0
Time to Clear Orders in Manual Review (2008)
Over two-thirds of merchants clear
orders through manual review
in one business day72
1 hour
or less
26
2-4
hours
10
Same
business
day
36
Next
business
day
18
2-3
business
days
8
4-5
business
days
1
6 or more
business
days
1
n=259
7
13
C Y B E R S O U R C E 1 0 T H A N N U A L O N L I N E F R A U D R E P O R T
13copy2009 CyberSource Corporation All rights reserved
The most popular tools currently used in the manual
review process are shown in chart 9 including the
percent of merchants planning to add each tool in 2009
Review Operations Efficiency
Reviewer Efficiency
The average number of orders a reviewer processed in a
day ranged from 22 for small merchants to 124 for large
(see chart 10) Large merchants who typically have case
management systems achieve a 5X higher throughput
per reviewer in the manual review stage possibly due to
greater use of review systems and detection tools during
manual review On average reviewers spent 7 minutes
reviewing each order in 2008
Time to Ramp New Staff
New to this yearrsquos surveymdashmerchants were asked how
long it takes for an order reviewer to attain acceptable
proficiency in his or her job While the learning curve
varies by type and size of online merchant the median
time reported was 4 weeks Larger merchants reported a
median of 6 weeks for a reviewer to achieve acceptable
proficiency Chart 11 shows the distribution of learning
times reported
Staff Tenure
Given the cost and time required to recruit and train
new staff merchants need to focus on staff retention
Fraud rates or order rejection rates can increase if highly
experienced review staff leave an organization and are
either not replaced or replaced by less experienced
reviewers 85 of review staff have been on the job
for one year or more Merchants report on average that
15 of their review staff were new in 2008 For large
merchants 24 of their staff were new in 2008 (see
chart 12) Efficient training and methods to ensure
consistent and accurate disposition of orders will be key
as merchants seek to optimize operating efficiency
Final Order DispositionAutomated screening and manual order review ultimately
result in order acceptance or rejection A relatively high
percentage of orders manually reviewed are ultimately
accepted (see next section)mdashhighlighting the need for
merchants to improve automated screening accuracy and
reduce the need for review A look at order reject and
acceptance rates follows in Stage 3 of the pipeline review
Overall $500K ndash lt$5Mlt$500K $5M ndash lt$25M $25M+
Average Orders Reviewed Per DayReviewer(by merchant size)
n=185
124
46
2322
68
10
Median of Weeks
4
52
Number of Weeks Required to Train New Reviewer
lt1
3
1
11
2
10
3
11
4
21
5-9
28
10-14
11
15+
5
n=159
11
Overall $500K ndash lt$5Mlt$500K $5M ndash lt$25M $25M+
of Review Staff New in 2008
n=206
24
1413
7
15
12
14
C Y B E R S O U R C E 1 0 T H A N N U A L O N L I N E F R A U D R E P O R T
Post-Review Order Acceptance RatesMerchants who manually review orders indicated they
ultimately accepted nearly frac34 of the orders they manually
reviewed (see chart 13) This was similar to the
proportion reported in 2007 50 of merchants report
they accept 90 or more of orders they manually review
These merchants are incurring significant expense
to find the 10 of the review queue they believe to be
too risky to accept Clearly most merchants require better
methods to determine which orders are to be outsorted for
manual review so only truly suspicious orders receive
human attention
Stage 3 Order Dispositioning (AcceptReject)
Automated
Screening1
Manual
Review2
Accept
Reject3
Fraud Claim
Management4ORDER
RETAINED
REVENUE
Tuning and Management
of Merchants Reporting This Level
of Post-Review Acceptance
1380 ndash 89
4490 ndash 99
6100
970 ndash 79
360 ndash 69
750 ndash 59
140 ndash 49
330 ndash 39
420 ndash 29
510 ndash 19
51 ndash 9
20
50 accept 90+
Post-Review Acceptance Trends
70
30
10
50
100
60
20
40
80
90
0
Most orders that enter manual review are accepted
2003
66
2004
71
2005
69
2006
66
2007
75
2008
73
of Orders Accepted in Review
13
15
C Y B E R S O U R C E 1 0 T H A N N U A L O N L I N E F R A U D R E P O R T
15copy2009 CyberSource Corporation All rights reserved
Overall Order Rejection RatesOrder reject rates can reflect true fraud
risk or signal ldquoprofit leaksrdquo in terms of
valid order rejection or unnecessarily
high rates of manual review In 2008 for
the first time in several years merchants
participating in the survey reported a
significant drop in their order rejection
rates from 42 in 2007 to 29 (see
chart 14)
Order rejection rates dropped in 2008 for
almost every size of merchant (see chart
15) except the very smallest and for
every industry segment (see chart 16)
It is likely that as online sales growth
slows and merchants seek to sustain
revenue levels merchants will look for
ways to accept more orders and reduce
orders rejected due to suspicion of fraud
In 2008 merchants were able to successfully reduce order
rejection rates while holding fraud rates stable It remains
to be seen if order rejection rates can be reduced further
in 2009 without an increase in fraud rates or manual
order review
Order rejection rates also vary by type of product and
merchant profile Chart 16 shows that segments which
have high cost of goods sold andor lower gross margins
tend to have higher order rejection rates Each fraud loss
in this arena has a large negative profit impact Consumer
electronics and jewelryapparel are two examples of online
segments that tend to have higher-than-average order
rejection rates
Yet even within similar groups of online merchants we
see that some merchants achieve low order rejection rates
while still keeping fraudulent order rates under control
Examining the large consumer electronics merchants in
the sample we find that half of these merchants report
35
15
05
25
50
30
10
20
40
45
0
Order Rejection Trends
2005
39
2006
41
2007
42
2008
29
14
Average Orders Rejected Due to Suspicion of Fraud
2007 n=2392008 n=326
Overall $500K ndash lt$5Mlt$500K $5M ndash lt$25M $25M+0
6
4
2
1
3
5
7
8
9
10
45
26
43
64
24
39
27
262
9
42
Order Rejection Rates by Selected Online Segment20072008
n=23
9
n=32
6
n=64
n=95
n=63
n=62
n=35
n=57
n=62
n=85
n=62
n=85
Overall Media amp
Entertainment
Digital Goods
ServicesApparel
Jewelry
Consumer
Electronics
49
34
32
56
42
56
32
42
29
42
Household amp
General Merchandise
22
31
15
16
16
C Y B E R S O U R C E 1 0 T H A N N U A L O N L I N E F R A U D R E P O R T
order rejection rates of 2 or less while maintaining
fraudulent order rates at or even below the average for
their segment
International Orders RiskierMerchants consistently report a much higher level of
order rejection on international orders due to suspicion
of payment fraud In 2008 merchants report their
rejection rate on these orders is over three and one half
times that of domestic orders as shown in chart 17
The actual fraud rate experienced on international orders
supports this cautious approach as merchants report the
fraud risk on international orders is also over three and
one half times that of domestic orders
Order Rejection Trends
of total USCanadian orders rejected of international orders rejected
Historically international order rejection rates
average 32x higher than USCanadian rates
2005 20072006 2008
6
4
2
1
3
5
7
8
9
12
11
10
13
14
42
11
11
29
13
41
12
39
0
15
17
17
C Y B E R S O U R C E 1 0 T H A N N U A L O N L I N E F R A U D R E P O R T
17copy2009 CyberSource Corporation All rights reserved
Fighting ChargebacksThis yearrsquos survey once again examined online merchantsrsquo
practices associated with reviewing and contesting
chargebacks (ldquore-presentmentrdquo) Over the past four years
the share of fraud-coded chargebacks merchants contest
has averaged 43 to 53 with the 2008 average at
50 Medium and large merchants report contesting 52
and 46 respectively of their fraud-coded chargebacks
in 2008 However when we look at the distribution of
merchantsrsquo answers to this question we find that over one
third of merchants are disputing 90 or more of their
fraud chagebacks while three out of ten merchants are
disputing less than 10 of their fraud chargebacks (see
chart 18)
Merchants report that they win on average 44 of the
chargebacks they dispute which is very similar to the 42
win rate reported in 2006 and 40 in 2007 Simply using
the average percent of chargebacks that are disputed (50)
times the average win rate of 44 results in a net recovery
rate of 22 (meaning 22 of all fraud-coded chargebacks
are recovered) However given the wide disparity in the
chargeback re-presentment rate when these are calculated
on a merchant-by-merchant basis and then averaged the
re-presentment win rate rises to 28 (see chart 19 on
next page) the same recovery rate that was found in 2007
Therefore disputing most fraud chargebacks and having
an efficient re-presentment process can help enhance
profitability and reduce fraud loss
Stage 4 Fraud Claim Management
Automated
Screening1
Manual
Review2
Accept
Reject3
Fraud Claim
Management4ORDER
RETAINED
REVENUE
Tuning and Management
Average Total Fraud-Coded
Chargebacks Re-presented of Merchants Reporting
this Re-presentment Rate
480 ndash 89
790 ndash 99
100
370 ndash 79
460 ndash 69
450 ndash 59
540 ndash 49
130 ndash 39
520 ndash 29
810 ndash 19
1 ndash 9
0
C
harg
ebac
ks R
e-pr
esen
ted
Overall $500K ndash lt$5Mlt$500K $5M ndash lt$25M $25M+
Annual Online Revenue
2006 n=1612007 n=1002008 n=120
50
53
47
36
38
48 52
46
5863
56
56
46
45
53
15
15
28
18
18
C Y B E R S O U R C E 1 0 T H A N N U A L O N L I N E F R A U D R E P O R T
Chargeback Management ToolsOf course disputing chargebacks is not an easy or cost-
free process Merchants must manage and organize all
order delivery and payment information to successfully
dispute fraudulent orders with financial institutions
Merchants are beginning to adopt automated systems
for handling this aspect of the pipeline One out of five
merchants reported using chargeback management tools
in 2008 and 37 of large merchants reported using
these tools In our 2006 survey we asked merchants to
provide estimates of how many hours it takes on average
to handle a fraud chargeback The average time spent
overall was 18 hours with a median time of 10 hours
to handle a fraud chargeback (total time consumed
for research documentation submission) The largest
merchants reported a median time of 30 minutes per fraud
chargeback Clearly fraud chargeback management is a
significant expense for merchants
ChargebacksmdashOnly Half the Problem How a fraudulent order is handled can have a significant
impact on bottom line profits Fraudulent orders are
presented to the merchant via two main routes as a
chargeback or as a direct request from a consumer
for credit (they claim fraudulent use of their account)
Although chargebacks are the most often cited metric
merchants report that chargebacks actually account for less
than half of all fraud claims This is true for all sizes of
merchants (see chart 20)
In 2007 large ($25M+ online sales) merchants reported
that 57 of their fraud was presented in the form of a
fraud-coded chargeback but in 2008 this dropped back
to 48 Considering the financial impact of both fraud
claim routes (chargebacks and credit issuancereversal)
some merchants encourage direct consumer contact
to address fraud claims and thus avoid the additional
chargeback fees levied by the merchant bankprocessor If
a consumer contacts the merchant first then the decision
is in the merchantrsquos control to either handle the dispute
directly with the consumer or to advise them to initiate a
fraud chargeback process In any event if merchants are
evaluating fraud losses solely on the basis of chargebacks
the actual rate of fraud loss the business is experiencing
may be as much as two times higher due to direct credit
issuancecharge reversal
Overall $500K ndash lt$5Mlt$500K $5M ndash lt$25M $25M+
Fraud Chargeback Re-presentment
Win RateNet Recovery Rate
Annual Online Revenues
Challenged Net Recovery
44AVERAGEWINRATE
46AVERAGEWINRATE
43AVERAGEWINRATE
54AVERAGEWINRATE
32AVERAGEWINRATE
50
28
36
23
52
38
63
35
46
19
10
0
20
30
40
50
60
70
80
90
100
(Net Recovery Rate is expressed as a of all fraud-coded chargebacks)
19
Overall $500K ndash lt$5Mlt$500K $5M ndash lt$25M $25M+
of Fraud Claims
Chargebacks vs Credit Issued by Merchant
Credits IssuedChargebacks
58
42
76
24
57
43
52
48
52
48
n=25
n=14
7
n=27
n=30
n=55
Annual Online Revenue
n=147
10
0
20
30
40
50
60
70
80
90
100
20
19
C Y B E R S O U R C E 1 0 T H A N N U A L O N L I N E F R A U D R E P O R T
19copy2009 CyberSource Corporation All rights reserved
Fraud Rate MetricsWhen monitoring the level and trend of online
fraud loss we focus on three key metrics
1) Overall revenue lost as a percent of total
online sales 2) percent of accepted orders
which turn out to be fraudulent (domestic and
international) and 3) the average value of a
fraudulent order relative to a valid order Fraud
rates vary widely by merchant and depend on a
variety of factors such as online sales volume
type of products or services sold online and
how such productsservices are delivered and
paid for It is important that merchants track
key fraud metrics over time and evaluate their
performance relative to their peer group (both
size and industry) Note this report provides
benchmarks on total fraud rates (chargebacks +
credits issued directly to consumers by merchants)
As such these metrics tend to be higher
than those reported by banks and credit card
associations which generally base reported rates
on chargeback activity only
Depending on which products or services are being sold
online fraud loss risk tolerances and order rejection
rates can vary significantly Merchants selling high
cost goods with relatively low gross margins like most
consumer electronics products tend to err on the side
of rejecting more orders to avoid expensive fraud losses
Merchants who are less subject to fraud attacks can
achieve similar fraud loss rates while rejecting
relatively few orders Over the past few years
as fraud rates have remained relatively stable
we have compiled data on fraud practices and
benchmarks by industry
Direct Revenue Loss Rates
Very large merchants typically use more tools
and have more experience and resources to
manage online fraud so their fraud rates tend
to be lower than the overall rate Revenue loss
measurement includes not only the value of
orders on which fraudulent chargebacks are
received but also the cost of any credits issued
to avoid such chargebacks Figures include both
chargebacks and credits issued directly by the
merchant in response to fraud claims
Fraudulent Order Rate for Accepted Orders
Another key metric is the number of accepted orders that
later turn out to be fraudulent Expressed as a percent of total
orders this metric is typically lower than the revenue loss
percent since the average value of fraudulent orders tends
to be greater than the average value of valid orders which
causes the fraud rate as measured by revenues to be higher
Overall 38 of merchants reported experiencing a fraudulent
order rate of 1 or more in 2008 which was the same
percent reported in 2007
20072008
Average Online Revenue Lost to Payment Fraud
(chargebacks amp fraud-related credits)
Overall $500K ndash lt$5Mlt$500K $5M ndash lt$25M $25M+
Annual Online Revenue
0
12
08
04
02
06
10
14
16
18
14 1
5 16
15
121
3
13
15
14
14
20072008
Average Accepted Orders Resulting in Fraud Losses
Overall $500K ndash lt$5Mlt$500K $5M ndash lt$25M $25M+
Annual Online Revenue
0
12
08
04
02
06
10
14
16
18
16
11
13
12
11
13
11
13
11
13
A fraud chargeback was received on the orders OR a credit was issued directly to a customerwho claims not to have placed an order
21
22
20
C Y B E R S O U R C E 1 0 T H A N N U A L O N L I N E F R A U D R E P O R T
International Orders Carry Higher Risk
Fifty-two percent of merchants surveyed accepted orders
from outside the US amp Canada in 2008 International
sales accounted for an average of 17 of total orders
for these merchants That same group reported that the
actual direct fraud rate on international orders averaged
40 or more than 36 times the overall fraud rate for
domestic online orders Though international markets
represent an attractive opportunity online merchants must
make sure that their fraud detection and management
systems are robust enough to handle the additional risk
involved Merchants who sell online outside of the US
amp Canada report that they reject international orders due
to suspicion of fraud at a rate that is over three and one
half times the US and Canadian average rate of 29
mdash rejecting approximately 1 out of every 9 international
orders received
Average Value of Fraudulent Order Higher than a Valid Order
Historically fraudulent orders tend to have higher values
on average than valid orders In 2008 the median value
of a fraudulent order was $200 compared to $130 median
value reported for valid orders This relationship of higher
fraudulent order values vs valid order value was found for
all merchant size categories as chart 24 shows Since
fraudulent orders tend to be somewhat higher in value than
valid orders merchants will tend to outsort more high value
orders for manual review and verification Large online
merchants reported that the median value of an order
flagged for manual review was $245
Valid vs Fraudulent Order Value
Valid orderFraudulent order
Median used to minimize impact of outliers
Overall $500K ndash lt$5Mlt$500K $5M ndash lt$25M $25M+
Annual Online Revenue
0
$200
$50
$100
$150
$250
$300
$350
$120
$150
$200
$150
$250
$175
$150
$100
$200
$130
24
40
10
05
20
15
25
35
45
30
00
International Fraud Rateover 3x USCanadian rate
11
40
Location of Order Origination
Within USCanadan=326
Outside USCanadan=164
Frau
d R
ate
o
f O
rder
s
23
21
C Y B E R S O U R C E 1 0 T H A N N U A L O N L I N E F R A U D R E P O R T
21copy2009 CyberSource Corporation All rights reserved
Tuning amp Management
Maintaining and Tuning Screening Rules28 of merchants say they have an automated order
screening system in place that allows business managers
to modify decision rules without assistance from internal
IT staff or external parties (up from 16 found in 2006)
The ability to adjust automated order screening systems
quickly helps manage the order review flow tailor rules
to new products and adapt to new fraud trends as they
are encountered Without this ability merchants cannot
easily minimize reject rates review costs or fraud rates
Additionally giving business managers the capability of
adjusting business rules on-the-fly reduces the costs and
burden of IT support
Global Fraud Portals Some online merchants are integrating fraud tools
and strategies via fraud management portals These
portals employ a combination of flexible rules systems
that interact with a portfolio of ldquotruth servicesrdquo around
the globe allowing business managers to set payment
type product type and market-specific screens Case
management systems are being integrated with these
portals with accompanying enhancements to streamline
workflow Global fraud portals typically include hierarchical
management as companies strive to centralize fraud
management across multiple lines of business and
geographies
Merchant Budgets for Fraud Management How much are online merchants spending to mitigate
fraud risk In both 2008 and in 2007 survey results
show that 34 of merchants spend 05 or more of
their online revenues to manage online payment fraud
while 66 spend less than 05 In 2008 across
all merchants the median ratio of fraud management
expense to sales was 022 down from 028 in 2007
although some merchants in high risk categories are
spending significantly more These spending estimates
focus on the cost of managing fraud risk (internal and
external systems and services management development
and review staffs) Direct fraud loss (chargebacks lost
goods and associated shipping costs) as well as the
opportunity cost associated with valid order rejection are
not included here (see chart 25)
Automated
Screening1
Manual
Review2
Accept
Reject3
Fraud Claim
Management4ORDER
RETAINED
REVENUE
Tuning and Management
02ndash lt050ndash lt02 05ndash lt10 10ndash lt40 40+
How Much Merchants Spend
on Fraud Management
(percent of merchants operating at defined expense level)
of Annual Online Revenues Spent to Manage Fraud(staff etc excluding fraud loss)
2007 n=972008 n=108
41 44
6
14
24
22
12 16
16
4
Median2008 = 022
2007 = 028
0
60
40
20
25
title (title)
22
C Y B E R S O U R C E 1 0 T H A N N U A L O N L I N E F R A U D R E P O R T
Budget Allocation For the past three years merchants have consistently
spent just over half their fraud management budgets on
review staff (see chart 26) The remainder is allocated
as follows 25 for third party tools or services and 24
on internally developed tools and systems
Clearly review staff costs are the dominant factor and
only 13 of merchants cite plans to increase review
staffing in 2009 Reducing the need for manual review
and increasing the efficiency and effectiveness of
reviewers is key to growing online business profits and
managing the total cost of online payment fraud One
place to start is by improving the automated detection of
risky orders so as to reduce manual order review volumes
Clearly the continued reliance on manual review we have
seen in the data over the last few years is not an optimal
long term strategy for managing online fraud As budgets
come under increasing pressure merchants will need
to redouble their efforts to automate more of the fraud
management process while keeping valid order conversion
high and fraud loss low
Base Those with 1 or more full-time manual review staff
Average Spending Allocation
for Fraud Management 2008
n=400
3rd Party
Tools
23
24
Internal
Tools amp
System
3rd Party
Tools
25
Order
Review
Staff
51
Planned Staffing Levels
Increase
13
21
Same
81
71
2009
2008
Decrease
6
8
n=238 248
26
23
C Y B E R S O U R C E 1 0 T H A N N U A L O N L I N E F R A U D R E P O R T
23copy2009 CyberSource Corporation All rights reserved
Resources amp Solutions
3 Managed Services
2 Design amp Installation
1 Systems amp Services
PAYMENT SECURITY
Order
Screening
Collection amp
Reconciliation
Global Payment
Acceptance
Processing
Management
L A S E R
BankBankTrans f e rTrans f e r
Direct
Debit
ORDER
bull Onlinebull Call Centerbull IVRbull Kioskbull POSbull ERP
With Performance
Guarantees
To find information on CyberSourcersquos industry-leading risk
management solutions self-paced webinars on decision
management and other whitepapers on electronic payment
management visit our Resource Center at
wwwcybersourcecom For sales assistance phone
1-888-330-2300 or e-mail salescybersourcecom
CyberSource Payment Management Solutions CyberSource offers a comprehensive portfolio of modular
services and tools to help your company manage your entire
payment pipeline to optimize sales results All are available
via one connection to our web-based services
Accept All Popular Payment Types in 190+
Countries
Accept payments worldwide using a merchant account from
your preferred provider or CyberSource worldwide credit
and debit cards regional cards direct debit bank
transfers electronic checks and alternative payment
types such as Bill Me Later and PayPal CyberSource
also provides professional services to help you
integrate payment with front-end and back-office
systems
Risk ManagementOrder Screening
Global Fraud Management Portal with CyberSource Intelligent
Review Technology A hosted rules and case management
system that provides on-demand access to over 150
validation tests and services across all four dimensions of
detection Detectors include multi-merchant transaction
history checks worldwide delivery address and phone
verification device fingerprinting IP geolocation purchase
velocity identity morphing and custom data from your
systems Case management system provides consolidated
data review workflow management and built-in callouts to
validation services to streamline review
Managed Services CyberSource provides client services to
help you analyze design and manage your order screening
and fraud detection processesmdasheverything from screening
strategies and risk threshold optimization analysis
to ongoing monitoring order review and chargeback
managementrecovery Our managed services include
business performance guarantees
Payer Authentication Verified by Visa MasterCard
SecureCode
Processing Management
CyberSource processes your payments in our high
availability datacenters located in the US Europe and
Japan All datacenters are certified PCI-compliant and
include sophisticated processing management logic to help
prevent payment failures and rate downgrades
Collection amp Reconciliation
A full array of online and exportable payment reporting
capability is available to streamline reconciliation activity
Further systems can be installed to automate up to 90
of the tasks associated with payment reconciliation and
chargeback re-presentment
Payment Security
Remove Payment Data From Your Network CyberSource
provides secure storage and hosted payment acceptance
services that let you process without storing or even
transmitting payment data A great way to streamline PCI
compliance and mitigate security risk
Payment System Centralization Our team of experts will help
you consolidate multiple payment systems into a single easy
to manage system Optionally CyberSource will also host
support and manage these systems in our secure datacenters
PCI Planning amp Remediation CyberSource provides PCI
compliance consulting and remediation services to help
remedy PCI issues
Professional Services
CyberSource maintains a team of experienced payment
consultants to assist with payment systems planning
system and process design and implementation and
integration Our client services team is additionally
available to help you monitor tune or fully outsource
portions of your payment operations
C Y B E R S O U R C E 1 0 T H A N N U A L O N L I N E F R A U D R E P O R T
North America
CyberSource Corporation
1295 Charleston Road
Mountain View CA 94043
T 8883302300
T 6509656000
F 6506259145
Email infocybersourcecom
Europe
CyberSource Ltd
The Waterfront
300 Thames Valley Park Drive
Thames Valley Park
Reading RG6 1PT
United Kingdom
T +44 (0) 1189294840
F +44 (0) 8704601931
Email ukcybersourcecom
UK Fraud Report wwwcybersourcecoukukfraudreport
Japan
CyberSource KK (Japan)
3-11-11 Shibuya Shibuya-ku
Tokyo 150-0002 Japan
T +81357747733
F +81357747732
Email mailcybersourcecojp
CyberSource Corporation is a leading provider of
electronic payment risk and security management
solutions CyberSource provides payment management
solutions for electronic payments processed via Web
call center kiosk mobile and POS environments
Services include hosted systems to help you manage
electronic payments as well as professional services
to help design integrate and fully manage parts or all
of your payment operations Over 245000 businesses
worldwide use CyberSource solutions including half
the companies comprising the Dow Jones Industrial
Average and leading Internet brands The company
is headquartered in Mountain View California and
has sales and service offices in Japan the United
Kingdom and other locations in the United States
For More Information
bull Call 18883302300
bull Email infocybersourcecom
bull Visit wwwcybersourcecom
Get Tailored Views of Risk Management
Pipelinetrade MetricsTo get a view crafted for your companyrsquos size and industry
please contact CyberSource at 18883302300 or online at
wwwcybersourcecomcontact_us
For additional information whitepapers and webinars
or sales assistance
bull Contact CyberSource 18883302300 or
wwwcybersourcecomcontact_us
bull Risk Management Solutions visit wwwcybersourcecom
products_and_servicesrisk_management
bull Global Payment amp Security Solutions
visit wwwcybersourcecomproducts_and_services
global_payment_services
About CyberSource
C Y B E R S O U R C E 1 0 T H A N N U A L O N L I N E F R A U D R E P O R T

3
C Y B E R S O U R C E 1 0 T H A N N U A L O N L I N E F R A U D R E P O R T
3copy2009 CyberSource Corporation All rights reserved
EXECUTIVE SUMMARY 4
STAGE 1 AUTOMATED SCREENING 7Fraud Detection Tools Used During Automated Screening 7
Planned Automated Screening Tool Usage 2009 9
Automated DecisionRules Systems9
STAGE 2 MANUAL REVIEW 10Manual Order Review Rates 10
Review Tools amp Practices 10
Review Operations Efficiency13
Final Order Disposition 13
STAGE 3 ORDER DISPOSITIONING (ACCEPTREJECT) 14Post-Review Order Acceptance Rates 14
Overall Order Rejection Rates 15
International Orders Riskier16
STAGE 4 FRAUD CLAIM MANAGEMENT 17Fighting Chargebacks 17
Chargeback Management Tools 18
ChargebacksmdashOnly Half the Problem 18
Fraud Rate Metrics 19
TUNING amp MANAGEMENT 21Maintaining and Tuning Screening Rules 21
Global Fraud Portals 21
Merchant Budgets for Fraud Management 21
Budget Allocation 22
RESOURCES amp SOLUTIONS 23CyberSource Payment Management Solutions 23
ABOUT CYBERSOURCE 24For More Information 24
Table of Contents
4
C Y B E R S O U R C E 1 0 T H A N N U A L O N L I N E F R A U D R E P O R T
Managing online fraud continues to be a significant
and growing cost for merchants of all sizes To better
understand the impact of payment fraud for online
merchants CyberSource sponsors annual surveys
addressing the detection prevention and management of
online fraud This report summarizes findings from our
tenth annual survey
OverviewOver the past three years the percent of online revenues
lost to payment fraud has been stable Merchants have
consistently reported an average loss of 14 of revenues
to payment fraud However total dollar losses from online
payment fraud in the US and Canada have steadily
increased during this time as eCommerce has continued
to grow In 2008 we estimate that $4 billion in online
revenues were lost to payment fraud Just two years ago
in 2006 payment fraud reached the $3 billion revenue
loss milestone (see chart 1)
Key Fraud MetricsThe percent of accepted orders which are later determined
to be fraudulent has also been relatively stable In 2008
merchants reported an overall average fraudulent order rate
of 11 in the US and Canada Over the past six years
the average percent of accepted orders which turn out
to be fraudulent has varied from 10 to 13 Among
industry sectors Consumer Electronics reported the highest
fraudulent order rate averaging 2
The share of incoming orders merchants decline to accept
due to suspicion of payment fraud was down significantly
Put more simply merchants are accepting a higher
percentage of orders In 2008 the overall order rejection
rate due to suspicion of fraud dropped to 29 compared
to 42 in 2007
As the growth of online sales has slowed during 2008 it
appears merchants are now focusing even more attention
on sales conversion and reducing their order rejection
Executive Summary
20
10
05
15
25
35
30
40
0
$45
$00
Revenue Lost to Online Fraud
O
nlin
e R
even
ue L
ost
36
32
17 1
8
16
14
29
2000n=132
2002n=341
2001n=220
2003n=333
2004n=348
2005n=404
2006n=351
14
2007n=294
14
2008n=399
$30
$35
$40
$20
$15
$10
$05
$25
2000 20022001 2003 2004 2005 2006 2007 2008
Online Revenue Loss Due to Fraud
$4B in 2008
$ Lo
ss i
n B
illi
ons
Although the rate of revenue loss due to online payment fraud was stable in 2008 total dollars lost to fraud have increased
due to online sales growth
$15 $1
7 $19
$26 $2
8 $30
$36
$40
$21
1
5
C Y B E R S O U R C E 1 0 T H A N N U A L O N L I N E F R A U D R E P O R T
5copy2009 CyberSource Corporation All rights reserved
rates due to suspicion of fraud The survey results
indicate most merchants have successfully increased
their order acceptance rate with little or no increase in
fraud rates It remains to be seen if online merchants
can continue to control fraud rates while increasing order
acceptance in 2009
Chargebacks Understate Fraud Loss by as Much as 50This yearrsquos survey again probed the percent of fraud
losses accounted for by chargebacks Overall merchants
continue to report that chargebacks accounted for less
than half of fraud losses The remainder occurred when
merchants issued credit to reverse a charge in response to
a consumerrsquos claim of fraudulent account use
International Order Risk 3frac12 Times Higher Than Domestic OrdersOn average merchants now say the rate of fraud
associated with international orders is over three-and-
one-half times as high as domestic orders In 2008 fraud
rates on international orders continued to climb reaching
an average of 40 up from 24 in 2005 Merchants
also reject international orders at a rate three-and-one-half
times higher than domestic orders
Manual Review Rates Over the past six years the overall percent of online
orders that enter manual fraud review has fluctuated
between 22 and 27 about 1 out of 4 on average In
some segments fraud risk is low enough for merchants
to rely entirely on automated review which lowers the
aggregate review ratio But most merchants do manually
review orders for fraud risk and these merchants on
average review 1 out of every 3 orders Over the past
five years merchants who engage in manual order review
have maintained this average review rate Large online
merchants who typically employ more automation
continue to have much lower manual review rates Over
the past three years large merchants ($25M+ in online
sales) performing manual order review have on average
reviewed approximately 15 of orders Looking back over
the past several years of survey data we conclude that
most merchants have made little progress in reducing
their reliance on manual review and are likely reviewing
far more orders today than they were just a few years ago
Efficiency Gains RequiredAs eCommerce sales continue to grow and budgets and
resources remain relatively fixed merchants face the
challenge of screening more online orders while keeping
order rejection and fraud rates as low as possible to
maximize sales and profits Continued reliance on manual
review presents a serious challenge to scalability Can
merchants grow their review staffing sufficiently to keep
pace with fraud Only 13 of online merchants expect to
increase manual review staff in 2009 This is the lowest
level of planned staff increases we have seen in the
survey At the same time merchants reported increased
interest in implementing more automated fraud detection
tools in some cases two or three times higher than last
yearrsquos reporting
6
C Y B E R S O U R C E 1 0 T H A N N U A L O N L I N E F R A U D R E P O R T
Total Pipeline ViewBusinesses that focus solely on managing chargebacks
may not be seeing the complete financial picture Online
payment fraud impacts profits from online sales in
multiple ways Besides direct revenue losses the cost of
stolen goodsservices and associated deliveryfulfillment
costs there are the additional costs of rejecting valid
orders staffing manual review administration of fraud
claims as well as challenges associated with business
scalability Merchants can gain efficiency by taking a total
pipeline view of operations and costs While the fraud rate
is one metric to monitor (and contain within industry
and association limits) an end-to-end view is required to
arrive at the best possible financial outcome
In 2008 these ldquoprofit leaksrdquo in the Risk Management
Pipelinetrade impact as much as 40+ of orders for
mid-sized merchants and as much as 19+ of orders
for larger merchantsmdashrestricting profits operating
efficiency and scalability This report details key metrics
and practices at each point in the pipeline to provide you
with benchmarks and hopefully insight Custom views
of these benchmarks and practices are available through
CyberSourcemdashsee end of report for contact information
Automated
Screening1
Manual
Review2
Accept
Reject3
Fraud Claim
Management4
Risk Management Pipeline
ORDERRETAINED
REVENUE
PROFIT LEAKSStaffing ampScalability
LostSales
Fraud Loss ampAdministration
29 Avg Reject Rate
for USCanadian orders
(all merchants)
109 Avg Reject Rate
for Non-USCanadian
orders (merchants who
accept these orders)
Merchants review 32 of
orders on average
51 of fraud management
budget is spent on review
staff costs
81 of these merchants
have no plans to change
manual order review
staffing during 2009
14 Average Fraud Loss
42 from chargebacks
58 from issued credits
7
C Y B E R S O U R C E 1 0 T H A N N U A L O N L I N E F R A U D R E P O R T
7copy2009 CyberSource Corporation All rights reserved
Fraud Detection Tools Used During Automated ScreeningWe define detection tools as those used to identify the
probability of risk associated with a transaction or to validate
the identity of the purchaser Results of tests carried out
by detection tools are then interpreted by humans or rules
systems to determine if a transaction should be accepted
rejected or reviewed A wide variety of tools are available to
help merchants evaluate incoming orders for potential fraud
Merchants handling large online order volumes typically
employ an initial automated order evaluation to determine
if an incoming order might represent a fraud risk Some
merchants will allow this initial automated screen to
cancel orders without further human intervention 46 of
all merchants cancelled some orders as a result of their
automated screening process and 58 of large merchants
indicated they cancelled some orders at this stage (see
chart 2)
In 2008 two-thirds of merchants reported using three or
more fraud detection tools for automated screening with
47 tools being the average Larger merchants dealing
with higher order volumes reported using 63 detection
tools on average
The most popular tools used to assess online fraud risk are
shown in chart 3 which shows the current and planned
adoption of different tools Note that the tool usage profile
for merchants over $25M in online sales is different than
the overall average These larger merchants generally use
tools across all four dimensions of detection and more often
use their customer history and proprietary data during the
automated order screening process They have a higher use of
company-specific risk scoring models negative and positive
lists and sophisticated order velocity monitoring tools
Overall 96 of merchants use one or more validation tools
These tools are often provided by the card associations to
help authenticate cards and card holders The tool most
often mentioned by merchants is the Address Verification
Service (AVS) which compares numeric address
data with information on file from the cardholderrsquos
card issuing bank AVS is generally available for US
cardholders and for limited numbers of cardholders
in Canada and the UK AVS is subject to a significant
rate of ldquofalse positivesrdquo which may lead to rejecting
valid orders as well as missing fraudulent orders1 If
the cardholder has a new address or a valid alternate
address (such as seasonal vacation home) this
information may not be reflected in the records of
the cardholderrsquos issuing bank so the address would
be flagged as invalid Merchants typically do not rely
solely on AVS to accept or reject an order
Card Verification Number (CVN also known as
CVV2 for Visa CVC2 for MasterCard CID for
American Express and Discover) is the second most
Stage 1 Automated Screening
46
Yes Yes35
11
54
No
11
47 58
No
42
Base Those using automated servicestechnologies
Are Inbound Orders Rejected
Based On Automated Screening
n=315 n=96
No generally all suspicious orders are out-sorted for manual reviewYes if automated tests indicate too much risk OR customer is on our negative listYes but generally ONLY if customer is on our negative list
All Merchants Merchants $25M+ Online Revenue
2
Automated
Screening1
Manual
Review2
Accept
Reject3
Fraud Claim
Management4ORDER
RETAINED
REVENUE
Tuning and Management
1CyberSource analyzed 94 million credit card transactions where AVS
was used and the final status of the transaction was known If a merchant
were to reject orders based solely on an AVS ldquono matchrdquo they would reject
57 of their orders but fail to detect 83 of the fraudulent orders This
represents an 181 false positive ratio
8
C Y B E R S O U R C E 1 0 T H A N N U A L O N L I N E F R A U D R E P O R T
commonly used detection tool The purpose of CVN in a
card-not-present transaction is to attempt to verify that the
person placing the order has the actual card in his or her
possession Requesting the card verification number during
an online purchase can add a measure of security to the
transaction However CVN numbers can be obtained by
fraudsters just as credit card numbers are obtained CVN
usage by online merchants has significantly increased in
the last five years rising from 44 in 2003 to 74 today
Large merchants were asked to identify the three most
effective tools they use To eliminate the bias that the more
commonly used tools have the potential to receive more
mentions we normalize the data by looking at the percent
of merchants using a particular tool who cite that tool as
one of their top three choices
Company specific
fraud screens
received the
highest rating as
being an effective
tool by merchants
who use this tool
Half of the 42
of large merchants
who use custom
fraud models
rated them as
one of their three
most effective
tools These fraud
screens are risk
scoring models
which are tuned
using an individual
merchantrsquos
historical data on
factors associated
with online orders
Since fraudsters
learn over time and
vary their strategies
we typically find
most risk scoring
models need
regular tuning
with new analysis
and data in order
to maximize their
effectiveness
Out-of-wallet or
in-wallet challenge systems while used by only 7 of large
merchants today was rated by 43 of these merchants
as being one of their three most effective tools The use
of challenge systems tends to be limited to merchants
who have frequent repeat purchases by customers or bill
customers on a regular schedule
Device Fingerprinting (also used by only 7 of large
merchants today) was rated by 43 of these merchants
as being one of their three most effective tools These
favorable opinions may well contribute to the very high
intention by other large online merchants to add this tool in
the next twelve months
Automated Fraud Detection Tool Current Usage and Plans
All Merchants Merchants $25M+ Online Revenue
78 11
74 14
35 9
27 18
25 12
11 7
5 6
5 6
CurrentPlanning to implement (next 12 months)
Current n=359 Future Plans n=194 Current n=101 Future Plans n=70
VALIDATION SERVICES
CVN (Card Verification Number)
Paid for public records service
Out-of-wallet or in-wallet challengeresponse
Telephone number verificationreverse lookup
Credit history check
Address Verification Service
Postal address validation services
Verified by VisaMasterCard SecureCode
87 6
80 16
39 9
19 11
31 10
21 4
3 1
7 6
47 10
38 12
28 15
27 11
18 10
20 9
SINGLE MERCHANT PURCHASE HISTORY
Fraud scoring model ndash company specific
Customer order history
Order velocity monitoring
Valid customer behavior analysis
Positive lists
Negative lists (in-house lists)
58 13
67 10
54 17
42 20
30 14
22 13
6 25
35 19
PURCHASE DEVICE TRACING
Device Fingerprinting
IP geolocation information 48 27
7 47
14 14
9 2
MULTI-MERCHANT PURCHASE HISTORY
Multi-merchant fraud models
Shared negative lists ndash shared hotlists 18 24
9 9
3
9
C Y B E R S O U R C E 1 0 T H A N N U A L O N L I N E F R A U D R E P O R T
9copy2009 CyberSource Corporation All rights reserved
Planned Automated Screening Tool Usage 2009
Device Fingerprinting Highest on ldquoPlan to Buyrdquo Lists
Merchants showed an increased intent to implement every
one of the 14 detection tools we looked at in both 2007 and
2008 Some tools showed dramatic increases in the percent
of merchants who say they intend to implement them in
2009 Four tools had 15 or more of merchants planning
to adopt them in 2009 and for three of these four tools the
plans to implement them have more than doubled over last
year These tools are Device Fingerprinting IP Geolocation
and Order Velocity Monitoring
Device Fingerprinting examines and records details about
the configuration of the device from which the order is
being placed This can aid in flagging fraud attacks where
a variety of fraudulent orders are launched from a common
device or set of devices Nearly 50 of large online
merchants indicated they were planning to add Device
Fingerprinting in the next twelve months
IP geolocation tools also showed a dramatic increase
in merchant interest This tool attempts to identify the
geographic location of the device from which an online order
was placed It provides an additional piece of information
to compare against other order information and order
acceptance rules to help assess the fraud risk of an order
In some cases only an internet service providerrsquos address is
returned so the ultimate geographic location of the device
remains unknown Fraudsters may also employ anonymizers
proxy servers to hide their true IP address and location
As in several years past card association payer
authentication services (eg Verified by Visa MasterCard
SecureCode) figure prominently in many merchantsrsquo future
plans 2008 survey results show that one out of four
merchants currently use one or more of the available payer
authentication services 18 of respondents say they are
interested in deploying these systems in the next twelve
months as a new tool to manage fraud However despite
significant interest in implementing payer authentication
systems over the past few years we have seen relatively
slow actual adoption of payer authentication since we
started tracking this tool in 2003
Implementing payer authentication should reduce exposure
to card-not-present fraud loss either by authenticating
the buyerrsquos identity or by shifting fraud liability back
to the card issuing bank (interchange incentives also
apply) Further certain card types in some countries are
beginning to require that payer authentication solutions
be used as a condition of accepting the associated cards
(eg Maestro Cards in the United Kingdom) But if
merchants have a sufficiently high direct fraud loss rate
the card association may not permit the merchant to shift
liability even if the merchant has implemented a payer
authentication system Over the next few years these
systems may help reduce the incidence of online credit
card fraud if a critical mass of consumers register their
cards and accept the new checkout procedures
Successful adoption of payer authentication will require
merchants to put procedures in place to handle customers
who have not adopted verification services or who
use cards or payment types which are not supported
International expansion and the growing popularity of
online payment types such as electronic checks PayPaltrade
Bill Me Laterreg etc drive the need for alternative fraud
management techniques
Automated DecisionRules Systems
Automated Order Screening
Automated order decisioning screening systems are now
used by 56 of merchants (up from 25 in 2005) Eight
out of ten larger online merchants use such systems These
tools help companies automate order screening by applying
a merchantrsquos business rules in the real-time evaluation of
incoming orders
Decision and rules systems automate the evaluation of test
results generated by fraud detection tools and determine
whether the transaction should be accepted rejected or
suspended for review As the number of tools used grow
it is becoming increasingly important for merchants to
employ automated systems to interpret and weigh the
multiple results for each product or transaction profile
(versus a ldquoone size fits allrdquo screen) to optimize business
results Because fraud patterns are dynamic and the
introduction of new products services or markets often
requires a unique set of acceptance rules it is imperative
that these systems also quickly adapt to the changing
environment Half of large merchants say their screening
system allows business managers to create and modify
screening rules without assistance from external experts or
internal information technology staff
Results of Automated Screening
The automated order screening process generates three
outcomes 1) order acceptance without further review 2)
orders flagged for further review and 3) automatic order
rejection 46 of merchants indicated they reject some
orders based on automated screening tests and 58 of
large merchants indicated doing so
10
C Y B E R S O U R C E 1 0 T H A N N U A L O N L I N E F R A U D R E P O R T
Orders which do not pass the automated order screening
stage typically enter a manual review queue During this
stage additional information is collected to determine if
orders should be accepted or rejected due to excessive
fraud risk
Manual review represents a critical area of profit leakage
It is expensive limits scalability and impacts customer
satisfaction For many merchants it represents half of
their fraud management budget Only 13 of merchants
say they have budget available to increase review
staff now or in the next twelve months This presents
significant challenges to profit growth since even at a
stable percent of orders sent to review the total number
of orders that must be reviewed increases in step with the
total increase of online sales
Manual Order Review RatesIn what should be a highly automated sales environment
most merchants are manually checking orders In fact
during the past six years overall 1 out of every 4 orders
transacted online have been manually reviewed (see chart
4) Over the same period merchants who conduct manual
review typically reviewed 1 out of 3 orders they received
Merchants of all sizes use manual review to manage
payment fraud Chart 5 shows smaller merchants review
a higher percentage of orders (perhaps because lower
order volumes permit such practice) but even larger
merchants review a significant percentage of online
ordersmdashand likely devote more resources to this task than
is operationally scalable
One consequence of using more fraud detection tools
during automated screening is a greater chance of one
or more flags being raised resulting in an order being
selected for manual review Adding additional tools to
detect fraud may result in downstream impacts and
costs if these tools are not carefully integrated into a
merchantrsquos review process and tuned to a merchantrsquos
specific situation
Merchants expecting increased online sales will need to
take at least one of the following actions 1) divert more
staff time to the order review process 2) increase staffing
levels 3) allow more time to process orders and ship good
ones or 4) improve accuracy of initial automated sorting
and make the subsequent review process more efficient
Review Tools amp PracticesGiven the reported limitations on hiring additional manual
review staff there is increased focus on investing in tools
and systems to increase the productivity and effectiveness
of review staff While the primary focus should be on
improving initial automated sorting accuracy to decrease
need for review attention to streamlining the review
process is also warranted
Stage 2 Manual Review
Automated
Screening1
Manual
Review2
Accept
Reject3
Fraud Claim
Management4ORDER
RETAINED
REVENUE
Tuning and Management
40
0
2004 2005 2006
Manual Review Trends
2007 2008
30
20
10
5
15
25
35
Over the past 5 years on average 1 out of 4 online orders were
manually reviewed Merchants performing manual review have
on average reviewed 1 out of every 3 orders received
35
26
Orders Reviewed by Merchants Practicing Review Orders Reviewed Overall (Net Review)
23
28
27
33
22
32
27
34
4
11
C Y B E R S O U R C E 1 0 T H A N N U A L O N L I N E F R A U D R E P O R T
11copy2009 CyberSource Corporation All rights reserved
Use of Case Management Systems
Currently 1 out of 3 merchants report having a case
management system that supports their manual review
process and staff Over half of merchants either
currently use a case management system or
plan to implement one in 2009 For large
online merchants 65 report currently using
or planning to implement a case management
system
Merchants using a case management system
are also more likely to be able to track fraud
rates on orders which have gone through
manual review 74 of merchants using case
management systems report tracking fraud
rates for manually reviewed orders vs only
42 being able to do so when not using a
case management system Surprisingly 44
of merchants performing manual order review
say they do not track the fraud rates of orders
which have been manually reviewed and 24
of large merchants say they do not have this
information Without knowing the fraud rate
on orders going through manual review and
who reviewed them it is difficult to determine
training needs or other actions to improve the
effectiveness of manual review
Tools UsedPlanned During Manual Review
While many of the tools or detector results used
during automated screening can also be used
during manual review several additional tools
and processes are employed by manual reviewers
Attempting to validate an order by contacting the
customer is standard practice for 7 out of 10
merchants and 82 of large merchants However
most organizations have policies regarding how
quickly they must clear orders through manual
review and how long they will wait for customers
to respond to requests for additional information
Most merchants try to clear orders through manual
review in one business day and say they will not
wait more than three business days for a customer
to respond to a request for more information (see
charts 7 and 8)
Another practice used only in manual review is to
contact the card issuer This action is taken by
almost half of merchants overall and 60 of large
merchants Telephone number validation reverse
lookup is the third most popular tool with 56 of
merchants using it during manual review vs 25
during automated screening
In 2008 two-thirds of merchants reported using
four or more fraud detection tools for manual review with
49 tools being the average Larger merchants reported
using 61 detection tools on average
35
15
5
25
30
10
20
40
45
50
55
0
Average of Orders Manually Reviewed(for merchants engaged in review)
200620072008
lt$500K
36
43
51
$500K ndash lt$5M
36
45
35
$5M ndash lt$25M
25
40
34
$25M+
15
14
15
o
f O
rder
s
Annual Online Revenues
5
Currently usePlan to implement in 2009Do not use or plan to implement
Use or Plan to Implement Case Management System
to Support Manual Order Review Process
18
4933
n=227
All Merchants
35
39
26
n=84
Merchants $25M+
Base Those conducting manual review
6
12
C Y B E R S O U R C E 1 0 T H A N N U A L O N L I N E F R A U D R E P O R T
35
15
5
25
50
30
10
20
40
45
0
Time Allowed for Customer Response
Source 2008 CyberSource Fraud Report
Half day
or less
10
Same
business
day
10
Next
business
day
14
2-3
business
days
37
4-5
business
days
11
6 or more
business
days
19
8
Fraud Detection Tool Usage During Manual Review
All Merchants Merchants $25M+ Online Revenue
69 11
56 15
49 10
45 12
23 14
9 7
currently using planning to begin use (in 2009)
Current n=265 Future Plans n=109 Current n=89 Future Plans n=43
VALIDATION SERVICES
Telephone number verificationreverse lookup
Credit history check
Paid for public records service
Contact customer to verify order
Contact card issuerAmex CVP
Postal address validation services
82 5
74 5
60 14
46 7
45 14
6 12
72 8
49 14
35 13
22 17
SINGLE MERCHANT PURCHASE HISTORY
Positive lists
Customer order history
Valid customer website behavior analysis
Negative lists (in-house lists)
83 5
69 12
37 14
34 30
40 20
PURCHASE DEVICE TRACING
IP geolocation information 55 28
11 28
MULTI-MERCHANT PURCHASE HISTORY
Shared negative lists ndash shared hotlists 16 35
9
35
15
5
25
30
10
20
40
45
50
0
Time to Clear Orders in Manual Review (2008)
Over two-thirds of merchants clear
orders through manual review
in one business day72
1 hour
or less
26
2-4
hours
10
Same
business
day
36
Next
business
day
18
2-3
business
days
8
4-5
business
days
1
6 or more
business
days
1
n=259
7
13
C Y B E R S O U R C E 1 0 T H A N N U A L O N L I N E F R A U D R E P O R T
13copy2009 CyberSource Corporation All rights reserved
The most popular tools currently used in the manual
review process are shown in chart 9 including the
percent of merchants planning to add each tool in 2009
Review Operations Efficiency
Reviewer Efficiency
The average number of orders a reviewer processed in a
day ranged from 22 for small merchants to 124 for large
(see chart 10) Large merchants who typically have case
management systems achieve a 5X higher throughput
per reviewer in the manual review stage possibly due to
greater use of review systems and detection tools during
manual review On average reviewers spent 7 minutes
reviewing each order in 2008
Time to Ramp New Staff
New to this yearrsquos surveymdashmerchants were asked how
long it takes for an order reviewer to attain acceptable
proficiency in his or her job While the learning curve
varies by type and size of online merchant the median
time reported was 4 weeks Larger merchants reported a
median of 6 weeks for a reviewer to achieve acceptable
proficiency Chart 11 shows the distribution of learning
times reported
Staff Tenure
Given the cost and time required to recruit and train
new staff merchants need to focus on staff retention
Fraud rates or order rejection rates can increase if highly
experienced review staff leave an organization and are
either not replaced or replaced by less experienced
reviewers 85 of review staff have been on the job
for one year or more Merchants report on average that
15 of their review staff were new in 2008 For large
merchants 24 of their staff were new in 2008 (see
chart 12) Efficient training and methods to ensure
consistent and accurate disposition of orders will be key
as merchants seek to optimize operating efficiency
Final Order DispositionAutomated screening and manual order review ultimately
result in order acceptance or rejection A relatively high
percentage of orders manually reviewed are ultimately
accepted (see next section)mdashhighlighting the need for
merchants to improve automated screening accuracy and
reduce the need for review A look at order reject and
acceptance rates follows in Stage 3 of the pipeline review
Overall $500K ndash lt$5Mlt$500K $5M ndash lt$25M $25M+
Average Orders Reviewed Per DayReviewer(by merchant size)
n=185
124
46
2322
68
10
Median of Weeks
4
52
Number of Weeks Required to Train New Reviewer
lt1
3
1
11
2
10
3
11
4
21
5-9
28
10-14
11
15+
5
n=159
11
Overall $500K ndash lt$5Mlt$500K $5M ndash lt$25M $25M+
of Review Staff New in 2008
n=206
24
1413
7
15
12
14
C Y B E R S O U R C E 1 0 T H A N N U A L O N L I N E F R A U D R E P O R T
Post-Review Order Acceptance RatesMerchants who manually review orders indicated they
ultimately accepted nearly frac34 of the orders they manually
reviewed (see chart 13) This was similar to the
proportion reported in 2007 50 of merchants report
they accept 90 or more of orders they manually review
These merchants are incurring significant expense
to find the 10 of the review queue they believe to be
too risky to accept Clearly most merchants require better
methods to determine which orders are to be outsorted for
manual review so only truly suspicious orders receive
human attention
Stage 3 Order Dispositioning (AcceptReject)
Automated
Screening1
Manual
Review2
Accept
Reject3
Fraud Claim
Management4ORDER
RETAINED
REVENUE
Tuning and Management
of Merchants Reporting This Level
of Post-Review Acceptance
1380 ndash 89
4490 ndash 99
6100
970 ndash 79
360 ndash 69
750 ndash 59
140 ndash 49
330 ndash 39
420 ndash 29
510 ndash 19
51 ndash 9
20
50 accept 90+
Post-Review Acceptance Trends
70
30
10
50
100
60
20
40
80
90
0
Most orders that enter manual review are accepted
2003
66
2004
71
2005
69
2006
66
2007
75
2008
73
of Orders Accepted in Review
13
15
C Y B E R S O U R C E 1 0 T H A N N U A L O N L I N E F R A U D R E P O R T
15copy2009 CyberSource Corporation All rights reserved
Overall Order Rejection RatesOrder reject rates can reflect true fraud
risk or signal ldquoprofit leaksrdquo in terms of
valid order rejection or unnecessarily
high rates of manual review In 2008 for
the first time in several years merchants
participating in the survey reported a
significant drop in their order rejection
rates from 42 in 2007 to 29 (see
chart 14)
Order rejection rates dropped in 2008 for
almost every size of merchant (see chart
15) except the very smallest and for
every industry segment (see chart 16)
It is likely that as online sales growth
slows and merchants seek to sustain
revenue levels merchants will look for
ways to accept more orders and reduce
orders rejected due to suspicion of fraud
In 2008 merchants were able to successfully reduce order
rejection rates while holding fraud rates stable It remains
to be seen if order rejection rates can be reduced further
in 2009 without an increase in fraud rates or manual
order review
Order rejection rates also vary by type of product and
merchant profile Chart 16 shows that segments which
have high cost of goods sold andor lower gross margins
tend to have higher order rejection rates Each fraud loss
in this arena has a large negative profit impact Consumer
electronics and jewelryapparel are two examples of online
segments that tend to have higher-than-average order
rejection rates
Yet even within similar groups of online merchants we
see that some merchants achieve low order rejection rates
while still keeping fraudulent order rates under control
Examining the large consumer electronics merchants in
the sample we find that half of these merchants report
35
15
05
25
50
30
10
20
40
45
0
Order Rejection Trends
2005
39
2006
41
2007
42
2008
29
14
Average Orders Rejected Due to Suspicion of Fraud
2007 n=2392008 n=326
Overall $500K ndash lt$5Mlt$500K $5M ndash lt$25M $25M+0
6
4
2
1
3
5
7
8
9
10
45
26
43
64
24
39
27
262
9
42
Order Rejection Rates by Selected Online Segment20072008
n=23
9
n=32
6
n=64
n=95
n=63
n=62
n=35
n=57
n=62
n=85
n=62
n=85
Overall Media amp
Entertainment
Digital Goods
ServicesApparel
Jewelry
Consumer
Electronics
49
34
32
56
42
56
32
42
29
42
Household amp
General Merchandise
22
31
15
16
16
C Y B E R S O U R C E 1 0 T H A N N U A L O N L I N E F R A U D R E P O R T
order rejection rates of 2 or less while maintaining
fraudulent order rates at or even below the average for
their segment
International Orders RiskierMerchants consistently report a much higher level of
order rejection on international orders due to suspicion
of payment fraud In 2008 merchants report their
rejection rate on these orders is over three and one half
times that of domestic orders as shown in chart 17
The actual fraud rate experienced on international orders
supports this cautious approach as merchants report the
fraud risk on international orders is also over three and
one half times that of domestic orders
Order Rejection Trends
of total USCanadian orders rejected of international orders rejected
Historically international order rejection rates
average 32x higher than USCanadian rates
2005 20072006 2008
6
4
2
1
3
5
7
8
9
12
11
10
13
14
42
11
11
29
13
41
12
39
0
15
17
17
C Y B E R S O U R C E 1 0 T H A N N U A L O N L I N E F R A U D R E P O R T
17copy2009 CyberSource Corporation All rights reserved
Fighting ChargebacksThis yearrsquos survey once again examined online merchantsrsquo
practices associated with reviewing and contesting
chargebacks (ldquore-presentmentrdquo) Over the past four years
the share of fraud-coded chargebacks merchants contest
has averaged 43 to 53 with the 2008 average at
50 Medium and large merchants report contesting 52
and 46 respectively of their fraud-coded chargebacks
in 2008 However when we look at the distribution of
merchantsrsquo answers to this question we find that over one
third of merchants are disputing 90 or more of their
fraud chagebacks while three out of ten merchants are
disputing less than 10 of their fraud chargebacks (see
chart 18)
Merchants report that they win on average 44 of the
chargebacks they dispute which is very similar to the 42
win rate reported in 2006 and 40 in 2007 Simply using
the average percent of chargebacks that are disputed (50)
times the average win rate of 44 results in a net recovery
rate of 22 (meaning 22 of all fraud-coded chargebacks
are recovered) However given the wide disparity in the
chargeback re-presentment rate when these are calculated
on a merchant-by-merchant basis and then averaged the
re-presentment win rate rises to 28 (see chart 19 on
next page) the same recovery rate that was found in 2007
Therefore disputing most fraud chargebacks and having
an efficient re-presentment process can help enhance
profitability and reduce fraud loss
Stage 4 Fraud Claim Management
Automated
Screening1
Manual
Review2
Accept
Reject3
Fraud Claim
Management4ORDER
RETAINED
REVENUE
Tuning and Management
Average Total Fraud-Coded
Chargebacks Re-presented of Merchants Reporting
this Re-presentment Rate
480 ndash 89
790 ndash 99
100
370 ndash 79
460 ndash 69
450 ndash 59
540 ndash 49
130 ndash 39
520 ndash 29
810 ndash 19
1 ndash 9
0
C
harg
ebac
ks R
e-pr
esen
ted
Overall $500K ndash lt$5Mlt$500K $5M ndash lt$25M $25M+
Annual Online Revenue
2006 n=1612007 n=1002008 n=120
50
53
47
36
38
48 52
46
5863
56
56
46
45
53
15
15
28
18
18
C Y B E R S O U R C E 1 0 T H A N N U A L O N L I N E F R A U D R E P O R T
Chargeback Management ToolsOf course disputing chargebacks is not an easy or cost-
free process Merchants must manage and organize all
order delivery and payment information to successfully
dispute fraudulent orders with financial institutions
Merchants are beginning to adopt automated systems
for handling this aspect of the pipeline One out of five
merchants reported using chargeback management tools
in 2008 and 37 of large merchants reported using
these tools In our 2006 survey we asked merchants to
provide estimates of how many hours it takes on average
to handle a fraud chargeback The average time spent
overall was 18 hours with a median time of 10 hours
to handle a fraud chargeback (total time consumed
for research documentation submission) The largest
merchants reported a median time of 30 minutes per fraud
chargeback Clearly fraud chargeback management is a
significant expense for merchants
ChargebacksmdashOnly Half the Problem How a fraudulent order is handled can have a significant
impact on bottom line profits Fraudulent orders are
presented to the merchant via two main routes as a
chargeback or as a direct request from a consumer
for credit (they claim fraudulent use of their account)
Although chargebacks are the most often cited metric
merchants report that chargebacks actually account for less
than half of all fraud claims This is true for all sizes of
merchants (see chart 20)
In 2007 large ($25M+ online sales) merchants reported
that 57 of their fraud was presented in the form of a
fraud-coded chargeback but in 2008 this dropped back
to 48 Considering the financial impact of both fraud
claim routes (chargebacks and credit issuancereversal)
some merchants encourage direct consumer contact
to address fraud claims and thus avoid the additional
chargeback fees levied by the merchant bankprocessor If
a consumer contacts the merchant first then the decision
is in the merchantrsquos control to either handle the dispute
directly with the consumer or to advise them to initiate a
fraud chargeback process In any event if merchants are
evaluating fraud losses solely on the basis of chargebacks
the actual rate of fraud loss the business is experiencing
may be as much as two times higher due to direct credit
issuancecharge reversal
Overall $500K ndash lt$5Mlt$500K $5M ndash lt$25M $25M+
Fraud Chargeback Re-presentment
Win RateNet Recovery Rate
Annual Online Revenues
Challenged Net Recovery
44AVERAGEWINRATE
46AVERAGEWINRATE
43AVERAGEWINRATE
54AVERAGEWINRATE
32AVERAGEWINRATE
50
28
36
23
52
38
63
35
46
19
10
0
20
30
40
50
60
70
80
90
100
(Net Recovery Rate is expressed as a of all fraud-coded chargebacks)
19
Overall $500K ndash lt$5Mlt$500K $5M ndash lt$25M $25M+
of Fraud Claims
Chargebacks vs Credit Issued by Merchant
Credits IssuedChargebacks
58
42
76
24
57
43
52
48
52
48
n=25
n=14
7
n=27
n=30
n=55
Annual Online Revenue
n=147
10
0
20
30
40
50
60
70
80
90
100
20
19
C Y B E R S O U R C E 1 0 T H A N N U A L O N L I N E F R A U D R E P O R T
19copy2009 CyberSource Corporation All rights reserved
Fraud Rate MetricsWhen monitoring the level and trend of online
fraud loss we focus on three key metrics
1) Overall revenue lost as a percent of total
online sales 2) percent of accepted orders
which turn out to be fraudulent (domestic and
international) and 3) the average value of a
fraudulent order relative to a valid order Fraud
rates vary widely by merchant and depend on a
variety of factors such as online sales volume
type of products or services sold online and
how such productsservices are delivered and
paid for It is important that merchants track
key fraud metrics over time and evaluate their
performance relative to their peer group (both
size and industry) Note this report provides
benchmarks on total fraud rates (chargebacks +
credits issued directly to consumers by merchants)
As such these metrics tend to be higher
than those reported by banks and credit card
associations which generally base reported rates
on chargeback activity only
Depending on which products or services are being sold
online fraud loss risk tolerances and order rejection
rates can vary significantly Merchants selling high
cost goods with relatively low gross margins like most
consumer electronics products tend to err on the side
of rejecting more orders to avoid expensive fraud losses
Merchants who are less subject to fraud attacks can
achieve similar fraud loss rates while rejecting
relatively few orders Over the past few years
as fraud rates have remained relatively stable
we have compiled data on fraud practices and
benchmarks by industry
Direct Revenue Loss Rates
Very large merchants typically use more tools
and have more experience and resources to
manage online fraud so their fraud rates tend
to be lower than the overall rate Revenue loss
measurement includes not only the value of
orders on which fraudulent chargebacks are
received but also the cost of any credits issued
to avoid such chargebacks Figures include both
chargebacks and credits issued directly by the
merchant in response to fraud claims
Fraudulent Order Rate for Accepted Orders
Another key metric is the number of accepted orders that
later turn out to be fraudulent Expressed as a percent of total
orders this metric is typically lower than the revenue loss
percent since the average value of fraudulent orders tends
to be greater than the average value of valid orders which
causes the fraud rate as measured by revenues to be higher
Overall 38 of merchants reported experiencing a fraudulent
order rate of 1 or more in 2008 which was the same
percent reported in 2007
20072008
Average Online Revenue Lost to Payment Fraud
(chargebacks amp fraud-related credits)
Overall $500K ndash lt$5Mlt$500K $5M ndash lt$25M $25M+
Annual Online Revenue
0
12
08
04
02
06
10
14
16
18
14 1
5 16
15
121
3
13
15
14
14
20072008
Average Accepted Orders Resulting in Fraud Losses
Overall $500K ndash lt$5Mlt$500K $5M ndash lt$25M $25M+
Annual Online Revenue
0
12
08
04
02
06
10
14
16
18
16
11
13
12
11
13
11
13
11
13
A fraud chargeback was received on the orders OR a credit was issued directly to a customerwho claims not to have placed an order
21
22
20
C Y B E R S O U R C E 1 0 T H A N N U A L O N L I N E F R A U D R E P O R T
International Orders Carry Higher Risk
Fifty-two percent of merchants surveyed accepted orders
from outside the US amp Canada in 2008 International
sales accounted for an average of 17 of total orders
for these merchants That same group reported that the
actual direct fraud rate on international orders averaged
40 or more than 36 times the overall fraud rate for
domestic online orders Though international markets
represent an attractive opportunity online merchants must
make sure that their fraud detection and management
systems are robust enough to handle the additional risk
involved Merchants who sell online outside of the US
amp Canada report that they reject international orders due
to suspicion of fraud at a rate that is over three and one
half times the US and Canadian average rate of 29
mdash rejecting approximately 1 out of every 9 international
orders received
Average Value of Fraudulent Order Higher than a Valid Order
Historically fraudulent orders tend to have higher values
on average than valid orders In 2008 the median value
of a fraudulent order was $200 compared to $130 median
value reported for valid orders This relationship of higher
fraudulent order values vs valid order value was found for
all merchant size categories as chart 24 shows Since
fraudulent orders tend to be somewhat higher in value than
valid orders merchants will tend to outsort more high value
orders for manual review and verification Large online
merchants reported that the median value of an order
flagged for manual review was $245
Valid vs Fraudulent Order Value
Valid orderFraudulent order
Median used to minimize impact of outliers
Overall $500K ndash lt$5Mlt$500K $5M ndash lt$25M $25M+
Annual Online Revenue
0
$200
$50
$100
$150
$250
$300
$350
$120
$150
$200
$150
$250
$175
$150
$100
$200
$130
24
40
10
05
20
15
25
35
45
30
00
International Fraud Rateover 3x USCanadian rate
11
40
Location of Order Origination
Within USCanadan=326
Outside USCanadan=164
Frau
d R
ate
o
f O
rder
s
23
21
C Y B E R S O U R C E 1 0 T H A N N U A L O N L I N E F R A U D R E P O R T
21copy2009 CyberSource Corporation All rights reserved
Tuning amp Management
Maintaining and Tuning Screening Rules28 of merchants say they have an automated order
screening system in place that allows business managers
to modify decision rules without assistance from internal
IT staff or external parties (up from 16 found in 2006)
The ability to adjust automated order screening systems
quickly helps manage the order review flow tailor rules
to new products and adapt to new fraud trends as they
are encountered Without this ability merchants cannot
easily minimize reject rates review costs or fraud rates
Additionally giving business managers the capability of
adjusting business rules on-the-fly reduces the costs and
burden of IT support
Global Fraud Portals Some online merchants are integrating fraud tools
and strategies via fraud management portals These
portals employ a combination of flexible rules systems
that interact with a portfolio of ldquotruth servicesrdquo around
the globe allowing business managers to set payment
type product type and market-specific screens Case
management systems are being integrated with these
portals with accompanying enhancements to streamline
workflow Global fraud portals typically include hierarchical
management as companies strive to centralize fraud
management across multiple lines of business and
geographies
Merchant Budgets for Fraud Management How much are online merchants spending to mitigate
fraud risk In both 2008 and in 2007 survey results
show that 34 of merchants spend 05 or more of
their online revenues to manage online payment fraud
while 66 spend less than 05 In 2008 across
all merchants the median ratio of fraud management
expense to sales was 022 down from 028 in 2007
although some merchants in high risk categories are
spending significantly more These spending estimates
focus on the cost of managing fraud risk (internal and
external systems and services management development
and review staffs) Direct fraud loss (chargebacks lost
goods and associated shipping costs) as well as the
opportunity cost associated with valid order rejection are
not included here (see chart 25)
Automated
Screening1
Manual
Review2
Accept
Reject3
Fraud Claim
Management4ORDER
RETAINED
REVENUE
Tuning and Management
02ndash lt050ndash lt02 05ndash lt10 10ndash lt40 40+
How Much Merchants Spend
on Fraud Management
(percent of merchants operating at defined expense level)
of Annual Online Revenues Spent to Manage Fraud(staff etc excluding fraud loss)
2007 n=972008 n=108
41 44
6
14
24
22
12 16
16
4
Median2008 = 022
2007 = 028
0
60
40
20
25
title (title)
22
C Y B E R S O U R C E 1 0 T H A N N U A L O N L I N E F R A U D R E P O R T
Budget Allocation For the past three years merchants have consistently
spent just over half their fraud management budgets on
review staff (see chart 26) The remainder is allocated
as follows 25 for third party tools or services and 24
on internally developed tools and systems
Clearly review staff costs are the dominant factor and
only 13 of merchants cite plans to increase review
staffing in 2009 Reducing the need for manual review
and increasing the efficiency and effectiveness of
reviewers is key to growing online business profits and
managing the total cost of online payment fraud One
place to start is by improving the automated detection of
risky orders so as to reduce manual order review volumes
Clearly the continued reliance on manual review we have
seen in the data over the last few years is not an optimal
long term strategy for managing online fraud As budgets
come under increasing pressure merchants will need
to redouble their efforts to automate more of the fraud
management process while keeping valid order conversion
high and fraud loss low
Base Those with 1 or more full-time manual review staff
Average Spending Allocation
for Fraud Management 2008
n=400
3rd Party
Tools
23
24
Internal
Tools amp
System
3rd Party
Tools
25
Order
Review
Staff
51
Planned Staffing Levels
Increase
13
21
Same
81
71
2009
2008
Decrease
6
8
n=238 248
26
23
C Y B E R S O U R C E 1 0 T H A N N U A L O N L I N E F R A U D R E P O R T
23copy2009 CyberSource Corporation All rights reserved
Resources amp Solutions
3 Managed Services
2 Design amp Installation
1 Systems amp Services
PAYMENT SECURITY
Order
Screening
Collection amp
Reconciliation
Global Payment
Acceptance
Processing
Management
L A S E R
BankBankTrans f e rTrans f e r
Direct
Debit
ORDER
bull Onlinebull Call Centerbull IVRbull Kioskbull POSbull ERP
With Performance
Guarantees
To find information on CyberSourcersquos industry-leading risk
management solutions self-paced webinars on decision
management and other whitepapers on electronic payment
management visit our Resource Center at
wwwcybersourcecom For sales assistance phone
1-888-330-2300 or e-mail salescybersourcecom
CyberSource Payment Management Solutions CyberSource offers a comprehensive portfolio of modular
services and tools to help your company manage your entire
payment pipeline to optimize sales results All are available
via one connection to our web-based services
Accept All Popular Payment Types in 190+
Countries
Accept payments worldwide using a merchant account from
your preferred provider or CyberSource worldwide credit
and debit cards regional cards direct debit bank
transfers electronic checks and alternative payment
types such as Bill Me Later and PayPal CyberSource
also provides professional services to help you
integrate payment with front-end and back-office
systems
Risk ManagementOrder Screening
Global Fraud Management Portal with CyberSource Intelligent
Review Technology A hosted rules and case management
system that provides on-demand access to over 150
validation tests and services across all four dimensions of
detection Detectors include multi-merchant transaction
history checks worldwide delivery address and phone
verification device fingerprinting IP geolocation purchase
velocity identity morphing and custom data from your
systems Case management system provides consolidated
data review workflow management and built-in callouts to
validation services to streamline review
Managed Services CyberSource provides client services to
help you analyze design and manage your order screening
and fraud detection processesmdasheverything from screening
strategies and risk threshold optimization analysis
to ongoing monitoring order review and chargeback
managementrecovery Our managed services include
business performance guarantees
Payer Authentication Verified by Visa MasterCard
SecureCode
Processing Management
CyberSource processes your payments in our high
availability datacenters located in the US Europe and
Japan All datacenters are certified PCI-compliant and
include sophisticated processing management logic to help
prevent payment failures and rate downgrades
Collection amp Reconciliation
A full array of online and exportable payment reporting
capability is available to streamline reconciliation activity
Further systems can be installed to automate up to 90
of the tasks associated with payment reconciliation and
chargeback re-presentment
Payment Security
Remove Payment Data From Your Network CyberSource
provides secure storage and hosted payment acceptance
services that let you process without storing or even
transmitting payment data A great way to streamline PCI
compliance and mitigate security risk
Payment System Centralization Our team of experts will help
you consolidate multiple payment systems into a single easy
to manage system Optionally CyberSource will also host
support and manage these systems in our secure datacenters
PCI Planning amp Remediation CyberSource provides PCI
compliance consulting and remediation services to help
remedy PCI issues
Professional Services
CyberSource maintains a team of experienced payment
consultants to assist with payment systems planning
system and process design and implementation and
integration Our client services team is additionally
available to help you monitor tune or fully outsource
portions of your payment operations
C Y B E R S O U R C E 1 0 T H A N N U A L O N L I N E F R A U D R E P O R T
North America
CyberSource Corporation
1295 Charleston Road
Mountain View CA 94043
T 8883302300
T 6509656000
F 6506259145
Email infocybersourcecom
Europe
CyberSource Ltd
The Waterfront
300 Thames Valley Park Drive
Thames Valley Park
Reading RG6 1PT
United Kingdom
T +44 (0) 1189294840
F +44 (0) 8704601931
Email ukcybersourcecom
UK Fraud Report wwwcybersourcecoukukfraudreport
Japan
CyberSource KK (Japan)
3-11-11 Shibuya Shibuya-ku
Tokyo 150-0002 Japan
T +81357747733
F +81357747732
Email mailcybersourcecojp
CyberSource Corporation is a leading provider of
electronic payment risk and security management
solutions CyberSource provides payment management
solutions for electronic payments processed via Web
call center kiosk mobile and POS environments
Services include hosted systems to help you manage
electronic payments as well as professional services
to help design integrate and fully manage parts or all
of your payment operations Over 245000 businesses
worldwide use CyberSource solutions including half
the companies comprising the Dow Jones Industrial
Average and leading Internet brands The company
is headquartered in Mountain View California and
has sales and service offices in Japan the United
Kingdom and other locations in the United States
For More Information
bull Call 18883302300
bull Email infocybersourcecom
bull Visit wwwcybersourcecom
Get Tailored Views of Risk Management
Pipelinetrade MetricsTo get a view crafted for your companyrsquos size and industry
please contact CyberSource at 18883302300 or online at
wwwcybersourcecomcontact_us
For additional information whitepapers and webinars
or sales assistance
bull Contact CyberSource 18883302300 or
wwwcybersourcecomcontact_us
bull Risk Management Solutions visit wwwcybersourcecom
products_and_servicesrisk_management
bull Global Payment amp Security Solutions
visit wwwcybersourcecomproducts_and_services
global_payment_services
About CyberSource
C Y B E R S O U R C E 1 0 T H A N N U A L O N L I N E F R A U D R E P O R T

4
C Y B E R S O U R C E 1 0 T H A N N U A L O N L I N E F R A U D R E P O R T
Managing online fraud continues to be a significant
and growing cost for merchants of all sizes To better
understand the impact of payment fraud for online
merchants CyberSource sponsors annual surveys
addressing the detection prevention and management of
online fraud This report summarizes findings from our
tenth annual survey
OverviewOver the past three years the percent of online revenues
lost to payment fraud has been stable Merchants have
consistently reported an average loss of 14 of revenues
to payment fraud However total dollar losses from online
payment fraud in the US and Canada have steadily
increased during this time as eCommerce has continued
to grow In 2008 we estimate that $4 billion in online
revenues were lost to payment fraud Just two years ago
in 2006 payment fraud reached the $3 billion revenue
loss milestone (see chart 1)
Key Fraud MetricsThe percent of accepted orders which are later determined
to be fraudulent has also been relatively stable In 2008
merchants reported an overall average fraudulent order rate
of 11 in the US and Canada Over the past six years
the average percent of accepted orders which turn out
to be fraudulent has varied from 10 to 13 Among
industry sectors Consumer Electronics reported the highest
fraudulent order rate averaging 2
The share of incoming orders merchants decline to accept
due to suspicion of payment fraud was down significantly
Put more simply merchants are accepting a higher
percentage of orders In 2008 the overall order rejection
rate due to suspicion of fraud dropped to 29 compared
to 42 in 2007
As the growth of online sales has slowed during 2008 it
appears merchants are now focusing even more attention
on sales conversion and reducing their order rejection
Executive Summary
20
10
05
15
25
35
30
40
0
$45
$00
Revenue Lost to Online Fraud
O
nlin
e R
even
ue L
ost
36
32
17 1
8
16
14
29
2000n=132
2002n=341
2001n=220
2003n=333
2004n=348
2005n=404
2006n=351
14
2007n=294
14
2008n=399
$30
$35
$40
$20
$15
$10
$05
$25
2000 20022001 2003 2004 2005 2006 2007 2008
Online Revenue Loss Due to Fraud
$4B in 2008
$ Lo
ss i
n B
illi
ons
Although the rate of revenue loss due to online payment fraud was stable in 2008 total dollars lost to fraud have increased
due to online sales growth
$15 $1
7 $19
$26 $2
8 $30
$36
$40
$21
1
5
C Y B E R S O U R C E 1 0 T H A N N U A L O N L I N E F R A U D R E P O R T
5copy2009 CyberSource Corporation All rights reserved
rates due to suspicion of fraud The survey results
indicate most merchants have successfully increased
their order acceptance rate with little or no increase in
fraud rates It remains to be seen if online merchants
can continue to control fraud rates while increasing order
acceptance in 2009
Chargebacks Understate Fraud Loss by as Much as 50This yearrsquos survey again probed the percent of fraud
losses accounted for by chargebacks Overall merchants
continue to report that chargebacks accounted for less
than half of fraud losses The remainder occurred when
merchants issued credit to reverse a charge in response to
a consumerrsquos claim of fraudulent account use
International Order Risk 3frac12 Times Higher Than Domestic OrdersOn average merchants now say the rate of fraud
associated with international orders is over three-and-
one-half times as high as domestic orders In 2008 fraud
rates on international orders continued to climb reaching
an average of 40 up from 24 in 2005 Merchants
also reject international orders at a rate three-and-one-half
times higher than domestic orders
Manual Review Rates Over the past six years the overall percent of online
orders that enter manual fraud review has fluctuated
between 22 and 27 about 1 out of 4 on average In
some segments fraud risk is low enough for merchants
to rely entirely on automated review which lowers the
aggregate review ratio But most merchants do manually
review orders for fraud risk and these merchants on
average review 1 out of every 3 orders Over the past
five years merchants who engage in manual order review
have maintained this average review rate Large online
merchants who typically employ more automation
continue to have much lower manual review rates Over
the past three years large merchants ($25M+ in online
sales) performing manual order review have on average
reviewed approximately 15 of orders Looking back over
the past several years of survey data we conclude that
most merchants have made little progress in reducing
their reliance on manual review and are likely reviewing
far more orders today than they were just a few years ago
Efficiency Gains RequiredAs eCommerce sales continue to grow and budgets and
resources remain relatively fixed merchants face the
challenge of screening more online orders while keeping
order rejection and fraud rates as low as possible to
maximize sales and profits Continued reliance on manual
review presents a serious challenge to scalability Can
merchants grow their review staffing sufficiently to keep
pace with fraud Only 13 of online merchants expect to
increase manual review staff in 2009 This is the lowest
level of planned staff increases we have seen in the
survey At the same time merchants reported increased
interest in implementing more automated fraud detection
tools in some cases two or three times higher than last
yearrsquos reporting
6
C Y B E R S O U R C E 1 0 T H A N N U A L O N L I N E F R A U D R E P O R T
Total Pipeline ViewBusinesses that focus solely on managing chargebacks
may not be seeing the complete financial picture Online
payment fraud impacts profits from online sales in
multiple ways Besides direct revenue losses the cost of
stolen goodsservices and associated deliveryfulfillment
costs there are the additional costs of rejecting valid
orders staffing manual review administration of fraud
claims as well as challenges associated with business
scalability Merchants can gain efficiency by taking a total
pipeline view of operations and costs While the fraud rate
is one metric to monitor (and contain within industry
and association limits) an end-to-end view is required to
arrive at the best possible financial outcome
In 2008 these ldquoprofit leaksrdquo in the Risk Management
Pipelinetrade impact as much as 40+ of orders for
mid-sized merchants and as much as 19+ of orders
for larger merchantsmdashrestricting profits operating
efficiency and scalability This report details key metrics
and practices at each point in the pipeline to provide you
with benchmarks and hopefully insight Custom views
of these benchmarks and practices are available through
CyberSourcemdashsee end of report for contact information
Automated
Screening1
Manual
Review2
Accept
Reject3
Fraud Claim
Management4
Risk Management Pipeline
ORDERRETAINED
REVENUE
PROFIT LEAKSStaffing ampScalability
LostSales
Fraud Loss ampAdministration
29 Avg Reject Rate
for USCanadian orders
(all merchants)
109 Avg Reject Rate
for Non-USCanadian
orders (merchants who
accept these orders)
Merchants review 32 of
orders on average
51 of fraud management
budget is spent on review
staff costs
81 of these merchants
have no plans to change
manual order review
staffing during 2009
14 Average Fraud Loss
42 from chargebacks
58 from issued credits
7
C Y B E R S O U R C E 1 0 T H A N N U A L O N L I N E F R A U D R E P O R T
7copy2009 CyberSource Corporation All rights reserved
Fraud Detection Tools Used During Automated ScreeningWe define detection tools as those used to identify the
probability of risk associated with a transaction or to validate
the identity of the purchaser Results of tests carried out
by detection tools are then interpreted by humans or rules
systems to determine if a transaction should be accepted
rejected or reviewed A wide variety of tools are available to
help merchants evaluate incoming orders for potential fraud
Merchants handling large online order volumes typically
employ an initial automated order evaluation to determine
if an incoming order might represent a fraud risk Some
merchants will allow this initial automated screen to
cancel orders without further human intervention 46 of
all merchants cancelled some orders as a result of their
automated screening process and 58 of large merchants
indicated they cancelled some orders at this stage (see
chart 2)
In 2008 two-thirds of merchants reported using three or
more fraud detection tools for automated screening with
47 tools being the average Larger merchants dealing
with higher order volumes reported using 63 detection
tools on average
The most popular tools used to assess online fraud risk are
shown in chart 3 which shows the current and planned
adoption of different tools Note that the tool usage profile
for merchants over $25M in online sales is different than
the overall average These larger merchants generally use
tools across all four dimensions of detection and more often
use their customer history and proprietary data during the
automated order screening process They have a higher use of
company-specific risk scoring models negative and positive
lists and sophisticated order velocity monitoring tools
Overall 96 of merchants use one or more validation tools
These tools are often provided by the card associations to
help authenticate cards and card holders The tool most
often mentioned by merchants is the Address Verification
Service (AVS) which compares numeric address
data with information on file from the cardholderrsquos
card issuing bank AVS is generally available for US
cardholders and for limited numbers of cardholders
in Canada and the UK AVS is subject to a significant
rate of ldquofalse positivesrdquo which may lead to rejecting
valid orders as well as missing fraudulent orders1 If
the cardholder has a new address or a valid alternate
address (such as seasonal vacation home) this
information may not be reflected in the records of
the cardholderrsquos issuing bank so the address would
be flagged as invalid Merchants typically do not rely
solely on AVS to accept or reject an order
Card Verification Number (CVN also known as
CVV2 for Visa CVC2 for MasterCard CID for
American Express and Discover) is the second most
Stage 1 Automated Screening
46
Yes Yes35
11
54
No
11
47 58
No
42
Base Those using automated servicestechnologies
Are Inbound Orders Rejected
Based On Automated Screening
n=315 n=96
No generally all suspicious orders are out-sorted for manual reviewYes if automated tests indicate too much risk OR customer is on our negative listYes but generally ONLY if customer is on our negative list
All Merchants Merchants $25M+ Online Revenue
2
Automated
Screening1
Manual
Review2
Accept
Reject3
Fraud Claim
Management4ORDER
RETAINED
REVENUE
Tuning and Management
1CyberSource analyzed 94 million credit card transactions where AVS
was used and the final status of the transaction was known If a merchant
were to reject orders based solely on an AVS ldquono matchrdquo they would reject
57 of their orders but fail to detect 83 of the fraudulent orders This
represents an 181 false positive ratio
8
C Y B E R S O U R C E 1 0 T H A N N U A L O N L I N E F R A U D R E P O R T
commonly used detection tool The purpose of CVN in a
card-not-present transaction is to attempt to verify that the
person placing the order has the actual card in his or her
possession Requesting the card verification number during
an online purchase can add a measure of security to the
transaction However CVN numbers can be obtained by
fraudsters just as credit card numbers are obtained CVN
usage by online merchants has significantly increased in
the last five years rising from 44 in 2003 to 74 today
Large merchants were asked to identify the three most
effective tools they use To eliminate the bias that the more
commonly used tools have the potential to receive more
mentions we normalize the data by looking at the percent
of merchants using a particular tool who cite that tool as
one of their top three choices
Company specific
fraud screens
received the
highest rating as
being an effective
tool by merchants
who use this tool
Half of the 42
of large merchants
who use custom
fraud models
rated them as
one of their three
most effective
tools These fraud
screens are risk
scoring models
which are tuned
using an individual
merchantrsquos
historical data on
factors associated
with online orders
Since fraudsters
learn over time and
vary their strategies
we typically find
most risk scoring
models need
regular tuning
with new analysis
and data in order
to maximize their
effectiveness
Out-of-wallet or
in-wallet challenge systems while used by only 7 of large
merchants today was rated by 43 of these merchants
as being one of their three most effective tools The use
of challenge systems tends to be limited to merchants
who have frequent repeat purchases by customers or bill
customers on a regular schedule
Device Fingerprinting (also used by only 7 of large
merchants today) was rated by 43 of these merchants
as being one of their three most effective tools These
favorable opinions may well contribute to the very high
intention by other large online merchants to add this tool in
the next twelve months
Automated Fraud Detection Tool Current Usage and Plans
All Merchants Merchants $25M+ Online Revenue
78 11
74 14
35 9
27 18
25 12
11 7
5 6
5 6
CurrentPlanning to implement (next 12 months)
Current n=359 Future Plans n=194 Current n=101 Future Plans n=70
VALIDATION SERVICES
CVN (Card Verification Number)
Paid for public records service
Out-of-wallet or in-wallet challengeresponse
Telephone number verificationreverse lookup
Credit history check
Address Verification Service
Postal address validation services
Verified by VisaMasterCard SecureCode
87 6
80 16
39 9
19 11
31 10
21 4
3 1
7 6
47 10
38 12
28 15
27 11
18 10
20 9
SINGLE MERCHANT PURCHASE HISTORY
Fraud scoring model ndash company specific
Customer order history
Order velocity monitoring
Valid customer behavior analysis
Positive lists
Negative lists (in-house lists)
58 13
67 10
54 17
42 20
30 14
22 13
6 25
35 19
PURCHASE DEVICE TRACING
Device Fingerprinting
IP geolocation information 48 27
7 47
14 14
9 2
MULTI-MERCHANT PURCHASE HISTORY
Multi-merchant fraud models
Shared negative lists ndash shared hotlists 18 24
9 9
3
9
C Y B E R S O U R C E 1 0 T H A N N U A L O N L I N E F R A U D R E P O R T
9copy2009 CyberSource Corporation All rights reserved
Planned Automated Screening Tool Usage 2009
Device Fingerprinting Highest on ldquoPlan to Buyrdquo Lists
Merchants showed an increased intent to implement every
one of the 14 detection tools we looked at in both 2007 and
2008 Some tools showed dramatic increases in the percent
of merchants who say they intend to implement them in
2009 Four tools had 15 or more of merchants planning
to adopt them in 2009 and for three of these four tools the
plans to implement them have more than doubled over last
year These tools are Device Fingerprinting IP Geolocation
and Order Velocity Monitoring
Device Fingerprinting examines and records details about
the configuration of the device from which the order is
being placed This can aid in flagging fraud attacks where
a variety of fraudulent orders are launched from a common
device or set of devices Nearly 50 of large online
merchants indicated they were planning to add Device
Fingerprinting in the next twelve months
IP geolocation tools also showed a dramatic increase
in merchant interest This tool attempts to identify the
geographic location of the device from which an online order
was placed It provides an additional piece of information
to compare against other order information and order
acceptance rules to help assess the fraud risk of an order
In some cases only an internet service providerrsquos address is
returned so the ultimate geographic location of the device
remains unknown Fraudsters may also employ anonymizers
proxy servers to hide their true IP address and location
As in several years past card association payer
authentication services (eg Verified by Visa MasterCard
SecureCode) figure prominently in many merchantsrsquo future
plans 2008 survey results show that one out of four
merchants currently use one or more of the available payer
authentication services 18 of respondents say they are
interested in deploying these systems in the next twelve
months as a new tool to manage fraud However despite
significant interest in implementing payer authentication
systems over the past few years we have seen relatively
slow actual adoption of payer authentication since we
started tracking this tool in 2003
Implementing payer authentication should reduce exposure
to card-not-present fraud loss either by authenticating
the buyerrsquos identity or by shifting fraud liability back
to the card issuing bank (interchange incentives also
apply) Further certain card types in some countries are
beginning to require that payer authentication solutions
be used as a condition of accepting the associated cards
(eg Maestro Cards in the United Kingdom) But if
merchants have a sufficiently high direct fraud loss rate
the card association may not permit the merchant to shift
liability even if the merchant has implemented a payer
authentication system Over the next few years these
systems may help reduce the incidence of online credit
card fraud if a critical mass of consumers register their
cards and accept the new checkout procedures
Successful adoption of payer authentication will require
merchants to put procedures in place to handle customers
who have not adopted verification services or who
use cards or payment types which are not supported
International expansion and the growing popularity of
online payment types such as electronic checks PayPaltrade
Bill Me Laterreg etc drive the need for alternative fraud
management techniques
Automated DecisionRules Systems
Automated Order Screening
Automated order decisioning screening systems are now
used by 56 of merchants (up from 25 in 2005) Eight
out of ten larger online merchants use such systems These
tools help companies automate order screening by applying
a merchantrsquos business rules in the real-time evaluation of
incoming orders
Decision and rules systems automate the evaluation of test
results generated by fraud detection tools and determine
whether the transaction should be accepted rejected or
suspended for review As the number of tools used grow
it is becoming increasingly important for merchants to
employ automated systems to interpret and weigh the
multiple results for each product or transaction profile
(versus a ldquoone size fits allrdquo screen) to optimize business
results Because fraud patterns are dynamic and the
introduction of new products services or markets often
requires a unique set of acceptance rules it is imperative
that these systems also quickly adapt to the changing
environment Half of large merchants say their screening
system allows business managers to create and modify
screening rules without assistance from external experts or
internal information technology staff
Results of Automated Screening
The automated order screening process generates three
outcomes 1) order acceptance without further review 2)
orders flagged for further review and 3) automatic order
rejection 46 of merchants indicated they reject some
orders based on automated screening tests and 58 of
large merchants indicated doing so
10
C Y B E R S O U R C E 1 0 T H A N N U A L O N L I N E F R A U D R E P O R T
Orders which do not pass the automated order screening
stage typically enter a manual review queue During this
stage additional information is collected to determine if
orders should be accepted or rejected due to excessive
fraud risk
Manual review represents a critical area of profit leakage
It is expensive limits scalability and impacts customer
satisfaction For many merchants it represents half of
their fraud management budget Only 13 of merchants
say they have budget available to increase review
staff now or in the next twelve months This presents
significant challenges to profit growth since even at a
stable percent of orders sent to review the total number
of orders that must be reviewed increases in step with the
total increase of online sales
Manual Order Review RatesIn what should be a highly automated sales environment
most merchants are manually checking orders In fact
during the past six years overall 1 out of every 4 orders
transacted online have been manually reviewed (see chart
4) Over the same period merchants who conduct manual
review typically reviewed 1 out of 3 orders they received
Merchants of all sizes use manual review to manage
payment fraud Chart 5 shows smaller merchants review
a higher percentage of orders (perhaps because lower
order volumes permit such practice) but even larger
merchants review a significant percentage of online
ordersmdashand likely devote more resources to this task than
is operationally scalable
One consequence of using more fraud detection tools
during automated screening is a greater chance of one
or more flags being raised resulting in an order being
selected for manual review Adding additional tools to
detect fraud may result in downstream impacts and
costs if these tools are not carefully integrated into a
merchantrsquos review process and tuned to a merchantrsquos
specific situation
Merchants expecting increased online sales will need to
take at least one of the following actions 1) divert more
staff time to the order review process 2) increase staffing
levels 3) allow more time to process orders and ship good
ones or 4) improve accuracy of initial automated sorting
and make the subsequent review process more efficient
Review Tools amp PracticesGiven the reported limitations on hiring additional manual
review staff there is increased focus on investing in tools
and systems to increase the productivity and effectiveness
of review staff While the primary focus should be on
improving initial automated sorting accuracy to decrease
need for review attention to streamlining the review
process is also warranted
Stage 2 Manual Review
Automated
Screening1
Manual
Review2
Accept
Reject3
Fraud Claim
Management4ORDER
RETAINED
REVENUE
Tuning and Management
40
0
2004 2005 2006
Manual Review Trends
2007 2008
30
20
10
5
15
25
35
Over the past 5 years on average 1 out of 4 online orders were
manually reviewed Merchants performing manual review have
on average reviewed 1 out of every 3 orders received
35
26
Orders Reviewed by Merchants Practicing Review Orders Reviewed Overall (Net Review)
23
28
27
33
22
32
27
34
4
11
C Y B E R S O U R C E 1 0 T H A N N U A L O N L I N E F R A U D R E P O R T
11copy2009 CyberSource Corporation All rights reserved
Use of Case Management Systems
Currently 1 out of 3 merchants report having a case
management system that supports their manual review
process and staff Over half of merchants either
currently use a case management system or
plan to implement one in 2009 For large
online merchants 65 report currently using
or planning to implement a case management
system
Merchants using a case management system
are also more likely to be able to track fraud
rates on orders which have gone through
manual review 74 of merchants using case
management systems report tracking fraud
rates for manually reviewed orders vs only
42 being able to do so when not using a
case management system Surprisingly 44
of merchants performing manual order review
say they do not track the fraud rates of orders
which have been manually reviewed and 24
of large merchants say they do not have this
information Without knowing the fraud rate
on orders going through manual review and
who reviewed them it is difficult to determine
training needs or other actions to improve the
effectiveness of manual review
Tools UsedPlanned During Manual Review
While many of the tools or detector results used
during automated screening can also be used
during manual review several additional tools
and processes are employed by manual reviewers
Attempting to validate an order by contacting the
customer is standard practice for 7 out of 10
merchants and 82 of large merchants However
most organizations have policies regarding how
quickly they must clear orders through manual
review and how long they will wait for customers
to respond to requests for additional information
Most merchants try to clear orders through manual
review in one business day and say they will not
wait more than three business days for a customer
to respond to a request for more information (see
charts 7 and 8)
Another practice used only in manual review is to
contact the card issuer This action is taken by
almost half of merchants overall and 60 of large
merchants Telephone number validation reverse
lookup is the third most popular tool with 56 of
merchants using it during manual review vs 25
during automated screening
In 2008 two-thirds of merchants reported using
four or more fraud detection tools for manual review with
49 tools being the average Larger merchants reported
using 61 detection tools on average
35
15
5
25
30
10
20
40
45
50
55
0
Average of Orders Manually Reviewed(for merchants engaged in review)
200620072008
lt$500K
36
43
51
$500K ndash lt$5M
36
45
35
$5M ndash lt$25M
25
40
34
$25M+
15
14
15
o
f O
rder
s
Annual Online Revenues
5
Currently usePlan to implement in 2009Do not use or plan to implement
Use or Plan to Implement Case Management System
to Support Manual Order Review Process
18
4933
n=227
All Merchants
35
39
26
n=84
Merchants $25M+
Base Those conducting manual review
6
12
C Y B E R S O U R C E 1 0 T H A N N U A L O N L I N E F R A U D R E P O R T
35
15
5
25
50
30
10
20
40
45
0
Time Allowed for Customer Response
Source 2008 CyberSource Fraud Report
Half day
or less
10
Same
business
day
10
Next
business
day
14
2-3
business
days
37
4-5
business
days
11
6 or more
business
days
19
8
Fraud Detection Tool Usage During Manual Review
All Merchants Merchants $25M+ Online Revenue
69 11
56 15
49 10
45 12
23 14
9 7
currently using planning to begin use (in 2009)
Current n=265 Future Plans n=109 Current n=89 Future Plans n=43
VALIDATION SERVICES
Telephone number verificationreverse lookup
Credit history check
Paid for public records service
Contact customer to verify order
Contact card issuerAmex CVP
Postal address validation services
82 5
74 5
60 14
46 7
45 14
6 12
72 8
49 14
35 13
22 17
SINGLE MERCHANT PURCHASE HISTORY
Positive lists
Customer order history
Valid customer website behavior analysis
Negative lists (in-house lists)
83 5
69 12
37 14
34 30
40 20
PURCHASE DEVICE TRACING
IP geolocation information 55 28
11 28
MULTI-MERCHANT PURCHASE HISTORY
Shared negative lists ndash shared hotlists 16 35
9
35
15
5
25
30
10
20
40
45
50
0
Time to Clear Orders in Manual Review (2008)
Over two-thirds of merchants clear
orders through manual review
in one business day72
1 hour
or less
26
2-4
hours
10
Same
business
day
36
Next
business
day
18
2-3
business
days
8
4-5
business
days
1
6 or more
business
days
1
n=259
7
13
C Y B E R S O U R C E 1 0 T H A N N U A L O N L I N E F R A U D R E P O R T
13copy2009 CyberSource Corporation All rights reserved
The most popular tools currently used in the manual
review process are shown in chart 9 including the
percent of merchants planning to add each tool in 2009
Review Operations Efficiency
Reviewer Efficiency
The average number of orders a reviewer processed in a
day ranged from 22 for small merchants to 124 for large
(see chart 10) Large merchants who typically have case
management systems achieve a 5X higher throughput
per reviewer in the manual review stage possibly due to
greater use of review systems and detection tools during
manual review On average reviewers spent 7 minutes
reviewing each order in 2008
Time to Ramp New Staff
New to this yearrsquos surveymdashmerchants were asked how
long it takes for an order reviewer to attain acceptable
proficiency in his or her job While the learning curve
varies by type and size of online merchant the median
time reported was 4 weeks Larger merchants reported a
median of 6 weeks for a reviewer to achieve acceptable
proficiency Chart 11 shows the distribution of learning
times reported
Staff Tenure
Given the cost and time required to recruit and train
new staff merchants need to focus on staff retention
Fraud rates or order rejection rates can increase if highly
experienced review staff leave an organization and are
either not replaced or replaced by less experienced
reviewers 85 of review staff have been on the job
for one year or more Merchants report on average that
15 of their review staff were new in 2008 For large
merchants 24 of their staff were new in 2008 (see
chart 12) Efficient training and methods to ensure
consistent and accurate disposition of orders will be key
as merchants seek to optimize operating efficiency
Final Order DispositionAutomated screening and manual order review ultimately
result in order acceptance or rejection A relatively high
percentage of orders manually reviewed are ultimately
accepted (see next section)mdashhighlighting the need for
merchants to improve automated screening accuracy and
reduce the need for review A look at order reject and
acceptance rates follows in Stage 3 of the pipeline review
Overall $500K ndash lt$5Mlt$500K $5M ndash lt$25M $25M+
Average Orders Reviewed Per DayReviewer(by merchant size)
n=185
124
46
2322
68
10
Median of Weeks
4
52
Number of Weeks Required to Train New Reviewer
lt1
3
1
11
2
10
3
11
4
21
5-9
28
10-14
11
15+
5
n=159
11
Overall $500K ndash lt$5Mlt$500K $5M ndash lt$25M $25M+
of Review Staff New in 2008
n=206
24
1413
7
15
12
14
C Y B E R S O U R C E 1 0 T H A N N U A L O N L I N E F R A U D R E P O R T
Post-Review Order Acceptance RatesMerchants who manually review orders indicated they
ultimately accepted nearly frac34 of the orders they manually
reviewed (see chart 13) This was similar to the
proportion reported in 2007 50 of merchants report
they accept 90 or more of orders they manually review
These merchants are incurring significant expense
to find the 10 of the review queue they believe to be
too risky to accept Clearly most merchants require better
methods to determine which orders are to be outsorted for
manual review so only truly suspicious orders receive
human attention
Stage 3 Order Dispositioning (AcceptReject)
Automated
Screening1
Manual
Review2
Accept
Reject3
Fraud Claim
Management4ORDER
RETAINED
REVENUE
Tuning and Management
of Merchants Reporting This Level
of Post-Review Acceptance
1380 ndash 89
4490 ndash 99
6100
970 ndash 79
360 ndash 69
750 ndash 59
140 ndash 49
330 ndash 39
420 ndash 29
510 ndash 19
51 ndash 9
20
50 accept 90+
Post-Review Acceptance Trends
70
30
10
50
100
60
20
40
80
90
0
Most orders that enter manual review are accepted
2003
66
2004
71
2005
69
2006
66
2007
75
2008
73
of Orders Accepted in Review
13
15
C Y B E R S O U R C E 1 0 T H A N N U A L O N L I N E F R A U D R E P O R T
15copy2009 CyberSource Corporation All rights reserved
Overall Order Rejection RatesOrder reject rates can reflect true fraud
risk or signal ldquoprofit leaksrdquo in terms of
valid order rejection or unnecessarily
high rates of manual review In 2008 for
the first time in several years merchants
participating in the survey reported a
significant drop in their order rejection
rates from 42 in 2007 to 29 (see
chart 14)
Order rejection rates dropped in 2008 for
almost every size of merchant (see chart
15) except the very smallest and for
every industry segment (see chart 16)
It is likely that as online sales growth
slows and merchants seek to sustain
revenue levels merchants will look for
ways to accept more orders and reduce
orders rejected due to suspicion of fraud
In 2008 merchants were able to successfully reduce order
rejection rates while holding fraud rates stable It remains
to be seen if order rejection rates can be reduced further
in 2009 without an increase in fraud rates or manual
order review
Order rejection rates also vary by type of product and
merchant profile Chart 16 shows that segments which
have high cost of goods sold andor lower gross margins
tend to have higher order rejection rates Each fraud loss
in this arena has a large negative profit impact Consumer
electronics and jewelryapparel are two examples of online
segments that tend to have higher-than-average order
rejection rates
Yet even within similar groups of online merchants we
see that some merchants achieve low order rejection rates
while still keeping fraudulent order rates under control
Examining the large consumer electronics merchants in
the sample we find that half of these merchants report
35
15
05
25
50
30
10
20
40
45
0
Order Rejection Trends
2005
39
2006
41
2007
42
2008
29
14
Average Orders Rejected Due to Suspicion of Fraud
2007 n=2392008 n=326
Overall $500K ndash lt$5Mlt$500K $5M ndash lt$25M $25M+0
6
4
2
1
3
5
7
8
9
10
45
26
43
64
24
39
27
262
9
42
Order Rejection Rates by Selected Online Segment20072008
n=23
9
n=32
6
n=64
n=95
n=63
n=62
n=35
n=57
n=62
n=85
n=62
n=85
Overall Media amp
Entertainment
Digital Goods
ServicesApparel
Jewelry
Consumer
Electronics
49
34
32
56
42
56
32
42
29
42
Household amp
General Merchandise
22
31
15
16
16
C Y B E R S O U R C E 1 0 T H A N N U A L O N L I N E F R A U D R E P O R T
order rejection rates of 2 or less while maintaining
fraudulent order rates at or even below the average for
their segment
International Orders RiskierMerchants consistently report a much higher level of
order rejection on international orders due to suspicion
of payment fraud In 2008 merchants report their
rejection rate on these orders is over three and one half
times that of domestic orders as shown in chart 17
The actual fraud rate experienced on international orders
supports this cautious approach as merchants report the
fraud risk on international orders is also over three and
one half times that of domestic orders
Order Rejection Trends
of total USCanadian orders rejected of international orders rejected
Historically international order rejection rates
average 32x higher than USCanadian rates
2005 20072006 2008
6
4
2
1
3
5
7
8
9
12
11
10
13
14
42
11
11
29
13
41
12
39
0
15
17
17
C Y B E R S O U R C E 1 0 T H A N N U A L O N L I N E F R A U D R E P O R T
17copy2009 CyberSource Corporation All rights reserved
Fighting ChargebacksThis yearrsquos survey once again examined online merchantsrsquo
practices associated with reviewing and contesting
chargebacks (ldquore-presentmentrdquo) Over the past four years
the share of fraud-coded chargebacks merchants contest
has averaged 43 to 53 with the 2008 average at
50 Medium and large merchants report contesting 52
and 46 respectively of their fraud-coded chargebacks
in 2008 However when we look at the distribution of
merchantsrsquo answers to this question we find that over one
third of merchants are disputing 90 or more of their
fraud chagebacks while three out of ten merchants are
disputing less than 10 of their fraud chargebacks (see
chart 18)
Merchants report that they win on average 44 of the
chargebacks they dispute which is very similar to the 42
win rate reported in 2006 and 40 in 2007 Simply using
the average percent of chargebacks that are disputed (50)
times the average win rate of 44 results in a net recovery
rate of 22 (meaning 22 of all fraud-coded chargebacks
are recovered) However given the wide disparity in the
chargeback re-presentment rate when these are calculated
on a merchant-by-merchant basis and then averaged the
re-presentment win rate rises to 28 (see chart 19 on
next page) the same recovery rate that was found in 2007
Therefore disputing most fraud chargebacks and having
an efficient re-presentment process can help enhance
profitability and reduce fraud loss
Stage 4 Fraud Claim Management
Automated
Screening1
Manual
Review2
Accept
Reject3
Fraud Claim
Management4ORDER
RETAINED
REVENUE
Tuning and Management
Average Total Fraud-Coded
Chargebacks Re-presented of Merchants Reporting
this Re-presentment Rate
480 ndash 89
790 ndash 99
100
370 ndash 79
460 ndash 69
450 ndash 59
540 ndash 49
130 ndash 39
520 ndash 29
810 ndash 19
1 ndash 9
0
C
harg
ebac
ks R
e-pr
esen
ted
Overall $500K ndash lt$5Mlt$500K $5M ndash lt$25M $25M+
Annual Online Revenue
2006 n=1612007 n=1002008 n=120
50
53
47
36
38
48 52
46
5863
56
56
46
45
53
15
15
28
18
18
C Y B E R S O U R C E 1 0 T H A N N U A L O N L I N E F R A U D R E P O R T
Chargeback Management ToolsOf course disputing chargebacks is not an easy or cost-
free process Merchants must manage and organize all
order delivery and payment information to successfully
dispute fraudulent orders with financial institutions
Merchants are beginning to adopt automated systems
for handling this aspect of the pipeline One out of five
merchants reported using chargeback management tools
in 2008 and 37 of large merchants reported using
these tools In our 2006 survey we asked merchants to
provide estimates of how many hours it takes on average
to handle a fraud chargeback The average time spent
overall was 18 hours with a median time of 10 hours
to handle a fraud chargeback (total time consumed
for research documentation submission) The largest
merchants reported a median time of 30 minutes per fraud
chargeback Clearly fraud chargeback management is a
significant expense for merchants
ChargebacksmdashOnly Half the Problem How a fraudulent order is handled can have a significant
impact on bottom line profits Fraudulent orders are
presented to the merchant via two main routes as a
chargeback or as a direct request from a consumer
for credit (they claim fraudulent use of their account)
Although chargebacks are the most often cited metric
merchants report that chargebacks actually account for less
than half of all fraud claims This is true for all sizes of
merchants (see chart 20)
In 2007 large ($25M+ online sales) merchants reported
that 57 of their fraud was presented in the form of a
fraud-coded chargeback but in 2008 this dropped back
to 48 Considering the financial impact of both fraud
claim routes (chargebacks and credit issuancereversal)
some merchants encourage direct consumer contact
to address fraud claims and thus avoid the additional
chargeback fees levied by the merchant bankprocessor If
a consumer contacts the merchant first then the decision
is in the merchantrsquos control to either handle the dispute
directly with the consumer or to advise them to initiate a
fraud chargeback process In any event if merchants are
evaluating fraud losses solely on the basis of chargebacks
the actual rate of fraud loss the business is experiencing
may be as much as two times higher due to direct credit
issuancecharge reversal
Overall $500K ndash lt$5Mlt$500K $5M ndash lt$25M $25M+
Fraud Chargeback Re-presentment
Win RateNet Recovery Rate
Annual Online Revenues
Challenged Net Recovery
44AVERAGEWINRATE
46AVERAGEWINRATE
43AVERAGEWINRATE
54AVERAGEWINRATE
32AVERAGEWINRATE
50
28
36
23
52
38
63
35
46
19
10
0
20
30
40
50
60
70
80
90
100
(Net Recovery Rate is expressed as a of all fraud-coded chargebacks)
19
Overall $500K ndash lt$5Mlt$500K $5M ndash lt$25M $25M+
of Fraud Claims
Chargebacks vs Credit Issued by Merchant
Credits IssuedChargebacks
58
42
76
24
57
43
52
48
52
48
n=25
n=14
7
n=27
n=30
n=55
Annual Online Revenue
n=147
10
0
20
30
40
50
60
70
80
90
100
20
19
C Y B E R S O U R C E 1 0 T H A N N U A L O N L I N E F R A U D R E P O R T
19copy2009 CyberSource Corporation All rights reserved
Fraud Rate MetricsWhen monitoring the level and trend of online
fraud loss we focus on three key metrics
1) Overall revenue lost as a percent of total
online sales 2) percent of accepted orders
which turn out to be fraudulent (domestic and
international) and 3) the average value of a
fraudulent order relative to a valid order Fraud
rates vary widely by merchant and depend on a
variety of factors such as online sales volume
type of products or services sold online and
how such productsservices are delivered and
paid for It is important that merchants track
key fraud metrics over time and evaluate their
performance relative to their peer group (both
size and industry) Note this report provides
benchmarks on total fraud rates (chargebacks +
credits issued directly to consumers by merchants)
As such these metrics tend to be higher
than those reported by banks and credit card
associations which generally base reported rates
on chargeback activity only
Depending on which products or services are being sold
online fraud loss risk tolerances and order rejection
rates can vary significantly Merchants selling high
cost goods with relatively low gross margins like most
consumer electronics products tend to err on the side
of rejecting more orders to avoid expensive fraud losses
Merchants who are less subject to fraud attacks can
achieve similar fraud loss rates while rejecting
relatively few orders Over the past few years
as fraud rates have remained relatively stable
we have compiled data on fraud practices and
benchmarks by industry
Direct Revenue Loss Rates
Very large merchants typically use more tools
and have more experience and resources to
manage online fraud so their fraud rates tend
to be lower than the overall rate Revenue loss
measurement includes not only the value of
orders on which fraudulent chargebacks are
received but also the cost of any credits issued
to avoid such chargebacks Figures include both
chargebacks and credits issued directly by the
merchant in response to fraud claims
Fraudulent Order Rate for Accepted Orders
Another key metric is the number of accepted orders that
later turn out to be fraudulent Expressed as a percent of total
orders this metric is typically lower than the revenue loss
percent since the average value of fraudulent orders tends
to be greater than the average value of valid orders which
causes the fraud rate as measured by revenues to be higher
Overall 38 of merchants reported experiencing a fraudulent
order rate of 1 or more in 2008 which was the same
percent reported in 2007
20072008
Average Online Revenue Lost to Payment Fraud
(chargebacks amp fraud-related credits)
Overall $500K ndash lt$5Mlt$500K $5M ndash lt$25M $25M+
Annual Online Revenue
0
12
08
04
02
06
10
14
16
18
14 1
5 16
15
121
3
13
15
14
14
20072008
Average Accepted Orders Resulting in Fraud Losses
Overall $500K ndash lt$5Mlt$500K $5M ndash lt$25M $25M+
Annual Online Revenue
0
12
08
04
02
06
10
14
16
18
16
11
13
12
11
13
11
13
11
13
A fraud chargeback was received on the orders OR a credit was issued directly to a customerwho claims not to have placed an order
21
22
20
C Y B E R S O U R C E 1 0 T H A N N U A L O N L I N E F R A U D R E P O R T
International Orders Carry Higher Risk
Fifty-two percent of merchants surveyed accepted orders
from outside the US amp Canada in 2008 International
sales accounted for an average of 17 of total orders
for these merchants That same group reported that the
actual direct fraud rate on international orders averaged
40 or more than 36 times the overall fraud rate for
domestic online orders Though international markets
represent an attractive opportunity online merchants must
make sure that their fraud detection and management
systems are robust enough to handle the additional risk
involved Merchants who sell online outside of the US
amp Canada report that they reject international orders due
to suspicion of fraud at a rate that is over three and one
half times the US and Canadian average rate of 29
mdash rejecting approximately 1 out of every 9 international
orders received
Average Value of Fraudulent Order Higher than a Valid Order
Historically fraudulent orders tend to have higher values
on average than valid orders In 2008 the median value
of a fraudulent order was $200 compared to $130 median
value reported for valid orders This relationship of higher
fraudulent order values vs valid order value was found for
all merchant size categories as chart 24 shows Since
fraudulent orders tend to be somewhat higher in value than
valid orders merchants will tend to outsort more high value
orders for manual review and verification Large online
merchants reported that the median value of an order
flagged for manual review was $245
Valid vs Fraudulent Order Value
Valid orderFraudulent order
Median used to minimize impact of outliers
Overall $500K ndash lt$5Mlt$500K $5M ndash lt$25M $25M+
Annual Online Revenue
0
$200
$50
$100
$150
$250
$300
$350
$120
$150
$200
$150
$250
$175
$150
$100
$200
$130
24
40
10
05
20
15
25
35
45
30
00
International Fraud Rateover 3x USCanadian rate
11
40
Location of Order Origination
Within USCanadan=326
Outside USCanadan=164
Frau
d R
ate
o
f O
rder
s
23
21
C Y B E R S O U R C E 1 0 T H A N N U A L O N L I N E F R A U D R E P O R T
21copy2009 CyberSource Corporation All rights reserved
Tuning amp Management
Maintaining and Tuning Screening Rules28 of merchants say they have an automated order
screening system in place that allows business managers
to modify decision rules without assistance from internal
IT staff or external parties (up from 16 found in 2006)
The ability to adjust automated order screening systems
quickly helps manage the order review flow tailor rules
to new products and adapt to new fraud trends as they
are encountered Without this ability merchants cannot
easily minimize reject rates review costs or fraud rates
Additionally giving business managers the capability of
adjusting business rules on-the-fly reduces the costs and
burden of IT support
Global Fraud Portals Some online merchants are integrating fraud tools
and strategies via fraud management portals These
portals employ a combination of flexible rules systems
that interact with a portfolio of ldquotruth servicesrdquo around
the globe allowing business managers to set payment
type product type and market-specific screens Case
management systems are being integrated with these
portals with accompanying enhancements to streamline
workflow Global fraud portals typically include hierarchical
management as companies strive to centralize fraud
management across multiple lines of business and
geographies
Merchant Budgets for Fraud Management How much are online merchants spending to mitigate
fraud risk In both 2008 and in 2007 survey results
show that 34 of merchants spend 05 or more of
their online revenues to manage online payment fraud
while 66 spend less than 05 In 2008 across
all merchants the median ratio of fraud management
expense to sales was 022 down from 028 in 2007
although some merchants in high risk categories are
spending significantly more These spending estimates
focus on the cost of managing fraud risk (internal and
external systems and services management development
and review staffs) Direct fraud loss (chargebacks lost
goods and associated shipping costs) as well as the
opportunity cost associated with valid order rejection are
not included here (see chart 25)
Automated
Screening1
Manual
Review2
Accept
Reject3
Fraud Claim
Management4ORDER
RETAINED
REVENUE
Tuning and Management
02ndash lt050ndash lt02 05ndash lt10 10ndash lt40 40+
How Much Merchants Spend
on Fraud Management
(percent of merchants operating at defined expense level)
of Annual Online Revenues Spent to Manage Fraud(staff etc excluding fraud loss)
2007 n=972008 n=108
41 44
6
14
24
22
12 16
16
4
Median2008 = 022
2007 = 028
0
60
40
20
25
title (title)
22
C Y B E R S O U R C E 1 0 T H A N N U A L O N L I N E F R A U D R E P O R T
Budget Allocation For the past three years merchants have consistently
spent just over half their fraud management budgets on
review staff (see chart 26) The remainder is allocated
as follows 25 for third party tools or services and 24
on internally developed tools and systems
Clearly review staff costs are the dominant factor and
only 13 of merchants cite plans to increase review
staffing in 2009 Reducing the need for manual review
and increasing the efficiency and effectiveness of
reviewers is key to growing online business profits and
managing the total cost of online payment fraud One
place to start is by improving the automated detection of
risky orders so as to reduce manual order review volumes
Clearly the continued reliance on manual review we have
seen in the data over the last few years is not an optimal
long term strategy for managing online fraud As budgets
come under increasing pressure merchants will need
to redouble their efforts to automate more of the fraud
management process while keeping valid order conversion
high and fraud loss low
Base Those with 1 or more full-time manual review staff
Average Spending Allocation
for Fraud Management 2008
n=400
3rd Party
Tools
23
24
Internal
Tools amp
System
3rd Party
Tools
25
Order
Review
Staff
51
Planned Staffing Levels
Increase
13
21
Same
81
71
2009
2008
Decrease
6
8
n=238 248
26
23
C Y B E R S O U R C E 1 0 T H A N N U A L O N L I N E F R A U D R E P O R T
23copy2009 CyberSource Corporation All rights reserved
Resources amp Solutions
3 Managed Services
2 Design amp Installation
1 Systems amp Services
PAYMENT SECURITY
Order
Screening
Collection amp
Reconciliation
Global Payment
Acceptance
Processing
Management
L A S E R
BankBankTrans f e rTrans f e r
Direct
Debit
ORDER
bull Onlinebull Call Centerbull IVRbull Kioskbull POSbull ERP
With Performance
Guarantees
To find information on CyberSourcersquos industry-leading risk
management solutions self-paced webinars on decision
management and other whitepapers on electronic payment
management visit our Resource Center at
wwwcybersourcecom For sales assistance phone
1-888-330-2300 or e-mail salescybersourcecom
CyberSource Payment Management Solutions CyberSource offers a comprehensive portfolio of modular
services and tools to help your company manage your entire
payment pipeline to optimize sales results All are available
via one connection to our web-based services
Accept All Popular Payment Types in 190+
Countries
Accept payments worldwide using a merchant account from
your preferred provider or CyberSource worldwide credit
and debit cards regional cards direct debit bank
transfers electronic checks and alternative payment
types such as Bill Me Later and PayPal CyberSource
also provides professional services to help you
integrate payment with front-end and back-office
systems
Risk ManagementOrder Screening
Global Fraud Management Portal with CyberSource Intelligent
Review Technology A hosted rules and case management
system that provides on-demand access to over 150
validation tests and services across all four dimensions of
detection Detectors include multi-merchant transaction
history checks worldwide delivery address and phone
verification device fingerprinting IP geolocation purchase
velocity identity morphing and custom data from your
systems Case management system provides consolidated
data review workflow management and built-in callouts to
validation services to streamline review
Managed Services CyberSource provides client services to
help you analyze design and manage your order screening
and fraud detection processesmdasheverything from screening
strategies and risk threshold optimization analysis
to ongoing monitoring order review and chargeback
managementrecovery Our managed services include
business performance guarantees
Payer Authentication Verified by Visa MasterCard
SecureCode
Processing Management
CyberSource processes your payments in our high
availability datacenters located in the US Europe and
Japan All datacenters are certified PCI-compliant and
include sophisticated processing management logic to help
prevent payment failures and rate downgrades
Collection amp Reconciliation
A full array of online and exportable payment reporting
capability is available to streamline reconciliation activity
Further systems can be installed to automate up to 90
of the tasks associated with payment reconciliation and
chargeback re-presentment
Payment Security
Remove Payment Data From Your Network CyberSource
provides secure storage and hosted payment acceptance
services that let you process without storing or even
transmitting payment data A great way to streamline PCI
compliance and mitigate security risk
Payment System Centralization Our team of experts will help
you consolidate multiple payment systems into a single easy
to manage system Optionally CyberSource will also host
support and manage these systems in our secure datacenters
PCI Planning amp Remediation CyberSource provides PCI
compliance consulting and remediation services to help
remedy PCI issues
Professional Services
CyberSource maintains a team of experienced payment
consultants to assist with payment systems planning
system and process design and implementation and
integration Our client services team is additionally
available to help you monitor tune or fully outsource
portions of your payment operations
C Y B E R S O U R C E 1 0 T H A N N U A L O N L I N E F R A U D R E P O R T
North America
CyberSource Corporation
1295 Charleston Road
Mountain View CA 94043
T 8883302300
T 6509656000
F 6506259145
Email infocybersourcecom
Europe
CyberSource Ltd
The Waterfront
300 Thames Valley Park Drive
Thames Valley Park
Reading RG6 1PT
United Kingdom
T +44 (0) 1189294840
F +44 (0) 8704601931
Email ukcybersourcecom
UK Fraud Report wwwcybersourcecoukukfraudreport
Japan
CyberSource KK (Japan)
3-11-11 Shibuya Shibuya-ku
Tokyo 150-0002 Japan
T +81357747733
F +81357747732
Email mailcybersourcecojp
CyberSource Corporation is a leading provider of
electronic payment risk and security management
solutions CyberSource provides payment management
solutions for electronic payments processed via Web
call center kiosk mobile and POS environments
Services include hosted systems to help you manage
electronic payments as well as professional services
to help design integrate and fully manage parts or all
of your payment operations Over 245000 businesses
worldwide use CyberSource solutions including half
the companies comprising the Dow Jones Industrial
Average and leading Internet brands The company
is headquartered in Mountain View California and
has sales and service offices in Japan the United
Kingdom and other locations in the United States
For More Information
bull Call 18883302300
bull Email infocybersourcecom
bull Visit wwwcybersourcecom
Get Tailored Views of Risk Management
Pipelinetrade MetricsTo get a view crafted for your companyrsquos size and industry
please contact CyberSource at 18883302300 or online at
wwwcybersourcecomcontact_us
For additional information whitepapers and webinars
or sales assistance
bull Contact CyberSource 18883302300 or
wwwcybersourcecomcontact_us
bull Risk Management Solutions visit wwwcybersourcecom
products_and_servicesrisk_management
bull Global Payment amp Security Solutions
visit wwwcybersourcecomproducts_and_services
global_payment_services
About CyberSource
C Y B E R S O U R C E 1 0 T H A N N U A L O N L I N E F R A U D R E P O R T

5
C Y B E R S O U R C E 1 0 T H A N N U A L O N L I N E F R A U D R E P O R T
5copy2009 CyberSource Corporation All rights reserved
rates due to suspicion of fraud The survey results
indicate most merchants have successfully increased
their order acceptance rate with little or no increase in
fraud rates It remains to be seen if online merchants
can continue to control fraud rates while increasing order
acceptance in 2009
Chargebacks Understate Fraud Loss by as Much as 50This yearrsquos survey again probed the percent of fraud
losses accounted for by chargebacks Overall merchants
continue to report that chargebacks accounted for less
than half of fraud losses The remainder occurred when
merchants issued credit to reverse a charge in response to
a consumerrsquos claim of fraudulent account use
International Order Risk 3frac12 Times Higher Than Domestic OrdersOn average merchants now say the rate of fraud
associated with international orders is over three-and-
one-half times as high as domestic orders In 2008 fraud
rates on international orders continued to climb reaching
an average of 40 up from 24 in 2005 Merchants
also reject international orders at a rate three-and-one-half
times higher than domestic orders
Manual Review Rates Over the past six years the overall percent of online
orders that enter manual fraud review has fluctuated
between 22 and 27 about 1 out of 4 on average In
some segments fraud risk is low enough for merchants
to rely entirely on automated review which lowers the
aggregate review ratio But most merchants do manually
review orders for fraud risk and these merchants on
average review 1 out of every 3 orders Over the past
five years merchants who engage in manual order review
have maintained this average review rate Large online
merchants who typically employ more automation
continue to have much lower manual review rates Over
the past three years large merchants ($25M+ in online
sales) performing manual order review have on average
reviewed approximately 15 of orders Looking back over
the past several years of survey data we conclude that
most merchants have made little progress in reducing
their reliance on manual review and are likely reviewing
far more orders today than they were just a few years ago
Efficiency Gains RequiredAs eCommerce sales continue to grow and budgets and
resources remain relatively fixed merchants face the
challenge of screening more online orders while keeping
order rejection and fraud rates as low as possible to
maximize sales and profits Continued reliance on manual
review presents a serious challenge to scalability Can
merchants grow their review staffing sufficiently to keep
pace with fraud Only 13 of online merchants expect to
increase manual review staff in 2009 This is the lowest
level of planned staff increases we have seen in the
survey At the same time merchants reported increased
interest in implementing more automated fraud detection
tools in some cases two or three times higher than last
yearrsquos reporting
6
C Y B E R S O U R C E 1 0 T H A N N U A L O N L I N E F R A U D R E P O R T
Total Pipeline ViewBusinesses that focus solely on managing chargebacks
may not be seeing the complete financial picture Online
payment fraud impacts profits from online sales in
multiple ways Besides direct revenue losses the cost of
stolen goodsservices and associated deliveryfulfillment
costs there are the additional costs of rejecting valid
orders staffing manual review administration of fraud
claims as well as challenges associated with business
scalability Merchants can gain efficiency by taking a total
pipeline view of operations and costs While the fraud rate
is one metric to monitor (and contain within industry
and association limits) an end-to-end view is required to
arrive at the best possible financial outcome
In 2008 these ldquoprofit leaksrdquo in the Risk Management
Pipelinetrade impact as much as 40+ of orders for
mid-sized merchants and as much as 19+ of orders
for larger merchantsmdashrestricting profits operating
efficiency and scalability This report details key metrics
and practices at each point in the pipeline to provide you
with benchmarks and hopefully insight Custom views
of these benchmarks and practices are available through
CyberSourcemdashsee end of report for contact information
Automated
Screening1
Manual
Review2
Accept
Reject3
Fraud Claim
Management4
Risk Management Pipeline
ORDERRETAINED
REVENUE
PROFIT LEAKSStaffing ampScalability
LostSales
Fraud Loss ampAdministration
29 Avg Reject Rate
for USCanadian orders
(all merchants)
109 Avg Reject Rate
for Non-USCanadian
orders (merchants who
accept these orders)
Merchants review 32 of
orders on average
51 of fraud management
budget is spent on review
staff costs
81 of these merchants
have no plans to change
manual order review
staffing during 2009
14 Average Fraud Loss
42 from chargebacks
58 from issued credits
7
C Y B E R S O U R C E 1 0 T H A N N U A L O N L I N E F R A U D R E P O R T
7copy2009 CyberSource Corporation All rights reserved
Fraud Detection Tools Used During Automated ScreeningWe define detection tools as those used to identify the
probability of risk associated with a transaction or to validate
the identity of the purchaser Results of tests carried out
by detection tools are then interpreted by humans or rules
systems to determine if a transaction should be accepted
rejected or reviewed A wide variety of tools are available to
help merchants evaluate incoming orders for potential fraud
Merchants handling large online order volumes typically
employ an initial automated order evaluation to determine
if an incoming order might represent a fraud risk Some
merchants will allow this initial automated screen to
cancel orders without further human intervention 46 of
all merchants cancelled some orders as a result of their
automated screening process and 58 of large merchants
indicated they cancelled some orders at this stage (see
chart 2)
In 2008 two-thirds of merchants reported using three or
more fraud detection tools for automated screening with
47 tools being the average Larger merchants dealing
with higher order volumes reported using 63 detection
tools on average
The most popular tools used to assess online fraud risk are
shown in chart 3 which shows the current and planned
adoption of different tools Note that the tool usage profile
for merchants over $25M in online sales is different than
the overall average These larger merchants generally use
tools across all four dimensions of detection and more often
use their customer history and proprietary data during the
automated order screening process They have a higher use of
company-specific risk scoring models negative and positive
lists and sophisticated order velocity monitoring tools
Overall 96 of merchants use one or more validation tools
These tools are often provided by the card associations to
help authenticate cards and card holders The tool most
often mentioned by merchants is the Address Verification
Service (AVS) which compares numeric address
data with information on file from the cardholderrsquos
card issuing bank AVS is generally available for US
cardholders and for limited numbers of cardholders
in Canada and the UK AVS is subject to a significant
rate of ldquofalse positivesrdquo which may lead to rejecting
valid orders as well as missing fraudulent orders1 If
the cardholder has a new address or a valid alternate
address (such as seasonal vacation home) this
information may not be reflected in the records of
the cardholderrsquos issuing bank so the address would
be flagged as invalid Merchants typically do not rely
solely on AVS to accept or reject an order
Card Verification Number (CVN also known as
CVV2 for Visa CVC2 for MasterCard CID for
American Express and Discover) is the second most
Stage 1 Automated Screening
46
Yes Yes35
11
54
No
11
47 58
No
42
Base Those using automated servicestechnologies
Are Inbound Orders Rejected
Based On Automated Screening
n=315 n=96
No generally all suspicious orders are out-sorted for manual reviewYes if automated tests indicate too much risk OR customer is on our negative listYes but generally ONLY if customer is on our negative list
All Merchants Merchants $25M+ Online Revenue
2
Automated
Screening1
Manual
Review2
Accept
Reject3
Fraud Claim
Management4ORDER
RETAINED
REVENUE
Tuning and Management
1CyberSource analyzed 94 million credit card transactions where AVS
was used and the final status of the transaction was known If a merchant
were to reject orders based solely on an AVS ldquono matchrdquo they would reject
57 of their orders but fail to detect 83 of the fraudulent orders This
represents an 181 false positive ratio
8
C Y B E R S O U R C E 1 0 T H A N N U A L O N L I N E F R A U D R E P O R T
commonly used detection tool The purpose of CVN in a
card-not-present transaction is to attempt to verify that the
person placing the order has the actual card in his or her
possession Requesting the card verification number during
an online purchase can add a measure of security to the
transaction However CVN numbers can be obtained by
fraudsters just as credit card numbers are obtained CVN
usage by online merchants has significantly increased in
the last five years rising from 44 in 2003 to 74 today
Large merchants were asked to identify the three most
effective tools they use To eliminate the bias that the more
commonly used tools have the potential to receive more
mentions we normalize the data by looking at the percent
of merchants using a particular tool who cite that tool as
one of their top three choices
Company specific
fraud screens
received the
highest rating as
being an effective
tool by merchants
who use this tool
Half of the 42
of large merchants
who use custom
fraud models
rated them as
one of their three
most effective
tools These fraud
screens are risk
scoring models
which are tuned
using an individual
merchantrsquos
historical data on
factors associated
with online orders
Since fraudsters
learn over time and
vary their strategies
we typically find
most risk scoring
models need
regular tuning
with new analysis
and data in order
to maximize their
effectiveness
Out-of-wallet or
in-wallet challenge systems while used by only 7 of large
merchants today was rated by 43 of these merchants
as being one of their three most effective tools The use
of challenge systems tends to be limited to merchants
who have frequent repeat purchases by customers or bill
customers on a regular schedule
Device Fingerprinting (also used by only 7 of large
merchants today) was rated by 43 of these merchants
as being one of their three most effective tools These
favorable opinions may well contribute to the very high
intention by other large online merchants to add this tool in
the next twelve months
Automated Fraud Detection Tool Current Usage and Plans
All Merchants Merchants $25M+ Online Revenue
78 11
74 14
35 9
27 18
25 12
11 7
5 6
5 6
CurrentPlanning to implement (next 12 months)
Current n=359 Future Plans n=194 Current n=101 Future Plans n=70
VALIDATION SERVICES
CVN (Card Verification Number)
Paid for public records service
Out-of-wallet or in-wallet challengeresponse
Telephone number verificationreverse lookup
Credit history check
Address Verification Service
Postal address validation services
Verified by VisaMasterCard SecureCode
87 6
80 16
39 9
19 11
31 10
21 4
3 1
7 6
47 10
38 12
28 15
27 11
18 10
20 9
SINGLE MERCHANT PURCHASE HISTORY
Fraud scoring model ndash company specific
Customer order history
Order velocity monitoring
Valid customer behavior analysis
Positive lists
Negative lists (in-house lists)
58 13
67 10
54 17
42 20
30 14
22 13
6 25
35 19
PURCHASE DEVICE TRACING
Device Fingerprinting
IP geolocation information 48 27
7 47
14 14
9 2
MULTI-MERCHANT PURCHASE HISTORY
Multi-merchant fraud models
Shared negative lists ndash shared hotlists 18 24
9 9
3
9
C Y B E R S O U R C E 1 0 T H A N N U A L O N L I N E F R A U D R E P O R T
9copy2009 CyberSource Corporation All rights reserved
Planned Automated Screening Tool Usage 2009
Device Fingerprinting Highest on ldquoPlan to Buyrdquo Lists
Merchants showed an increased intent to implement every
one of the 14 detection tools we looked at in both 2007 and
2008 Some tools showed dramatic increases in the percent
of merchants who say they intend to implement them in
2009 Four tools had 15 or more of merchants planning
to adopt them in 2009 and for three of these four tools the
plans to implement them have more than doubled over last
year These tools are Device Fingerprinting IP Geolocation
and Order Velocity Monitoring
Device Fingerprinting examines and records details about
the configuration of the device from which the order is
being placed This can aid in flagging fraud attacks where
a variety of fraudulent orders are launched from a common
device or set of devices Nearly 50 of large online
merchants indicated they were planning to add Device
Fingerprinting in the next twelve months
IP geolocation tools also showed a dramatic increase
in merchant interest This tool attempts to identify the
geographic location of the device from which an online order
was placed It provides an additional piece of information
to compare against other order information and order
acceptance rules to help assess the fraud risk of an order
In some cases only an internet service providerrsquos address is
returned so the ultimate geographic location of the device
remains unknown Fraudsters may also employ anonymizers
proxy servers to hide their true IP address and location
As in several years past card association payer
authentication services (eg Verified by Visa MasterCard
SecureCode) figure prominently in many merchantsrsquo future
plans 2008 survey results show that one out of four
merchants currently use one or more of the available payer
authentication services 18 of respondents say they are
interested in deploying these systems in the next twelve
months as a new tool to manage fraud However despite
significant interest in implementing payer authentication
systems over the past few years we have seen relatively
slow actual adoption of payer authentication since we
started tracking this tool in 2003
Implementing payer authentication should reduce exposure
to card-not-present fraud loss either by authenticating
the buyerrsquos identity or by shifting fraud liability back
to the card issuing bank (interchange incentives also
apply) Further certain card types in some countries are
beginning to require that payer authentication solutions
be used as a condition of accepting the associated cards
(eg Maestro Cards in the United Kingdom) But if
merchants have a sufficiently high direct fraud loss rate
the card association may not permit the merchant to shift
liability even if the merchant has implemented a payer
authentication system Over the next few years these
systems may help reduce the incidence of online credit
card fraud if a critical mass of consumers register their
cards and accept the new checkout procedures
Successful adoption of payer authentication will require
merchants to put procedures in place to handle customers
who have not adopted verification services or who
use cards or payment types which are not supported
International expansion and the growing popularity of
online payment types such as electronic checks PayPaltrade
Bill Me Laterreg etc drive the need for alternative fraud
management techniques
Automated DecisionRules Systems
Automated Order Screening
Automated order decisioning screening systems are now
used by 56 of merchants (up from 25 in 2005) Eight
out of ten larger online merchants use such systems These
tools help companies automate order screening by applying
a merchantrsquos business rules in the real-time evaluation of
incoming orders
Decision and rules systems automate the evaluation of test
results generated by fraud detection tools and determine
whether the transaction should be accepted rejected or
suspended for review As the number of tools used grow
it is becoming increasingly important for merchants to
employ automated systems to interpret and weigh the
multiple results for each product or transaction profile
(versus a ldquoone size fits allrdquo screen) to optimize business
results Because fraud patterns are dynamic and the
introduction of new products services or markets often
requires a unique set of acceptance rules it is imperative
that these systems also quickly adapt to the changing
environment Half of large merchants say their screening
system allows business managers to create and modify
screening rules without assistance from external experts or
internal information technology staff
Results of Automated Screening
The automated order screening process generates three
outcomes 1) order acceptance without further review 2)
orders flagged for further review and 3) automatic order
rejection 46 of merchants indicated they reject some
orders based on automated screening tests and 58 of
large merchants indicated doing so
10
C Y B E R S O U R C E 1 0 T H A N N U A L O N L I N E F R A U D R E P O R T
Orders which do not pass the automated order screening
stage typically enter a manual review queue During this
stage additional information is collected to determine if
orders should be accepted or rejected due to excessive
fraud risk
Manual review represents a critical area of profit leakage
It is expensive limits scalability and impacts customer
satisfaction For many merchants it represents half of
their fraud management budget Only 13 of merchants
say they have budget available to increase review
staff now or in the next twelve months This presents
significant challenges to profit growth since even at a
stable percent of orders sent to review the total number
of orders that must be reviewed increases in step with the
total increase of online sales
Manual Order Review RatesIn what should be a highly automated sales environment
most merchants are manually checking orders In fact
during the past six years overall 1 out of every 4 orders
transacted online have been manually reviewed (see chart
4) Over the same period merchants who conduct manual
review typically reviewed 1 out of 3 orders they received
Merchants of all sizes use manual review to manage
payment fraud Chart 5 shows smaller merchants review
a higher percentage of orders (perhaps because lower
order volumes permit such practice) but even larger
merchants review a significant percentage of online
ordersmdashand likely devote more resources to this task than
is operationally scalable
One consequence of using more fraud detection tools
during automated screening is a greater chance of one
or more flags being raised resulting in an order being
selected for manual review Adding additional tools to
detect fraud may result in downstream impacts and
costs if these tools are not carefully integrated into a
merchantrsquos review process and tuned to a merchantrsquos
specific situation
Merchants expecting increased online sales will need to
take at least one of the following actions 1) divert more
staff time to the order review process 2) increase staffing
levels 3) allow more time to process orders and ship good
ones or 4) improve accuracy of initial automated sorting
and make the subsequent review process more efficient
Review Tools amp PracticesGiven the reported limitations on hiring additional manual
review staff there is increased focus on investing in tools
and systems to increase the productivity and effectiveness
of review staff While the primary focus should be on
improving initial automated sorting accuracy to decrease
need for review attention to streamlining the review
process is also warranted
Stage 2 Manual Review
Automated
Screening1
Manual
Review2
Accept
Reject3
Fraud Claim
Management4ORDER
RETAINED
REVENUE
Tuning and Management
40
0
2004 2005 2006
Manual Review Trends
2007 2008
30
20
10
5
15
25
35
Over the past 5 years on average 1 out of 4 online orders were
manually reviewed Merchants performing manual review have
on average reviewed 1 out of every 3 orders received
35
26
Orders Reviewed by Merchants Practicing Review Orders Reviewed Overall (Net Review)
23
28
27
33
22
32
27
34
4
11
C Y B E R S O U R C E 1 0 T H A N N U A L O N L I N E F R A U D R E P O R T
11copy2009 CyberSource Corporation All rights reserved
Use of Case Management Systems
Currently 1 out of 3 merchants report having a case
management system that supports their manual review
process and staff Over half of merchants either
currently use a case management system or
plan to implement one in 2009 For large
online merchants 65 report currently using
or planning to implement a case management
system
Merchants using a case management system
are also more likely to be able to track fraud
rates on orders which have gone through
manual review 74 of merchants using case
management systems report tracking fraud
rates for manually reviewed orders vs only
42 being able to do so when not using a
case management system Surprisingly 44
of merchants performing manual order review
say they do not track the fraud rates of orders
which have been manually reviewed and 24
of large merchants say they do not have this
information Without knowing the fraud rate
on orders going through manual review and
who reviewed them it is difficult to determine
training needs or other actions to improve the
effectiveness of manual review
Tools UsedPlanned During Manual Review
While many of the tools or detector results used
during automated screening can also be used
during manual review several additional tools
and processes are employed by manual reviewers
Attempting to validate an order by contacting the
customer is standard practice for 7 out of 10
merchants and 82 of large merchants However
most organizations have policies regarding how
quickly they must clear orders through manual
review and how long they will wait for customers
to respond to requests for additional information
Most merchants try to clear orders through manual
review in one business day and say they will not
wait more than three business days for a customer
to respond to a request for more information (see
charts 7 and 8)
Another practice used only in manual review is to
contact the card issuer This action is taken by
almost half of merchants overall and 60 of large
merchants Telephone number validation reverse
lookup is the third most popular tool with 56 of
merchants using it during manual review vs 25
during automated screening
In 2008 two-thirds of merchants reported using
four or more fraud detection tools for manual review with
49 tools being the average Larger merchants reported
using 61 detection tools on average
35
15
5
25
30
10
20
40
45
50
55
0
Average of Orders Manually Reviewed(for merchants engaged in review)
200620072008
lt$500K
36
43
51
$500K ndash lt$5M
36
45
35
$5M ndash lt$25M
25
40
34
$25M+
15
14
15
o
f O
rder
s
Annual Online Revenues
5
Currently usePlan to implement in 2009Do not use or plan to implement
Use or Plan to Implement Case Management System
to Support Manual Order Review Process
18
4933
n=227
All Merchants
35
39
26
n=84
Merchants $25M+
Base Those conducting manual review
6
12
C Y B E R S O U R C E 1 0 T H A N N U A L O N L I N E F R A U D R E P O R T
35
15
5
25
50
30
10
20
40
45
0
Time Allowed for Customer Response
Source 2008 CyberSource Fraud Report
Half day
or less
10
Same
business
day
10
Next
business
day
14
2-3
business
days
37
4-5
business
days
11
6 or more
business
days
19
8
Fraud Detection Tool Usage During Manual Review
All Merchants Merchants $25M+ Online Revenue
69 11
56 15
49 10
45 12
23 14
9 7
currently using planning to begin use (in 2009)
Current n=265 Future Plans n=109 Current n=89 Future Plans n=43
VALIDATION SERVICES
Telephone number verificationreverse lookup
Credit history check
Paid for public records service
Contact customer to verify order
Contact card issuerAmex CVP
Postal address validation services
82 5
74 5
60 14
46 7
45 14
6 12
72 8
49 14
35 13
22 17
SINGLE MERCHANT PURCHASE HISTORY
Positive lists
Customer order history
Valid customer website behavior analysis
Negative lists (in-house lists)
83 5
69 12
37 14
34 30
40 20
PURCHASE DEVICE TRACING
IP geolocation information 55 28
11 28
MULTI-MERCHANT PURCHASE HISTORY
Shared negative lists ndash shared hotlists 16 35
9
35
15
5
25
30
10
20
40
45
50
0
Time to Clear Orders in Manual Review (2008)
Over two-thirds of merchants clear
orders through manual review
in one business day72
1 hour
or less
26
2-4
hours
10
Same
business
day
36
Next
business
day
18
2-3
business
days
8
4-5
business
days
1
6 or more
business
days
1
n=259
7
13
C Y B E R S O U R C E 1 0 T H A N N U A L O N L I N E F R A U D R E P O R T
13copy2009 CyberSource Corporation All rights reserved
The most popular tools currently used in the manual
review process are shown in chart 9 including the
percent of merchants planning to add each tool in 2009
Review Operations Efficiency
Reviewer Efficiency
The average number of orders a reviewer processed in a
day ranged from 22 for small merchants to 124 for large
(see chart 10) Large merchants who typically have case
management systems achieve a 5X higher throughput
per reviewer in the manual review stage possibly due to
greater use of review systems and detection tools during
manual review On average reviewers spent 7 minutes
reviewing each order in 2008
Time to Ramp New Staff
New to this yearrsquos surveymdashmerchants were asked how
long it takes for an order reviewer to attain acceptable
proficiency in his or her job While the learning curve
varies by type and size of online merchant the median
time reported was 4 weeks Larger merchants reported a
median of 6 weeks for a reviewer to achieve acceptable
proficiency Chart 11 shows the distribution of learning
times reported
Staff Tenure
Given the cost and time required to recruit and train
new staff merchants need to focus on staff retention
Fraud rates or order rejection rates can increase if highly
experienced review staff leave an organization and are
either not replaced or replaced by less experienced
reviewers 85 of review staff have been on the job
for one year or more Merchants report on average that
15 of their review staff were new in 2008 For large
merchants 24 of their staff were new in 2008 (see
chart 12) Efficient training and methods to ensure
consistent and accurate disposition of orders will be key
as merchants seek to optimize operating efficiency
Final Order DispositionAutomated screening and manual order review ultimately
result in order acceptance or rejection A relatively high
percentage of orders manually reviewed are ultimately
accepted (see next section)mdashhighlighting the need for
merchants to improve automated screening accuracy and
reduce the need for review A look at order reject and
acceptance rates follows in Stage 3 of the pipeline review
Overall $500K ndash lt$5Mlt$500K $5M ndash lt$25M $25M+
Average Orders Reviewed Per DayReviewer(by merchant size)
n=185
124
46
2322
68
10
Median of Weeks
4
52
Number of Weeks Required to Train New Reviewer
lt1
3
1
11
2
10
3
11
4
21
5-9
28
10-14
11
15+
5
n=159
11
Overall $500K ndash lt$5Mlt$500K $5M ndash lt$25M $25M+
of Review Staff New in 2008
n=206
24
1413
7
15
12
14
C Y B E R S O U R C E 1 0 T H A N N U A L O N L I N E F R A U D R E P O R T
Post-Review Order Acceptance RatesMerchants who manually review orders indicated they
ultimately accepted nearly frac34 of the orders they manually
reviewed (see chart 13) This was similar to the
proportion reported in 2007 50 of merchants report
they accept 90 or more of orders they manually review
These merchants are incurring significant expense
to find the 10 of the review queue they believe to be
too risky to accept Clearly most merchants require better
methods to determine which orders are to be outsorted for
manual review so only truly suspicious orders receive
human attention
Stage 3 Order Dispositioning (AcceptReject)
Automated
Screening1
Manual
Review2
Accept
Reject3
Fraud Claim
Management4ORDER
RETAINED
REVENUE
Tuning and Management
of Merchants Reporting This Level
of Post-Review Acceptance
1380 ndash 89
4490 ndash 99
6100
970 ndash 79
360 ndash 69
750 ndash 59
140 ndash 49
330 ndash 39
420 ndash 29
510 ndash 19
51 ndash 9
20
50 accept 90+
Post-Review Acceptance Trends
70
30
10
50
100
60
20
40
80
90
0
Most orders that enter manual review are accepted
2003
66
2004
71
2005
69
2006
66
2007
75
2008
73
of Orders Accepted in Review
13
15
C Y B E R S O U R C E 1 0 T H A N N U A L O N L I N E F R A U D R E P O R T
15copy2009 CyberSource Corporation All rights reserved
Overall Order Rejection RatesOrder reject rates can reflect true fraud
risk or signal ldquoprofit leaksrdquo in terms of
valid order rejection or unnecessarily
high rates of manual review In 2008 for
the first time in several years merchants
participating in the survey reported a
significant drop in their order rejection
rates from 42 in 2007 to 29 (see
chart 14)
Order rejection rates dropped in 2008 for
almost every size of merchant (see chart
15) except the very smallest and for
every industry segment (see chart 16)
It is likely that as online sales growth
slows and merchants seek to sustain
revenue levels merchants will look for
ways to accept more orders and reduce
orders rejected due to suspicion of fraud
In 2008 merchants were able to successfully reduce order
rejection rates while holding fraud rates stable It remains
to be seen if order rejection rates can be reduced further
in 2009 without an increase in fraud rates or manual
order review
Order rejection rates also vary by type of product and
merchant profile Chart 16 shows that segments which
have high cost of goods sold andor lower gross margins
tend to have higher order rejection rates Each fraud loss
in this arena has a large negative profit impact Consumer
electronics and jewelryapparel are two examples of online
segments that tend to have higher-than-average order
rejection rates
Yet even within similar groups of online merchants we
see that some merchants achieve low order rejection rates
while still keeping fraudulent order rates under control
Examining the large consumer electronics merchants in
the sample we find that half of these merchants report
35
15
05
25
50
30
10
20
40
45
0
Order Rejection Trends
2005
39
2006
41
2007
42
2008
29
14
Average Orders Rejected Due to Suspicion of Fraud
2007 n=2392008 n=326
Overall $500K ndash lt$5Mlt$500K $5M ndash lt$25M $25M+0
6
4
2
1
3
5
7
8
9
10
45
26
43
64
24
39
27
262
9
42
Order Rejection Rates by Selected Online Segment20072008
n=23
9
n=32
6
n=64
n=95
n=63
n=62
n=35
n=57
n=62
n=85
n=62
n=85
Overall Media amp
Entertainment
Digital Goods
ServicesApparel
Jewelry
Consumer
Electronics
49
34
32
56
42
56
32
42
29
42
Household amp
General Merchandise
22
31
15
16
16
C Y B E R S O U R C E 1 0 T H A N N U A L O N L I N E F R A U D R E P O R T
order rejection rates of 2 or less while maintaining
fraudulent order rates at or even below the average for
their segment
International Orders RiskierMerchants consistently report a much higher level of
order rejection on international orders due to suspicion
of payment fraud In 2008 merchants report their
rejection rate on these orders is over three and one half
times that of domestic orders as shown in chart 17
The actual fraud rate experienced on international orders
supports this cautious approach as merchants report the
fraud risk on international orders is also over three and
one half times that of domestic orders
Order Rejection Trends
of total USCanadian orders rejected of international orders rejected
Historically international order rejection rates
average 32x higher than USCanadian rates
2005 20072006 2008
6
4
2
1
3
5
7
8
9
12
11
10
13
14
42
11
11
29
13
41
12
39
0
15
17
17
C Y B E R S O U R C E 1 0 T H A N N U A L O N L I N E F R A U D R E P O R T
17copy2009 CyberSource Corporation All rights reserved
Fighting ChargebacksThis yearrsquos survey once again examined online merchantsrsquo
practices associated with reviewing and contesting
chargebacks (ldquore-presentmentrdquo) Over the past four years
the share of fraud-coded chargebacks merchants contest
has averaged 43 to 53 with the 2008 average at
50 Medium and large merchants report contesting 52
and 46 respectively of their fraud-coded chargebacks
in 2008 However when we look at the distribution of
merchantsrsquo answers to this question we find that over one
third of merchants are disputing 90 or more of their
fraud chagebacks while three out of ten merchants are
disputing less than 10 of their fraud chargebacks (see
chart 18)
Merchants report that they win on average 44 of the
chargebacks they dispute which is very similar to the 42
win rate reported in 2006 and 40 in 2007 Simply using
the average percent of chargebacks that are disputed (50)
times the average win rate of 44 results in a net recovery
rate of 22 (meaning 22 of all fraud-coded chargebacks
are recovered) However given the wide disparity in the
chargeback re-presentment rate when these are calculated
on a merchant-by-merchant basis and then averaged the
re-presentment win rate rises to 28 (see chart 19 on
next page) the same recovery rate that was found in 2007
Therefore disputing most fraud chargebacks and having
an efficient re-presentment process can help enhance
profitability and reduce fraud loss
Stage 4 Fraud Claim Management
Automated
Screening1
Manual
Review2
Accept
Reject3
Fraud Claim
Management4ORDER
RETAINED
REVENUE
Tuning and Management
Average Total Fraud-Coded
Chargebacks Re-presented of Merchants Reporting
this Re-presentment Rate
480 ndash 89
790 ndash 99
100
370 ndash 79
460 ndash 69
450 ndash 59
540 ndash 49
130 ndash 39
520 ndash 29
810 ndash 19
1 ndash 9
0
C
harg
ebac
ks R
e-pr
esen
ted
Overall $500K ndash lt$5Mlt$500K $5M ndash lt$25M $25M+
Annual Online Revenue
2006 n=1612007 n=1002008 n=120
50
53
47
36
38
48 52
46
5863
56
56
46
45
53
15
15
28
18
18
C Y B E R S O U R C E 1 0 T H A N N U A L O N L I N E F R A U D R E P O R T
Chargeback Management ToolsOf course disputing chargebacks is not an easy or cost-
free process Merchants must manage and organize all
order delivery and payment information to successfully
dispute fraudulent orders with financial institutions
Merchants are beginning to adopt automated systems
for handling this aspect of the pipeline One out of five
merchants reported using chargeback management tools
in 2008 and 37 of large merchants reported using
these tools In our 2006 survey we asked merchants to
provide estimates of how many hours it takes on average
to handle a fraud chargeback The average time spent
overall was 18 hours with a median time of 10 hours
to handle a fraud chargeback (total time consumed
for research documentation submission) The largest
merchants reported a median time of 30 minutes per fraud
chargeback Clearly fraud chargeback management is a
significant expense for merchants
ChargebacksmdashOnly Half the Problem How a fraudulent order is handled can have a significant
impact on bottom line profits Fraudulent orders are
presented to the merchant via two main routes as a
chargeback or as a direct request from a consumer
for credit (they claim fraudulent use of their account)
Although chargebacks are the most often cited metric
merchants report that chargebacks actually account for less
than half of all fraud claims This is true for all sizes of
merchants (see chart 20)
In 2007 large ($25M+ online sales) merchants reported
that 57 of their fraud was presented in the form of a
fraud-coded chargeback but in 2008 this dropped back
to 48 Considering the financial impact of both fraud
claim routes (chargebacks and credit issuancereversal)
some merchants encourage direct consumer contact
to address fraud claims and thus avoid the additional
chargeback fees levied by the merchant bankprocessor If
a consumer contacts the merchant first then the decision
is in the merchantrsquos control to either handle the dispute
directly with the consumer or to advise them to initiate a
fraud chargeback process In any event if merchants are
evaluating fraud losses solely on the basis of chargebacks
the actual rate of fraud loss the business is experiencing
may be as much as two times higher due to direct credit
issuancecharge reversal
Overall $500K ndash lt$5Mlt$500K $5M ndash lt$25M $25M+
Fraud Chargeback Re-presentment
Win RateNet Recovery Rate
Annual Online Revenues
Challenged Net Recovery
44AVERAGEWINRATE
46AVERAGEWINRATE
43AVERAGEWINRATE
54AVERAGEWINRATE
32AVERAGEWINRATE
50
28
36
23
52
38
63
35
46
19
10
0
20
30
40
50
60
70
80
90
100
(Net Recovery Rate is expressed as a of all fraud-coded chargebacks)
19
Overall $500K ndash lt$5Mlt$500K $5M ndash lt$25M $25M+
of Fraud Claims
Chargebacks vs Credit Issued by Merchant
Credits IssuedChargebacks
58
42
76
24
57
43
52
48
52
48
n=25
n=14
7
n=27
n=30
n=55
Annual Online Revenue
n=147
10
0
20
30
40
50
60
70
80
90
100
20
19
C Y B E R S O U R C E 1 0 T H A N N U A L O N L I N E F R A U D R E P O R T
19copy2009 CyberSource Corporation All rights reserved
Fraud Rate MetricsWhen monitoring the level and trend of online
fraud loss we focus on three key metrics
1) Overall revenue lost as a percent of total
online sales 2) percent of accepted orders
which turn out to be fraudulent (domestic and
international) and 3) the average value of a
fraudulent order relative to a valid order Fraud
rates vary widely by merchant and depend on a
variety of factors such as online sales volume
type of products or services sold online and
how such productsservices are delivered and
paid for It is important that merchants track
key fraud metrics over time and evaluate their
performance relative to their peer group (both
size and industry) Note this report provides
benchmarks on total fraud rates (chargebacks +
credits issued directly to consumers by merchants)
As such these metrics tend to be higher
than those reported by banks and credit card
associations which generally base reported rates
on chargeback activity only
Depending on which products or services are being sold
online fraud loss risk tolerances and order rejection
rates can vary significantly Merchants selling high
cost goods with relatively low gross margins like most
consumer electronics products tend to err on the side
of rejecting more orders to avoid expensive fraud losses
Merchants who are less subject to fraud attacks can
achieve similar fraud loss rates while rejecting
relatively few orders Over the past few years
as fraud rates have remained relatively stable
we have compiled data on fraud practices and
benchmarks by industry
Direct Revenue Loss Rates
Very large merchants typically use more tools
and have more experience and resources to
manage online fraud so their fraud rates tend
to be lower than the overall rate Revenue loss
measurement includes not only the value of
orders on which fraudulent chargebacks are
received but also the cost of any credits issued
to avoid such chargebacks Figures include both
chargebacks and credits issued directly by the
merchant in response to fraud claims
Fraudulent Order Rate for Accepted Orders
Another key metric is the number of accepted orders that
later turn out to be fraudulent Expressed as a percent of total
orders this metric is typically lower than the revenue loss
percent since the average value of fraudulent orders tends
to be greater than the average value of valid orders which
causes the fraud rate as measured by revenues to be higher
Overall 38 of merchants reported experiencing a fraudulent
order rate of 1 or more in 2008 which was the same
percent reported in 2007
20072008
Average Online Revenue Lost to Payment Fraud
(chargebacks amp fraud-related credits)
Overall $500K ndash lt$5Mlt$500K $5M ndash lt$25M $25M+
Annual Online Revenue
0
12
08
04
02
06
10
14
16
18
14 1
5 16
15
121
3
13
15
14
14
20072008
Average Accepted Orders Resulting in Fraud Losses
Overall $500K ndash lt$5Mlt$500K $5M ndash lt$25M $25M+
Annual Online Revenue
0
12
08
04
02
06
10
14
16
18
16
11
13
12
11
13
11
13
11
13
A fraud chargeback was received on the orders OR a credit was issued directly to a customerwho claims not to have placed an order
21
22
20
C Y B E R S O U R C E 1 0 T H A N N U A L O N L I N E F R A U D R E P O R T
International Orders Carry Higher Risk
Fifty-two percent of merchants surveyed accepted orders
from outside the US amp Canada in 2008 International
sales accounted for an average of 17 of total orders
for these merchants That same group reported that the
actual direct fraud rate on international orders averaged
40 or more than 36 times the overall fraud rate for
domestic online orders Though international markets
represent an attractive opportunity online merchants must
make sure that their fraud detection and management
systems are robust enough to handle the additional risk
involved Merchants who sell online outside of the US
amp Canada report that they reject international orders due
to suspicion of fraud at a rate that is over three and one
half times the US and Canadian average rate of 29
mdash rejecting approximately 1 out of every 9 international
orders received
Average Value of Fraudulent Order Higher than a Valid Order
Historically fraudulent orders tend to have higher values
on average than valid orders In 2008 the median value
of a fraudulent order was $200 compared to $130 median
value reported for valid orders This relationship of higher
fraudulent order values vs valid order value was found for
all merchant size categories as chart 24 shows Since
fraudulent orders tend to be somewhat higher in value than
valid orders merchants will tend to outsort more high value
orders for manual review and verification Large online
merchants reported that the median value of an order
flagged for manual review was $245
Valid vs Fraudulent Order Value
Valid orderFraudulent order
Median used to minimize impact of outliers
Overall $500K ndash lt$5Mlt$500K $5M ndash lt$25M $25M+
Annual Online Revenue
0
$200
$50
$100
$150
$250
$300
$350
$120
$150
$200
$150
$250
$175
$150
$100
$200
$130
24
40
10
05
20
15
25
35
45
30
00
International Fraud Rateover 3x USCanadian rate
11
40
Location of Order Origination
Within USCanadan=326
Outside USCanadan=164
Frau
d R
ate
o
f O
rder
s
23
21
C Y B E R S O U R C E 1 0 T H A N N U A L O N L I N E F R A U D R E P O R T
21copy2009 CyberSource Corporation All rights reserved
Tuning amp Management
Maintaining and Tuning Screening Rules28 of merchants say they have an automated order
screening system in place that allows business managers
to modify decision rules without assistance from internal
IT staff or external parties (up from 16 found in 2006)
The ability to adjust automated order screening systems
quickly helps manage the order review flow tailor rules
to new products and adapt to new fraud trends as they
are encountered Without this ability merchants cannot
easily minimize reject rates review costs or fraud rates
Additionally giving business managers the capability of
adjusting business rules on-the-fly reduces the costs and
burden of IT support
Global Fraud Portals Some online merchants are integrating fraud tools
and strategies via fraud management portals These
portals employ a combination of flexible rules systems
that interact with a portfolio of ldquotruth servicesrdquo around
the globe allowing business managers to set payment
type product type and market-specific screens Case
management systems are being integrated with these
portals with accompanying enhancements to streamline
workflow Global fraud portals typically include hierarchical
management as companies strive to centralize fraud
management across multiple lines of business and
geographies
Merchant Budgets for Fraud Management How much are online merchants spending to mitigate
fraud risk In both 2008 and in 2007 survey results
show that 34 of merchants spend 05 or more of
their online revenues to manage online payment fraud
while 66 spend less than 05 In 2008 across
all merchants the median ratio of fraud management
expense to sales was 022 down from 028 in 2007
although some merchants in high risk categories are
spending significantly more These spending estimates
focus on the cost of managing fraud risk (internal and
external systems and services management development
and review staffs) Direct fraud loss (chargebacks lost
goods and associated shipping costs) as well as the
opportunity cost associated with valid order rejection are
not included here (see chart 25)
Automated
Screening1
Manual
Review2
Accept
Reject3
Fraud Claim
Management4ORDER
RETAINED
REVENUE
Tuning and Management
02ndash lt050ndash lt02 05ndash lt10 10ndash lt40 40+
How Much Merchants Spend
on Fraud Management
(percent of merchants operating at defined expense level)
of Annual Online Revenues Spent to Manage Fraud(staff etc excluding fraud loss)
2007 n=972008 n=108
41 44
6
14
24
22
12 16
16
4
Median2008 = 022
2007 = 028
0
60
40
20
25
title (title)
22
C Y B E R S O U R C E 1 0 T H A N N U A L O N L I N E F R A U D R E P O R T
Budget Allocation For the past three years merchants have consistently
spent just over half their fraud management budgets on
review staff (see chart 26) The remainder is allocated
as follows 25 for third party tools or services and 24
on internally developed tools and systems
Clearly review staff costs are the dominant factor and
only 13 of merchants cite plans to increase review
staffing in 2009 Reducing the need for manual review
and increasing the efficiency and effectiveness of
reviewers is key to growing online business profits and
managing the total cost of online payment fraud One
place to start is by improving the automated detection of
risky orders so as to reduce manual order review volumes
Clearly the continued reliance on manual review we have
seen in the data over the last few years is not an optimal
long term strategy for managing online fraud As budgets
come under increasing pressure merchants will need
to redouble their efforts to automate more of the fraud
management process while keeping valid order conversion
high and fraud loss low
Base Those with 1 or more full-time manual review staff
Average Spending Allocation
for Fraud Management 2008
n=400
3rd Party
Tools
23
24
Internal
Tools amp
System
3rd Party
Tools
25
Order
Review
Staff
51
Planned Staffing Levels
Increase
13
21
Same
81
71
2009
2008
Decrease
6
8
n=238 248
26
23
C Y B E R S O U R C E 1 0 T H A N N U A L O N L I N E F R A U D R E P O R T
23copy2009 CyberSource Corporation All rights reserved
Resources amp Solutions
3 Managed Services
2 Design amp Installation
1 Systems amp Services
PAYMENT SECURITY
Order
Screening
Collection amp
Reconciliation
Global Payment
Acceptance
Processing
Management
L A S E R
BankBankTrans f e rTrans f e r
Direct
Debit
ORDER
bull Onlinebull Call Centerbull IVRbull Kioskbull POSbull ERP
With Performance
Guarantees
To find information on CyberSourcersquos industry-leading risk
management solutions self-paced webinars on decision
management and other whitepapers on electronic payment
management visit our Resource Center at
wwwcybersourcecom For sales assistance phone
1-888-330-2300 or e-mail salescybersourcecom
CyberSource Payment Management Solutions CyberSource offers a comprehensive portfolio of modular
services and tools to help your company manage your entire
payment pipeline to optimize sales results All are available
via one connection to our web-based services
Accept All Popular Payment Types in 190+
Countries
Accept payments worldwide using a merchant account from
your preferred provider or CyberSource worldwide credit
and debit cards regional cards direct debit bank
transfers electronic checks and alternative payment
types such as Bill Me Later and PayPal CyberSource
also provides professional services to help you
integrate payment with front-end and back-office
systems
Risk ManagementOrder Screening
Global Fraud Management Portal with CyberSource Intelligent
Review Technology A hosted rules and case management
system that provides on-demand access to over 150
validation tests and services across all four dimensions of
detection Detectors include multi-merchant transaction
history checks worldwide delivery address and phone
verification device fingerprinting IP geolocation purchase
velocity identity morphing and custom data from your
systems Case management system provides consolidated
data review workflow management and built-in callouts to
validation services to streamline review
Managed Services CyberSource provides client services to
help you analyze design and manage your order screening
and fraud detection processesmdasheverything from screening
strategies and risk threshold optimization analysis
to ongoing monitoring order review and chargeback
managementrecovery Our managed services include
business performance guarantees
Payer Authentication Verified by Visa MasterCard
SecureCode
Processing Management
CyberSource processes your payments in our high
availability datacenters located in the US Europe and
Japan All datacenters are certified PCI-compliant and
include sophisticated processing management logic to help
prevent payment failures and rate downgrades
Collection amp Reconciliation
A full array of online and exportable payment reporting
capability is available to streamline reconciliation activity
Further systems can be installed to automate up to 90
of the tasks associated with payment reconciliation and
chargeback re-presentment
Payment Security
Remove Payment Data From Your Network CyberSource
provides secure storage and hosted payment acceptance
services that let you process without storing or even
transmitting payment data A great way to streamline PCI
compliance and mitigate security risk
Payment System Centralization Our team of experts will help
you consolidate multiple payment systems into a single easy
to manage system Optionally CyberSource will also host
support and manage these systems in our secure datacenters
PCI Planning amp Remediation CyberSource provides PCI
compliance consulting and remediation services to help
remedy PCI issues
Professional Services
CyberSource maintains a team of experienced payment
consultants to assist with payment systems planning
system and process design and implementation and
integration Our client services team is additionally
available to help you monitor tune or fully outsource
portions of your payment operations
C Y B E R S O U R C E 1 0 T H A N N U A L O N L I N E F R A U D R E P O R T
North America
CyberSource Corporation
1295 Charleston Road
Mountain View CA 94043
T 8883302300
T 6509656000
F 6506259145
Email infocybersourcecom
Europe
CyberSource Ltd
The Waterfront
300 Thames Valley Park Drive
Thames Valley Park
Reading RG6 1PT
United Kingdom
T +44 (0) 1189294840
F +44 (0) 8704601931
Email ukcybersourcecom
UK Fraud Report wwwcybersourcecoukukfraudreport
Japan
CyberSource KK (Japan)
3-11-11 Shibuya Shibuya-ku
Tokyo 150-0002 Japan
T +81357747733
F +81357747732
Email mailcybersourcecojp
CyberSource Corporation is a leading provider of
electronic payment risk and security management
solutions CyberSource provides payment management
solutions for electronic payments processed via Web
call center kiosk mobile and POS environments
Services include hosted systems to help you manage
electronic payments as well as professional services
to help design integrate and fully manage parts or all
of your payment operations Over 245000 businesses
worldwide use CyberSource solutions including half
the companies comprising the Dow Jones Industrial
Average and leading Internet brands The company
is headquartered in Mountain View California and
has sales and service offices in Japan the United
Kingdom and other locations in the United States
For More Information
bull Call 18883302300
bull Email infocybersourcecom
bull Visit wwwcybersourcecom
Get Tailored Views of Risk Management
Pipelinetrade MetricsTo get a view crafted for your companyrsquos size and industry
please contact CyberSource at 18883302300 or online at
wwwcybersourcecomcontact_us
For additional information whitepapers and webinars
or sales assistance
bull Contact CyberSource 18883302300 or
wwwcybersourcecomcontact_us
bull Risk Management Solutions visit wwwcybersourcecom
products_and_servicesrisk_management
bull Global Payment amp Security Solutions
visit wwwcybersourcecomproducts_and_services
global_payment_services
About CyberSource
C Y B E R S O U R C E 1 0 T H A N N U A L O N L I N E F R A U D R E P O R T

6
C Y B E R S O U R C E 1 0 T H A N N U A L O N L I N E F R A U D R E P O R T
Total Pipeline ViewBusinesses that focus solely on managing chargebacks
may not be seeing the complete financial picture Online
payment fraud impacts profits from online sales in
multiple ways Besides direct revenue losses the cost of
stolen goodsservices and associated deliveryfulfillment
costs there are the additional costs of rejecting valid
orders staffing manual review administration of fraud
claims as well as challenges associated with business
scalability Merchants can gain efficiency by taking a total
pipeline view of operations and costs While the fraud rate
is one metric to monitor (and contain within industry
and association limits) an end-to-end view is required to
arrive at the best possible financial outcome
In 2008 these ldquoprofit leaksrdquo in the Risk Management
Pipelinetrade impact as much as 40+ of orders for
mid-sized merchants and as much as 19+ of orders
for larger merchantsmdashrestricting profits operating
efficiency and scalability This report details key metrics
and practices at each point in the pipeline to provide you
with benchmarks and hopefully insight Custom views
of these benchmarks and practices are available through
CyberSourcemdashsee end of report for contact information
Automated
Screening1
Manual
Review2
Accept
Reject3
Fraud Claim
Management4
Risk Management Pipeline
ORDERRETAINED
REVENUE
PROFIT LEAKSStaffing ampScalability
LostSales
Fraud Loss ampAdministration
29 Avg Reject Rate
for USCanadian orders
(all merchants)
109 Avg Reject Rate
for Non-USCanadian
orders (merchants who
accept these orders)
Merchants review 32 of
orders on average
51 of fraud management
budget is spent on review
staff costs
81 of these merchants
have no plans to change
manual order review
staffing during 2009
14 Average Fraud Loss
42 from chargebacks
58 from issued credits
7
C Y B E R S O U R C E 1 0 T H A N N U A L O N L I N E F R A U D R E P O R T
7copy2009 CyberSource Corporation All rights reserved
Fraud Detection Tools Used During Automated ScreeningWe define detection tools as those used to identify the
probability of risk associated with a transaction or to validate
the identity of the purchaser Results of tests carried out
by detection tools are then interpreted by humans or rules
systems to determine if a transaction should be accepted
rejected or reviewed A wide variety of tools are available to
help merchants evaluate incoming orders for potential fraud
Merchants handling large online order volumes typically
employ an initial automated order evaluation to determine
if an incoming order might represent a fraud risk Some
merchants will allow this initial automated screen to
cancel orders without further human intervention 46 of
all merchants cancelled some orders as a result of their
automated screening process and 58 of large merchants
indicated they cancelled some orders at this stage (see
chart 2)
In 2008 two-thirds of merchants reported using three or
more fraud detection tools for automated screening with
47 tools being the average Larger merchants dealing
with higher order volumes reported using 63 detection
tools on average
The most popular tools used to assess online fraud risk are
shown in chart 3 which shows the current and planned
adoption of different tools Note that the tool usage profile
for merchants over $25M in online sales is different than
the overall average These larger merchants generally use
tools across all four dimensions of detection and more often
use their customer history and proprietary data during the
automated order screening process They have a higher use of
company-specific risk scoring models negative and positive
lists and sophisticated order velocity monitoring tools
Overall 96 of merchants use one or more validation tools
These tools are often provided by the card associations to
help authenticate cards and card holders The tool most
often mentioned by merchants is the Address Verification
Service (AVS) which compares numeric address
data with information on file from the cardholderrsquos
card issuing bank AVS is generally available for US
cardholders and for limited numbers of cardholders
in Canada and the UK AVS is subject to a significant
rate of ldquofalse positivesrdquo which may lead to rejecting
valid orders as well as missing fraudulent orders1 If
the cardholder has a new address or a valid alternate
address (such as seasonal vacation home) this
information may not be reflected in the records of
the cardholderrsquos issuing bank so the address would
be flagged as invalid Merchants typically do not rely
solely on AVS to accept or reject an order
Card Verification Number (CVN also known as
CVV2 for Visa CVC2 for MasterCard CID for
American Express and Discover) is the second most
Stage 1 Automated Screening
46
Yes Yes35
11
54
No
11
47 58
No
42
Base Those using automated servicestechnologies
Are Inbound Orders Rejected
Based On Automated Screening
n=315 n=96
No generally all suspicious orders are out-sorted for manual reviewYes if automated tests indicate too much risk OR customer is on our negative listYes but generally ONLY if customer is on our negative list
All Merchants Merchants $25M+ Online Revenue
2
Automated
Screening1
Manual
Review2
Accept
Reject3
Fraud Claim
Management4ORDER
RETAINED
REVENUE
Tuning and Management
1CyberSource analyzed 94 million credit card transactions where AVS
was used and the final status of the transaction was known If a merchant
were to reject orders based solely on an AVS ldquono matchrdquo they would reject
57 of their orders but fail to detect 83 of the fraudulent orders This
represents an 181 false positive ratio
8
C Y B E R S O U R C E 1 0 T H A N N U A L O N L I N E F R A U D R E P O R T
commonly used detection tool The purpose of CVN in a
card-not-present transaction is to attempt to verify that the
person placing the order has the actual card in his or her
possession Requesting the card verification number during
an online purchase can add a measure of security to the
transaction However CVN numbers can be obtained by
fraudsters just as credit card numbers are obtained CVN
usage by online merchants has significantly increased in
the last five years rising from 44 in 2003 to 74 today
Large merchants were asked to identify the three most
effective tools they use To eliminate the bias that the more
commonly used tools have the potential to receive more
mentions we normalize the data by looking at the percent
of merchants using a particular tool who cite that tool as
one of their top three choices
Company specific
fraud screens
received the
highest rating as
being an effective
tool by merchants
who use this tool
Half of the 42
of large merchants
who use custom
fraud models
rated them as
one of their three
most effective
tools These fraud
screens are risk
scoring models
which are tuned
using an individual
merchantrsquos
historical data on
factors associated
with online orders
Since fraudsters
learn over time and
vary their strategies
we typically find
most risk scoring
models need
regular tuning
with new analysis
and data in order
to maximize their
effectiveness
Out-of-wallet or
in-wallet challenge systems while used by only 7 of large
merchants today was rated by 43 of these merchants
as being one of their three most effective tools The use
of challenge systems tends to be limited to merchants
who have frequent repeat purchases by customers or bill
customers on a regular schedule
Device Fingerprinting (also used by only 7 of large
merchants today) was rated by 43 of these merchants
as being one of their three most effective tools These
favorable opinions may well contribute to the very high
intention by other large online merchants to add this tool in
the next twelve months
Automated Fraud Detection Tool Current Usage and Plans
All Merchants Merchants $25M+ Online Revenue
78 11
74 14
35 9
27 18
25 12
11 7
5 6
5 6
CurrentPlanning to implement (next 12 months)
Current n=359 Future Plans n=194 Current n=101 Future Plans n=70
VALIDATION SERVICES
CVN (Card Verification Number)
Paid for public records service
Out-of-wallet or in-wallet challengeresponse
Telephone number verificationreverse lookup
Credit history check
Address Verification Service
Postal address validation services
Verified by VisaMasterCard SecureCode
87 6
80 16
39 9
19 11
31 10
21 4
3 1
7 6
47 10
38 12
28 15
27 11
18 10
20 9
SINGLE MERCHANT PURCHASE HISTORY
Fraud scoring model ndash company specific
Customer order history
Order velocity monitoring
Valid customer behavior analysis
Positive lists
Negative lists (in-house lists)
58 13
67 10
54 17
42 20
30 14
22 13
6 25
35 19
PURCHASE DEVICE TRACING
Device Fingerprinting
IP geolocation information 48 27
7 47
14 14
9 2
MULTI-MERCHANT PURCHASE HISTORY
Multi-merchant fraud models
Shared negative lists ndash shared hotlists 18 24
9 9
3
9
C Y B E R S O U R C E 1 0 T H A N N U A L O N L I N E F R A U D R E P O R T
9copy2009 CyberSource Corporation All rights reserved
Planned Automated Screening Tool Usage 2009
Device Fingerprinting Highest on ldquoPlan to Buyrdquo Lists
Merchants showed an increased intent to implement every
one of the 14 detection tools we looked at in both 2007 and
2008 Some tools showed dramatic increases in the percent
of merchants who say they intend to implement them in
2009 Four tools had 15 or more of merchants planning
to adopt them in 2009 and for three of these four tools the
plans to implement them have more than doubled over last
year These tools are Device Fingerprinting IP Geolocation
and Order Velocity Monitoring
Device Fingerprinting examines and records details about
the configuration of the device from which the order is
being placed This can aid in flagging fraud attacks where
a variety of fraudulent orders are launched from a common
device or set of devices Nearly 50 of large online
merchants indicated they were planning to add Device
Fingerprinting in the next twelve months
IP geolocation tools also showed a dramatic increase
in merchant interest This tool attempts to identify the
geographic location of the device from which an online order
was placed It provides an additional piece of information
to compare against other order information and order
acceptance rules to help assess the fraud risk of an order
In some cases only an internet service providerrsquos address is
returned so the ultimate geographic location of the device
remains unknown Fraudsters may also employ anonymizers
proxy servers to hide their true IP address and location
As in several years past card association payer
authentication services (eg Verified by Visa MasterCard
SecureCode) figure prominently in many merchantsrsquo future
plans 2008 survey results show that one out of four
merchants currently use one or more of the available payer
authentication services 18 of respondents say they are
interested in deploying these systems in the next twelve
months as a new tool to manage fraud However despite
significant interest in implementing payer authentication
systems over the past few years we have seen relatively
slow actual adoption of payer authentication since we
started tracking this tool in 2003
Implementing payer authentication should reduce exposure
to card-not-present fraud loss either by authenticating
the buyerrsquos identity or by shifting fraud liability back
to the card issuing bank (interchange incentives also
apply) Further certain card types in some countries are
beginning to require that payer authentication solutions
be used as a condition of accepting the associated cards
(eg Maestro Cards in the United Kingdom) But if
merchants have a sufficiently high direct fraud loss rate
the card association may not permit the merchant to shift
liability even if the merchant has implemented a payer
authentication system Over the next few years these
systems may help reduce the incidence of online credit
card fraud if a critical mass of consumers register their
cards and accept the new checkout procedures
Successful adoption of payer authentication will require
merchants to put procedures in place to handle customers
who have not adopted verification services or who
use cards or payment types which are not supported
International expansion and the growing popularity of
online payment types such as electronic checks PayPaltrade
Bill Me Laterreg etc drive the need for alternative fraud
management techniques
Automated DecisionRules Systems
Automated Order Screening
Automated order decisioning screening systems are now
used by 56 of merchants (up from 25 in 2005) Eight
out of ten larger online merchants use such systems These
tools help companies automate order screening by applying
a merchantrsquos business rules in the real-time evaluation of
incoming orders
Decision and rules systems automate the evaluation of test
results generated by fraud detection tools and determine
whether the transaction should be accepted rejected or
suspended for review As the number of tools used grow
it is becoming increasingly important for merchants to
employ automated systems to interpret and weigh the
multiple results for each product or transaction profile
(versus a ldquoone size fits allrdquo screen) to optimize business
results Because fraud patterns are dynamic and the
introduction of new products services or markets often
requires a unique set of acceptance rules it is imperative
that these systems also quickly adapt to the changing
environment Half of large merchants say their screening
system allows business managers to create and modify
screening rules without assistance from external experts or
internal information technology staff
Results of Automated Screening
The automated order screening process generates three
outcomes 1) order acceptance without further review 2)
orders flagged for further review and 3) automatic order
rejection 46 of merchants indicated they reject some
orders based on automated screening tests and 58 of
large merchants indicated doing so
10
C Y B E R S O U R C E 1 0 T H A N N U A L O N L I N E F R A U D R E P O R T
Orders which do not pass the automated order screening
stage typically enter a manual review queue During this
stage additional information is collected to determine if
orders should be accepted or rejected due to excessive
fraud risk
Manual review represents a critical area of profit leakage
It is expensive limits scalability and impacts customer
satisfaction For many merchants it represents half of
their fraud management budget Only 13 of merchants
say they have budget available to increase review
staff now or in the next twelve months This presents
significant challenges to profit growth since even at a
stable percent of orders sent to review the total number
of orders that must be reviewed increases in step with the
total increase of online sales
Manual Order Review RatesIn what should be a highly automated sales environment
most merchants are manually checking orders In fact
during the past six years overall 1 out of every 4 orders
transacted online have been manually reviewed (see chart
4) Over the same period merchants who conduct manual
review typically reviewed 1 out of 3 orders they received
Merchants of all sizes use manual review to manage
payment fraud Chart 5 shows smaller merchants review
a higher percentage of orders (perhaps because lower
order volumes permit such practice) but even larger
merchants review a significant percentage of online
ordersmdashand likely devote more resources to this task than
is operationally scalable
One consequence of using more fraud detection tools
during automated screening is a greater chance of one
or more flags being raised resulting in an order being
selected for manual review Adding additional tools to
detect fraud may result in downstream impacts and
costs if these tools are not carefully integrated into a
merchantrsquos review process and tuned to a merchantrsquos
specific situation
Merchants expecting increased online sales will need to
take at least one of the following actions 1) divert more
staff time to the order review process 2) increase staffing
levels 3) allow more time to process orders and ship good
ones or 4) improve accuracy of initial automated sorting
and make the subsequent review process more efficient
Review Tools amp PracticesGiven the reported limitations on hiring additional manual
review staff there is increased focus on investing in tools
and systems to increase the productivity and effectiveness
of review staff While the primary focus should be on
improving initial automated sorting accuracy to decrease
need for review attention to streamlining the review
process is also warranted
Stage 2 Manual Review
Automated
Screening1
Manual
Review2
Accept
Reject3
Fraud Claim
Management4ORDER
RETAINED
REVENUE
Tuning and Management
40
0
2004 2005 2006
Manual Review Trends
2007 2008
30
20
10
5
15
25
35
Over the past 5 years on average 1 out of 4 online orders were
manually reviewed Merchants performing manual review have
on average reviewed 1 out of every 3 orders received
35
26
Orders Reviewed by Merchants Practicing Review Orders Reviewed Overall (Net Review)
23
28
27
33
22
32
27
34
4
11
C Y B E R S O U R C E 1 0 T H A N N U A L O N L I N E F R A U D R E P O R T
11copy2009 CyberSource Corporation All rights reserved
Use of Case Management Systems
Currently 1 out of 3 merchants report having a case
management system that supports their manual review
process and staff Over half of merchants either
currently use a case management system or
plan to implement one in 2009 For large
online merchants 65 report currently using
or planning to implement a case management
system
Merchants using a case management system
are also more likely to be able to track fraud
rates on orders which have gone through
manual review 74 of merchants using case
management systems report tracking fraud
rates for manually reviewed orders vs only
42 being able to do so when not using a
case management system Surprisingly 44
of merchants performing manual order review
say they do not track the fraud rates of orders
which have been manually reviewed and 24
of large merchants say they do not have this
information Without knowing the fraud rate
on orders going through manual review and
who reviewed them it is difficult to determine
training needs or other actions to improve the
effectiveness of manual review
Tools UsedPlanned During Manual Review
While many of the tools or detector results used
during automated screening can also be used
during manual review several additional tools
and processes are employed by manual reviewers
Attempting to validate an order by contacting the
customer is standard practice for 7 out of 10
merchants and 82 of large merchants However
most organizations have policies regarding how
quickly they must clear orders through manual
review and how long they will wait for customers
to respond to requests for additional information
Most merchants try to clear orders through manual
review in one business day and say they will not
wait more than three business days for a customer
to respond to a request for more information (see
charts 7 and 8)
Another practice used only in manual review is to
contact the card issuer This action is taken by
almost half of merchants overall and 60 of large
merchants Telephone number validation reverse
lookup is the third most popular tool with 56 of
merchants using it during manual review vs 25
during automated screening
In 2008 two-thirds of merchants reported using
four or more fraud detection tools for manual review with
49 tools being the average Larger merchants reported
using 61 detection tools on average
35
15
5
25
30
10
20
40
45
50
55
0
Average of Orders Manually Reviewed(for merchants engaged in review)
200620072008
lt$500K
36
43
51
$500K ndash lt$5M
36
45
35
$5M ndash lt$25M
25
40
34
$25M+
15
14
15
o
f O
rder
s
Annual Online Revenues
5
Currently usePlan to implement in 2009Do not use or plan to implement
Use or Plan to Implement Case Management System
to Support Manual Order Review Process
18
4933
n=227
All Merchants
35
39
26
n=84
Merchants $25M+
Base Those conducting manual review
6
12
C Y B E R S O U R C E 1 0 T H A N N U A L O N L I N E F R A U D R E P O R T
35
15
5
25
50
30
10
20
40
45
0
Time Allowed for Customer Response
Source 2008 CyberSource Fraud Report
Half day
or less
10
Same
business
day
10
Next
business
day
14
2-3
business
days
37
4-5
business
days
11
6 or more
business
days
19
8
Fraud Detection Tool Usage During Manual Review
All Merchants Merchants $25M+ Online Revenue
69 11
56 15
49 10
45 12
23 14
9 7
currently using planning to begin use (in 2009)
Current n=265 Future Plans n=109 Current n=89 Future Plans n=43
VALIDATION SERVICES
Telephone number verificationreverse lookup
Credit history check
Paid for public records service
Contact customer to verify order
Contact card issuerAmex CVP
Postal address validation services
82 5
74 5
60 14
46 7
45 14
6 12
72 8
49 14
35 13
22 17
SINGLE MERCHANT PURCHASE HISTORY
Positive lists
Customer order history
Valid customer website behavior analysis
Negative lists (in-house lists)
83 5
69 12
37 14
34 30
40 20
PURCHASE DEVICE TRACING
IP geolocation information 55 28
11 28
MULTI-MERCHANT PURCHASE HISTORY
Shared negative lists ndash shared hotlists 16 35
9
35
15
5
25
30
10
20
40
45
50
0
Time to Clear Orders in Manual Review (2008)
Over two-thirds of merchants clear
orders through manual review
in one business day72
1 hour
or less
26
2-4
hours
10
Same
business
day
36
Next
business
day
18
2-3
business
days
8
4-5
business
days
1
6 or more
business
days
1
n=259
7
13
C Y B E R S O U R C E 1 0 T H A N N U A L O N L I N E F R A U D R E P O R T
13copy2009 CyberSource Corporation All rights reserved
The most popular tools currently used in the manual
review process are shown in chart 9 including the
percent of merchants planning to add each tool in 2009
Review Operations Efficiency
Reviewer Efficiency
The average number of orders a reviewer processed in a
day ranged from 22 for small merchants to 124 for large
(see chart 10) Large merchants who typically have case
management systems achieve a 5X higher throughput
per reviewer in the manual review stage possibly due to
greater use of review systems and detection tools during
manual review On average reviewers spent 7 minutes
reviewing each order in 2008
Time to Ramp New Staff
New to this yearrsquos surveymdashmerchants were asked how
long it takes for an order reviewer to attain acceptable
proficiency in his or her job While the learning curve
varies by type and size of online merchant the median
time reported was 4 weeks Larger merchants reported a
median of 6 weeks for a reviewer to achieve acceptable
proficiency Chart 11 shows the distribution of learning
times reported
Staff Tenure
Given the cost and time required to recruit and train
new staff merchants need to focus on staff retention
Fraud rates or order rejection rates can increase if highly
experienced review staff leave an organization and are
either not replaced or replaced by less experienced
reviewers 85 of review staff have been on the job
for one year or more Merchants report on average that
15 of their review staff were new in 2008 For large
merchants 24 of their staff were new in 2008 (see
chart 12) Efficient training and methods to ensure
consistent and accurate disposition of orders will be key
as merchants seek to optimize operating efficiency
Final Order DispositionAutomated screening and manual order review ultimately
result in order acceptance or rejection A relatively high
percentage of orders manually reviewed are ultimately
accepted (see next section)mdashhighlighting the need for
merchants to improve automated screening accuracy and
reduce the need for review A look at order reject and
acceptance rates follows in Stage 3 of the pipeline review
Overall $500K ndash lt$5Mlt$500K $5M ndash lt$25M $25M+
Average Orders Reviewed Per DayReviewer(by merchant size)
n=185
124
46
2322
68
10
Median of Weeks
4
52
Number of Weeks Required to Train New Reviewer
lt1
3
1
11
2
10
3
11
4
21
5-9
28
10-14
11
15+
5
n=159
11
Overall $500K ndash lt$5Mlt$500K $5M ndash lt$25M $25M+
of Review Staff New in 2008
n=206
24
1413
7
15
12
14
C Y B E R S O U R C E 1 0 T H A N N U A L O N L I N E F R A U D R E P O R T
Post-Review Order Acceptance RatesMerchants who manually review orders indicated they
ultimately accepted nearly frac34 of the orders they manually
reviewed (see chart 13) This was similar to the
proportion reported in 2007 50 of merchants report
they accept 90 or more of orders they manually review
These merchants are incurring significant expense
to find the 10 of the review queue they believe to be
too risky to accept Clearly most merchants require better
methods to determine which orders are to be outsorted for
manual review so only truly suspicious orders receive
human attention
Stage 3 Order Dispositioning (AcceptReject)
Automated
Screening1
Manual
Review2
Accept
Reject3
Fraud Claim
Management4ORDER
RETAINED
REVENUE
Tuning and Management
of Merchants Reporting This Level
of Post-Review Acceptance
1380 ndash 89
4490 ndash 99
6100
970 ndash 79
360 ndash 69
750 ndash 59
140 ndash 49
330 ndash 39
420 ndash 29
510 ndash 19
51 ndash 9
20
50 accept 90+
Post-Review Acceptance Trends
70
30
10
50
100
60
20
40
80
90
0
Most orders that enter manual review are accepted
2003
66
2004
71
2005
69
2006
66
2007
75
2008
73
of Orders Accepted in Review
13
15
C Y B E R S O U R C E 1 0 T H A N N U A L O N L I N E F R A U D R E P O R T
15copy2009 CyberSource Corporation All rights reserved
Overall Order Rejection RatesOrder reject rates can reflect true fraud
risk or signal ldquoprofit leaksrdquo in terms of
valid order rejection or unnecessarily
high rates of manual review In 2008 for
the first time in several years merchants
participating in the survey reported a
significant drop in their order rejection
rates from 42 in 2007 to 29 (see
chart 14)
Order rejection rates dropped in 2008 for
almost every size of merchant (see chart
15) except the very smallest and for
every industry segment (see chart 16)
It is likely that as online sales growth
slows and merchants seek to sustain
revenue levels merchants will look for
ways to accept more orders and reduce
orders rejected due to suspicion of fraud
In 2008 merchants were able to successfully reduce order
rejection rates while holding fraud rates stable It remains
to be seen if order rejection rates can be reduced further
in 2009 without an increase in fraud rates or manual
order review
Order rejection rates also vary by type of product and
merchant profile Chart 16 shows that segments which
have high cost of goods sold andor lower gross margins
tend to have higher order rejection rates Each fraud loss
in this arena has a large negative profit impact Consumer
electronics and jewelryapparel are two examples of online
segments that tend to have higher-than-average order
rejection rates
Yet even within similar groups of online merchants we
see that some merchants achieve low order rejection rates
while still keeping fraudulent order rates under control
Examining the large consumer electronics merchants in
the sample we find that half of these merchants report
35
15
05
25
50
30
10
20
40
45
0
Order Rejection Trends
2005
39
2006
41
2007
42
2008
29
14
Average Orders Rejected Due to Suspicion of Fraud
2007 n=2392008 n=326
Overall $500K ndash lt$5Mlt$500K $5M ndash lt$25M $25M+0
6
4
2
1
3
5
7
8
9
10
45
26
43
64
24
39
27
262
9
42
Order Rejection Rates by Selected Online Segment20072008
n=23
9
n=32
6
n=64
n=95
n=63
n=62
n=35
n=57
n=62
n=85
n=62
n=85
Overall Media amp
Entertainment
Digital Goods
ServicesApparel
Jewelry
Consumer
Electronics
49
34
32
56
42
56
32
42
29
42
Household amp
General Merchandise
22
31
15
16
16
C Y B E R S O U R C E 1 0 T H A N N U A L O N L I N E F R A U D R E P O R T
order rejection rates of 2 or less while maintaining
fraudulent order rates at or even below the average for
their segment
International Orders RiskierMerchants consistently report a much higher level of
order rejection on international orders due to suspicion
of payment fraud In 2008 merchants report their
rejection rate on these orders is over three and one half
times that of domestic orders as shown in chart 17
The actual fraud rate experienced on international orders
supports this cautious approach as merchants report the
fraud risk on international orders is also over three and
one half times that of domestic orders
Order Rejection Trends
of total USCanadian orders rejected of international orders rejected
Historically international order rejection rates
average 32x higher than USCanadian rates
2005 20072006 2008
6
4
2
1
3
5
7
8
9
12
11
10
13
14
42
11
11
29
13
41
12
39
0
15
17
17
C Y B E R S O U R C E 1 0 T H A N N U A L O N L I N E F R A U D R E P O R T
17copy2009 CyberSource Corporation All rights reserved
Fighting ChargebacksThis yearrsquos survey once again examined online merchantsrsquo
practices associated with reviewing and contesting
chargebacks (ldquore-presentmentrdquo) Over the past four years
the share of fraud-coded chargebacks merchants contest
has averaged 43 to 53 with the 2008 average at
50 Medium and large merchants report contesting 52
and 46 respectively of their fraud-coded chargebacks
in 2008 However when we look at the distribution of
merchantsrsquo answers to this question we find that over one
third of merchants are disputing 90 or more of their
fraud chagebacks while three out of ten merchants are
disputing less than 10 of their fraud chargebacks (see
chart 18)
Merchants report that they win on average 44 of the
chargebacks they dispute which is very similar to the 42
win rate reported in 2006 and 40 in 2007 Simply using
the average percent of chargebacks that are disputed (50)
times the average win rate of 44 results in a net recovery
rate of 22 (meaning 22 of all fraud-coded chargebacks
are recovered) However given the wide disparity in the
chargeback re-presentment rate when these are calculated
on a merchant-by-merchant basis and then averaged the
re-presentment win rate rises to 28 (see chart 19 on
next page) the same recovery rate that was found in 2007
Therefore disputing most fraud chargebacks and having
an efficient re-presentment process can help enhance
profitability and reduce fraud loss
Stage 4 Fraud Claim Management
Automated
Screening1
Manual
Review2
Accept
Reject3
Fraud Claim
Management4ORDER
RETAINED
REVENUE
Tuning and Management
Average Total Fraud-Coded
Chargebacks Re-presented of Merchants Reporting
this Re-presentment Rate
480 ndash 89
790 ndash 99
100
370 ndash 79
460 ndash 69
450 ndash 59
540 ndash 49
130 ndash 39
520 ndash 29
810 ndash 19
1 ndash 9
0
C
harg
ebac
ks R
e-pr
esen
ted
Overall $500K ndash lt$5Mlt$500K $5M ndash lt$25M $25M+
Annual Online Revenue
2006 n=1612007 n=1002008 n=120
50
53
47
36
38
48 52
46
5863
56
56
46
45
53
15
15
28
18
18
C Y B E R S O U R C E 1 0 T H A N N U A L O N L I N E F R A U D R E P O R T
Chargeback Management ToolsOf course disputing chargebacks is not an easy or cost-
free process Merchants must manage and organize all
order delivery and payment information to successfully
dispute fraudulent orders with financial institutions
Merchants are beginning to adopt automated systems
for handling this aspect of the pipeline One out of five
merchants reported using chargeback management tools
in 2008 and 37 of large merchants reported using
these tools In our 2006 survey we asked merchants to
provide estimates of how many hours it takes on average
to handle a fraud chargeback The average time spent
overall was 18 hours with a median time of 10 hours
to handle a fraud chargeback (total time consumed
for research documentation submission) The largest
merchants reported a median time of 30 minutes per fraud
chargeback Clearly fraud chargeback management is a
significant expense for merchants
ChargebacksmdashOnly Half the Problem How a fraudulent order is handled can have a significant
impact on bottom line profits Fraudulent orders are
presented to the merchant via two main routes as a
chargeback or as a direct request from a consumer
for credit (they claim fraudulent use of their account)
Although chargebacks are the most often cited metric
merchants report that chargebacks actually account for less
than half of all fraud claims This is true for all sizes of
merchants (see chart 20)
In 2007 large ($25M+ online sales) merchants reported
that 57 of their fraud was presented in the form of a
fraud-coded chargeback but in 2008 this dropped back
to 48 Considering the financial impact of both fraud
claim routes (chargebacks and credit issuancereversal)
some merchants encourage direct consumer contact
to address fraud claims and thus avoid the additional
chargeback fees levied by the merchant bankprocessor If
a consumer contacts the merchant first then the decision
is in the merchantrsquos control to either handle the dispute
directly with the consumer or to advise them to initiate a
fraud chargeback process In any event if merchants are
evaluating fraud losses solely on the basis of chargebacks
the actual rate of fraud loss the business is experiencing
may be as much as two times higher due to direct credit
issuancecharge reversal
Overall $500K ndash lt$5Mlt$500K $5M ndash lt$25M $25M+
Fraud Chargeback Re-presentment
Win RateNet Recovery Rate
Annual Online Revenues
Challenged Net Recovery
44AVERAGEWINRATE
46AVERAGEWINRATE
43AVERAGEWINRATE
54AVERAGEWINRATE
32AVERAGEWINRATE
50
28
36
23
52
38
63
35
46
19
10
0
20
30
40
50
60
70
80
90
100
(Net Recovery Rate is expressed as a of all fraud-coded chargebacks)
19
Overall $500K ndash lt$5Mlt$500K $5M ndash lt$25M $25M+
of Fraud Claims
Chargebacks vs Credit Issued by Merchant
Credits IssuedChargebacks
58
42
76
24
57
43
52
48
52
48
n=25
n=14
7
n=27
n=30
n=55
Annual Online Revenue
n=147
10
0
20
30
40
50
60
70
80
90
100
20
19
C Y B E R S O U R C E 1 0 T H A N N U A L O N L I N E F R A U D R E P O R T
19copy2009 CyberSource Corporation All rights reserved
Fraud Rate MetricsWhen monitoring the level and trend of online
fraud loss we focus on three key metrics
1) Overall revenue lost as a percent of total
online sales 2) percent of accepted orders
which turn out to be fraudulent (domestic and
international) and 3) the average value of a
fraudulent order relative to a valid order Fraud
rates vary widely by merchant and depend on a
variety of factors such as online sales volume
type of products or services sold online and
how such productsservices are delivered and
paid for It is important that merchants track
key fraud metrics over time and evaluate their
performance relative to their peer group (both
size and industry) Note this report provides
benchmarks on total fraud rates (chargebacks +
credits issued directly to consumers by merchants)
As such these metrics tend to be higher
than those reported by banks and credit card
associations which generally base reported rates
on chargeback activity only
Depending on which products or services are being sold
online fraud loss risk tolerances and order rejection
rates can vary significantly Merchants selling high
cost goods with relatively low gross margins like most
consumer electronics products tend to err on the side
of rejecting more orders to avoid expensive fraud losses
Merchants who are less subject to fraud attacks can
achieve similar fraud loss rates while rejecting
relatively few orders Over the past few years
as fraud rates have remained relatively stable
we have compiled data on fraud practices and
benchmarks by industry
Direct Revenue Loss Rates
Very large merchants typically use more tools
and have more experience and resources to
manage online fraud so their fraud rates tend
to be lower than the overall rate Revenue loss
measurement includes not only the value of
orders on which fraudulent chargebacks are
received but also the cost of any credits issued
to avoid such chargebacks Figures include both
chargebacks and credits issued directly by the
merchant in response to fraud claims
Fraudulent Order Rate for Accepted Orders
Another key metric is the number of accepted orders that
later turn out to be fraudulent Expressed as a percent of total
orders this metric is typically lower than the revenue loss
percent since the average value of fraudulent orders tends
to be greater than the average value of valid orders which
causes the fraud rate as measured by revenues to be higher
Overall 38 of merchants reported experiencing a fraudulent
order rate of 1 or more in 2008 which was the same
percent reported in 2007
20072008
Average Online Revenue Lost to Payment Fraud
(chargebacks amp fraud-related credits)
Overall $500K ndash lt$5Mlt$500K $5M ndash lt$25M $25M+
Annual Online Revenue
0
12
08
04
02
06
10
14
16
18
14 1
5 16
15
121
3
13
15
14
14
20072008
Average Accepted Orders Resulting in Fraud Losses
Overall $500K ndash lt$5Mlt$500K $5M ndash lt$25M $25M+
Annual Online Revenue
0
12
08
04
02
06
10
14
16
18
16
11
13
12
11
13
11
13
11
13
A fraud chargeback was received on the orders OR a credit was issued directly to a customerwho claims not to have placed an order
21
22
20
C Y B E R S O U R C E 1 0 T H A N N U A L O N L I N E F R A U D R E P O R T
International Orders Carry Higher Risk
Fifty-two percent of merchants surveyed accepted orders
from outside the US amp Canada in 2008 International
sales accounted for an average of 17 of total orders
for these merchants That same group reported that the
actual direct fraud rate on international orders averaged
40 or more than 36 times the overall fraud rate for
domestic online orders Though international markets
represent an attractive opportunity online merchants must
make sure that their fraud detection and management
systems are robust enough to handle the additional risk
involved Merchants who sell online outside of the US
amp Canada report that they reject international orders due
to suspicion of fraud at a rate that is over three and one
half times the US and Canadian average rate of 29
mdash rejecting approximately 1 out of every 9 international
orders received
Average Value of Fraudulent Order Higher than a Valid Order
Historically fraudulent orders tend to have higher values
on average than valid orders In 2008 the median value
of a fraudulent order was $200 compared to $130 median
value reported for valid orders This relationship of higher
fraudulent order values vs valid order value was found for
all merchant size categories as chart 24 shows Since
fraudulent orders tend to be somewhat higher in value than
valid orders merchants will tend to outsort more high value
orders for manual review and verification Large online
merchants reported that the median value of an order
flagged for manual review was $245
Valid vs Fraudulent Order Value
Valid orderFraudulent order
Median used to minimize impact of outliers
Overall $500K ndash lt$5Mlt$500K $5M ndash lt$25M $25M+
Annual Online Revenue
0
$200
$50
$100
$150
$250
$300
$350
$120
$150
$200
$150
$250
$175
$150
$100
$200
$130
24
40
10
05
20
15
25
35
45
30
00
International Fraud Rateover 3x USCanadian rate
11
40
Location of Order Origination
Within USCanadan=326
Outside USCanadan=164
Frau
d R
ate
o
f O
rder
s
23
21
C Y B E R S O U R C E 1 0 T H A N N U A L O N L I N E F R A U D R E P O R T
21copy2009 CyberSource Corporation All rights reserved
Tuning amp Management
Maintaining and Tuning Screening Rules28 of merchants say they have an automated order
screening system in place that allows business managers
to modify decision rules without assistance from internal
IT staff or external parties (up from 16 found in 2006)
The ability to adjust automated order screening systems
quickly helps manage the order review flow tailor rules
to new products and adapt to new fraud trends as they
are encountered Without this ability merchants cannot
easily minimize reject rates review costs or fraud rates
Additionally giving business managers the capability of
adjusting business rules on-the-fly reduces the costs and
burden of IT support
Global Fraud Portals Some online merchants are integrating fraud tools
and strategies via fraud management portals These
portals employ a combination of flexible rules systems
that interact with a portfolio of ldquotruth servicesrdquo around
the globe allowing business managers to set payment
type product type and market-specific screens Case
management systems are being integrated with these
portals with accompanying enhancements to streamline
workflow Global fraud portals typically include hierarchical
management as companies strive to centralize fraud
management across multiple lines of business and
geographies
Merchant Budgets for Fraud Management How much are online merchants spending to mitigate
fraud risk In both 2008 and in 2007 survey results
show that 34 of merchants spend 05 or more of
their online revenues to manage online payment fraud
while 66 spend less than 05 In 2008 across
all merchants the median ratio of fraud management
expense to sales was 022 down from 028 in 2007
although some merchants in high risk categories are
spending significantly more These spending estimates
focus on the cost of managing fraud risk (internal and
external systems and services management development
and review staffs) Direct fraud loss (chargebacks lost
goods and associated shipping costs) as well as the
opportunity cost associated with valid order rejection are
not included here (see chart 25)
Automated
Screening1
Manual
Review2
Accept
Reject3
Fraud Claim
Management4ORDER
RETAINED
REVENUE
Tuning and Management
02ndash lt050ndash lt02 05ndash lt10 10ndash lt40 40+
How Much Merchants Spend
on Fraud Management
(percent of merchants operating at defined expense level)
of Annual Online Revenues Spent to Manage Fraud(staff etc excluding fraud loss)
2007 n=972008 n=108
41 44
6
14
24
22
12 16
16
4
Median2008 = 022
2007 = 028
0
60
40
20
25
title (title)
22
C Y B E R S O U R C E 1 0 T H A N N U A L O N L I N E F R A U D R E P O R T
Budget Allocation For the past three years merchants have consistently
spent just over half their fraud management budgets on
review staff (see chart 26) The remainder is allocated
as follows 25 for third party tools or services and 24
on internally developed tools and systems
Clearly review staff costs are the dominant factor and
only 13 of merchants cite plans to increase review
staffing in 2009 Reducing the need for manual review
and increasing the efficiency and effectiveness of
reviewers is key to growing online business profits and
managing the total cost of online payment fraud One
place to start is by improving the automated detection of
risky orders so as to reduce manual order review volumes
Clearly the continued reliance on manual review we have
seen in the data over the last few years is not an optimal
long term strategy for managing online fraud As budgets
come under increasing pressure merchants will need
to redouble their efforts to automate more of the fraud
management process while keeping valid order conversion
high and fraud loss low
Base Those with 1 or more full-time manual review staff
Average Spending Allocation
for Fraud Management 2008
n=400
3rd Party
Tools
23
24
Internal
Tools amp
System
3rd Party
Tools
25
Order
Review
Staff
51
Planned Staffing Levels
Increase
13
21
Same
81
71
2009
2008
Decrease
6
8
n=238 248
26
23
C Y B E R S O U R C E 1 0 T H A N N U A L O N L I N E F R A U D R E P O R T
23copy2009 CyberSource Corporation All rights reserved
Resources amp Solutions
3 Managed Services
2 Design amp Installation
1 Systems amp Services
PAYMENT SECURITY
Order
Screening
Collection amp
Reconciliation
Global Payment
Acceptance
Processing
Management
L A S E R
BankBankTrans f e rTrans f e r
Direct
Debit
ORDER
bull Onlinebull Call Centerbull IVRbull Kioskbull POSbull ERP
With Performance
Guarantees
To find information on CyberSourcersquos industry-leading risk
management solutions self-paced webinars on decision
management and other whitepapers on electronic payment
management visit our Resource Center at
wwwcybersourcecom For sales assistance phone
1-888-330-2300 or e-mail salescybersourcecom
CyberSource Payment Management Solutions CyberSource offers a comprehensive portfolio of modular
services and tools to help your company manage your entire
payment pipeline to optimize sales results All are available
via one connection to our web-based services
Accept All Popular Payment Types in 190+
Countries
Accept payments worldwide using a merchant account from
your preferred provider or CyberSource worldwide credit
and debit cards regional cards direct debit bank
transfers electronic checks and alternative payment
types such as Bill Me Later and PayPal CyberSource
also provides professional services to help you
integrate payment with front-end and back-office
systems
Risk ManagementOrder Screening
Global Fraud Management Portal with CyberSource Intelligent
Review Technology A hosted rules and case management
system that provides on-demand access to over 150
validation tests and services across all four dimensions of
detection Detectors include multi-merchant transaction
history checks worldwide delivery address and phone
verification device fingerprinting IP geolocation purchase
velocity identity morphing and custom data from your
systems Case management system provides consolidated
data review workflow management and built-in callouts to
validation services to streamline review
Managed Services CyberSource provides client services to
help you analyze design and manage your order screening
and fraud detection processesmdasheverything from screening
strategies and risk threshold optimization analysis
to ongoing monitoring order review and chargeback
managementrecovery Our managed services include
business performance guarantees
Payer Authentication Verified by Visa MasterCard
SecureCode
Processing Management
CyberSource processes your payments in our high
availability datacenters located in the US Europe and
Japan All datacenters are certified PCI-compliant and
include sophisticated processing management logic to help
prevent payment failures and rate downgrades
Collection amp Reconciliation
A full array of online and exportable payment reporting
capability is available to streamline reconciliation activity
Further systems can be installed to automate up to 90
of the tasks associated with payment reconciliation and
chargeback re-presentment
Payment Security
Remove Payment Data From Your Network CyberSource
provides secure storage and hosted payment acceptance
services that let you process without storing or even
transmitting payment data A great way to streamline PCI
compliance and mitigate security risk
Payment System Centralization Our team of experts will help
you consolidate multiple payment systems into a single easy
to manage system Optionally CyberSource will also host
support and manage these systems in our secure datacenters
PCI Planning amp Remediation CyberSource provides PCI
compliance consulting and remediation services to help
remedy PCI issues
Professional Services
CyberSource maintains a team of experienced payment
consultants to assist with payment systems planning
system and process design and implementation and
integration Our client services team is additionally
available to help you monitor tune or fully outsource
portions of your payment operations
C Y B E R S O U R C E 1 0 T H A N N U A L O N L I N E F R A U D R E P O R T
North America
CyberSource Corporation
1295 Charleston Road
Mountain View CA 94043
T 8883302300
T 6509656000
F 6506259145
Email infocybersourcecom
Europe
CyberSource Ltd
The Waterfront
300 Thames Valley Park Drive
Thames Valley Park
Reading RG6 1PT
United Kingdom
T +44 (0) 1189294840
F +44 (0) 8704601931
Email ukcybersourcecom
UK Fraud Report wwwcybersourcecoukukfraudreport
Japan
CyberSource KK (Japan)
3-11-11 Shibuya Shibuya-ku
Tokyo 150-0002 Japan
T +81357747733
F +81357747732
Email mailcybersourcecojp
CyberSource Corporation is a leading provider of
electronic payment risk and security management
solutions CyberSource provides payment management
solutions for electronic payments processed via Web
call center kiosk mobile and POS environments
Services include hosted systems to help you manage
electronic payments as well as professional services
to help design integrate and fully manage parts or all
of your payment operations Over 245000 businesses
worldwide use CyberSource solutions including half
the companies comprising the Dow Jones Industrial
Average and leading Internet brands The company
is headquartered in Mountain View California and
has sales and service offices in Japan the United
Kingdom and other locations in the United States
For More Information
bull Call 18883302300
bull Email infocybersourcecom
bull Visit wwwcybersourcecom
Get Tailored Views of Risk Management
Pipelinetrade MetricsTo get a view crafted for your companyrsquos size and industry
please contact CyberSource at 18883302300 or online at
wwwcybersourcecomcontact_us
For additional information whitepapers and webinars
or sales assistance
bull Contact CyberSource 18883302300 or
wwwcybersourcecomcontact_us
bull Risk Management Solutions visit wwwcybersourcecom
products_and_servicesrisk_management
bull Global Payment amp Security Solutions
visit wwwcybersourcecomproducts_and_services
global_payment_services
About CyberSource
C Y B E R S O U R C E 1 0 T H A N N U A L O N L I N E F R A U D R E P O R T

7
C Y B E R S O U R C E 1 0 T H A N N U A L O N L I N E F R A U D R E P O R T
7copy2009 CyberSource Corporation All rights reserved
Fraud Detection Tools Used During Automated ScreeningWe define detection tools as those used to identify the
probability of risk associated with a transaction or to validate
the identity of the purchaser Results of tests carried out
by detection tools are then interpreted by humans or rules
systems to determine if a transaction should be accepted
rejected or reviewed A wide variety of tools are available to
help merchants evaluate incoming orders for potential fraud
Merchants handling large online order volumes typically
employ an initial automated order evaluation to determine
if an incoming order might represent a fraud risk Some
merchants will allow this initial automated screen to
cancel orders without further human intervention 46 of
all merchants cancelled some orders as a result of their
automated screening process and 58 of large merchants
indicated they cancelled some orders at this stage (see
chart 2)
In 2008 two-thirds of merchants reported using three or
more fraud detection tools for automated screening with
47 tools being the average Larger merchants dealing
with higher order volumes reported using 63 detection
tools on average
The most popular tools used to assess online fraud risk are
shown in chart 3 which shows the current and planned
adoption of different tools Note that the tool usage profile
for merchants over $25M in online sales is different than
the overall average These larger merchants generally use
tools across all four dimensions of detection and more often
use their customer history and proprietary data during the
automated order screening process They have a higher use of
company-specific risk scoring models negative and positive
lists and sophisticated order velocity monitoring tools
Overall 96 of merchants use one or more validation tools
These tools are often provided by the card associations to
help authenticate cards and card holders The tool most
often mentioned by merchants is the Address Verification
Service (AVS) which compares numeric address
data with information on file from the cardholderrsquos
card issuing bank AVS is generally available for US
cardholders and for limited numbers of cardholders
in Canada and the UK AVS is subject to a significant
rate of ldquofalse positivesrdquo which may lead to rejecting
valid orders as well as missing fraudulent orders1 If
the cardholder has a new address or a valid alternate
address (such as seasonal vacation home) this
information may not be reflected in the records of
the cardholderrsquos issuing bank so the address would
be flagged as invalid Merchants typically do not rely
solely on AVS to accept or reject an order
Card Verification Number (CVN also known as
CVV2 for Visa CVC2 for MasterCard CID for
American Express and Discover) is the second most
Stage 1 Automated Screening
46
Yes Yes35
11
54
No
11
47 58
No
42
Base Those using automated servicestechnologies
Are Inbound Orders Rejected
Based On Automated Screening
n=315 n=96
No generally all suspicious orders are out-sorted for manual reviewYes if automated tests indicate too much risk OR customer is on our negative listYes but generally ONLY if customer is on our negative list
All Merchants Merchants $25M+ Online Revenue
2
Automated
Screening1
Manual
Review2
Accept
Reject3
Fraud Claim
Management4ORDER
RETAINED
REVENUE
Tuning and Management
1CyberSource analyzed 94 million credit card transactions where AVS
was used and the final status of the transaction was known If a merchant
were to reject orders based solely on an AVS ldquono matchrdquo they would reject
57 of their orders but fail to detect 83 of the fraudulent orders This
represents an 181 false positive ratio
8
C Y B E R S O U R C E 1 0 T H A N N U A L O N L I N E F R A U D R E P O R T
commonly used detection tool The purpose of CVN in a
card-not-present transaction is to attempt to verify that the
person placing the order has the actual card in his or her
possession Requesting the card verification number during
an online purchase can add a measure of security to the
transaction However CVN numbers can be obtained by
fraudsters just as credit card numbers are obtained CVN
usage by online merchants has significantly increased in
the last five years rising from 44 in 2003 to 74 today
Large merchants were asked to identify the three most
effective tools they use To eliminate the bias that the more
commonly used tools have the potential to receive more
mentions we normalize the data by looking at the percent
of merchants using a particular tool who cite that tool as
one of their top three choices
Company specific
fraud screens
received the
highest rating as
being an effective
tool by merchants
who use this tool
Half of the 42
of large merchants
who use custom
fraud models
rated them as
one of their three
most effective
tools These fraud
screens are risk
scoring models
which are tuned
using an individual
merchantrsquos
historical data on
factors associated
with online orders
Since fraudsters
learn over time and
vary their strategies
we typically find
most risk scoring
models need
regular tuning
with new analysis
and data in order
to maximize their
effectiveness
Out-of-wallet or
in-wallet challenge systems while used by only 7 of large
merchants today was rated by 43 of these merchants
as being one of their three most effective tools The use
of challenge systems tends to be limited to merchants
who have frequent repeat purchases by customers or bill
customers on a regular schedule
Device Fingerprinting (also used by only 7 of large
merchants today) was rated by 43 of these merchants
as being one of their three most effective tools These
favorable opinions may well contribute to the very high
intention by other large online merchants to add this tool in
the next twelve months
Automated Fraud Detection Tool Current Usage and Plans
All Merchants Merchants $25M+ Online Revenue
78 11
74 14
35 9
27 18
25 12
11 7
5 6
5 6
CurrentPlanning to implement (next 12 months)
Current n=359 Future Plans n=194 Current n=101 Future Plans n=70
VALIDATION SERVICES
CVN (Card Verification Number)
Paid for public records service
Out-of-wallet or in-wallet challengeresponse
Telephone number verificationreverse lookup
Credit history check
Address Verification Service
Postal address validation services
Verified by VisaMasterCard SecureCode
87 6
80 16
39 9
19 11
31 10
21 4
3 1
7 6
47 10
38 12
28 15
27 11
18 10
20 9
SINGLE MERCHANT PURCHASE HISTORY
Fraud scoring model ndash company specific
Customer order history
Order velocity monitoring
Valid customer behavior analysis
Positive lists
Negative lists (in-house lists)
58 13
67 10
54 17
42 20
30 14
22 13
6 25
35 19
PURCHASE DEVICE TRACING
Device Fingerprinting
IP geolocation information 48 27
7 47
14 14
9 2
MULTI-MERCHANT PURCHASE HISTORY
Multi-merchant fraud models
Shared negative lists ndash shared hotlists 18 24
9 9
3
9
C Y B E R S O U R C E 1 0 T H A N N U A L O N L I N E F R A U D R E P O R T
9copy2009 CyberSource Corporation All rights reserved
Planned Automated Screening Tool Usage 2009
Device Fingerprinting Highest on ldquoPlan to Buyrdquo Lists
Merchants showed an increased intent to implement every
one of the 14 detection tools we looked at in both 2007 and
2008 Some tools showed dramatic increases in the percent
of merchants who say they intend to implement them in
2009 Four tools had 15 or more of merchants planning
to adopt them in 2009 and for three of these four tools the
plans to implement them have more than doubled over last
year These tools are Device Fingerprinting IP Geolocation
and Order Velocity Monitoring
Device Fingerprinting examines and records details about
the configuration of the device from which the order is
being placed This can aid in flagging fraud attacks where
a variety of fraudulent orders are launched from a common
device or set of devices Nearly 50 of large online
merchants indicated they were planning to add Device
Fingerprinting in the next twelve months
IP geolocation tools also showed a dramatic increase
in merchant interest This tool attempts to identify the
geographic location of the device from which an online order
was placed It provides an additional piece of information
to compare against other order information and order
acceptance rules to help assess the fraud risk of an order
In some cases only an internet service providerrsquos address is
returned so the ultimate geographic location of the device
remains unknown Fraudsters may also employ anonymizers
proxy servers to hide their true IP address and location
As in several years past card association payer
authentication services (eg Verified by Visa MasterCard
SecureCode) figure prominently in many merchantsrsquo future
plans 2008 survey results show that one out of four
merchants currently use one or more of the available payer
authentication services 18 of respondents say they are
interested in deploying these systems in the next twelve
months as a new tool to manage fraud However despite
significant interest in implementing payer authentication
systems over the past few years we have seen relatively
slow actual adoption of payer authentication since we
started tracking this tool in 2003
Implementing payer authentication should reduce exposure
to card-not-present fraud loss either by authenticating
the buyerrsquos identity or by shifting fraud liability back
to the card issuing bank (interchange incentives also
apply) Further certain card types in some countries are
beginning to require that payer authentication solutions
be used as a condition of accepting the associated cards
(eg Maestro Cards in the United Kingdom) But if
merchants have a sufficiently high direct fraud loss rate
the card association may not permit the merchant to shift
liability even if the merchant has implemented a payer
authentication system Over the next few years these
systems may help reduce the incidence of online credit
card fraud if a critical mass of consumers register their
cards and accept the new checkout procedures
Successful adoption of payer authentication will require
merchants to put procedures in place to handle customers
who have not adopted verification services or who
use cards or payment types which are not supported
International expansion and the growing popularity of
online payment types such as electronic checks PayPaltrade
Bill Me Laterreg etc drive the need for alternative fraud
management techniques
Automated DecisionRules Systems
Automated Order Screening
Automated order decisioning screening systems are now
used by 56 of merchants (up from 25 in 2005) Eight
out of ten larger online merchants use such systems These
tools help companies automate order screening by applying
a merchantrsquos business rules in the real-time evaluation of
incoming orders
Decision and rules systems automate the evaluation of test
results generated by fraud detection tools and determine
whether the transaction should be accepted rejected or
suspended for review As the number of tools used grow
it is becoming increasingly important for merchants to
employ automated systems to interpret and weigh the
multiple results for each product or transaction profile
(versus a ldquoone size fits allrdquo screen) to optimize business
results Because fraud patterns are dynamic and the
introduction of new products services or markets often
requires a unique set of acceptance rules it is imperative
that these systems also quickly adapt to the changing
environment Half of large merchants say their screening
system allows business managers to create and modify
screening rules without assistance from external experts or
internal information technology staff
Results of Automated Screening
The automated order screening process generates three
outcomes 1) order acceptance without further review 2)
orders flagged for further review and 3) automatic order
rejection 46 of merchants indicated they reject some
orders based on automated screening tests and 58 of
large merchants indicated doing so
10
C Y B E R S O U R C E 1 0 T H A N N U A L O N L I N E F R A U D R E P O R T
Orders which do not pass the automated order screening
stage typically enter a manual review queue During this
stage additional information is collected to determine if
orders should be accepted or rejected due to excessive
fraud risk
Manual review represents a critical area of profit leakage
It is expensive limits scalability and impacts customer
satisfaction For many merchants it represents half of
their fraud management budget Only 13 of merchants
say they have budget available to increase review
staff now or in the next twelve months This presents
significant challenges to profit growth since even at a
stable percent of orders sent to review the total number
of orders that must be reviewed increases in step with the
total increase of online sales
Manual Order Review RatesIn what should be a highly automated sales environment
most merchants are manually checking orders In fact
during the past six years overall 1 out of every 4 orders
transacted online have been manually reviewed (see chart
4) Over the same period merchants who conduct manual
review typically reviewed 1 out of 3 orders they received
Merchants of all sizes use manual review to manage
payment fraud Chart 5 shows smaller merchants review
a higher percentage of orders (perhaps because lower
order volumes permit such practice) but even larger
merchants review a significant percentage of online
ordersmdashand likely devote more resources to this task than
is operationally scalable
One consequence of using more fraud detection tools
during automated screening is a greater chance of one
or more flags being raised resulting in an order being
selected for manual review Adding additional tools to
detect fraud may result in downstream impacts and
costs if these tools are not carefully integrated into a
merchantrsquos review process and tuned to a merchantrsquos
specific situation
Merchants expecting increased online sales will need to
take at least one of the following actions 1) divert more
staff time to the order review process 2) increase staffing
levels 3) allow more time to process orders and ship good
ones or 4) improve accuracy of initial automated sorting
and make the subsequent review process more efficient
Review Tools amp PracticesGiven the reported limitations on hiring additional manual
review staff there is increased focus on investing in tools
and systems to increase the productivity and effectiveness
of review staff While the primary focus should be on
improving initial automated sorting accuracy to decrease
need for review attention to streamlining the review
process is also warranted
Stage 2 Manual Review
Automated
Screening1
Manual
Review2
Accept
Reject3
Fraud Claim
Management4ORDER
RETAINED
REVENUE
Tuning and Management
40
0
2004 2005 2006
Manual Review Trends
2007 2008
30
20
10
5
15
25
35
Over the past 5 years on average 1 out of 4 online orders were
manually reviewed Merchants performing manual review have
on average reviewed 1 out of every 3 orders received
35
26
Orders Reviewed by Merchants Practicing Review Orders Reviewed Overall (Net Review)
23
28
27
33
22
32
27
34
4
11
C Y B E R S O U R C E 1 0 T H A N N U A L O N L I N E F R A U D R E P O R T
11copy2009 CyberSource Corporation All rights reserved
Use of Case Management Systems
Currently 1 out of 3 merchants report having a case
management system that supports their manual review
process and staff Over half of merchants either
currently use a case management system or
plan to implement one in 2009 For large
online merchants 65 report currently using
or planning to implement a case management
system
Merchants using a case management system
are also more likely to be able to track fraud
rates on orders which have gone through
manual review 74 of merchants using case
management systems report tracking fraud
rates for manually reviewed orders vs only
42 being able to do so when not using a
case management system Surprisingly 44
of merchants performing manual order review
say they do not track the fraud rates of orders
which have been manually reviewed and 24
of large merchants say they do not have this
information Without knowing the fraud rate
on orders going through manual review and
who reviewed them it is difficult to determine
training needs or other actions to improve the
effectiveness of manual review
Tools UsedPlanned During Manual Review
While many of the tools or detector results used
during automated screening can also be used
during manual review several additional tools
and processes are employed by manual reviewers
Attempting to validate an order by contacting the
customer is standard practice for 7 out of 10
merchants and 82 of large merchants However
most organizations have policies regarding how
quickly they must clear orders through manual
review and how long they will wait for customers
to respond to requests for additional information
Most merchants try to clear orders through manual
review in one business day and say they will not
wait more than three business days for a customer
to respond to a request for more information (see
charts 7 and 8)
Another practice used only in manual review is to
contact the card issuer This action is taken by
almost half of merchants overall and 60 of large
merchants Telephone number validation reverse
lookup is the third most popular tool with 56 of
merchants using it during manual review vs 25
during automated screening
In 2008 two-thirds of merchants reported using
four or more fraud detection tools for manual review with
49 tools being the average Larger merchants reported
using 61 detection tools on average
35
15
5
25
30
10
20
40
45
50
55
0
Average of Orders Manually Reviewed(for merchants engaged in review)
200620072008
lt$500K
36
43
51
$500K ndash lt$5M
36
45
35
$5M ndash lt$25M
25
40
34
$25M+
15
14
15
o
f O
rder
s
Annual Online Revenues
5
Currently usePlan to implement in 2009Do not use or plan to implement
Use or Plan to Implement Case Management System
to Support Manual Order Review Process
18
4933
n=227
All Merchants
35
39
26
n=84
Merchants $25M+
Base Those conducting manual review
6
12
C Y B E R S O U R C E 1 0 T H A N N U A L O N L I N E F R A U D R E P O R T
35
15
5
25
50
30
10
20
40
45
0
Time Allowed for Customer Response
Source 2008 CyberSource Fraud Report
Half day
or less
10
Same
business
day
10
Next
business
day
14
2-3
business
days
37
4-5
business
days
11
6 or more
business
days
19
8
Fraud Detection Tool Usage During Manual Review
All Merchants Merchants $25M+ Online Revenue
69 11
56 15
49 10
45 12
23 14
9 7
currently using planning to begin use (in 2009)
Current n=265 Future Plans n=109 Current n=89 Future Plans n=43
VALIDATION SERVICES
Telephone number verificationreverse lookup
Credit history check
Paid for public records service
Contact customer to verify order
Contact card issuerAmex CVP
Postal address validation services
82 5
74 5
60 14
46 7
45 14
6 12
72 8
49 14
35 13
22 17
SINGLE MERCHANT PURCHASE HISTORY
Positive lists
Customer order history
Valid customer website behavior analysis
Negative lists (in-house lists)
83 5
69 12
37 14
34 30
40 20
PURCHASE DEVICE TRACING
IP geolocation information 55 28
11 28
MULTI-MERCHANT PURCHASE HISTORY
Shared negative lists ndash shared hotlists 16 35
9
35
15
5
25
30
10
20
40
45
50
0
Time to Clear Orders in Manual Review (2008)
Over two-thirds of merchants clear
orders through manual review
in one business day72
1 hour
or less
26
2-4
hours
10
Same
business
day
36
Next
business
day
18
2-3
business
days
8
4-5
business
days
1
6 or more
business
days
1
n=259
7
13
C Y B E R S O U R C E 1 0 T H A N N U A L O N L I N E F R A U D R E P O R T
13copy2009 CyberSource Corporation All rights reserved
The most popular tools currently used in the manual
review process are shown in chart 9 including the
percent of merchants planning to add each tool in 2009
Review Operations Efficiency
Reviewer Efficiency
The average number of orders a reviewer processed in a
day ranged from 22 for small merchants to 124 for large
(see chart 10) Large merchants who typically have case
management systems achieve a 5X higher throughput
per reviewer in the manual review stage possibly due to
greater use of review systems and detection tools during
manual review On average reviewers spent 7 minutes
reviewing each order in 2008
Time to Ramp New Staff
New to this yearrsquos surveymdashmerchants were asked how
long it takes for an order reviewer to attain acceptable
proficiency in his or her job While the learning curve
varies by type and size of online merchant the median
time reported was 4 weeks Larger merchants reported a
median of 6 weeks for a reviewer to achieve acceptable
proficiency Chart 11 shows the distribution of learning
times reported
Staff Tenure
Given the cost and time required to recruit and train
new staff merchants need to focus on staff retention
Fraud rates or order rejection rates can increase if highly
experienced review staff leave an organization and are
either not replaced or replaced by less experienced
reviewers 85 of review staff have been on the job
for one year or more Merchants report on average that
15 of their review staff were new in 2008 For large
merchants 24 of their staff were new in 2008 (see
chart 12) Efficient training and methods to ensure
consistent and accurate disposition of orders will be key
as merchants seek to optimize operating efficiency
Final Order DispositionAutomated screening and manual order review ultimately
result in order acceptance or rejection A relatively high
percentage of orders manually reviewed are ultimately
accepted (see next section)mdashhighlighting the need for
merchants to improve automated screening accuracy and
reduce the need for review A look at order reject and
acceptance rates follows in Stage 3 of the pipeline review
Overall $500K ndash lt$5Mlt$500K $5M ndash lt$25M $25M+
Average Orders Reviewed Per DayReviewer(by merchant size)
n=185
124
46
2322
68
10
Median of Weeks
4
52
Number of Weeks Required to Train New Reviewer
lt1
3
1
11
2
10
3
11
4
21
5-9
28
10-14
11
15+
5
n=159
11
Overall $500K ndash lt$5Mlt$500K $5M ndash lt$25M $25M+
of Review Staff New in 2008
n=206
24
1413
7
15
12
14
C Y B E R S O U R C E 1 0 T H A N N U A L O N L I N E F R A U D R E P O R T
Post-Review Order Acceptance RatesMerchants who manually review orders indicated they
ultimately accepted nearly frac34 of the orders they manually
reviewed (see chart 13) This was similar to the
proportion reported in 2007 50 of merchants report
they accept 90 or more of orders they manually review
These merchants are incurring significant expense
to find the 10 of the review queue they believe to be
too risky to accept Clearly most merchants require better
methods to determine which orders are to be outsorted for
manual review so only truly suspicious orders receive
human attention
Stage 3 Order Dispositioning (AcceptReject)
Automated
Screening1
Manual
Review2
Accept
Reject3
Fraud Claim
Management4ORDER
RETAINED
REVENUE
Tuning and Management
of Merchants Reporting This Level
of Post-Review Acceptance
1380 ndash 89
4490 ndash 99
6100
970 ndash 79
360 ndash 69
750 ndash 59
140 ndash 49
330 ndash 39
420 ndash 29
510 ndash 19
51 ndash 9
20
50 accept 90+
Post-Review Acceptance Trends
70
30
10
50
100
60
20
40
80
90
0
Most orders that enter manual review are accepted
2003
66
2004
71
2005
69
2006
66
2007
75
2008
73
of Orders Accepted in Review
13
15
C Y B E R S O U R C E 1 0 T H A N N U A L O N L I N E F R A U D R E P O R T
15copy2009 CyberSource Corporation All rights reserved
Overall Order Rejection RatesOrder reject rates can reflect true fraud
risk or signal ldquoprofit leaksrdquo in terms of
valid order rejection or unnecessarily
high rates of manual review In 2008 for
the first time in several years merchants
participating in the survey reported a
significant drop in their order rejection
rates from 42 in 2007 to 29 (see
chart 14)
Order rejection rates dropped in 2008 for
almost every size of merchant (see chart
15) except the very smallest and for
every industry segment (see chart 16)
It is likely that as online sales growth
slows and merchants seek to sustain
revenue levels merchants will look for
ways to accept more orders and reduce
orders rejected due to suspicion of fraud
In 2008 merchants were able to successfully reduce order
rejection rates while holding fraud rates stable It remains
to be seen if order rejection rates can be reduced further
in 2009 without an increase in fraud rates or manual
order review
Order rejection rates also vary by type of product and
merchant profile Chart 16 shows that segments which
have high cost of goods sold andor lower gross margins
tend to have higher order rejection rates Each fraud loss
in this arena has a large negative profit impact Consumer
electronics and jewelryapparel are two examples of online
segments that tend to have higher-than-average order
rejection rates
Yet even within similar groups of online merchants we
see that some merchants achieve low order rejection rates
while still keeping fraudulent order rates under control
Examining the large consumer electronics merchants in
the sample we find that half of these merchants report
35
15
05
25
50
30
10
20
40
45
0
Order Rejection Trends
2005
39
2006
41
2007
42
2008
29
14
Average Orders Rejected Due to Suspicion of Fraud
2007 n=2392008 n=326
Overall $500K ndash lt$5Mlt$500K $5M ndash lt$25M $25M+0
6
4
2
1
3
5
7
8
9
10
45
26
43
64
24
39
27
262
9
42
Order Rejection Rates by Selected Online Segment20072008
n=23
9
n=32
6
n=64
n=95
n=63
n=62
n=35
n=57
n=62
n=85
n=62
n=85
Overall Media amp
Entertainment
Digital Goods
ServicesApparel
Jewelry
Consumer
Electronics
49
34
32
56
42
56
32
42
29
42
Household amp
General Merchandise
22
31
15
16
16
C Y B E R S O U R C E 1 0 T H A N N U A L O N L I N E F R A U D R E P O R T
order rejection rates of 2 or less while maintaining
fraudulent order rates at or even below the average for
their segment
International Orders RiskierMerchants consistently report a much higher level of
order rejection on international orders due to suspicion
of payment fraud In 2008 merchants report their
rejection rate on these orders is over three and one half
times that of domestic orders as shown in chart 17
The actual fraud rate experienced on international orders
supports this cautious approach as merchants report the
fraud risk on international orders is also over three and
one half times that of domestic orders
Order Rejection Trends
of total USCanadian orders rejected of international orders rejected
Historically international order rejection rates
average 32x higher than USCanadian rates
2005 20072006 2008
6
4
2
1
3
5
7
8
9
12
11
10
13
14
42
11
11
29
13
41
12
39
0
15
17
17
C Y B E R S O U R C E 1 0 T H A N N U A L O N L I N E F R A U D R E P O R T
17copy2009 CyberSource Corporation All rights reserved
Fighting ChargebacksThis yearrsquos survey once again examined online merchantsrsquo
practices associated with reviewing and contesting
chargebacks (ldquore-presentmentrdquo) Over the past four years
the share of fraud-coded chargebacks merchants contest
has averaged 43 to 53 with the 2008 average at
50 Medium and large merchants report contesting 52
and 46 respectively of their fraud-coded chargebacks
in 2008 However when we look at the distribution of
merchantsrsquo answers to this question we find that over one
third of merchants are disputing 90 or more of their
fraud chagebacks while three out of ten merchants are
disputing less than 10 of their fraud chargebacks (see
chart 18)
Merchants report that they win on average 44 of the
chargebacks they dispute which is very similar to the 42
win rate reported in 2006 and 40 in 2007 Simply using
the average percent of chargebacks that are disputed (50)
times the average win rate of 44 results in a net recovery
rate of 22 (meaning 22 of all fraud-coded chargebacks
are recovered) However given the wide disparity in the
chargeback re-presentment rate when these are calculated
on a merchant-by-merchant basis and then averaged the
re-presentment win rate rises to 28 (see chart 19 on
next page) the same recovery rate that was found in 2007
Therefore disputing most fraud chargebacks and having
an efficient re-presentment process can help enhance
profitability and reduce fraud loss
Stage 4 Fraud Claim Management
Automated
Screening1
Manual
Review2
Accept
Reject3
Fraud Claim
Management4ORDER
RETAINED
REVENUE
Tuning and Management
Average Total Fraud-Coded
Chargebacks Re-presented of Merchants Reporting
this Re-presentment Rate
480 ndash 89
790 ndash 99
100
370 ndash 79
460 ndash 69
450 ndash 59
540 ndash 49
130 ndash 39
520 ndash 29
810 ndash 19
1 ndash 9
0
C
harg
ebac
ks R
e-pr
esen
ted
Overall $500K ndash lt$5Mlt$500K $5M ndash lt$25M $25M+
Annual Online Revenue
2006 n=1612007 n=1002008 n=120
50
53
47
36
38
48 52
46
5863
56
56
46
45
53
15
15
28
18
18
C Y B E R S O U R C E 1 0 T H A N N U A L O N L I N E F R A U D R E P O R T
Chargeback Management ToolsOf course disputing chargebacks is not an easy or cost-
free process Merchants must manage and organize all
order delivery and payment information to successfully
dispute fraudulent orders with financial institutions
Merchants are beginning to adopt automated systems
for handling this aspect of the pipeline One out of five
merchants reported using chargeback management tools
in 2008 and 37 of large merchants reported using
these tools In our 2006 survey we asked merchants to
provide estimates of how many hours it takes on average
to handle a fraud chargeback The average time spent
overall was 18 hours with a median time of 10 hours
to handle a fraud chargeback (total time consumed
for research documentation submission) The largest
merchants reported a median time of 30 minutes per fraud
chargeback Clearly fraud chargeback management is a
significant expense for merchants
ChargebacksmdashOnly Half the Problem How a fraudulent order is handled can have a significant
impact on bottom line profits Fraudulent orders are
presented to the merchant via two main routes as a
chargeback or as a direct request from a consumer
for credit (they claim fraudulent use of their account)
Although chargebacks are the most often cited metric
merchants report that chargebacks actually account for less
than half of all fraud claims This is true for all sizes of
merchants (see chart 20)
In 2007 large ($25M+ online sales) merchants reported
that 57 of their fraud was presented in the form of a
fraud-coded chargeback but in 2008 this dropped back
to 48 Considering the financial impact of both fraud
claim routes (chargebacks and credit issuancereversal)
some merchants encourage direct consumer contact
to address fraud claims and thus avoid the additional
chargeback fees levied by the merchant bankprocessor If
a consumer contacts the merchant first then the decision
is in the merchantrsquos control to either handle the dispute
directly with the consumer or to advise them to initiate a
fraud chargeback process In any event if merchants are
evaluating fraud losses solely on the basis of chargebacks
the actual rate of fraud loss the business is experiencing
may be as much as two times higher due to direct credit
issuancecharge reversal
Overall $500K ndash lt$5Mlt$500K $5M ndash lt$25M $25M+
Fraud Chargeback Re-presentment
Win RateNet Recovery Rate
Annual Online Revenues
Challenged Net Recovery
44AVERAGEWINRATE
46AVERAGEWINRATE
43AVERAGEWINRATE
54AVERAGEWINRATE
32AVERAGEWINRATE
50
28
36
23
52
38
63
35
46
19
10
0
20
30
40
50
60
70
80
90
100
(Net Recovery Rate is expressed as a of all fraud-coded chargebacks)
19
Overall $500K ndash lt$5Mlt$500K $5M ndash lt$25M $25M+
of Fraud Claims
Chargebacks vs Credit Issued by Merchant
Credits IssuedChargebacks
58
42
76
24
57
43
52
48
52
48
n=25
n=14
7
n=27
n=30
n=55
Annual Online Revenue
n=147
10
0
20
30
40
50
60
70
80
90
100
20
19
C Y B E R S O U R C E 1 0 T H A N N U A L O N L I N E F R A U D R E P O R T
19copy2009 CyberSource Corporation All rights reserved
Fraud Rate MetricsWhen monitoring the level and trend of online
fraud loss we focus on three key metrics
1) Overall revenue lost as a percent of total
online sales 2) percent of accepted orders
which turn out to be fraudulent (domestic and
international) and 3) the average value of a
fraudulent order relative to a valid order Fraud
rates vary widely by merchant and depend on a
variety of factors such as online sales volume
type of products or services sold online and
how such productsservices are delivered and
paid for It is important that merchants track
key fraud metrics over time and evaluate their
performance relative to their peer group (both
size and industry) Note this report provides
benchmarks on total fraud rates (chargebacks +
credits issued directly to consumers by merchants)
As such these metrics tend to be higher
than those reported by banks and credit card
associations which generally base reported rates
on chargeback activity only
Depending on which products or services are being sold
online fraud loss risk tolerances and order rejection
rates can vary significantly Merchants selling high
cost goods with relatively low gross margins like most
consumer electronics products tend to err on the side
of rejecting more orders to avoid expensive fraud losses
Merchants who are less subject to fraud attacks can
achieve similar fraud loss rates while rejecting
relatively few orders Over the past few years
as fraud rates have remained relatively stable
we have compiled data on fraud practices and
benchmarks by industry
Direct Revenue Loss Rates
Very large merchants typically use more tools
and have more experience and resources to
manage online fraud so their fraud rates tend
to be lower than the overall rate Revenue loss
measurement includes not only the value of
orders on which fraudulent chargebacks are
received but also the cost of any credits issued
to avoid such chargebacks Figures include both
chargebacks and credits issued directly by the
merchant in response to fraud claims
Fraudulent Order Rate for Accepted Orders
Another key metric is the number of accepted orders that
later turn out to be fraudulent Expressed as a percent of total
orders this metric is typically lower than the revenue loss
percent since the average value of fraudulent orders tends
to be greater than the average value of valid orders which
causes the fraud rate as measured by revenues to be higher
Overall 38 of merchants reported experiencing a fraudulent
order rate of 1 or more in 2008 which was the same
percent reported in 2007
20072008
Average Online Revenue Lost to Payment Fraud
(chargebacks amp fraud-related credits)
Overall $500K ndash lt$5Mlt$500K $5M ndash lt$25M $25M+
Annual Online Revenue
0
12
08
04
02
06
10
14
16
18
14 1
5 16
15
121
3
13
15
14
14
20072008
Average Accepted Orders Resulting in Fraud Losses
Overall $500K ndash lt$5Mlt$500K $5M ndash lt$25M $25M+
Annual Online Revenue
0
12
08
04
02
06
10
14
16
18
16
11
13
12
11
13
11
13
11
13
A fraud chargeback was received on the orders OR a credit was issued directly to a customerwho claims not to have placed an order
21
22
20
C Y B E R S O U R C E 1 0 T H A N N U A L O N L I N E F R A U D R E P O R T
International Orders Carry Higher Risk
Fifty-two percent of merchants surveyed accepted orders
from outside the US amp Canada in 2008 International
sales accounted for an average of 17 of total orders
for these merchants That same group reported that the
actual direct fraud rate on international orders averaged
40 or more than 36 times the overall fraud rate for
domestic online orders Though international markets
represent an attractive opportunity online merchants must
make sure that their fraud detection and management
systems are robust enough to handle the additional risk
involved Merchants who sell online outside of the US
amp Canada report that they reject international orders due
to suspicion of fraud at a rate that is over three and one
half times the US and Canadian average rate of 29
mdash rejecting approximately 1 out of every 9 international
orders received
Average Value of Fraudulent Order Higher than a Valid Order
Historically fraudulent orders tend to have higher values
on average than valid orders In 2008 the median value
of a fraudulent order was $200 compared to $130 median
value reported for valid orders This relationship of higher
fraudulent order values vs valid order value was found for
all merchant size categories as chart 24 shows Since
fraudulent orders tend to be somewhat higher in value than
valid orders merchants will tend to outsort more high value
orders for manual review and verification Large online
merchants reported that the median value of an order
flagged for manual review was $245
Valid vs Fraudulent Order Value
Valid orderFraudulent order
Median used to minimize impact of outliers
Overall $500K ndash lt$5Mlt$500K $5M ndash lt$25M $25M+
Annual Online Revenue
0
$200
$50
$100
$150
$250
$300
$350
$120
$150
$200
$150
$250
$175
$150
$100
$200
$130
24
40
10
05
20
15
25
35
45
30
00
International Fraud Rateover 3x USCanadian rate
11
40
Location of Order Origination
Within USCanadan=326
Outside USCanadan=164
Frau
d R
ate
o
f O
rder
s
23
21
C Y B E R S O U R C E 1 0 T H A N N U A L O N L I N E F R A U D R E P O R T
21copy2009 CyberSource Corporation All rights reserved
Tuning amp Management
Maintaining and Tuning Screening Rules28 of merchants say they have an automated order
screening system in place that allows business managers
to modify decision rules without assistance from internal
IT staff or external parties (up from 16 found in 2006)
The ability to adjust automated order screening systems
quickly helps manage the order review flow tailor rules
to new products and adapt to new fraud trends as they
are encountered Without this ability merchants cannot
easily minimize reject rates review costs or fraud rates
Additionally giving business managers the capability of
adjusting business rules on-the-fly reduces the costs and
burden of IT support
Global Fraud Portals Some online merchants are integrating fraud tools
and strategies via fraud management portals These
portals employ a combination of flexible rules systems
that interact with a portfolio of ldquotruth servicesrdquo around
the globe allowing business managers to set payment
type product type and market-specific screens Case
management systems are being integrated with these
portals with accompanying enhancements to streamline
workflow Global fraud portals typically include hierarchical
management as companies strive to centralize fraud
management across multiple lines of business and
geographies
Merchant Budgets for Fraud Management How much are online merchants spending to mitigate
fraud risk In both 2008 and in 2007 survey results
show that 34 of merchants spend 05 or more of
their online revenues to manage online payment fraud
while 66 spend less than 05 In 2008 across
all merchants the median ratio of fraud management
expense to sales was 022 down from 028 in 2007
although some merchants in high risk categories are
spending significantly more These spending estimates
focus on the cost of managing fraud risk (internal and
external systems and services management development
and review staffs) Direct fraud loss (chargebacks lost
goods and associated shipping costs) as well as the
opportunity cost associated with valid order rejection are
not included here (see chart 25)
Automated
Screening1
Manual
Review2
Accept
Reject3
Fraud Claim
Management4ORDER
RETAINED
REVENUE
Tuning and Management
02ndash lt050ndash lt02 05ndash lt10 10ndash lt40 40+
How Much Merchants Spend
on Fraud Management
(percent of merchants operating at defined expense level)
of Annual Online Revenues Spent to Manage Fraud(staff etc excluding fraud loss)
2007 n=972008 n=108
41 44
6
14
24
22
12 16
16
4
Median2008 = 022
2007 = 028
0
60
40
20
25
title (title)
22
C Y B E R S O U R C E 1 0 T H A N N U A L O N L I N E F R A U D R E P O R T
Budget Allocation For the past three years merchants have consistently
spent just over half their fraud management budgets on
review staff (see chart 26) The remainder is allocated
as follows 25 for third party tools or services and 24
on internally developed tools and systems
Clearly review staff costs are the dominant factor and
only 13 of merchants cite plans to increase review
staffing in 2009 Reducing the need for manual review
and increasing the efficiency and effectiveness of
reviewers is key to growing online business profits and
managing the total cost of online payment fraud One
place to start is by improving the automated detection of
risky orders so as to reduce manual order review volumes
Clearly the continued reliance on manual review we have
seen in the data over the last few years is not an optimal
long term strategy for managing online fraud As budgets
come under increasing pressure merchants will need
to redouble their efforts to automate more of the fraud
management process while keeping valid order conversion
high and fraud loss low
Base Those with 1 or more full-time manual review staff
Average Spending Allocation
for Fraud Management 2008
n=400
3rd Party
Tools
23
24
Internal
Tools amp
System
3rd Party
Tools
25
Order
Review
Staff
51
Planned Staffing Levels
Increase
13
21
Same
81
71
2009
2008
Decrease
6
8
n=238 248
26
23
C Y B E R S O U R C E 1 0 T H A N N U A L O N L I N E F R A U D R E P O R T
23copy2009 CyberSource Corporation All rights reserved
Resources amp Solutions
3 Managed Services
2 Design amp Installation
1 Systems amp Services
PAYMENT SECURITY
Order
Screening
Collection amp
Reconciliation
Global Payment
Acceptance
Processing
Management
L A S E R
BankBankTrans f e rTrans f e r
Direct
Debit
ORDER
bull Onlinebull Call Centerbull IVRbull Kioskbull POSbull ERP
With Performance
Guarantees
To find information on CyberSourcersquos industry-leading risk
management solutions self-paced webinars on decision
management and other whitepapers on electronic payment
management visit our Resource Center at
wwwcybersourcecom For sales assistance phone
1-888-330-2300 or e-mail salescybersourcecom
CyberSource Payment Management Solutions CyberSource offers a comprehensive portfolio of modular
services and tools to help your company manage your entire
payment pipeline to optimize sales results All are available
via one connection to our web-based services
Accept All Popular Payment Types in 190+
Countries
Accept payments worldwide using a merchant account from
your preferred provider or CyberSource worldwide credit
and debit cards regional cards direct debit bank
transfers electronic checks and alternative payment
types such as Bill Me Later and PayPal CyberSource
also provides professional services to help you
integrate payment with front-end and back-office
systems
Risk ManagementOrder Screening
Global Fraud Management Portal with CyberSource Intelligent
Review Technology A hosted rules and case management
system that provides on-demand access to over 150
validation tests and services across all four dimensions of
detection Detectors include multi-merchant transaction
history checks worldwide delivery address and phone
verification device fingerprinting IP geolocation purchase
velocity identity morphing and custom data from your
systems Case management system provides consolidated
data review workflow management and built-in callouts to
validation services to streamline review
Managed Services CyberSource provides client services to
help you analyze design and manage your order screening
and fraud detection processesmdasheverything from screening
strategies and risk threshold optimization analysis
to ongoing monitoring order review and chargeback
managementrecovery Our managed services include
business performance guarantees
Payer Authentication Verified by Visa MasterCard
SecureCode
Processing Management
CyberSource processes your payments in our high
availability datacenters located in the US Europe and
Japan All datacenters are certified PCI-compliant and
include sophisticated processing management logic to help
prevent payment failures and rate downgrades
Collection amp Reconciliation
A full array of online and exportable payment reporting
capability is available to streamline reconciliation activity
Further systems can be installed to automate up to 90
of the tasks associated with payment reconciliation and
chargeback re-presentment
Payment Security
Remove Payment Data From Your Network CyberSource
provides secure storage and hosted payment acceptance
services that let you process without storing or even
transmitting payment data A great way to streamline PCI
compliance and mitigate security risk
Payment System Centralization Our team of experts will help
you consolidate multiple payment systems into a single easy
to manage system Optionally CyberSource will also host
support and manage these systems in our secure datacenters
PCI Planning amp Remediation CyberSource provides PCI
compliance consulting and remediation services to help
remedy PCI issues
Professional Services
CyberSource maintains a team of experienced payment
consultants to assist with payment systems planning
system and process design and implementation and
integration Our client services team is additionally
available to help you monitor tune or fully outsource
portions of your payment operations
C Y B E R S O U R C E 1 0 T H A N N U A L O N L I N E F R A U D R E P O R T
North America
CyberSource Corporation
1295 Charleston Road
Mountain View CA 94043
T 8883302300
T 6509656000
F 6506259145
Email infocybersourcecom
Europe
CyberSource Ltd
The Waterfront
300 Thames Valley Park Drive
Thames Valley Park
Reading RG6 1PT
United Kingdom
T +44 (0) 1189294840
F +44 (0) 8704601931
Email ukcybersourcecom
UK Fraud Report wwwcybersourcecoukukfraudreport
Japan
CyberSource KK (Japan)
3-11-11 Shibuya Shibuya-ku
Tokyo 150-0002 Japan
T +81357747733
F +81357747732
Email mailcybersourcecojp
CyberSource Corporation is a leading provider of
electronic payment risk and security management
solutions CyberSource provides payment management
solutions for electronic payments processed via Web
call center kiosk mobile and POS environments
Services include hosted systems to help you manage
electronic payments as well as professional services
to help design integrate and fully manage parts or all
of your payment operations Over 245000 businesses
worldwide use CyberSource solutions including half
the companies comprising the Dow Jones Industrial
Average and leading Internet brands The company
is headquartered in Mountain View California and
has sales and service offices in Japan the United
Kingdom and other locations in the United States
For More Information
bull Call 18883302300
bull Email infocybersourcecom
bull Visit wwwcybersourcecom
Get Tailored Views of Risk Management
Pipelinetrade MetricsTo get a view crafted for your companyrsquos size and industry
please contact CyberSource at 18883302300 or online at
wwwcybersourcecomcontact_us
For additional information whitepapers and webinars
or sales assistance
bull Contact CyberSource 18883302300 or
wwwcybersourcecomcontact_us
bull Risk Management Solutions visit wwwcybersourcecom
products_and_servicesrisk_management
bull Global Payment amp Security Solutions
visit wwwcybersourcecomproducts_and_services
global_payment_services
About CyberSource
C Y B E R S O U R C E 1 0 T H A N N U A L O N L I N E F R A U D R E P O R T

8
C Y B E R S O U R C E 1 0 T H A N N U A L O N L I N E F R A U D R E P O R T
commonly used detection tool The purpose of CVN in a
card-not-present transaction is to attempt to verify that the
person placing the order has the actual card in his or her
possession Requesting the card verification number during
an online purchase can add a measure of security to the
transaction However CVN numbers can be obtained by
fraudsters just as credit card numbers are obtained CVN
usage by online merchants has significantly increased in
the last five years rising from 44 in 2003 to 74 today
Large merchants were asked to identify the three most
effective tools they use To eliminate the bias that the more
commonly used tools have the potential to receive more
mentions we normalize the data by looking at the percent
of merchants using a particular tool who cite that tool as
one of their top three choices
Company specific
fraud screens
received the
highest rating as
being an effective
tool by merchants
who use this tool
Half of the 42
of large merchants
who use custom
fraud models
rated them as
one of their three
most effective
tools These fraud
screens are risk
scoring models
which are tuned
using an individual
merchantrsquos
historical data on
factors associated
with online orders
Since fraudsters
learn over time and
vary their strategies
we typically find
most risk scoring
models need
regular tuning
with new analysis
and data in order
to maximize their
effectiveness
Out-of-wallet or
in-wallet challenge systems while used by only 7 of large
merchants today was rated by 43 of these merchants
as being one of their three most effective tools The use
of challenge systems tends to be limited to merchants
who have frequent repeat purchases by customers or bill
customers on a regular schedule
Device Fingerprinting (also used by only 7 of large
merchants today) was rated by 43 of these merchants
as being one of their three most effective tools These
favorable opinions may well contribute to the very high
intention by other large online merchants to add this tool in
the next twelve months
Automated Fraud Detection Tool Current Usage and Plans
All Merchants Merchants $25M+ Online Revenue
78 11
74 14
35 9
27 18
25 12
11 7
5 6
5 6
CurrentPlanning to implement (next 12 months)
Current n=359 Future Plans n=194 Current n=101 Future Plans n=70
VALIDATION SERVICES
CVN (Card Verification Number)
Paid for public records service
Out-of-wallet or in-wallet challengeresponse
Telephone number verificationreverse lookup
Credit history check
Address Verification Service
Postal address validation services
Verified by VisaMasterCard SecureCode
87 6
80 16
39 9
19 11
31 10
21 4
3 1
7 6
47 10
38 12
28 15
27 11
18 10
20 9
SINGLE MERCHANT PURCHASE HISTORY
Fraud scoring model ndash company specific
Customer order history
Order velocity monitoring
Valid customer behavior analysis
Positive lists
Negative lists (in-house lists)
58 13
67 10
54 17
42 20
30 14
22 13
6 25
35 19
PURCHASE DEVICE TRACING
Device Fingerprinting
IP geolocation information 48 27
7 47
14 14
9 2
MULTI-MERCHANT PURCHASE HISTORY
Multi-merchant fraud models
Shared negative lists ndash shared hotlists 18 24
9 9
3
9
C Y B E R S O U R C E 1 0 T H A N N U A L O N L I N E F R A U D R E P O R T
9copy2009 CyberSource Corporation All rights reserved
Planned Automated Screening Tool Usage 2009
Device Fingerprinting Highest on ldquoPlan to Buyrdquo Lists
Merchants showed an increased intent to implement every
one of the 14 detection tools we looked at in both 2007 and
2008 Some tools showed dramatic increases in the percent
of merchants who say they intend to implement them in
2009 Four tools had 15 or more of merchants planning
to adopt them in 2009 and for three of these four tools the
plans to implement them have more than doubled over last
year These tools are Device Fingerprinting IP Geolocation
and Order Velocity Monitoring
Device Fingerprinting examines and records details about
the configuration of the device from which the order is
being placed This can aid in flagging fraud attacks where
a variety of fraudulent orders are launched from a common
device or set of devices Nearly 50 of large online
merchants indicated they were planning to add Device
Fingerprinting in the next twelve months
IP geolocation tools also showed a dramatic increase
in merchant interest This tool attempts to identify the
geographic location of the device from which an online order
was placed It provides an additional piece of information
to compare against other order information and order
acceptance rules to help assess the fraud risk of an order
In some cases only an internet service providerrsquos address is
returned so the ultimate geographic location of the device
remains unknown Fraudsters may also employ anonymizers
proxy servers to hide their true IP address and location
As in several years past card association payer
authentication services (eg Verified by Visa MasterCard
SecureCode) figure prominently in many merchantsrsquo future
plans 2008 survey results show that one out of four
merchants currently use one or more of the available payer
authentication services 18 of respondents say they are
interested in deploying these systems in the next twelve
months as a new tool to manage fraud However despite
significant interest in implementing payer authentication
systems over the past few years we have seen relatively
slow actual adoption of payer authentication since we
started tracking this tool in 2003
Implementing payer authentication should reduce exposure
to card-not-present fraud loss either by authenticating
the buyerrsquos identity or by shifting fraud liability back
to the card issuing bank (interchange incentives also
apply) Further certain card types in some countries are
beginning to require that payer authentication solutions
be used as a condition of accepting the associated cards
(eg Maestro Cards in the United Kingdom) But if
merchants have a sufficiently high direct fraud loss rate
the card association may not permit the merchant to shift
liability even if the merchant has implemented a payer
authentication system Over the next few years these
systems may help reduce the incidence of online credit
card fraud if a critical mass of consumers register their
cards and accept the new checkout procedures
Successful adoption of payer authentication will require
merchants to put procedures in place to handle customers
who have not adopted verification services or who
use cards or payment types which are not supported
International expansion and the growing popularity of
online payment types such as electronic checks PayPaltrade
Bill Me Laterreg etc drive the need for alternative fraud
management techniques
Automated DecisionRules Systems
Automated Order Screening
Automated order decisioning screening systems are now
used by 56 of merchants (up from 25 in 2005) Eight
out of ten larger online merchants use such systems These
tools help companies automate order screening by applying
a merchantrsquos business rules in the real-time evaluation of
incoming orders
Decision and rules systems automate the evaluation of test
results generated by fraud detection tools and determine
whether the transaction should be accepted rejected or
suspended for review As the number of tools used grow
it is becoming increasingly important for merchants to
employ automated systems to interpret and weigh the
multiple results for each product or transaction profile
(versus a ldquoone size fits allrdquo screen) to optimize business
results Because fraud patterns are dynamic and the
introduction of new products services or markets often
requires a unique set of acceptance rules it is imperative
that these systems also quickly adapt to the changing
environment Half of large merchants say their screening
system allows business managers to create and modify
screening rules without assistance from external experts or
internal information technology staff
Results of Automated Screening
The automated order screening process generates three
outcomes 1) order acceptance without further review 2)
orders flagged for further review and 3) automatic order
rejection 46 of merchants indicated they reject some
orders based on automated screening tests and 58 of
large merchants indicated doing so
10
C Y B E R S O U R C E 1 0 T H A N N U A L O N L I N E F R A U D R E P O R T
Orders which do not pass the automated order screening
stage typically enter a manual review queue During this
stage additional information is collected to determine if
orders should be accepted or rejected due to excessive
fraud risk
Manual review represents a critical area of profit leakage
It is expensive limits scalability and impacts customer
satisfaction For many merchants it represents half of
their fraud management budget Only 13 of merchants
say they have budget available to increase review
staff now or in the next twelve months This presents
significant challenges to profit growth since even at a
stable percent of orders sent to review the total number
of orders that must be reviewed increases in step with the
total increase of online sales
Manual Order Review RatesIn what should be a highly automated sales environment
most merchants are manually checking orders In fact
during the past six years overall 1 out of every 4 orders
transacted online have been manually reviewed (see chart
4) Over the same period merchants who conduct manual
review typically reviewed 1 out of 3 orders they received
Merchants of all sizes use manual review to manage
payment fraud Chart 5 shows smaller merchants review
a higher percentage of orders (perhaps because lower
order volumes permit such practice) but even larger
merchants review a significant percentage of online
ordersmdashand likely devote more resources to this task than
is operationally scalable
One consequence of using more fraud detection tools
during automated screening is a greater chance of one
or more flags being raised resulting in an order being
selected for manual review Adding additional tools to
detect fraud may result in downstream impacts and
costs if these tools are not carefully integrated into a
merchantrsquos review process and tuned to a merchantrsquos
specific situation
Merchants expecting increased online sales will need to
take at least one of the following actions 1) divert more
staff time to the order review process 2) increase staffing
levels 3) allow more time to process orders and ship good
ones or 4) improve accuracy of initial automated sorting
and make the subsequent review process more efficient
Review Tools amp PracticesGiven the reported limitations on hiring additional manual
review staff there is increased focus on investing in tools
and systems to increase the productivity and effectiveness
of review staff While the primary focus should be on
improving initial automated sorting accuracy to decrease
need for review attention to streamlining the review
process is also warranted
Stage 2 Manual Review
Automated
Screening1
Manual
Review2
Accept
Reject3
Fraud Claim
Management4ORDER
RETAINED
REVENUE
Tuning and Management
40
0
2004 2005 2006
Manual Review Trends
2007 2008
30
20
10
5
15
25
35
Over the past 5 years on average 1 out of 4 online orders were
manually reviewed Merchants performing manual review have
on average reviewed 1 out of every 3 orders received
35
26
Orders Reviewed by Merchants Practicing Review Orders Reviewed Overall (Net Review)
23
28
27
33
22
32
27
34
4
11
C Y B E R S O U R C E 1 0 T H A N N U A L O N L I N E F R A U D R E P O R T
11copy2009 CyberSource Corporation All rights reserved
Use of Case Management Systems
Currently 1 out of 3 merchants report having a case
management system that supports their manual review
process and staff Over half of merchants either
currently use a case management system or
plan to implement one in 2009 For large
online merchants 65 report currently using
or planning to implement a case management
system
Merchants using a case management system
are also more likely to be able to track fraud
rates on orders which have gone through
manual review 74 of merchants using case
management systems report tracking fraud
rates for manually reviewed orders vs only
42 being able to do so when not using a
case management system Surprisingly 44
of merchants performing manual order review
say they do not track the fraud rates of orders
which have been manually reviewed and 24
of large merchants say they do not have this
information Without knowing the fraud rate
on orders going through manual review and
who reviewed them it is difficult to determine
training needs or other actions to improve the
effectiveness of manual review
Tools UsedPlanned During Manual Review
While many of the tools or detector results used
during automated screening can also be used
during manual review several additional tools
and processes are employed by manual reviewers
Attempting to validate an order by contacting the
customer is standard practice for 7 out of 10
merchants and 82 of large merchants However
most organizations have policies regarding how
quickly they must clear orders through manual
review and how long they will wait for customers
to respond to requests for additional information
Most merchants try to clear orders through manual
review in one business day and say they will not
wait more than three business days for a customer
to respond to a request for more information (see
charts 7 and 8)
Another practice used only in manual review is to
contact the card issuer This action is taken by
almost half of merchants overall and 60 of large
merchants Telephone number validation reverse
lookup is the third most popular tool with 56 of
merchants using it during manual review vs 25
during automated screening
In 2008 two-thirds of merchants reported using
four or more fraud detection tools for manual review with
49 tools being the average Larger merchants reported
using 61 detection tools on average
35
15
5
25
30
10
20
40
45
50
55
0
Average of Orders Manually Reviewed(for merchants engaged in review)
200620072008
lt$500K
36
43
51
$500K ndash lt$5M
36
45
35
$5M ndash lt$25M
25
40
34
$25M+
15
14
15
o
f O
rder
s
Annual Online Revenues
5
Currently usePlan to implement in 2009Do not use or plan to implement
Use or Plan to Implement Case Management System
to Support Manual Order Review Process
18
4933
n=227
All Merchants
35
39
26
n=84
Merchants $25M+
Base Those conducting manual review
6
12
C Y B E R S O U R C E 1 0 T H A N N U A L O N L I N E F R A U D R E P O R T
35
15
5
25
50
30
10
20
40
45
0
Time Allowed for Customer Response
Source 2008 CyberSource Fraud Report
Half day
or less
10
Same
business
day
10
Next
business
day
14
2-3
business
days
37
4-5
business
days
11
6 or more
business
days
19
8
Fraud Detection Tool Usage During Manual Review
All Merchants Merchants $25M+ Online Revenue
69 11
56 15
49 10
45 12
23 14
9 7
currently using planning to begin use (in 2009)
Current n=265 Future Plans n=109 Current n=89 Future Plans n=43
VALIDATION SERVICES
Telephone number verificationreverse lookup
Credit history check
Paid for public records service
Contact customer to verify order
Contact card issuerAmex CVP
Postal address validation services
82 5
74 5
60 14
46 7
45 14
6 12
72 8
49 14
35 13
22 17
SINGLE MERCHANT PURCHASE HISTORY
Positive lists
Customer order history
Valid customer website behavior analysis
Negative lists (in-house lists)
83 5
69 12
37 14
34 30
40 20
PURCHASE DEVICE TRACING
IP geolocation information 55 28
11 28
MULTI-MERCHANT PURCHASE HISTORY
Shared negative lists ndash shared hotlists 16 35
9
35
15
5
25
30
10
20
40
45
50
0
Time to Clear Orders in Manual Review (2008)
Over two-thirds of merchants clear
orders through manual review
in one business day72
1 hour
or less
26
2-4
hours
10
Same
business
day
36
Next
business
day
18
2-3
business
days
8
4-5
business
days
1
6 or more
business
days
1
n=259
7
13
C Y B E R S O U R C E 1 0 T H A N N U A L O N L I N E F R A U D R E P O R T
13copy2009 CyberSource Corporation All rights reserved
The most popular tools currently used in the manual
review process are shown in chart 9 including the
percent of merchants planning to add each tool in 2009
Review Operations Efficiency
Reviewer Efficiency
The average number of orders a reviewer processed in a
day ranged from 22 for small merchants to 124 for large
(see chart 10) Large merchants who typically have case
management systems achieve a 5X higher throughput
per reviewer in the manual review stage possibly due to
greater use of review systems and detection tools during
manual review On average reviewers spent 7 minutes
reviewing each order in 2008
Time to Ramp New Staff
New to this yearrsquos surveymdashmerchants were asked how
long it takes for an order reviewer to attain acceptable
proficiency in his or her job While the learning curve
varies by type and size of online merchant the median
time reported was 4 weeks Larger merchants reported a
median of 6 weeks for a reviewer to achieve acceptable
proficiency Chart 11 shows the distribution of learning
times reported
Staff Tenure
Given the cost and time required to recruit and train
new staff merchants need to focus on staff retention
Fraud rates or order rejection rates can increase if highly
experienced review staff leave an organization and are
either not replaced or replaced by less experienced
reviewers 85 of review staff have been on the job
for one year or more Merchants report on average that
15 of their review staff were new in 2008 For large
merchants 24 of their staff were new in 2008 (see
chart 12) Efficient training and methods to ensure
consistent and accurate disposition of orders will be key
as merchants seek to optimize operating efficiency
Final Order DispositionAutomated screening and manual order review ultimately
result in order acceptance or rejection A relatively high
percentage of orders manually reviewed are ultimately
accepted (see next section)mdashhighlighting the need for
merchants to improve automated screening accuracy and
reduce the need for review A look at order reject and
acceptance rates follows in Stage 3 of the pipeline review
Overall $500K ndash lt$5Mlt$500K $5M ndash lt$25M $25M+
Average Orders Reviewed Per DayReviewer(by merchant size)
n=185
124
46
2322
68
10
Median of Weeks
4
52
Number of Weeks Required to Train New Reviewer
lt1
3
1
11
2
10
3
11
4
21
5-9
28
10-14
11
15+
5
n=159
11
Overall $500K ndash lt$5Mlt$500K $5M ndash lt$25M $25M+
of Review Staff New in 2008
n=206
24
1413
7
15
12
14
C Y B E R S O U R C E 1 0 T H A N N U A L O N L I N E F R A U D R E P O R T
Post-Review Order Acceptance RatesMerchants who manually review orders indicated they
ultimately accepted nearly frac34 of the orders they manually
reviewed (see chart 13) This was similar to the
proportion reported in 2007 50 of merchants report
they accept 90 or more of orders they manually review
These merchants are incurring significant expense
to find the 10 of the review queue they believe to be
too risky to accept Clearly most merchants require better
methods to determine which orders are to be outsorted for
manual review so only truly suspicious orders receive
human attention
Stage 3 Order Dispositioning (AcceptReject)
Automated
Screening1
Manual
Review2
Accept
Reject3
Fraud Claim
Management4ORDER
RETAINED
REVENUE
Tuning and Management
of Merchants Reporting This Level
of Post-Review Acceptance
1380 ndash 89
4490 ndash 99
6100
970 ndash 79
360 ndash 69
750 ndash 59
140 ndash 49
330 ndash 39
420 ndash 29
510 ndash 19
51 ndash 9
20
50 accept 90+
Post-Review Acceptance Trends
70
30
10
50
100
60
20
40
80
90
0
Most orders that enter manual review are accepted
2003
66
2004
71
2005
69
2006
66
2007
75
2008
73
of Orders Accepted in Review
13
15
C Y B E R S O U R C E 1 0 T H A N N U A L O N L I N E F R A U D R E P O R T
15copy2009 CyberSource Corporation All rights reserved
Overall Order Rejection RatesOrder reject rates can reflect true fraud
risk or signal ldquoprofit leaksrdquo in terms of
valid order rejection or unnecessarily
high rates of manual review In 2008 for
the first time in several years merchants
participating in the survey reported a
significant drop in their order rejection
rates from 42 in 2007 to 29 (see
chart 14)
Order rejection rates dropped in 2008 for
almost every size of merchant (see chart
15) except the very smallest and for
every industry segment (see chart 16)
It is likely that as online sales growth
slows and merchants seek to sustain
revenue levels merchants will look for
ways to accept more orders and reduce
orders rejected due to suspicion of fraud
In 2008 merchants were able to successfully reduce order
rejection rates while holding fraud rates stable It remains
to be seen if order rejection rates can be reduced further
in 2009 without an increase in fraud rates or manual
order review
Order rejection rates also vary by type of product and
merchant profile Chart 16 shows that segments which
have high cost of goods sold andor lower gross margins
tend to have higher order rejection rates Each fraud loss
in this arena has a large negative profit impact Consumer
electronics and jewelryapparel are two examples of online
segments that tend to have higher-than-average order
rejection rates
Yet even within similar groups of online merchants we
see that some merchants achieve low order rejection rates
while still keeping fraudulent order rates under control
Examining the large consumer electronics merchants in
the sample we find that half of these merchants report
35
15
05
25
50
30
10
20
40
45
0
Order Rejection Trends
2005
39
2006
41
2007
42
2008
29
14
Average Orders Rejected Due to Suspicion of Fraud
2007 n=2392008 n=326
Overall $500K ndash lt$5Mlt$500K $5M ndash lt$25M $25M+0
6
4
2
1
3
5
7
8
9
10
45
26
43
64
24
39
27
262
9
42
Order Rejection Rates by Selected Online Segment20072008
n=23
9
n=32
6
n=64
n=95
n=63
n=62
n=35
n=57
n=62
n=85
n=62
n=85
Overall Media amp
Entertainment
Digital Goods
ServicesApparel
Jewelry
Consumer
Electronics
49
34
32
56
42
56
32
42
29
42
Household amp
General Merchandise
22
31
15
16
16
C Y B E R S O U R C E 1 0 T H A N N U A L O N L I N E F R A U D R E P O R T
order rejection rates of 2 or less while maintaining
fraudulent order rates at or even below the average for
their segment
International Orders RiskierMerchants consistently report a much higher level of
order rejection on international orders due to suspicion
of payment fraud In 2008 merchants report their
rejection rate on these orders is over three and one half
times that of domestic orders as shown in chart 17
The actual fraud rate experienced on international orders
supports this cautious approach as merchants report the
fraud risk on international orders is also over three and
one half times that of domestic orders
Order Rejection Trends
of total USCanadian orders rejected of international orders rejected
Historically international order rejection rates
average 32x higher than USCanadian rates
2005 20072006 2008
6
4
2
1
3
5
7
8
9
12
11
10
13
14
42
11
11
29
13
41
12
39
0
15
17
17
C Y B E R S O U R C E 1 0 T H A N N U A L O N L I N E F R A U D R E P O R T
17copy2009 CyberSource Corporation All rights reserved
Fighting ChargebacksThis yearrsquos survey once again examined online merchantsrsquo
practices associated with reviewing and contesting
chargebacks (ldquore-presentmentrdquo) Over the past four years
the share of fraud-coded chargebacks merchants contest
has averaged 43 to 53 with the 2008 average at
50 Medium and large merchants report contesting 52
and 46 respectively of their fraud-coded chargebacks
in 2008 However when we look at the distribution of
merchantsrsquo answers to this question we find that over one
third of merchants are disputing 90 or more of their
fraud chagebacks while three out of ten merchants are
disputing less than 10 of their fraud chargebacks (see
chart 18)
Merchants report that they win on average 44 of the
chargebacks they dispute which is very similar to the 42
win rate reported in 2006 and 40 in 2007 Simply using
the average percent of chargebacks that are disputed (50)
times the average win rate of 44 results in a net recovery
rate of 22 (meaning 22 of all fraud-coded chargebacks
are recovered) However given the wide disparity in the
chargeback re-presentment rate when these are calculated
on a merchant-by-merchant basis and then averaged the
re-presentment win rate rises to 28 (see chart 19 on
next page) the same recovery rate that was found in 2007
Therefore disputing most fraud chargebacks and having
an efficient re-presentment process can help enhance
profitability and reduce fraud loss
Stage 4 Fraud Claim Management
Automated
Screening1
Manual
Review2
Accept
Reject3
Fraud Claim
Management4ORDER
RETAINED
REVENUE
Tuning and Management
Average Total Fraud-Coded
Chargebacks Re-presented of Merchants Reporting
this Re-presentment Rate
480 ndash 89
790 ndash 99
100
370 ndash 79
460 ndash 69
450 ndash 59
540 ndash 49
130 ndash 39
520 ndash 29
810 ndash 19
1 ndash 9
0
C
harg
ebac
ks R
e-pr
esen
ted
Overall $500K ndash lt$5Mlt$500K $5M ndash lt$25M $25M+
Annual Online Revenue
2006 n=1612007 n=1002008 n=120
50
53
47
36
38
48 52
46
5863
56
56
46
45
53
15
15
28
18
18
C Y B E R S O U R C E 1 0 T H A N N U A L O N L I N E F R A U D R E P O R T
Chargeback Management ToolsOf course disputing chargebacks is not an easy or cost-
free process Merchants must manage and organize all
order delivery and payment information to successfully
dispute fraudulent orders with financial institutions
Merchants are beginning to adopt automated systems
for handling this aspect of the pipeline One out of five
merchants reported using chargeback management tools
in 2008 and 37 of large merchants reported using
these tools In our 2006 survey we asked merchants to
provide estimates of how many hours it takes on average
to handle a fraud chargeback The average time spent
overall was 18 hours with a median time of 10 hours
to handle a fraud chargeback (total time consumed
for research documentation submission) The largest
merchants reported a median time of 30 minutes per fraud
chargeback Clearly fraud chargeback management is a
significant expense for merchants
ChargebacksmdashOnly Half the Problem How a fraudulent order is handled can have a significant
impact on bottom line profits Fraudulent orders are
presented to the merchant via two main routes as a
chargeback or as a direct request from a consumer
for credit (they claim fraudulent use of their account)
Although chargebacks are the most often cited metric
merchants report that chargebacks actually account for less
than half of all fraud claims This is true for all sizes of
merchants (see chart 20)
In 2007 large ($25M+ online sales) merchants reported
that 57 of their fraud was presented in the form of a
fraud-coded chargeback but in 2008 this dropped back
to 48 Considering the financial impact of both fraud
claim routes (chargebacks and credit issuancereversal)
some merchants encourage direct consumer contact
to address fraud claims and thus avoid the additional
chargeback fees levied by the merchant bankprocessor If
a consumer contacts the merchant first then the decision
is in the merchantrsquos control to either handle the dispute
directly with the consumer or to advise them to initiate a
fraud chargeback process In any event if merchants are
evaluating fraud losses solely on the basis of chargebacks
the actual rate of fraud loss the business is experiencing
may be as much as two times higher due to direct credit
issuancecharge reversal
Overall $500K ndash lt$5Mlt$500K $5M ndash lt$25M $25M+
Fraud Chargeback Re-presentment
Win RateNet Recovery Rate
Annual Online Revenues
Challenged Net Recovery
44AVERAGEWINRATE
46AVERAGEWINRATE
43AVERAGEWINRATE
54AVERAGEWINRATE
32AVERAGEWINRATE
50
28
36
23
52
38
63
35
46
19
10
0
20
30
40
50
60
70
80
90
100
(Net Recovery Rate is expressed as a of all fraud-coded chargebacks)
19
Overall $500K ndash lt$5Mlt$500K $5M ndash lt$25M $25M+
of Fraud Claims
Chargebacks vs Credit Issued by Merchant
Credits IssuedChargebacks
58
42
76
24
57
43
52
48
52
48
n=25
n=14
7
n=27
n=30
n=55
Annual Online Revenue
n=147
10
0
20
30
40
50
60
70
80
90
100
20
19
C Y B E R S O U R C E 1 0 T H A N N U A L O N L I N E F R A U D R E P O R T
19copy2009 CyberSource Corporation All rights reserved
Fraud Rate MetricsWhen monitoring the level and trend of online
fraud loss we focus on three key metrics
1) Overall revenue lost as a percent of total
online sales 2) percent of accepted orders
which turn out to be fraudulent (domestic and
international) and 3) the average value of a
fraudulent order relative to a valid order Fraud
rates vary widely by merchant and depend on a
variety of factors such as online sales volume
type of products or services sold online and
how such productsservices are delivered and
paid for It is important that merchants track
key fraud metrics over time and evaluate their
performance relative to their peer group (both
size and industry) Note this report provides
benchmarks on total fraud rates (chargebacks +
credits issued directly to consumers by merchants)
As such these metrics tend to be higher
than those reported by banks and credit card
associations which generally base reported rates
on chargeback activity only
Depending on which products or services are being sold
online fraud loss risk tolerances and order rejection
rates can vary significantly Merchants selling high
cost goods with relatively low gross margins like most
consumer electronics products tend to err on the side
of rejecting more orders to avoid expensive fraud losses
Merchants who are less subject to fraud attacks can
achieve similar fraud loss rates while rejecting
relatively few orders Over the past few years
as fraud rates have remained relatively stable
we have compiled data on fraud practices and
benchmarks by industry
Direct Revenue Loss Rates
Very large merchants typically use more tools
and have more experience and resources to
manage online fraud so their fraud rates tend
to be lower than the overall rate Revenue loss
measurement includes not only the value of
orders on which fraudulent chargebacks are
received but also the cost of any credits issued
to avoid such chargebacks Figures include both
chargebacks and credits issued directly by the
merchant in response to fraud claims
Fraudulent Order Rate for Accepted Orders
Another key metric is the number of accepted orders that
later turn out to be fraudulent Expressed as a percent of total
orders this metric is typically lower than the revenue loss
percent since the average value of fraudulent orders tends
to be greater than the average value of valid orders which
causes the fraud rate as measured by revenues to be higher
Overall 38 of merchants reported experiencing a fraudulent
order rate of 1 or more in 2008 which was the same
percent reported in 2007
20072008
Average Online Revenue Lost to Payment Fraud
(chargebacks amp fraud-related credits)
Overall $500K ndash lt$5Mlt$500K $5M ndash lt$25M $25M+
Annual Online Revenue
0
12
08
04
02
06
10
14
16
18
14 1
5 16
15
121
3
13
15
14
14
20072008
Average Accepted Orders Resulting in Fraud Losses
Overall $500K ndash lt$5Mlt$500K $5M ndash lt$25M $25M+
Annual Online Revenue
0
12
08
04
02
06
10
14
16
18
16
11
13
12
11
13
11
13
11
13
A fraud chargeback was received on the orders OR a credit was issued directly to a customerwho claims not to have placed an order
21
22
20
C Y B E R S O U R C E 1 0 T H A N N U A L O N L I N E F R A U D R E P O R T
International Orders Carry Higher Risk
Fifty-two percent of merchants surveyed accepted orders
from outside the US amp Canada in 2008 International
sales accounted for an average of 17 of total orders
for these merchants That same group reported that the
actual direct fraud rate on international orders averaged
40 or more than 36 times the overall fraud rate for
domestic online orders Though international markets
represent an attractive opportunity online merchants must
make sure that their fraud detection and management
systems are robust enough to handle the additional risk
involved Merchants who sell online outside of the US
amp Canada report that they reject international orders due
to suspicion of fraud at a rate that is over three and one
half times the US and Canadian average rate of 29
mdash rejecting approximately 1 out of every 9 international
orders received
Average Value of Fraudulent Order Higher than a Valid Order
Historically fraudulent orders tend to have higher values
on average than valid orders In 2008 the median value
of a fraudulent order was $200 compared to $130 median
value reported for valid orders This relationship of higher
fraudulent order values vs valid order value was found for
all merchant size categories as chart 24 shows Since
fraudulent orders tend to be somewhat higher in value than
valid orders merchants will tend to outsort more high value
orders for manual review and verification Large online
merchants reported that the median value of an order
flagged for manual review was $245
Valid vs Fraudulent Order Value
Valid orderFraudulent order
Median used to minimize impact of outliers
Overall $500K ndash lt$5Mlt$500K $5M ndash lt$25M $25M+
Annual Online Revenue
0
$200
$50
$100
$150
$250
$300
$350
$120
$150
$200
$150
$250
$175
$150
$100
$200
$130
24
40
10
05
20
15
25
35
45
30
00
International Fraud Rateover 3x USCanadian rate
11
40
Location of Order Origination
Within USCanadan=326
Outside USCanadan=164
Frau
d R
ate
o
f O
rder
s
23
21
C Y B E R S O U R C E 1 0 T H A N N U A L O N L I N E F R A U D R E P O R T
21copy2009 CyberSource Corporation All rights reserved
Tuning amp Management
Maintaining and Tuning Screening Rules28 of merchants say they have an automated order
screening system in place that allows business managers
to modify decision rules without assistance from internal
IT staff or external parties (up from 16 found in 2006)
The ability to adjust automated order screening systems
quickly helps manage the order review flow tailor rules
to new products and adapt to new fraud trends as they
are encountered Without this ability merchants cannot
easily minimize reject rates review costs or fraud rates
Additionally giving business managers the capability of
adjusting business rules on-the-fly reduces the costs and
burden of IT support
Global Fraud Portals Some online merchants are integrating fraud tools
and strategies via fraud management portals These
portals employ a combination of flexible rules systems
that interact with a portfolio of ldquotruth servicesrdquo around
the globe allowing business managers to set payment
type product type and market-specific screens Case
management systems are being integrated with these
portals with accompanying enhancements to streamline
workflow Global fraud portals typically include hierarchical
management as companies strive to centralize fraud
management across multiple lines of business and
geographies
Merchant Budgets for Fraud Management How much are online merchants spending to mitigate
fraud risk In both 2008 and in 2007 survey results
show that 34 of merchants spend 05 or more of
their online revenues to manage online payment fraud
while 66 spend less than 05 In 2008 across
all merchants the median ratio of fraud management
expense to sales was 022 down from 028 in 2007
although some merchants in high risk categories are
spending significantly more These spending estimates
focus on the cost of managing fraud risk (internal and
external systems and services management development
and review staffs) Direct fraud loss (chargebacks lost
goods and associated shipping costs) as well as the
opportunity cost associated with valid order rejection are
not included here (see chart 25)
Automated
Screening1
Manual
Review2
Accept
Reject3
Fraud Claim
Management4ORDER
RETAINED
REVENUE
Tuning and Management
02ndash lt050ndash lt02 05ndash lt10 10ndash lt40 40+
How Much Merchants Spend
on Fraud Management
(percent of merchants operating at defined expense level)
of Annual Online Revenues Spent to Manage Fraud(staff etc excluding fraud loss)
2007 n=972008 n=108
41 44
6
14
24
22
12 16
16
4
Median2008 = 022
2007 = 028
0
60
40
20
25
title (title)
22
C Y B E R S O U R C E 1 0 T H A N N U A L O N L I N E F R A U D R E P O R T
Budget Allocation For the past three years merchants have consistently
spent just over half their fraud management budgets on
review staff (see chart 26) The remainder is allocated
as follows 25 for third party tools or services and 24
on internally developed tools and systems
Clearly review staff costs are the dominant factor and
only 13 of merchants cite plans to increase review
staffing in 2009 Reducing the need for manual review
and increasing the efficiency and effectiveness of
reviewers is key to growing online business profits and
managing the total cost of online payment fraud One
place to start is by improving the automated detection of
risky orders so as to reduce manual order review volumes
Clearly the continued reliance on manual review we have
seen in the data over the last few years is not an optimal
long term strategy for managing online fraud As budgets
come under increasing pressure merchants will need
to redouble their efforts to automate more of the fraud
management process while keeping valid order conversion
high and fraud loss low
Base Those with 1 or more full-time manual review staff
Average Spending Allocation
for Fraud Management 2008
n=400
3rd Party
Tools
23
24
Internal
Tools amp
System
3rd Party
Tools
25
Order
Review
Staff
51
Planned Staffing Levels
Increase
13
21
Same
81
71
2009
2008
Decrease
6
8
n=238 248
26
23
C Y B E R S O U R C E 1 0 T H A N N U A L O N L I N E F R A U D R E P O R T
23copy2009 CyberSource Corporation All rights reserved
Resources amp Solutions
3 Managed Services
2 Design amp Installation
1 Systems amp Services
PAYMENT SECURITY
Order
Screening
Collection amp
Reconciliation
Global Payment
Acceptance
Processing
Management
L A S E R
BankBankTrans f e rTrans f e r
Direct
Debit
ORDER
bull Onlinebull Call Centerbull IVRbull Kioskbull POSbull ERP
With Performance
Guarantees
To find information on CyberSourcersquos industry-leading risk
management solutions self-paced webinars on decision
management and other whitepapers on electronic payment
management visit our Resource Center at
wwwcybersourcecom For sales assistance phone
1-888-330-2300 or e-mail salescybersourcecom
CyberSource Payment Management Solutions CyberSource offers a comprehensive portfolio of modular
services and tools to help your company manage your entire
payment pipeline to optimize sales results All are available
via one connection to our web-based services
Accept All Popular Payment Types in 190+
Countries
Accept payments worldwide using a merchant account from
your preferred provider or CyberSource worldwide credit
and debit cards regional cards direct debit bank
transfers electronic checks and alternative payment
types such as Bill Me Later and PayPal CyberSource
also provides professional services to help you
integrate payment with front-end and back-office
systems
Risk ManagementOrder Screening
Global Fraud Management Portal with CyberSource Intelligent
Review Technology A hosted rules and case management
system that provides on-demand access to over 150
validation tests and services across all four dimensions of
detection Detectors include multi-merchant transaction
history checks worldwide delivery address and phone
verification device fingerprinting IP geolocation purchase
velocity identity morphing and custom data from your
systems Case management system provides consolidated
data review workflow management and built-in callouts to
validation services to streamline review
Managed Services CyberSource provides client services to
help you analyze design and manage your order screening
and fraud detection processesmdasheverything from screening
strategies and risk threshold optimization analysis
to ongoing monitoring order review and chargeback
managementrecovery Our managed services include
business performance guarantees
Payer Authentication Verified by Visa MasterCard
SecureCode
Processing Management
CyberSource processes your payments in our high
availability datacenters located in the US Europe and
Japan All datacenters are certified PCI-compliant and
include sophisticated processing management logic to help
prevent payment failures and rate downgrades
Collection amp Reconciliation
A full array of online and exportable payment reporting
capability is available to streamline reconciliation activity
Further systems can be installed to automate up to 90
of the tasks associated with payment reconciliation and
chargeback re-presentment
Payment Security
Remove Payment Data From Your Network CyberSource
provides secure storage and hosted payment acceptance
services that let you process without storing or even
transmitting payment data A great way to streamline PCI
compliance and mitigate security risk
Payment System Centralization Our team of experts will help
you consolidate multiple payment systems into a single easy
to manage system Optionally CyberSource will also host
support and manage these systems in our secure datacenters
PCI Planning amp Remediation CyberSource provides PCI
compliance consulting and remediation services to help
remedy PCI issues
Professional Services
CyberSource maintains a team of experienced payment
consultants to assist with payment systems planning
system and process design and implementation and
integration Our client services team is additionally
available to help you monitor tune or fully outsource
portions of your payment operations
C Y B E R S O U R C E 1 0 T H A N N U A L O N L I N E F R A U D R E P O R T
North America
CyberSource Corporation
1295 Charleston Road
Mountain View CA 94043
T 8883302300
T 6509656000
F 6506259145
Email infocybersourcecom
Europe
CyberSource Ltd
The Waterfront
300 Thames Valley Park Drive
Thames Valley Park
Reading RG6 1PT
United Kingdom
T +44 (0) 1189294840
F +44 (0) 8704601931
Email ukcybersourcecom
UK Fraud Report wwwcybersourcecoukukfraudreport
Japan
CyberSource KK (Japan)
3-11-11 Shibuya Shibuya-ku
Tokyo 150-0002 Japan
T +81357747733
F +81357747732
Email mailcybersourcecojp
CyberSource Corporation is a leading provider of
electronic payment risk and security management
solutions CyberSource provides payment management
solutions for electronic payments processed via Web
call center kiosk mobile and POS environments
Services include hosted systems to help you manage
electronic payments as well as professional services
to help design integrate and fully manage parts or all
of your payment operations Over 245000 businesses
worldwide use CyberSource solutions including half
the companies comprising the Dow Jones Industrial
Average and leading Internet brands The company
is headquartered in Mountain View California and
has sales and service offices in Japan the United
Kingdom and other locations in the United States
For More Information
bull Call 18883302300
bull Email infocybersourcecom
bull Visit wwwcybersourcecom
Get Tailored Views of Risk Management
Pipelinetrade MetricsTo get a view crafted for your companyrsquos size and industry
please contact CyberSource at 18883302300 or online at
wwwcybersourcecomcontact_us
For additional information whitepapers and webinars
or sales assistance
bull Contact CyberSource 18883302300 or
wwwcybersourcecomcontact_us
bull Risk Management Solutions visit wwwcybersourcecom
products_and_servicesrisk_management
bull Global Payment amp Security Solutions
visit wwwcybersourcecomproducts_and_services
global_payment_services
About CyberSource
C Y B E R S O U R C E 1 0 T H A N N U A L O N L I N E F R A U D R E P O R T
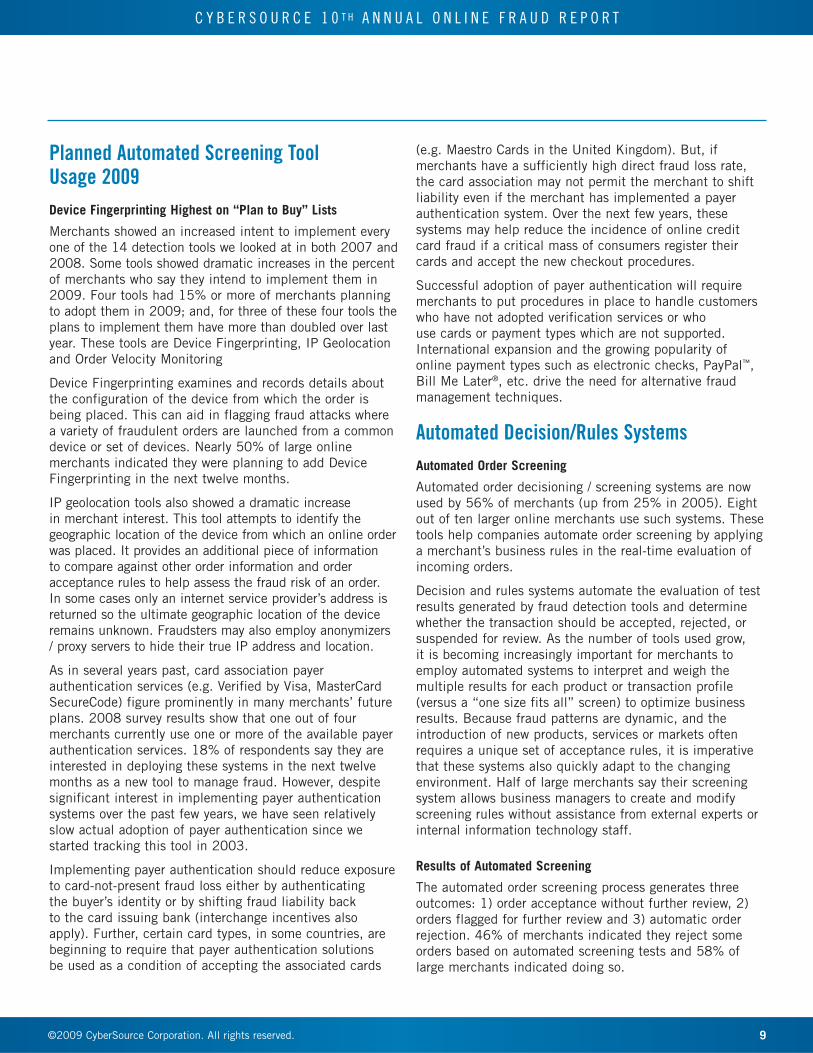
9
C Y B E R S O U R C E 1 0 T H A N N U A L O N L I N E F R A U D R E P O R T
9copy2009 CyberSource Corporation All rights reserved
Planned Automated Screening Tool Usage 2009
Device Fingerprinting Highest on ldquoPlan to Buyrdquo Lists
Merchants showed an increased intent to implement every
one of the 14 detection tools we looked at in both 2007 and
2008 Some tools showed dramatic increases in the percent
of merchants who say they intend to implement them in
2009 Four tools had 15 or more of merchants planning
to adopt them in 2009 and for three of these four tools the
plans to implement them have more than doubled over last
year These tools are Device Fingerprinting IP Geolocation
and Order Velocity Monitoring
Device Fingerprinting examines and records details about
the configuration of the device from which the order is
being placed This can aid in flagging fraud attacks where
a variety of fraudulent orders are launched from a common
device or set of devices Nearly 50 of large online
merchants indicated they were planning to add Device
Fingerprinting in the next twelve months
IP geolocation tools also showed a dramatic increase
in merchant interest This tool attempts to identify the
geographic location of the device from which an online order
was placed It provides an additional piece of information
to compare against other order information and order
acceptance rules to help assess the fraud risk of an order
In some cases only an internet service providerrsquos address is
returned so the ultimate geographic location of the device
remains unknown Fraudsters may also employ anonymizers
proxy servers to hide their true IP address and location
As in several years past card association payer
authentication services (eg Verified by Visa MasterCard
SecureCode) figure prominently in many merchantsrsquo future
plans 2008 survey results show that one out of four
merchants currently use one or more of the available payer
authentication services 18 of respondents say they are
interested in deploying these systems in the next twelve
months as a new tool to manage fraud However despite
significant interest in implementing payer authentication
systems over the past few years we have seen relatively
slow actual adoption of payer authentication since we
started tracking this tool in 2003
Implementing payer authentication should reduce exposure
to card-not-present fraud loss either by authenticating
the buyerrsquos identity or by shifting fraud liability back
to the card issuing bank (interchange incentives also
apply) Further certain card types in some countries are
beginning to require that payer authentication solutions
be used as a condition of accepting the associated cards
(eg Maestro Cards in the United Kingdom) But if
merchants have a sufficiently high direct fraud loss rate
the card association may not permit the merchant to shift
liability even if the merchant has implemented a payer
authentication system Over the next few years these
systems may help reduce the incidence of online credit
card fraud if a critical mass of consumers register their
cards and accept the new checkout procedures
Successful adoption of payer authentication will require
merchants to put procedures in place to handle customers
who have not adopted verification services or who
use cards or payment types which are not supported
International expansion and the growing popularity of
online payment types such as electronic checks PayPaltrade
Bill Me Laterreg etc drive the need for alternative fraud
management techniques
Automated DecisionRules Systems
Automated Order Screening
Automated order decisioning screening systems are now
used by 56 of merchants (up from 25 in 2005) Eight
out of ten larger online merchants use such systems These
tools help companies automate order screening by applying
a merchantrsquos business rules in the real-time evaluation of
incoming orders
Decision and rules systems automate the evaluation of test
results generated by fraud detection tools and determine
whether the transaction should be accepted rejected or
suspended for review As the number of tools used grow
it is becoming increasingly important for merchants to
employ automated systems to interpret and weigh the
multiple results for each product or transaction profile
(versus a ldquoone size fits allrdquo screen) to optimize business
results Because fraud patterns are dynamic and the
introduction of new products services or markets often
requires a unique set of acceptance rules it is imperative
that these systems also quickly adapt to the changing
environment Half of large merchants say their screening
system allows business managers to create and modify
screening rules without assistance from external experts or
internal information technology staff
Results of Automated Screening
The automated order screening process generates three
outcomes 1) order acceptance without further review 2)
orders flagged for further review and 3) automatic order
rejection 46 of merchants indicated they reject some
orders based on automated screening tests and 58 of
large merchants indicated doing so
10
C Y B E R S O U R C E 1 0 T H A N N U A L O N L I N E F R A U D R E P O R T
Orders which do not pass the automated order screening
stage typically enter a manual review queue During this
stage additional information is collected to determine if
orders should be accepted or rejected due to excessive
fraud risk
Manual review represents a critical area of profit leakage
It is expensive limits scalability and impacts customer
satisfaction For many merchants it represents half of
their fraud management budget Only 13 of merchants
say they have budget available to increase review
staff now or in the next twelve months This presents
significant challenges to profit growth since even at a
stable percent of orders sent to review the total number
of orders that must be reviewed increases in step with the
total increase of online sales
Manual Order Review RatesIn what should be a highly automated sales environment
most merchants are manually checking orders In fact
during the past six years overall 1 out of every 4 orders
transacted online have been manually reviewed (see chart
4) Over the same period merchants who conduct manual
review typically reviewed 1 out of 3 orders they received
Merchants of all sizes use manual review to manage
payment fraud Chart 5 shows smaller merchants review
a higher percentage of orders (perhaps because lower
order volumes permit such practice) but even larger
merchants review a significant percentage of online
ordersmdashand likely devote more resources to this task than
is operationally scalable
One consequence of using more fraud detection tools
during automated screening is a greater chance of one
or more flags being raised resulting in an order being
selected for manual review Adding additional tools to
detect fraud may result in downstream impacts and
costs if these tools are not carefully integrated into a
merchantrsquos review process and tuned to a merchantrsquos
specific situation
Merchants expecting increased online sales will need to
take at least one of the following actions 1) divert more
staff time to the order review process 2) increase staffing
levels 3) allow more time to process orders and ship good
ones or 4) improve accuracy of initial automated sorting
and make the subsequent review process more efficient
Review Tools amp PracticesGiven the reported limitations on hiring additional manual
review staff there is increased focus on investing in tools
and systems to increase the productivity and effectiveness
of review staff While the primary focus should be on
improving initial automated sorting accuracy to decrease
need for review attention to streamlining the review
process is also warranted
Stage 2 Manual Review
Automated
Screening1
Manual
Review2
Accept
Reject3
Fraud Claim
Management4ORDER
RETAINED
REVENUE
Tuning and Management
40
0
2004 2005 2006
Manual Review Trends
2007 2008
30
20
10
5
15
25
35
Over the past 5 years on average 1 out of 4 online orders were
manually reviewed Merchants performing manual review have
on average reviewed 1 out of every 3 orders received
35
26
Orders Reviewed by Merchants Practicing Review Orders Reviewed Overall (Net Review)
23
28
27
33
22
32
27
34
4
11
C Y B E R S O U R C E 1 0 T H A N N U A L O N L I N E F R A U D R E P O R T
11copy2009 CyberSource Corporation All rights reserved
Use of Case Management Systems
Currently 1 out of 3 merchants report having a case
management system that supports their manual review
process and staff Over half of merchants either
currently use a case management system or
plan to implement one in 2009 For large
online merchants 65 report currently using
or planning to implement a case management
system
Merchants using a case management system
are also more likely to be able to track fraud
rates on orders which have gone through
manual review 74 of merchants using case
management systems report tracking fraud
rates for manually reviewed orders vs only
42 being able to do so when not using a
case management system Surprisingly 44
of merchants performing manual order review
say they do not track the fraud rates of orders
which have been manually reviewed and 24
of large merchants say they do not have this
information Without knowing the fraud rate
on orders going through manual review and
who reviewed them it is difficult to determine
training needs or other actions to improve the
effectiveness of manual review
Tools UsedPlanned During Manual Review
While many of the tools or detector results used
during automated screening can also be used
during manual review several additional tools
and processes are employed by manual reviewers
Attempting to validate an order by contacting the
customer is standard practice for 7 out of 10
merchants and 82 of large merchants However
most organizations have policies regarding how
quickly they must clear orders through manual
review and how long they will wait for customers
to respond to requests for additional information
Most merchants try to clear orders through manual
review in one business day and say they will not
wait more than three business days for a customer
to respond to a request for more information (see
charts 7 and 8)
Another practice used only in manual review is to
contact the card issuer This action is taken by
almost half of merchants overall and 60 of large
merchants Telephone number validation reverse
lookup is the third most popular tool with 56 of
merchants using it during manual review vs 25
during automated screening
In 2008 two-thirds of merchants reported using
four or more fraud detection tools for manual review with
49 tools being the average Larger merchants reported
using 61 detection tools on average
35
15
5
25
30
10
20
40
45
50
55
0
Average of Orders Manually Reviewed(for merchants engaged in review)
200620072008
lt$500K
36
43
51
$500K ndash lt$5M
36
45
35
$5M ndash lt$25M
25
40
34
$25M+
15
14
15
o
f O
rder
s
Annual Online Revenues
5
Currently usePlan to implement in 2009Do not use or plan to implement
Use or Plan to Implement Case Management System
to Support Manual Order Review Process
18
4933
n=227
All Merchants
35
39
26
n=84
Merchants $25M+
Base Those conducting manual review
6
12
C Y B E R S O U R C E 1 0 T H A N N U A L O N L I N E F R A U D R E P O R T
35
15
5
25
50
30
10
20
40
45
0
Time Allowed for Customer Response
Source 2008 CyberSource Fraud Report
Half day
or less
10
Same
business
day
10
Next
business
day
14
2-3
business
days
37
4-5
business
days
11
6 or more
business
days
19
8
Fraud Detection Tool Usage During Manual Review
All Merchants Merchants $25M+ Online Revenue
69 11
56 15
49 10
45 12
23 14
9 7
currently using planning to begin use (in 2009)
Current n=265 Future Plans n=109 Current n=89 Future Plans n=43
VALIDATION SERVICES
Telephone number verificationreverse lookup
Credit history check
Paid for public records service
Contact customer to verify order
Contact card issuerAmex CVP
Postal address validation services
82 5
74 5
60 14
46 7
45 14
6 12
72 8
49 14
35 13
22 17
SINGLE MERCHANT PURCHASE HISTORY
Positive lists
Customer order history
Valid customer website behavior analysis
Negative lists (in-house lists)
83 5
69 12
37 14
34 30
40 20
PURCHASE DEVICE TRACING
IP geolocation information 55 28
11 28
MULTI-MERCHANT PURCHASE HISTORY
Shared negative lists ndash shared hotlists 16 35
9
35
15
5
25
30
10
20
40
45
50
0
Time to Clear Orders in Manual Review (2008)
Over two-thirds of merchants clear
orders through manual review
in one business day72
1 hour
or less
26
2-4
hours
10
Same
business
day
36
Next
business
day
18
2-3
business
days
8
4-5
business
days
1
6 or more
business
days
1
n=259
7
13
C Y B E R S O U R C E 1 0 T H A N N U A L O N L I N E F R A U D R E P O R T
13copy2009 CyberSource Corporation All rights reserved
The most popular tools currently used in the manual
review process are shown in chart 9 including the
percent of merchants planning to add each tool in 2009
Review Operations Efficiency
Reviewer Efficiency
The average number of orders a reviewer processed in a
day ranged from 22 for small merchants to 124 for large
(see chart 10) Large merchants who typically have case
management systems achieve a 5X higher throughput
per reviewer in the manual review stage possibly due to
greater use of review systems and detection tools during
manual review On average reviewers spent 7 minutes
reviewing each order in 2008
Time to Ramp New Staff
New to this yearrsquos surveymdashmerchants were asked how
long it takes for an order reviewer to attain acceptable
proficiency in his or her job While the learning curve
varies by type and size of online merchant the median
time reported was 4 weeks Larger merchants reported a
median of 6 weeks for a reviewer to achieve acceptable
proficiency Chart 11 shows the distribution of learning
times reported
Staff Tenure
Given the cost and time required to recruit and train
new staff merchants need to focus on staff retention
Fraud rates or order rejection rates can increase if highly
experienced review staff leave an organization and are
either not replaced or replaced by less experienced
reviewers 85 of review staff have been on the job
for one year or more Merchants report on average that
15 of their review staff were new in 2008 For large
merchants 24 of their staff were new in 2008 (see
chart 12) Efficient training and methods to ensure
consistent and accurate disposition of orders will be key
as merchants seek to optimize operating efficiency
Final Order DispositionAutomated screening and manual order review ultimately
result in order acceptance or rejection A relatively high
percentage of orders manually reviewed are ultimately
accepted (see next section)mdashhighlighting the need for
merchants to improve automated screening accuracy and
reduce the need for review A look at order reject and
acceptance rates follows in Stage 3 of the pipeline review
Overall $500K ndash lt$5Mlt$500K $5M ndash lt$25M $25M+
Average Orders Reviewed Per DayReviewer(by merchant size)
n=185
124
46
2322
68
10
Median of Weeks
4
52
Number of Weeks Required to Train New Reviewer
lt1
3
1
11
2
10
3
11
4
21
5-9
28
10-14
11
15+
5
n=159
11
Overall $500K ndash lt$5Mlt$500K $5M ndash lt$25M $25M+
of Review Staff New in 2008
n=206
24
1413
7
15
12
14
C Y B E R S O U R C E 1 0 T H A N N U A L O N L I N E F R A U D R E P O R T
Post-Review Order Acceptance RatesMerchants who manually review orders indicated they
ultimately accepted nearly frac34 of the orders they manually
reviewed (see chart 13) This was similar to the
proportion reported in 2007 50 of merchants report
they accept 90 or more of orders they manually review
These merchants are incurring significant expense
to find the 10 of the review queue they believe to be
too risky to accept Clearly most merchants require better
methods to determine which orders are to be outsorted for
manual review so only truly suspicious orders receive
human attention
Stage 3 Order Dispositioning (AcceptReject)
Automated
Screening1
Manual
Review2
Accept
Reject3
Fraud Claim
Management4ORDER
RETAINED
REVENUE
Tuning and Management
of Merchants Reporting This Level
of Post-Review Acceptance
1380 ndash 89
4490 ndash 99
6100
970 ndash 79
360 ndash 69
750 ndash 59
140 ndash 49
330 ndash 39
420 ndash 29
510 ndash 19
51 ndash 9
20
50 accept 90+
Post-Review Acceptance Trends
70
30
10
50
100
60
20
40
80
90
0
Most orders that enter manual review are accepted
2003
66
2004
71
2005
69
2006
66
2007
75
2008
73
of Orders Accepted in Review
13
15
C Y B E R S O U R C E 1 0 T H A N N U A L O N L I N E F R A U D R E P O R T
15copy2009 CyberSource Corporation All rights reserved
Overall Order Rejection RatesOrder reject rates can reflect true fraud
risk or signal ldquoprofit leaksrdquo in terms of
valid order rejection or unnecessarily
high rates of manual review In 2008 for
the first time in several years merchants
participating in the survey reported a
significant drop in their order rejection
rates from 42 in 2007 to 29 (see
chart 14)
Order rejection rates dropped in 2008 for
almost every size of merchant (see chart
15) except the very smallest and for
every industry segment (see chart 16)
It is likely that as online sales growth
slows and merchants seek to sustain
revenue levels merchants will look for
ways to accept more orders and reduce
orders rejected due to suspicion of fraud
In 2008 merchants were able to successfully reduce order
rejection rates while holding fraud rates stable It remains
to be seen if order rejection rates can be reduced further
in 2009 without an increase in fraud rates or manual
order review
Order rejection rates also vary by type of product and
merchant profile Chart 16 shows that segments which
have high cost of goods sold andor lower gross margins
tend to have higher order rejection rates Each fraud loss
in this arena has a large negative profit impact Consumer
electronics and jewelryapparel are two examples of online
segments that tend to have higher-than-average order
rejection rates
Yet even within similar groups of online merchants we
see that some merchants achieve low order rejection rates
while still keeping fraudulent order rates under control
Examining the large consumer electronics merchants in
the sample we find that half of these merchants report
35
15
05
25
50
30
10
20
40
45
0
Order Rejection Trends
2005
39
2006
41
2007
42
2008
29
14
Average Orders Rejected Due to Suspicion of Fraud
2007 n=2392008 n=326
Overall $500K ndash lt$5Mlt$500K $5M ndash lt$25M $25M+0
6
4
2
1
3
5
7
8
9
10
45
26
43
64
24
39
27
262
9
42
Order Rejection Rates by Selected Online Segment20072008
n=23
9
n=32
6
n=64
n=95
n=63
n=62
n=35
n=57
n=62
n=85
n=62
n=85
Overall Media amp
Entertainment
Digital Goods
ServicesApparel
Jewelry
Consumer
Electronics
49
34
32
56
42
56
32
42
29
42
Household amp
General Merchandise
22
31
15
16
16
C Y B E R S O U R C E 1 0 T H A N N U A L O N L I N E F R A U D R E P O R T
order rejection rates of 2 or less while maintaining
fraudulent order rates at or even below the average for
their segment
International Orders RiskierMerchants consistently report a much higher level of
order rejection on international orders due to suspicion
of payment fraud In 2008 merchants report their
rejection rate on these orders is over three and one half
times that of domestic orders as shown in chart 17
The actual fraud rate experienced on international orders
supports this cautious approach as merchants report the
fraud risk on international orders is also over three and
one half times that of domestic orders
Order Rejection Trends
of total USCanadian orders rejected of international orders rejected
Historically international order rejection rates
average 32x higher than USCanadian rates
2005 20072006 2008
6
4
2
1
3
5
7
8
9
12
11
10
13
14
42
11
11
29
13
41
12
39
0
15
17
17
C Y B E R S O U R C E 1 0 T H A N N U A L O N L I N E F R A U D R E P O R T
17copy2009 CyberSource Corporation All rights reserved
Fighting ChargebacksThis yearrsquos survey once again examined online merchantsrsquo
practices associated with reviewing and contesting
chargebacks (ldquore-presentmentrdquo) Over the past four years
the share of fraud-coded chargebacks merchants contest
has averaged 43 to 53 with the 2008 average at
50 Medium and large merchants report contesting 52
and 46 respectively of their fraud-coded chargebacks
in 2008 However when we look at the distribution of
merchantsrsquo answers to this question we find that over one
third of merchants are disputing 90 or more of their
fraud chagebacks while three out of ten merchants are
disputing less than 10 of their fraud chargebacks (see
chart 18)
Merchants report that they win on average 44 of the
chargebacks they dispute which is very similar to the 42
win rate reported in 2006 and 40 in 2007 Simply using
the average percent of chargebacks that are disputed (50)
times the average win rate of 44 results in a net recovery
rate of 22 (meaning 22 of all fraud-coded chargebacks
are recovered) However given the wide disparity in the
chargeback re-presentment rate when these are calculated
on a merchant-by-merchant basis and then averaged the
re-presentment win rate rises to 28 (see chart 19 on
next page) the same recovery rate that was found in 2007
Therefore disputing most fraud chargebacks and having
an efficient re-presentment process can help enhance
profitability and reduce fraud loss
Stage 4 Fraud Claim Management
Automated
Screening1
Manual
Review2
Accept
Reject3
Fraud Claim
Management4ORDER
RETAINED
REVENUE
Tuning and Management
Average Total Fraud-Coded
Chargebacks Re-presented of Merchants Reporting
this Re-presentment Rate
480 ndash 89
790 ndash 99
100
370 ndash 79
460 ndash 69
450 ndash 59
540 ndash 49
130 ndash 39
520 ndash 29
810 ndash 19
1 ndash 9
0
C
harg
ebac
ks R
e-pr
esen
ted
Overall $500K ndash lt$5Mlt$500K $5M ndash lt$25M $25M+
Annual Online Revenue
2006 n=1612007 n=1002008 n=120
50
53
47
36
38
48 52
46
5863
56
56
46
45
53
15
15
28
18
18
C Y B E R S O U R C E 1 0 T H A N N U A L O N L I N E F R A U D R E P O R T
Chargeback Management ToolsOf course disputing chargebacks is not an easy or cost-
free process Merchants must manage and organize all
order delivery and payment information to successfully
dispute fraudulent orders with financial institutions
Merchants are beginning to adopt automated systems
for handling this aspect of the pipeline One out of five
merchants reported using chargeback management tools
in 2008 and 37 of large merchants reported using
these tools In our 2006 survey we asked merchants to
provide estimates of how many hours it takes on average
to handle a fraud chargeback The average time spent
overall was 18 hours with a median time of 10 hours
to handle a fraud chargeback (total time consumed
for research documentation submission) The largest
merchants reported a median time of 30 minutes per fraud
chargeback Clearly fraud chargeback management is a
significant expense for merchants
ChargebacksmdashOnly Half the Problem How a fraudulent order is handled can have a significant
impact on bottom line profits Fraudulent orders are
presented to the merchant via two main routes as a
chargeback or as a direct request from a consumer
for credit (they claim fraudulent use of their account)
Although chargebacks are the most often cited metric
merchants report that chargebacks actually account for less
than half of all fraud claims This is true for all sizes of
merchants (see chart 20)
In 2007 large ($25M+ online sales) merchants reported
that 57 of their fraud was presented in the form of a
fraud-coded chargeback but in 2008 this dropped back
to 48 Considering the financial impact of both fraud
claim routes (chargebacks and credit issuancereversal)
some merchants encourage direct consumer contact
to address fraud claims and thus avoid the additional
chargeback fees levied by the merchant bankprocessor If
a consumer contacts the merchant first then the decision
is in the merchantrsquos control to either handle the dispute
directly with the consumer or to advise them to initiate a
fraud chargeback process In any event if merchants are
evaluating fraud losses solely on the basis of chargebacks
the actual rate of fraud loss the business is experiencing
may be as much as two times higher due to direct credit
issuancecharge reversal
Overall $500K ndash lt$5Mlt$500K $5M ndash lt$25M $25M+
Fraud Chargeback Re-presentment
Win RateNet Recovery Rate
Annual Online Revenues
Challenged Net Recovery
44AVERAGEWINRATE
46AVERAGEWINRATE
43AVERAGEWINRATE
54AVERAGEWINRATE
32AVERAGEWINRATE
50
28
36
23
52
38
63
35
46
19
10
0
20
30
40
50
60
70
80
90
100
(Net Recovery Rate is expressed as a of all fraud-coded chargebacks)
19
Overall $500K ndash lt$5Mlt$500K $5M ndash lt$25M $25M+
of Fraud Claims
Chargebacks vs Credit Issued by Merchant
Credits IssuedChargebacks
58
42
76
24
57
43
52
48
52
48
n=25
n=14
7
n=27
n=30
n=55
Annual Online Revenue
n=147
10
0
20
30
40
50
60
70
80
90
100
20
19
C Y B E R S O U R C E 1 0 T H A N N U A L O N L I N E F R A U D R E P O R T
19copy2009 CyberSource Corporation All rights reserved
Fraud Rate MetricsWhen monitoring the level and trend of online
fraud loss we focus on three key metrics
1) Overall revenue lost as a percent of total
online sales 2) percent of accepted orders
which turn out to be fraudulent (domestic and
international) and 3) the average value of a
fraudulent order relative to a valid order Fraud
rates vary widely by merchant and depend on a
variety of factors such as online sales volume
type of products or services sold online and
how such productsservices are delivered and
paid for It is important that merchants track
key fraud metrics over time and evaluate their
performance relative to their peer group (both
size and industry) Note this report provides
benchmarks on total fraud rates (chargebacks +
credits issued directly to consumers by merchants)
As such these metrics tend to be higher
than those reported by banks and credit card
associations which generally base reported rates
on chargeback activity only
Depending on which products or services are being sold
online fraud loss risk tolerances and order rejection
rates can vary significantly Merchants selling high
cost goods with relatively low gross margins like most
consumer electronics products tend to err on the side
of rejecting more orders to avoid expensive fraud losses
Merchants who are less subject to fraud attacks can
achieve similar fraud loss rates while rejecting
relatively few orders Over the past few years
as fraud rates have remained relatively stable
we have compiled data on fraud practices and
benchmarks by industry
Direct Revenue Loss Rates
Very large merchants typically use more tools
and have more experience and resources to
manage online fraud so their fraud rates tend
to be lower than the overall rate Revenue loss
measurement includes not only the value of
orders on which fraudulent chargebacks are
received but also the cost of any credits issued
to avoid such chargebacks Figures include both
chargebacks and credits issued directly by the
merchant in response to fraud claims
Fraudulent Order Rate for Accepted Orders
Another key metric is the number of accepted orders that
later turn out to be fraudulent Expressed as a percent of total
orders this metric is typically lower than the revenue loss
percent since the average value of fraudulent orders tends
to be greater than the average value of valid orders which
causes the fraud rate as measured by revenues to be higher
Overall 38 of merchants reported experiencing a fraudulent
order rate of 1 or more in 2008 which was the same
percent reported in 2007
20072008
Average Online Revenue Lost to Payment Fraud
(chargebacks amp fraud-related credits)
Overall $500K ndash lt$5Mlt$500K $5M ndash lt$25M $25M+
Annual Online Revenue
0
12
08
04
02
06
10
14
16
18
14 1
5 16
15
121
3
13
15
14
14
20072008
Average Accepted Orders Resulting in Fraud Losses
Overall $500K ndash lt$5Mlt$500K $5M ndash lt$25M $25M+
Annual Online Revenue
0
12
08
04
02
06
10
14
16
18
16
11
13
12
11
13
11
13
11
13
A fraud chargeback was received on the orders OR a credit was issued directly to a customerwho claims not to have placed an order
21
22
20
C Y B E R S O U R C E 1 0 T H A N N U A L O N L I N E F R A U D R E P O R T
International Orders Carry Higher Risk
Fifty-two percent of merchants surveyed accepted orders
from outside the US amp Canada in 2008 International
sales accounted for an average of 17 of total orders
for these merchants That same group reported that the
actual direct fraud rate on international orders averaged
40 or more than 36 times the overall fraud rate for
domestic online orders Though international markets
represent an attractive opportunity online merchants must
make sure that their fraud detection and management
systems are robust enough to handle the additional risk
involved Merchants who sell online outside of the US
amp Canada report that they reject international orders due
to suspicion of fraud at a rate that is over three and one
half times the US and Canadian average rate of 29
mdash rejecting approximately 1 out of every 9 international
orders received
Average Value of Fraudulent Order Higher than a Valid Order
Historically fraudulent orders tend to have higher values
on average than valid orders In 2008 the median value
of a fraudulent order was $200 compared to $130 median
value reported for valid orders This relationship of higher
fraudulent order values vs valid order value was found for
all merchant size categories as chart 24 shows Since
fraudulent orders tend to be somewhat higher in value than
valid orders merchants will tend to outsort more high value
orders for manual review and verification Large online
merchants reported that the median value of an order
flagged for manual review was $245
Valid vs Fraudulent Order Value
Valid orderFraudulent order
Median used to minimize impact of outliers
Overall $500K ndash lt$5Mlt$500K $5M ndash lt$25M $25M+
Annual Online Revenue
0
$200
$50
$100
$150
$250
$300
$350
$120
$150
$200
$150
$250
$175
$150
$100
$200
$130
24
40
10
05
20
15
25
35
45
30
00
International Fraud Rateover 3x USCanadian rate
11
40
Location of Order Origination
Within USCanadan=326
Outside USCanadan=164
Frau
d R
ate
o
f O
rder
s
23
21
C Y B E R S O U R C E 1 0 T H A N N U A L O N L I N E F R A U D R E P O R T
21copy2009 CyberSource Corporation All rights reserved
Tuning amp Management
Maintaining and Tuning Screening Rules28 of merchants say they have an automated order
screening system in place that allows business managers
to modify decision rules without assistance from internal
IT staff or external parties (up from 16 found in 2006)
The ability to adjust automated order screening systems
quickly helps manage the order review flow tailor rules
to new products and adapt to new fraud trends as they
are encountered Without this ability merchants cannot
easily minimize reject rates review costs or fraud rates
Additionally giving business managers the capability of
adjusting business rules on-the-fly reduces the costs and
burden of IT support
Global Fraud Portals Some online merchants are integrating fraud tools
and strategies via fraud management portals These
portals employ a combination of flexible rules systems
that interact with a portfolio of ldquotruth servicesrdquo around
the globe allowing business managers to set payment
type product type and market-specific screens Case
management systems are being integrated with these
portals with accompanying enhancements to streamline
workflow Global fraud portals typically include hierarchical
management as companies strive to centralize fraud
management across multiple lines of business and
geographies
Merchant Budgets for Fraud Management How much are online merchants spending to mitigate
fraud risk In both 2008 and in 2007 survey results
show that 34 of merchants spend 05 or more of
their online revenues to manage online payment fraud
while 66 spend less than 05 In 2008 across
all merchants the median ratio of fraud management
expense to sales was 022 down from 028 in 2007
although some merchants in high risk categories are
spending significantly more These spending estimates
focus on the cost of managing fraud risk (internal and
external systems and services management development
and review staffs) Direct fraud loss (chargebacks lost
goods and associated shipping costs) as well as the
opportunity cost associated with valid order rejection are
not included here (see chart 25)
Automated
Screening1
Manual
Review2
Accept
Reject3
Fraud Claim
Management4ORDER
RETAINED
REVENUE
Tuning and Management
02ndash lt050ndash lt02 05ndash lt10 10ndash lt40 40+
How Much Merchants Spend
on Fraud Management
(percent of merchants operating at defined expense level)
of Annual Online Revenues Spent to Manage Fraud(staff etc excluding fraud loss)
2007 n=972008 n=108
41 44
6
14
24
22
12 16
16
4
Median2008 = 022
2007 = 028
0
60
40
20
25
title (title)
22
C Y B E R S O U R C E 1 0 T H A N N U A L O N L I N E F R A U D R E P O R T
Budget Allocation For the past three years merchants have consistently
spent just over half their fraud management budgets on
review staff (see chart 26) The remainder is allocated
as follows 25 for third party tools or services and 24
on internally developed tools and systems
Clearly review staff costs are the dominant factor and
only 13 of merchants cite plans to increase review
staffing in 2009 Reducing the need for manual review
and increasing the efficiency and effectiveness of
reviewers is key to growing online business profits and
managing the total cost of online payment fraud One
place to start is by improving the automated detection of
risky orders so as to reduce manual order review volumes
Clearly the continued reliance on manual review we have
seen in the data over the last few years is not an optimal
long term strategy for managing online fraud As budgets
come under increasing pressure merchants will need
to redouble their efforts to automate more of the fraud
management process while keeping valid order conversion
high and fraud loss low
Base Those with 1 or more full-time manual review staff
Average Spending Allocation
for Fraud Management 2008
n=400
3rd Party
Tools
23
24
Internal
Tools amp
System
3rd Party
Tools
25
Order
Review
Staff
51
Planned Staffing Levels
Increase
13
21
Same
81
71
2009
2008
Decrease
6
8
n=238 248
26
23
C Y B E R S O U R C E 1 0 T H A N N U A L O N L I N E F R A U D R E P O R T
23copy2009 CyberSource Corporation All rights reserved
Resources amp Solutions
3 Managed Services
2 Design amp Installation
1 Systems amp Services
PAYMENT SECURITY
Order
Screening
Collection amp
Reconciliation
Global Payment
Acceptance
Processing
Management
L A S E R
BankBankTrans f e rTrans f e r
Direct
Debit
ORDER
bull Onlinebull Call Centerbull IVRbull Kioskbull POSbull ERP
With Performance
Guarantees
To find information on CyberSourcersquos industry-leading risk
management solutions self-paced webinars on decision
management and other whitepapers on electronic payment
management visit our Resource Center at
wwwcybersourcecom For sales assistance phone
1-888-330-2300 or e-mail salescybersourcecom
CyberSource Payment Management Solutions CyberSource offers a comprehensive portfolio of modular
services and tools to help your company manage your entire
payment pipeline to optimize sales results All are available
via one connection to our web-based services
Accept All Popular Payment Types in 190+
Countries
Accept payments worldwide using a merchant account from
your preferred provider or CyberSource worldwide credit
and debit cards regional cards direct debit bank
transfers electronic checks and alternative payment
types such as Bill Me Later and PayPal CyberSource
also provides professional services to help you
integrate payment with front-end and back-office
systems
Risk ManagementOrder Screening
Global Fraud Management Portal with CyberSource Intelligent
Review Technology A hosted rules and case management
system that provides on-demand access to over 150
validation tests and services across all four dimensions of
detection Detectors include multi-merchant transaction
history checks worldwide delivery address and phone
verification device fingerprinting IP geolocation purchase
velocity identity morphing and custom data from your
systems Case management system provides consolidated
data review workflow management and built-in callouts to
validation services to streamline review
Managed Services CyberSource provides client services to
help you analyze design and manage your order screening
and fraud detection processesmdasheverything from screening
strategies and risk threshold optimization analysis
to ongoing monitoring order review and chargeback
managementrecovery Our managed services include
business performance guarantees
Payer Authentication Verified by Visa MasterCard
SecureCode
Processing Management
CyberSource processes your payments in our high
availability datacenters located in the US Europe and
Japan All datacenters are certified PCI-compliant and
include sophisticated processing management logic to help
prevent payment failures and rate downgrades
Collection amp Reconciliation
A full array of online and exportable payment reporting
capability is available to streamline reconciliation activity
Further systems can be installed to automate up to 90
of the tasks associated with payment reconciliation and
chargeback re-presentment
Payment Security
Remove Payment Data From Your Network CyberSource
provides secure storage and hosted payment acceptance
services that let you process without storing or even
transmitting payment data A great way to streamline PCI
compliance and mitigate security risk
Payment System Centralization Our team of experts will help
you consolidate multiple payment systems into a single easy
to manage system Optionally CyberSource will also host
support and manage these systems in our secure datacenters
PCI Planning amp Remediation CyberSource provides PCI
compliance consulting and remediation services to help
remedy PCI issues
Professional Services
CyberSource maintains a team of experienced payment
consultants to assist with payment systems planning
system and process design and implementation and
integration Our client services team is additionally
available to help you monitor tune or fully outsource
portions of your payment operations
C Y B E R S O U R C E 1 0 T H A N N U A L O N L I N E F R A U D R E P O R T
North America
CyberSource Corporation
1295 Charleston Road
Mountain View CA 94043
T 8883302300
T 6509656000
F 6506259145
Email infocybersourcecom
Europe
CyberSource Ltd
The Waterfront
300 Thames Valley Park Drive
Thames Valley Park
Reading RG6 1PT
United Kingdom
T +44 (0) 1189294840
F +44 (0) 8704601931
Email ukcybersourcecom
UK Fraud Report wwwcybersourcecoukukfraudreport
Japan
CyberSource KK (Japan)
3-11-11 Shibuya Shibuya-ku
Tokyo 150-0002 Japan
T +81357747733
F +81357747732
Email mailcybersourcecojp
CyberSource Corporation is a leading provider of
electronic payment risk and security management
solutions CyberSource provides payment management
solutions for electronic payments processed via Web
call center kiosk mobile and POS environments
Services include hosted systems to help you manage
electronic payments as well as professional services
to help design integrate and fully manage parts or all
of your payment operations Over 245000 businesses
worldwide use CyberSource solutions including half
the companies comprising the Dow Jones Industrial
Average and leading Internet brands The company
is headquartered in Mountain View California and
has sales and service offices in Japan the United
Kingdom and other locations in the United States
For More Information
bull Call 18883302300
bull Email infocybersourcecom
bull Visit wwwcybersourcecom
Get Tailored Views of Risk Management
Pipelinetrade MetricsTo get a view crafted for your companyrsquos size and industry
please contact CyberSource at 18883302300 or online at
wwwcybersourcecomcontact_us
For additional information whitepapers and webinars
or sales assistance
bull Contact CyberSource 18883302300 or
wwwcybersourcecomcontact_us
bull Risk Management Solutions visit wwwcybersourcecom
products_and_servicesrisk_management
bull Global Payment amp Security Solutions
visit wwwcybersourcecomproducts_and_services
global_payment_services
About CyberSource
C Y B E R S O U R C E 1 0 T H A N N U A L O N L I N E F R A U D R E P O R T
10
C Y B E R S O U R C E 1 0 T H A N N U A L O N L I N E F R A U D R E P O R T
Orders which do not pass the automated order screening
stage typically enter a manual review queue During this
stage additional information is collected to determine if
orders should be accepted or rejected due to excessive
fraud risk
Manual review represents a critical area of profit leakage
It is expensive limits scalability and impacts customer
satisfaction For many merchants it represents half of
their fraud management budget Only 13 of merchants
say they have budget available to increase review
staff now or in the next twelve months This presents
significant challenges to profit growth since even at a
stable percent of orders sent to review the total number
of orders that must be reviewed increases in step with the
total increase of online sales
Manual Order Review RatesIn what should be a highly automated sales environment
most merchants are manually checking orders In fact
during the past six years overall 1 out of every 4 orders
transacted online have been manually reviewed (see chart
4) Over the same period merchants who conduct manual
review typically reviewed 1 out of 3 orders they received
Merchants of all sizes use manual review to manage
payment fraud Chart 5 shows smaller merchants review
a higher percentage of orders (perhaps because lower
order volumes permit such practice) but even larger
merchants review a significant percentage of online
ordersmdashand likely devote more resources to this task than
is operationally scalable
One consequence of using more fraud detection tools
during automated screening is a greater chance of one
or more flags being raised resulting in an order being
selected for manual review Adding additional tools to
detect fraud may result in downstream impacts and
costs if these tools are not carefully integrated into a
merchantrsquos review process and tuned to a merchantrsquos
specific situation
Merchants expecting increased online sales will need to
take at least one of the following actions 1) divert more
staff time to the order review process 2) increase staffing
levels 3) allow more time to process orders and ship good
ones or 4) improve accuracy of initial automated sorting
and make the subsequent review process more efficient
Review Tools amp PracticesGiven the reported limitations on hiring additional manual
review staff there is increased focus on investing in tools
and systems to increase the productivity and effectiveness
of review staff While the primary focus should be on
improving initial automated sorting accuracy to decrease
need for review attention to streamlining the review
process is also warranted
Stage 2 Manual Review
Automated
Screening1
Manual
Review2
Accept
Reject3
Fraud Claim
Management4ORDER
RETAINED
REVENUE
Tuning and Management
40
0
2004 2005 2006
Manual Review Trends
2007 2008
30
20
10
5
15
25
35
Over the past 5 years on average 1 out of 4 online orders were
manually reviewed Merchants performing manual review have
on average reviewed 1 out of every 3 orders received
35
26
Orders Reviewed by Merchants Practicing Review Orders Reviewed Overall (Net Review)
23
28
27
33
22
32
27
34
4
11
C Y B E R S O U R C E 1 0 T H A N N U A L O N L I N E F R A U D R E P O R T
11copy2009 CyberSource Corporation All rights reserved
Use of Case Management Systems
Currently 1 out of 3 merchants report having a case
management system that supports their manual review
process and staff Over half of merchants either
currently use a case management system or
plan to implement one in 2009 For large
online merchants 65 report currently using
or planning to implement a case management
system
Merchants using a case management system
are also more likely to be able to track fraud
rates on orders which have gone through
manual review 74 of merchants using case
management systems report tracking fraud
rates for manually reviewed orders vs only
42 being able to do so when not using a
case management system Surprisingly 44
of merchants performing manual order review
say they do not track the fraud rates of orders
which have been manually reviewed and 24
of large merchants say they do not have this
information Without knowing the fraud rate
on orders going through manual review and
who reviewed them it is difficult to determine
training needs or other actions to improve the
effectiveness of manual review
Tools UsedPlanned During Manual Review
While many of the tools or detector results used
during automated screening can also be used
during manual review several additional tools
and processes are employed by manual reviewers
Attempting to validate an order by contacting the
customer is standard practice for 7 out of 10
merchants and 82 of large merchants However
most organizations have policies regarding how
quickly they must clear orders through manual
review and how long they will wait for customers
to respond to requests for additional information
Most merchants try to clear orders through manual
review in one business day and say they will not
wait more than three business days for a customer
to respond to a request for more information (see
charts 7 and 8)
Another practice used only in manual review is to
contact the card issuer This action is taken by
almost half of merchants overall and 60 of large
merchants Telephone number validation reverse
lookup is the third most popular tool with 56 of
merchants using it during manual review vs 25
during automated screening
In 2008 two-thirds of merchants reported using
four or more fraud detection tools for manual review with
49 tools being the average Larger merchants reported
using 61 detection tools on average
35
15
5
25
30
10
20
40
45
50
55
0
Average of Orders Manually Reviewed(for merchants engaged in review)
200620072008
lt$500K
36
43
51
$500K ndash lt$5M
36
45
35
$5M ndash lt$25M
25
40
34
$25M+
15
14
15
o
f O
rder
s
Annual Online Revenues
5
Currently usePlan to implement in 2009Do not use or plan to implement
Use or Plan to Implement Case Management System
to Support Manual Order Review Process
18
4933
n=227
All Merchants
35
39
26
n=84
Merchants $25M+
Base Those conducting manual review
6
12
C Y B E R S O U R C E 1 0 T H A N N U A L O N L I N E F R A U D R E P O R T
35
15
5
25
50
30
10
20
40
45
0
Time Allowed for Customer Response
Source 2008 CyberSource Fraud Report
Half day
or less
10
Same
business
day
10
Next
business
day
14
2-3
business
days
37
4-5
business
days
11
6 or more
business
days
19
8
Fraud Detection Tool Usage During Manual Review
All Merchants Merchants $25M+ Online Revenue
69 11
56 15
49 10
45 12
23 14
9 7
currently using planning to begin use (in 2009)
Current n=265 Future Plans n=109 Current n=89 Future Plans n=43
VALIDATION SERVICES
Telephone number verificationreverse lookup
Credit history check
Paid for public records service
Contact customer to verify order
Contact card issuerAmex CVP
Postal address validation services
82 5
74 5
60 14
46 7
45 14
6 12
72 8
49 14
35 13
22 17
SINGLE MERCHANT PURCHASE HISTORY
Positive lists
Customer order history
Valid customer website behavior analysis
Negative lists (in-house lists)
83 5
69 12
37 14
34 30
40 20
PURCHASE DEVICE TRACING
IP geolocation information 55 28
11 28
MULTI-MERCHANT PURCHASE HISTORY
Shared negative lists ndash shared hotlists 16 35
9
35
15
5
25
30
10
20
40
45
50
0
Time to Clear Orders in Manual Review (2008)
Over two-thirds of merchants clear
orders through manual review
in one business day72
1 hour
or less
26
2-4
hours
10
Same
business
day
36
Next
business
day
18
2-3
business
days
8
4-5
business
days
1
6 or more
business
days
1
n=259
7
13
C Y B E R S O U R C E 1 0 T H A N N U A L O N L I N E F R A U D R E P O R T
13copy2009 CyberSource Corporation All rights reserved
The most popular tools currently used in the manual
review process are shown in chart 9 including the
percent of merchants planning to add each tool in 2009
Review Operations Efficiency
Reviewer Efficiency
The average number of orders a reviewer processed in a
day ranged from 22 for small merchants to 124 for large
(see chart 10) Large merchants who typically have case
management systems achieve a 5X higher throughput
per reviewer in the manual review stage possibly due to
greater use of review systems and detection tools during
manual review On average reviewers spent 7 minutes
reviewing each order in 2008
Time to Ramp New Staff
New to this yearrsquos surveymdashmerchants were asked how
long it takes for an order reviewer to attain acceptable
proficiency in his or her job While the learning curve
varies by type and size of online merchant the median
time reported was 4 weeks Larger merchants reported a
median of 6 weeks for a reviewer to achieve acceptable
proficiency Chart 11 shows the distribution of learning
times reported
Staff Tenure
Given the cost and time required to recruit and train
new staff merchants need to focus on staff retention
Fraud rates or order rejection rates can increase if highly
experienced review staff leave an organization and are
either not replaced or replaced by less experienced
reviewers 85 of review staff have been on the job
for one year or more Merchants report on average that
15 of their review staff were new in 2008 For large
merchants 24 of their staff were new in 2008 (see
chart 12) Efficient training and methods to ensure
consistent and accurate disposition of orders will be key
as merchants seek to optimize operating efficiency
Final Order DispositionAutomated screening and manual order review ultimately
result in order acceptance or rejection A relatively high
percentage of orders manually reviewed are ultimately
accepted (see next section)mdashhighlighting the need for
merchants to improve automated screening accuracy and
reduce the need for review A look at order reject and
acceptance rates follows in Stage 3 of the pipeline review
Overall $500K ndash lt$5Mlt$500K $5M ndash lt$25M $25M+
Average Orders Reviewed Per DayReviewer(by merchant size)
n=185
124
46
2322
68
10
Median of Weeks
4
52
Number of Weeks Required to Train New Reviewer
lt1
3
1
11
2
10
3
11
4
21
5-9
28
10-14
11
15+
5
n=159
11
Overall $500K ndash lt$5Mlt$500K $5M ndash lt$25M $25M+
of Review Staff New in 2008
n=206
24
1413
7
15
12
14
C Y B E R S O U R C E 1 0 T H A N N U A L O N L I N E F R A U D R E P O R T
Post-Review Order Acceptance RatesMerchants who manually review orders indicated they
ultimately accepted nearly frac34 of the orders they manually
reviewed (see chart 13) This was similar to the
proportion reported in 2007 50 of merchants report
they accept 90 or more of orders they manually review
These merchants are incurring significant expense
to find the 10 of the review queue they believe to be
too risky to accept Clearly most merchants require better
methods to determine which orders are to be outsorted for
manual review so only truly suspicious orders receive
human attention
Stage 3 Order Dispositioning (AcceptReject)
Automated
Screening1
Manual
Review2
Accept
Reject3
Fraud Claim
Management4ORDER
RETAINED
REVENUE
Tuning and Management
of Merchants Reporting This Level
of Post-Review Acceptance
1380 ndash 89
4490 ndash 99
6100
970 ndash 79
360 ndash 69
750 ndash 59
140 ndash 49
330 ndash 39
420 ndash 29
510 ndash 19
51 ndash 9
20
50 accept 90+
Post-Review Acceptance Trends
70
30
10
50
100
60
20
40
80
90
0
Most orders that enter manual review are accepted
2003
66
2004
71
2005
69
2006
66
2007
75
2008
73
of Orders Accepted in Review
13
15
C Y B E R S O U R C E 1 0 T H A N N U A L O N L I N E F R A U D R E P O R T
15copy2009 CyberSource Corporation All rights reserved
Overall Order Rejection RatesOrder reject rates can reflect true fraud
risk or signal ldquoprofit leaksrdquo in terms of
valid order rejection or unnecessarily
high rates of manual review In 2008 for
the first time in several years merchants
participating in the survey reported a
significant drop in their order rejection
rates from 42 in 2007 to 29 (see
chart 14)
Order rejection rates dropped in 2008 for
almost every size of merchant (see chart
15) except the very smallest and for
every industry segment (see chart 16)
It is likely that as online sales growth
slows and merchants seek to sustain
revenue levels merchants will look for
ways to accept more orders and reduce
orders rejected due to suspicion of fraud
In 2008 merchants were able to successfully reduce order
rejection rates while holding fraud rates stable It remains
to be seen if order rejection rates can be reduced further
in 2009 without an increase in fraud rates or manual
order review
Order rejection rates also vary by type of product and
merchant profile Chart 16 shows that segments which
have high cost of goods sold andor lower gross margins
tend to have higher order rejection rates Each fraud loss
in this arena has a large negative profit impact Consumer
electronics and jewelryapparel are two examples of online
segments that tend to have higher-than-average order
rejection rates
Yet even within similar groups of online merchants we
see that some merchants achieve low order rejection rates
while still keeping fraudulent order rates under control
Examining the large consumer electronics merchants in
the sample we find that half of these merchants report
35
15
05
25
50
30
10
20
40
45
0
Order Rejection Trends
2005
39
2006
41
2007
42
2008
29
14
Average Orders Rejected Due to Suspicion of Fraud
2007 n=2392008 n=326
Overall $500K ndash lt$5Mlt$500K $5M ndash lt$25M $25M+0
6
4
2
1
3
5
7
8
9
10
45
26
43
64
24
39
27
262
9
42
Order Rejection Rates by Selected Online Segment20072008
n=23
9
n=32
6
n=64
n=95
n=63
n=62
n=35
n=57
n=62
n=85
n=62
n=85
Overall Media amp
Entertainment
Digital Goods
ServicesApparel
Jewelry
Consumer
Electronics
49
34
32
56
42
56
32
42
29
42
Household amp
General Merchandise
22
31
15
16
16
C Y B E R S O U R C E 1 0 T H A N N U A L O N L I N E F R A U D R E P O R T
order rejection rates of 2 or less while maintaining
fraudulent order rates at or even below the average for
their segment
International Orders RiskierMerchants consistently report a much higher level of
order rejection on international orders due to suspicion
of payment fraud In 2008 merchants report their
rejection rate on these orders is over three and one half
times that of domestic orders as shown in chart 17
The actual fraud rate experienced on international orders
supports this cautious approach as merchants report the
fraud risk on international orders is also over three and
one half times that of domestic orders
Order Rejection Trends
of total USCanadian orders rejected of international orders rejected
Historically international order rejection rates
average 32x higher than USCanadian rates
2005 20072006 2008
6
4
2
1
3
5
7
8
9
12
11
10
13
14
42
11
11
29
13
41
12
39
0
15
17
17
C Y B E R S O U R C E 1 0 T H A N N U A L O N L I N E F R A U D R E P O R T
17copy2009 CyberSource Corporation All rights reserved
Fighting ChargebacksThis yearrsquos survey once again examined online merchantsrsquo
practices associated with reviewing and contesting
chargebacks (ldquore-presentmentrdquo) Over the past four years
the share of fraud-coded chargebacks merchants contest
has averaged 43 to 53 with the 2008 average at
50 Medium and large merchants report contesting 52
and 46 respectively of their fraud-coded chargebacks
in 2008 However when we look at the distribution of
merchantsrsquo answers to this question we find that over one
third of merchants are disputing 90 or more of their
fraud chagebacks while three out of ten merchants are
disputing less than 10 of their fraud chargebacks (see
chart 18)
Merchants report that they win on average 44 of the
chargebacks they dispute which is very similar to the 42
win rate reported in 2006 and 40 in 2007 Simply using
the average percent of chargebacks that are disputed (50)
times the average win rate of 44 results in a net recovery
rate of 22 (meaning 22 of all fraud-coded chargebacks
are recovered) However given the wide disparity in the
chargeback re-presentment rate when these are calculated
on a merchant-by-merchant basis and then averaged the
re-presentment win rate rises to 28 (see chart 19 on
next page) the same recovery rate that was found in 2007
Therefore disputing most fraud chargebacks and having
an efficient re-presentment process can help enhance
profitability and reduce fraud loss
Stage 4 Fraud Claim Management
Automated
Screening1
Manual
Review2
Accept
Reject3
Fraud Claim
Management4ORDER
RETAINED
REVENUE
Tuning and Management
Average Total Fraud-Coded
Chargebacks Re-presented of Merchants Reporting
this Re-presentment Rate
480 ndash 89
790 ndash 99
100
370 ndash 79
460 ndash 69
450 ndash 59
540 ndash 49
130 ndash 39
520 ndash 29
810 ndash 19
1 ndash 9
0
C
harg
ebac
ks R
e-pr
esen
ted
Overall $500K ndash lt$5Mlt$500K $5M ndash lt$25M $25M+
Annual Online Revenue
2006 n=1612007 n=1002008 n=120
50
53
47
36
38
48 52
46
5863
56
56
46
45
53
15
15
28
18
18
C Y B E R S O U R C E 1 0 T H A N N U A L O N L I N E F R A U D R E P O R T
Chargeback Management ToolsOf course disputing chargebacks is not an easy or cost-
free process Merchants must manage and organize all
order delivery and payment information to successfully
dispute fraudulent orders with financial institutions
Merchants are beginning to adopt automated systems
for handling this aspect of the pipeline One out of five
merchants reported using chargeback management tools
in 2008 and 37 of large merchants reported using
these tools In our 2006 survey we asked merchants to
provide estimates of how many hours it takes on average
to handle a fraud chargeback The average time spent
overall was 18 hours with a median time of 10 hours
to handle a fraud chargeback (total time consumed
for research documentation submission) The largest
merchants reported a median time of 30 minutes per fraud
chargeback Clearly fraud chargeback management is a
significant expense for merchants
ChargebacksmdashOnly Half the Problem How a fraudulent order is handled can have a significant
impact on bottom line profits Fraudulent orders are
presented to the merchant via two main routes as a
chargeback or as a direct request from a consumer
for credit (they claim fraudulent use of their account)
Although chargebacks are the most often cited metric
merchants report that chargebacks actually account for less
than half of all fraud claims This is true for all sizes of
merchants (see chart 20)
In 2007 large ($25M+ online sales) merchants reported
that 57 of their fraud was presented in the form of a
fraud-coded chargeback but in 2008 this dropped back
to 48 Considering the financial impact of both fraud
claim routes (chargebacks and credit issuancereversal)
some merchants encourage direct consumer contact
to address fraud claims and thus avoid the additional
chargeback fees levied by the merchant bankprocessor If
a consumer contacts the merchant first then the decision
is in the merchantrsquos control to either handle the dispute
directly with the consumer or to advise them to initiate a
fraud chargeback process In any event if merchants are
evaluating fraud losses solely on the basis of chargebacks
the actual rate of fraud loss the business is experiencing
may be as much as two times higher due to direct credit
issuancecharge reversal
Overall $500K ndash lt$5Mlt$500K $5M ndash lt$25M $25M+
Fraud Chargeback Re-presentment
Win RateNet Recovery Rate
Annual Online Revenues
Challenged Net Recovery
44AVERAGEWINRATE
46AVERAGEWINRATE
43AVERAGEWINRATE
54AVERAGEWINRATE
32AVERAGEWINRATE
50
28
36
23
52
38
63
35
46
19
10
0
20
30
40
50
60
70
80
90
100
(Net Recovery Rate is expressed as a of all fraud-coded chargebacks)
19
Overall $500K ndash lt$5Mlt$500K $5M ndash lt$25M $25M+
of Fraud Claims
Chargebacks vs Credit Issued by Merchant
Credits IssuedChargebacks
58
42
76
24
57
43
52
48
52
48
n=25
n=14
7
n=27
n=30
n=55
Annual Online Revenue
n=147
10
0
20
30
40
50
60
70
80
90
100
20
19
C Y B E R S O U R C E 1 0 T H A N N U A L O N L I N E F R A U D R E P O R T
19copy2009 CyberSource Corporation All rights reserved
Fraud Rate MetricsWhen monitoring the level and trend of online
fraud loss we focus on three key metrics
1) Overall revenue lost as a percent of total
online sales 2) percent of accepted orders
which turn out to be fraudulent (domestic and
international) and 3) the average value of a
fraudulent order relative to a valid order Fraud
rates vary widely by merchant and depend on a
variety of factors such as online sales volume
type of products or services sold online and
how such productsservices are delivered and
paid for It is important that merchants track
key fraud metrics over time and evaluate their
performance relative to their peer group (both
size and industry) Note this report provides
benchmarks on total fraud rates (chargebacks +
credits issued directly to consumers by merchants)
As such these metrics tend to be higher
than those reported by banks and credit card
associations which generally base reported rates
on chargeback activity only
Depending on which products or services are being sold
online fraud loss risk tolerances and order rejection
rates can vary significantly Merchants selling high
cost goods with relatively low gross margins like most
consumer electronics products tend to err on the side
of rejecting more orders to avoid expensive fraud losses
Merchants who are less subject to fraud attacks can
achieve similar fraud loss rates while rejecting
relatively few orders Over the past few years
as fraud rates have remained relatively stable
we have compiled data on fraud practices and
benchmarks by industry
Direct Revenue Loss Rates
Very large merchants typically use more tools
and have more experience and resources to
manage online fraud so their fraud rates tend
to be lower than the overall rate Revenue loss
measurement includes not only the value of
orders on which fraudulent chargebacks are
received but also the cost of any credits issued
to avoid such chargebacks Figures include both
chargebacks and credits issued directly by the
merchant in response to fraud claims
Fraudulent Order Rate for Accepted Orders
Another key metric is the number of accepted orders that
later turn out to be fraudulent Expressed as a percent of total
orders this metric is typically lower than the revenue loss
percent since the average value of fraudulent orders tends
to be greater than the average value of valid orders which
causes the fraud rate as measured by revenues to be higher
Overall 38 of merchants reported experiencing a fraudulent
order rate of 1 or more in 2008 which was the same
percent reported in 2007
20072008
Average Online Revenue Lost to Payment Fraud
(chargebacks amp fraud-related credits)
Overall $500K ndash lt$5Mlt$500K $5M ndash lt$25M $25M+
Annual Online Revenue
0
12
08
04
02
06
10
14
16
18
14 1
5 16
15
121
3
13
15
14
14
20072008
Average Accepted Orders Resulting in Fraud Losses
Overall $500K ndash lt$5Mlt$500K $5M ndash lt$25M $25M+
Annual Online Revenue
0
12
08
04
02
06
10
14
16
18
16
11
13
12
11
13
11
13
11
13
A fraud chargeback was received on the orders OR a credit was issued directly to a customerwho claims not to have placed an order
21
22
20
C Y B E R S O U R C E 1 0 T H A N N U A L O N L I N E F R A U D R E P O R T
International Orders Carry Higher Risk
Fifty-two percent of merchants surveyed accepted orders
from outside the US amp Canada in 2008 International
sales accounted for an average of 17 of total orders
for these merchants That same group reported that the
actual direct fraud rate on international orders averaged
40 or more than 36 times the overall fraud rate for
domestic online orders Though international markets
represent an attractive opportunity online merchants must
make sure that their fraud detection and management
systems are robust enough to handle the additional risk
involved Merchants who sell online outside of the US
amp Canada report that they reject international orders due
to suspicion of fraud at a rate that is over three and one
half times the US and Canadian average rate of 29
mdash rejecting approximately 1 out of every 9 international
orders received
Average Value of Fraudulent Order Higher than a Valid Order
Historically fraudulent orders tend to have higher values
on average than valid orders In 2008 the median value
of a fraudulent order was $200 compared to $130 median
value reported for valid orders This relationship of higher
fraudulent order values vs valid order value was found for
all merchant size categories as chart 24 shows Since
fraudulent orders tend to be somewhat higher in value than
valid orders merchants will tend to outsort more high value
orders for manual review and verification Large online
merchants reported that the median value of an order
flagged for manual review was $245
Valid vs Fraudulent Order Value
Valid orderFraudulent order
Median used to minimize impact of outliers
Overall $500K ndash lt$5Mlt$500K $5M ndash lt$25M $25M+
Annual Online Revenue
0
$200
$50
$100
$150
$250
$300
$350
$120
$150
$200
$150
$250
$175
$150
$100
$200
$130
24
40
10
05
20
15
25
35
45
30
00
International Fraud Rateover 3x USCanadian rate
11
40
Location of Order Origination
Within USCanadan=326
Outside USCanadan=164
Frau
d R
ate
o
f O
rder
s
23
21
C Y B E R S O U R C E 1 0 T H A N N U A L O N L I N E F R A U D R E P O R T
21copy2009 CyberSource Corporation All rights reserved
Tuning amp Management
Maintaining and Tuning Screening Rules28 of merchants say they have an automated order
screening system in place that allows business managers
to modify decision rules without assistance from internal
IT staff or external parties (up from 16 found in 2006)
The ability to adjust automated order screening systems
quickly helps manage the order review flow tailor rules
to new products and adapt to new fraud trends as they
are encountered Without this ability merchants cannot
easily minimize reject rates review costs or fraud rates
Additionally giving business managers the capability of
adjusting business rules on-the-fly reduces the costs and
burden of IT support
Global Fraud Portals Some online merchants are integrating fraud tools
and strategies via fraud management portals These
portals employ a combination of flexible rules systems
that interact with a portfolio of ldquotruth servicesrdquo around
the globe allowing business managers to set payment
type product type and market-specific screens Case
management systems are being integrated with these
portals with accompanying enhancements to streamline
workflow Global fraud portals typically include hierarchical
management as companies strive to centralize fraud
management across multiple lines of business and
geographies
Merchant Budgets for Fraud Management How much are online merchants spending to mitigate
fraud risk In both 2008 and in 2007 survey results
show that 34 of merchants spend 05 or more of
their online revenues to manage online payment fraud
while 66 spend less than 05 In 2008 across
all merchants the median ratio of fraud management
expense to sales was 022 down from 028 in 2007
although some merchants in high risk categories are
spending significantly more These spending estimates
focus on the cost of managing fraud risk (internal and
external systems and services management development
and review staffs) Direct fraud loss (chargebacks lost
goods and associated shipping costs) as well as the
opportunity cost associated with valid order rejection are
not included here (see chart 25)
Automated
Screening1
Manual
Review2
Accept
Reject3
Fraud Claim
Management4ORDER
RETAINED
REVENUE
Tuning and Management
02ndash lt050ndash lt02 05ndash lt10 10ndash lt40 40+
How Much Merchants Spend
on Fraud Management
(percent of merchants operating at defined expense level)
of Annual Online Revenues Spent to Manage Fraud(staff etc excluding fraud loss)
2007 n=972008 n=108
41 44
6
14
24
22
12 16
16
4
Median2008 = 022
2007 = 028
0
60
40
20
25
title (title)
22
C Y B E R S O U R C E 1 0 T H A N N U A L O N L I N E F R A U D R E P O R T
Budget Allocation For the past three years merchants have consistently
spent just over half their fraud management budgets on
review staff (see chart 26) The remainder is allocated
as follows 25 for third party tools or services and 24
on internally developed tools and systems
Clearly review staff costs are the dominant factor and
only 13 of merchants cite plans to increase review
staffing in 2009 Reducing the need for manual review
and increasing the efficiency and effectiveness of
reviewers is key to growing online business profits and
managing the total cost of online payment fraud One
place to start is by improving the automated detection of
risky orders so as to reduce manual order review volumes
Clearly the continued reliance on manual review we have
seen in the data over the last few years is not an optimal
long term strategy for managing online fraud As budgets
come under increasing pressure merchants will need
to redouble their efforts to automate more of the fraud
management process while keeping valid order conversion
high and fraud loss low
Base Those with 1 or more full-time manual review staff
Average Spending Allocation
for Fraud Management 2008
n=400
3rd Party
Tools
23
24
Internal
Tools amp
System
3rd Party
Tools
25
Order
Review
Staff
51
Planned Staffing Levels
Increase
13
21
Same
81
71
2009
2008
Decrease
6
8
n=238 248
26
23
C Y B E R S O U R C E 1 0 T H A N N U A L O N L I N E F R A U D R E P O R T
23copy2009 CyberSource Corporation All rights reserved
Resources amp Solutions
3 Managed Services
2 Design amp Installation
1 Systems amp Services
PAYMENT SECURITY
Order
Screening
Collection amp
Reconciliation
Global Payment
Acceptance
Processing
Management
L A S E R
BankBankTrans f e rTrans f e r
Direct
Debit
ORDER
bull Onlinebull Call Centerbull IVRbull Kioskbull POSbull ERP
With Performance
Guarantees
To find information on CyberSourcersquos industry-leading risk
management solutions self-paced webinars on decision
management and other whitepapers on electronic payment
management visit our Resource Center at
wwwcybersourcecom For sales assistance phone
1-888-330-2300 or e-mail salescybersourcecom
CyberSource Payment Management Solutions CyberSource offers a comprehensive portfolio of modular
services and tools to help your company manage your entire
payment pipeline to optimize sales results All are available
via one connection to our web-based services
Accept All Popular Payment Types in 190+
Countries
Accept payments worldwide using a merchant account from
your preferred provider or CyberSource worldwide credit
and debit cards regional cards direct debit bank
transfers electronic checks and alternative payment
types such as Bill Me Later and PayPal CyberSource
also provides professional services to help you
integrate payment with front-end and back-office
systems
Risk ManagementOrder Screening
Global Fraud Management Portal with CyberSource Intelligent
Review Technology A hosted rules and case management
system that provides on-demand access to over 150
validation tests and services across all four dimensions of
detection Detectors include multi-merchant transaction
history checks worldwide delivery address and phone
verification device fingerprinting IP geolocation purchase
velocity identity morphing and custom data from your
systems Case management system provides consolidated
data review workflow management and built-in callouts to
validation services to streamline review
Managed Services CyberSource provides client services to
help you analyze design and manage your order screening
and fraud detection processesmdasheverything from screening
strategies and risk threshold optimization analysis
to ongoing monitoring order review and chargeback
managementrecovery Our managed services include
business performance guarantees
Payer Authentication Verified by Visa MasterCard
SecureCode
Processing Management
CyberSource processes your payments in our high
availability datacenters located in the US Europe and
Japan All datacenters are certified PCI-compliant and
include sophisticated processing management logic to help
prevent payment failures and rate downgrades
Collection amp Reconciliation
A full array of online and exportable payment reporting
capability is available to streamline reconciliation activity
Further systems can be installed to automate up to 90
of the tasks associated with payment reconciliation and
chargeback re-presentment
Payment Security
Remove Payment Data From Your Network CyberSource
provides secure storage and hosted payment acceptance
services that let you process without storing or even
transmitting payment data A great way to streamline PCI
compliance and mitigate security risk
Payment System Centralization Our team of experts will help
you consolidate multiple payment systems into a single easy
to manage system Optionally CyberSource will also host
support and manage these systems in our secure datacenters
PCI Planning amp Remediation CyberSource provides PCI
compliance consulting and remediation services to help
remedy PCI issues
Professional Services
CyberSource maintains a team of experienced payment
consultants to assist with payment systems planning
system and process design and implementation and
integration Our client services team is additionally
available to help you monitor tune or fully outsource
portions of your payment operations
C Y B E R S O U R C E 1 0 T H A N N U A L O N L I N E F R A U D R E P O R T
North America
CyberSource Corporation
1295 Charleston Road
Mountain View CA 94043
T 8883302300
T 6509656000
F 6506259145
Email infocybersourcecom
Europe
CyberSource Ltd
The Waterfront
300 Thames Valley Park Drive
Thames Valley Park
Reading RG6 1PT
United Kingdom
T +44 (0) 1189294840
F +44 (0) 8704601931
Email ukcybersourcecom
UK Fraud Report wwwcybersourcecoukukfraudreport
Japan
CyberSource KK (Japan)
3-11-11 Shibuya Shibuya-ku
Tokyo 150-0002 Japan
T +81357747733
F +81357747732
Email mailcybersourcecojp
CyberSource Corporation is a leading provider of
electronic payment risk and security management
solutions CyberSource provides payment management
solutions for electronic payments processed via Web
call center kiosk mobile and POS environments
Services include hosted systems to help you manage
electronic payments as well as professional services
to help design integrate and fully manage parts or all
of your payment operations Over 245000 businesses
worldwide use CyberSource solutions including half
the companies comprising the Dow Jones Industrial
Average and leading Internet brands The company
is headquartered in Mountain View California and
has sales and service offices in Japan the United
Kingdom and other locations in the United States
For More Information
bull Call 18883302300
bull Email infocybersourcecom
bull Visit wwwcybersourcecom
Get Tailored Views of Risk Management
Pipelinetrade MetricsTo get a view crafted for your companyrsquos size and industry
please contact CyberSource at 18883302300 or online at
wwwcybersourcecomcontact_us
For additional information whitepapers and webinars
or sales assistance
bull Contact CyberSource 18883302300 or
wwwcybersourcecomcontact_us
bull Risk Management Solutions visit wwwcybersourcecom
products_and_servicesrisk_management
bull Global Payment amp Security Solutions
visit wwwcybersourcecomproducts_and_services
global_payment_services
About CyberSource
C Y B E R S O U R C E 1 0 T H A N N U A L O N L I N E F R A U D R E P O R T
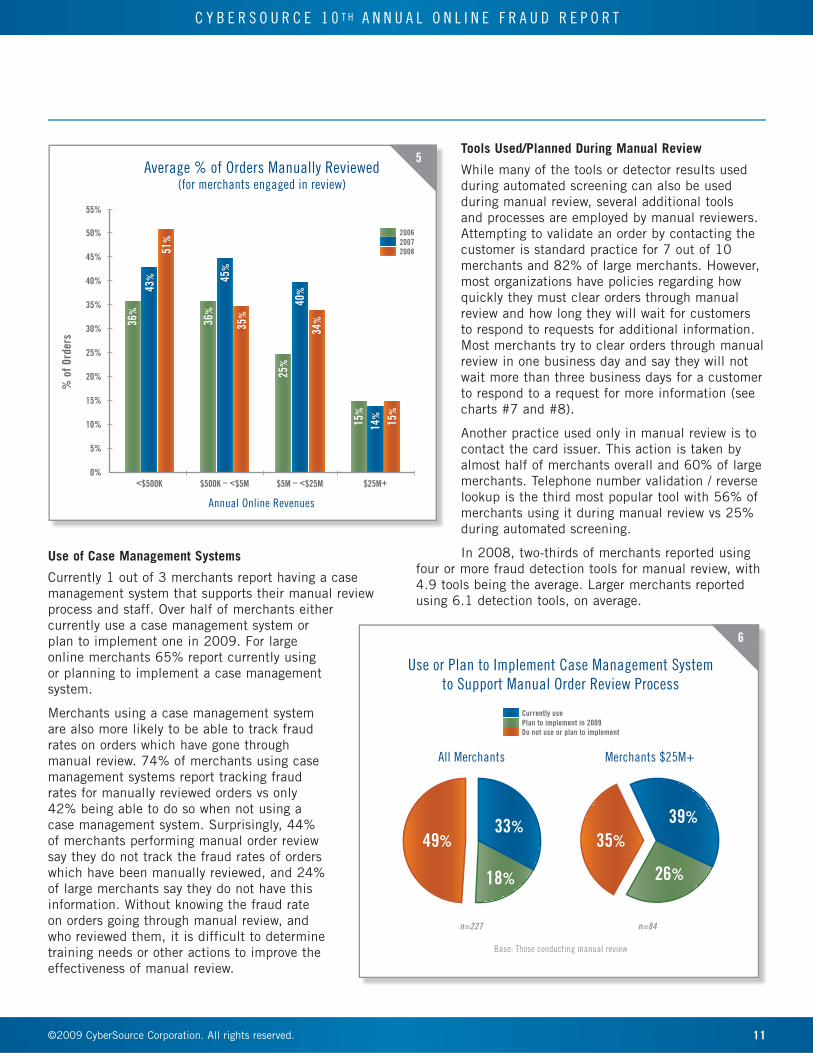
11
C Y B E R S O U R C E 1 0 T H A N N U A L O N L I N E F R A U D R E P O R T
11copy2009 CyberSource Corporation All rights reserved
Use of Case Management Systems
Currently 1 out of 3 merchants report having a case
management system that supports their manual review
process and staff Over half of merchants either
currently use a case management system or
plan to implement one in 2009 For large
online merchants 65 report currently using
or planning to implement a case management
system
Merchants using a case management system
are also more likely to be able to track fraud
rates on orders which have gone through
manual review 74 of merchants using case
management systems report tracking fraud
rates for manually reviewed orders vs only
42 being able to do so when not using a
case management system Surprisingly 44
of merchants performing manual order review
say they do not track the fraud rates of orders
which have been manually reviewed and 24
of large merchants say they do not have this
information Without knowing the fraud rate
on orders going through manual review and
who reviewed them it is difficult to determine
training needs or other actions to improve the
effectiveness of manual review
Tools UsedPlanned During Manual Review
While many of the tools or detector results used
during automated screening can also be used
during manual review several additional tools
and processes are employed by manual reviewers
Attempting to validate an order by contacting the
customer is standard practice for 7 out of 10
merchants and 82 of large merchants However
most organizations have policies regarding how
quickly they must clear orders through manual
review and how long they will wait for customers
to respond to requests for additional information
Most merchants try to clear orders through manual
review in one business day and say they will not
wait more than three business days for a customer
to respond to a request for more information (see
charts 7 and 8)
Another practice used only in manual review is to
contact the card issuer This action is taken by
almost half of merchants overall and 60 of large
merchants Telephone number validation reverse
lookup is the third most popular tool with 56 of
merchants using it during manual review vs 25
during automated screening
In 2008 two-thirds of merchants reported using
four or more fraud detection tools for manual review with
49 tools being the average Larger merchants reported
using 61 detection tools on average
35
15
5
25
30
10
20
40
45
50
55
0
Average of Orders Manually Reviewed(for merchants engaged in review)
200620072008
lt$500K
36
43
51
$500K ndash lt$5M
36
45
35
$5M ndash lt$25M
25
40
34
$25M+
15
14
15
o
f O
rder
s
Annual Online Revenues
5
Currently usePlan to implement in 2009Do not use or plan to implement
Use or Plan to Implement Case Management System
to Support Manual Order Review Process
18
4933
n=227
All Merchants
35
39
26
n=84
Merchants $25M+
Base Those conducting manual review
6
12
C Y B E R S O U R C E 1 0 T H A N N U A L O N L I N E F R A U D R E P O R T
35
15
5
25
50
30
10
20
40
45
0
Time Allowed for Customer Response
Source 2008 CyberSource Fraud Report
Half day
or less
10
Same
business
day
10
Next
business
day
14
2-3
business
days
37
4-5
business
days
11
6 or more
business
days
19
8
Fraud Detection Tool Usage During Manual Review
All Merchants Merchants $25M+ Online Revenue
69 11
56 15
49 10
45 12
23 14
9 7
currently using planning to begin use (in 2009)
Current n=265 Future Plans n=109 Current n=89 Future Plans n=43
VALIDATION SERVICES
Telephone number verificationreverse lookup
Credit history check
Paid for public records service
Contact customer to verify order
Contact card issuerAmex CVP
Postal address validation services
82 5
74 5
60 14
46 7
45 14
6 12
72 8
49 14
35 13
22 17
SINGLE MERCHANT PURCHASE HISTORY
Positive lists
Customer order history
Valid customer website behavior analysis
Negative lists (in-house lists)
83 5
69 12
37 14
34 30
40 20
PURCHASE DEVICE TRACING
IP geolocation information 55 28
11 28
MULTI-MERCHANT PURCHASE HISTORY
Shared negative lists ndash shared hotlists 16 35
9
35
15
5
25
30
10
20
40
45
50
0
Time to Clear Orders in Manual Review (2008)
Over two-thirds of merchants clear
orders through manual review
in one business day72
1 hour
or less
26
2-4
hours
10
Same
business
day
36
Next
business
day
18
2-3
business
days
8
4-5
business
days
1
6 or more
business
days
1
n=259
7
13
C Y B E R S O U R C E 1 0 T H A N N U A L O N L I N E F R A U D R E P O R T
13copy2009 CyberSource Corporation All rights reserved
The most popular tools currently used in the manual
review process are shown in chart 9 including the
percent of merchants planning to add each tool in 2009
Review Operations Efficiency
Reviewer Efficiency
The average number of orders a reviewer processed in a
day ranged from 22 for small merchants to 124 for large
(see chart 10) Large merchants who typically have case
management systems achieve a 5X higher throughput
per reviewer in the manual review stage possibly due to
greater use of review systems and detection tools during
manual review On average reviewers spent 7 minutes
reviewing each order in 2008
Time to Ramp New Staff
New to this yearrsquos surveymdashmerchants were asked how
long it takes for an order reviewer to attain acceptable
proficiency in his or her job While the learning curve
varies by type and size of online merchant the median
time reported was 4 weeks Larger merchants reported a
median of 6 weeks for a reviewer to achieve acceptable
proficiency Chart 11 shows the distribution of learning
times reported
Staff Tenure
Given the cost and time required to recruit and train
new staff merchants need to focus on staff retention
Fraud rates or order rejection rates can increase if highly
experienced review staff leave an organization and are
either not replaced or replaced by less experienced
reviewers 85 of review staff have been on the job
for one year or more Merchants report on average that
15 of their review staff were new in 2008 For large
merchants 24 of their staff were new in 2008 (see
chart 12) Efficient training and methods to ensure
consistent and accurate disposition of orders will be key
as merchants seek to optimize operating efficiency
Final Order DispositionAutomated screening and manual order review ultimately
result in order acceptance or rejection A relatively high
percentage of orders manually reviewed are ultimately
accepted (see next section)mdashhighlighting the need for
merchants to improve automated screening accuracy and
reduce the need for review A look at order reject and
acceptance rates follows in Stage 3 of the pipeline review
Overall $500K ndash lt$5Mlt$500K $5M ndash lt$25M $25M+
Average Orders Reviewed Per DayReviewer(by merchant size)
n=185
124
46
2322
68
10
Median of Weeks
4
52
Number of Weeks Required to Train New Reviewer
lt1
3
1
11
2
10
3
11
4
21
5-9
28
10-14
11
15+
5
n=159
11
Overall $500K ndash lt$5Mlt$500K $5M ndash lt$25M $25M+
of Review Staff New in 2008
n=206
24
1413
7
15
12
14
C Y B E R S O U R C E 1 0 T H A N N U A L O N L I N E F R A U D R E P O R T
Post-Review Order Acceptance RatesMerchants who manually review orders indicated they
ultimately accepted nearly frac34 of the orders they manually
reviewed (see chart 13) This was similar to the
proportion reported in 2007 50 of merchants report
they accept 90 or more of orders they manually review
These merchants are incurring significant expense
to find the 10 of the review queue they believe to be
too risky to accept Clearly most merchants require better
methods to determine which orders are to be outsorted for
manual review so only truly suspicious orders receive
human attention
Stage 3 Order Dispositioning (AcceptReject)
Automated
Screening1
Manual
Review2
Accept
Reject3
Fraud Claim
Management4ORDER
RETAINED
REVENUE
Tuning and Management
of Merchants Reporting This Level
of Post-Review Acceptance
1380 ndash 89
4490 ndash 99
6100
970 ndash 79
360 ndash 69
750 ndash 59
140 ndash 49
330 ndash 39
420 ndash 29
510 ndash 19
51 ndash 9
20
50 accept 90+
Post-Review Acceptance Trends
70
30
10
50
100
60
20
40
80
90
0
Most orders that enter manual review are accepted
2003
66
2004
71
2005
69
2006
66
2007
75
2008
73
of Orders Accepted in Review
13
15
C Y B E R S O U R C E 1 0 T H A N N U A L O N L I N E F R A U D R E P O R T
15copy2009 CyberSource Corporation All rights reserved
Overall Order Rejection RatesOrder reject rates can reflect true fraud
risk or signal ldquoprofit leaksrdquo in terms of
valid order rejection or unnecessarily
high rates of manual review In 2008 for
the first time in several years merchants
participating in the survey reported a
significant drop in their order rejection
rates from 42 in 2007 to 29 (see
chart 14)
Order rejection rates dropped in 2008 for
almost every size of merchant (see chart
15) except the very smallest and for
every industry segment (see chart 16)
It is likely that as online sales growth
slows and merchants seek to sustain
revenue levels merchants will look for
ways to accept more orders and reduce
orders rejected due to suspicion of fraud
In 2008 merchants were able to successfully reduce order
rejection rates while holding fraud rates stable It remains
to be seen if order rejection rates can be reduced further
in 2009 without an increase in fraud rates or manual
order review
Order rejection rates also vary by type of product and
merchant profile Chart 16 shows that segments which
have high cost of goods sold andor lower gross margins
tend to have higher order rejection rates Each fraud loss
in this arena has a large negative profit impact Consumer
electronics and jewelryapparel are two examples of online
segments that tend to have higher-than-average order
rejection rates
Yet even within similar groups of online merchants we
see that some merchants achieve low order rejection rates
while still keeping fraudulent order rates under control
Examining the large consumer electronics merchants in
the sample we find that half of these merchants report
35
15
05
25
50
30
10
20
40
45
0
Order Rejection Trends
2005
39
2006
41
2007
42
2008
29
14
Average Orders Rejected Due to Suspicion of Fraud
2007 n=2392008 n=326
Overall $500K ndash lt$5Mlt$500K $5M ndash lt$25M $25M+0
6
4
2
1
3
5
7
8
9
10
45
26
43
64
24
39
27
262
9
42
Order Rejection Rates by Selected Online Segment20072008
n=23
9
n=32
6
n=64
n=95
n=63
n=62
n=35
n=57
n=62
n=85
n=62
n=85
Overall Media amp
Entertainment
Digital Goods
ServicesApparel
Jewelry
Consumer
Electronics
49
34
32
56
42
56
32
42
29
42
Household amp
General Merchandise
22
31
15
16
16
C Y B E R S O U R C E 1 0 T H A N N U A L O N L I N E F R A U D R E P O R T
order rejection rates of 2 or less while maintaining
fraudulent order rates at or even below the average for
their segment
International Orders RiskierMerchants consistently report a much higher level of
order rejection on international orders due to suspicion
of payment fraud In 2008 merchants report their
rejection rate on these orders is over three and one half
times that of domestic orders as shown in chart 17
The actual fraud rate experienced on international orders
supports this cautious approach as merchants report the
fraud risk on international orders is also over three and
one half times that of domestic orders
Order Rejection Trends
of total USCanadian orders rejected of international orders rejected
Historically international order rejection rates
average 32x higher than USCanadian rates
2005 20072006 2008
6
4
2
1
3
5
7
8
9
12
11
10
13
14
42
11
11
29
13
41
12
39
0
15
17
17
C Y B E R S O U R C E 1 0 T H A N N U A L O N L I N E F R A U D R E P O R T
17copy2009 CyberSource Corporation All rights reserved
Fighting ChargebacksThis yearrsquos survey once again examined online merchantsrsquo
practices associated with reviewing and contesting
chargebacks (ldquore-presentmentrdquo) Over the past four years
the share of fraud-coded chargebacks merchants contest
has averaged 43 to 53 with the 2008 average at
50 Medium and large merchants report contesting 52
and 46 respectively of their fraud-coded chargebacks
in 2008 However when we look at the distribution of
merchantsrsquo answers to this question we find that over one
third of merchants are disputing 90 or more of their
fraud chagebacks while three out of ten merchants are
disputing less than 10 of their fraud chargebacks (see
chart 18)
Merchants report that they win on average 44 of the
chargebacks they dispute which is very similar to the 42
win rate reported in 2006 and 40 in 2007 Simply using
the average percent of chargebacks that are disputed (50)
times the average win rate of 44 results in a net recovery
rate of 22 (meaning 22 of all fraud-coded chargebacks
are recovered) However given the wide disparity in the
chargeback re-presentment rate when these are calculated
on a merchant-by-merchant basis and then averaged the
re-presentment win rate rises to 28 (see chart 19 on
next page) the same recovery rate that was found in 2007
Therefore disputing most fraud chargebacks and having
an efficient re-presentment process can help enhance
profitability and reduce fraud loss
Stage 4 Fraud Claim Management
Automated
Screening1
Manual
Review2
Accept
Reject3
Fraud Claim
Management4ORDER
RETAINED
REVENUE
Tuning and Management
Average Total Fraud-Coded
Chargebacks Re-presented of Merchants Reporting
this Re-presentment Rate
480 ndash 89
790 ndash 99
100
370 ndash 79
460 ndash 69
450 ndash 59
540 ndash 49
130 ndash 39
520 ndash 29
810 ndash 19
1 ndash 9
0
C
harg
ebac
ks R
e-pr
esen
ted
Overall $500K ndash lt$5Mlt$500K $5M ndash lt$25M $25M+
Annual Online Revenue
2006 n=1612007 n=1002008 n=120
50
53
47
36
38
48 52
46
5863
56
56
46
45
53
15
15
28
18
18
C Y B E R S O U R C E 1 0 T H A N N U A L O N L I N E F R A U D R E P O R T
Chargeback Management ToolsOf course disputing chargebacks is not an easy or cost-
free process Merchants must manage and organize all
order delivery and payment information to successfully
dispute fraudulent orders with financial institutions
Merchants are beginning to adopt automated systems
for handling this aspect of the pipeline One out of five
merchants reported using chargeback management tools
in 2008 and 37 of large merchants reported using
these tools In our 2006 survey we asked merchants to
provide estimates of how many hours it takes on average
to handle a fraud chargeback The average time spent
overall was 18 hours with a median time of 10 hours
to handle a fraud chargeback (total time consumed
for research documentation submission) The largest
merchants reported a median time of 30 minutes per fraud
chargeback Clearly fraud chargeback management is a
significant expense for merchants
ChargebacksmdashOnly Half the Problem How a fraudulent order is handled can have a significant
impact on bottom line profits Fraudulent orders are
presented to the merchant via two main routes as a
chargeback or as a direct request from a consumer
for credit (they claim fraudulent use of their account)
Although chargebacks are the most often cited metric
merchants report that chargebacks actually account for less
than half of all fraud claims This is true for all sizes of
merchants (see chart 20)
In 2007 large ($25M+ online sales) merchants reported
that 57 of their fraud was presented in the form of a
fraud-coded chargeback but in 2008 this dropped back
to 48 Considering the financial impact of both fraud
claim routes (chargebacks and credit issuancereversal)
some merchants encourage direct consumer contact
to address fraud claims and thus avoid the additional
chargeback fees levied by the merchant bankprocessor If
a consumer contacts the merchant first then the decision
is in the merchantrsquos control to either handle the dispute
directly with the consumer or to advise them to initiate a
fraud chargeback process In any event if merchants are
evaluating fraud losses solely on the basis of chargebacks
the actual rate of fraud loss the business is experiencing
may be as much as two times higher due to direct credit
issuancecharge reversal
Overall $500K ndash lt$5Mlt$500K $5M ndash lt$25M $25M+
Fraud Chargeback Re-presentment
Win RateNet Recovery Rate
Annual Online Revenues
Challenged Net Recovery
44AVERAGEWINRATE
46AVERAGEWINRATE
43AVERAGEWINRATE
54AVERAGEWINRATE
32AVERAGEWINRATE
50
28
36
23
52
38
63
35
46
19
10
0
20
30
40
50
60
70
80
90
100
(Net Recovery Rate is expressed as a of all fraud-coded chargebacks)
19
Overall $500K ndash lt$5Mlt$500K $5M ndash lt$25M $25M+
of Fraud Claims
Chargebacks vs Credit Issued by Merchant
Credits IssuedChargebacks
58
42
76
24
57
43
52
48
52
48
n=25
n=14
7
n=27
n=30
n=55
Annual Online Revenue
n=147
10
0
20
30
40
50
60
70
80
90
100
20
19
C Y B E R S O U R C E 1 0 T H A N N U A L O N L I N E F R A U D R E P O R T
19copy2009 CyberSource Corporation All rights reserved
Fraud Rate MetricsWhen monitoring the level and trend of online
fraud loss we focus on three key metrics
1) Overall revenue lost as a percent of total
online sales 2) percent of accepted orders
which turn out to be fraudulent (domestic and
international) and 3) the average value of a
fraudulent order relative to a valid order Fraud
rates vary widely by merchant and depend on a
variety of factors such as online sales volume
type of products or services sold online and
how such productsservices are delivered and
paid for It is important that merchants track
key fraud metrics over time and evaluate their
performance relative to their peer group (both
size and industry) Note this report provides
benchmarks on total fraud rates (chargebacks +
credits issued directly to consumers by merchants)
As such these metrics tend to be higher
than those reported by banks and credit card
associations which generally base reported rates
on chargeback activity only
Depending on which products or services are being sold
online fraud loss risk tolerances and order rejection
rates can vary significantly Merchants selling high
cost goods with relatively low gross margins like most
consumer electronics products tend to err on the side
of rejecting more orders to avoid expensive fraud losses
Merchants who are less subject to fraud attacks can
achieve similar fraud loss rates while rejecting
relatively few orders Over the past few years
as fraud rates have remained relatively stable
we have compiled data on fraud practices and
benchmarks by industry
Direct Revenue Loss Rates
Very large merchants typically use more tools
and have more experience and resources to
manage online fraud so their fraud rates tend
to be lower than the overall rate Revenue loss
measurement includes not only the value of
orders on which fraudulent chargebacks are
received but also the cost of any credits issued
to avoid such chargebacks Figures include both
chargebacks and credits issued directly by the
merchant in response to fraud claims
Fraudulent Order Rate for Accepted Orders
Another key metric is the number of accepted orders that
later turn out to be fraudulent Expressed as a percent of total
orders this metric is typically lower than the revenue loss
percent since the average value of fraudulent orders tends
to be greater than the average value of valid orders which
causes the fraud rate as measured by revenues to be higher
Overall 38 of merchants reported experiencing a fraudulent
order rate of 1 or more in 2008 which was the same
percent reported in 2007
20072008
Average Online Revenue Lost to Payment Fraud
(chargebacks amp fraud-related credits)
Overall $500K ndash lt$5Mlt$500K $5M ndash lt$25M $25M+
Annual Online Revenue
0
12
08
04
02
06
10
14
16
18
14 1
5 16
15
121
3
13
15
14
14
20072008
Average Accepted Orders Resulting in Fraud Losses
Overall $500K ndash lt$5Mlt$500K $5M ndash lt$25M $25M+
Annual Online Revenue
0
12
08
04
02
06
10
14
16
18
16
11
13
12
11
13
11
13
11
13
A fraud chargeback was received on the orders OR a credit was issued directly to a customerwho claims not to have placed an order
21
22
20
C Y B E R S O U R C E 1 0 T H A N N U A L O N L I N E F R A U D R E P O R T
International Orders Carry Higher Risk
Fifty-two percent of merchants surveyed accepted orders
from outside the US amp Canada in 2008 International
sales accounted for an average of 17 of total orders
for these merchants That same group reported that the
actual direct fraud rate on international orders averaged
40 or more than 36 times the overall fraud rate for
domestic online orders Though international markets
represent an attractive opportunity online merchants must
make sure that their fraud detection and management
systems are robust enough to handle the additional risk
involved Merchants who sell online outside of the US
amp Canada report that they reject international orders due
to suspicion of fraud at a rate that is over three and one
half times the US and Canadian average rate of 29
mdash rejecting approximately 1 out of every 9 international
orders received
Average Value of Fraudulent Order Higher than a Valid Order
Historically fraudulent orders tend to have higher values
on average than valid orders In 2008 the median value
of a fraudulent order was $200 compared to $130 median
value reported for valid orders This relationship of higher
fraudulent order values vs valid order value was found for
all merchant size categories as chart 24 shows Since
fraudulent orders tend to be somewhat higher in value than
valid orders merchants will tend to outsort more high value
orders for manual review and verification Large online
merchants reported that the median value of an order
flagged for manual review was $245
Valid vs Fraudulent Order Value
Valid orderFraudulent order
Median used to minimize impact of outliers
Overall $500K ndash lt$5Mlt$500K $5M ndash lt$25M $25M+
Annual Online Revenue
0
$200
$50
$100
$150
$250
$300
$350
$120
$150
$200
$150
$250
$175
$150
$100
$200
$130
24
40
10
05
20
15
25
35
45
30
00
International Fraud Rateover 3x USCanadian rate
11
40
Location of Order Origination
Within USCanadan=326
Outside USCanadan=164
Frau
d R
ate
o
f O
rder
s
23
21
C Y B E R S O U R C E 1 0 T H A N N U A L O N L I N E F R A U D R E P O R T
21copy2009 CyberSource Corporation All rights reserved
Tuning amp Management
Maintaining and Tuning Screening Rules28 of merchants say they have an automated order
screening system in place that allows business managers
to modify decision rules without assistance from internal
IT staff or external parties (up from 16 found in 2006)
The ability to adjust automated order screening systems
quickly helps manage the order review flow tailor rules
to new products and adapt to new fraud trends as they
are encountered Without this ability merchants cannot
easily minimize reject rates review costs or fraud rates
Additionally giving business managers the capability of
adjusting business rules on-the-fly reduces the costs and
burden of IT support
Global Fraud Portals Some online merchants are integrating fraud tools
and strategies via fraud management portals These
portals employ a combination of flexible rules systems
that interact with a portfolio of ldquotruth servicesrdquo around
the globe allowing business managers to set payment
type product type and market-specific screens Case
management systems are being integrated with these
portals with accompanying enhancements to streamline
workflow Global fraud portals typically include hierarchical
management as companies strive to centralize fraud
management across multiple lines of business and
geographies
Merchant Budgets for Fraud Management How much are online merchants spending to mitigate
fraud risk In both 2008 and in 2007 survey results
show that 34 of merchants spend 05 or more of
their online revenues to manage online payment fraud
while 66 spend less than 05 In 2008 across
all merchants the median ratio of fraud management
expense to sales was 022 down from 028 in 2007
although some merchants in high risk categories are
spending significantly more These spending estimates
focus on the cost of managing fraud risk (internal and
external systems and services management development
and review staffs) Direct fraud loss (chargebacks lost
goods and associated shipping costs) as well as the
opportunity cost associated with valid order rejection are
not included here (see chart 25)
Automated
Screening1
Manual
Review2
Accept
Reject3
Fraud Claim
Management4ORDER
RETAINED
REVENUE
Tuning and Management
02ndash lt050ndash lt02 05ndash lt10 10ndash lt40 40+
How Much Merchants Spend
on Fraud Management
(percent of merchants operating at defined expense level)
of Annual Online Revenues Spent to Manage Fraud(staff etc excluding fraud loss)
2007 n=972008 n=108
41 44
6
14
24
22
12 16
16
4
Median2008 = 022
2007 = 028
0
60
40
20
25
title (title)
22
C Y B E R S O U R C E 1 0 T H A N N U A L O N L I N E F R A U D R E P O R T
Budget Allocation For the past three years merchants have consistently
spent just over half their fraud management budgets on
review staff (see chart 26) The remainder is allocated
as follows 25 for third party tools or services and 24
on internally developed tools and systems
Clearly review staff costs are the dominant factor and
only 13 of merchants cite plans to increase review
staffing in 2009 Reducing the need for manual review
and increasing the efficiency and effectiveness of
reviewers is key to growing online business profits and
managing the total cost of online payment fraud One
place to start is by improving the automated detection of
risky orders so as to reduce manual order review volumes
Clearly the continued reliance on manual review we have
seen in the data over the last few years is not an optimal
long term strategy for managing online fraud As budgets
come under increasing pressure merchants will need
to redouble their efforts to automate more of the fraud
management process while keeping valid order conversion
high and fraud loss low
Base Those with 1 or more full-time manual review staff
Average Spending Allocation
for Fraud Management 2008
n=400
3rd Party
Tools
23
24
Internal
Tools amp
System
3rd Party
Tools
25
Order
Review
Staff
51
Planned Staffing Levels
Increase
13
21
Same
81
71
2009
2008
Decrease
6
8
n=238 248
26
23
C Y B E R S O U R C E 1 0 T H A N N U A L O N L I N E F R A U D R E P O R T
23copy2009 CyberSource Corporation All rights reserved
Resources amp Solutions
3 Managed Services
2 Design amp Installation
1 Systems amp Services
PAYMENT SECURITY
Order
Screening
Collection amp
Reconciliation
Global Payment
Acceptance
Processing
Management
L A S E R
BankBankTrans f e rTrans f e r
Direct
Debit
ORDER
bull Onlinebull Call Centerbull IVRbull Kioskbull POSbull ERP
With Performance
Guarantees
To find information on CyberSourcersquos industry-leading risk
management solutions self-paced webinars on decision
management and other whitepapers on electronic payment
management visit our Resource Center at
wwwcybersourcecom For sales assistance phone
1-888-330-2300 or e-mail salescybersourcecom
CyberSource Payment Management Solutions CyberSource offers a comprehensive portfolio of modular
services and tools to help your company manage your entire
payment pipeline to optimize sales results All are available
via one connection to our web-based services
Accept All Popular Payment Types in 190+
Countries
Accept payments worldwide using a merchant account from
your preferred provider or CyberSource worldwide credit
and debit cards regional cards direct debit bank
transfers electronic checks and alternative payment
types such as Bill Me Later and PayPal CyberSource
also provides professional services to help you
integrate payment with front-end and back-office
systems
Risk ManagementOrder Screening
Global Fraud Management Portal with CyberSource Intelligent
Review Technology A hosted rules and case management
system that provides on-demand access to over 150
validation tests and services across all four dimensions of
detection Detectors include multi-merchant transaction
history checks worldwide delivery address and phone
verification device fingerprinting IP geolocation purchase
velocity identity morphing and custom data from your
systems Case management system provides consolidated
data review workflow management and built-in callouts to
validation services to streamline review
Managed Services CyberSource provides client services to
help you analyze design and manage your order screening
and fraud detection processesmdasheverything from screening
strategies and risk threshold optimization analysis
to ongoing monitoring order review and chargeback
managementrecovery Our managed services include
business performance guarantees
Payer Authentication Verified by Visa MasterCard
SecureCode
Processing Management
CyberSource processes your payments in our high
availability datacenters located in the US Europe and
Japan All datacenters are certified PCI-compliant and
include sophisticated processing management logic to help
prevent payment failures and rate downgrades
Collection amp Reconciliation
A full array of online and exportable payment reporting
capability is available to streamline reconciliation activity
Further systems can be installed to automate up to 90
of the tasks associated with payment reconciliation and
chargeback re-presentment
Payment Security
Remove Payment Data From Your Network CyberSource
provides secure storage and hosted payment acceptance
services that let you process without storing or even
transmitting payment data A great way to streamline PCI
compliance and mitigate security risk
Payment System Centralization Our team of experts will help
you consolidate multiple payment systems into a single easy
to manage system Optionally CyberSource will also host
support and manage these systems in our secure datacenters
PCI Planning amp Remediation CyberSource provides PCI
compliance consulting and remediation services to help
remedy PCI issues
Professional Services
CyberSource maintains a team of experienced payment
consultants to assist with payment systems planning
system and process design and implementation and
integration Our client services team is additionally
available to help you monitor tune or fully outsource
portions of your payment operations
C Y B E R S O U R C E 1 0 T H A N N U A L O N L I N E F R A U D R E P O R T
North America
CyberSource Corporation
1295 Charleston Road
Mountain View CA 94043
T 8883302300
T 6509656000
F 6506259145
Email infocybersourcecom
Europe
CyberSource Ltd
The Waterfront
300 Thames Valley Park Drive
Thames Valley Park
Reading RG6 1PT
United Kingdom
T +44 (0) 1189294840
F +44 (0) 8704601931
Email ukcybersourcecom
UK Fraud Report wwwcybersourcecoukukfraudreport
Japan
CyberSource KK (Japan)
3-11-11 Shibuya Shibuya-ku
Tokyo 150-0002 Japan
T +81357747733
F +81357747732
Email mailcybersourcecojp
CyberSource Corporation is a leading provider of
electronic payment risk and security management
solutions CyberSource provides payment management
solutions for electronic payments processed via Web
call center kiosk mobile and POS environments
Services include hosted systems to help you manage
electronic payments as well as professional services
to help design integrate and fully manage parts or all
of your payment operations Over 245000 businesses
worldwide use CyberSource solutions including half
the companies comprising the Dow Jones Industrial
Average and leading Internet brands The company
is headquartered in Mountain View California and
has sales and service offices in Japan the United
Kingdom and other locations in the United States
For More Information
bull Call 18883302300
bull Email infocybersourcecom
bull Visit wwwcybersourcecom
Get Tailored Views of Risk Management
Pipelinetrade MetricsTo get a view crafted for your companyrsquos size and industry
please contact CyberSource at 18883302300 or online at
wwwcybersourcecomcontact_us
For additional information whitepapers and webinars
or sales assistance
bull Contact CyberSource 18883302300 or
wwwcybersourcecomcontact_us
bull Risk Management Solutions visit wwwcybersourcecom
products_and_servicesrisk_management
bull Global Payment amp Security Solutions
visit wwwcybersourcecomproducts_and_services
global_payment_services
About CyberSource
C Y B E R S O U R C E 1 0 T H A N N U A L O N L I N E F R A U D R E P O R T

12
C Y B E R S O U R C E 1 0 T H A N N U A L O N L I N E F R A U D R E P O R T
35
15
5
25
50
30
10
20
40
45
0
Time Allowed for Customer Response
Source 2008 CyberSource Fraud Report
Half day
or less
10
Same
business
day
10
Next
business
day
14
2-3
business
days
37
4-5
business
days
11
6 or more
business
days
19
8
Fraud Detection Tool Usage During Manual Review
All Merchants Merchants $25M+ Online Revenue
69 11
56 15
49 10
45 12
23 14
9 7
currently using planning to begin use (in 2009)
Current n=265 Future Plans n=109 Current n=89 Future Plans n=43
VALIDATION SERVICES
Telephone number verificationreverse lookup
Credit history check
Paid for public records service
Contact customer to verify order
Contact card issuerAmex CVP
Postal address validation services
82 5
74 5
60 14
46 7
45 14
6 12
72 8
49 14
35 13
22 17
SINGLE MERCHANT PURCHASE HISTORY
Positive lists
Customer order history
Valid customer website behavior analysis
Negative lists (in-house lists)
83 5
69 12
37 14
34 30
40 20
PURCHASE DEVICE TRACING
IP geolocation information 55 28
11 28
MULTI-MERCHANT PURCHASE HISTORY
Shared negative lists ndash shared hotlists 16 35
9
35
15
5
25
30
10
20
40
45
50
0
Time to Clear Orders in Manual Review (2008)
Over two-thirds of merchants clear
orders through manual review
in one business day72
1 hour
or less
26
2-4
hours
10
Same
business
day
36
Next
business
day
18
2-3
business
days
8
4-5
business
days
1
6 or more
business
days
1
n=259
7
13
C Y B E R S O U R C E 1 0 T H A N N U A L O N L I N E F R A U D R E P O R T
13copy2009 CyberSource Corporation All rights reserved
The most popular tools currently used in the manual
review process are shown in chart 9 including the
percent of merchants planning to add each tool in 2009
Review Operations Efficiency
Reviewer Efficiency
The average number of orders a reviewer processed in a
day ranged from 22 for small merchants to 124 for large
(see chart 10) Large merchants who typically have case
management systems achieve a 5X higher throughput
per reviewer in the manual review stage possibly due to
greater use of review systems and detection tools during
manual review On average reviewers spent 7 minutes
reviewing each order in 2008
Time to Ramp New Staff
New to this yearrsquos surveymdashmerchants were asked how
long it takes for an order reviewer to attain acceptable
proficiency in his or her job While the learning curve
varies by type and size of online merchant the median
time reported was 4 weeks Larger merchants reported a
median of 6 weeks for a reviewer to achieve acceptable
proficiency Chart 11 shows the distribution of learning
times reported
Staff Tenure
Given the cost and time required to recruit and train
new staff merchants need to focus on staff retention
Fraud rates or order rejection rates can increase if highly
experienced review staff leave an organization and are
either not replaced or replaced by less experienced
reviewers 85 of review staff have been on the job
for one year or more Merchants report on average that
15 of their review staff were new in 2008 For large
merchants 24 of their staff were new in 2008 (see
chart 12) Efficient training and methods to ensure
consistent and accurate disposition of orders will be key
as merchants seek to optimize operating efficiency
Final Order DispositionAutomated screening and manual order review ultimately
result in order acceptance or rejection A relatively high
percentage of orders manually reviewed are ultimately
accepted (see next section)mdashhighlighting the need for
merchants to improve automated screening accuracy and
reduce the need for review A look at order reject and
acceptance rates follows in Stage 3 of the pipeline review
Overall $500K ndash lt$5Mlt$500K $5M ndash lt$25M $25M+
Average Orders Reviewed Per DayReviewer(by merchant size)
n=185
124
46
2322
68
10
Median of Weeks
4
52
Number of Weeks Required to Train New Reviewer
lt1
3
1
11
2
10
3
11
4
21
5-9
28
10-14
11
15+
5
n=159
11
Overall $500K ndash lt$5Mlt$500K $5M ndash lt$25M $25M+
of Review Staff New in 2008
n=206
24
1413
7
15
12
14
C Y B E R S O U R C E 1 0 T H A N N U A L O N L I N E F R A U D R E P O R T
Post-Review Order Acceptance RatesMerchants who manually review orders indicated they
ultimately accepted nearly frac34 of the orders they manually
reviewed (see chart 13) This was similar to the
proportion reported in 2007 50 of merchants report
they accept 90 or more of orders they manually review
These merchants are incurring significant expense
to find the 10 of the review queue they believe to be
too risky to accept Clearly most merchants require better
methods to determine which orders are to be outsorted for
manual review so only truly suspicious orders receive
human attention
Stage 3 Order Dispositioning (AcceptReject)
Automated
Screening1
Manual
Review2
Accept
Reject3
Fraud Claim
Management4ORDER
RETAINED
REVENUE
Tuning and Management
of Merchants Reporting This Level
of Post-Review Acceptance
1380 ndash 89
4490 ndash 99
6100
970 ndash 79
360 ndash 69
750 ndash 59
140 ndash 49
330 ndash 39
420 ndash 29
510 ndash 19
51 ndash 9
20
50 accept 90+
Post-Review Acceptance Trends
70
30
10
50
100
60
20
40
80
90
0
Most orders that enter manual review are accepted
2003
66
2004
71
2005
69
2006
66
2007
75
2008
73
of Orders Accepted in Review
13
15
C Y B E R S O U R C E 1 0 T H A N N U A L O N L I N E F R A U D R E P O R T
15copy2009 CyberSource Corporation All rights reserved
Overall Order Rejection RatesOrder reject rates can reflect true fraud
risk or signal ldquoprofit leaksrdquo in terms of
valid order rejection or unnecessarily
high rates of manual review In 2008 for
the first time in several years merchants
participating in the survey reported a
significant drop in their order rejection
rates from 42 in 2007 to 29 (see
chart 14)
Order rejection rates dropped in 2008 for
almost every size of merchant (see chart
15) except the very smallest and for
every industry segment (see chart 16)
It is likely that as online sales growth
slows and merchants seek to sustain
revenue levels merchants will look for
ways to accept more orders and reduce
orders rejected due to suspicion of fraud
In 2008 merchants were able to successfully reduce order
rejection rates while holding fraud rates stable It remains
to be seen if order rejection rates can be reduced further
in 2009 without an increase in fraud rates or manual
order review
Order rejection rates also vary by type of product and
merchant profile Chart 16 shows that segments which
have high cost of goods sold andor lower gross margins
tend to have higher order rejection rates Each fraud loss
in this arena has a large negative profit impact Consumer
electronics and jewelryapparel are two examples of online
segments that tend to have higher-than-average order
rejection rates
Yet even within similar groups of online merchants we
see that some merchants achieve low order rejection rates
while still keeping fraudulent order rates under control
Examining the large consumer electronics merchants in
the sample we find that half of these merchants report
35
15
05
25
50
30
10
20
40
45
0
Order Rejection Trends
2005
39
2006
41
2007
42
2008
29
14
Average Orders Rejected Due to Suspicion of Fraud
2007 n=2392008 n=326
Overall $500K ndash lt$5Mlt$500K $5M ndash lt$25M $25M+0
6
4
2
1
3
5
7
8
9
10
45
26
43
64
24
39
27
262
9
42
Order Rejection Rates by Selected Online Segment20072008
n=23
9
n=32
6
n=64
n=95
n=63
n=62
n=35
n=57
n=62
n=85
n=62
n=85
Overall Media amp
Entertainment
Digital Goods
ServicesApparel
Jewelry
Consumer
Electronics
49
34
32
56
42
56
32
42
29
42
Household amp
General Merchandise
22
31
15
16
16
C Y B E R S O U R C E 1 0 T H A N N U A L O N L I N E F R A U D R E P O R T
order rejection rates of 2 or less while maintaining
fraudulent order rates at or even below the average for
their segment
International Orders RiskierMerchants consistently report a much higher level of
order rejection on international orders due to suspicion
of payment fraud In 2008 merchants report their
rejection rate on these orders is over three and one half
times that of domestic orders as shown in chart 17
The actual fraud rate experienced on international orders
supports this cautious approach as merchants report the
fraud risk on international orders is also over three and
one half times that of domestic orders
Order Rejection Trends
of total USCanadian orders rejected of international orders rejected
Historically international order rejection rates
average 32x higher than USCanadian rates
2005 20072006 2008
6
4
2
1
3
5
7
8
9
12
11
10
13
14
42
11
11
29
13
41
12
39
0
15
17
17
C Y B E R S O U R C E 1 0 T H A N N U A L O N L I N E F R A U D R E P O R T
17copy2009 CyberSource Corporation All rights reserved
Fighting ChargebacksThis yearrsquos survey once again examined online merchantsrsquo
practices associated with reviewing and contesting
chargebacks (ldquore-presentmentrdquo) Over the past four years
the share of fraud-coded chargebacks merchants contest
has averaged 43 to 53 with the 2008 average at
50 Medium and large merchants report contesting 52
and 46 respectively of their fraud-coded chargebacks
in 2008 However when we look at the distribution of
merchantsrsquo answers to this question we find that over one
third of merchants are disputing 90 or more of their
fraud chagebacks while three out of ten merchants are
disputing less than 10 of their fraud chargebacks (see
chart 18)
Merchants report that they win on average 44 of the
chargebacks they dispute which is very similar to the 42
win rate reported in 2006 and 40 in 2007 Simply using
the average percent of chargebacks that are disputed (50)
times the average win rate of 44 results in a net recovery
rate of 22 (meaning 22 of all fraud-coded chargebacks
are recovered) However given the wide disparity in the
chargeback re-presentment rate when these are calculated
on a merchant-by-merchant basis and then averaged the
re-presentment win rate rises to 28 (see chart 19 on
next page) the same recovery rate that was found in 2007
Therefore disputing most fraud chargebacks and having
an efficient re-presentment process can help enhance
profitability and reduce fraud loss
Stage 4 Fraud Claim Management
Automated
Screening1
Manual
Review2
Accept
Reject3
Fraud Claim
Management4ORDER
RETAINED
REVENUE
Tuning and Management
Average Total Fraud-Coded
Chargebacks Re-presented of Merchants Reporting
this Re-presentment Rate
480 ndash 89
790 ndash 99
100
370 ndash 79
460 ndash 69
450 ndash 59
540 ndash 49
130 ndash 39
520 ndash 29
810 ndash 19
1 ndash 9
0
C
harg
ebac
ks R
e-pr
esen
ted
Overall $500K ndash lt$5Mlt$500K $5M ndash lt$25M $25M+
Annual Online Revenue
2006 n=1612007 n=1002008 n=120
50
53
47
36
38
48 52
46
5863
56
56
46
45
53
15
15
28
18
18
C Y B E R S O U R C E 1 0 T H A N N U A L O N L I N E F R A U D R E P O R T
Chargeback Management ToolsOf course disputing chargebacks is not an easy or cost-
free process Merchants must manage and organize all
order delivery and payment information to successfully
dispute fraudulent orders with financial institutions
Merchants are beginning to adopt automated systems
for handling this aspect of the pipeline One out of five
merchants reported using chargeback management tools
in 2008 and 37 of large merchants reported using
these tools In our 2006 survey we asked merchants to
provide estimates of how many hours it takes on average
to handle a fraud chargeback The average time spent
overall was 18 hours with a median time of 10 hours
to handle a fraud chargeback (total time consumed
for research documentation submission) The largest
merchants reported a median time of 30 minutes per fraud
chargeback Clearly fraud chargeback management is a
significant expense for merchants
ChargebacksmdashOnly Half the Problem How a fraudulent order is handled can have a significant
impact on bottom line profits Fraudulent orders are
presented to the merchant via two main routes as a
chargeback or as a direct request from a consumer
for credit (they claim fraudulent use of their account)
Although chargebacks are the most often cited metric
merchants report that chargebacks actually account for less
than half of all fraud claims This is true for all sizes of
merchants (see chart 20)
In 2007 large ($25M+ online sales) merchants reported
that 57 of their fraud was presented in the form of a
fraud-coded chargeback but in 2008 this dropped back
to 48 Considering the financial impact of both fraud
claim routes (chargebacks and credit issuancereversal)
some merchants encourage direct consumer contact
to address fraud claims and thus avoid the additional
chargeback fees levied by the merchant bankprocessor If
a consumer contacts the merchant first then the decision
is in the merchantrsquos control to either handle the dispute
directly with the consumer or to advise them to initiate a
fraud chargeback process In any event if merchants are
evaluating fraud losses solely on the basis of chargebacks
the actual rate of fraud loss the business is experiencing
may be as much as two times higher due to direct credit
issuancecharge reversal
Overall $500K ndash lt$5Mlt$500K $5M ndash lt$25M $25M+
Fraud Chargeback Re-presentment
Win RateNet Recovery Rate
Annual Online Revenues
Challenged Net Recovery
44AVERAGEWINRATE
46AVERAGEWINRATE
43AVERAGEWINRATE
54AVERAGEWINRATE
32AVERAGEWINRATE
50
28
36
23
52
38
63
35
46
19
10
0
20
30
40
50
60
70
80
90
100
(Net Recovery Rate is expressed as a of all fraud-coded chargebacks)
19
Overall $500K ndash lt$5Mlt$500K $5M ndash lt$25M $25M+
of Fraud Claims
Chargebacks vs Credit Issued by Merchant
Credits IssuedChargebacks
58
42
76
24
57
43
52
48
52
48
n=25
n=14
7
n=27
n=30
n=55
Annual Online Revenue
n=147
10
0
20
30
40
50
60
70
80
90
100
20
19
C Y B E R S O U R C E 1 0 T H A N N U A L O N L I N E F R A U D R E P O R T
19copy2009 CyberSource Corporation All rights reserved
Fraud Rate MetricsWhen monitoring the level and trend of online
fraud loss we focus on three key metrics
1) Overall revenue lost as a percent of total
online sales 2) percent of accepted orders
which turn out to be fraudulent (domestic and
international) and 3) the average value of a
fraudulent order relative to a valid order Fraud
rates vary widely by merchant and depend on a
variety of factors such as online sales volume
type of products or services sold online and
how such productsservices are delivered and
paid for It is important that merchants track
key fraud metrics over time and evaluate their
performance relative to their peer group (both
size and industry) Note this report provides
benchmarks on total fraud rates (chargebacks +
credits issued directly to consumers by merchants)
As such these metrics tend to be higher
than those reported by banks and credit card
associations which generally base reported rates
on chargeback activity only
Depending on which products or services are being sold
online fraud loss risk tolerances and order rejection
rates can vary significantly Merchants selling high
cost goods with relatively low gross margins like most
consumer electronics products tend to err on the side
of rejecting more orders to avoid expensive fraud losses
Merchants who are less subject to fraud attacks can
achieve similar fraud loss rates while rejecting
relatively few orders Over the past few years
as fraud rates have remained relatively stable
we have compiled data on fraud practices and
benchmarks by industry
Direct Revenue Loss Rates
Very large merchants typically use more tools
and have more experience and resources to
manage online fraud so their fraud rates tend
to be lower than the overall rate Revenue loss
measurement includes not only the value of
orders on which fraudulent chargebacks are
received but also the cost of any credits issued
to avoid such chargebacks Figures include both
chargebacks and credits issued directly by the
merchant in response to fraud claims
Fraudulent Order Rate for Accepted Orders
Another key metric is the number of accepted orders that
later turn out to be fraudulent Expressed as a percent of total
orders this metric is typically lower than the revenue loss
percent since the average value of fraudulent orders tends
to be greater than the average value of valid orders which
causes the fraud rate as measured by revenues to be higher
Overall 38 of merchants reported experiencing a fraudulent
order rate of 1 or more in 2008 which was the same
percent reported in 2007
20072008
Average Online Revenue Lost to Payment Fraud
(chargebacks amp fraud-related credits)
Overall $500K ndash lt$5Mlt$500K $5M ndash lt$25M $25M+
Annual Online Revenue
0
12
08
04
02
06
10
14
16
18
14 1
5 16
15
121
3
13
15
14
14
20072008
Average Accepted Orders Resulting in Fraud Losses
Overall $500K ndash lt$5Mlt$500K $5M ndash lt$25M $25M+
Annual Online Revenue
0
12
08
04
02
06
10
14
16
18
16
11
13
12
11
13
11
13
11
13
A fraud chargeback was received on the orders OR a credit was issued directly to a customerwho claims not to have placed an order
21
22
20
C Y B E R S O U R C E 1 0 T H A N N U A L O N L I N E F R A U D R E P O R T
International Orders Carry Higher Risk
Fifty-two percent of merchants surveyed accepted orders
from outside the US amp Canada in 2008 International
sales accounted for an average of 17 of total orders
for these merchants That same group reported that the
actual direct fraud rate on international orders averaged
40 or more than 36 times the overall fraud rate for
domestic online orders Though international markets
represent an attractive opportunity online merchants must
make sure that their fraud detection and management
systems are robust enough to handle the additional risk
involved Merchants who sell online outside of the US
amp Canada report that they reject international orders due
to suspicion of fraud at a rate that is over three and one
half times the US and Canadian average rate of 29
mdash rejecting approximately 1 out of every 9 international
orders received
Average Value of Fraudulent Order Higher than a Valid Order
Historically fraudulent orders tend to have higher values
on average than valid orders In 2008 the median value
of a fraudulent order was $200 compared to $130 median
value reported for valid orders This relationship of higher
fraudulent order values vs valid order value was found for
all merchant size categories as chart 24 shows Since
fraudulent orders tend to be somewhat higher in value than
valid orders merchants will tend to outsort more high value
orders for manual review and verification Large online
merchants reported that the median value of an order
flagged for manual review was $245
Valid vs Fraudulent Order Value
Valid orderFraudulent order
Median used to minimize impact of outliers
Overall $500K ndash lt$5Mlt$500K $5M ndash lt$25M $25M+
Annual Online Revenue
0
$200
$50
$100
$150
$250
$300
$350
$120
$150
$200
$150
$250
$175
$150
$100
$200
$130
24
40
10
05
20
15
25
35
45
30
00
International Fraud Rateover 3x USCanadian rate
11
40
Location of Order Origination
Within USCanadan=326
Outside USCanadan=164
Frau
d R
ate
o
f O
rder
s
23
21
C Y B E R S O U R C E 1 0 T H A N N U A L O N L I N E F R A U D R E P O R T
21copy2009 CyberSource Corporation All rights reserved
Tuning amp Management
Maintaining and Tuning Screening Rules28 of merchants say they have an automated order
screening system in place that allows business managers
to modify decision rules without assistance from internal
IT staff or external parties (up from 16 found in 2006)
The ability to adjust automated order screening systems
quickly helps manage the order review flow tailor rules
to new products and adapt to new fraud trends as they
are encountered Without this ability merchants cannot
easily minimize reject rates review costs or fraud rates
Additionally giving business managers the capability of
adjusting business rules on-the-fly reduces the costs and
burden of IT support
Global Fraud Portals Some online merchants are integrating fraud tools
and strategies via fraud management portals These
portals employ a combination of flexible rules systems
that interact with a portfolio of ldquotruth servicesrdquo around
the globe allowing business managers to set payment
type product type and market-specific screens Case
management systems are being integrated with these
portals with accompanying enhancements to streamline
workflow Global fraud portals typically include hierarchical
management as companies strive to centralize fraud
management across multiple lines of business and
geographies
Merchant Budgets for Fraud Management How much are online merchants spending to mitigate
fraud risk In both 2008 and in 2007 survey results
show that 34 of merchants spend 05 or more of
their online revenues to manage online payment fraud
while 66 spend less than 05 In 2008 across
all merchants the median ratio of fraud management
expense to sales was 022 down from 028 in 2007
although some merchants in high risk categories are
spending significantly more These spending estimates
focus on the cost of managing fraud risk (internal and
external systems and services management development
and review staffs) Direct fraud loss (chargebacks lost
goods and associated shipping costs) as well as the
opportunity cost associated with valid order rejection are
not included here (see chart 25)
Automated
Screening1
Manual
Review2
Accept
Reject3
Fraud Claim
Management4ORDER
RETAINED
REVENUE
Tuning and Management
02ndash lt050ndash lt02 05ndash lt10 10ndash lt40 40+
How Much Merchants Spend
on Fraud Management
(percent of merchants operating at defined expense level)
of Annual Online Revenues Spent to Manage Fraud(staff etc excluding fraud loss)
2007 n=972008 n=108
41 44
6
14
24
22
12 16
16
4
Median2008 = 022
2007 = 028
0
60
40
20
25
title (title)
22
C Y B E R S O U R C E 1 0 T H A N N U A L O N L I N E F R A U D R E P O R T
Budget Allocation For the past three years merchants have consistently
spent just over half their fraud management budgets on
review staff (see chart 26) The remainder is allocated
as follows 25 for third party tools or services and 24
on internally developed tools and systems
Clearly review staff costs are the dominant factor and
only 13 of merchants cite plans to increase review
staffing in 2009 Reducing the need for manual review
and increasing the efficiency and effectiveness of
reviewers is key to growing online business profits and
managing the total cost of online payment fraud One
place to start is by improving the automated detection of
risky orders so as to reduce manual order review volumes
Clearly the continued reliance on manual review we have
seen in the data over the last few years is not an optimal
long term strategy for managing online fraud As budgets
come under increasing pressure merchants will need
to redouble their efforts to automate more of the fraud
management process while keeping valid order conversion
high and fraud loss low
Base Those with 1 or more full-time manual review staff
Average Spending Allocation
for Fraud Management 2008
n=400
3rd Party
Tools
23
24
Internal
Tools amp
System
3rd Party
Tools
25
Order
Review
Staff
51
Planned Staffing Levels
Increase
13
21
Same
81
71
2009
2008
Decrease
6
8
n=238 248
26
23
C Y B E R S O U R C E 1 0 T H A N N U A L O N L I N E F R A U D R E P O R T
23copy2009 CyberSource Corporation All rights reserved
Resources amp Solutions
3 Managed Services
2 Design amp Installation
1 Systems amp Services
PAYMENT SECURITY
Order
Screening
Collection amp
Reconciliation
Global Payment
Acceptance
Processing
Management
L A S E R
BankBankTrans f e rTrans f e r
Direct
Debit
ORDER
bull Onlinebull Call Centerbull IVRbull Kioskbull POSbull ERP
With Performance
Guarantees
To find information on CyberSourcersquos industry-leading risk
management solutions self-paced webinars on decision
management and other whitepapers on electronic payment
management visit our Resource Center at
wwwcybersourcecom For sales assistance phone
1-888-330-2300 or e-mail salescybersourcecom
CyberSource Payment Management Solutions CyberSource offers a comprehensive portfolio of modular
services and tools to help your company manage your entire
payment pipeline to optimize sales results All are available
via one connection to our web-based services
Accept All Popular Payment Types in 190+
Countries
Accept payments worldwide using a merchant account from
your preferred provider or CyberSource worldwide credit
and debit cards regional cards direct debit bank
transfers electronic checks and alternative payment
types such as Bill Me Later and PayPal CyberSource
also provides professional services to help you
integrate payment with front-end and back-office
systems
Risk ManagementOrder Screening
Global Fraud Management Portal with CyberSource Intelligent
Review Technology A hosted rules and case management
system that provides on-demand access to over 150
validation tests and services across all four dimensions of
detection Detectors include multi-merchant transaction
history checks worldwide delivery address and phone
verification device fingerprinting IP geolocation purchase
velocity identity morphing and custom data from your
systems Case management system provides consolidated
data review workflow management and built-in callouts to
validation services to streamline review
Managed Services CyberSource provides client services to
help you analyze design and manage your order screening
and fraud detection processesmdasheverything from screening
strategies and risk threshold optimization analysis
to ongoing monitoring order review and chargeback
managementrecovery Our managed services include
business performance guarantees
Payer Authentication Verified by Visa MasterCard
SecureCode
Processing Management
CyberSource processes your payments in our high
availability datacenters located in the US Europe and
Japan All datacenters are certified PCI-compliant and
include sophisticated processing management logic to help
prevent payment failures and rate downgrades
Collection amp Reconciliation
A full array of online and exportable payment reporting
capability is available to streamline reconciliation activity
Further systems can be installed to automate up to 90
of the tasks associated with payment reconciliation and
chargeback re-presentment
Payment Security
Remove Payment Data From Your Network CyberSource
provides secure storage and hosted payment acceptance
services that let you process without storing or even
transmitting payment data A great way to streamline PCI
compliance and mitigate security risk
Payment System Centralization Our team of experts will help
you consolidate multiple payment systems into a single easy
to manage system Optionally CyberSource will also host
support and manage these systems in our secure datacenters
PCI Planning amp Remediation CyberSource provides PCI
compliance consulting and remediation services to help
remedy PCI issues
Professional Services
CyberSource maintains a team of experienced payment
consultants to assist with payment systems planning
system and process design and implementation and
integration Our client services team is additionally
available to help you monitor tune or fully outsource
portions of your payment operations
C Y B E R S O U R C E 1 0 T H A N N U A L O N L I N E F R A U D R E P O R T
North America
CyberSource Corporation
1295 Charleston Road
Mountain View CA 94043
T 8883302300
T 6509656000
F 6506259145
Email infocybersourcecom
Europe
CyberSource Ltd
The Waterfront
300 Thames Valley Park Drive
Thames Valley Park
Reading RG6 1PT
United Kingdom
T +44 (0) 1189294840
F +44 (0) 8704601931
Email ukcybersourcecom
UK Fraud Report wwwcybersourcecoukukfraudreport
Japan
CyberSource KK (Japan)
3-11-11 Shibuya Shibuya-ku
Tokyo 150-0002 Japan
T +81357747733
F +81357747732
Email mailcybersourcecojp
CyberSource Corporation is a leading provider of
electronic payment risk and security management
solutions CyberSource provides payment management
solutions for electronic payments processed via Web
call center kiosk mobile and POS environments
Services include hosted systems to help you manage
electronic payments as well as professional services
to help design integrate and fully manage parts or all
of your payment operations Over 245000 businesses
worldwide use CyberSource solutions including half
the companies comprising the Dow Jones Industrial
Average and leading Internet brands The company
is headquartered in Mountain View California and
has sales and service offices in Japan the United
Kingdom and other locations in the United States
For More Information
bull Call 18883302300
bull Email infocybersourcecom
bull Visit wwwcybersourcecom
Get Tailored Views of Risk Management
Pipelinetrade MetricsTo get a view crafted for your companyrsquos size and industry
please contact CyberSource at 18883302300 or online at
wwwcybersourcecomcontact_us
For additional information whitepapers and webinars
or sales assistance
bull Contact CyberSource 18883302300 or
wwwcybersourcecomcontact_us
bull Risk Management Solutions visit wwwcybersourcecom
products_and_servicesrisk_management
bull Global Payment amp Security Solutions
visit wwwcybersourcecomproducts_and_services
global_payment_services
About CyberSource
C Y B E R S O U R C E 1 0 T H A N N U A L O N L I N E F R A U D R E P O R T
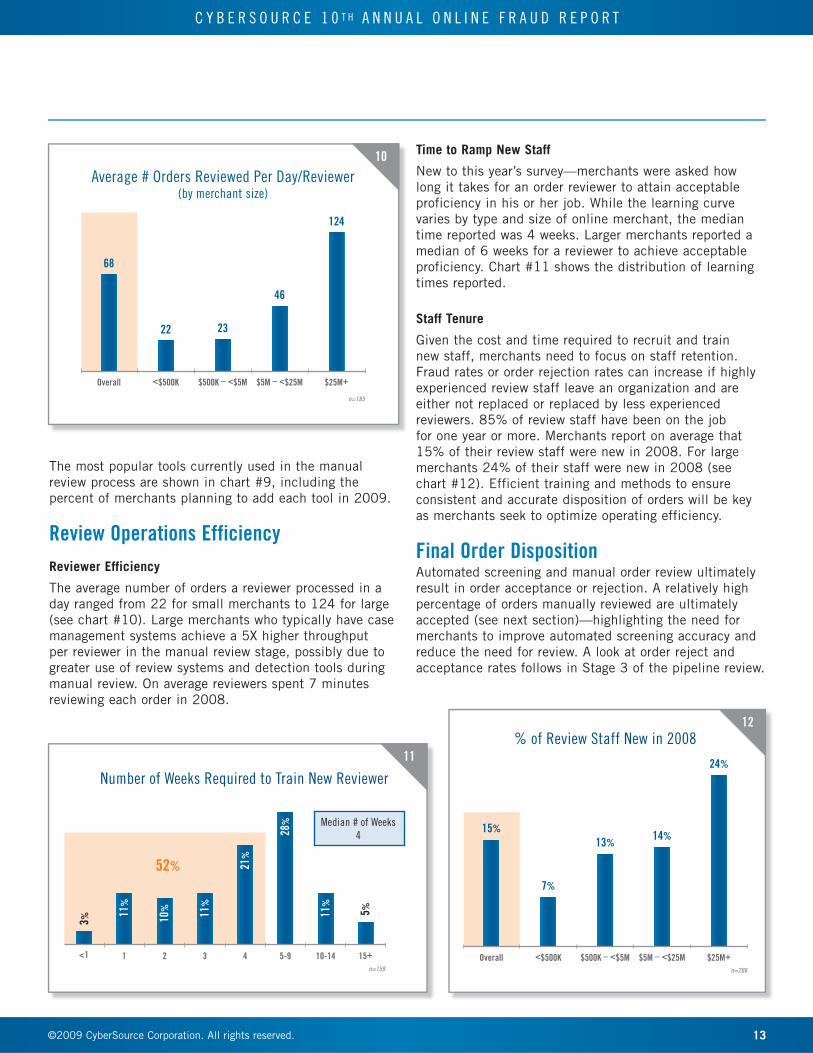
13
C Y B E R S O U R C E 1 0 T H A N N U A L O N L I N E F R A U D R E P O R T
13copy2009 CyberSource Corporation All rights reserved
The most popular tools currently used in the manual
review process are shown in chart 9 including the
percent of merchants planning to add each tool in 2009
Review Operations Efficiency
Reviewer Efficiency
The average number of orders a reviewer processed in a
day ranged from 22 for small merchants to 124 for large
(see chart 10) Large merchants who typically have case
management systems achieve a 5X higher throughput
per reviewer in the manual review stage possibly due to
greater use of review systems and detection tools during
manual review On average reviewers spent 7 minutes
reviewing each order in 2008
Time to Ramp New Staff
New to this yearrsquos surveymdashmerchants were asked how
long it takes for an order reviewer to attain acceptable
proficiency in his or her job While the learning curve
varies by type and size of online merchant the median
time reported was 4 weeks Larger merchants reported a
median of 6 weeks for a reviewer to achieve acceptable
proficiency Chart 11 shows the distribution of learning
times reported
Staff Tenure
Given the cost and time required to recruit and train
new staff merchants need to focus on staff retention
Fraud rates or order rejection rates can increase if highly
experienced review staff leave an organization and are
either not replaced or replaced by less experienced
reviewers 85 of review staff have been on the job
for one year or more Merchants report on average that
15 of their review staff were new in 2008 For large
merchants 24 of their staff were new in 2008 (see
chart 12) Efficient training and methods to ensure
consistent and accurate disposition of orders will be key
as merchants seek to optimize operating efficiency
Final Order DispositionAutomated screening and manual order review ultimately
result in order acceptance or rejection A relatively high
percentage of orders manually reviewed are ultimately
accepted (see next section)mdashhighlighting the need for
merchants to improve automated screening accuracy and
reduce the need for review A look at order reject and
acceptance rates follows in Stage 3 of the pipeline review
Overall $500K ndash lt$5Mlt$500K $5M ndash lt$25M $25M+
Average Orders Reviewed Per DayReviewer(by merchant size)
n=185
124
46
2322
68
10
Median of Weeks
4
52
Number of Weeks Required to Train New Reviewer
lt1
3
1
11
2
10
3
11
4
21
5-9
28
10-14
11
15+
5
n=159
11
Overall $500K ndash lt$5Mlt$500K $5M ndash lt$25M $25M+
of Review Staff New in 2008
n=206
24
1413
7
15
12
14
C Y B E R S O U R C E 1 0 T H A N N U A L O N L I N E F R A U D R E P O R T
Post-Review Order Acceptance RatesMerchants who manually review orders indicated they
ultimately accepted nearly frac34 of the orders they manually
reviewed (see chart 13) This was similar to the
proportion reported in 2007 50 of merchants report
they accept 90 or more of orders they manually review
These merchants are incurring significant expense
to find the 10 of the review queue they believe to be
too risky to accept Clearly most merchants require better
methods to determine which orders are to be outsorted for
manual review so only truly suspicious orders receive
human attention
Stage 3 Order Dispositioning (AcceptReject)
Automated
Screening1
Manual
Review2
Accept
Reject3
Fraud Claim
Management4ORDER
RETAINED
REVENUE
Tuning and Management
of Merchants Reporting This Level
of Post-Review Acceptance
1380 ndash 89
4490 ndash 99
6100
970 ndash 79
360 ndash 69
750 ndash 59
140 ndash 49
330 ndash 39
420 ndash 29
510 ndash 19
51 ndash 9
20
50 accept 90+
Post-Review Acceptance Trends
70
30
10
50
100
60
20
40
80
90
0
Most orders that enter manual review are accepted
2003
66
2004
71
2005
69
2006
66
2007
75
2008
73
of Orders Accepted in Review
13
15
C Y B E R S O U R C E 1 0 T H A N N U A L O N L I N E F R A U D R E P O R T
15copy2009 CyberSource Corporation All rights reserved
Overall Order Rejection RatesOrder reject rates can reflect true fraud
risk or signal ldquoprofit leaksrdquo in terms of
valid order rejection or unnecessarily
high rates of manual review In 2008 for
the first time in several years merchants
participating in the survey reported a
significant drop in their order rejection
rates from 42 in 2007 to 29 (see
chart 14)
Order rejection rates dropped in 2008 for
almost every size of merchant (see chart
15) except the very smallest and for
every industry segment (see chart 16)
It is likely that as online sales growth
slows and merchants seek to sustain
revenue levels merchants will look for
ways to accept more orders and reduce
orders rejected due to suspicion of fraud
In 2008 merchants were able to successfully reduce order
rejection rates while holding fraud rates stable It remains
to be seen if order rejection rates can be reduced further
in 2009 without an increase in fraud rates or manual
order review
Order rejection rates also vary by type of product and
merchant profile Chart 16 shows that segments which
have high cost of goods sold andor lower gross margins
tend to have higher order rejection rates Each fraud loss
in this arena has a large negative profit impact Consumer
electronics and jewelryapparel are two examples of online
segments that tend to have higher-than-average order
rejection rates
Yet even within similar groups of online merchants we
see that some merchants achieve low order rejection rates
while still keeping fraudulent order rates under control
Examining the large consumer electronics merchants in
the sample we find that half of these merchants report
35
15
05
25
50
30
10
20
40
45
0
Order Rejection Trends
2005
39
2006
41
2007
42
2008
29
14
Average Orders Rejected Due to Suspicion of Fraud
2007 n=2392008 n=326
Overall $500K ndash lt$5Mlt$500K $5M ndash lt$25M $25M+0
6
4
2
1
3
5
7
8
9
10
45
26
43
64
24
39
27
262
9
42
Order Rejection Rates by Selected Online Segment20072008
n=23
9
n=32
6
n=64
n=95
n=63
n=62
n=35
n=57
n=62
n=85
n=62
n=85
Overall Media amp
Entertainment
Digital Goods
ServicesApparel
Jewelry
Consumer
Electronics
49
34
32
56
42
56
32
42
29
42
Household amp
General Merchandise
22
31
15
16
16
C Y B E R S O U R C E 1 0 T H A N N U A L O N L I N E F R A U D R E P O R T
order rejection rates of 2 or less while maintaining
fraudulent order rates at or even below the average for
their segment
International Orders RiskierMerchants consistently report a much higher level of
order rejection on international orders due to suspicion
of payment fraud In 2008 merchants report their
rejection rate on these orders is over three and one half
times that of domestic orders as shown in chart 17
The actual fraud rate experienced on international orders
supports this cautious approach as merchants report the
fraud risk on international orders is also over three and
one half times that of domestic orders
Order Rejection Trends
of total USCanadian orders rejected of international orders rejected
Historically international order rejection rates
average 32x higher than USCanadian rates
2005 20072006 2008
6
4
2
1
3
5
7
8
9
12
11
10
13
14
42
11
11
29
13
41
12
39
0
15
17
17
C Y B E R S O U R C E 1 0 T H A N N U A L O N L I N E F R A U D R E P O R T
17copy2009 CyberSource Corporation All rights reserved
Fighting ChargebacksThis yearrsquos survey once again examined online merchantsrsquo
practices associated with reviewing and contesting
chargebacks (ldquore-presentmentrdquo) Over the past four years
the share of fraud-coded chargebacks merchants contest
has averaged 43 to 53 with the 2008 average at
50 Medium and large merchants report contesting 52
and 46 respectively of their fraud-coded chargebacks
in 2008 However when we look at the distribution of
merchantsrsquo answers to this question we find that over one
third of merchants are disputing 90 or more of their
fraud chagebacks while three out of ten merchants are
disputing less than 10 of their fraud chargebacks (see
chart 18)
Merchants report that they win on average 44 of the
chargebacks they dispute which is very similar to the 42
win rate reported in 2006 and 40 in 2007 Simply using
the average percent of chargebacks that are disputed (50)
times the average win rate of 44 results in a net recovery
rate of 22 (meaning 22 of all fraud-coded chargebacks
are recovered) However given the wide disparity in the
chargeback re-presentment rate when these are calculated
on a merchant-by-merchant basis and then averaged the
re-presentment win rate rises to 28 (see chart 19 on
next page) the same recovery rate that was found in 2007
Therefore disputing most fraud chargebacks and having
an efficient re-presentment process can help enhance
profitability and reduce fraud loss
Stage 4 Fraud Claim Management
Automated
Screening1
Manual
Review2
Accept
Reject3
Fraud Claim
Management4ORDER
RETAINED
REVENUE
Tuning and Management
Average Total Fraud-Coded
Chargebacks Re-presented of Merchants Reporting
this Re-presentment Rate
480 ndash 89
790 ndash 99
100
370 ndash 79
460 ndash 69
450 ndash 59
540 ndash 49
130 ndash 39
520 ndash 29
810 ndash 19
1 ndash 9
0
C
harg
ebac
ks R
e-pr
esen
ted
Overall $500K ndash lt$5Mlt$500K $5M ndash lt$25M $25M+
Annual Online Revenue
2006 n=1612007 n=1002008 n=120
50
53
47
36
38
48 52
46
5863
56
56
46
45
53
15
15
28
18
18
C Y B E R S O U R C E 1 0 T H A N N U A L O N L I N E F R A U D R E P O R T
Chargeback Management ToolsOf course disputing chargebacks is not an easy or cost-
free process Merchants must manage and organize all
order delivery and payment information to successfully
dispute fraudulent orders with financial institutions
Merchants are beginning to adopt automated systems
for handling this aspect of the pipeline One out of five
merchants reported using chargeback management tools
in 2008 and 37 of large merchants reported using
these tools In our 2006 survey we asked merchants to
provide estimates of how many hours it takes on average
to handle a fraud chargeback The average time spent
overall was 18 hours with a median time of 10 hours
to handle a fraud chargeback (total time consumed
for research documentation submission) The largest
merchants reported a median time of 30 minutes per fraud
chargeback Clearly fraud chargeback management is a
significant expense for merchants
ChargebacksmdashOnly Half the Problem How a fraudulent order is handled can have a significant
impact on bottom line profits Fraudulent orders are
presented to the merchant via two main routes as a
chargeback or as a direct request from a consumer
for credit (they claim fraudulent use of their account)
Although chargebacks are the most often cited metric
merchants report that chargebacks actually account for less
than half of all fraud claims This is true for all sizes of
merchants (see chart 20)
In 2007 large ($25M+ online sales) merchants reported
that 57 of their fraud was presented in the form of a
fraud-coded chargeback but in 2008 this dropped back
to 48 Considering the financial impact of both fraud
claim routes (chargebacks and credit issuancereversal)
some merchants encourage direct consumer contact
to address fraud claims and thus avoid the additional
chargeback fees levied by the merchant bankprocessor If
a consumer contacts the merchant first then the decision
is in the merchantrsquos control to either handle the dispute
directly with the consumer or to advise them to initiate a
fraud chargeback process In any event if merchants are
evaluating fraud losses solely on the basis of chargebacks
the actual rate of fraud loss the business is experiencing
may be as much as two times higher due to direct credit
issuancecharge reversal
Overall $500K ndash lt$5Mlt$500K $5M ndash lt$25M $25M+
Fraud Chargeback Re-presentment
Win RateNet Recovery Rate
Annual Online Revenues
Challenged Net Recovery
44AVERAGEWINRATE
46AVERAGEWINRATE
43AVERAGEWINRATE
54AVERAGEWINRATE
32AVERAGEWINRATE
50
28
36
23
52
38
63
35
46
19
10
0
20
30
40
50
60
70
80
90
100
(Net Recovery Rate is expressed as a of all fraud-coded chargebacks)
19
Overall $500K ndash lt$5Mlt$500K $5M ndash lt$25M $25M+
of Fraud Claims
Chargebacks vs Credit Issued by Merchant
Credits IssuedChargebacks
58
42
76
24
57
43
52
48
52
48
n=25
n=14
7
n=27
n=30
n=55
Annual Online Revenue
n=147
10
0
20
30
40
50
60
70
80
90
100
20
19
C Y B E R S O U R C E 1 0 T H A N N U A L O N L I N E F R A U D R E P O R T
19copy2009 CyberSource Corporation All rights reserved
Fraud Rate MetricsWhen monitoring the level and trend of online
fraud loss we focus on three key metrics
1) Overall revenue lost as a percent of total
online sales 2) percent of accepted orders
which turn out to be fraudulent (domestic and
international) and 3) the average value of a
fraudulent order relative to a valid order Fraud
rates vary widely by merchant and depend on a
variety of factors such as online sales volume
type of products or services sold online and
how such productsservices are delivered and
paid for It is important that merchants track
key fraud metrics over time and evaluate their
performance relative to their peer group (both
size and industry) Note this report provides
benchmarks on total fraud rates (chargebacks +
credits issued directly to consumers by merchants)
As such these metrics tend to be higher
than those reported by banks and credit card
associations which generally base reported rates
on chargeback activity only
Depending on which products or services are being sold
online fraud loss risk tolerances and order rejection
rates can vary significantly Merchants selling high
cost goods with relatively low gross margins like most
consumer electronics products tend to err on the side
of rejecting more orders to avoid expensive fraud losses
Merchants who are less subject to fraud attacks can
achieve similar fraud loss rates while rejecting
relatively few orders Over the past few years
as fraud rates have remained relatively stable
we have compiled data on fraud practices and
benchmarks by industry
Direct Revenue Loss Rates
Very large merchants typically use more tools
and have more experience and resources to
manage online fraud so their fraud rates tend
to be lower than the overall rate Revenue loss
measurement includes not only the value of
orders on which fraudulent chargebacks are
received but also the cost of any credits issued
to avoid such chargebacks Figures include both
chargebacks and credits issued directly by the
merchant in response to fraud claims
Fraudulent Order Rate for Accepted Orders
Another key metric is the number of accepted orders that
later turn out to be fraudulent Expressed as a percent of total
orders this metric is typically lower than the revenue loss
percent since the average value of fraudulent orders tends
to be greater than the average value of valid orders which
causes the fraud rate as measured by revenues to be higher
Overall 38 of merchants reported experiencing a fraudulent
order rate of 1 or more in 2008 which was the same
percent reported in 2007
20072008
Average Online Revenue Lost to Payment Fraud
(chargebacks amp fraud-related credits)
Overall $500K ndash lt$5Mlt$500K $5M ndash lt$25M $25M+
Annual Online Revenue
0
12
08
04
02
06
10
14
16
18
14 1
5 16
15
121
3
13
15
14
14
20072008
Average Accepted Orders Resulting in Fraud Losses
Overall $500K ndash lt$5Mlt$500K $5M ndash lt$25M $25M+
Annual Online Revenue
0
12
08
04
02
06
10
14
16
18
16
11
13
12
11
13
11
13
11
13
A fraud chargeback was received on the orders OR a credit was issued directly to a customerwho claims not to have placed an order
21
22
20
C Y B E R S O U R C E 1 0 T H A N N U A L O N L I N E F R A U D R E P O R T
International Orders Carry Higher Risk
Fifty-two percent of merchants surveyed accepted orders
from outside the US amp Canada in 2008 International
sales accounted for an average of 17 of total orders
for these merchants That same group reported that the
actual direct fraud rate on international orders averaged
40 or more than 36 times the overall fraud rate for
domestic online orders Though international markets
represent an attractive opportunity online merchants must
make sure that their fraud detection and management
systems are robust enough to handle the additional risk
involved Merchants who sell online outside of the US
amp Canada report that they reject international orders due
to suspicion of fraud at a rate that is over three and one
half times the US and Canadian average rate of 29
mdash rejecting approximately 1 out of every 9 international
orders received
Average Value of Fraudulent Order Higher than a Valid Order
Historically fraudulent orders tend to have higher values
on average than valid orders In 2008 the median value
of a fraudulent order was $200 compared to $130 median
value reported for valid orders This relationship of higher
fraudulent order values vs valid order value was found for
all merchant size categories as chart 24 shows Since
fraudulent orders tend to be somewhat higher in value than
valid orders merchants will tend to outsort more high value
orders for manual review and verification Large online
merchants reported that the median value of an order
flagged for manual review was $245
Valid vs Fraudulent Order Value
Valid orderFraudulent order
Median used to minimize impact of outliers
Overall $500K ndash lt$5Mlt$500K $5M ndash lt$25M $25M+
Annual Online Revenue
0
$200
$50
$100
$150
$250
$300
$350
$120
$150
$200
$150
$250
$175
$150
$100
$200
$130
24
40
10
05
20
15
25
35
45
30
00
International Fraud Rateover 3x USCanadian rate
11
40
Location of Order Origination
Within USCanadan=326
Outside USCanadan=164
Frau
d R
ate
o
f O
rder
s
23
21
C Y B E R S O U R C E 1 0 T H A N N U A L O N L I N E F R A U D R E P O R T
21copy2009 CyberSource Corporation All rights reserved
Tuning amp Management
Maintaining and Tuning Screening Rules28 of merchants say they have an automated order
screening system in place that allows business managers
to modify decision rules without assistance from internal
IT staff or external parties (up from 16 found in 2006)
The ability to adjust automated order screening systems
quickly helps manage the order review flow tailor rules
to new products and adapt to new fraud trends as they
are encountered Without this ability merchants cannot
easily minimize reject rates review costs or fraud rates
Additionally giving business managers the capability of
adjusting business rules on-the-fly reduces the costs and
burden of IT support
Global Fraud Portals Some online merchants are integrating fraud tools
and strategies via fraud management portals These
portals employ a combination of flexible rules systems
that interact with a portfolio of ldquotruth servicesrdquo around
the globe allowing business managers to set payment
type product type and market-specific screens Case
management systems are being integrated with these
portals with accompanying enhancements to streamline
workflow Global fraud portals typically include hierarchical
management as companies strive to centralize fraud
management across multiple lines of business and
geographies
Merchant Budgets for Fraud Management How much are online merchants spending to mitigate
fraud risk In both 2008 and in 2007 survey results
show that 34 of merchants spend 05 or more of
their online revenues to manage online payment fraud
while 66 spend less than 05 In 2008 across
all merchants the median ratio of fraud management
expense to sales was 022 down from 028 in 2007
although some merchants in high risk categories are
spending significantly more These spending estimates
focus on the cost of managing fraud risk (internal and
external systems and services management development
and review staffs) Direct fraud loss (chargebacks lost
goods and associated shipping costs) as well as the
opportunity cost associated with valid order rejection are
not included here (see chart 25)
Automated
Screening1
Manual
Review2
Accept
Reject3
Fraud Claim
Management4ORDER
RETAINED
REVENUE
Tuning and Management
02ndash lt050ndash lt02 05ndash lt10 10ndash lt40 40+
How Much Merchants Spend
on Fraud Management
(percent of merchants operating at defined expense level)
of Annual Online Revenues Spent to Manage Fraud(staff etc excluding fraud loss)
2007 n=972008 n=108
41 44
6
14
24
22
12 16
16
4
Median2008 = 022
2007 = 028
0
60
40
20
25
title (title)
22
C Y B E R S O U R C E 1 0 T H A N N U A L O N L I N E F R A U D R E P O R T
Budget Allocation For the past three years merchants have consistently
spent just over half their fraud management budgets on
review staff (see chart 26) The remainder is allocated
as follows 25 for third party tools or services and 24
on internally developed tools and systems
Clearly review staff costs are the dominant factor and
only 13 of merchants cite plans to increase review
staffing in 2009 Reducing the need for manual review
and increasing the efficiency and effectiveness of
reviewers is key to growing online business profits and
managing the total cost of online payment fraud One
place to start is by improving the automated detection of
risky orders so as to reduce manual order review volumes
Clearly the continued reliance on manual review we have
seen in the data over the last few years is not an optimal
long term strategy for managing online fraud As budgets
come under increasing pressure merchants will need
to redouble their efforts to automate more of the fraud
management process while keeping valid order conversion
high and fraud loss low
Base Those with 1 or more full-time manual review staff
Average Spending Allocation
for Fraud Management 2008
n=400
3rd Party
Tools
23
24
Internal
Tools amp
System
3rd Party
Tools
25
Order
Review
Staff
51
Planned Staffing Levels
Increase
13
21
Same
81
71
2009
2008
Decrease
6
8
n=238 248
26
23
C Y B E R S O U R C E 1 0 T H A N N U A L O N L I N E F R A U D R E P O R T
23copy2009 CyberSource Corporation All rights reserved
Resources amp Solutions
3 Managed Services
2 Design amp Installation
1 Systems amp Services
PAYMENT SECURITY
Order
Screening
Collection amp
Reconciliation
Global Payment
Acceptance
Processing
Management
L A S E R
BankBankTrans f e rTrans f e r
Direct
Debit
ORDER
bull Onlinebull Call Centerbull IVRbull Kioskbull POSbull ERP
With Performance
Guarantees
To find information on CyberSourcersquos industry-leading risk
management solutions self-paced webinars on decision
management and other whitepapers on electronic payment
management visit our Resource Center at
wwwcybersourcecom For sales assistance phone
1-888-330-2300 or e-mail salescybersourcecom
CyberSource Payment Management Solutions CyberSource offers a comprehensive portfolio of modular
services and tools to help your company manage your entire
payment pipeline to optimize sales results All are available
via one connection to our web-based services
Accept All Popular Payment Types in 190+
Countries
Accept payments worldwide using a merchant account from
your preferred provider or CyberSource worldwide credit
and debit cards regional cards direct debit bank
transfers electronic checks and alternative payment
types such as Bill Me Later and PayPal CyberSource
also provides professional services to help you
integrate payment with front-end and back-office
systems
Risk ManagementOrder Screening
Global Fraud Management Portal with CyberSource Intelligent
Review Technology A hosted rules and case management
system that provides on-demand access to over 150
validation tests and services across all four dimensions of
detection Detectors include multi-merchant transaction
history checks worldwide delivery address and phone
verification device fingerprinting IP geolocation purchase
velocity identity morphing and custom data from your
systems Case management system provides consolidated
data review workflow management and built-in callouts to
validation services to streamline review
Managed Services CyberSource provides client services to
help you analyze design and manage your order screening
and fraud detection processesmdasheverything from screening
strategies and risk threshold optimization analysis
to ongoing monitoring order review and chargeback
managementrecovery Our managed services include
business performance guarantees
Payer Authentication Verified by Visa MasterCard
SecureCode
Processing Management
CyberSource processes your payments in our high
availability datacenters located in the US Europe and
Japan All datacenters are certified PCI-compliant and
include sophisticated processing management logic to help
prevent payment failures and rate downgrades
Collection amp Reconciliation
A full array of online and exportable payment reporting
capability is available to streamline reconciliation activity
Further systems can be installed to automate up to 90
of the tasks associated with payment reconciliation and
chargeback re-presentment
Payment Security
Remove Payment Data From Your Network CyberSource
provides secure storage and hosted payment acceptance
services that let you process without storing or even
transmitting payment data A great way to streamline PCI
compliance and mitigate security risk
Payment System Centralization Our team of experts will help
you consolidate multiple payment systems into a single easy
to manage system Optionally CyberSource will also host
support and manage these systems in our secure datacenters
PCI Planning amp Remediation CyberSource provides PCI
compliance consulting and remediation services to help
remedy PCI issues
Professional Services
CyberSource maintains a team of experienced payment
consultants to assist with payment systems planning
system and process design and implementation and
integration Our client services team is additionally
available to help you monitor tune or fully outsource
portions of your payment operations
C Y B E R S O U R C E 1 0 T H A N N U A L O N L I N E F R A U D R E P O R T
North America
CyberSource Corporation
1295 Charleston Road
Mountain View CA 94043
T 8883302300
T 6509656000
F 6506259145
Email infocybersourcecom
Europe
CyberSource Ltd
The Waterfront
300 Thames Valley Park Drive
Thames Valley Park
Reading RG6 1PT
United Kingdom
T +44 (0) 1189294840
F +44 (0) 8704601931
Email ukcybersourcecom
UK Fraud Report wwwcybersourcecoukukfraudreport
Japan
CyberSource KK (Japan)
3-11-11 Shibuya Shibuya-ku
Tokyo 150-0002 Japan
T +81357747733
F +81357747732
Email mailcybersourcecojp
CyberSource Corporation is a leading provider of
electronic payment risk and security management
solutions CyberSource provides payment management
solutions for electronic payments processed via Web
call center kiosk mobile and POS environments
Services include hosted systems to help you manage
electronic payments as well as professional services
to help design integrate and fully manage parts or all
of your payment operations Over 245000 businesses
worldwide use CyberSource solutions including half
the companies comprising the Dow Jones Industrial
Average and leading Internet brands The company
is headquartered in Mountain View California and
has sales and service offices in Japan the United
Kingdom and other locations in the United States
For More Information
bull Call 18883302300
bull Email infocybersourcecom
bull Visit wwwcybersourcecom
Get Tailored Views of Risk Management
Pipelinetrade MetricsTo get a view crafted for your companyrsquos size and industry
please contact CyberSource at 18883302300 or online at
wwwcybersourcecomcontact_us
For additional information whitepapers and webinars
or sales assistance
bull Contact CyberSource 18883302300 or
wwwcybersourcecomcontact_us
bull Risk Management Solutions visit wwwcybersourcecom
products_and_servicesrisk_management
bull Global Payment amp Security Solutions
visit wwwcybersourcecomproducts_and_services
global_payment_services
About CyberSource
C Y B E R S O U R C E 1 0 T H A N N U A L O N L I N E F R A U D R E P O R T

14
C Y B E R S O U R C E 1 0 T H A N N U A L O N L I N E F R A U D R E P O R T
Post-Review Order Acceptance RatesMerchants who manually review orders indicated they
ultimately accepted nearly frac34 of the orders they manually
reviewed (see chart 13) This was similar to the
proportion reported in 2007 50 of merchants report
they accept 90 or more of orders they manually review
These merchants are incurring significant expense
to find the 10 of the review queue they believe to be
too risky to accept Clearly most merchants require better
methods to determine which orders are to be outsorted for
manual review so only truly suspicious orders receive
human attention
Stage 3 Order Dispositioning (AcceptReject)
Automated
Screening1
Manual
Review2
Accept
Reject3
Fraud Claim
Management4ORDER
RETAINED
REVENUE
Tuning and Management
of Merchants Reporting This Level
of Post-Review Acceptance
1380 ndash 89
4490 ndash 99
6100
970 ndash 79
360 ndash 69
750 ndash 59
140 ndash 49
330 ndash 39
420 ndash 29
510 ndash 19
51 ndash 9
20
50 accept 90+
Post-Review Acceptance Trends
70
30
10
50
100
60
20
40
80
90
0
Most orders that enter manual review are accepted
2003
66
2004
71
2005
69
2006
66
2007
75
2008
73
of Orders Accepted in Review
13
15
C Y B E R S O U R C E 1 0 T H A N N U A L O N L I N E F R A U D R E P O R T
15copy2009 CyberSource Corporation All rights reserved
Overall Order Rejection RatesOrder reject rates can reflect true fraud
risk or signal ldquoprofit leaksrdquo in terms of
valid order rejection or unnecessarily
high rates of manual review In 2008 for
the first time in several years merchants
participating in the survey reported a
significant drop in their order rejection
rates from 42 in 2007 to 29 (see
chart 14)
Order rejection rates dropped in 2008 for
almost every size of merchant (see chart
15) except the very smallest and for
every industry segment (see chart 16)
It is likely that as online sales growth
slows and merchants seek to sustain
revenue levels merchants will look for
ways to accept more orders and reduce
orders rejected due to suspicion of fraud
In 2008 merchants were able to successfully reduce order
rejection rates while holding fraud rates stable It remains
to be seen if order rejection rates can be reduced further
in 2009 without an increase in fraud rates or manual
order review
Order rejection rates also vary by type of product and
merchant profile Chart 16 shows that segments which
have high cost of goods sold andor lower gross margins
tend to have higher order rejection rates Each fraud loss
in this arena has a large negative profit impact Consumer
electronics and jewelryapparel are two examples of online
segments that tend to have higher-than-average order
rejection rates
Yet even within similar groups of online merchants we
see that some merchants achieve low order rejection rates
while still keeping fraudulent order rates under control
Examining the large consumer electronics merchants in
the sample we find that half of these merchants report
35
15
05
25
50
30
10
20
40
45
0
Order Rejection Trends
2005
39
2006
41
2007
42
2008
29
14
Average Orders Rejected Due to Suspicion of Fraud
2007 n=2392008 n=326
Overall $500K ndash lt$5Mlt$500K $5M ndash lt$25M $25M+0
6
4
2
1
3
5
7
8
9
10
45
26
43
64
24
39
27
262
9
42
Order Rejection Rates by Selected Online Segment20072008
n=23
9
n=32
6
n=64
n=95
n=63
n=62
n=35
n=57
n=62
n=85
n=62
n=85
Overall Media amp
Entertainment
Digital Goods
ServicesApparel
Jewelry
Consumer
Electronics
49
34
32
56
42
56
32
42
29
42
Household amp
General Merchandise
22
31
15
16
16
C Y B E R S O U R C E 1 0 T H A N N U A L O N L I N E F R A U D R E P O R T
order rejection rates of 2 or less while maintaining
fraudulent order rates at or even below the average for
their segment
International Orders RiskierMerchants consistently report a much higher level of
order rejection on international orders due to suspicion
of payment fraud In 2008 merchants report their
rejection rate on these orders is over three and one half
times that of domestic orders as shown in chart 17
The actual fraud rate experienced on international orders
supports this cautious approach as merchants report the
fraud risk on international orders is also over three and
one half times that of domestic orders
Order Rejection Trends
of total USCanadian orders rejected of international orders rejected
Historically international order rejection rates
average 32x higher than USCanadian rates
2005 20072006 2008
6
4
2
1
3
5
7
8
9
12
11
10
13
14
42
11
11
29
13
41
12
39
0
15
17
17
C Y B E R S O U R C E 1 0 T H A N N U A L O N L I N E F R A U D R E P O R T
17copy2009 CyberSource Corporation All rights reserved
Fighting ChargebacksThis yearrsquos survey once again examined online merchantsrsquo
practices associated with reviewing and contesting
chargebacks (ldquore-presentmentrdquo) Over the past four years
the share of fraud-coded chargebacks merchants contest
has averaged 43 to 53 with the 2008 average at
50 Medium and large merchants report contesting 52
and 46 respectively of their fraud-coded chargebacks
in 2008 However when we look at the distribution of
merchantsrsquo answers to this question we find that over one
third of merchants are disputing 90 or more of their
fraud chagebacks while three out of ten merchants are
disputing less than 10 of their fraud chargebacks (see
chart 18)
Merchants report that they win on average 44 of the
chargebacks they dispute which is very similar to the 42
win rate reported in 2006 and 40 in 2007 Simply using
the average percent of chargebacks that are disputed (50)
times the average win rate of 44 results in a net recovery
rate of 22 (meaning 22 of all fraud-coded chargebacks
are recovered) However given the wide disparity in the
chargeback re-presentment rate when these are calculated
on a merchant-by-merchant basis and then averaged the
re-presentment win rate rises to 28 (see chart 19 on
next page) the same recovery rate that was found in 2007
Therefore disputing most fraud chargebacks and having
an efficient re-presentment process can help enhance
profitability and reduce fraud loss
Stage 4 Fraud Claim Management
Automated
Screening1
Manual
Review2
Accept
Reject3
Fraud Claim
Management4ORDER
RETAINED
REVENUE
Tuning and Management
Average Total Fraud-Coded
Chargebacks Re-presented of Merchants Reporting
this Re-presentment Rate
480 ndash 89
790 ndash 99
100
370 ndash 79
460 ndash 69
450 ndash 59
540 ndash 49
130 ndash 39
520 ndash 29
810 ndash 19
1 ndash 9
0
C
harg
ebac
ks R
e-pr
esen
ted
Overall $500K ndash lt$5Mlt$500K $5M ndash lt$25M $25M+
Annual Online Revenue
2006 n=1612007 n=1002008 n=120
50
53
47
36
38
48 52
46
5863
56
56
46
45
53
15
15
28
18
18
C Y B E R S O U R C E 1 0 T H A N N U A L O N L I N E F R A U D R E P O R T
Chargeback Management ToolsOf course disputing chargebacks is not an easy or cost-
free process Merchants must manage and organize all
order delivery and payment information to successfully
dispute fraudulent orders with financial institutions
Merchants are beginning to adopt automated systems
for handling this aspect of the pipeline One out of five
merchants reported using chargeback management tools
in 2008 and 37 of large merchants reported using
these tools In our 2006 survey we asked merchants to
provide estimates of how many hours it takes on average
to handle a fraud chargeback The average time spent
overall was 18 hours with a median time of 10 hours
to handle a fraud chargeback (total time consumed
for research documentation submission) The largest
merchants reported a median time of 30 minutes per fraud
chargeback Clearly fraud chargeback management is a
significant expense for merchants
ChargebacksmdashOnly Half the Problem How a fraudulent order is handled can have a significant
impact on bottom line profits Fraudulent orders are
presented to the merchant via two main routes as a
chargeback or as a direct request from a consumer
for credit (they claim fraudulent use of their account)
Although chargebacks are the most often cited metric
merchants report that chargebacks actually account for less
than half of all fraud claims This is true for all sizes of
merchants (see chart 20)
In 2007 large ($25M+ online sales) merchants reported
that 57 of their fraud was presented in the form of a
fraud-coded chargeback but in 2008 this dropped back
to 48 Considering the financial impact of both fraud
claim routes (chargebacks and credit issuancereversal)
some merchants encourage direct consumer contact
to address fraud claims and thus avoid the additional
chargeback fees levied by the merchant bankprocessor If
a consumer contacts the merchant first then the decision
is in the merchantrsquos control to either handle the dispute
directly with the consumer or to advise them to initiate a
fraud chargeback process In any event if merchants are
evaluating fraud losses solely on the basis of chargebacks
the actual rate of fraud loss the business is experiencing
may be as much as two times higher due to direct credit
issuancecharge reversal
Overall $500K ndash lt$5Mlt$500K $5M ndash lt$25M $25M+
Fraud Chargeback Re-presentment
Win RateNet Recovery Rate
Annual Online Revenues
Challenged Net Recovery
44AVERAGEWINRATE
46AVERAGEWINRATE
43AVERAGEWINRATE
54AVERAGEWINRATE
32AVERAGEWINRATE
50
28
36
23
52
38
63
35
46
19
10
0
20
30
40
50
60
70
80
90
100
(Net Recovery Rate is expressed as a of all fraud-coded chargebacks)
19
Overall $500K ndash lt$5Mlt$500K $5M ndash lt$25M $25M+
of Fraud Claims
Chargebacks vs Credit Issued by Merchant
Credits IssuedChargebacks
58
42
76
24
57
43
52
48
52
48
n=25
n=14
7
n=27
n=30
n=55
Annual Online Revenue
n=147
10
0
20
30
40
50
60
70
80
90
100
20
19
C Y B E R S O U R C E 1 0 T H A N N U A L O N L I N E F R A U D R E P O R T
19copy2009 CyberSource Corporation All rights reserved
Fraud Rate MetricsWhen monitoring the level and trend of online
fraud loss we focus on three key metrics
1) Overall revenue lost as a percent of total
online sales 2) percent of accepted orders
which turn out to be fraudulent (domestic and
international) and 3) the average value of a
fraudulent order relative to a valid order Fraud
rates vary widely by merchant and depend on a
variety of factors such as online sales volume
type of products or services sold online and
how such productsservices are delivered and
paid for It is important that merchants track
key fraud metrics over time and evaluate their
performance relative to their peer group (both
size and industry) Note this report provides
benchmarks on total fraud rates (chargebacks +
credits issued directly to consumers by merchants)
As such these metrics tend to be higher
than those reported by banks and credit card
associations which generally base reported rates
on chargeback activity only
Depending on which products or services are being sold
online fraud loss risk tolerances and order rejection
rates can vary significantly Merchants selling high
cost goods with relatively low gross margins like most
consumer electronics products tend to err on the side
of rejecting more orders to avoid expensive fraud losses
Merchants who are less subject to fraud attacks can
achieve similar fraud loss rates while rejecting
relatively few orders Over the past few years
as fraud rates have remained relatively stable
we have compiled data on fraud practices and
benchmarks by industry
Direct Revenue Loss Rates
Very large merchants typically use more tools
and have more experience and resources to
manage online fraud so their fraud rates tend
to be lower than the overall rate Revenue loss
measurement includes not only the value of
orders on which fraudulent chargebacks are
received but also the cost of any credits issued
to avoid such chargebacks Figures include both
chargebacks and credits issued directly by the
merchant in response to fraud claims
Fraudulent Order Rate for Accepted Orders
Another key metric is the number of accepted orders that
later turn out to be fraudulent Expressed as a percent of total
orders this metric is typically lower than the revenue loss
percent since the average value of fraudulent orders tends
to be greater than the average value of valid orders which
causes the fraud rate as measured by revenues to be higher
Overall 38 of merchants reported experiencing a fraudulent
order rate of 1 or more in 2008 which was the same
percent reported in 2007
20072008
Average Online Revenue Lost to Payment Fraud
(chargebacks amp fraud-related credits)
Overall $500K ndash lt$5Mlt$500K $5M ndash lt$25M $25M+
Annual Online Revenue
0
12
08
04
02
06
10
14
16
18
14 1
5 16
15
121
3
13
15
14
14
20072008
Average Accepted Orders Resulting in Fraud Losses
Overall $500K ndash lt$5Mlt$500K $5M ndash lt$25M $25M+
Annual Online Revenue
0
12
08
04
02
06
10
14
16
18
16
11
13
12
11
13
11
13
11
13
A fraud chargeback was received on the orders OR a credit was issued directly to a customerwho claims not to have placed an order
21
22
20
C Y B E R S O U R C E 1 0 T H A N N U A L O N L I N E F R A U D R E P O R T
International Orders Carry Higher Risk
Fifty-two percent of merchants surveyed accepted orders
from outside the US amp Canada in 2008 International
sales accounted for an average of 17 of total orders
for these merchants That same group reported that the
actual direct fraud rate on international orders averaged
40 or more than 36 times the overall fraud rate for
domestic online orders Though international markets
represent an attractive opportunity online merchants must
make sure that their fraud detection and management
systems are robust enough to handle the additional risk
involved Merchants who sell online outside of the US
amp Canada report that they reject international orders due
to suspicion of fraud at a rate that is over three and one
half times the US and Canadian average rate of 29
mdash rejecting approximately 1 out of every 9 international
orders received
Average Value of Fraudulent Order Higher than a Valid Order
Historically fraudulent orders tend to have higher values
on average than valid orders In 2008 the median value
of a fraudulent order was $200 compared to $130 median
value reported for valid orders This relationship of higher
fraudulent order values vs valid order value was found for
all merchant size categories as chart 24 shows Since
fraudulent orders tend to be somewhat higher in value than
valid orders merchants will tend to outsort more high value
orders for manual review and verification Large online
merchants reported that the median value of an order
flagged for manual review was $245
Valid vs Fraudulent Order Value
Valid orderFraudulent order
Median used to minimize impact of outliers
Overall $500K ndash lt$5Mlt$500K $5M ndash lt$25M $25M+
Annual Online Revenue
0
$200
$50
$100
$150
$250
$300
$350
$120
$150
$200
$150
$250
$175
$150
$100
$200
$130
24
40
10
05
20
15
25
35
45
30
00
International Fraud Rateover 3x USCanadian rate
11
40
Location of Order Origination
Within USCanadan=326
Outside USCanadan=164
Frau
d R
ate
o
f O
rder
s
23
21
C Y B E R S O U R C E 1 0 T H A N N U A L O N L I N E F R A U D R E P O R T
21copy2009 CyberSource Corporation All rights reserved
Tuning amp Management
Maintaining and Tuning Screening Rules28 of merchants say they have an automated order
screening system in place that allows business managers
to modify decision rules without assistance from internal
IT staff or external parties (up from 16 found in 2006)
The ability to adjust automated order screening systems
quickly helps manage the order review flow tailor rules
to new products and adapt to new fraud trends as they
are encountered Without this ability merchants cannot
easily minimize reject rates review costs or fraud rates
Additionally giving business managers the capability of
adjusting business rules on-the-fly reduces the costs and
burden of IT support
Global Fraud Portals Some online merchants are integrating fraud tools
and strategies via fraud management portals These
portals employ a combination of flexible rules systems
that interact with a portfolio of ldquotruth servicesrdquo around
the globe allowing business managers to set payment
type product type and market-specific screens Case
management systems are being integrated with these
portals with accompanying enhancements to streamline
workflow Global fraud portals typically include hierarchical
management as companies strive to centralize fraud
management across multiple lines of business and
geographies
Merchant Budgets for Fraud Management How much are online merchants spending to mitigate
fraud risk In both 2008 and in 2007 survey results
show that 34 of merchants spend 05 or more of
their online revenues to manage online payment fraud
while 66 spend less than 05 In 2008 across
all merchants the median ratio of fraud management
expense to sales was 022 down from 028 in 2007
although some merchants in high risk categories are
spending significantly more These spending estimates
focus on the cost of managing fraud risk (internal and
external systems and services management development
and review staffs) Direct fraud loss (chargebacks lost
goods and associated shipping costs) as well as the
opportunity cost associated with valid order rejection are
not included here (see chart 25)
Automated
Screening1
Manual
Review2
Accept
Reject3
Fraud Claim
Management4ORDER
RETAINED
REVENUE
Tuning and Management
02ndash lt050ndash lt02 05ndash lt10 10ndash lt40 40+
How Much Merchants Spend
on Fraud Management
(percent of merchants operating at defined expense level)
of Annual Online Revenues Spent to Manage Fraud(staff etc excluding fraud loss)
2007 n=972008 n=108
41 44
6
14
24
22
12 16
16
4
Median2008 = 022
2007 = 028
0
60
40
20
25
title (title)
22
C Y B E R S O U R C E 1 0 T H A N N U A L O N L I N E F R A U D R E P O R T
Budget Allocation For the past three years merchants have consistently
spent just over half their fraud management budgets on
review staff (see chart 26) The remainder is allocated
as follows 25 for third party tools or services and 24
on internally developed tools and systems
Clearly review staff costs are the dominant factor and
only 13 of merchants cite plans to increase review
staffing in 2009 Reducing the need for manual review
and increasing the efficiency and effectiveness of
reviewers is key to growing online business profits and
managing the total cost of online payment fraud One
place to start is by improving the automated detection of
risky orders so as to reduce manual order review volumes
Clearly the continued reliance on manual review we have
seen in the data over the last few years is not an optimal
long term strategy for managing online fraud As budgets
come under increasing pressure merchants will need
to redouble their efforts to automate more of the fraud
management process while keeping valid order conversion
high and fraud loss low
Base Those with 1 or more full-time manual review staff
Average Spending Allocation
for Fraud Management 2008
n=400
3rd Party
Tools
23
24
Internal
Tools amp
System
3rd Party
Tools
25
Order
Review
Staff
51
Planned Staffing Levels
Increase
13
21
Same
81
71
2009
2008
Decrease
6
8
n=238 248
26
23
C Y B E R S O U R C E 1 0 T H A N N U A L O N L I N E F R A U D R E P O R T
23copy2009 CyberSource Corporation All rights reserved
Resources amp Solutions
3 Managed Services
2 Design amp Installation
1 Systems amp Services
PAYMENT SECURITY
Order
Screening
Collection amp
Reconciliation
Global Payment
Acceptance
Processing
Management
L A S E R
BankBankTrans f e rTrans f e r
Direct
Debit
ORDER
bull Onlinebull Call Centerbull IVRbull Kioskbull POSbull ERP
With Performance
Guarantees
To find information on CyberSourcersquos industry-leading risk
management solutions self-paced webinars on decision
management and other whitepapers on electronic payment
management visit our Resource Center at
wwwcybersourcecom For sales assistance phone
1-888-330-2300 or e-mail salescybersourcecom
CyberSource Payment Management Solutions CyberSource offers a comprehensive portfolio of modular
services and tools to help your company manage your entire
payment pipeline to optimize sales results All are available
via one connection to our web-based services
Accept All Popular Payment Types in 190+
Countries
Accept payments worldwide using a merchant account from
your preferred provider or CyberSource worldwide credit
and debit cards regional cards direct debit bank
transfers electronic checks and alternative payment
types such as Bill Me Later and PayPal CyberSource
also provides professional services to help you
integrate payment with front-end and back-office
systems
Risk ManagementOrder Screening
Global Fraud Management Portal with CyberSource Intelligent
Review Technology A hosted rules and case management
system that provides on-demand access to over 150
validation tests and services across all four dimensions of
detection Detectors include multi-merchant transaction
history checks worldwide delivery address and phone
verification device fingerprinting IP geolocation purchase
velocity identity morphing and custom data from your
systems Case management system provides consolidated
data review workflow management and built-in callouts to
validation services to streamline review
Managed Services CyberSource provides client services to
help you analyze design and manage your order screening
and fraud detection processesmdasheverything from screening
strategies and risk threshold optimization analysis
to ongoing monitoring order review and chargeback
managementrecovery Our managed services include
business performance guarantees
Payer Authentication Verified by Visa MasterCard
SecureCode
Processing Management
CyberSource processes your payments in our high
availability datacenters located in the US Europe and
Japan All datacenters are certified PCI-compliant and
include sophisticated processing management logic to help
prevent payment failures and rate downgrades
Collection amp Reconciliation
A full array of online and exportable payment reporting
capability is available to streamline reconciliation activity
Further systems can be installed to automate up to 90
of the tasks associated with payment reconciliation and
chargeback re-presentment
Payment Security
Remove Payment Data From Your Network CyberSource
provides secure storage and hosted payment acceptance
services that let you process without storing or even
transmitting payment data A great way to streamline PCI
compliance and mitigate security risk
Payment System Centralization Our team of experts will help
you consolidate multiple payment systems into a single easy
to manage system Optionally CyberSource will also host
support and manage these systems in our secure datacenters
PCI Planning amp Remediation CyberSource provides PCI
compliance consulting and remediation services to help
remedy PCI issues
Professional Services
CyberSource maintains a team of experienced payment
consultants to assist with payment systems planning
system and process design and implementation and
integration Our client services team is additionally
available to help you monitor tune or fully outsource
portions of your payment operations
C Y B E R S O U R C E 1 0 T H A N N U A L O N L I N E F R A U D R E P O R T
North America
CyberSource Corporation
1295 Charleston Road
Mountain View CA 94043
T 8883302300
T 6509656000
F 6506259145
Email infocybersourcecom
Europe
CyberSource Ltd
The Waterfront
300 Thames Valley Park Drive
Thames Valley Park
Reading RG6 1PT
United Kingdom
T +44 (0) 1189294840
F +44 (0) 8704601931
Email ukcybersourcecom
UK Fraud Report wwwcybersourcecoukukfraudreport
Japan
CyberSource KK (Japan)
3-11-11 Shibuya Shibuya-ku
Tokyo 150-0002 Japan
T +81357747733
F +81357747732
Email mailcybersourcecojp
CyberSource Corporation is a leading provider of
electronic payment risk and security management
solutions CyberSource provides payment management
solutions for electronic payments processed via Web
call center kiosk mobile and POS environments
Services include hosted systems to help you manage
electronic payments as well as professional services
to help design integrate and fully manage parts or all
of your payment operations Over 245000 businesses
worldwide use CyberSource solutions including half
the companies comprising the Dow Jones Industrial
Average and leading Internet brands The company
is headquartered in Mountain View California and
has sales and service offices in Japan the United
Kingdom and other locations in the United States
For More Information
bull Call 18883302300
bull Email infocybersourcecom
bull Visit wwwcybersourcecom
Get Tailored Views of Risk Management
Pipelinetrade MetricsTo get a view crafted for your companyrsquos size and industry
please contact CyberSource at 18883302300 or online at
wwwcybersourcecomcontact_us
For additional information whitepapers and webinars
or sales assistance
bull Contact CyberSource 18883302300 or
wwwcybersourcecomcontact_us
bull Risk Management Solutions visit wwwcybersourcecom
products_and_servicesrisk_management
bull Global Payment amp Security Solutions
visit wwwcybersourcecomproducts_and_services
global_payment_services
About CyberSource
C Y B E R S O U R C E 1 0 T H A N N U A L O N L I N E F R A U D R E P O R T

15
C Y B E R S O U R C E 1 0 T H A N N U A L O N L I N E F R A U D R E P O R T
15copy2009 CyberSource Corporation All rights reserved
Overall Order Rejection RatesOrder reject rates can reflect true fraud
risk or signal ldquoprofit leaksrdquo in terms of
valid order rejection or unnecessarily
high rates of manual review In 2008 for
the first time in several years merchants
participating in the survey reported a
significant drop in their order rejection
rates from 42 in 2007 to 29 (see
chart 14)
Order rejection rates dropped in 2008 for
almost every size of merchant (see chart
15) except the very smallest and for
every industry segment (see chart 16)
It is likely that as online sales growth
slows and merchants seek to sustain
revenue levels merchants will look for
ways to accept more orders and reduce
orders rejected due to suspicion of fraud
In 2008 merchants were able to successfully reduce order
rejection rates while holding fraud rates stable It remains
to be seen if order rejection rates can be reduced further
in 2009 without an increase in fraud rates or manual
order review
Order rejection rates also vary by type of product and
merchant profile Chart 16 shows that segments which
have high cost of goods sold andor lower gross margins
tend to have higher order rejection rates Each fraud loss
in this arena has a large negative profit impact Consumer
electronics and jewelryapparel are two examples of online
segments that tend to have higher-than-average order
rejection rates
Yet even within similar groups of online merchants we
see that some merchants achieve low order rejection rates
while still keeping fraudulent order rates under control
Examining the large consumer electronics merchants in
the sample we find that half of these merchants report
35
15
05
25
50
30
10
20
40
45
0
Order Rejection Trends
2005
39
2006
41
2007
42
2008
29
14
Average Orders Rejected Due to Suspicion of Fraud
2007 n=2392008 n=326
Overall $500K ndash lt$5Mlt$500K $5M ndash lt$25M $25M+0
6
4
2
1
3
5
7
8
9
10
45
26
43
64
24
39
27
262
9
42
Order Rejection Rates by Selected Online Segment20072008
n=23
9
n=32
6
n=64
n=95
n=63
n=62
n=35
n=57
n=62
n=85
n=62
n=85
Overall Media amp
Entertainment
Digital Goods
ServicesApparel
Jewelry
Consumer
Electronics
49
34
32
56
42
56
32
42
29
42
Household amp
General Merchandise
22
31
15
16
16
C Y B E R S O U R C E 1 0 T H A N N U A L O N L I N E F R A U D R E P O R T
order rejection rates of 2 or less while maintaining
fraudulent order rates at or even below the average for
their segment
International Orders RiskierMerchants consistently report a much higher level of
order rejection on international orders due to suspicion
of payment fraud In 2008 merchants report their
rejection rate on these orders is over three and one half
times that of domestic orders as shown in chart 17
The actual fraud rate experienced on international orders
supports this cautious approach as merchants report the
fraud risk on international orders is also over three and
one half times that of domestic orders
Order Rejection Trends
of total USCanadian orders rejected of international orders rejected
Historically international order rejection rates
average 32x higher than USCanadian rates
2005 20072006 2008
6
4
2
1
3
5
7
8
9
12
11
10
13
14
42
11
11
29
13
41
12
39
0
15
17
17
C Y B E R S O U R C E 1 0 T H A N N U A L O N L I N E F R A U D R E P O R T
17copy2009 CyberSource Corporation All rights reserved
Fighting ChargebacksThis yearrsquos survey once again examined online merchantsrsquo
practices associated with reviewing and contesting
chargebacks (ldquore-presentmentrdquo) Over the past four years
the share of fraud-coded chargebacks merchants contest
has averaged 43 to 53 with the 2008 average at
50 Medium and large merchants report contesting 52
and 46 respectively of their fraud-coded chargebacks
in 2008 However when we look at the distribution of
merchantsrsquo answers to this question we find that over one
third of merchants are disputing 90 or more of their
fraud chagebacks while three out of ten merchants are
disputing less than 10 of their fraud chargebacks (see
chart 18)
Merchants report that they win on average 44 of the
chargebacks they dispute which is very similar to the 42
win rate reported in 2006 and 40 in 2007 Simply using
the average percent of chargebacks that are disputed (50)
times the average win rate of 44 results in a net recovery
rate of 22 (meaning 22 of all fraud-coded chargebacks
are recovered) However given the wide disparity in the
chargeback re-presentment rate when these are calculated
on a merchant-by-merchant basis and then averaged the
re-presentment win rate rises to 28 (see chart 19 on
next page) the same recovery rate that was found in 2007
Therefore disputing most fraud chargebacks and having
an efficient re-presentment process can help enhance
profitability and reduce fraud loss
Stage 4 Fraud Claim Management
Automated
Screening1
Manual
Review2
Accept
Reject3
Fraud Claim
Management4ORDER
RETAINED
REVENUE
Tuning and Management
Average Total Fraud-Coded
Chargebacks Re-presented of Merchants Reporting
this Re-presentment Rate
480 ndash 89
790 ndash 99
100
370 ndash 79
460 ndash 69
450 ndash 59
540 ndash 49
130 ndash 39
520 ndash 29
810 ndash 19
1 ndash 9
0
C
harg
ebac
ks R
e-pr
esen
ted
Overall $500K ndash lt$5Mlt$500K $5M ndash lt$25M $25M+
Annual Online Revenue
2006 n=1612007 n=1002008 n=120
50
53
47
36
38
48 52
46
5863
56
56
46
45
53
15
15
28
18
18
C Y B E R S O U R C E 1 0 T H A N N U A L O N L I N E F R A U D R E P O R T
Chargeback Management ToolsOf course disputing chargebacks is not an easy or cost-
free process Merchants must manage and organize all
order delivery and payment information to successfully
dispute fraudulent orders with financial institutions
Merchants are beginning to adopt automated systems
for handling this aspect of the pipeline One out of five
merchants reported using chargeback management tools
in 2008 and 37 of large merchants reported using
these tools In our 2006 survey we asked merchants to
provide estimates of how many hours it takes on average
to handle a fraud chargeback The average time spent
overall was 18 hours with a median time of 10 hours
to handle a fraud chargeback (total time consumed
for research documentation submission) The largest
merchants reported a median time of 30 minutes per fraud
chargeback Clearly fraud chargeback management is a
significant expense for merchants
ChargebacksmdashOnly Half the Problem How a fraudulent order is handled can have a significant
impact on bottom line profits Fraudulent orders are
presented to the merchant via two main routes as a
chargeback or as a direct request from a consumer
for credit (they claim fraudulent use of their account)
Although chargebacks are the most often cited metric
merchants report that chargebacks actually account for less
than half of all fraud claims This is true for all sizes of
merchants (see chart 20)
In 2007 large ($25M+ online sales) merchants reported
that 57 of their fraud was presented in the form of a
fraud-coded chargeback but in 2008 this dropped back
to 48 Considering the financial impact of both fraud
claim routes (chargebacks and credit issuancereversal)
some merchants encourage direct consumer contact
to address fraud claims and thus avoid the additional
chargeback fees levied by the merchant bankprocessor If
a consumer contacts the merchant first then the decision
is in the merchantrsquos control to either handle the dispute
directly with the consumer or to advise them to initiate a
fraud chargeback process In any event if merchants are
evaluating fraud losses solely on the basis of chargebacks
the actual rate of fraud loss the business is experiencing
may be as much as two times higher due to direct credit
issuancecharge reversal
Overall $500K ndash lt$5Mlt$500K $5M ndash lt$25M $25M+
Fraud Chargeback Re-presentment
Win RateNet Recovery Rate
Annual Online Revenues
Challenged Net Recovery
44AVERAGEWINRATE
46AVERAGEWINRATE
43AVERAGEWINRATE
54AVERAGEWINRATE
32AVERAGEWINRATE
50
28
36
23
52
38
63
35
46
19
10
0
20
30
40
50
60
70
80
90
100
(Net Recovery Rate is expressed as a of all fraud-coded chargebacks)
19
Overall $500K ndash lt$5Mlt$500K $5M ndash lt$25M $25M+
of Fraud Claims
Chargebacks vs Credit Issued by Merchant
Credits IssuedChargebacks
58
42
76
24
57
43
52
48
52
48
n=25
n=14
7
n=27
n=30
n=55
Annual Online Revenue
n=147
10
0
20
30
40
50
60
70
80
90
100
20
19
C Y B E R S O U R C E 1 0 T H A N N U A L O N L I N E F R A U D R E P O R T
19copy2009 CyberSource Corporation All rights reserved
Fraud Rate MetricsWhen monitoring the level and trend of online
fraud loss we focus on three key metrics
1) Overall revenue lost as a percent of total
online sales 2) percent of accepted orders
which turn out to be fraudulent (domestic and
international) and 3) the average value of a
fraudulent order relative to a valid order Fraud
rates vary widely by merchant and depend on a
variety of factors such as online sales volume
type of products or services sold online and
how such productsservices are delivered and
paid for It is important that merchants track
key fraud metrics over time and evaluate their
performance relative to their peer group (both
size and industry) Note this report provides
benchmarks on total fraud rates (chargebacks +
credits issued directly to consumers by merchants)
As such these metrics tend to be higher
than those reported by banks and credit card
associations which generally base reported rates
on chargeback activity only
Depending on which products or services are being sold
online fraud loss risk tolerances and order rejection
rates can vary significantly Merchants selling high
cost goods with relatively low gross margins like most
consumer electronics products tend to err on the side
of rejecting more orders to avoid expensive fraud losses
Merchants who are less subject to fraud attacks can
achieve similar fraud loss rates while rejecting
relatively few orders Over the past few years
as fraud rates have remained relatively stable
we have compiled data on fraud practices and
benchmarks by industry
Direct Revenue Loss Rates
Very large merchants typically use more tools
and have more experience and resources to
manage online fraud so their fraud rates tend
to be lower than the overall rate Revenue loss
measurement includes not only the value of
orders on which fraudulent chargebacks are
received but also the cost of any credits issued
to avoid such chargebacks Figures include both
chargebacks and credits issued directly by the
merchant in response to fraud claims
Fraudulent Order Rate for Accepted Orders
Another key metric is the number of accepted orders that
later turn out to be fraudulent Expressed as a percent of total
orders this metric is typically lower than the revenue loss
percent since the average value of fraudulent orders tends
to be greater than the average value of valid orders which
causes the fraud rate as measured by revenues to be higher
Overall 38 of merchants reported experiencing a fraudulent
order rate of 1 or more in 2008 which was the same
percent reported in 2007
20072008
Average Online Revenue Lost to Payment Fraud
(chargebacks amp fraud-related credits)
Overall $500K ndash lt$5Mlt$500K $5M ndash lt$25M $25M+
Annual Online Revenue
0
12
08
04
02
06
10
14
16
18
14 1
5 16
15
121
3
13
15
14
14
20072008
Average Accepted Orders Resulting in Fraud Losses
Overall $500K ndash lt$5Mlt$500K $5M ndash lt$25M $25M+
Annual Online Revenue
0
12
08
04
02
06
10
14
16
18
16
11
13
12
11
13
11
13
11
13
A fraud chargeback was received on the orders OR a credit was issued directly to a customerwho claims not to have placed an order
21
22
20
C Y B E R S O U R C E 1 0 T H A N N U A L O N L I N E F R A U D R E P O R T
International Orders Carry Higher Risk
Fifty-two percent of merchants surveyed accepted orders
from outside the US amp Canada in 2008 International
sales accounted for an average of 17 of total orders
for these merchants That same group reported that the
actual direct fraud rate on international orders averaged
40 or more than 36 times the overall fraud rate for
domestic online orders Though international markets
represent an attractive opportunity online merchants must
make sure that their fraud detection and management
systems are robust enough to handle the additional risk
involved Merchants who sell online outside of the US
amp Canada report that they reject international orders due
to suspicion of fraud at a rate that is over three and one
half times the US and Canadian average rate of 29
mdash rejecting approximately 1 out of every 9 international
orders received
Average Value of Fraudulent Order Higher than a Valid Order
Historically fraudulent orders tend to have higher values
on average than valid orders In 2008 the median value
of a fraudulent order was $200 compared to $130 median
value reported for valid orders This relationship of higher
fraudulent order values vs valid order value was found for
all merchant size categories as chart 24 shows Since
fraudulent orders tend to be somewhat higher in value than
valid orders merchants will tend to outsort more high value
orders for manual review and verification Large online
merchants reported that the median value of an order
flagged for manual review was $245
Valid vs Fraudulent Order Value
Valid orderFraudulent order
Median used to minimize impact of outliers
Overall $500K ndash lt$5Mlt$500K $5M ndash lt$25M $25M+
Annual Online Revenue
0
$200
$50
$100
$150
$250
$300
$350
$120
$150
$200
$150
$250
$175
$150
$100
$200
$130
24
40
10
05
20
15
25
35
45
30
00
International Fraud Rateover 3x USCanadian rate
11
40
Location of Order Origination
Within USCanadan=326
Outside USCanadan=164
Frau
d R
ate
o
f O
rder
s
23
21
C Y B E R S O U R C E 1 0 T H A N N U A L O N L I N E F R A U D R E P O R T
21copy2009 CyberSource Corporation All rights reserved
Tuning amp Management
Maintaining and Tuning Screening Rules28 of merchants say they have an automated order
screening system in place that allows business managers
to modify decision rules without assistance from internal
IT staff or external parties (up from 16 found in 2006)
The ability to adjust automated order screening systems
quickly helps manage the order review flow tailor rules
to new products and adapt to new fraud trends as they
are encountered Without this ability merchants cannot
easily minimize reject rates review costs or fraud rates
Additionally giving business managers the capability of
adjusting business rules on-the-fly reduces the costs and
burden of IT support
Global Fraud Portals Some online merchants are integrating fraud tools
and strategies via fraud management portals These
portals employ a combination of flexible rules systems
that interact with a portfolio of ldquotruth servicesrdquo around
the globe allowing business managers to set payment
type product type and market-specific screens Case
management systems are being integrated with these
portals with accompanying enhancements to streamline
workflow Global fraud portals typically include hierarchical
management as companies strive to centralize fraud
management across multiple lines of business and
geographies
Merchant Budgets for Fraud Management How much are online merchants spending to mitigate
fraud risk In both 2008 and in 2007 survey results
show that 34 of merchants spend 05 or more of
their online revenues to manage online payment fraud
while 66 spend less than 05 In 2008 across
all merchants the median ratio of fraud management
expense to sales was 022 down from 028 in 2007
although some merchants in high risk categories are
spending significantly more These spending estimates
focus on the cost of managing fraud risk (internal and
external systems and services management development
and review staffs) Direct fraud loss (chargebacks lost
goods and associated shipping costs) as well as the
opportunity cost associated with valid order rejection are
not included here (see chart 25)
Automated
Screening1
Manual
Review2
Accept
Reject3
Fraud Claim
Management4ORDER
RETAINED
REVENUE
Tuning and Management
02ndash lt050ndash lt02 05ndash lt10 10ndash lt40 40+
How Much Merchants Spend
on Fraud Management
(percent of merchants operating at defined expense level)
of Annual Online Revenues Spent to Manage Fraud(staff etc excluding fraud loss)
2007 n=972008 n=108
41 44
6
14
24
22
12 16
16
4
Median2008 = 022
2007 = 028
0
60
40
20
25
title (title)
22
C Y B E R S O U R C E 1 0 T H A N N U A L O N L I N E F R A U D R E P O R T
Budget Allocation For the past three years merchants have consistently
spent just over half their fraud management budgets on
review staff (see chart 26) The remainder is allocated
as follows 25 for third party tools or services and 24
on internally developed tools and systems
Clearly review staff costs are the dominant factor and
only 13 of merchants cite plans to increase review
staffing in 2009 Reducing the need for manual review
and increasing the efficiency and effectiveness of
reviewers is key to growing online business profits and
managing the total cost of online payment fraud One
place to start is by improving the automated detection of
risky orders so as to reduce manual order review volumes
Clearly the continued reliance on manual review we have
seen in the data over the last few years is not an optimal
long term strategy for managing online fraud As budgets
come under increasing pressure merchants will need
to redouble their efforts to automate more of the fraud
management process while keeping valid order conversion
high and fraud loss low
Base Those with 1 or more full-time manual review staff
Average Spending Allocation
for Fraud Management 2008
n=400
3rd Party
Tools
23
24
Internal
Tools amp
System
3rd Party
Tools
25
Order
Review
Staff
51
Planned Staffing Levels
Increase
13
21
Same
81
71
2009
2008
Decrease
6
8
n=238 248
26
23
C Y B E R S O U R C E 1 0 T H A N N U A L O N L I N E F R A U D R E P O R T
23copy2009 CyberSource Corporation All rights reserved
Resources amp Solutions
3 Managed Services
2 Design amp Installation
1 Systems amp Services
PAYMENT SECURITY
Order
Screening
Collection amp
Reconciliation
Global Payment
Acceptance
Processing
Management
L A S E R
BankBankTrans f e rTrans f e r
Direct
Debit
ORDER
bull Onlinebull Call Centerbull IVRbull Kioskbull POSbull ERP
With Performance
Guarantees
To find information on CyberSourcersquos industry-leading risk
management solutions self-paced webinars on decision
management and other whitepapers on electronic payment
management visit our Resource Center at
wwwcybersourcecom For sales assistance phone
1-888-330-2300 or e-mail salescybersourcecom
CyberSource Payment Management Solutions CyberSource offers a comprehensive portfolio of modular
services and tools to help your company manage your entire
payment pipeline to optimize sales results All are available
via one connection to our web-based services
Accept All Popular Payment Types in 190+
Countries
Accept payments worldwide using a merchant account from
your preferred provider or CyberSource worldwide credit
and debit cards regional cards direct debit bank
transfers electronic checks and alternative payment
types such as Bill Me Later and PayPal CyberSource
also provides professional services to help you
integrate payment with front-end and back-office
systems
Risk ManagementOrder Screening
Global Fraud Management Portal with CyberSource Intelligent
Review Technology A hosted rules and case management
system that provides on-demand access to over 150
validation tests and services across all four dimensions of
detection Detectors include multi-merchant transaction
history checks worldwide delivery address and phone
verification device fingerprinting IP geolocation purchase
velocity identity morphing and custom data from your
systems Case management system provides consolidated
data review workflow management and built-in callouts to
validation services to streamline review
Managed Services CyberSource provides client services to
help you analyze design and manage your order screening
and fraud detection processesmdasheverything from screening
strategies and risk threshold optimization analysis
to ongoing monitoring order review and chargeback
managementrecovery Our managed services include
business performance guarantees
Payer Authentication Verified by Visa MasterCard
SecureCode
Processing Management
CyberSource processes your payments in our high
availability datacenters located in the US Europe and
Japan All datacenters are certified PCI-compliant and
include sophisticated processing management logic to help
prevent payment failures and rate downgrades
Collection amp Reconciliation
A full array of online and exportable payment reporting
capability is available to streamline reconciliation activity
Further systems can be installed to automate up to 90
of the tasks associated with payment reconciliation and
chargeback re-presentment
Payment Security
Remove Payment Data From Your Network CyberSource
provides secure storage and hosted payment acceptance
services that let you process without storing or even
transmitting payment data A great way to streamline PCI
compliance and mitigate security risk
Payment System Centralization Our team of experts will help
you consolidate multiple payment systems into a single easy
to manage system Optionally CyberSource will also host
support and manage these systems in our secure datacenters
PCI Planning amp Remediation CyberSource provides PCI
compliance consulting and remediation services to help
remedy PCI issues
Professional Services
CyberSource maintains a team of experienced payment
consultants to assist with payment systems planning
system and process design and implementation and
integration Our client services team is additionally
available to help you monitor tune or fully outsource
portions of your payment operations
C Y B E R S O U R C E 1 0 T H A N N U A L O N L I N E F R A U D R E P O R T
North America
CyberSource Corporation
1295 Charleston Road
Mountain View CA 94043
T 8883302300
T 6509656000
F 6506259145
Email infocybersourcecom
Europe
CyberSource Ltd
The Waterfront
300 Thames Valley Park Drive
Thames Valley Park
Reading RG6 1PT
United Kingdom
T +44 (0) 1189294840
F +44 (0) 8704601931
Email ukcybersourcecom
UK Fraud Report wwwcybersourcecoukukfraudreport
Japan
CyberSource KK (Japan)
3-11-11 Shibuya Shibuya-ku
Tokyo 150-0002 Japan
T +81357747733
F +81357747732
Email mailcybersourcecojp
CyberSource Corporation is a leading provider of
electronic payment risk and security management
solutions CyberSource provides payment management
solutions for electronic payments processed via Web
call center kiosk mobile and POS environments
Services include hosted systems to help you manage
electronic payments as well as professional services
to help design integrate and fully manage parts or all
of your payment operations Over 245000 businesses
worldwide use CyberSource solutions including half
the companies comprising the Dow Jones Industrial
Average and leading Internet brands The company
is headquartered in Mountain View California and
has sales and service offices in Japan the United
Kingdom and other locations in the United States
For More Information
bull Call 18883302300
bull Email infocybersourcecom
bull Visit wwwcybersourcecom
Get Tailored Views of Risk Management
Pipelinetrade MetricsTo get a view crafted for your companyrsquos size and industry
please contact CyberSource at 18883302300 or online at
wwwcybersourcecomcontact_us
For additional information whitepapers and webinars
or sales assistance
bull Contact CyberSource 18883302300 or
wwwcybersourcecomcontact_us
bull Risk Management Solutions visit wwwcybersourcecom
products_and_servicesrisk_management
bull Global Payment amp Security Solutions
visit wwwcybersourcecomproducts_and_services
global_payment_services
About CyberSource
C Y B E R S O U R C E 1 0 T H A N N U A L O N L I N E F R A U D R E P O R T

16
C Y B E R S O U R C E 1 0 T H A N N U A L O N L I N E F R A U D R E P O R T
order rejection rates of 2 or less while maintaining
fraudulent order rates at or even below the average for
their segment
International Orders RiskierMerchants consistently report a much higher level of
order rejection on international orders due to suspicion
of payment fraud In 2008 merchants report their
rejection rate on these orders is over three and one half
times that of domestic orders as shown in chart 17
The actual fraud rate experienced on international orders
supports this cautious approach as merchants report the
fraud risk on international orders is also over three and
one half times that of domestic orders
Order Rejection Trends
of total USCanadian orders rejected of international orders rejected
Historically international order rejection rates
average 32x higher than USCanadian rates
2005 20072006 2008
6
4
2
1
3
5
7
8
9
12
11
10
13
14
42
11
11
29
13
41
12
39
0
15
17
17
C Y B E R S O U R C E 1 0 T H A N N U A L O N L I N E F R A U D R E P O R T
17copy2009 CyberSource Corporation All rights reserved
Fighting ChargebacksThis yearrsquos survey once again examined online merchantsrsquo
practices associated with reviewing and contesting
chargebacks (ldquore-presentmentrdquo) Over the past four years
the share of fraud-coded chargebacks merchants contest
has averaged 43 to 53 with the 2008 average at
50 Medium and large merchants report contesting 52
and 46 respectively of their fraud-coded chargebacks
in 2008 However when we look at the distribution of
merchantsrsquo answers to this question we find that over one
third of merchants are disputing 90 or more of their
fraud chagebacks while three out of ten merchants are
disputing less than 10 of their fraud chargebacks (see
chart 18)
Merchants report that they win on average 44 of the
chargebacks they dispute which is very similar to the 42
win rate reported in 2006 and 40 in 2007 Simply using
the average percent of chargebacks that are disputed (50)
times the average win rate of 44 results in a net recovery
rate of 22 (meaning 22 of all fraud-coded chargebacks
are recovered) However given the wide disparity in the
chargeback re-presentment rate when these are calculated
on a merchant-by-merchant basis and then averaged the
re-presentment win rate rises to 28 (see chart 19 on
next page) the same recovery rate that was found in 2007
Therefore disputing most fraud chargebacks and having
an efficient re-presentment process can help enhance
profitability and reduce fraud loss
Stage 4 Fraud Claim Management
Automated
Screening1
Manual
Review2
Accept
Reject3
Fraud Claim
Management4ORDER
RETAINED
REVENUE
Tuning and Management
Average Total Fraud-Coded
Chargebacks Re-presented of Merchants Reporting
this Re-presentment Rate
480 ndash 89
790 ndash 99
100
370 ndash 79
460 ndash 69
450 ndash 59
540 ndash 49
130 ndash 39
520 ndash 29
810 ndash 19
1 ndash 9
0
C
harg
ebac
ks R
e-pr
esen
ted
Overall $500K ndash lt$5Mlt$500K $5M ndash lt$25M $25M+
Annual Online Revenue
2006 n=1612007 n=1002008 n=120
50
53
47
36
38
48 52
46
5863
56
56
46
45
53
15
15
28
18
18
C Y B E R S O U R C E 1 0 T H A N N U A L O N L I N E F R A U D R E P O R T
Chargeback Management ToolsOf course disputing chargebacks is not an easy or cost-
free process Merchants must manage and organize all
order delivery and payment information to successfully
dispute fraudulent orders with financial institutions
Merchants are beginning to adopt automated systems
for handling this aspect of the pipeline One out of five
merchants reported using chargeback management tools
in 2008 and 37 of large merchants reported using
these tools In our 2006 survey we asked merchants to
provide estimates of how many hours it takes on average
to handle a fraud chargeback The average time spent
overall was 18 hours with a median time of 10 hours
to handle a fraud chargeback (total time consumed
for research documentation submission) The largest
merchants reported a median time of 30 minutes per fraud
chargeback Clearly fraud chargeback management is a
significant expense for merchants
ChargebacksmdashOnly Half the Problem How a fraudulent order is handled can have a significant
impact on bottom line profits Fraudulent orders are
presented to the merchant via two main routes as a
chargeback or as a direct request from a consumer
for credit (they claim fraudulent use of their account)
Although chargebacks are the most often cited metric
merchants report that chargebacks actually account for less
than half of all fraud claims This is true for all sizes of
merchants (see chart 20)
In 2007 large ($25M+ online sales) merchants reported
that 57 of their fraud was presented in the form of a
fraud-coded chargeback but in 2008 this dropped back
to 48 Considering the financial impact of both fraud
claim routes (chargebacks and credit issuancereversal)
some merchants encourage direct consumer contact
to address fraud claims and thus avoid the additional
chargeback fees levied by the merchant bankprocessor If
a consumer contacts the merchant first then the decision
is in the merchantrsquos control to either handle the dispute
directly with the consumer or to advise them to initiate a
fraud chargeback process In any event if merchants are
evaluating fraud losses solely on the basis of chargebacks
the actual rate of fraud loss the business is experiencing
may be as much as two times higher due to direct credit
issuancecharge reversal
Overall $500K ndash lt$5Mlt$500K $5M ndash lt$25M $25M+
Fraud Chargeback Re-presentment
Win RateNet Recovery Rate
Annual Online Revenues
Challenged Net Recovery
44AVERAGEWINRATE
46AVERAGEWINRATE
43AVERAGEWINRATE
54AVERAGEWINRATE
32AVERAGEWINRATE
50
28
36
23
52
38
63
35
46
19
10
0
20
30
40
50
60
70
80
90
100
(Net Recovery Rate is expressed as a of all fraud-coded chargebacks)
19
Overall $500K ndash lt$5Mlt$500K $5M ndash lt$25M $25M+
of Fraud Claims
Chargebacks vs Credit Issued by Merchant
Credits IssuedChargebacks
58
42
76
24
57
43
52
48
52
48
n=25
n=14
7
n=27
n=30
n=55
Annual Online Revenue
n=147
10
0
20
30
40
50
60
70
80
90
100
20
19
C Y B E R S O U R C E 1 0 T H A N N U A L O N L I N E F R A U D R E P O R T
19copy2009 CyberSource Corporation All rights reserved
Fraud Rate MetricsWhen monitoring the level and trend of online
fraud loss we focus on three key metrics
1) Overall revenue lost as a percent of total
online sales 2) percent of accepted orders
which turn out to be fraudulent (domestic and
international) and 3) the average value of a
fraudulent order relative to a valid order Fraud
rates vary widely by merchant and depend on a
variety of factors such as online sales volume
type of products or services sold online and
how such productsservices are delivered and
paid for It is important that merchants track
key fraud metrics over time and evaluate their
performance relative to their peer group (both
size and industry) Note this report provides
benchmarks on total fraud rates (chargebacks +
credits issued directly to consumers by merchants)
As such these metrics tend to be higher
than those reported by banks and credit card
associations which generally base reported rates
on chargeback activity only
Depending on which products or services are being sold
online fraud loss risk tolerances and order rejection
rates can vary significantly Merchants selling high
cost goods with relatively low gross margins like most
consumer electronics products tend to err on the side
of rejecting more orders to avoid expensive fraud losses
Merchants who are less subject to fraud attacks can
achieve similar fraud loss rates while rejecting
relatively few orders Over the past few years
as fraud rates have remained relatively stable
we have compiled data on fraud practices and
benchmarks by industry
Direct Revenue Loss Rates
Very large merchants typically use more tools
and have more experience and resources to
manage online fraud so their fraud rates tend
to be lower than the overall rate Revenue loss
measurement includes not only the value of
orders on which fraudulent chargebacks are
received but also the cost of any credits issued
to avoid such chargebacks Figures include both
chargebacks and credits issued directly by the
merchant in response to fraud claims
Fraudulent Order Rate for Accepted Orders
Another key metric is the number of accepted orders that
later turn out to be fraudulent Expressed as a percent of total
orders this metric is typically lower than the revenue loss
percent since the average value of fraudulent orders tends
to be greater than the average value of valid orders which
causes the fraud rate as measured by revenues to be higher
Overall 38 of merchants reported experiencing a fraudulent
order rate of 1 or more in 2008 which was the same
percent reported in 2007
20072008
Average Online Revenue Lost to Payment Fraud
(chargebacks amp fraud-related credits)
Overall $500K ndash lt$5Mlt$500K $5M ndash lt$25M $25M+
Annual Online Revenue
0
12
08
04
02
06
10
14
16
18
14 1
5 16
15
121
3
13
15
14
14
20072008
Average Accepted Orders Resulting in Fraud Losses
Overall $500K ndash lt$5Mlt$500K $5M ndash lt$25M $25M+
Annual Online Revenue
0
12
08
04
02
06
10
14
16
18
16
11
13
12
11
13
11
13
11
13
A fraud chargeback was received on the orders OR a credit was issued directly to a customerwho claims not to have placed an order
21
22
20
C Y B E R S O U R C E 1 0 T H A N N U A L O N L I N E F R A U D R E P O R T
International Orders Carry Higher Risk
Fifty-two percent of merchants surveyed accepted orders
from outside the US amp Canada in 2008 International
sales accounted for an average of 17 of total orders
for these merchants That same group reported that the
actual direct fraud rate on international orders averaged
40 or more than 36 times the overall fraud rate for
domestic online orders Though international markets
represent an attractive opportunity online merchants must
make sure that their fraud detection and management
systems are robust enough to handle the additional risk
involved Merchants who sell online outside of the US
amp Canada report that they reject international orders due
to suspicion of fraud at a rate that is over three and one
half times the US and Canadian average rate of 29
mdash rejecting approximately 1 out of every 9 international
orders received
Average Value of Fraudulent Order Higher than a Valid Order
Historically fraudulent orders tend to have higher values
on average than valid orders In 2008 the median value
of a fraudulent order was $200 compared to $130 median
value reported for valid orders This relationship of higher
fraudulent order values vs valid order value was found for
all merchant size categories as chart 24 shows Since
fraudulent orders tend to be somewhat higher in value than
valid orders merchants will tend to outsort more high value
orders for manual review and verification Large online
merchants reported that the median value of an order
flagged for manual review was $245
Valid vs Fraudulent Order Value
Valid orderFraudulent order
Median used to minimize impact of outliers
Overall $500K ndash lt$5Mlt$500K $5M ndash lt$25M $25M+
Annual Online Revenue
0
$200
$50
$100
$150
$250
$300
$350
$120
$150
$200
$150
$250
$175
$150
$100
$200
$130
24
40
10
05
20
15
25
35
45
30
00
International Fraud Rateover 3x USCanadian rate
11
40
Location of Order Origination
Within USCanadan=326
Outside USCanadan=164
Frau
d R
ate
o
f O
rder
s
23
21
C Y B E R S O U R C E 1 0 T H A N N U A L O N L I N E F R A U D R E P O R T
21copy2009 CyberSource Corporation All rights reserved
Tuning amp Management
Maintaining and Tuning Screening Rules28 of merchants say they have an automated order
screening system in place that allows business managers
to modify decision rules without assistance from internal
IT staff or external parties (up from 16 found in 2006)
The ability to adjust automated order screening systems
quickly helps manage the order review flow tailor rules
to new products and adapt to new fraud trends as they
are encountered Without this ability merchants cannot
easily minimize reject rates review costs or fraud rates
Additionally giving business managers the capability of
adjusting business rules on-the-fly reduces the costs and
burden of IT support
Global Fraud Portals Some online merchants are integrating fraud tools
and strategies via fraud management portals These
portals employ a combination of flexible rules systems
that interact with a portfolio of ldquotruth servicesrdquo around
the globe allowing business managers to set payment
type product type and market-specific screens Case
management systems are being integrated with these
portals with accompanying enhancements to streamline
workflow Global fraud portals typically include hierarchical
management as companies strive to centralize fraud
management across multiple lines of business and
geographies
Merchant Budgets for Fraud Management How much are online merchants spending to mitigate
fraud risk In both 2008 and in 2007 survey results
show that 34 of merchants spend 05 or more of
their online revenues to manage online payment fraud
while 66 spend less than 05 In 2008 across
all merchants the median ratio of fraud management
expense to sales was 022 down from 028 in 2007
although some merchants in high risk categories are
spending significantly more These spending estimates
focus on the cost of managing fraud risk (internal and
external systems and services management development
and review staffs) Direct fraud loss (chargebacks lost
goods and associated shipping costs) as well as the
opportunity cost associated with valid order rejection are
not included here (see chart 25)
Automated
Screening1
Manual
Review2
Accept
Reject3
Fraud Claim
Management4ORDER
RETAINED
REVENUE
Tuning and Management
02ndash lt050ndash lt02 05ndash lt10 10ndash lt40 40+
How Much Merchants Spend
on Fraud Management
(percent of merchants operating at defined expense level)
of Annual Online Revenues Spent to Manage Fraud(staff etc excluding fraud loss)
2007 n=972008 n=108
41 44
6
14
24
22
12 16
16
4
Median2008 = 022
2007 = 028
0
60
40
20
25
title (title)
22
C Y B E R S O U R C E 1 0 T H A N N U A L O N L I N E F R A U D R E P O R T
Budget Allocation For the past three years merchants have consistently
spent just over half their fraud management budgets on
review staff (see chart 26) The remainder is allocated
as follows 25 for third party tools or services and 24
on internally developed tools and systems
Clearly review staff costs are the dominant factor and
only 13 of merchants cite plans to increase review
staffing in 2009 Reducing the need for manual review
and increasing the efficiency and effectiveness of
reviewers is key to growing online business profits and
managing the total cost of online payment fraud One
place to start is by improving the automated detection of
risky orders so as to reduce manual order review volumes
Clearly the continued reliance on manual review we have
seen in the data over the last few years is not an optimal
long term strategy for managing online fraud As budgets
come under increasing pressure merchants will need
to redouble their efforts to automate more of the fraud
management process while keeping valid order conversion
high and fraud loss low
Base Those with 1 or more full-time manual review staff
Average Spending Allocation
for Fraud Management 2008
n=400
3rd Party
Tools
23
24
Internal
Tools amp
System
3rd Party
Tools
25
Order
Review
Staff
51
Planned Staffing Levels
Increase
13
21
Same
81
71
2009
2008
Decrease
6
8
n=238 248
26
23
C Y B E R S O U R C E 1 0 T H A N N U A L O N L I N E F R A U D R E P O R T
23copy2009 CyberSource Corporation All rights reserved
Resources amp Solutions
3 Managed Services
2 Design amp Installation
1 Systems amp Services
PAYMENT SECURITY
Order
Screening
Collection amp
Reconciliation
Global Payment
Acceptance
Processing
Management
L A S E R
BankBankTrans f e rTrans f e r
Direct
Debit
ORDER
bull Onlinebull Call Centerbull IVRbull Kioskbull POSbull ERP
With Performance
Guarantees
To find information on CyberSourcersquos industry-leading risk
management solutions self-paced webinars on decision
management and other whitepapers on electronic payment
management visit our Resource Center at
wwwcybersourcecom For sales assistance phone
1-888-330-2300 or e-mail salescybersourcecom
CyberSource Payment Management Solutions CyberSource offers a comprehensive portfolio of modular
services and tools to help your company manage your entire
payment pipeline to optimize sales results All are available
via one connection to our web-based services
Accept All Popular Payment Types in 190+
Countries
Accept payments worldwide using a merchant account from
your preferred provider or CyberSource worldwide credit
and debit cards regional cards direct debit bank
transfers electronic checks and alternative payment
types such as Bill Me Later and PayPal CyberSource
also provides professional services to help you
integrate payment with front-end and back-office
systems
Risk ManagementOrder Screening
Global Fraud Management Portal with CyberSource Intelligent
Review Technology A hosted rules and case management
system that provides on-demand access to over 150
validation tests and services across all four dimensions of
detection Detectors include multi-merchant transaction
history checks worldwide delivery address and phone
verification device fingerprinting IP geolocation purchase
velocity identity morphing and custom data from your
systems Case management system provides consolidated
data review workflow management and built-in callouts to
validation services to streamline review
Managed Services CyberSource provides client services to
help you analyze design and manage your order screening
and fraud detection processesmdasheverything from screening
strategies and risk threshold optimization analysis
to ongoing monitoring order review and chargeback
managementrecovery Our managed services include
business performance guarantees
Payer Authentication Verified by Visa MasterCard
SecureCode
Processing Management
CyberSource processes your payments in our high
availability datacenters located in the US Europe and
Japan All datacenters are certified PCI-compliant and
include sophisticated processing management logic to help
prevent payment failures and rate downgrades
Collection amp Reconciliation
A full array of online and exportable payment reporting
capability is available to streamline reconciliation activity
Further systems can be installed to automate up to 90
of the tasks associated with payment reconciliation and
chargeback re-presentment
Payment Security
Remove Payment Data From Your Network CyberSource
provides secure storage and hosted payment acceptance
services that let you process without storing or even
transmitting payment data A great way to streamline PCI
compliance and mitigate security risk
Payment System Centralization Our team of experts will help
you consolidate multiple payment systems into a single easy
to manage system Optionally CyberSource will also host
support and manage these systems in our secure datacenters
PCI Planning amp Remediation CyberSource provides PCI
compliance consulting and remediation services to help
remedy PCI issues
Professional Services
CyberSource maintains a team of experienced payment
consultants to assist with payment systems planning
system and process design and implementation and
integration Our client services team is additionally
available to help you monitor tune or fully outsource
portions of your payment operations
C Y B E R S O U R C E 1 0 T H A N N U A L O N L I N E F R A U D R E P O R T
North America
CyberSource Corporation
1295 Charleston Road
Mountain View CA 94043
T 8883302300
T 6509656000
F 6506259145
Email infocybersourcecom
Europe
CyberSource Ltd
The Waterfront
300 Thames Valley Park Drive
Thames Valley Park
Reading RG6 1PT
United Kingdom
T +44 (0) 1189294840
F +44 (0) 8704601931
Email ukcybersourcecom
UK Fraud Report wwwcybersourcecoukukfraudreport
Japan
CyberSource KK (Japan)
3-11-11 Shibuya Shibuya-ku
Tokyo 150-0002 Japan
T +81357747733
F +81357747732
Email mailcybersourcecojp
CyberSource Corporation is a leading provider of
electronic payment risk and security management
solutions CyberSource provides payment management
solutions for electronic payments processed via Web
call center kiosk mobile and POS environments
Services include hosted systems to help you manage
electronic payments as well as professional services
to help design integrate and fully manage parts or all
of your payment operations Over 245000 businesses
worldwide use CyberSource solutions including half
the companies comprising the Dow Jones Industrial
Average and leading Internet brands The company
is headquartered in Mountain View California and
has sales and service offices in Japan the United
Kingdom and other locations in the United States
For More Information
bull Call 18883302300
bull Email infocybersourcecom
bull Visit wwwcybersourcecom
Get Tailored Views of Risk Management
Pipelinetrade MetricsTo get a view crafted for your companyrsquos size and industry
please contact CyberSource at 18883302300 or online at
wwwcybersourcecomcontact_us
For additional information whitepapers and webinars
or sales assistance
bull Contact CyberSource 18883302300 or
wwwcybersourcecomcontact_us
bull Risk Management Solutions visit wwwcybersourcecom
products_and_servicesrisk_management
bull Global Payment amp Security Solutions
visit wwwcybersourcecomproducts_and_services
global_payment_services
About CyberSource
C Y B E R S O U R C E 1 0 T H A N N U A L O N L I N E F R A U D R E P O R T

18
C Y B E R S O U R C E 1 0 T H A N N U A L O N L I N E F R A U D R E P O R T
Chargeback Management ToolsOf course disputing chargebacks is not an easy or cost-
free process Merchants must manage and organize all
order delivery and payment information to successfully
dispute fraudulent orders with financial institutions
Merchants are beginning to adopt automated systems
for handling this aspect of the pipeline One out of five
merchants reported using chargeback management tools
in 2008 and 37 of large merchants reported using
these tools In our 2006 survey we asked merchants to
provide estimates of how many hours it takes on average
to handle a fraud chargeback The average time spent
overall was 18 hours with a median time of 10 hours
to handle a fraud chargeback (total time consumed
for research documentation submission) The largest
merchants reported a median time of 30 minutes per fraud
chargeback Clearly fraud chargeback management is a
significant expense for merchants
ChargebacksmdashOnly Half the Problem How a fraudulent order is handled can have a significant
impact on bottom line profits Fraudulent orders are
presented to the merchant via two main routes as a
chargeback or as a direct request from a consumer
for credit (they claim fraudulent use of their account)
Although chargebacks are the most often cited metric
merchants report that chargebacks actually account for less
than half of all fraud claims This is true for all sizes of
merchants (see chart 20)
In 2007 large ($25M+ online sales) merchants reported
that 57 of their fraud was presented in the form of a
fraud-coded chargeback but in 2008 this dropped back
to 48 Considering the financial impact of both fraud
claim routes (chargebacks and credit issuancereversal)
some merchants encourage direct consumer contact
to address fraud claims and thus avoid the additional
chargeback fees levied by the merchant bankprocessor If
a consumer contacts the merchant first then the decision
is in the merchantrsquos control to either handle the dispute
directly with the consumer or to advise them to initiate a
fraud chargeback process In any event if merchants are
evaluating fraud losses solely on the basis of chargebacks
the actual rate of fraud loss the business is experiencing
may be as much as two times higher due to direct credit
issuancecharge reversal
Overall $500K ndash lt$5Mlt$500K $5M ndash lt$25M $25M+
Fraud Chargeback Re-presentment
Win RateNet Recovery Rate
Annual Online Revenues
Challenged Net Recovery
44AVERAGEWINRATE
46AVERAGEWINRATE
43AVERAGEWINRATE
54AVERAGEWINRATE
32AVERAGEWINRATE
50
28
36
23
52
38
63
35
46
19
10
0
20
30
40
50
60
70
80
90
100
(Net Recovery Rate is expressed as a of all fraud-coded chargebacks)
19
Overall $500K ndash lt$5Mlt$500K $5M ndash lt$25M $25M+
of Fraud Claims
Chargebacks vs Credit Issued by Merchant
Credits IssuedChargebacks
58
42
76
24
57
43
52
48
52
48
n=25
n=14
7
n=27
n=30
n=55
Annual Online Revenue
n=147
10
0
20
30
40
50
60
70
80
90
100
20
19
C Y B E R S O U R C E 1 0 T H A N N U A L O N L I N E F R A U D R E P O R T
19copy2009 CyberSource Corporation All rights reserved
Fraud Rate MetricsWhen monitoring the level and trend of online
fraud loss we focus on three key metrics
1) Overall revenue lost as a percent of total
online sales 2) percent of accepted orders
which turn out to be fraudulent (domestic and
international) and 3) the average value of a
fraudulent order relative to a valid order Fraud
rates vary widely by merchant and depend on a
variety of factors such as online sales volume
type of products or services sold online and
how such productsservices are delivered and
paid for It is important that merchants track
key fraud metrics over time and evaluate their
performance relative to their peer group (both
size and industry) Note this report provides
benchmarks on total fraud rates (chargebacks +
credits issued directly to consumers by merchants)
As such these metrics tend to be higher
than those reported by banks and credit card
associations which generally base reported rates
on chargeback activity only
Depending on which products or services are being sold
online fraud loss risk tolerances and order rejection
rates can vary significantly Merchants selling high
cost goods with relatively low gross margins like most
consumer electronics products tend to err on the side
of rejecting more orders to avoid expensive fraud losses
Merchants who are less subject to fraud attacks can
achieve similar fraud loss rates while rejecting
relatively few orders Over the past few years
as fraud rates have remained relatively stable
we have compiled data on fraud practices and
benchmarks by industry
Direct Revenue Loss Rates
Very large merchants typically use more tools
and have more experience and resources to
manage online fraud so their fraud rates tend
to be lower than the overall rate Revenue loss
measurement includes not only the value of
orders on which fraudulent chargebacks are
received but also the cost of any credits issued
to avoid such chargebacks Figures include both
chargebacks and credits issued directly by the
merchant in response to fraud claims
Fraudulent Order Rate for Accepted Orders
Another key metric is the number of accepted orders that
later turn out to be fraudulent Expressed as a percent of total
orders this metric is typically lower than the revenue loss
percent since the average value of fraudulent orders tends
to be greater than the average value of valid orders which
causes the fraud rate as measured by revenues to be higher
Overall 38 of merchants reported experiencing a fraudulent
order rate of 1 or more in 2008 which was the same
percent reported in 2007
20072008
Average Online Revenue Lost to Payment Fraud
(chargebacks amp fraud-related credits)
Overall $500K ndash lt$5Mlt$500K $5M ndash lt$25M $25M+
Annual Online Revenue
0
12
08
04
02
06
10
14
16
18
14 1
5 16
15
121
3
13
15
14
14
20072008
Average Accepted Orders Resulting in Fraud Losses
Overall $500K ndash lt$5Mlt$500K $5M ndash lt$25M $25M+
Annual Online Revenue
0
12
08
04
02
06
10
14
16
18
16
11
13
12
11
13
11
13
11
13
A fraud chargeback was received on the orders OR a credit was issued directly to a customerwho claims not to have placed an order
21
22
20
C Y B E R S O U R C E 1 0 T H A N N U A L O N L I N E F R A U D R E P O R T
International Orders Carry Higher Risk
Fifty-two percent of merchants surveyed accepted orders
from outside the US amp Canada in 2008 International
sales accounted for an average of 17 of total orders
for these merchants That same group reported that the
actual direct fraud rate on international orders averaged
40 or more than 36 times the overall fraud rate for
domestic online orders Though international markets
represent an attractive opportunity online merchants must
make sure that their fraud detection and management
systems are robust enough to handle the additional risk
involved Merchants who sell online outside of the US
amp Canada report that they reject international orders due
to suspicion of fraud at a rate that is over three and one
half times the US and Canadian average rate of 29
mdash rejecting approximately 1 out of every 9 international
orders received
Average Value of Fraudulent Order Higher than a Valid Order
Historically fraudulent orders tend to have higher values
on average than valid orders In 2008 the median value
of a fraudulent order was $200 compared to $130 median
value reported for valid orders This relationship of higher
fraudulent order values vs valid order value was found for
all merchant size categories as chart 24 shows Since
fraudulent orders tend to be somewhat higher in value than
valid orders merchants will tend to outsort more high value
orders for manual review and verification Large online
merchants reported that the median value of an order
flagged for manual review was $245
Valid vs Fraudulent Order Value
Valid orderFraudulent order
Median used to minimize impact of outliers
Overall $500K ndash lt$5Mlt$500K $5M ndash lt$25M $25M+
Annual Online Revenue
0
$200
$50
$100
$150
$250
$300
$350
$120
$150
$200
$150
$250
$175
$150
$100
$200
$130
24
40
10
05
20
15
25
35
45
30
00
International Fraud Rateover 3x USCanadian rate
11
40
Location of Order Origination
Within USCanadan=326
Outside USCanadan=164
Frau
d R
ate
o
f O
rder
s
23
21
C Y B E R S O U R C E 1 0 T H A N N U A L O N L I N E F R A U D R E P O R T
21copy2009 CyberSource Corporation All rights reserved
Tuning amp Management
Maintaining and Tuning Screening Rules28 of merchants say they have an automated order
screening system in place that allows business managers
to modify decision rules without assistance from internal
IT staff or external parties (up from 16 found in 2006)
The ability to adjust automated order screening systems
quickly helps manage the order review flow tailor rules
to new products and adapt to new fraud trends as they
are encountered Without this ability merchants cannot
easily minimize reject rates review costs or fraud rates
Additionally giving business managers the capability of
adjusting business rules on-the-fly reduces the costs and
burden of IT support
Global Fraud Portals Some online merchants are integrating fraud tools
and strategies via fraud management portals These
portals employ a combination of flexible rules systems
that interact with a portfolio of ldquotruth servicesrdquo around
the globe allowing business managers to set payment
type product type and market-specific screens Case
management systems are being integrated with these
portals with accompanying enhancements to streamline
workflow Global fraud portals typically include hierarchical
management as companies strive to centralize fraud
management across multiple lines of business and
geographies
Merchant Budgets for Fraud Management How much are online merchants spending to mitigate
fraud risk In both 2008 and in 2007 survey results
show that 34 of merchants spend 05 or more of
their online revenues to manage online payment fraud
while 66 spend less than 05 In 2008 across
all merchants the median ratio of fraud management
expense to sales was 022 down from 028 in 2007
although some merchants in high risk categories are
spending significantly more These spending estimates
focus on the cost of managing fraud risk (internal and
external systems and services management development
and review staffs) Direct fraud loss (chargebacks lost
goods and associated shipping costs) as well as the
opportunity cost associated with valid order rejection are
not included here (see chart 25)
Automated
Screening1
Manual
Review2
Accept
Reject3
Fraud Claim
Management4ORDER
RETAINED
REVENUE
Tuning and Management
02ndash lt050ndash lt02 05ndash lt10 10ndash lt40 40+
How Much Merchants Spend
on Fraud Management
(percent of merchants operating at defined expense level)
of Annual Online Revenues Spent to Manage Fraud(staff etc excluding fraud loss)
2007 n=972008 n=108
41 44
6
14
24
22
12 16
16
4
Median2008 = 022
2007 = 028
0
60
40
20
25
title (title)
22
C Y B E R S O U R C E 1 0 T H A N N U A L O N L I N E F R A U D R E P O R T
Budget Allocation For the past three years merchants have consistently
spent just over half their fraud management budgets on
review staff (see chart 26) The remainder is allocated
as follows 25 for third party tools or services and 24
on internally developed tools and systems
Clearly review staff costs are the dominant factor and
only 13 of merchants cite plans to increase review
staffing in 2009 Reducing the need for manual review
and increasing the efficiency and effectiveness of
reviewers is key to growing online business profits and
managing the total cost of online payment fraud One
place to start is by improving the automated detection of
risky orders so as to reduce manual order review volumes
Clearly the continued reliance on manual review we have
seen in the data over the last few years is not an optimal
long term strategy for managing online fraud As budgets
come under increasing pressure merchants will need
to redouble their efforts to automate more of the fraud
management process while keeping valid order conversion
high and fraud loss low
Base Those with 1 or more full-time manual review staff
Average Spending Allocation
for Fraud Management 2008
n=400
3rd Party
Tools
23
24
Internal
Tools amp
System
3rd Party
Tools
25
Order
Review
Staff
51
Planned Staffing Levels
Increase
13
21
Same
81
71
2009
2008
Decrease
6
8
n=238 248
26
23
C Y B E R S O U R C E 1 0 T H A N N U A L O N L I N E F R A U D R E P O R T
23copy2009 CyberSource Corporation All rights reserved
Resources amp Solutions
3 Managed Services
2 Design amp Installation
1 Systems amp Services
PAYMENT SECURITY
Order
Screening
Collection amp
Reconciliation
Global Payment
Acceptance
Processing
Management
L A S E R
BankBankTrans f e rTrans f e r
Direct
Debit
ORDER
bull Onlinebull Call Centerbull IVRbull Kioskbull POSbull ERP
With Performance
Guarantees
To find information on CyberSourcersquos industry-leading risk
management solutions self-paced webinars on decision
management and other whitepapers on electronic payment
management visit our Resource Center at
wwwcybersourcecom For sales assistance phone
1-888-330-2300 or e-mail salescybersourcecom
CyberSource Payment Management Solutions CyberSource offers a comprehensive portfolio of modular
services and tools to help your company manage your entire
payment pipeline to optimize sales results All are available
via one connection to our web-based services
Accept All Popular Payment Types in 190+
Countries
Accept payments worldwide using a merchant account from
your preferred provider or CyberSource worldwide credit
and debit cards regional cards direct debit bank
transfers electronic checks and alternative payment
types such as Bill Me Later and PayPal CyberSource
also provides professional services to help you
integrate payment with front-end and back-office
systems
Risk ManagementOrder Screening
Global Fraud Management Portal with CyberSource Intelligent
Review Technology A hosted rules and case management
system that provides on-demand access to over 150
validation tests and services across all four dimensions of
detection Detectors include multi-merchant transaction
history checks worldwide delivery address and phone
verification device fingerprinting IP geolocation purchase
velocity identity morphing and custom data from your
systems Case management system provides consolidated
data review workflow management and built-in callouts to
validation services to streamline review
Managed Services CyberSource provides client services to
help you analyze design and manage your order screening
and fraud detection processesmdasheverything from screening
strategies and risk threshold optimization analysis
to ongoing monitoring order review and chargeback
managementrecovery Our managed services include
business performance guarantees
Payer Authentication Verified by Visa MasterCard
SecureCode
Processing Management
CyberSource processes your payments in our high
availability datacenters located in the US Europe and
Japan All datacenters are certified PCI-compliant and
include sophisticated processing management logic to help
prevent payment failures and rate downgrades
Collection amp Reconciliation
A full array of online and exportable payment reporting
capability is available to streamline reconciliation activity
Further systems can be installed to automate up to 90
of the tasks associated with payment reconciliation and
chargeback re-presentment
Payment Security
Remove Payment Data From Your Network CyberSource
provides secure storage and hosted payment acceptance
services that let you process without storing or even
transmitting payment data A great way to streamline PCI
compliance and mitigate security risk
Payment System Centralization Our team of experts will help
you consolidate multiple payment systems into a single easy
to manage system Optionally CyberSource will also host
support and manage these systems in our secure datacenters
PCI Planning amp Remediation CyberSource provides PCI
compliance consulting and remediation services to help
remedy PCI issues
Professional Services
CyberSource maintains a team of experienced payment
consultants to assist with payment systems planning
system and process design and implementation and
integration Our client services team is additionally
available to help you monitor tune or fully outsource
portions of your payment operations
C Y B E R S O U R C E 1 0 T H A N N U A L O N L I N E F R A U D R E P O R T
North America
CyberSource Corporation
1295 Charleston Road
Mountain View CA 94043
T 8883302300
T 6509656000
F 6506259145
Email infocybersourcecom
Europe
CyberSource Ltd
The Waterfront
300 Thames Valley Park Drive
Thames Valley Park
Reading RG6 1PT
United Kingdom
T +44 (0) 1189294840
F +44 (0) 8704601931
Email ukcybersourcecom
UK Fraud Report wwwcybersourcecoukukfraudreport
Japan
CyberSource KK (Japan)
3-11-11 Shibuya Shibuya-ku
Tokyo 150-0002 Japan
T +81357747733
F +81357747732
Email mailcybersourcecojp
CyberSource Corporation is a leading provider of
electronic payment risk and security management
solutions CyberSource provides payment management
solutions for electronic payments processed via Web
call center kiosk mobile and POS environments
Services include hosted systems to help you manage
electronic payments as well as professional services
to help design integrate and fully manage parts or all
of your payment operations Over 245000 businesses
worldwide use CyberSource solutions including half
the companies comprising the Dow Jones Industrial
Average and leading Internet brands The company
is headquartered in Mountain View California and
has sales and service offices in Japan the United
Kingdom and other locations in the United States
For More Information
bull Call 18883302300
bull Email infocybersourcecom
bull Visit wwwcybersourcecom
Get Tailored Views of Risk Management
Pipelinetrade MetricsTo get a view crafted for your companyrsquos size and industry
please contact CyberSource at 18883302300 or online at
wwwcybersourcecomcontact_us
For additional information whitepapers and webinars
or sales assistance
bull Contact CyberSource 18883302300 or
wwwcybersourcecomcontact_us
bull Risk Management Solutions visit wwwcybersourcecom
products_and_servicesrisk_management
bull Global Payment amp Security Solutions
visit wwwcybersourcecomproducts_and_services
global_payment_services
About CyberSource
C Y B E R S O U R C E 1 0 T H A N N U A L O N L I N E F R A U D R E P O R T

20
C Y B E R S O U R C E 1 0 T H A N N U A L O N L I N E F R A U D R E P O R T
International Orders Carry Higher Risk
Fifty-two percent of merchants surveyed accepted orders
from outside the US amp Canada in 2008 International
sales accounted for an average of 17 of total orders
for these merchants That same group reported that the
actual direct fraud rate on international orders averaged
40 or more than 36 times the overall fraud rate for
domestic online orders Though international markets
represent an attractive opportunity online merchants must
make sure that their fraud detection and management
systems are robust enough to handle the additional risk
involved Merchants who sell online outside of the US
amp Canada report that they reject international orders due
to suspicion of fraud at a rate that is over three and one
half times the US and Canadian average rate of 29
mdash rejecting approximately 1 out of every 9 international
orders received
Average Value of Fraudulent Order Higher than a Valid Order
Historically fraudulent orders tend to have higher values
on average than valid orders In 2008 the median value
of a fraudulent order was $200 compared to $130 median
value reported for valid orders This relationship of higher
fraudulent order values vs valid order value was found for
all merchant size categories as chart 24 shows Since
fraudulent orders tend to be somewhat higher in value than
valid orders merchants will tend to outsort more high value
orders for manual review and verification Large online
merchants reported that the median value of an order
flagged for manual review was $245
Valid vs Fraudulent Order Value
Valid orderFraudulent order
Median used to minimize impact of outliers
Overall $500K ndash lt$5Mlt$500K $5M ndash lt$25M $25M+
Annual Online Revenue
0
$200
$50
$100
$150
$250
$300
$350
$120
$150
$200
$150
$250
$175
$150
$100
$200
$130
24
40
10
05
20
15
25
35
45
30
00
International Fraud Rateover 3x USCanadian rate
11
40
Location of Order Origination
Within USCanadan=326
Outside USCanadan=164
Frau
d R
ate
o
f O
rder
s
23
21
C Y B E R S O U R C E 1 0 T H A N N U A L O N L I N E F R A U D R E P O R T
21copy2009 CyberSource Corporation All rights reserved
Tuning amp Management
Maintaining and Tuning Screening Rules28 of merchants say they have an automated order
screening system in place that allows business managers
to modify decision rules without assistance from internal
IT staff or external parties (up from 16 found in 2006)
The ability to adjust automated order screening systems
quickly helps manage the order review flow tailor rules
to new products and adapt to new fraud trends as they
are encountered Without this ability merchants cannot
easily minimize reject rates review costs or fraud rates
Additionally giving business managers the capability of
adjusting business rules on-the-fly reduces the costs and
burden of IT support
Global Fraud Portals Some online merchants are integrating fraud tools
and strategies via fraud management portals These
portals employ a combination of flexible rules systems
that interact with a portfolio of ldquotruth servicesrdquo around
the globe allowing business managers to set payment
type product type and market-specific screens Case
management systems are being integrated with these
portals with accompanying enhancements to streamline
workflow Global fraud portals typically include hierarchical
management as companies strive to centralize fraud
management across multiple lines of business and
geographies
Merchant Budgets for Fraud Management How much are online merchants spending to mitigate
fraud risk In both 2008 and in 2007 survey results
show that 34 of merchants spend 05 or more of
their online revenues to manage online payment fraud
while 66 spend less than 05 In 2008 across
all merchants the median ratio of fraud management
expense to sales was 022 down from 028 in 2007
although some merchants in high risk categories are
spending significantly more These spending estimates
focus on the cost of managing fraud risk (internal and
external systems and services management development
and review staffs) Direct fraud loss (chargebacks lost
goods and associated shipping costs) as well as the
opportunity cost associated with valid order rejection are
not included here (see chart 25)
Automated
Screening1
Manual
Review2
Accept
Reject3
Fraud Claim
Management4ORDER
RETAINED
REVENUE
Tuning and Management
02ndash lt050ndash lt02 05ndash lt10 10ndash lt40 40+
How Much Merchants Spend
on Fraud Management
(percent of merchants operating at defined expense level)
of Annual Online Revenues Spent to Manage Fraud(staff etc excluding fraud loss)
2007 n=972008 n=108
41 44
6
14
24
22
12 16
16
4
Median2008 = 022
2007 = 028
0
60
40
20
25
title (title)
22
C Y B E R S O U R C E 1 0 T H A N N U A L O N L I N E F R A U D R E P O R T
Budget Allocation For the past three years merchants have consistently
spent just over half their fraud management budgets on
review staff (see chart 26) The remainder is allocated
as follows 25 for third party tools or services and 24
on internally developed tools and systems
Clearly review staff costs are the dominant factor and
only 13 of merchants cite plans to increase review
staffing in 2009 Reducing the need for manual review
and increasing the efficiency and effectiveness of
reviewers is key to growing online business profits and
managing the total cost of online payment fraud One
place to start is by improving the automated detection of
risky orders so as to reduce manual order review volumes
Clearly the continued reliance on manual review we have
seen in the data over the last few years is not an optimal
long term strategy for managing online fraud As budgets
come under increasing pressure merchants will need
to redouble their efforts to automate more of the fraud
management process while keeping valid order conversion
high and fraud loss low
Base Those with 1 or more full-time manual review staff
Average Spending Allocation
for Fraud Management 2008
n=400
3rd Party
Tools
23
24
Internal
Tools amp
System
3rd Party
Tools
25
Order
Review
Staff
51
Planned Staffing Levels
Increase
13
21
Same
81
71
2009
2008
Decrease
6
8
n=238 248
26
23
C Y B E R S O U R C E 1 0 T H A N N U A L O N L I N E F R A U D R E P O R T
23copy2009 CyberSource Corporation All rights reserved
Resources amp Solutions
3 Managed Services
2 Design amp Installation
1 Systems amp Services
PAYMENT SECURITY
Order
Screening
Collection amp
Reconciliation
Global Payment
Acceptance
Processing
Management
L A S E R
BankBankTrans f e rTrans f e r
Direct
Debit
ORDER
bull Onlinebull Call Centerbull IVRbull Kioskbull POSbull ERP
With Performance
Guarantees
To find information on CyberSourcersquos industry-leading risk
management solutions self-paced webinars on decision
management and other whitepapers on electronic payment
management visit our Resource Center at
wwwcybersourcecom For sales assistance phone
1-888-330-2300 or e-mail salescybersourcecom
CyberSource Payment Management Solutions CyberSource offers a comprehensive portfolio of modular
services and tools to help your company manage your entire
payment pipeline to optimize sales results All are available
via one connection to our web-based services
Accept All Popular Payment Types in 190+
Countries
Accept payments worldwide using a merchant account from
your preferred provider or CyberSource worldwide credit
and debit cards regional cards direct debit bank
transfers electronic checks and alternative payment
types such as Bill Me Later and PayPal CyberSource
also provides professional services to help you
integrate payment with front-end and back-office
systems
Risk ManagementOrder Screening
Global Fraud Management Portal with CyberSource Intelligent
Review Technology A hosted rules and case management
system that provides on-demand access to over 150
validation tests and services across all four dimensions of
detection Detectors include multi-merchant transaction
history checks worldwide delivery address and phone
verification device fingerprinting IP geolocation purchase
velocity identity morphing and custom data from your
systems Case management system provides consolidated
data review workflow management and built-in callouts to
validation services to streamline review
Managed Services CyberSource provides client services to
help you analyze design and manage your order screening
and fraud detection processesmdasheverything from screening
strategies and risk threshold optimization analysis
to ongoing monitoring order review and chargeback
managementrecovery Our managed services include
business performance guarantees
Payer Authentication Verified by Visa MasterCard
SecureCode
Processing Management
CyberSource processes your payments in our high
availability datacenters located in the US Europe and
Japan All datacenters are certified PCI-compliant and
include sophisticated processing management logic to help
prevent payment failures and rate downgrades
Collection amp Reconciliation
A full array of online and exportable payment reporting
capability is available to streamline reconciliation activity
Further systems can be installed to automate up to 90
of the tasks associated with payment reconciliation and
chargeback re-presentment
Payment Security
Remove Payment Data From Your Network CyberSource
provides secure storage and hosted payment acceptance
services that let you process without storing or even
transmitting payment data A great way to streamline PCI
compliance and mitigate security risk
Payment System Centralization Our team of experts will help
you consolidate multiple payment systems into a single easy
to manage system Optionally CyberSource will also host
support and manage these systems in our secure datacenters
PCI Planning amp Remediation CyberSource provides PCI
compliance consulting and remediation services to help
remedy PCI issues
Professional Services
CyberSource maintains a team of experienced payment
consultants to assist with payment systems planning
system and process design and implementation and
integration Our client services team is additionally
available to help you monitor tune or fully outsource
portions of your payment operations
C Y B E R S O U R C E 1 0 T H A N N U A L O N L I N E F R A U D R E P O R T
North America
CyberSource Corporation
1295 Charleston Road
Mountain View CA 94043
T 8883302300
T 6509656000
F 6506259145
Email infocybersourcecom
Europe
CyberSource Ltd
The Waterfront
300 Thames Valley Park Drive
Thames Valley Park
Reading RG6 1PT
United Kingdom
T +44 (0) 1189294840
F +44 (0) 8704601931
Email ukcybersourcecom
UK Fraud Report wwwcybersourcecoukukfraudreport
Japan
CyberSource KK (Japan)
3-11-11 Shibuya Shibuya-ku
Tokyo 150-0002 Japan
T +81357747733
F +81357747732
Email mailcybersourcecojp
CyberSource Corporation is a leading provider of
electronic payment risk and security management
solutions CyberSource provides payment management
solutions for electronic payments processed via Web
call center kiosk mobile and POS environments
Services include hosted systems to help you manage
electronic payments as well as professional services
to help design integrate and fully manage parts or all
of your payment operations Over 245000 businesses
worldwide use CyberSource solutions including half
the companies comprising the Dow Jones Industrial
Average and leading Internet brands The company
is headquartered in Mountain View California and
has sales and service offices in Japan the United
Kingdom and other locations in the United States
For More Information
bull Call 18883302300
bull Email infocybersourcecom
bull Visit wwwcybersourcecom
Get Tailored Views of Risk Management
Pipelinetrade MetricsTo get a view crafted for your companyrsquos size and industry
please contact CyberSource at 18883302300 or online at
wwwcybersourcecomcontact_us
For additional information whitepapers and webinars
or sales assistance
bull Contact CyberSource 18883302300 or
wwwcybersourcecomcontact_us
bull Risk Management Solutions visit wwwcybersourcecom
products_and_servicesrisk_management
bull Global Payment amp Security Solutions
visit wwwcybersourcecomproducts_and_services
global_payment_services
About CyberSource
C Y B E R S O U R C E 1 0 T H A N N U A L O N L I N E F R A U D R E P O R T
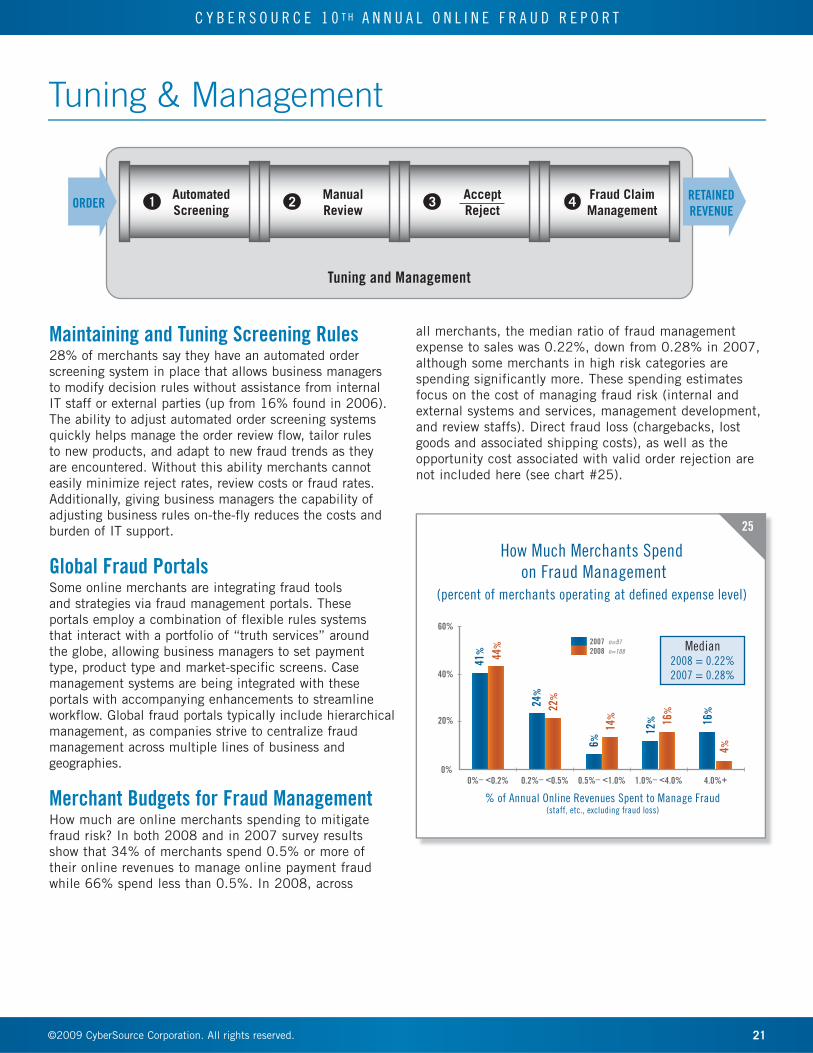
21
C Y B E R S O U R C E 1 0 T H A N N U A L O N L I N E F R A U D R E P O R T
21copy2009 CyberSource Corporation All rights reserved
Tuning amp Management
Maintaining and Tuning Screening Rules28 of merchants say they have an automated order
screening system in place that allows business managers
to modify decision rules without assistance from internal
IT staff or external parties (up from 16 found in 2006)
The ability to adjust automated order screening systems
quickly helps manage the order review flow tailor rules
to new products and adapt to new fraud trends as they
are encountered Without this ability merchants cannot
easily minimize reject rates review costs or fraud rates
Additionally giving business managers the capability of
adjusting business rules on-the-fly reduces the costs and
burden of IT support
Global Fraud Portals Some online merchants are integrating fraud tools
and strategies via fraud management portals These
portals employ a combination of flexible rules systems
that interact with a portfolio of ldquotruth servicesrdquo around
the globe allowing business managers to set payment
type product type and market-specific screens Case
management systems are being integrated with these
portals with accompanying enhancements to streamline
workflow Global fraud portals typically include hierarchical
management as companies strive to centralize fraud
management across multiple lines of business and
geographies
Merchant Budgets for Fraud Management How much are online merchants spending to mitigate
fraud risk In both 2008 and in 2007 survey results
show that 34 of merchants spend 05 or more of
their online revenues to manage online payment fraud
while 66 spend less than 05 In 2008 across
all merchants the median ratio of fraud management
expense to sales was 022 down from 028 in 2007
although some merchants in high risk categories are
spending significantly more These spending estimates
focus on the cost of managing fraud risk (internal and
external systems and services management development
and review staffs) Direct fraud loss (chargebacks lost
goods and associated shipping costs) as well as the
opportunity cost associated with valid order rejection are
not included here (see chart 25)
Automated
Screening1
Manual
Review2
Accept
Reject3
Fraud Claim
Management4ORDER
RETAINED
REVENUE
Tuning and Management
02ndash lt050ndash lt02 05ndash lt10 10ndash lt40 40+
How Much Merchants Spend
on Fraud Management
(percent of merchants operating at defined expense level)
of Annual Online Revenues Spent to Manage Fraud(staff etc excluding fraud loss)
2007 n=972008 n=108
41 44
6
14
24
22
12 16
16
4
Median2008 = 022
2007 = 028
0
60
40
20
25
title (title)
22
C Y B E R S O U R C E 1 0 T H A N N U A L O N L I N E F R A U D R E P O R T
Budget Allocation For the past three years merchants have consistently
spent just over half their fraud management budgets on
review staff (see chart 26) The remainder is allocated
as follows 25 for third party tools or services and 24
on internally developed tools and systems
Clearly review staff costs are the dominant factor and
only 13 of merchants cite plans to increase review
staffing in 2009 Reducing the need for manual review
and increasing the efficiency and effectiveness of
reviewers is key to growing online business profits and
managing the total cost of online payment fraud One
place to start is by improving the automated detection of
risky orders so as to reduce manual order review volumes
Clearly the continued reliance on manual review we have
seen in the data over the last few years is not an optimal
long term strategy for managing online fraud As budgets
come under increasing pressure merchants will need
to redouble their efforts to automate more of the fraud
management process while keeping valid order conversion
high and fraud loss low
Base Those with 1 or more full-time manual review staff
Average Spending Allocation
for Fraud Management 2008
n=400
3rd Party
Tools
23
24
Internal
Tools amp
System
3rd Party
Tools
25
Order
Review
Staff
51
Planned Staffing Levels
Increase
13
21
Same
81
71
2009
2008
Decrease
6
8
n=238 248
26
23
C Y B E R S O U R C E 1 0 T H A N N U A L O N L I N E F R A U D R E P O R T
23copy2009 CyberSource Corporation All rights reserved
Resources amp Solutions
3 Managed Services
2 Design amp Installation
1 Systems amp Services
PAYMENT SECURITY
Order
Screening
Collection amp
Reconciliation
Global Payment
Acceptance
Processing
Management
L A S E R
BankBankTrans f e rTrans f e r
Direct
Debit
ORDER
bull Onlinebull Call Centerbull IVRbull Kioskbull POSbull ERP
With Performance
Guarantees
To find information on CyberSourcersquos industry-leading risk
management solutions self-paced webinars on decision
management and other whitepapers on electronic payment
management visit our Resource Center at
wwwcybersourcecom For sales assistance phone
1-888-330-2300 or e-mail salescybersourcecom
CyberSource Payment Management Solutions CyberSource offers a comprehensive portfolio of modular
services and tools to help your company manage your entire
payment pipeline to optimize sales results All are available
via one connection to our web-based services
Accept All Popular Payment Types in 190+
Countries
Accept payments worldwide using a merchant account from
your preferred provider or CyberSource worldwide credit
and debit cards regional cards direct debit bank
transfers electronic checks and alternative payment
types such as Bill Me Later and PayPal CyberSource
also provides professional services to help you
integrate payment with front-end and back-office
systems
Risk ManagementOrder Screening
Global Fraud Management Portal with CyberSource Intelligent
Review Technology A hosted rules and case management
system that provides on-demand access to over 150
validation tests and services across all four dimensions of
detection Detectors include multi-merchant transaction
history checks worldwide delivery address and phone
verification device fingerprinting IP geolocation purchase
velocity identity morphing and custom data from your
systems Case management system provides consolidated
data review workflow management and built-in callouts to
validation services to streamline review
Managed Services CyberSource provides client services to
help you analyze design and manage your order screening
and fraud detection processesmdasheverything from screening
strategies and risk threshold optimization analysis
to ongoing monitoring order review and chargeback
managementrecovery Our managed services include
business performance guarantees
Payer Authentication Verified by Visa MasterCard
SecureCode
Processing Management
CyberSource processes your payments in our high
availability datacenters located in the US Europe and
Japan All datacenters are certified PCI-compliant and
include sophisticated processing management logic to help
prevent payment failures and rate downgrades
Collection amp Reconciliation
A full array of online and exportable payment reporting
capability is available to streamline reconciliation activity
Further systems can be installed to automate up to 90
of the tasks associated with payment reconciliation and
chargeback re-presentment
Payment Security
Remove Payment Data From Your Network CyberSource
provides secure storage and hosted payment acceptance
services that let you process without storing or even
transmitting payment data A great way to streamline PCI
compliance and mitigate security risk
Payment System Centralization Our team of experts will help
you consolidate multiple payment systems into a single easy
to manage system Optionally CyberSource will also host
support and manage these systems in our secure datacenters
PCI Planning amp Remediation CyberSource provides PCI
compliance consulting and remediation services to help
remedy PCI issues
Professional Services
CyberSource maintains a team of experienced payment
consultants to assist with payment systems planning
system and process design and implementation and
integration Our client services team is additionally
available to help you monitor tune or fully outsource
portions of your payment operations
C Y B E R S O U R C E 1 0 T H A N N U A L O N L I N E F R A U D R E P O R T
North America
CyberSource Corporation
1295 Charleston Road
Mountain View CA 94043
T 8883302300
T 6509656000
F 6506259145
Email infocybersourcecom
Europe
CyberSource Ltd
The Waterfront
300 Thames Valley Park Drive
Thames Valley Park
Reading RG6 1PT
United Kingdom
T +44 (0) 1189294840
F +44 (0) 8704601931
Email ukcybersourcecom
UK Fraud Report wwwcybersourcecoukukfraudreport
Japan
CyberSource KK (Japan)
3-11-11 Shibuya Shibuya-ku
Tokyo 150-0002 Japan
T +81357747733
F +81357747732
Email mailcybersourcecojp
CyberSource Corporation is a leading provider of
electronic payment risk and security management
solutions CyberSource provides payment management
solutions for electronic payments processed via Web
call center kiosk mobile and POS environments
Services include hosted systems to help you manage
electronic payments as well as professional services
to help design integrate and fully manage parts or all
of your payment operations Over 245000 businesses
worldwide use CyberSource solutions including half
the companies comprising the Dow Jones Industrial
Average and leading Internet brands The company
is headquartered in Mountain View California and
has sales and service offices in Japan the United
Kingdom and other locations in the United States
For More Information
bull Call 18883302300
bull Email infocybersourcecom
bull Visit wwwcybersourcecom
Get Tailored Views of Risk Management
Pipelinetrade MetricsTo get a view crafted for your companyrsquos size and industry
please contact CyberSource at 18883302300 or online at
wwwcybersourcecomcontact_us
For additional information whitepapers and webinars
or sales assistance
bull Contact CyberSource 18883302300 or
wwwcybersourcecomcontact_us
bull Risk Management Solutions visit wwwcybersourcecom
products_and_servicesrisk_management
bull Global Payment amp Security Solutions
visit wwwcybersourcecomproducts_and_services
global_payment_services
About CyberSource
C Y B E R S O U R C E 1 0 T H A N N U A L O N L I N E F R A U D R E P O R T
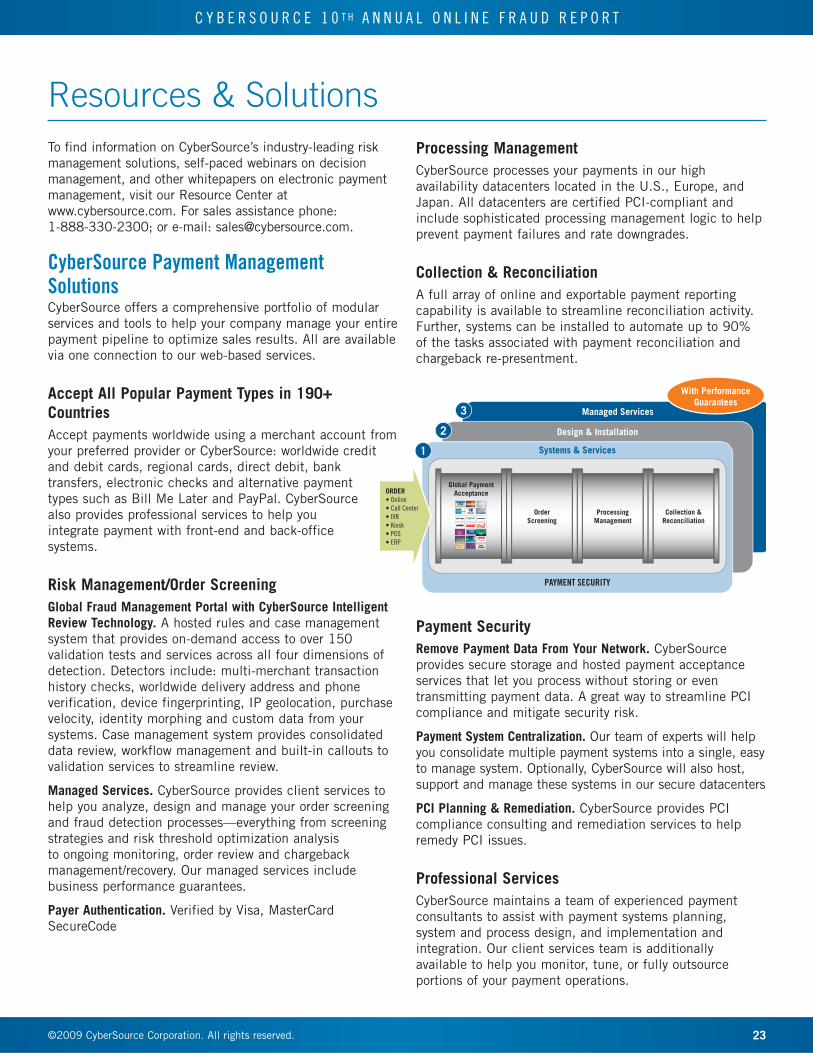