CVG Chapter APICS April 20, 2010 vf
68
Kingsgate Marriott at the University of Cincinnati April 20, 2010 Present Supply Chain Management in Turbulent Times Freese & Associates, Inc. and The Cincinnati Chapter of
Transcript of CVG Chapter APICS April 20, 2010 vf

20 April 2010Supply Chain Management in
Turbulent Times
Page 1
Freese & Associates, Inc.
Kingsgate Marriott at the University of CincinnatiApril 20, 2010
Present
Supply Chain Management in Turbulent Times
Freese & Associates, Inc.
and
The Cincinnati Chapter of

20 April 2010Supply Chain Management in
Turbulent Times
Page 2
Freese & Associates, Inc.
Agenda• Supply Chain Management
o Historyo Definitiono Evolution
• The State of Logistics
• Turbulent Timeso The Perfect Storm o Economic & Markets
• SCM Trends
• Economic Direction& Impacts
• Financial Impactsof SCM
• Keys to the Future
• Q & A
20 April 2010Supply Chain Management in
Turbulent Times
Page 3
Freese & Associates, Inc.
Presents
Content Overview, Objectives & Definitions
Supply Chain Management
20 April 2010Supply Chain Management in
Turbulent Times
Page 4
Freese & Associates, Inc.
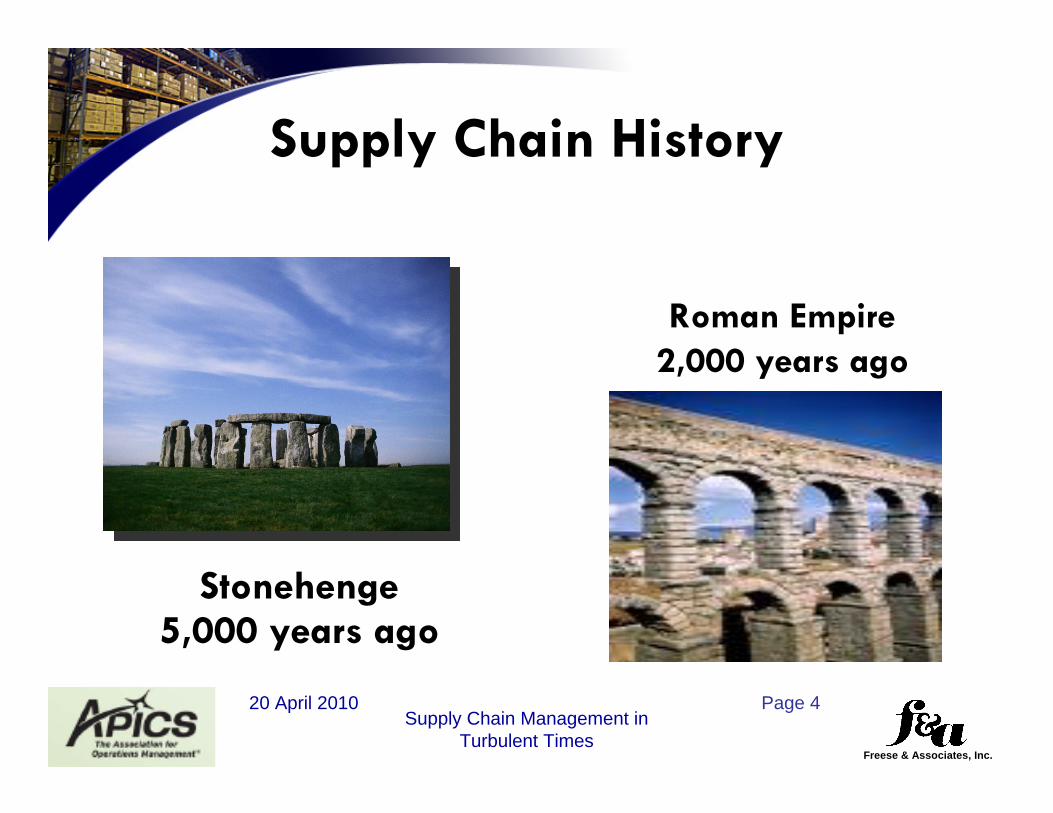
Supply Chain History
Stonehenge5,000 years ago
Roman Empire2,000 years ago

20 April 2010Supply Chain Management in
Turbulent Times
Page 5
Freese & Associates, Inc.
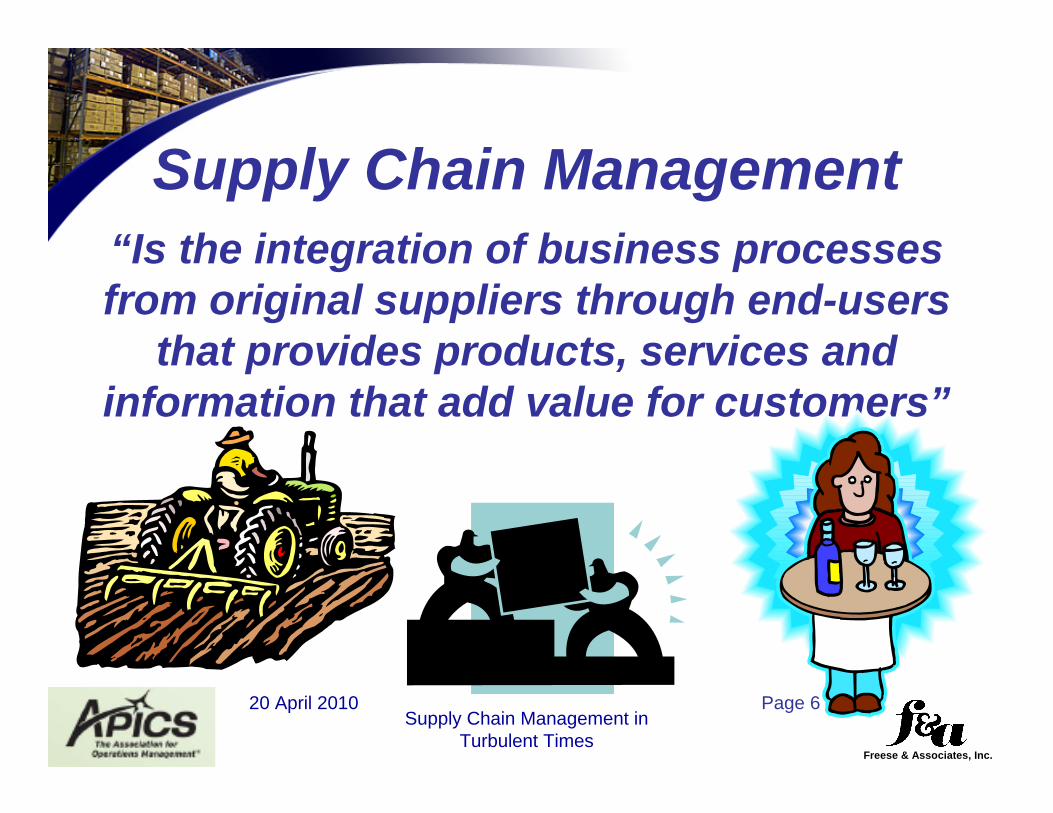
What is Supply Chain Management?
20 April 2010Supply Chain Management in
Turbulent Times
Page 6
Freese & Associates, Inc.
“Is the integration of business processesfrom original suppliers through end-users
that provides products, services and information that add value for customers”
Supply Chain Management

20 April 2010Supply Chain Management in
Turbulent Times
Page 7
Freese & Associates, Inc.
Suppliers’ SupplierTo
Customers’ Customer

20 April 2010Supply Chain Management in
Turbulent Times
Page 8
Freese & Associates, Inc.
“Supply Chain Management” is More Than Just “Logistics” !
“Demand Management” “Focal Firm” “Supply Management”
CustomerRelationshipManagement
Demand Planning
Operations/Manufacturing
(Product/Service)StrategyOutbound
Logistics
Procurement
InboundLogistics
SalesOrder Mgt.
Process Design and Management
Project Management
Supply Chain Integration
SupplierRelationshipManagement
Post-SalesSupport
Financial Resource Management

20 April 2010Supply Chain Management in
Turbulent Times
Page 9
Freese & Associates, Inc.
•
•Sales,
Manufac
turing,
Purcha
sing,
Transp
ortatio
n
•Sales/
Logisti
cs/Oper
ations
•Incept
ion of
SCM •Full I
mplement
ation
of Coll
aborat
ive
SCM
Prehistoric 2000
Post WWII 1982
How long will it take??
2???
The Evolution of SCM
More AttentionFrom SeniorManagement
More AttentionFrom SeniorManagement

20 April 2010Supply Chain Management in
Turbulent Times
Page 10
Freese & Associates, Inc.
A horizontal process view is the foundation to Supply Chain Management
Supply Chain management processes cut across the silos. It’s horizontal.

20 April 2010Supply Chain Management in
Turbulent Times
Page 11
Freese & Associates, Inc.
Most supply chains are global
D is tr ib u tio nD is tr ib u tio nD is tr ib u tio nD is tr ib u tio n
In te rn a tio n a l T ra d e In te rn a tio n a l T ra d e L o g is tic sL o g is tic s
C u s to m e rsC u s to m e rs
M a n u fa c tu r in gM a n u fa c tu r in gS u p p lie rsS u p p lie rs F in is h e dF in is h e dg o o d sg o o d s
w a re h o u s ew a re h o u s e
In te rn a tio n a l T ra d e In te rn a tio n a l T ra d e L o g is tic sL o g is tic s
C u s to m sC u s to m sC u s to m sC u s to m s

20 April 2010Supply Chain Management in
Turbulent Times
Page 12
Freese & Associates, Inc.
Electronics Supply Chain
Reverse Logistics
Component Manufacturers Distributors
ContractManufacturer
OEMsFinished Goods
Distributors / Channel Partners
Retailers &End Consumers
NationalSemi
AMD
TexasInstrument
LSILogic
Intel
Arrow
Avnet
Pioneer
Premier
Bell
Solectron
SCI
Celestica
Flextronics
Jabil
Sanmina
IBM
HP
Compaq
Lucent
Motorola
Dell
Alcatel
Nortel
Cisco
Ingram Micro
Tech Data Corp
Merisel, Inc
Brightpoint
CellStar
CompUSA
Best Buy
Radio Shack
RetailersRetailers
End ConsumerEnd Consumer
Enterprise SalesE-commerce
purchase

20 April 2010Supply Chain Management in
Turbulent Times
Page 13
Freese & Associates, Inc.
Factory
Seller’s DC Customer’s DC
ConsumersSeller’sPlant
Supplier
SCOR Model

20 April 2010Supply Chain Management in
Turbulent Times
Page 14
Freese & Associates, Inc.
Best in Class Performance & Potential Savings
Source: SRI International
$117.5b10.2%4.3%$1,991bDefense & Industrial
$138.9b9.2%4.9%$3,231bConsumer Packaged Goods
$23.5b8.3%3.3%$470bTelecommunications
$15.3b8.3%4.0%$356bComputers & Electronic
$46.8b11.2%3.9%$641bChemicals & Pharmaceuticals
Potential Savings
MedianLogistics Costs
Best in classTotal Revenue
BillionsIndustry

20 April 2010Supply Chain Management in
Turbulent Times
Page 15
Freese & Associates, Inc.
Benefits of SCM• Strengthens vendor -customer relations• Facilitates planning at all levels• Allows all partners in the supply chain to
monitor shipment progress• Minimizes bottlenecks created by waiting for
proper documents• Enables all parties to participate in process
improvements• Eliminates duplicate efforts• Enhances supply chain security
/

20 April 2010Supply Chain Management in
Turbulent Times
Page 16
Freese & Associates, Inc.
SCM Has ImpactsA study by Georgia Tech showed that a company’s stock price drops
8% when the company experiences a glitch in its supply chain.
A study at Miami University of Ohio showed that when a company adopts a new supply chain innovation, the company’s stock price increases.
A study by Bain & Company showed that companies employing sophisticated supply chain methods enjoyed 12 times greater profit than companies with unsophisticated methods.
Wall Street: New found respect for SCM. In one SCM MBA program in the US, 21/32 grads received job offers from Investment Banking firms because of the importance of SCM to their clients!!

20 April 2010Supply Chain Management in
Turbulent Times
Page 17
Freese & Associates, Inc.
Features Benefits Value• Single focus must be on the creation of value• Key questions include
– Value for whom?– How to create value through supply chain management?– How to measure and quantify the value that is created?
• Significant improvement needed in key areas such as:– Understanding customers’ needs– Performance measurement and KPIs– Quantification of value and determination of ROI

4/23/2010 5:17:13 PM20 April 2010 Supply Chain Management in
Turbulent Times
Page 18
Freese & Associates, Inc.
The Challenge is “Change”:
“Consider how hard it is to change yourself, and you’ll understand what little chance you have of changing others.”(Albert Einstein)
“It is not the strongest of the species that survive, nor the most intelligent, but those most responsive to change” (Charles Darwin)

20 April 2010Supply Chain Management in
Turbulent Times
Page 19
Freese & Associates, Inc.
Presents
Content Overview, Objectives & Definitions
State of LogisticsMagnitudeImpact

20 April 2010Supply Chain Management in
Turbulent Times
Page 20
Freese & Associates, Inc.
U.S. Logistics Cost as Percent of GDP in 2008
103273111487
455216671
58381041
177
854
1,397
InterestTaxes, Obsolescence, Depreciation, InsuranceWarehousing
Truck - IntercityTruck - Local
RailroadsWater (International 33 Domestic 5)
(International 16 Domestic 25)Oil PipelinesAir
Other Carriers:
Motor Carriers:
Subtotal
Subtotal
Subtotal
Carrying Costs - $ 2.026 Trillion All Business Inventory
Transportation Costs
Shipper Related CostsLogistics Administration
TOTAL LOGISTICS COST
$ Billions
30Forwarders
1

20 April 2010Supply Chain Management in
Turbulent Times
Page 21
Freese & Associates, Inc.
U.S. Business Logistics Costs
1
0.921.01 0.97 0.92 0.95
1.03
1.181.31
1.39 1.34
1999
2000
2001
2002
2003
2004
2005
2006
2007
2008
$ Tr
illio
ns

20 April 2010Supply Chain Management in
Turbulent Times
Page 22
Freese & Associates, Inc.
The U.S. Business Logistics System Cost is the Equivalent of 9.4 Percent
of Current GDP in 2008
47252122420
460220680
63391040
184
852
1,344
InterestTaxes, Obsolescence, Depreciation, InsuranceWarehousing
Truck - IntercityTruck - Local
RailroadsWater (International 33 Domestic 6)
(International 16 Domestic 24)Oil PipelinesAir
Other Carriers:
Motor Carriers:
Subtotal
Subtotal
Subtotal
Carrying Costs - $ 1.965 Trillion All Business Inventory
Transportation Costs
Shipper Related CostsLogistics Administration
TOTAL LOGISTICS COST
$ Billions
32Forwarders
2

20 April 2010Supply Chain Management in
Turbulent Times
Page 23
Freese & Associates, Inc.
Logistics Cost As A Percent of GDP
3
9.9 10.39.5
8.8 8.6 8.89.5
9.9 10.19.4
1999
2000
2001
2002
2003
2004
2005
2006
2007
2008
20 April 2010Supply Chain Management in
Turbulent Times
Page 24
Freese & Associates, Inc.4
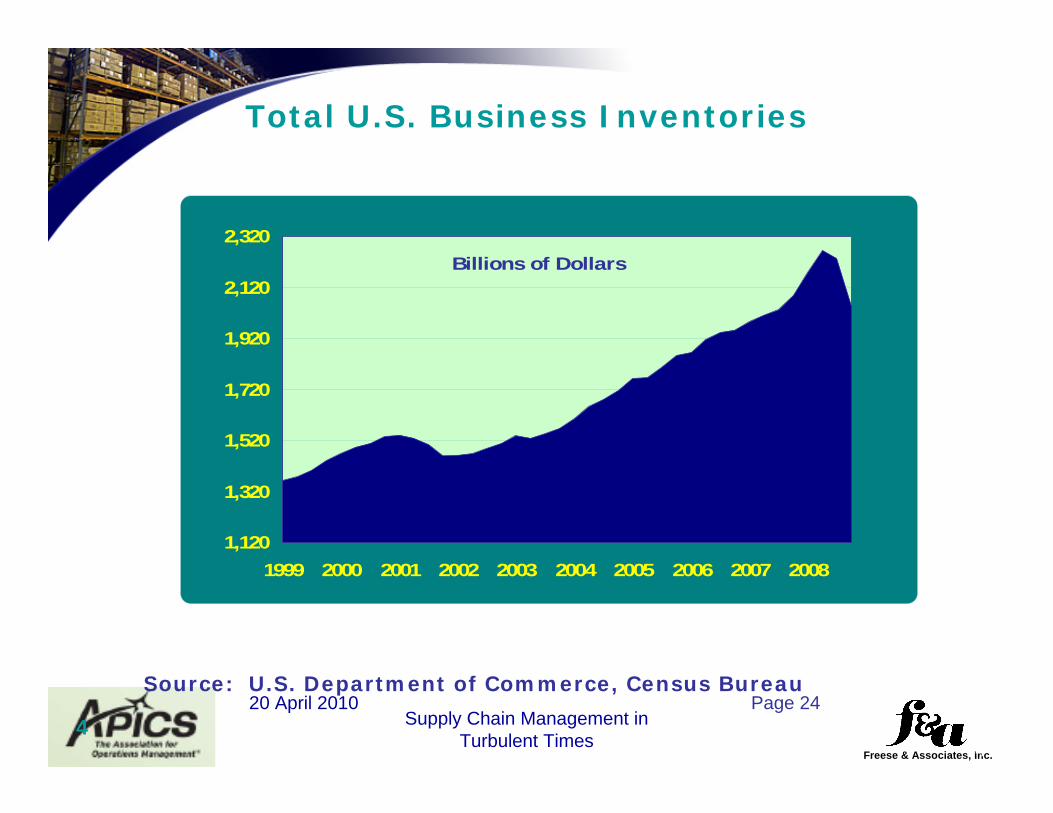
Total U.S. Business Inventories
Source: U.S. Department of Commerce, Census Bureau
1,120
1,320
1,520
1,720
1,920
2,120
2,320
1999 2000 2001 2002 2003 2004 2005 2006 2007 2008
Billions of Dollars
4

20 April 2010Supply Chain Management in
Turbulent Times
Page 25
Freese & Associates, Inc.
The Inventory to Sales Ratio Rose Sharply in the Second Half of 2008
Source: U.S. Department of Commerce, Census Bureau
5
1.20
1.25
1.30
1.35
1.40
1.45
1.50
1999 2000 2001 2002 2003 2004 2005 2006 2007 2008

20 April 2010Supply Chain Management in
Turbulent Times
Page 26
Freese & Associates, Inc.
U.S. Average Commercial Paper Rates Have Fallen Dramatically in 2008
Source: Board of Governors of the Federal Reserve System
5
0.0
1.0
2.0
3.0
4.0
5.0
6.0
7.0
19991999 2000 2001 2002 2003 2004 2006 2006 2007 2008
Perc
ent
6

20 April 2010Supply Chain Management in
Turbulent Times
Page 27
Freese & Associates, Inc.
The U.S. Business Logistics System Cost is the Equivalent of 9.4 Percent
of Current GDP in 2008
47252122420
460220680
63391040
184
852
1,344
InterestTaxes, Obsolescence, Depreciation, InsuranceWarehousing
Truck - IntercityTruck - Local
RailroadsWater (International 33 Domestic 6)
(International 16 Domestic 24)Oil PipelinesAir
Other Carriers:
Motor Carriers:
Subtotal
Subtotal
Subtotal
Carrying Costs - $ 1.965 Trillion All Business Inventory
Transportation Costs
Shipper Related CostsLogistics Administration
TOTAL LOGISTICS COST
$ Billions
32Forwarders
7
down 13%
$882up 2%

20 April 2010Supply Chain Management in
Turbulent Times
Page 28
Freese & Associates, Inc.
Index of Logistics Costs as a Percent of GDP 1988 - 2008
910
30
50
70
90
110
1988 1990 1995 2000 2005 2008
InventoryTransportationTotal

20 April 2010Supply Chain Management in
Turbulent Times
Page 29
Freese & Associates, Inc.
GDP Growth and Logistics Cost Growth
11
2004 2005 2006 2007 2008
GDPLogistics Costs
20 April 2010Supply Chain Management in
Turbulent Times
Page 30
Freese & Associates, Inc.
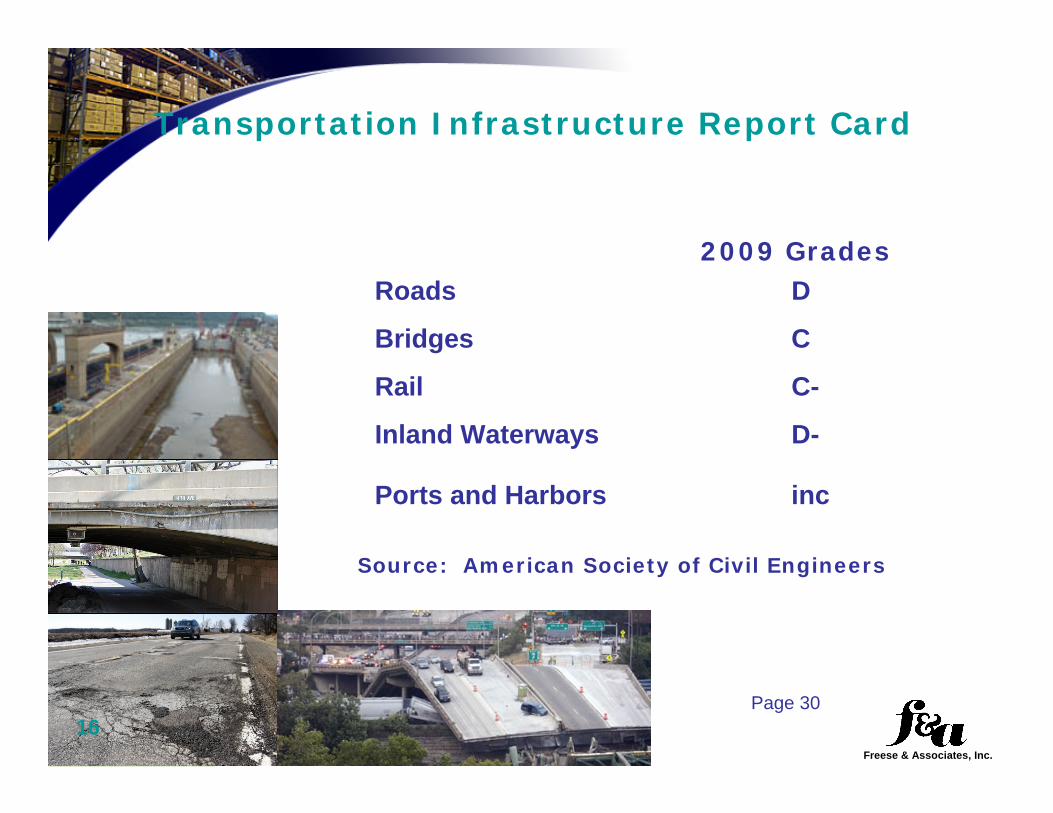
Transportation Infrastructure Report Card
2009 GradesRoads D
Bridges C
Rail C-
Inland Waterways D-
Ports and Harbors inc
Source: American Society of Civil Engineers
16

20 April 2010Supply Chain Management in
Turbulent Times
Page 31
Freese & Associates, Inc.
Summary
17
• 2008 Logistics Costs fell to $1.3 trillion
• Transportation costs rose 2.0 percent and now account for 6.1 percent of nominal GDP
Logistics cost were equivalent to 9.4 percent of GDP in 2008
•
• Inventory carrying costs declined 13.2 percent and now account for 2.9 percent of nominal GDP – both decreased inventories and lower interest rates contributed
21
The weak dollar spurred demand for U.S. goods pushing up exports. Higher shipments of export goods partially offset the drop in domestic shipping demand in 2008.
•

20 April 2010Supply Chain Management in
Turbulent Times
Page 32
Freese & Associates, Inc.
Cost As A Percent of GDP
9.9 10.39.5
8.8 8.6 8.89.5
9.9 10.19.4
1999
2000
2001
2002
2003
2004
2005
2006
2007
2008

20 April 2010Supply Chain Management in
Turbulent Times
Page 33
Freese & Associates, Inc.
The Changing Costs of Logistics
• From 2000/2004 Logistics Costs Declined– Low Energy Costs– Deregulation– Increased Information Technology
• Starting in 2005 Logistics Costs Increased– Rising Energy Costs– Rising Inventories– Declining Transportation Capacity

20 April 2010Supply Chain Management in
Turbulent Times
Page 34
Freese & Associates, Inc.
Wholesale Vs. Retail Inventories(Billions of Dollars)
200250
300350
400450
500550
600
1997
1998
1999
2000
2001
2002
2003
2004
2005
2006
2007
2008
WholesaleRetail
Source: U.S. Department of Commerce, Bureau of Economic Analysis
20 April 2010Supply Chain Management in
Turbulent Times
Page 35
Freese & Associates, Inc.
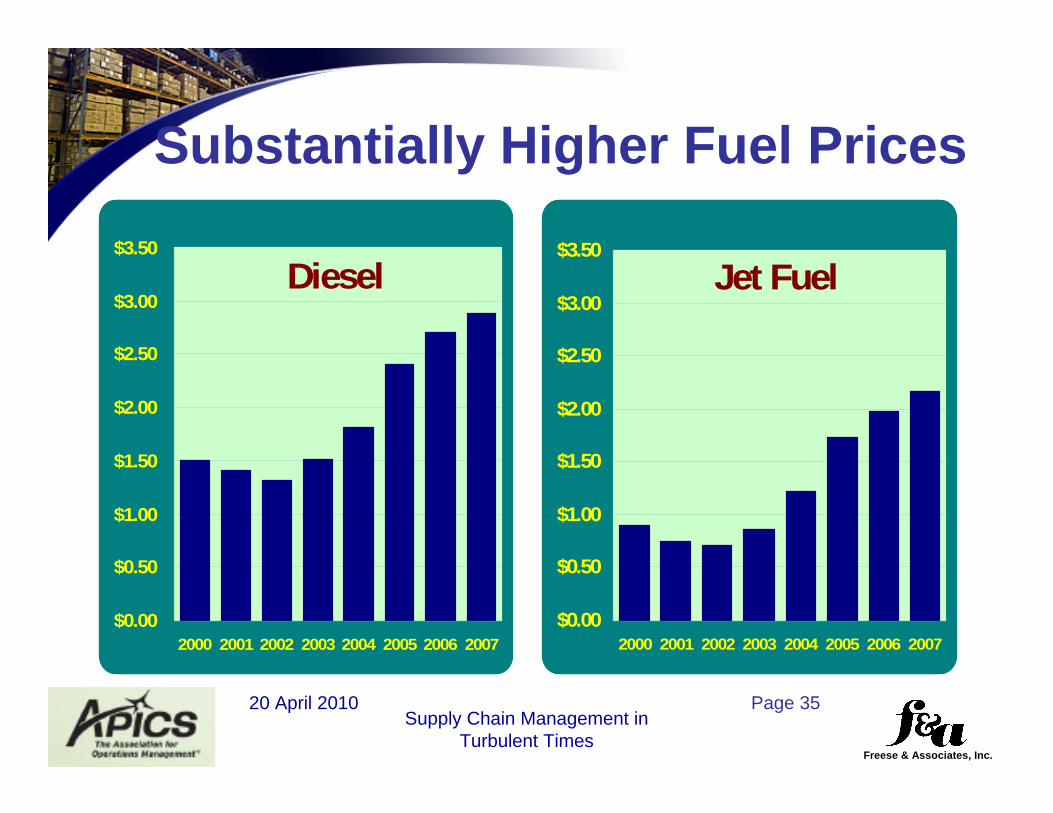
Substantially Higher Fuel Prices
Diesel
$0.00
$0.50
$1.00
$1.50
$2.00
$2.50
$3.00
$3.50
2000 2001 2002 2003 2004 2005 2006 2007
Jet Fuel
$0.00
$0.50
$1.00
$1.50
$2.00
$2.50
$3.00
$3.50
2000 2001 2002 2003 2004 2005 2006 2007

20 April 2010Supply Chain Management in
Turbulent Times
Page 36
Freese & Associates, Inc.
Fuel EfficiencyTon-Miles Per Gallon
Barge Railroad Truck
576
413
155
Source: Texas Transportation Institute Study, Nov. 2007

20 April 2010Supply Chain Management in
Turbulent Times
Page 37
Freese & Associates, Inc.
Mode Utilization
Barge Railroad Truck

20 April 2010Supply Chain Management in
Turbulent Times
Page 38
Freese & Associates, Inc.
Global Comparison of Logistics Expenditures
Asia 13-20% GDPChina 15% GDP
Europe 12-14% GDPIndia 13% GDPJapan 11% GDPMexico 14% GDP
EconomyHigher Output--GDPBetter use of resourcesMulti-use InfrastructureBusinessesMarket AccessMarket IntegrationCost EfficiencyConsumersMore Goods and ServicesWider AvailabilityLower Prices/Income
U.S. 9.4% GDP

20 April 2010Supply Chain Management in
Turbulent Times
Page 39
Freese & Associates, Inc.
The cost of logistics in the U. S. was $1.4 trillion in 2007; about 10.1% of our GDP (gross domestic product).
U. S. expenditure on logistics is larger than the national GDP of all but 12 countries. (For example, U. S. logistics expenditures are larger than the GDP of Spain).
Total domestic business inventories carrying costs rose 9 percent and now account for 3.5 percent of nominal GDP.
In 1980 logistics represented 17.9% of America’s GDP. Today it is 10.1%.By comparison, estimated logistics costs represent 15% of China’s GDP and 13% in India.
SOME MAGNITUDES…
Transportation costs rose 5.9 percent and now account for 6.2 percent of nominal GDP

20 April 2010Supply Chain Management in
Turbulent Times
Page 40
Freese & Associates, Inc.
Presents
Content Overview, Objectives & Definitions
Turbulent Times

20 April 2010Supply Chain Management in
Turbulent Times
Page 41
Freese & Associates, Inc.
The Perfect Storm
Credit Crunch
Crude Oil Prices

20 April 2010Supply Chain Management in
Turbulent Times
Page 42
Freese & Associates, Inc.
What We’ve Seen
Gasoline prices have risen lowered And were they stop no one knows

20 April 2010Supply Chain Management in
Turbulent Times
Page 43
Freese & Associates, Inc.
What About the Market?
What Goes Up Can Also Go Down
2007
2008
1938

20 April 2010Supply Chain Management in
Turbulent Times
Page 44
Freese & Associates, Inc.
GDP as an IndicatorUnited States GDP Growth Rate

20 April 2010Supply Chain Management in
Turbulent Times
Page 45
Freese & Associates, Inc.
Economic Indicators
3.25%3.25%3.25%Prime Rate
$58.85$70.60$87.05Oil / Barrel
$917.00$945.00$1,130.00Gold / Once
8.90%9.40%9.70%Unemployment
-6.29%-1.03%5.60%GDP Growth
-0.45%-1.19%2.10%Inflation
8,4699,33710,897DJI Index
May 12, 2009
August 10, 2009
April 7, 2010

20 April 2010Supply Chain Management in
Turbulent Times
Page 46
Freese & Associates, Inc.
ISM Index
Institute For Supply Management March 2010

20 April 2010Supply Chain Management in
Turbulent Times
Page 47
Freese & Associates, Inc.
Current PMI Direction

20 April 2010Supply Chain Management in
Turbulent Times
Page 48
Freese & Associates, Inc.
CPI February 2010
U S Bureau of Labor Statistics April 2010

20 April 2010Supply Chain Management in
Turbulent Times
Page 49
Freese & Associates, Inc.
Industrial Production & Capacity
Federal Reserve Board August 2009

20 April 2010Supply Chain Management in
Turbulent Times
Page 50
Freese & Associates, Inc.
2010 Dow Jones & Company April 2010
DJI 5 Year Trend

20 April 2010Supply Chain Management in
Turbulent Times
Page 51
Freese & Associates, Inc.
How This TranslatesTransportation for 2009, was flat or down because of:
• Volumes being down for trucking the largest segment. – In the current environment it was very difficult for rates to
increase. – For the last two years fuel surcharges have been a significant chunk of revenue. – With fuel prices falling
in the latter part of the year and volumes down many carriers eased off on the surcharges.
• Rail volumes although the fourth highest have ever been flat to slightly up,
– because pricing has been soft and surcharges were removed. • Air Freight was down because,
– volumes are down, – fuel pricing hurt economics.
• Water was down, – both internationally and domestically.

20 April 2010Supply Chain Management in
Turbulent Times
Page 52
Freese & Associates, Inc.
Presents
Content Overview, Objectives & Definitions
The Future

20 April 2010Supply Chain Management in
Turbulent Times
Page 53
Freese & Associates, Inc.
What This Means in SCMSCM Trends:• Reverse globalization - new sourcing strategies, especially Mexico;
rethinking many strategies• Changes in packaging design - and routing to reduce ton-miles• Capacity issues - loss of trucking capacity, excess capacity in container
shipping industry, driver shortages• Transportation Companies - Companies that come through this will be
stronger, more agile players• Impact of the stimulus bill - not enough nor aimed at the right spots to
turn around SCM direction• Need For a Strong National Freight Transportation Policy -
needs to address entire supply chain, funding issues (reduced fuel consumption has hit the already inadequate Highway Trust Fund), best investment strategies, etc.
• Fuel prices will be climbing again - strategies to mitigate fuel volatility

20 April 2010Supply Chain Management in
Turbulent Times
Page 54
Freese & Associates, Inc.
What This All Means in SCM• High fuel prices will led many to reevaluate their entire supply
chains.– companies are reevaluating where they are sourcing their raw materials, – where they are locating their manufacturing centers, and – where they are locating their distribution centers. – No longer is moving manufacturing operations to China seen as a
panacea.
• The rail and parcel/express sectors have weathered the best.
• LTL pricing is under the most pressure because demand is heavily tied to the industrial economy and capital spending, it is not as consolidated as the rail and parcel sectors, and it hasn't had enough capacity taken out relative to lower industry volumes.
20 April 2010Supply Chain Management in
Turbulent Times
Page 55
Freese & Associates, Inc.
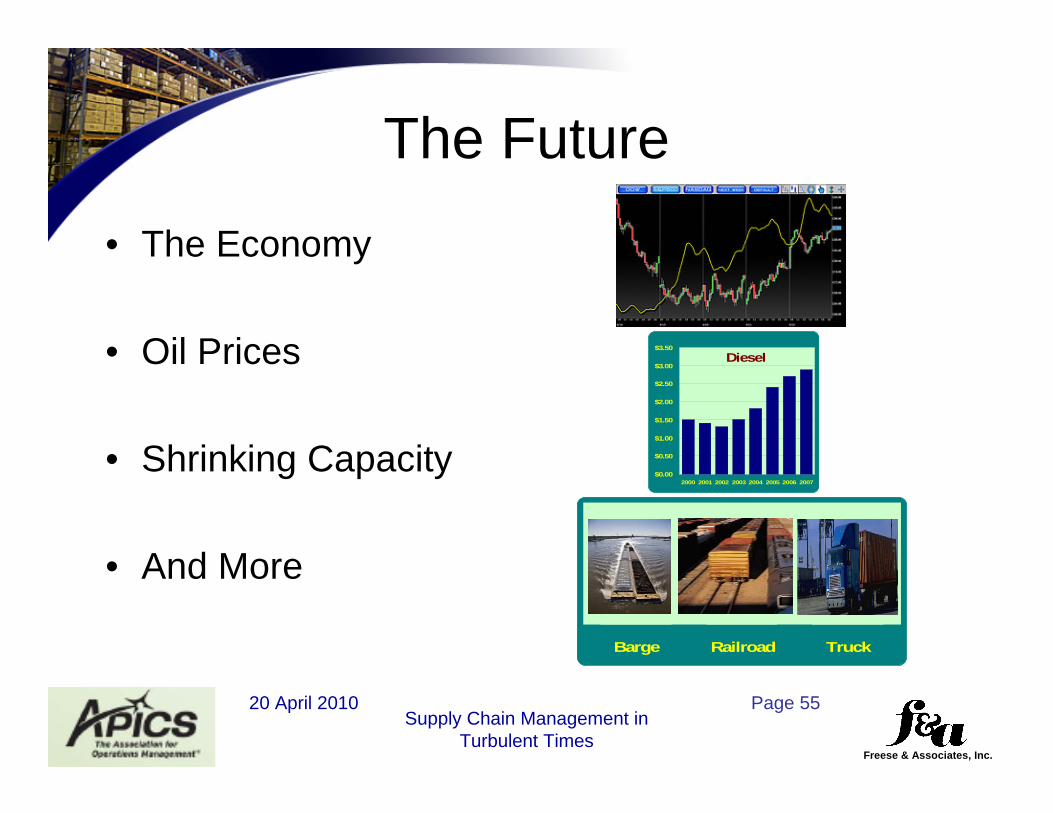
The Future
• The Economy
• Oil Prices
• Shrinking Capacity
• And More
Barge Railroad Truck
Diesel
$0.00
$0.50
$1.00
$1.50
$2.00
$2.50
$3.00
$3.50
2000 2001 2002 2003 2004 2005 2006 2007

20 April 2010Supply Chain Management in
Turbulent Times
Page 56
Freese & Associates, Inc.
Green Trends
• Investors see “green” practices as a reflection of good management practices.
• Today: Public relations tactic.• Tomorrow: Real economic value
strategies.Energy cost inflation will help green ROI get even better.
• Cap and Trade

20 April 2010Supply Chain Management in
Turbulent Times
Page 57
Freese & Associates, Inc.
DC / Warehouse Facility items being considered include:
• Energy Creation measures
• Wind power units – rooftop units - individual fans or horizontal row of blades at roof edge to capture air flow rising up and over building, & stand alone tower units.
Green Trends Influencing Warehousing

20 April 2010Supply Chain Management in
Turbulent Times
Page 58
Freese & Associates, Inc.
• Solar Power Stations• Atop Warehouses / DC’s …. Why…???
Large available flat areas - “just sit there”Solar panels not a great load factorYou pay only for the solar energy produced, at prices equal to or below current retail energy rates.
•Whole Foods Store, CA
•Staples Store
Green Trends Influencing Warehousing

20 April 2010Supply Chain Management in
Turbulent Times
Page 59
Freese & Associates, Inc.
Mega Trends – Shifting Demographics
China’s middle class has grown From 20% to 40% by 2020
By 2010, 450 million Indians will Have middle class incomes
95% of the world populationGrowth through 2050 will occurIn developing nations
Urban areas will produce nearly allOf the population growth over the Next 25 years

20 April 2010Supply Chain Management in
Turbulent Times
Page 60
Freese & Associates, Inc.
What To Do When Supply Chains Go Wrong

20 April 2010Supply Chain Management in
Turbulent Times
Page 61
Freese & Associates, Inc.
• Reducing vulnerability . . .
• Build in flexibility . . .
• Resilience can be a competitive advantage . . .
• When things go wrong . . .
Resilience

20 April 2010Supply Chain Management in
Turbulent Times
Page 62
Freese & Associates, Inc.
• Resilience, a notion borrowed from material science, represents the ability of a material to recover its original shape following a deformation.
• Resilience can be achieved through redundancy
• Flexible or agile supply chains can help a company not only withstand disruptions by adapting quickly to changing conditions, but also better respond to the day-to-day gyrations of the marketplace.
Globalization is stretching supply chains at a time when market volatility is on the increase, exposing companies to greater risk.
Resilience

20 April 2010Supply Chain Management in
Turbulent Times
Page 63
Freese & Associates, Inc.
• Reducing Costs and Eliminating Waste
• Energy Costs and Conservation
• The most popular definition of sustainability can be traced to a 1987 UN conference. It defined sustainable developments as those that "meet present needs without compromising the ability of future generations to meet their needs“ (WECD, 1987).
Sustainability

20 April 2010Supply Chain Management in
Turbulent Times
Page 64
Freese & Associates, Inc.
Sustainability

20 April 2010Supply Chain Management in
Turbulent Times
Page 65
Freese & Associates, Inc.
75 % of the Global 100 Companies Issue Sustainability Reports

20 April 2010Supply Chain Management in
Turbulent Times
Page 66
Freese & Associates, Inc.
Trust
KEY ISSUES IMPACTINGSUPPLY CHAIN MANAGEMENT
Financial Markets
Multiple Supply Chains

20 April 2010Supply Chain Management in
Turbulent Times
Page 67
Freese & Associates, Inc.
Information Challenges
Managing Relationships
Old-line Management
20 April 2010Supply Chain Management in
Turbulent Times
Page 68
Freese & Associates, Inc.
Freese & Associates, Inc.www.FreeseInc.com