Customs Index with the support of the InMind research company EBA Customs INDEX Based on I/II...
13
Customs Index Customs Index with the support of the InMind research company EBA Customs INDEX EBA Customs INDEX Based on I/II quarter 2010 Conducted by EBA with the support of InMind research company February 2011
-
Upload
benedict-cummings -
Category
Documents
-
view
225 -
download
0
Transcript of Customs Index with the support of the InMind research company EBA Customs INDEX Based on I/II...
Customs IndexCustoms Index with the support of theInMind research company
EBA Customs INDEXEBA Customs INDEXBased on I/II quarter 2010
Conducted by EBA
with the support of
InMind research company
February 2011
Customs IndexCustoms Index with the support of theInMind research company
Project Project methodology (1)methodology (1)
The presented results of the EBA Customs Index are based on the 1st wave of expert poll conducted among the EBA Customs Committee members.
Methodology: The EBA Customs Index is the set of 4 indicators of customs procedures evaluations by the companies that interacted with the customs:
• Average number of days spent for customs clearance of one shipment
• Rate of goods physical inspections (%)
• Total number of rejections to apply 1st customs valuation method (share of total customs declarations number, %)
• Average number of documents per one shipment
On top of it customs procedure simplification dynamics is added as evaluated by the CEOs as a part of EBA Investment Attractiveness Index.
2
Customs IndexCustoms Index with the support of theInMind research company
Project Project methodology (2)methodology (2)
The results are presented by each of 4 indicators separately as
• the average value for each indicator (mean) reflected in the charts and tables
• the numeric value separating the higher half of a sample, from the lower half (median)
The results are also split by:
Company type: a) only import/export produced goods, b) companies that also have local production; c) companies that provide service and import/export for own needs
Types of goods/services that company produces: a) consumer goods; b) industrial goods; c) services
Participants: 67 representatives of EBA members companies, Customs Committee members
Timing: Data collected in the 2nd half of 2010 and reflect situation in the 1st half of 2010
Survey Implementation: the Survey was conducted by EBA,
analytical support provided by InMind research company
3
Customs IndexCustoms Index with the support of theInMind research company
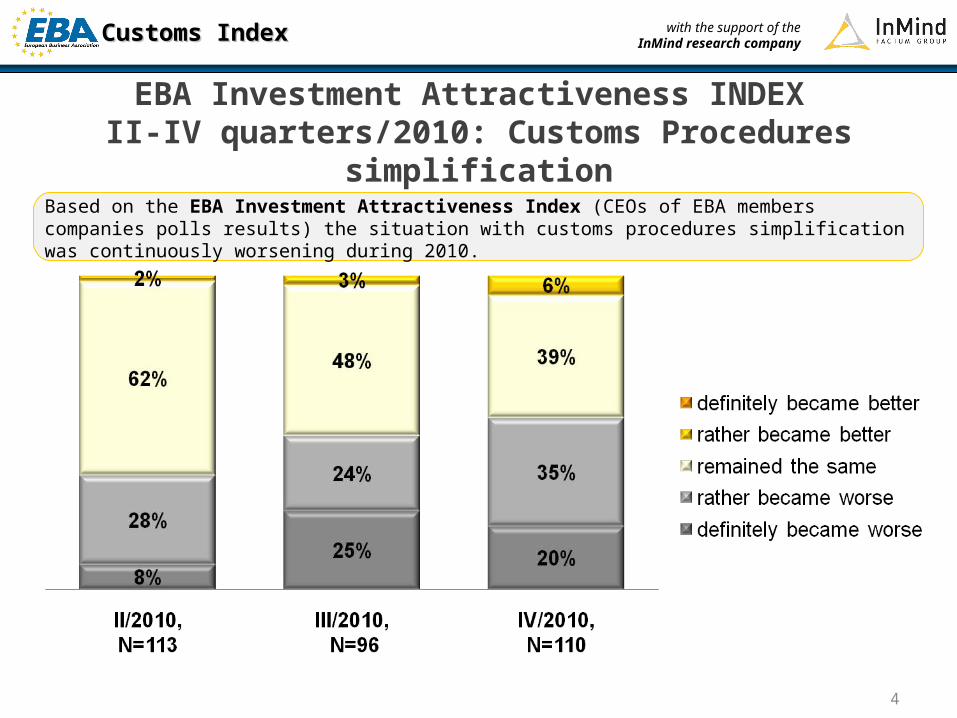
EBA Investment Attractiveness INDEX II-IV quarters/2010: Customs Procedures simplification
Based on the EBA Investment Attractiveness Index (CEOs of EBA members companies polls results) the situation with customs procedures simplification was continuously worsening during 2010.
4
Customs IndexCustoms Index with the support of theInMind research company
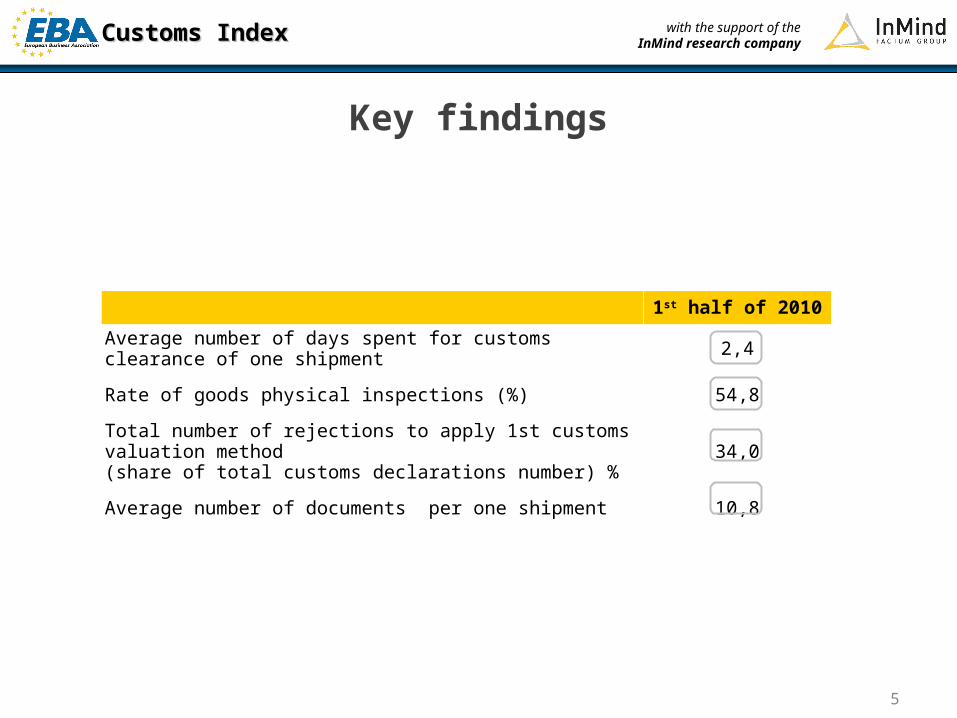
Key findings
1st half of 2010
Average number of days spent for customs clearance of one shipment 2,4
Rate of goods physical inspections (%) 54,8
Total number of rejections to apply 1st customs valuation method (share of total customs declarations number) %
34,0
Average number of documents per one shipment 10,8
5
Customs IndexCustoms Index with the support of theInMind research company
6
EBA Customs Index: EBA Customs Index:
Components
Customs IndexCustoms Index with the support of theInMind research company
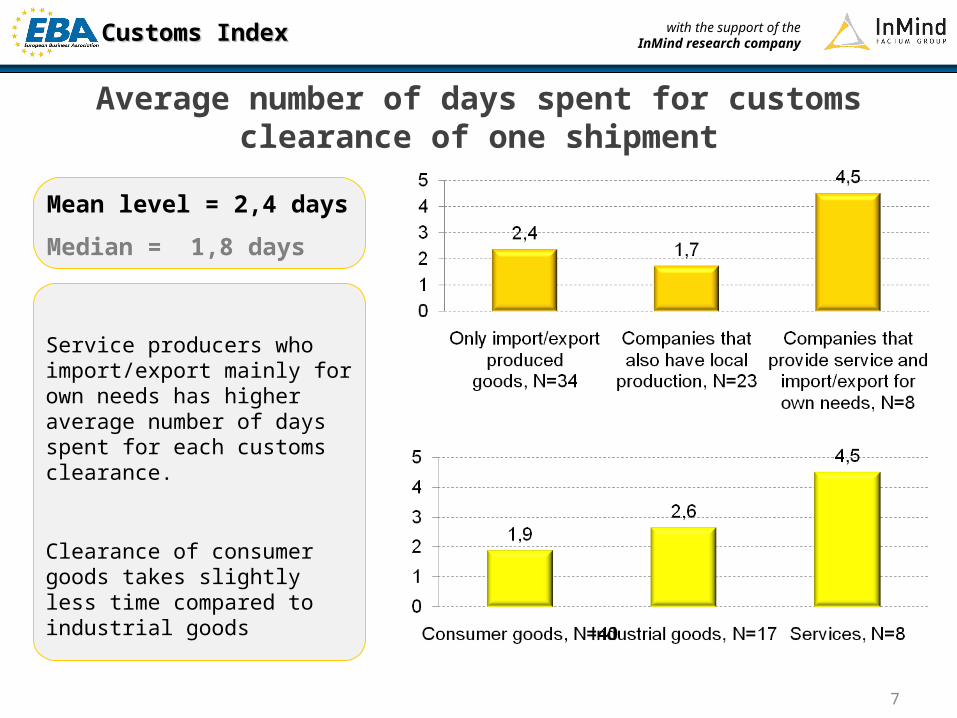
Average number of days spent for customs clearance of one shipment
Service producers who import/export mainly for own needs has higher average number of days spent for each customs clearance.
Clearance of consumer goods takes slightly less time compared to industrial goods
Mean level = 2,4 days
Median = 1,8 days
7
Customs IndexCustoms Index with the support of theInMind research company
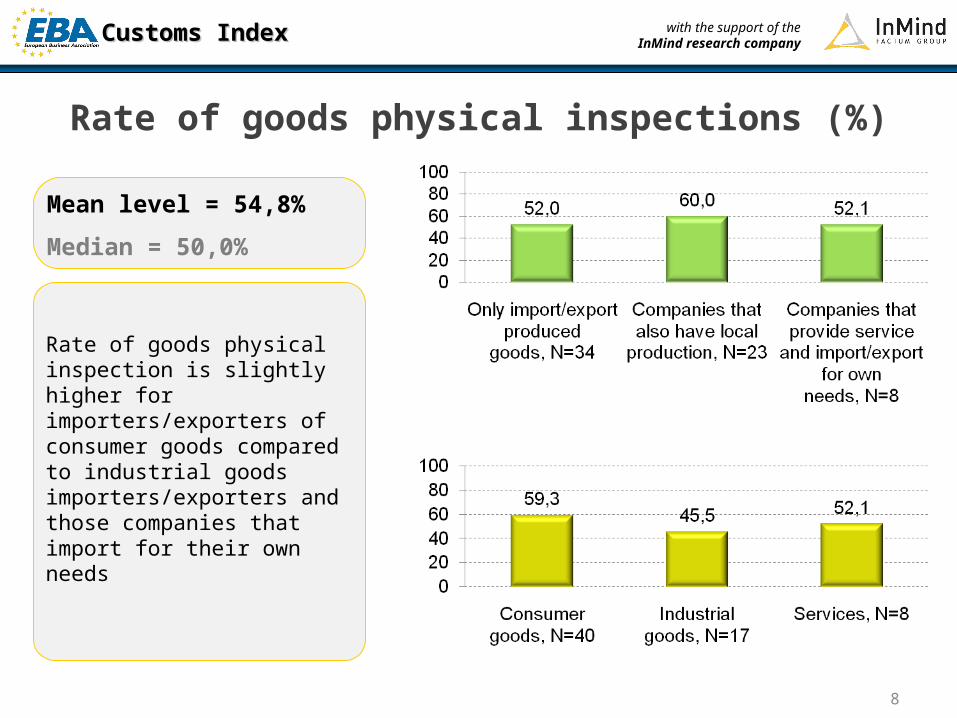
Rate of goods physical inspections (%)
Rate of goods physical inspection is slightly higher for importers/exporters of consumer goods compared to industrial goods importers/exporters and those companies that import for their own needs
Mean level = 54,8%
Median = 50,0%
8
Customs IndexCustoms Index with the support of theInMind research company
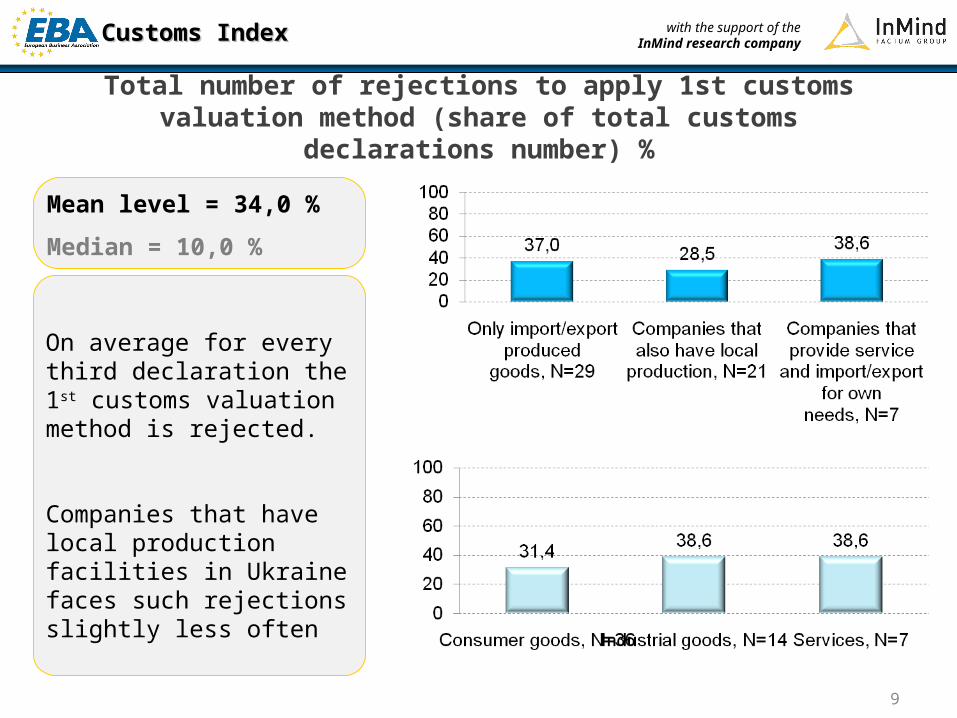
Total number of rejections to apply 1st customs valuation method (share of total customs declarations number) %
On average for every third declaration the 1st customs valuation method is rejected.
Companies that have local production facilities in Ukraine faces such rejections slightly less often
Mean level = 34,0 %
Median = 10,0 %
9
Customs IndexCustoms Index with the support of theInMind research company
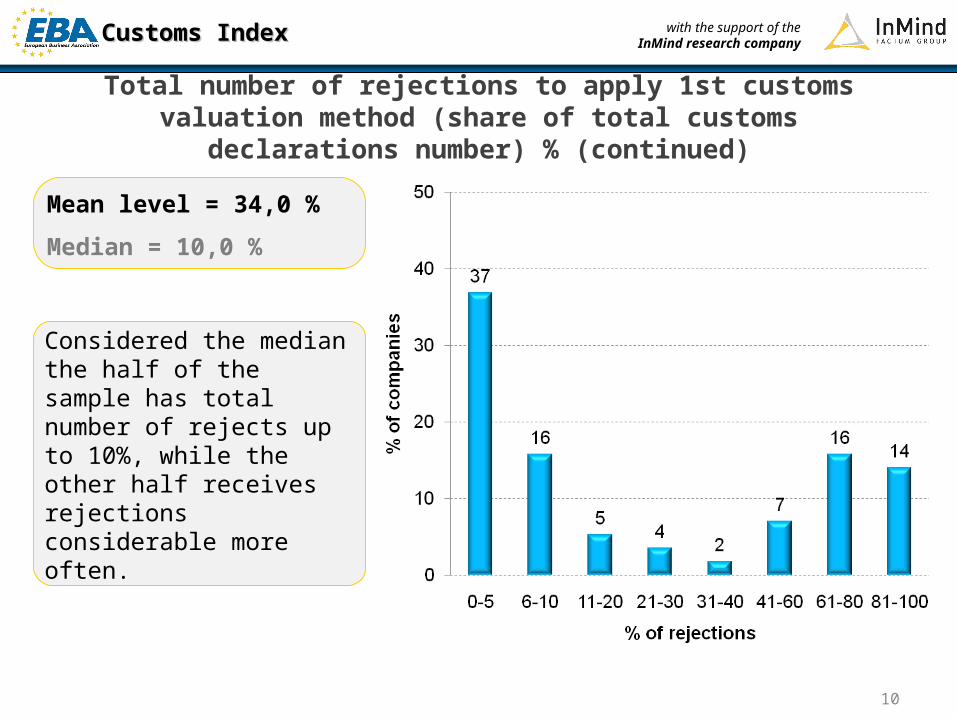
Total number of rejections to apply 1st customs valuation method (share of total customs declarations number) % (continued)
Considered the median the half of the sample has total number of rejects up to 10%, while the other half receives rejections considerable more often.
Mean level = 34,0 %
Median = 10,0 %
10
Customs IndexCustoms Index with the support of theInMind research company
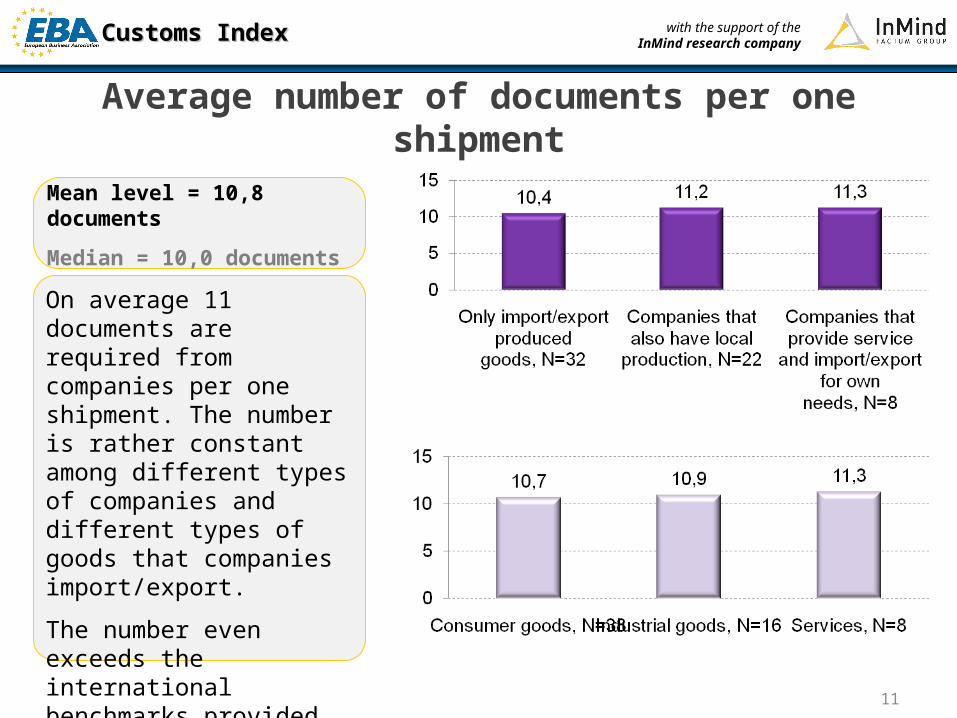
Average number of documents per one shipment
On average 11 documents are required from companies per one shipment. The number is rather constant among different types of companies and different types of goods that companies import/export.
The number even exceeds the international benchmarks provided for Ukraine (see the next slide)
Mean level = 10,8 documents
Median = 10,0 documents
11
Customs IndexCustoms Index with the support of theInMind research company
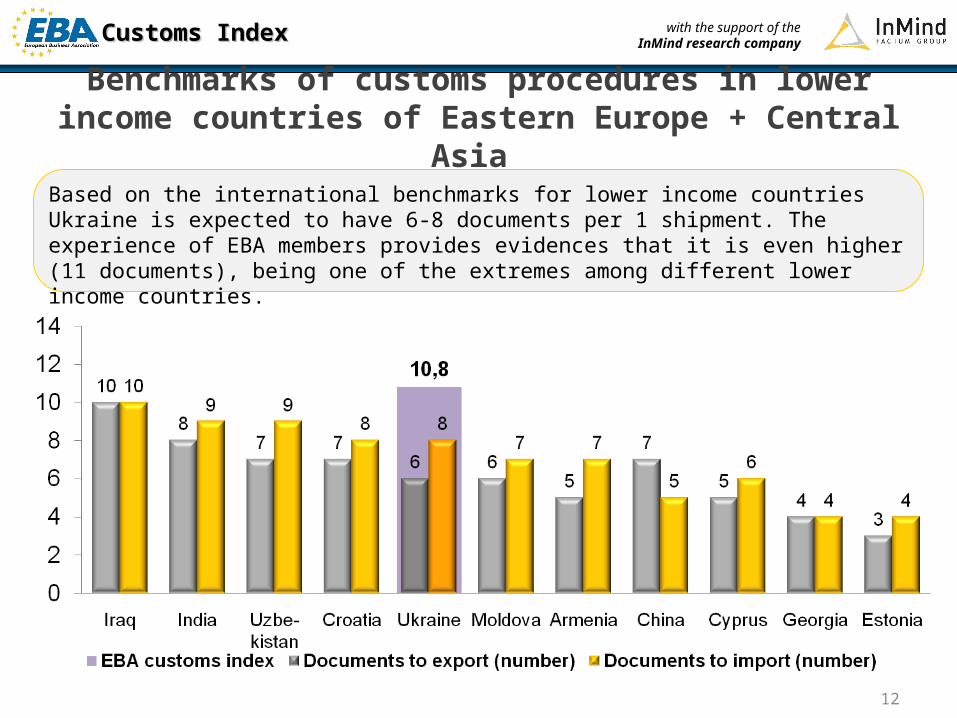
Benchmarks of customs procedures in lower income countries of Eastern Europe + Central Asia
Based on the international benchmarks for lower income countries Ukraine is expected to have 6-8 documents per 1 shipment. The experience of EBA members provides evidences that it is even higher (11 documents), being one of the extremes among different lower income countries.
12
Customs IndexCustoms Index with the support of theInMind research company
+38 044 496 06 01
www.eba.com.ua