Customs Administration Reform and Modernization in ... · PDF fileCustoms Administration...
45
Customs Administration Reform and Modernization in Anglophone Africa—Early 1990s to Mid-2010 Prepared by Justin Zake WP/11/184
Transcript of Customs Administration Reform and Modernization in ... · PDF fileCustoms Administration...
Customs Administration Reform and Modernization in Anglophone Africa—Early
1990s to Mid-2010
Prepared by Justin Zake
WP/11/184
© 2011 International Monetary Fund WP/11/184
IMF Working Paper
Fiscal Affairs Department
Customs Administration Reform and Modernization in Anglophone Africa— Early 1990s to Mid-2010
Prepared by Justin Zake
Authorized for distribution by Juan Toro
August 2011
Abstract
This Working Paper should not be reported as representing the views of the IMF. The views expressed in this paper are those of the author and do not necessarily represent those of the IMF or IMF policy. The assessments and findings describe research in progress by the author and are published to elicit comments and to further debate. Anglophone African countries have been implementing reform and modernization initiatives in their Customs administrations. This paper outlines the progression of key reform and modernization initiatives in these countries since the early 1990s, and assesses the gap between these reforms and those of more modern Customs agencies. The review suggests that Customs administration reform and modernization initiatives in Anglophone African countries generally lag behind international good practice and it is necessary to speed up implementation if revenue, trade facilitation, and trade chain security objectives are to be achieved. The findings also have implications on the design of reform programs and focus of potential technical assistance for the outstanding reform agenda. JEL Classification Numbers: H29, O57
Keywords: Anglophone African countries, Customs administration, reform and modernization.
Author’s E-Mail Address: [email protected]
2
Contents Page
Preface ........................................................................................................................................4
I. Background and Reform Context ...........................................................................................5
A. Basic Profile of Anglophone African Countries .......................................................5 B. Regional Trade Arrangements ..................................................................................6 C. Fiscal Importance of Customs Administrations in Anglophone Africa ....................8
II. The Customs Administration Reform Agenda ......................................................................9
A. Customs Administration Reform Challenges ...........................................................9 B. Characteristics of Modern Customs Administrations .............................................10 C. Customs Administration Reform Drivers ...............................................................11
III. Key Customs Administration Reforms in Anglophone Africa ..........................................13
A. Conformity with International Conventions and Standards ....................................13 B. Organizational Arrangements .................................................................................15 C. Ethics and Integrity .................................................................................................16 D. Tariff Reform ..........................................................................................................18 E. Customs Processes and Procedures .........................................................................18 F. Pre-shipment/Destination Inspection Services ........................................................23 G. Coordinated Border Management ...........................................................................23 H. Information Technology Reforms ...........................................................................24
IV. Broad Reform and Regional Trade Arrangement Impacts ................................................28
A. Impact on Revenue Mobilization ............................................................................28 B. Impact on Ethics and Integrity ................................................................................30 C. Impact of Regional Trade Arrangements ................................................................31
V. The Outstanding Reforms Agenda ......................................................................................32 A. Outstanding Reforms ..............................................................................................32 B. Conclusion ...............................................................................................................32
Tables 1. Anglophone African Countries: Membership of Regional Trade Organizations as of June 2010...................................................................................................................7 2. Percentage of Import Duties to Total Tax Revenue ...............................................................8 3. Traditional Compared to Modern Customs Administration ................................................12 4. Anglophone Africa Country Accession to Select International Organizations, Conventions, and Standards .............................................................................................14 5. Customs and Other Import Duties for Selected Countries—Pre and Post ACV Implementation of the Agreement on Customs Valuation ..............................................20 6. Efficiency Rating of Customs Processes in Anglophone Africa between 2006 and 2009 ..21 7. Large Importers Contributing 70-80 Percent of Customs Revenue .....................................22
3
8. Automated Customs Administration Systems in Anglophone African Countries at mid-June 2010 ..............................................................................................................25 9. Comparing Control of Corruption, Collected Customs Tariff, and Customs Efficiency ....30 10. Summary of Outstanding Customs Administration Reform Areas ...................................34 Figures 1. High-Level Illustration of the International Trade Supply Chain ........................................11 2. Control of Corruption in Anglophone Africa ......................................................................17 3. All Anglophone Africa—Merchandise Imports and Customs Duties .................................28 4. Country Profiles—Collected Customs Tariff Rate .............................................................29 Boxes 1. Basic Principles and Expected Benefits of Customs Administration Reform .....................12 2. Some Challenges Encountered in Customs Administration Automation ............................27 Appendixes 1. Selected Characteristics of Anglophone African Countries ................................................36 2. Selected Trade and Customs Statistics ................................................................................38 Appendix Tables 1. Merchandise Imports as a Percentage of GDP ....................................................................38 2. Customs and Other Import Duties as a Percentage of Total Tax Revenue ..........................39 3. Customs and Other Import Duties as a Percentage of GDP ................................................40 4. Collected Customs Tariff Rate .............................................................................................41
References ................................................................................................................................42
4
PREFACE
Purpose of the paper
To take stock of Customs administration reform and modernization in Anglophone Africa, identify gaps, and propose a way forward. Globally, Customs administration has undergone tremendous transformation since the early 1990s, moving from trade transactions management for revenue purposes on one hand, to trade facilitation, protection of society, and security of the international trade supply chain on the other. Anglophone African countries1 have also been implementing reform and modernization initiatives in their Customs administrations, with mixed results. Duty revenue (and other taxes) from international trade remains a critical contributor to the national budgets of these countries. This paper outlines the progression of key reform and modernization initiatives in Anglophone African country Customs administrations since the early 1990s and assesses the gap between these reforms and those of more modern Customs agencies. The findings also have implications on the design of reform programs and focus of potential technical assistance (TA) for the outstanding reform agenda. Methodology/approach
This is largely a qualitative study that relies on secondary information comprising IMF country TA reports, and review of relevant Customs administration country and other international organizations literature. Findings
The review suggests that, in general, Customs administration reform and modernization initiatives in Anglophone African countries lag behind international good practice and it is necessary to step up the tempo in order to compete effectively in the global trade arena. The most prominent reform initiatives undertaken include: tariff reform and automation of Customs processes. Outstanding reforms include: organizational structure development, particularly strengthening headquarters oversight of operations; use of intelligence and risk management approaches to improve compliance; and improving trade facilitation arrangements. From the experience of the Fiscal Affairs Department (FAD) field missions and anecdotal evidence, some of the key issues hindering faster reform pace include: low levels of political commitment; human resource capacity and skills gaps; and inadequate resources to finance the reform effort.
1 For this paper, Anglophone African countries include: Botswana, The Gambia, Ghana, Kenya, Lesotho, Liberia, Malawi, Mauritius, Namibia, Nigeria, Rwanda, Seychelles, Sierra Leone, South Africa, Swaziland, Tanzania, Uganda, Zambia, and Zimbabwe.
5
I. BACKGROUND AND REFORM CONTEXT
The socioeconomic environment in which Customs (and tax) administrations operate can have an impact on reform direction and the implementation pace. This section sets the context of Customs administration reform in Anglophone Africa from the early 1990s to mid-2010. It outlines the key country characteristics—social, economic, and development characteristics.
A. Basic Profile of Anglophone African Countries
The broad characteristics of the 19 Anglophone African countries are outlined below, with supporting details provided in Appendix I. It should be noted that Zimbabwe is a rather unique case and the footnote2 outlines the country’s circumstances that should be borne in mind when reading this paper.
Population—in 1990, the total Anglophone Africa population was about 220 million people (4.2 percent of the world population). Estimates for 2009 put the population at about 335 million or 4.9 percent of the world population, an increase of 50 percent over 1990. The population of these countries ranges from 87,000 in Seychelles to 150 million in Nigeria.
Income grouping—the world average GDP per capita in 2008 is estimated at about US$9,000, and the Anglophone African country average at about US$2,300 (see Appendix I–1.2). The majority of Anglophone African countries are below these averages—the median country is Lesotho at US$804—reflecting the relatively lower level of development.
Extractive natural resource endowment—all countries except Mauritius are either already well endowed and exploiting their mineral wealth (Botswana, Nigeria, South Africa, Tanzania, and Zambia) or are in the process of exploring this wealth (e.g., oil exploration is underway in The Gambia, Ghana, Kenya, Rwanda, Seychelles (offshore), and Uganda). Experience shows that a number of African countries that rely heavily on natural resources in their revenue mobilization efforts have often neglected non-oil revenue reform and modernization. This observation is supported by Bornhorst, Gupta, and Thornton (2008) who found a statistically significant negative relation between government revenues from natural resources and revenues from other domestic sources, with a typical result being that a 1 percentage point increase in hydrocarbon revenue (in relation to GDP) lowers non-hydrocarbon revenues by about 0.2 percent.
2 Zimbabwe is emerging slowly from significant economic and social deterioration that occurred during the period 1999–2008. During this period, real GDP shrank by more than 40 percent, and inflation reached estimated at 500 billion percent in September 2008. In October/November 2008, the local currency (the Zimbabwe dollar) disappeared from circulation, and pricing of goods and services shifted to foreign currency units (mostly, the U.S. dollar and the South African rand). Dollarization (use of any foreign currency in domestic transactions in parallel with or instead of the domestic currency) helped stop hyperinflation. The government of national unity, formed in February 2009, started addressing the most pressing short-term economic recovery needs under the Short-Term Emergency Recovery Program (STERP).
6
Post-conflict and low income countries under stress—post-conflict Anglophone African countries include Liberia, Rwanda, and Sierra Leone. The Gambia, Nigeria, and Sierra Leone are considered to be marginally fragile while Liberia and Zimbabwe are classified as severely stressed.3
The structure of the economy has implications for revenue mobilization and consequently, the degree to which reform and modernization needs to be undertaken. The broad economic structures of the Anglophone African countries (2008 and 2009 estimates—Appendix I–1.2) suggests that on average, agriculture contributes about 25 percent of the economy, industry 28 percent, and services 47 percent.
Tax to GDP ratio—for the period under review, the average non-oil tax to GDP ratio of the Anglophone African countries is about 21 percent (Appendix I–1.2), just below the World average of 23 percent. Countries with a ratio above the 20.5 percent average include Botswana, Ghana, Lesotho, Namibia, Seychelles, South Africa, Swaziland, and Liberia. At the extreme end is Zimbabwe with a non-oil tax contribution of 3.3 percent, but with high expectations of recovery to above 20 percent in 2010 onward. The seemingly high average tax to GDP ratios hides country-by-country differences and many continue to run fiscal deficits (see also Fofack, 2010).
Governance indicators—political commitment is an important prerequisite to successful reform and modernization programs. Existence of good governance arrangements can be an indicator of the extent to which this commitment is likely to be forthcoming and, consequently, the potential for successful reform. Appendix I–1.3 provides a cross-sectional comparison of six governance indicators computed by the World Bank for 1998 and 2008.4 On average, governance within the Anglophone African countries appears to have improved slightly from -0.43 to -0.30 between 1998 and 2008 (see consolidated index in the last column of Appendix I–1.3). Mauritius and Botswana, Namibia and South Africa have the better governance indices in the Anglophone African group, and Sierra Leone, Liberia, Nigeria, and Zimbabwe come off worst.
B. Regional Trade Arrangements
Regional trading blocs are a common feature of trade arrangements in Anglophone Africa. In forming these blocs (Customs unions and free trade areas),5 the stated objective has always been economic cooperation for mutual benefit of member countries. All the Anglophone
3 The World Bank definition of low income countries under stress connotes fragile or chronically weak countries.
4 These indicators are: voice and accountability; political stability and the absence of violence or terrorism; effectiveness of government; regulatory quality; the rule of law; and control of corruption. 5 A Customs union is a free trade area, usually with a common external trade policy, no tariffs between member countries and a common external tariff (CET) applied to all nonmembers. Non-Customs union free trade areas do not have a CET but usually apply different quotas and tariffs among themselves.
7
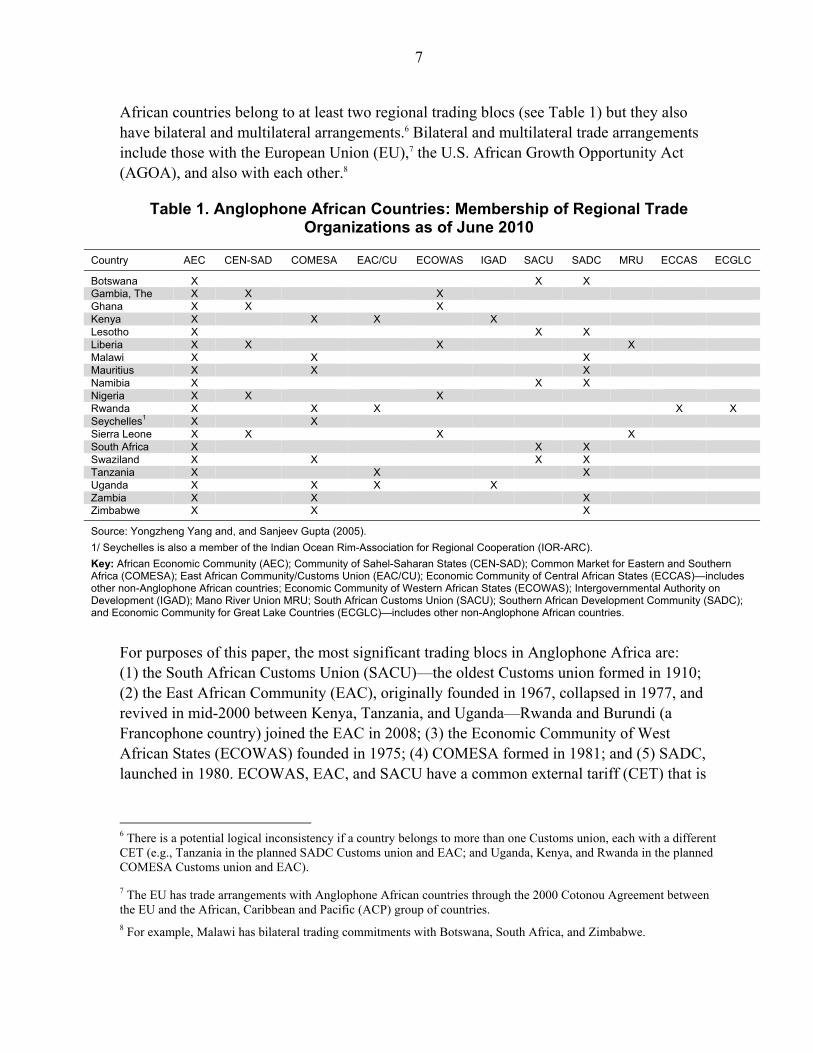
African countries belong to at least two regional trading blocs (see Table 1) but they also have bilateral and multilateral arrangements.6 Bilateral and multilateral trade arrangements include those with the European Union (EU),7 the U.S. African Growth Opportunity Act (AGOA), and also with each other.8
Table 1. Anglophone African Countries: Membership of Regional Trade Organizations as of June 2010
Country AEC CEN-SAD COMESA EAC/CU ECOWAS IGAD SACU SADC MRU ECCAS ECGLC
Botswana X X X Gambia, The X X X Ghana X X X Kenya X X X X Lesotho X X X Liberia X X X X Malawi X X X Mauritius X X X Namibia X X X Nigeria X X X Rwanda X X X X X Seychelles1 X X Sierra Leone X X X X South Africa X X X Swaziland X X X X Tanzania X X X Uganda X X X X Zambia X X X Zimbabwe X X X
Source: Yongzheng Yang and, and Sanjeev Gupta (2005).
1/ Seychelles is also a member of the Indian Ocean Rim-Association for Regional Cooperation (IOR-ARC).
Key: African Economic Community (AEC); Community of Sahel-Saharan States (CEN-SAD); Common Market for Eastern and Southern Africa (COMESA); East African Community/Customs Union (EAC/CU); Economic Community of Central African States (ECCAS)—includes other non-Anglophone African countries; Economic Community of Western African States (ECOWAS); Intergovernmental Authority on Development (IGAD); Mano River Union MRU; South African Customs Union (SACU); Southern African Development Community (SADC); and Economic Community for Great Lake Countries (ECGLC)—includes other non-Anglophone African countries.
For purposes of this paper, the most significant trading blocs in Anglophone Africa are: (1) the South African Customs Union (SACU)—the oldest Customs union formed in 1910; (2) the East African Community (EAC), originally founded in 1967, collapsed in 1977, and revived in mid-2000 between Kenya, Tanzania, and Uganda—Rwanda and Burundi (a Francophone country) joined the EAC in 2008; (3) the Economic Community of West African States (ECOWAS) founded in 1975; (4) COMESA formed in 1981; and (5) SADC, launched in 1980. ECOWAS, EAC, and SACU have a common external tariff (CET) that is
6 There is a potential logical inconsistency if a country belongs to more than one Customs union, each with a different CET (e.g., Tanzania in the planned SADC Customs union and EAC; and Uganda, Kenya, and Rwanda in the planned COMESA Customs union and EAC).
7 The EU has trade arrangements with Anglophone African countries through the 2000 Cotonou Agreement between the EU and the African, Caribbean and Pacific (ACP) group of countries. 8 For example, Malawi has bilateral trading commitments with Botswana, South Africa, and Zimbabwe.
8
used by member countries. It is only SACU that pools duty and excises on imports and shares them between the member countries using an agreed formula.9
C. Fiscal Importance of Customs Administrations in Anglophone Africa
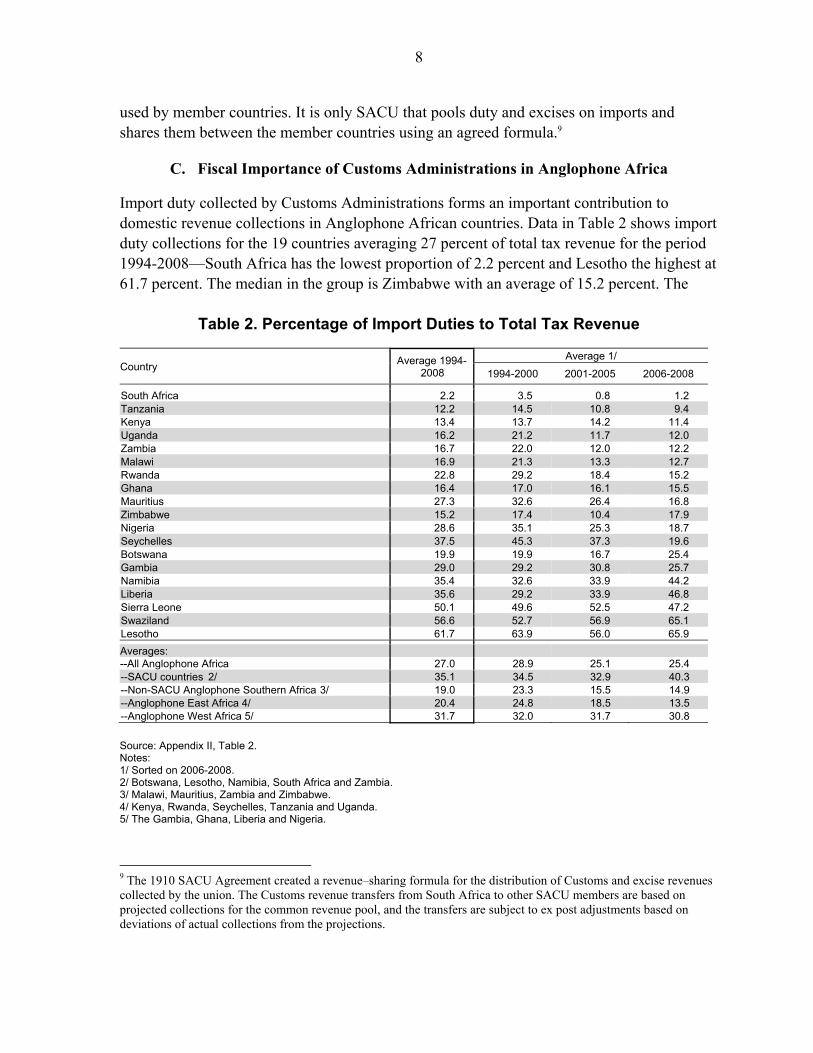
Import duty collected by Customs Administrations forms an important contribution to domestic revenue collections in Anglophone African countries. Data in Table 2 shows import duty collections for the 19 countries averaging 27 percent of total tax revenue for the period 1994-2008—South Africa has the lowest proportion of 2.2 percent and Lesotho the highest at 61.7 percent. The median in the group is Zimbabwe with an average of 15.2 percent. The
Table 2. Percentage of Import Duties to Total Tax Revenue
Country Average 1994-
2008
Average 1/
1994-2000 2001-2005 2006-2008
South Africa 2.2 3.5 0.8 1.2 Tanzania 12.2 14.5 10.8 9.4 Kenya 13.4 13.7 14.2 11.4 Uganda 16.2 21.2 11.7 12.0 Zambia 16.7 22.0 12.0 12.2 Malawi 16.9 21.3 13.3 12.7 Rwanda 22.8 29.2 18.4 15.2 Ghana 16.4 17.0 16.1 15.5 Mauritius 27.3 32.6 26.4 16.8 Zimbabwe 15.2 17.4 10.4 17.9 Nigeria 28.6 35.1 25.3 18.7 Seychelles 37.5 45.3 37.3 19.6 Botswana 19.9 19.9 16.7 25.4 Gambia 29.0 29.2 30.8 25.7 Namibia 35.4 32.6 33.9 44.2 Liberia 35.6 29.2 33.9 46.8 Sierra Leone 50.1 49.6 52.5 47.2 Swaziland 56.6 52.7 56.9 65.1 Lesotho 61.7 63.9 56.0 65.9
Averages: --All Anglophone Africa 27.0 28.9 25.1 25.4 --SACU countries 2/ 35.1 34.5 32.9 40.3 --Non-SACU Anglophone Southern Africa 3/ 19.0 23.3 15.5 14.9 --Anglophone East Africa 4/ 20.4 24.8 18.5 13.5 --Anglophone West Africa 5/ 31.7 32.0 31.7 30.8
Source: Appendix II, Table 2. Notes: 1/ Sorted on 2006-2008. 2/ Botswana, Lesotho, Namibia, South Africa and Zambia. 3/ Malawi, Mauritius, Zambia and Zimbabwe. 4/ Kenya, Rwanda, Seychelles, Tanzania and Uganda. 5/ The Gambia, Ghana, Liberia and Nigeria.
9 The 1910 SACU Agreement created a revenue–sharing formula for the distribution of Customs and excise revenues collected by the union. The Customs revenue transfers from South Africa to other SACU members are based on projected collections for the common revenue pool, and the transfers are subject to ex post adjustments based on deviations of actual collections from the projections.
9
SACU countries share from a pool of customs and other import duty revenue that includes import excise duties. As such, from an import tariff collections perspective, the non-SACU countries perhaps provide a better picture, with collections ranging from an average of 12.2 percent for Tanzania to 50.1 percent for Sierra Leone. Over the period, the non-SACU Anglophone Southern Africa group had the lowest average import duty collections to total tax revenue of 19.0 percent.
The fiscal importance of Customs administrations in Anglophone Africa (and elsewhere) is amplified by the fact that these agencies also collect value added or sales taxes on imports at country borders; they also manage country export transactions and related documentation. Certified import and export declarations provide evidence that enables Value Added Tax (VAT) registered traders to claim their input tax or claim refunds on filing their VAT returns to domestic tax administrations. Culpeper and Bhushan (July/August 2010, p. 5) infer the fiscal importance of customs administrations when they state that, “…most low-income countries (LIC) are heavily dependent on trade taxes as a source of revenue, in large part because they are the easiest taxes to collect. About a third of non-resource tax revenue in [Sub-Saharan Africa] SSA comes from trade taxes…”
II. THE CUSTOMS ADMINISTRATION REFORM AGENDA
The challenges of the 21st Century are placing massive demands on Customs administrations. Now, more than ever before, there is a need for Customs administrations to be more responsive. An understanding is required of issues such as globalization, the dynamics of international trade, the technicalities of the trade supply chain, emerging policy directions and the complexities of the global landscape.
Pravin Gordhan10
The basic strategy for modernizing Customs administration…is straightforward: establish transparent and simple rules and procedures [,] and foster voluntary compliance by building a system of self-assessment buttressed by well-designed audit policies. Implementing this, however, requires addressing a range of issues, involving links with trade policy, organizational reform, the use of new technologies, the appropriate nature and extent of private sector involvement, designing incentive systems to overcome governance issues—and many others.
Teresa Ter-Minassian11
A. Customs Administration Reform Challenges
The above conclusion by Gordhan in his treatise on the changing role of Customs administration is an apt introduction to the global challenges that Customs administrations 10 Pravin Gordhan, (March 2007). 11 Preface in: Michael Keen, ed. (2003).
10
face as borders become more open and responses to international trade changes become more pressing. Further, with the 2008/09 global economic crisis and the resultant stimulus packages, the need to preserve or create employment, and the attendant trade protectionism, puts a lot more pressure on Customs administrations to be responsive and deliver the administration of an increasing number of policy instruments.12 Ter-Minassian summarizes the strategic response to these challenges that is still valid today as it was when stated in 2003.
The role of Customs administration is increasingly focusing on trader facilitation and security of the trade supply chain, with revenue collection becoming a by-product. The September 11, 2001 terrorist attack on the United States heightened security concerns of the supply chain. A typical high-level flow of goods is depicted in Figure 1 (there are many variants), and the place of Customs (at origin and destination) in that chain. The trading community and Customs administrations have to cope with a multiplicity of buyers, suppliers, origins—and related rules that determine national product source and applicable tariffs, destinations, commodity types, and classification, valuation differences depending on a number of variables that include quality and origin, nontariff barriers—all-in-all, a complex and dynamic trade environment. Despite these complexities, knowledge of the supply chain, especially of the key players (origin and destination countries, intermediaries, and final consumers), is very important in planning the balance between trade facilitation, compliance management and security of the trade supply chain. In designing reform and modernization programs, Customs administrations are likely to quickly realize the tensions between, for example, the need to balance extensive pre-inspection of shipments with (for those countries that are more revenue-focused) the use of risk-based approaches that emphasize post-release controls.13
B. Characteristics of Modern Customs Administrations
The Revised Kyoto Convention is the generally accepted reference point for the key principles of Customs administration modernization. Use of these principles (summarized in Box 1) in designing and implementing a Customs administration reform programs results in a number of benefits14 that include: improved voluntary compliance; increased revenue (still an important national revenue contributor in Anglophone African countries); simplified processes and procedures; greater institutional efficiency; reduced transactions costs to government, trade and the Customs administration; and economic growth. Additionally, modernized Customs administrations usually exhibit the following characteristics: (1) self- 12 The Anglophone African countries have not been spared the global challenges and their Customs administrations are expected to respond accordingly, driven by the changing international trade terrain and domestic demands for efficiency. The 2008/09 global crisis also brings into focus the need to reduce the costs of doing business that include the implementation of concepts such as just-in-time inventory with Customs administrations providing the necessary facilitation. 13 See Lorenz, Akiva J. (February 28, 2008). 14 The benefits are also espoused by the International Chamber of Commerce in their drive for trade facilitation and efficiency in Customs, and in pursuit of an International Trade Facilitation Agreement that would define the responsibilities of governments involved in international trade transactions.
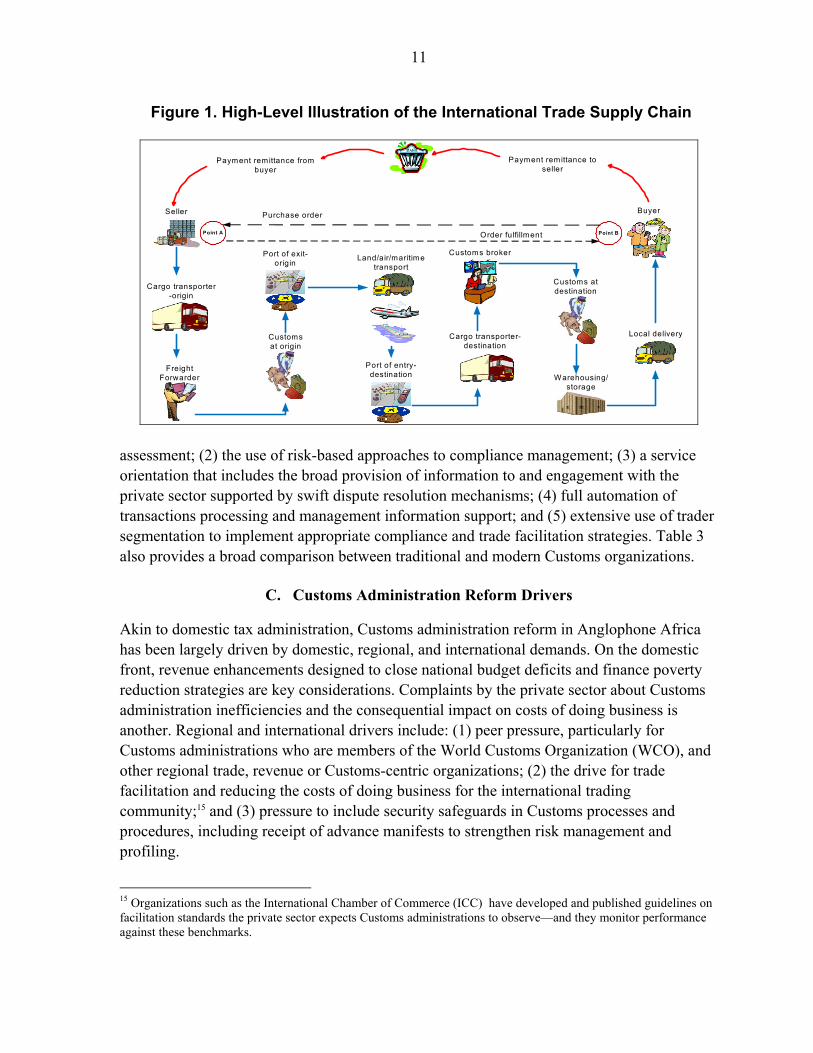
11
Figure 1. High-Level Illustration of the International Trade Supply Chain
Payment remittance from buyer
Payment remittance to seller
Seller
Freight Forwarder
Cargo transporter-origin
Port of exit-origin
Customs broker
Cargo transporter-destination
Customs atdestination
Customs at origin
Port of entry-destination
Land/air/maritimetransport
Warehousing/ storage
Buyer
Point A Point B
Purchase order
Order fulfillment
Local delivery
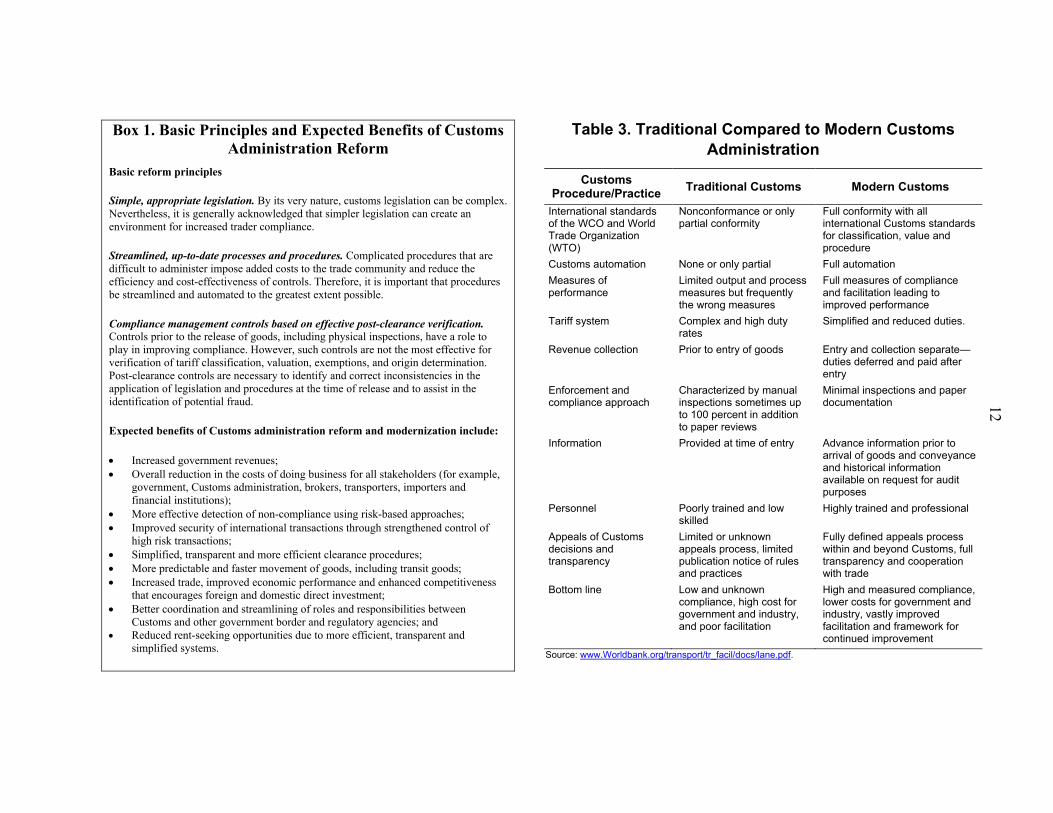
assessment; (2) the use of risk-based approaches to compliance management; (3) a service orientation that includes the broad provision of information to and engagement with the private sector supported by swift dispute resolution mechanisms; (4) full automation of transactions processing and management information support; and (5) extensive use of trader segmentation to implement appropriate compliance and trade facilitation strategies. Table 3 also provides a broad comparison between traditional and modern Customs organizations.
C. Customs Administration Reform Drivers
Akin to domestic tax administration, Customs administration reform in Anglophone Africa has been largely driven by domestic, regional, and international demands. On the domestic front, revenue enhancements designed to close national budget deficits and finance poverty reduction strategies are key considerations. Complaints by the private sector about Customs administration inefficiencies and the consequential impact on costs of doing business is another. Regional and international drivers include: (1) peer pressure, particularly for Customs administrations who are members of the World Customs Organization (WCO), and other regional trade, revenue or Customs-centric organizations; (2) the drive for trade facilitation and reducing the costs of doing business for the international trading community;15 and (3) pressure to include security safeguards in Customs processes and procedures, including receipt of advance manifests to strengthen risk management and profiling.
15 Organizations such as the International Chamber of Commerce (ICC) have developed and published guidelines on facilitation standards the private sector expects Customs administrations to observe—and they monitor performance against these benchmarks.
12
Box 1. Basic Principles and Expected Benefits of Customs Administration Reform
Basic reform principles
Simple, appropriate legislation. By its very nature, customs legislation can be complex. Nevertheless, it is generally acknowledged that simpler legislation can create an environment for increased trader compliance.
Streamlined, up-to-date processes and procedures. Complicated procedures that are difficult to administer impose added costs to the trade community and reduce the efficiency and cost-effectiveness of controls. Therefore, it is important that procedures be streamlined and automated to the greatest extent possible.
Compliance management controls based on effective post-clearance verification. Controls prior to the release of goods, including physical inspections, have a role to play in improving compliance. However, such controls are not the most effective for verification of tariff classification, valuation, exemptions, and origin determination. Post-clearance controls are necessary to identify and correct inconsistencies in the application of legislation and procedures at the time of release and to assist in the identification of potential fraud.
Expected benefits of Customs administration reform and modernization include:
Increased government revenues; Overall reduction in the costs of doing business for all stakeholders (for example,
government, Customs administration, brokers, transporters, importers and financial institutions);
More effective detection of non-compliance using risk-based approaches; Improved security of international transactions through strengthened control of
high risk transactions; Simplified, transparent and more efficient clearance procedures; More predictable and faster movement of goods, including transit goods; Increased trade, improved economic performance and enhanced competitiveness
that encourages foreign and domestic direct investment; Better coordination and streamlining of roles and responsibilities between
Customs and other government border and regulatory agencies; and Reduced rent-seeking opportunities due to more efficient, transparent and
simplified systems.
Table 3. Traditional Compared to Modern Customs Administration
Customs Procedure/Practice
Traditional Customs Modern Customs
International standards of the WCO and World Trade Organization (WTO)
Nonconformance or only partial conformity
Full conformity with all international Customs standards for classification, value and procedure
Customs automation None or only partial Full automation
Measures of performance
Limited output and process measures but frequently the wrong measures
Full measures of compliance and facilitation leading to improved performance
Tariff system Complex and high duty rates
Simplified and reduced duties.
Revenue collection Prior to entry of goods Entry and collection separate—duties deferred and paid after entry
Enforcement and compliance approach
Characterized by manual inspections sometimes up to 100 percent in addition to paper reviews
Minimal inspections and paper documentation
Information Provided at time of entry Advance information prior to arrival of goods and conveyance and historical information available on request for audit purposes
Personnel Poorly trained and low skilled
Highly trained and professional
Appeals of Customs decisions and transparency
Limited or unknown appeals process, limited publication notice of rules and practices
Fully defined appeals process within and beyond Customs, full transparency and cooperation with trade
Bottom line Low and unknown compliance, high cost for government and industry, and poor facilitation
High and measured compliance, lower costs for government and industry, vastly improved facilitation and framework for continued improvement
Source: www.Worldbank.org/transport/tr_facil/docs/lane.pdf.
13
III. KEY CUSTOMS ADMINISTRATION REFORMS IN ANGLOPHONE AFRICA
This section outlines the key reform initiatives in Anglophone Africa including: compliance with international conventions and standards, organizational arrangements, ethics and integrity, tariff reform, Customs processes and procedures, one-stop-border points (OSBPs) and information technology developments. The role of pre-shipment/destination inspection (PSI/DSI) services in Anglophone Africa’s Customs administration reform is discussed briefly.
A. Conformity with International Conventions and Standards
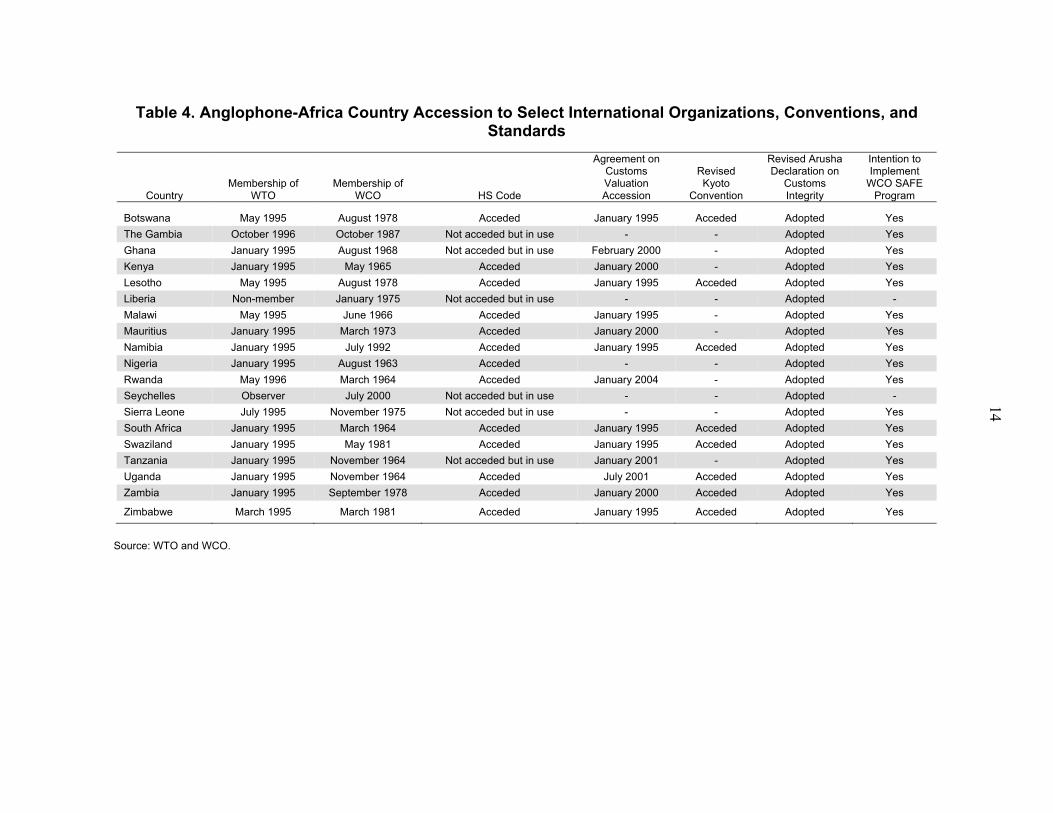
Globally, Customs administrations subscribe to a number of conventions and standards, the main ones being: (1) the Harmonized Commodity Description and Coding System (HS code); (2) the WTO Agreement on Customs Value (ACV); (3) the revised International Convention on the Simplification and Harmonization of Customs Procedures (Revised Kyoto Convention); (4) the revised Arusha Declaration on Customs Integrity; and (5) more recently the WCO Framework of Standards to Secure and Facilitate Global Trade (SAFE) program. Table 4 summarizes the conformity status of the countries.
Use of the HS code—as of end-July 2010, 138 countries worldwide had formally acceded to the use of the HS code—including 16 of the 19 Anglophone African countries. The exceptions are: The Gambia, Seychelles, and Sierra Leone—it would appear that these countries have just not got around to formally acceding to the convention. They nevertheless apply the HS code in their Customs operations but are technically not bound by the guidelines of the HS convention.16 Of the 16 acceding countries, only Kenya and Liberia were reported to be using the HS 2002 rather than the HS 2007 versions.17 Kenya has since (in July 2010) notified the WCO on the use of HS 2007.
The Revised Kyoto Convention—up to January 2010, the convention had 68 signatories worldwide of which only Botswana, Lesotho, Mauritius, Namibia, South Africa, Uganda, Zambia, and Zimbabwe are from Anglophone Africa. It is not clear why the other countries have not acceded to the convention because many of them subscribe to its principles. It should also be noted that accession imposes stricter accountabilities and is a legal act that binds the signatory to the obligations of the convention. From the available information and experience of FAD field missions to some Anglophone African countries, accession by some of the countries appears to be more of a formality than intent to implement the convention’s provisions. An audit of adherence to the Convention’s provisions would be very instructive.
16 In the event of disputes by traders in the nonsignatory countries, interpretation rulings by the WCO may not necessarily be binding on the country or trader unless they choose to do so. This could pose challenges for effective taxpayer services and trade facilitation. 17 WCO (June 26, 2010), “Position of Contracting Parties to the Harmonized System Convention and Non-Contracting Party Administrations.”
14
Table 4. Anglophone-Africa Country Accession to Select International Organizations, Conventions, and Standards
Country Membership of
WTO Membership of
WCO HS Code
Agreement on Customs Valuation Accession
Revised Kyoto
Convention
Revised Arusha Declaration on
Customs Integrity
Intention to Implement
WCO SAFE Program
Botswana May 1995 August 1978 Acceded January 1995 Acceded Adopted Yes
The Gambia October 1996 October 1987 Not acceded but in use - - Adopted Yes
Ghana January 1995 August 1968 Not acceded but in use February 2000 - Adopted Yes
Kenya January 1995 May 1965 Acceded January 2000 - Adopted Yes
Lesotho May 1995 August 1978 Acceded January 1995 Acceded Adopted Yes
Liberia Non-member January 1975 Not acceded but in use - - Adopted -
Malawi May 1995 June 1966 Acceded January 1995 - Adopted Yes
Mauritius January 1995 March 1973 Acceded January 2000 - Adopted Yes
Namibia January 1995 July 1992 Acceded January 1995 Acceded Adopted Yes
Nigeria January 1995 August 1963 Acceded - - Adopted Yes
Rwanda May 1996 March 1964 Acceded January 2004 - Adopted Yes
Seychelles Observer July 2000 Not acceded but in use - - Adopted -
Sierra Leone July 1995 November 1975 Not acceded but in use - - Adopted Yes
South Africa January 1995 March 1964 Acceded January 1995 Acceded Adopted Yes
Swaziland January 1995 May 1981 Acceded January 1995 Acceded Adopted Yes
Tanzania January 1995 November 1964 Not acceded but in use January 2001 - Adopted Yes
Uganda January 1995 November 1964 Acceded July 2001 Acceded Adopted Yes
Zambia January 1995 September 1978 Acceded January 2000 Acceded Adopted Yes
Zimbabwe March 1995 March 1981 Acceded January 1995 Acceded Adopted Yes
Source: WTO and WCO.
15
The WTO Agreement on Customs Valuation (ACV)—by June 2010, 17 of the 19 Anglophone African countries were full members of the WTO. The exceptions were Liberia (has observer status), and Seychelles. Further, other than The Gambia, Liberia, Nigeria, and Seychelles which are still using the Brussels Definition of Value, the other 15 countries are currently using ACV. All the five SACU member countries, Malawi and Zimbabwe implemented the ACV at its inception (January 1995) as they were already using the transactions value-based GATT valuation code in their Customs operations. The other 10 Anglophone African countries invoked the five-year grace period to allow for capacity building and adjustment. The SACU members use FOB country of export as the valuation base while the others use cost, insurance, and freight (CIF) value at destination. There is anecdotal evidence that many of the countries do not implement strictly the provisions of ACV and this has often led to disputes with the trading community.
WCO SAFE program and related developments—as of May 2010, all the 19 Anglophone African countries had expressed their intention to implement the SAFE program. By the same date, the WCO had conducted needs assessment (diagnostic) missions (Phase I) in all the countries except Liberia and Seychelles. Further assistance is being provided in Phase II to 12 of the 17 Phase I beneficiary countries other than Botswana, The Gambia, Namibia, Sierra Leone, and Zimbabwe. Phase II assistance includes, amongst others, capacity-building in strategic planning, post-clearance audit (PCA), trade facilitation, information and communication technology, the framework of standards, and change management.
B. Organizational Arrangements18
Administratively integrated Customs and tax administrations are dominant in Anglophone Africa. Other than Liberia and Nigeria, which have separate tax and Customs agencies, the other countries bring the administration of Customs and tax under one organization—a revenue authority. The revenue authority model was implemented starting with Uganda in 1991, and quickly spread to the other countries, generally spurred on by development partners, particularly the United Kingdom’s Department of International Development (DfID). Ghana is the most recent country (2009) to adopt the revenue authority governance model combining a number of separate revenue services for value-added tax (VAT), income tax and Customs under one structural umbrella—these services were hitherto coordinated by a central governing board under the ministry of finance. Customs operations are still run by a distinct Customs service within the revenue authorities except for South Africa and Zimbabwe where there is no clear corporate level organizational delineation between tax and Customs—distinct Customs houses and border management stations exist at the operational
18 A full treatise of organizational arrangements in Anglophone Africa is given in David Kloeden, forthcoming IMF Working Paper “Revenue Administration Reforms in Anglophone Africa since the Early-1990s.”
16
level. However, there are indications that both South Africa and Zimbabwe are moving toward a more distinct delineation of Customs operations.19
Some observations
Generally, headquarters operational policy functions are still poorly developed in Anglophone Africa with very centralized management practices which require all approvals/decisions to be referred upward to the highest levels of the organization. It is therefore not uncommon for the heads of Customs to intervene in the majority of cases, leaving very little time for strategic planning, articulation of value-adding directions and managing in a visionary manner. A headquarters structure, staffed with a small professional and experienced team adds critical value to the organization by: (a) developing and documenting the operational policies and procedures to ensure their consistent application throughout the organization; (b) developing and disseminating strategic and operational plans to the field delivery offices; and (c) using appropriate indicators to monitor operational performance against plans. Through this kind of feedback, improvements to policies, processes, and procedures can be made.
C. Ethics and Integrity
Corruption in Africa generally, and in Customs administration specifically, has been widely documented (for example, see Stasavage and Daubrée, 1998, and Hors, 2001). The demand and receipt of bribes by revenue administration staff subverts tax compliance, undermines governance, and concerns many stakeholders. Organizations such as Transparency International have prominently exposed the issue of corruption. All the Anglophone African countries are signatories to the revised Arusha Declaration on Integrity in Customs that tasks individual member countries to implement the framework.20 Measures taken by some of the countries and revenue agencies/Customs administrations include: (1) passage of national anticorruption legislation; (2) creation of anticorruption agencies or Ombudsmen offices; (3) development of revenue agency-specific anticorruption strategies that are aligned to national policy; (4) increased accountability through national auditor general investigations and representation before parliamentary accountability committees; (5) declaration of assets
19 South Africa restructured Customs operations and appointed (in 2008) a chief officer in charge of Customs and border management, and a structure that includes: (a) a headquarters division responsible Customs strategy and policy; (b) another in charge of Customs operations; and (c) a third in charge of border management and coordination with other border agencies. Zimbabwe started implementing restructuring plans from August 2010. 20 The Arusha declaration on integrity in Customs administration was adopted in its previous (1993) and revised (2003) form by all member countries of the WCO including the Anglophone African countries. The declaration consists of elements considered essential for the development and implementation of a comprehensive anti-corruption and integrity program. These are: leadership and commitment; regulatory framework; transparency; automation; reform and modernization; audit and investigation; code of conduct; HR management; morale and organizational culture; and relationship with the private sector. Collectively, the ten key elements are designed to reduce monopoly power and the inappropriate use of official discretion, while concurrently increasing the level of practical accountability. See WCO.
17
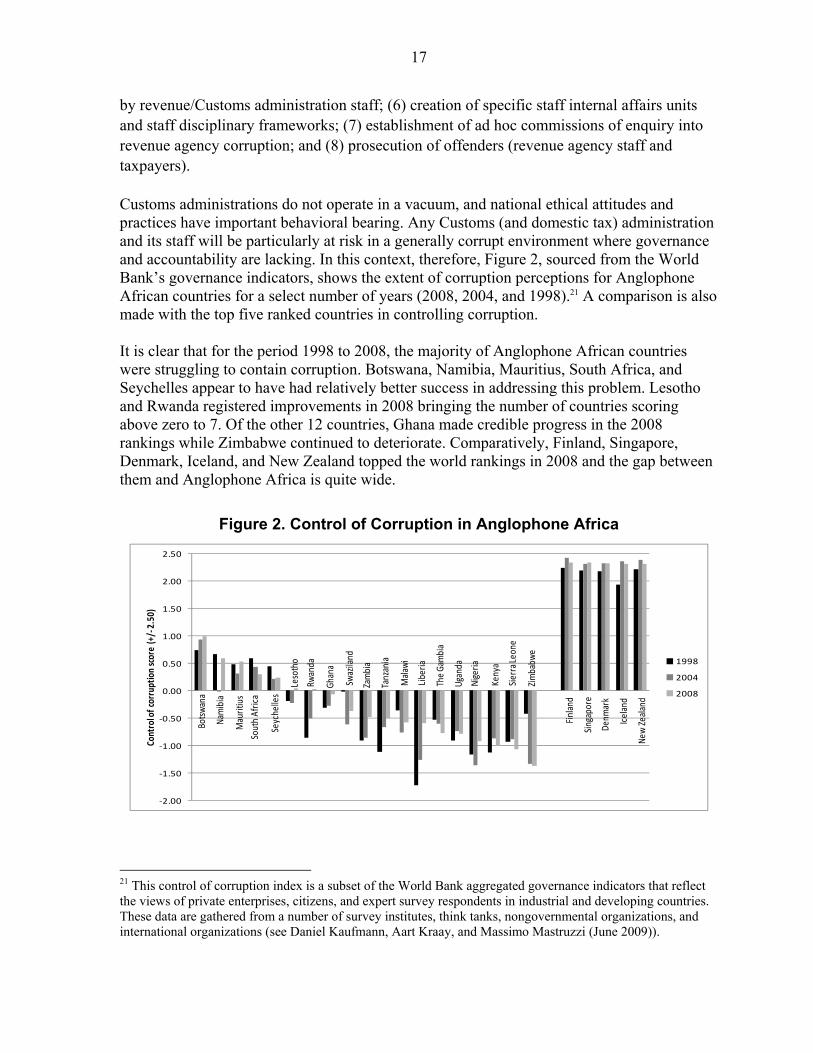
by revenue/Customs administration staff; (6) creation of specific staff internal affairs units and staff disciplinary frameworks; (7) establishment of ad hoc commissions of enquiry into revenue agency corruption; and (8) prosecution of offenders (revenue agency staff and taxpayers). Customs administrations do not operate in a vacuum, and national ethical attitudes and practices have important behavioral bearing. Any Customs (and domestic tax) administration and its staff will be particularly at risk in a generally corrupt environment where governance and accountability are lacking. In this context, therefore, Figure 2, sourced from the World Bank’s governance indicators, shows the extent of corruption perceptions for Anglophone African countries for a select number of years (2008, 2004, and 1998).21 A comparison is also made with the top five ranked countries in controlling corruption. It is clear that for the period 1998 to 2008, the majority of Anglophone African countries were struggling to contain corruption. Botswana, Namibia, Mauritius, South Africa, and Seychelles appear to have had relatively better success in addressing this problem. Lesotho and Rwanda registered improvements in 2008 bringing the number of countries scoring above zero to 7. Of the other 12 countries, Ghana made credible progress in the 2008 rankings while Zimbabwe continued to deteriorate. Comparatively, Finland, Singapore, Denmark, Iceland, and New Zealand topped the world rankings in 2008 and the gap between them and Anglophone Africa is quite wide.
Figure 2. Control of Corruption in Anglophone Africa
Bots
wan
a
Nam
ibia
Mau
ritiu
s
Sout
h A
fric
a
Seyc
helle
s
Leso
tho
Rwan
da
Gha
na
Swaz
iland
Zam
bia
Tanz
ania
Mal
awi
Libe
ria
The
Gam
bia
Uga
nda
Nig
eria
Keny
a
Sier
ra L
eone
Zim
babw
e
Finl
and
Sing
apor
e
Den
mar
k
Icel
and
New
Zea
land
-2.00
-1.50
-1.00
-0.50
0.00
0.50
1.00
1.50
2.00
2.50
Cont
rol o
f co
rrup
tion
sco
re (
+/-2
.50)
1998
2004
2008
21 This control of corruption index is a subset of the World Bank aggregated governance indicators that reflect the views of private enterprises, citizens, and expert survey respondents in industrial and developing countries. These data are gathered from a number of survey institutes, think tanks, nongovernmental organizations, and international organizations (see Daniel Kaufmann, Aart Kraay, and Massimo Mastruzzi (June 2009)).
18
D. Tariff Reform
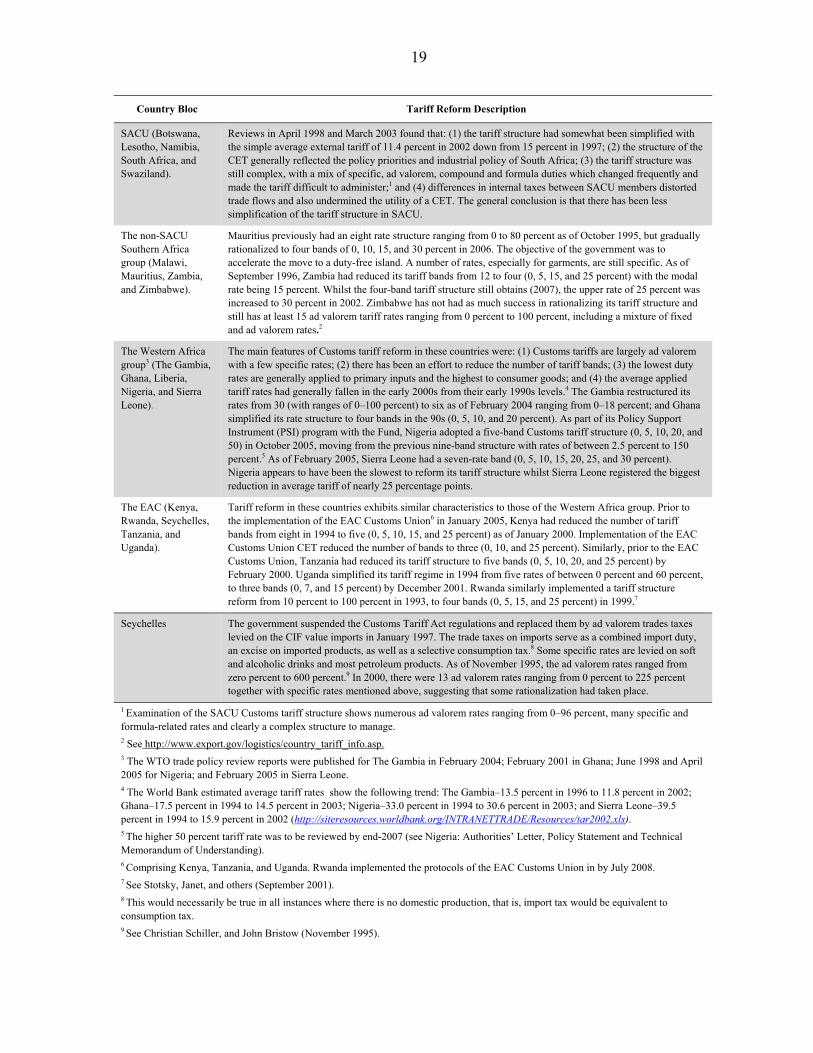
An important reform in Customs administration is usually the rationalization and simplification of the tariff structure. The extent of tariff reform in Anglophone Africa can be gleaned from the various trade policy reviews carried out in most of these countries22 by the WTO. A survey of these and IMF staff country and TA reports indicates that most of these countries rationalized, simplified, and reduced the number of tariff bands to enhance their external competitiveness and reduce discretionary behavior in their Customs administrations. The World Bank’s (2007) Global Monitoring Report confirms this general trend for a number of Anglophone African countries (Ghana, Nigeria, Kenya, Tanzania, and Zambia) during the period 2000–06 in which tariff reductions and overall trade restrictiveness is reported to have declined. A summary for each bloc of countries is shown in the matrix that follows (page 19).
On the whole, there appears to have been some effort in rationalizing the tariff structure by all countries. The impact on revenue has not been that significant though—the average Customs and other import duties as a percentage of GDP remained flat for the period 1994–2008 (see Appendix II, Table 4). It would also appear that more tariff rationalization is required by some Anglophone African countries, especially those in SACU.
E. Customs Processes and Procedures
The revised Kyoto Convention proposes that countries should reform existing Customs practices to further facilitate the movement of goods. Further, Customs administration should adopt modern business process re-engineering (transformation) techniques to identify inefficient or redundant activities for streamlining or elimination. Risk management approaches are strongly advocated as are special Customs clearance schemes for the most compliant traders. The use of PCA controls and information technology tools are strongly recommended (see also Keen (2003), Section 5).
Valuation reforms
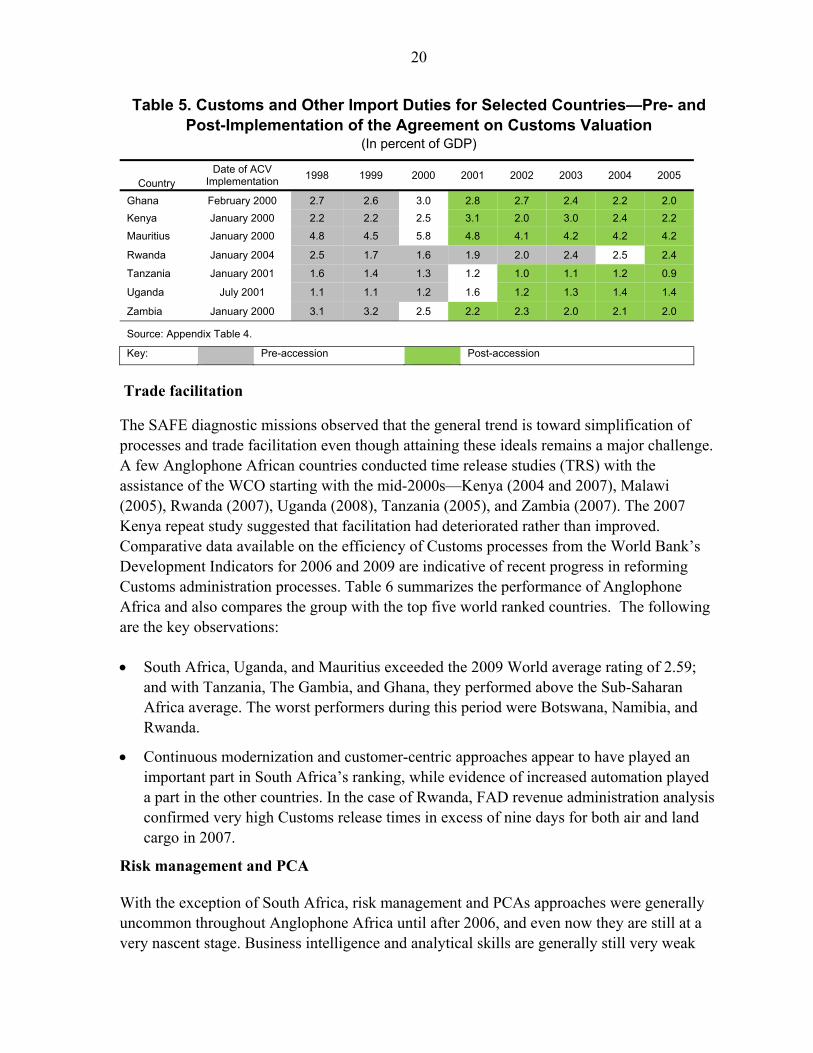
The WTO ACV—as outlined above, 17 of the 19 Anglophone African countries were full members of the WTO as of June 2010, with the exception of Liberia and Seychelles. Further, 10 Anglophone African countries concerned about the possible reduction in Customs revenue invoked the five-year grace period before implementing the principles of the ACV. However, the Customs revenue reduction concerns are generally not borne out. A review of pre- and post-accession Customs duty as a percentage of GDP for seven countries (see Table 5) suggests that: (1) revenue declines are evident pre-ACV implementation (Ghana, Mauritius, Rwanda, and Tanzania); and (2) some countries (Ghana, Mauritius, Rwanda, and Uganda) increased the revenue take during the year of implementation but none sustained it thereafter.
22 Trade policy reviews were yet to be carried out in Liberia and Seychelles. The main objective of these reviews was to recommend measures designed to increase the efficiency of trade and enhance the ability of countries to fulfill their international obligations including fulfilling WTO commitments.
19
Country Bloc Tariff Reform Description
SACU (Botswana, Lesotho, Namibia, South Africa, and Swaziland).
Reviews in April 1998 and March 2003 found that: (1) the tariff structure had somewhat been simplified with the simple average external tariff of 11.4 percent in 2002 down from 15 percent in 1997; (2) the structure of the CET generally reflected the policy priorities and industrial policy of South Africa; (3) the tariff structure was still complex, with a mix of specific, ad valorem, compound and formula duties which changed frequently and made the tariff difficult to administer;1 and (4) differences in internal taxes between SACU members distorted trade flows and also undermined the utility of a CET. The general conclusion is that there has been less simplification of the tariff structure in SACU.
The non-SACU Southern Africa group (Malawi, Mauritius, Zambia, and Zimbabwe).
Mauritius previously had an eight rate structure ranging from 0 to 80 percent as of October 1995, but gradually rationalized to four bands of 0, 10, 15, and 30 percent in 2006. The objective of the government was to accelerate the move to a duty-free island. A number of rates, especially for garments, are still specific. As of September 1996, Zambia had reduced its tariff bands from 12 to four (0, 5, 15, and 25 percent) with the modal rate being 15 percent. Whilst the four-band tariff structure still obtains (2007), the upper rate of 25 percent was increased to 30 percent in 2002. Zimbabwe has not had as much success in rationalizing its tariff structure and still has at least 15 ad valorem tariff rates ranging from 0 percent to 100 percent, including a mixture of fixed and ad valorem rates.2
The Western Africa group3 (The Gambia, Ghana, Liberia, Nigeria, and Sierra Leone).
The main features of Customs tariff reform in these countries were: (1) Customs tariffs are largely ad valorem with a few specific rates; (2) there has been an effort to reduce the number of tariff bands; (3) the lowest duty rates are generally applied to primary inputs and the highest to consumer goods; and (4) the average applied tariff rates had generally fallen in the early 2000s from their early 1990s levels.4 The Gambia restructured its rates from 30 (with ranges of 0–100 percent) to six as of February 2004 ranging from 0–18 percent; and Ghana simplified its rate structure to four bands in the 90s (0, 5, 10, and 20 percent). As part of its Policy Support Instrument (PSI) program with the Fund, Nigeria adopted a five-band Customs tariff structure (0, 5, 10, 20, and 50) in October 2005, moving from the previous nine-band structure with rates of between 2.5 percent to 150 percent.5 As of February 2005, Sierra Leone had a seven-rate band (0, 5, 10, 15, 20, 25, and 30 percent). Nigeria appears to have been the slowest to reform its tariff structure whilst Sierra Leone registered the biggest reduction in average tariff of nearly 25 percentage points.
The EAC (Kenya, Rwanda, Seychelles, Tanzania, and Uganda).
Tariff reform in these countries exhibits similar characteristics to those of the Western Africa group. Prior to the implementation of the EAC Customs Union6 in January 2005, Kenya had reduced the number of tariff bands from eight in 1994 to five (0, 5, 10, 15, and 25 percent) as of January 2000. Implementation of the EAC Customs Union CET reduced the number of bands to three (0, 10, and 25 percent). Similarly, prior to the EAC Customs Union, Tanzania had reduced its tariff structure to five bands (0, 5, 10, 20, and 25 percent) by February 2000. Uganda simplified its tariff regime in 1994 from five rates of between 0 percent and 60 percent, to three bands (0, 7, and 15 percent) by December 2001. Rwanda similarly implemented a tariff structure reform from 10 percent to 100 percent in 1993, to four bands (0, 5, 15, and 25 percent) in 1999.7
Seychelles The government suspended the Customs Tariff Act regulations and replaced them by ad valorem trades taxes levied on the CIF value imports in January 1997. The trade taxes on imports serve as a combined import duty, an excise on imported products, as well as a selective consumption tax.8 Some specific rates are levied on soft and alcoholic drinks and most petroleum products. As of November 1995, the ad valorem rates ranged from zero percent to 600 percent.9 In 2000, there were 13 ad valorem rates ranging from 0 percent to 225 percent together with specific rates mentioned above, suggesting that some rationalization had taken place.
1 Examination of the SACU Customs tariff structure shows numerous ad valorem rates ranging from 0–96 percent, many specific and formula-related rates and clearly a complex structure to manage. 2 See http://www.export.gov/logistics/country_tariff_info.asp. 3 The WTO trade policy review reports were published for The Gambia in February 2004; February 2001 in Ghana; June 1998 and April 2005 for Nigeria; and February 2005 in Sierra Leone. 4 The World Bank estimated average tariff rates show the following trend: The Gambia–13.5 percent in 1996 to 11.8 percent in 2002; Ghana–17.5 percent in 1994 to 14.5 percent in 2003; Nigeria–33.0 percent in 1994 to 30.6 percent in 2003; and Sierra Leone–39.5 percent in 1994 to 15.9 percent in 2002 (http://siteresources.worldbank.org/INTRANETTRADE/Resources/tar2002.xls). 5 The higher 50 percent tariff rate was to be reviewed by end-2007 (see Nigeria: Authorities’ Letter, Policy Statement and Technical Memorandum of Understanding). 6 Comprising Kenya, Tanzania, and Uganda. Rwanda implemented the protocols of the EAC Customs Union in by July 2008. 7 See Stotsky, Janet, and others (September 2001). 8 This would necessarily be true in all instances where there is no domestic production, that is, import tax would be equivalent to consumption tax. 9 See Christian Schiller, and John Bristow (November 1995).
20
Table 5. Customs and Other Import Duties for Selected Countries—Pre- and Post-Implementation of the Agreement on Customs Valuation
(In percent of GDP)
Country Date of ACV
Implementation 1998 1999 2000 2001 2002 2003 2004 2005
Ghana February 2000 2.7 2.6 3.0 2.8 2.7 2.4 2.2 2.0
Kenya January 2000 2.2 2.2 2.5 3.1 2.0 3.0 2.4 2.2
Mauritius January 2000 4.8 4.5 5.8 4.8 4.1 4.2 4.2 4.2
Rwanda January 2004 2.5 1.7 1.6 1.9 2.0 2.4 2.5 2.4
Tanzania January 2001 1.6 1.4 1.3 1.2 1.0 1.1 1.2 0.9
Uganda July 2001 1.1 1.1 1.2 1.6 1.2 1.3 1.4 1.4
Zambia January 2000 3.1 3.2 2.5 2.2 2.3 2.0 2.1 2.0
Source: Appendix Table 4.
Key: Pre-accession Post-accession
Trade facilitation
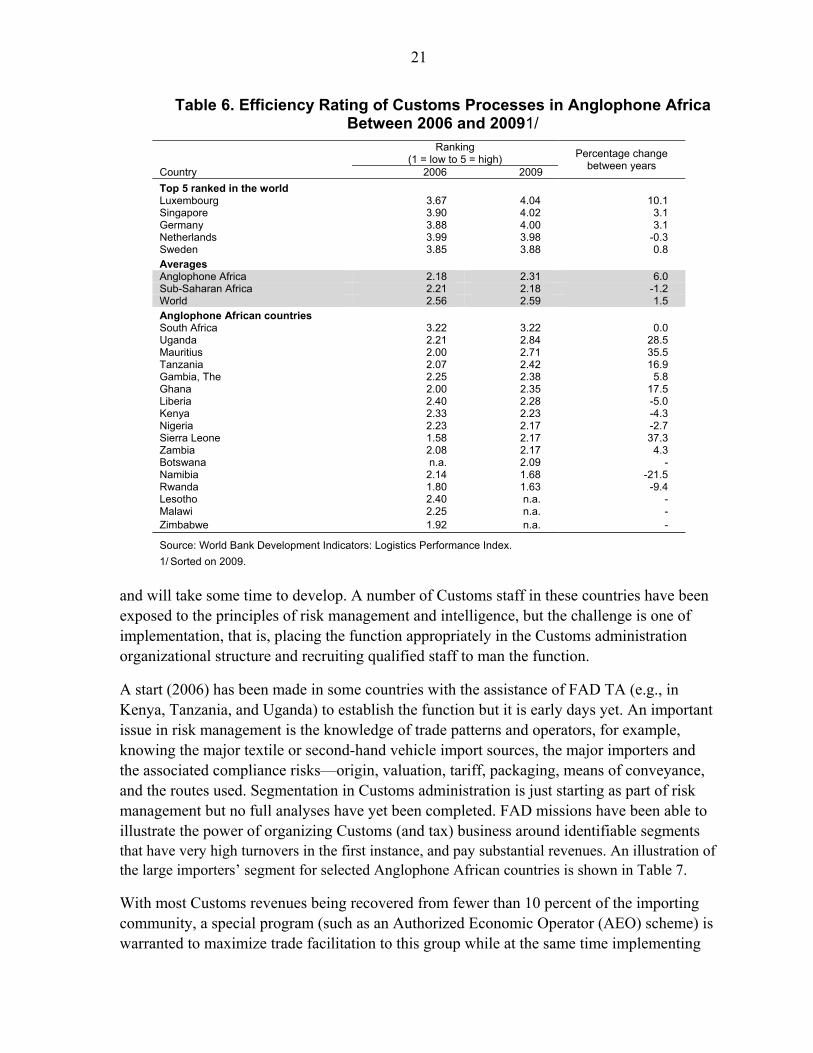
The SAFE diagnostic missions observed that the general trend is toward simplification of processes and trade facilitation even though attaining these ideals remains a major challenge. A few Anglophone African countries conducted time release studies (TRS) with the assistance of the WCO starting with the mid-2000s—Kenya (2004 and 2007), Malawi (2005), Rwanda (2007), Uganda (2008), Tanzania (2005), and Zambia (2007). The 2007 Kenya repeat study suggested that facilitation had deteriorated rather than improved. Comparative data available on the efficiency of Customs processes from the World Bank’s Development Indicators for 2006 and 2009 are indicative of recent progress in reforming Customs administration processes. Table 6 summarizes the performance of Anglophone Africa and also compares the group with the top five world ranked countries. The following are the key observations:
South Africa, Uganda, and Mauritius exceeded the 2009 World average rating of 2.59; and with Tanzania, The Gambia, and Ghana, they performed above the Sub-Saharan Africa average. The worst performers during this period were Botswana, Namibia, and Rwanda.
Continuous modernization and customer-centric approaches appear to have played an important part in South Africa’s ranking, while evidence of increased automation played a part in the other countries. In the case of Rwanda, FAD revenue administration analysis confirmed very high Customs release times in excess of nine days for both air and land cargo in 2007.
Risk management and PCA
With the exception of South Africa, risk management and PCAs approaches were generally uncommon throughout Anglophone Africa until after 2006, and even now they are still at a very nascent stage. Business intelligence and analytical skills are generally still very weak
21
Table 6. Efficiency Rating of Customs Processes in Anglophone Africa Between 2006 and 20091/
Ranking
(1 = low to 5 = high) Percentage change between years
Country 2006 2009
Top 5 ranked in the world Luxembourg 3.67 4.04 10.1 Singapore 3.90 4.02 3.1 Germany 3.88 4.00 3.1 Netherlands 3.99 3.98 -0.3 Sweden 3.85 3.88 0.8 Averages Anglophone Africa 2.18 2.31 6.0 Sub-Saharan Africa 2.21 2.18 -1.2 World 2.56 2.59 1.5 Anglophone African countries South Africa 3.22 3.22 0.0 Uganda 2.21 2.84 28.5 Mauritius 2.00 2.71 35.5 Tanzania 2.07 2.42 16.9 Gambia, The 2.25 2.38 5.8 Ghana 2.00 2.35 17.5 Liberia 2.40 2.28 -5.0 Kenya 2.33 2.23 -4.3 Nigeria 2.23 2.17 -2.7 Sierra Leone 1.58 2.17 37.3 Zambia 2.08 2.17 4.3 Botswana n.a. 2.09 - Namibia 2.14 1.68 -21.5 Rwanda 1.80 1.63 -9.4 Lesotho 2.40 n.a. - Malawi 2.25 n.a. - Zimbabwe 1.92 n.a. -
Source: World Bank Development Indicators: Logistics Performance Index.
1/ Sorted on 2009.
and will take some time to develop. A number of Customs staff in these countries have been exposed to the principles of risk management and intelligence, but the challenge is one of implementation, that is, placing the function appropriately in the Customs administration organizational structure and recruiting qualified staff to man the function.
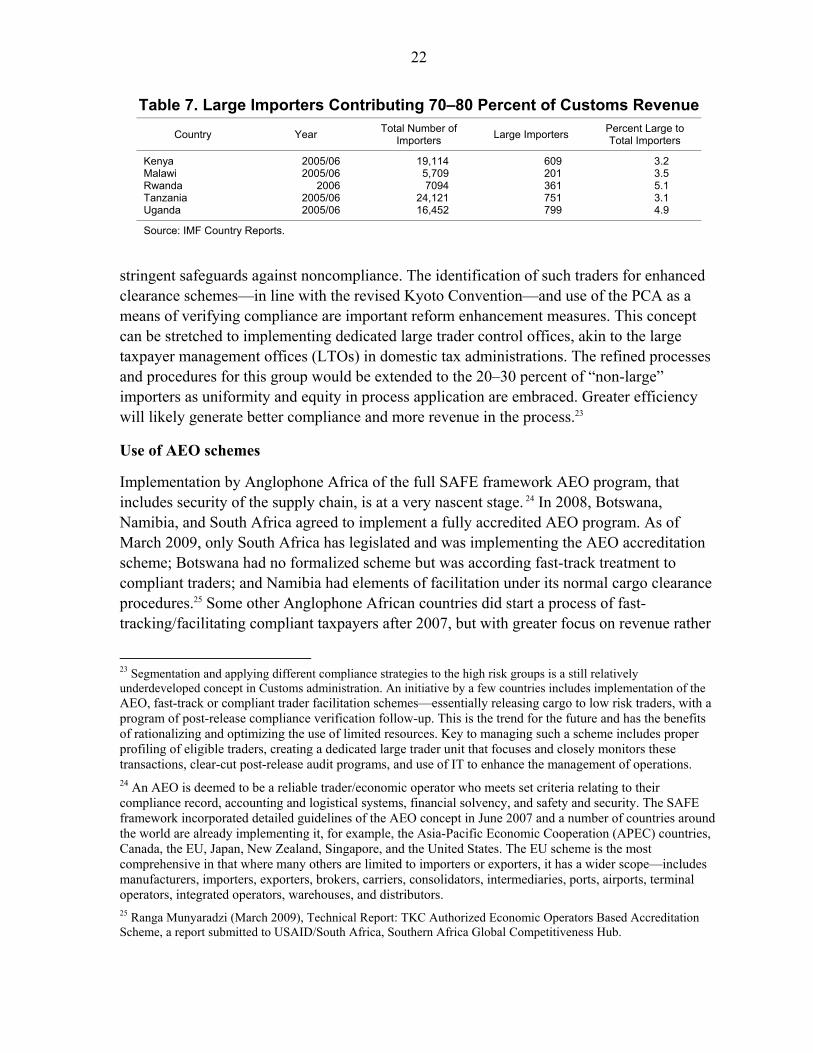
A start (2006) has been made in some countries with the assistance of FAD TA (e.g., in Kenya, Tanzania, and Uganda) to establish the function but it is early days yet. An important issue in risk management is the knowledge of trade patterns and operators, for example, knowing the major textile or second-hand vehicle import sources, the major importers and the associated compliance risks—origin, valuation, tariff, packaging, means of conveyance, and the routes used. Segmentation in Customs administration is just starting as part of risk management but no full analyses have yet been completed. FAD missions have been able to illustrate the power of organizing Customs (and tax) business around identifiable segments that have very high turnovers in the first instance, and pay substantial revenues. An illustration of the large importers’ segment for selected Anglophone African countries is shown in Table 7.
With most Customs revenues being recovered from fewer than 10 percent of the importing community, a special program (such as an Authorized Economic Operator (AEO) scheme) is warranted to maximize trade facilitation to this group while at the same time implementing
22
Table 7. Large Importers Contributing 70–80 Percent of Customs Revenue
Country Year Total Number of
Importers Large Importers
Percent Large to Total Importers
Kenya 2005/06 19,114 609 3.2 Malawi 2005/06 5,709 201 3.5 Rwanda 2006 7094 361 5.1 Tanzania 2005/06 24,121 751 3.1 Uganda 2005/06 16,452 799 4.9
Source: IMF Country Reports.
stringent safeguards against noncompliance. The identification of such traders for enhanced clearance schemes—in line with the revised Kyoto Convention—and use of the PCA as a means of verifying compliance are important reform enhancement measures. This concept can be stretched to implementing dedicated large trader control offices, akin to the large taxpayer management offices (LTOs) in domestic tax administrations. The refined processes and procedures for this group would be extended to the 20–30 percent of “non-large” importers as uniformity and equity in process application are embraced. Greater efficiency will likely generate better compliance and more revenue in the process.23
Use of AEO schemes
Implementation by Anglophone Africa of the full SAFE framework AEO program, that includes security of the supply chain, is at a very nascent stage. 24 In 2008, Botswana, Namibia, and South Africa agreed to implement a fully accredited AEO program. As of March 2009, only South Africa has legislated and was implementing the AEO accreditation scheme; Botswana had no formalized scheme but was according fast-track treatment to compliant traders; and Namibia had elements of facilitation under its normal cargo clearance procedures.25 Some other Anglophone African countries did start a process of fast-tracking/facilitating compliant taxpayers after 2007, but with greater focus on revenue rather
23 Segmentation and applying different compliance strategies to the high risk groups is a still relatively underdeveloped concept in Customs administration. An initiative by a few countries includes implementation of the AEO, fast-track or compliant trader facilitation schemes—essentially releasing cargo to low risk traders, with a program of post-release compliance verification follow-up. This is the trend for the future and has the benefits of rationalizing and optimizing the use of limited resources. Key to managing such a scheme includes proper profiling of eligible traders, creating a dedicated large trader unit that focuses and closely monitors these transactions, clear-cut post-release audit programs, and use of IT to enhance the management of operations. 24 An AEO is deemed to be a reliable trader/economic operator who meets set criteria relating to their compliance record, accounting and logistical systems, financial solvency, and safety and security. The SAFE framework incorporated detailed guidelines of the AEO concept in June 2007 and a number of countries around the world are already implementing it, for example, the Asia-Pacific Economic Cooperation (APEC) countries, Canada, the EU, Japan, New Zealand, Singapore, and the United States. The EU scheme is the most comprehensive in that where many others are limited to importers or exporters, it has a wider scope—includes manufacturers, importers, exporters, brokers, carriers, consolidators, intermediaries, ports, airports, terminal operators, integrated operators, warehouses, and distributors. 25 Ranga Munyaradzi (March 2009), Technical Report: TKC Authorized Economic Operators Based Accreditation Scheme, a report submitted to USAID/South Africa, Southern Africa Global Competitiveness Hub.
23
than supply chain security. For example, limited accredited trader facilitation programs were started by Tanzania in 2007, Rwanda and Kenya during 2008, and Uganda during the first half of 2010. The EAC is in the process of developing a regional AEO program and so is SADC, the latter also includes the SACU countries.
F. Pre-shipment/Destination Inspection Services
Several Anglophone African countries tried to address revenue and corruption concerns by engaging pre-shipment inspection/destination inspection (PSI/DI) companies in the mid-1990s. The PSI/DI companies particularly addressed the issues of valuation, classification and origin, and in some instances, at the behest of the central banks, capital flight.
Only 8 of the 19 Anglophone African countries have not used PSI/DI. These include Mauritius, Seychelles, Zambia, and the five SACU countries. Some utilized and then discontinued these services from mid-1990s, for example, Uganda (2002), Kenya (2005), Malawi (2007). Key issues in discarding the services were complaints from traders that they were paying an unnecessary cost (usually about 1 percent of CIF value above a designated import value threshold). Additionally, the skills of Customs officers in their “bread-and-butter” functions of valuation, classification, and origin determination were being lost. As at mid-2010, The Gambia, Ghana, Liberia, Nigeria, Sierra Leone, Tanzania, and Zimbabwe were still using these services.
There is no overwhelming evidence to suggest that the bottom-line (Customs revenue) improved dramatically following the use of PSI/DI). With concerns of declining core competencies of customs officials, some PSI/DI companies are transforming their operations and business models. For example, in Ghana, where primarily destination inspection is used, the DI companies have teamed up with the Ghana Link Network Services to manage the community-based TradeNet system (Ghana Community Network Services Limited (GCNet)) that was incorporated in November 2000. In Nigeria, the companies have also partnered with the authorities to manage the Global Scan TradeNet system installed in 2006. Tanzania still has a DI contract running through 2011, and is refocusing on skills acquisition especially management of the risk management system of the DI company. The new business model of PSI/DI companies investing in community-based networks in partnership with local companies and their ability to reduce the compliance costs to traders needs a cost-benefit review—imports are still subjected to a fee that is used to finance the TradeNet system. The key lesson is that where inspection services are used, care must be taken not to erode core Customs administration skills and transfer knowledge from the inspection company to the Customs administration staff.
G. Coordinated Border Management
The increase in international movement of people and trade, and security threats across borders are driving the need for closer and coordinated border management between countries. In this regard, some Anglophone African countries have started the juxtaposition
24
of neighboring country border Customs administration staff in a one-stop Customs administration post to manage, at one site, cargo (and people) inflows and outflows from either country.26
In Anglophone Africa, plans to introduce OSBPs started in the mid-2000s with support from development partners including the United States Agency for International Development (USAID), DfID, and Japan International Cooperation Agency. Two OSBPs were opened: one between Kenya and Uganda at the Malaba border in June 2006, and another at Chirundu on the Zambia/Zimbabwe border in December 2009. The current operational modality is a memorandum of understanding between the countries, and for each country to process the declaration and collect their own tariffs, taxes, and fees. The commencement of the one-stop border operation at Malaba confirmed the necessity of a cross-border automated information systems interface between the Kenya’s Simba and Uganda’s Automated System for Customs Data (ASYCUDA) . This was achieved through joint development of a Revenue Authorities Digital Data Exchange (RADDEX) system that is being continually enhanced. The OSBP at Malaba is said to have improved clearance times27 and more are points are planned to include other border services such as the police, immigration, and standards regulatory agencies.
H. Information Technology Reforms
Background
The automation of Customs processes in Anglophone Africa started during the early 1980s (see Table 8), the key objective being, at that time, to automate the clerical aspects of trader declarations processing and minimize errors by declarants. South Africa had the earliest start with the introduction of the Customs Automated Processing of Entries (CAPE) system in 1981 that was conceived during the late 1970s, followed by Mauritius in the late 1980s following the development of the ASYCUDA by the United Nations Conference on Trade and Development (UNCTAD) in 1984. Kenya implemented its automated system (Boffin) in 1989 and Rwanda introduced the early version of ASYCUDA in 1989.
The mid-1990s saw 10 other countries start automating their Customs administration processes. Seychelles and Swaziland automated in 2007, Sierra Leone in January 2010, while Lesotho and Liberia were in the process of implementing automated systems as of mid-2010. All countries implementing ASYCUDA, other than Botswana and Nigeria, had their projects financed by development partners—primarily the DfID, the United Nations Development Program (UNDP), the EU, the Danish Development Agency (DANIDA), and the World Bank. Beneficiary countries were required to contribute counterpart funding of about
26 The perceived benefits include: the reduction in transaction costs by improving the efficiency of border post-operations, reducing the time it takes to move cargo across the border crossings and the need for only one declaration for traders to process goods through the border point. 27 Initial results of the Kenya/Uganda OSBP point indicated reductions in clearance times from three to five days to between 20 minutes and three hours (depending on whether an inspection is required). See http://eastafrica.usaid.gov/en/Article.1051.aspx.

25
Table 8. Automated Customs Administration Systems in Anglophone African Countries at mid-June 2010
Country Type of Customs Administration Automated System Initial Systems Project Start or Implementation Date 1/
Botswana ASYCUDA 1992
Gambia, The ASYCUDA 1991
Ghana Originally used ASYCUDA, and currently Ghana Customs Management System (GCMS) which is integrated with Ghana TradeNet electronic trade portal
ASYCUDA in 1994, then GCMS from July 2003
Kenya Boffin and then Simba-2005 (based on the Senegalese Gainde/Sophix system)
Boffin in 1989 then Simba-2005 in 2005 2/
Lesotho ASYCUDA in the process of implementation -
Liberia ASYCUDA world January 2010 in the Port of Monrovia 2/
Malawi ASYCUDA 1999
Mauritius ASYCUDA then a bespoke Customs Management System (CMS) ASYCUDA in late 1980s then
CMS in 1997
Namibia ASYCUDA 1993
Nigeria ASYCUDA 1999
Rwanda ASYCUDA 1989
Seychelles ASYCUDA 2007
Sierra Leone ASYCUDA January 2010 2/
South Africa CAPE then web-based TATIS CAPE in 1981 then TATIS in 2009 2/
Swaziland ASYCUDA 2007
Tanzania ASYCUDA 1994
Uganda ASYCUDA 1996
Zambia ASYCUDA 1997 Zimbabwe ASYCUDA 1992
1/ UNCTAD: http://www.unctad.org/Templates/Search.asp?intItemID=1397&lang=1&frmSearchStr=asycuda&frmCategory=all§ion=whole for ASYCUDA.
2/ Country reports.
10 percent of the project cost. Implementation costs of the early ASYCUDA versions (excluding subsequent upgrades) were in the range of U$500,000–US$5 million, depending on the scope.28 In the face of declining donor financing, coupled with the global recession, developing countries should consciously and systemically plan the scope and financing of such (inevitable) information technology projects from own resources—including the recurrent costs of sustaining the systems.
Customs administration automation is dominated by ASYCUDA. Of the 19 countries, 14 are using ASYCUDA, and one (Lesotho) is at the development stage. Mauritius and Ghana originally used ASYCUDA but replaced it with bespoke systems that were capable of integrating into community-based single window applications29 using Singapore’s TradeNet as a model. The earlier transactions-centric versions of ASYCUDA were gradually upgraded to include greater functionality that supports direct trader input, basic risk management using
28 Source http://www.asycuda.org/countrydb.asp and country documents. 29 An integrated (usually virtual) system in which a community of stakeholders (e.g., the business community, Customs administrations, domestic tax administration, regulatory agencies, government ministries, departments, and agencies (MDAs), or civil society subscribe to and act upon their portion of data required to complete a transactions cycle.
26
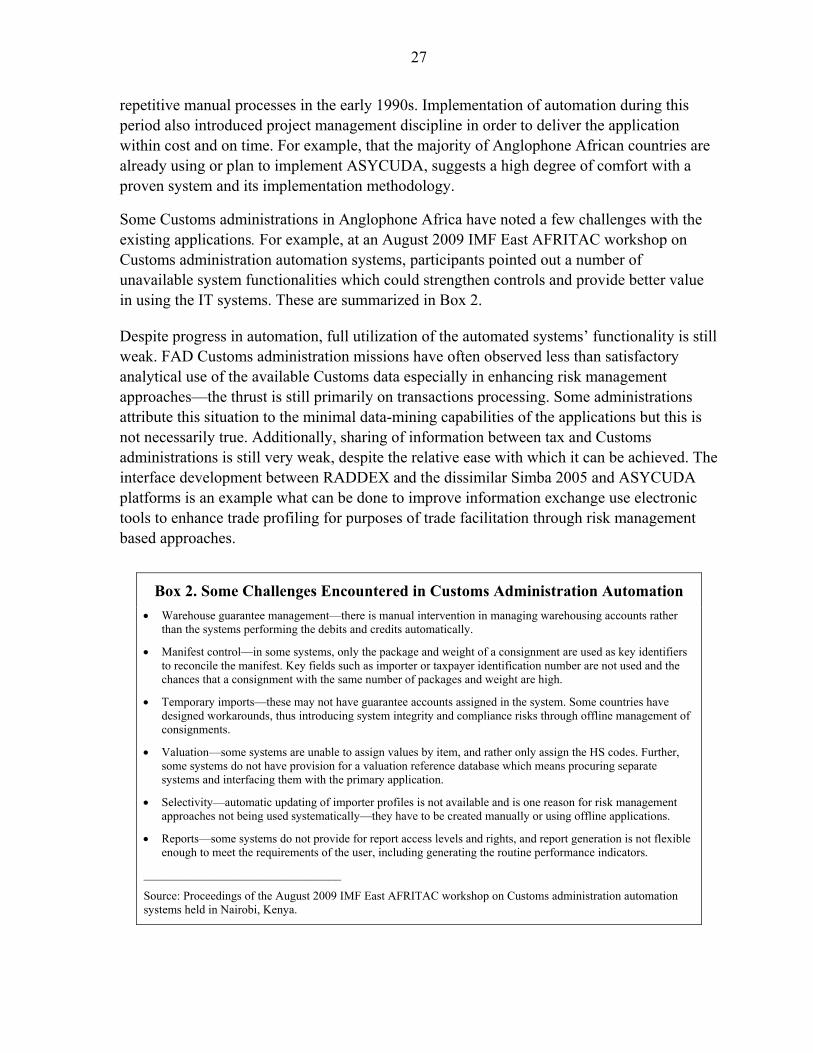
the selectivity modules, transit cargo management, and the ability to handle the attachment of electronic support documentation.
Community-based networks
A new generation of Customs applications that encourage the use of community-based networks is beginning to take root. Such networks aim to allow all parties to a transaction to lodge standardized information and documents electronically from a single virtual point dubbed, “single window.” This concept allows individual data elements to be submitted once for all purposes and also to: (1) reduce declarations processing times from days to minutes; (2) reduce the cost of doing business and in the process, increase business activity; (3) eliminate multiple and duplicate data capture points—capture data at the first point of declaration and avail this to all regulatory agencies to perform their duties; and (4) enable traders to access the information database including tacking the status of cargo clearance. The community based networks are typically managed by a joint venture company of the public and private sectors. Each partner subscribes an amount of share capital and the running costs are sustained by transaction fees paid by the users/traders.
Advance cargo information systems
For purposes of providing advance cargo information to destination countries, efforts to automate cross-border Customs declarations information started in the mid-1990s. The Anglophone East African countries took the lead by developing the RADDEX system that enables cross-border transmission of declarations data. Initiation of the concept occurred during the mid-1990s in a bid for Uganda to receive advance cargo information from Kenya and Tanzania. Serious efforts to develop a robust system occurred around 2005 with a joint in-house application development by Kenya and Uganda. RADDEX was then implemented in October 2007. The USAID extended support to enhance the system further. Rwanda and Tanzania were linked to the system in mid-2008 to exchange information with Kenya and Uganda. The system was also subsequently launched between Tanzania and Malawi in January 2010.30
Key observations
Automation of Customs processes was an important catalyst in reforming Customs administration processes and procedures in the early 1990s. Automation forces a structured operational discipline and in this instance, it seems to have eliminated some mundane and
30 More recent versions of RADDEX have, since 2009, enabled traders to track the movements of their cargo and traders in Uganda and have used the data to automatically populate the ASYCUDA electronic bill of entry, obviating the need to duplicate data entry. This electronic advance cargo system is an important trade facilitation and risk management tool, particularly in reconciling import/export data between dissimilar automated applications such as ASYCUDA and Kenya’s Simba-2005 (see also discussion on the OSBP above).
27
repetitive manual processes in the early 1990s. Implementation of automation during this period also introduced project management discipline in order to deliver the application within cost and on time. For example, that the majority of Anglophone African countries are already using or plan to implement ASYCUDA, suggests a high degree of comfort with a proven system and its implementation methodology.
Some Customs administrations in Anglophone Africa have noted a few challenges with the existing applications. For example, at an August 2009 IMF East AFRITAC workshop on Customs administration automation systems, participants pointed out a number of unavailable system functionalities which could strengthen controls and provide better value in using the IT systems. These are summarized in Box 2.
Despite progress in automation, full utilization of the automated systems’ functionality is still weak. FAD Customs administration missions have often observed less than satisfactory analytical use of the available Customs data especially in enhancing risk management approaches—the thrust is still primarily on transactions processing. Some administrations attribute this situation to the minimal data-mining capabilities of the applications but this is not necessarily true. Additionally, sharing of information between tax and Customs administrations is still very weak, despite the relative ease with which it can be achieved. The interface development between RADDEX and the dissimilar Simba 2005 and ASYCUDA platforms is an example what can be done to improve information exchange use electronic tools to enhance trade profiling for purposes of trade facilitation through risk management based approaches.
Box 2. Some Challenges Encountered in Customs Administration Automation
Warehouse guarantee management—there is manual intervention in managing warehousing accounts rather than the systems performing the debits and credits automatically.
Manifest control—in some systems, only the package and weight of a consignment are used as key identifiers to reconcile the manifest. Key fields such as importer or taxpayer identification number are not used and the chances that a consignment with the same number of packages and weight are high.
Temporary imports—these may not have guarantee accounts assigned in the system. Some countries have designed workarounds, thus introducing system integrity and compliance risks through offline management of consignments.
Valuation—some systems are unable to assign values by item, and rather only assign the HS codes. Further, some systems do not have provision for a valuation reference database which means procuring separate systems and interfacing them with the primary application.
Selectivity—automatic updating of importer profiles is not available and is one reason for risk management approaches not being used systematically—they have to be created manually or using offline applications.
Reports—some systems do not provide for report access levels and rights, and report generation is not flexible enough to meet the requirements of the user, including generating the routine performance indicators.
_________________________________
Source: Proceedings of the August 2009 IMF East AFRITAC workshop on Customs administration automation systems held in Nairobi, Kenya.
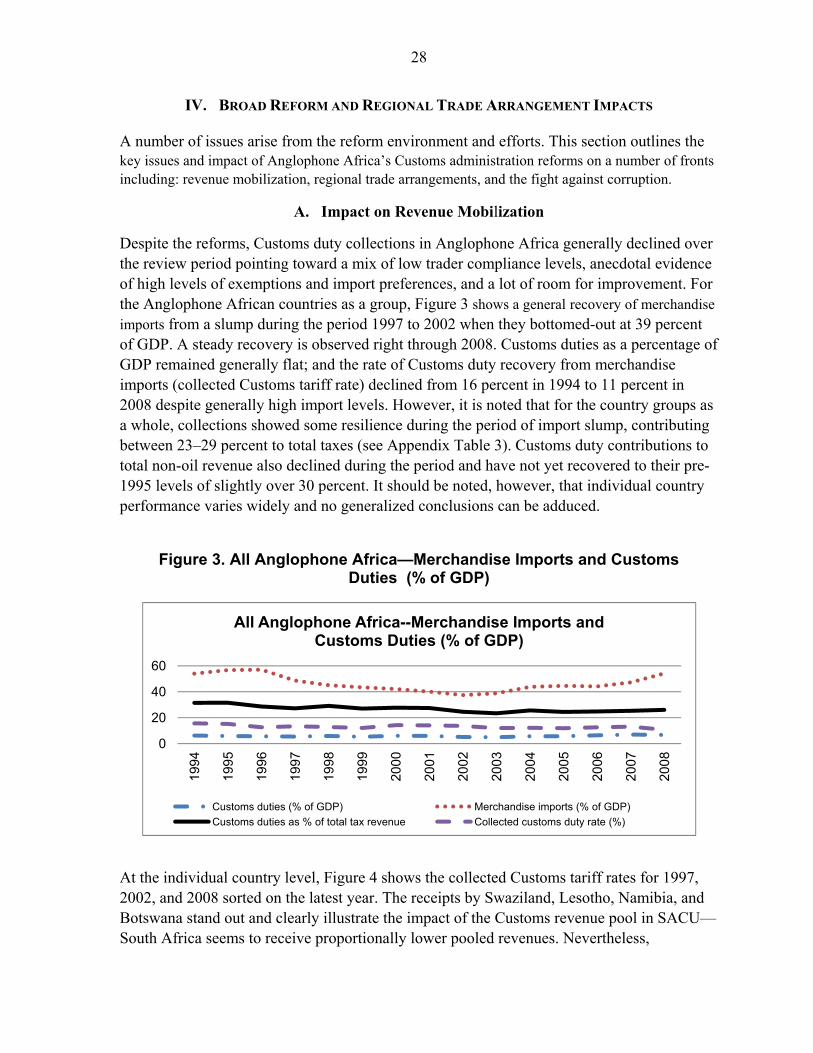
28
IV. BROAD REFORM AND REGIONAL TRADE ARRANGEMENT IMPACTS
A number of issues arise from the reform environment and efforts. This section outlines the key issues and impact of Anglophone Africa’s Customs administration reforms on a number of fronts including: revenue mobilization, regional trade arrangements, and the fight against corruption.
A. Impact on Revenue Mobilization
Despite the reforms, Customs duty collections in Anglophone Africa generally declined over the review period pointing toward a mix of low trader compliance levels, anecdotal evidence of high levels of exemptions and import preferences, and a lot of room for improvement. For the Anglophone African countries as a group, Figure 3 shows a general recovery of merchandise imports from a slump during the period 1997 to 2002 when they bottomed-out at 39 percent of GDP. A steady recovery is observed right through 2008. Customs duties as a percentage of GDP remained generally flat; and the rate of Customs duty recovery from merchandise imports (collected Customs tariff rate) declined from 16 percent in 1994 to 11 percent in 2008 despite generally high import levels. However, it is noted that for the country groups as a whole, collections showed some resilience during the period of import slump, contributing between 23–29 percent to total taxes (see Appendix Table 3). Customs duty contributions to total non-oil revenue also declined during the period and have not yet recovered to their pre-1995 levels of slightly over 30 percent. It should be noted, however, that individual country performance varies widely and no generalized conclusions can be adduced.
At the individual country level, Figure 4 shows the collected Customs tariff rates for 1997, 2002, and 2008 sorted on the latest year. The receipts by Swaziland, Lesotho, Namibia, and Botswana stand out and clearly illustrate the impact of the Customs revenue pool in SACU— South Africa seems to receive proportionally lower pooled revenues. Nevertheless,
Figure 3. All Anglophone Africa—Merchandise Imports and Customs Duties (% of GDP)
0
20
40
60
1994
1995
1996
1997
1998
1999
2000
2001
2002
2003
2004
2005
2006
2007
2008
All Anglophone Africa--Merchandise Imports and Customs Duties (% of GDP)
Customs duties (% of GDP) Merchandise imports (% of GDP)
Customs duties as % of total tax revenue Collected customs duty rate (%)
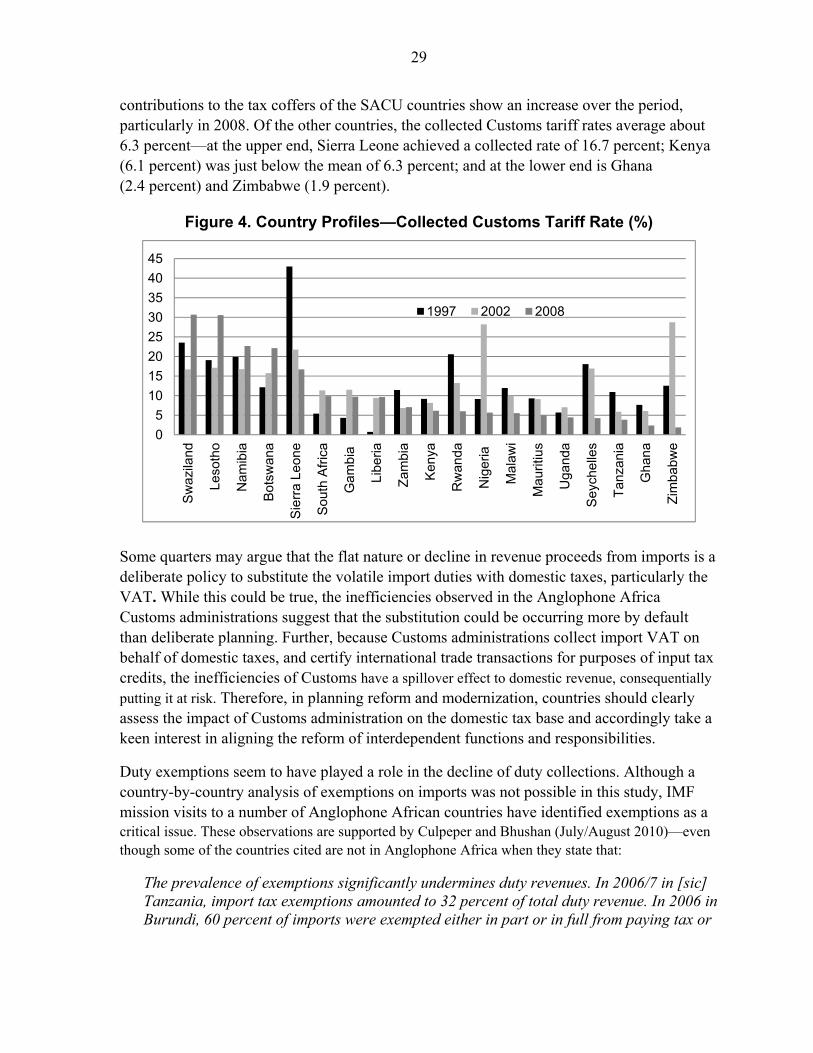
29
contributions to the tax coffers of the SACU countries show an increase over the period, particularly in 2008. Of the other countries, the collected Customs tariff rates average about 6.3 percent—at the upper end, Sierra Leone achieved a collected rate of 16.7 percent; Kenya (6.1 percent) was just below the mean of 6.3 percent; and at the lower end is Ghana (2.4 percent) and Zimbabwe (1.9 percent).
Some quarters may argue that the flat nature or decline in revenue proceeds from imports is a deliberate policy to substitute the volatile import duties with domestic taxes, particularly the VAT. While this could be true, the inefficiencies observed in the Anglophone Africa Customs administrations suggest that the substitution could be occurring more by default than deliberate planning. Further, because Customs administrations collect import VAT on behalf of domestic taxes, and certify international trade transactions for purposes of input tax credits, the inefficiencies of Customs have a spillover effect to domestic revenue, consequentially putting it at risk. Therefore, in planning reform and modernization, countries should clearly assess the impact of Customs administration on the domestic tax base and accordingly take a keen interest in aligning the reform of interdependent functions and responsibilities.
Duty exemptions seem to have played a role in the decline of duty collections. Although a country-by-country analysis of exemptions on imports was not possible in this study, IMF mission visits to a number of Anglophone African countries have identified exemptions as a critical issue. These observations are supported by Culpeper and Bhushan (July/August 2010)—even though some of the countries cited are not in Anglophone Africa when they state that:
The prevalence of exemptions significantly undermines duty revenues. In 2006/7 in [sic] Tanzania, import tax exemptions amounted to 32 percent of total duty revenue. In 2006 in Burundi, 60 percent of imports were exempted either in part or in full from paying tax or
Figure 4. Country Profiles—Collected Customs Tariff Rate (%)
0
5
10
15
20
25
30
35
40
45
Sw
azila
nd
Leso
tho
Nam
ibia
Bot
swan
a
Sie
rra
Leon
e
Sou
th A
fric
a
Gam
bia
Libe
ria
Zam
bia
Ken
ya
Rw
anda
Nig
eria
Mal
awi
Mau
ritiu
s
Uga
nda
Sey
chel
les
Tan
zani
a
Gha
na
Zim
babw
e
1997 2002 2008
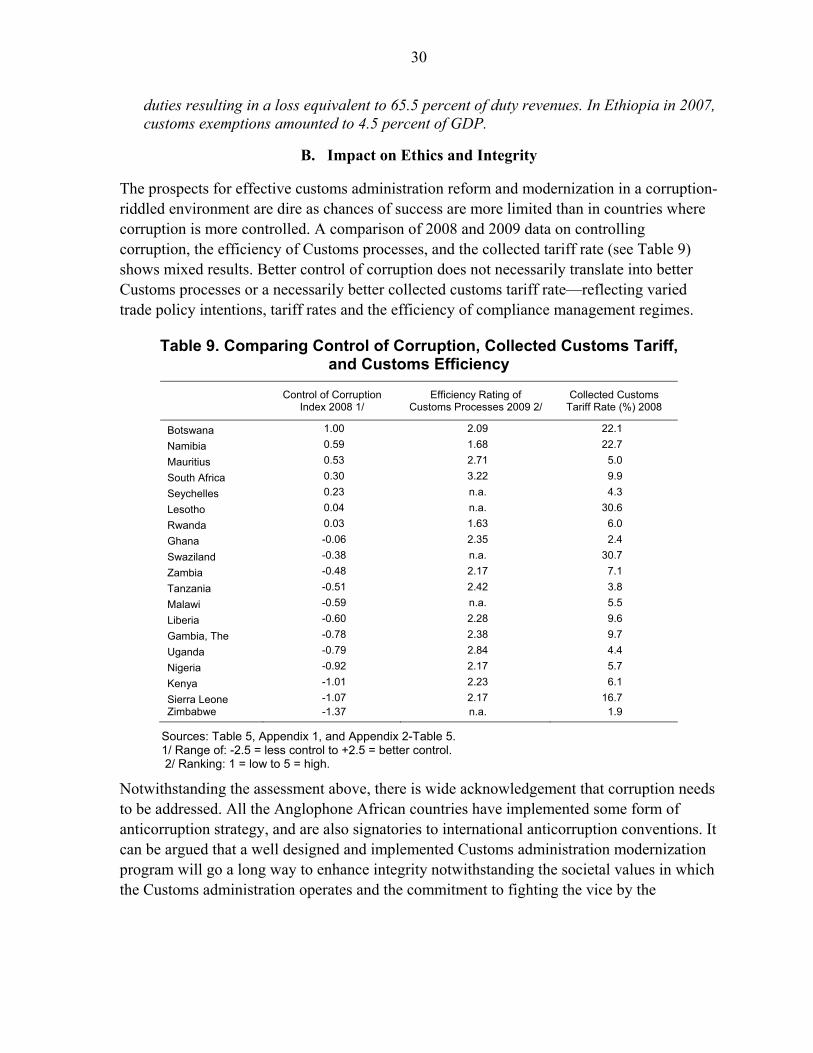
30
duties resulting in a loss equivalent to 65.5 percent of duty revenues. In Ethiopia in 2007, customs exemptions amounted to 4.5 percent of GDP.
B. Impact on Ethics and Integrity
The prospects for effective customs administration reform and modernization in a corruption-riddled environment are dire as chances of success are more limited than in countries where corruption is more controlled. A comparison of 2008 and 2009 data on controlling corruption, the efficiency of Customs processes, and the collected tariff rate (see Table 9) shows mixed results. Better control of corruption does not necessarily translate into better Customs processes or a necessarily better collected customs tariff rate—reflecting varied trade policy intentions, tariff rates and the efficiency of compliance management regimes.
Table 9. Comparing Control of Corruption, Collected Customs Tariff, and Customs Efficiency
Control of Corruption Index 2008 1/
Efficiency Rating of Customs Processes 2009 2/
Collected Customs Tariff Rate (%) 2008
Botswana 1.00 2.09 22.1
Namibia 0.59 1.68 22.7
Mauritius 0.53 2.71 5.0
South Africa 0.30 3.22 9.9
Seychelles 0.23 n.a. 4.3
Lesotho 0.04 n.a. 30.6
Rwanda 0.03 1.63 6.0
Ghana -0.06 2.35 2.4
Swaziland -0.38 n.a. 30.7
Zambia -0.48 2.17 7.1
Tanzania -0.51 2.42 3.8
Malawi -0.59 n.a. 5.5
Liberia -0.60 2.28 9.6
Gambia, The -0.78 2.38 9.7
Uganda -0.79 2.84 4.4
Nigeria -0.92 2.17 5.7
Kenya -1.01 2.23 6.1
Sierra Leone -1.07 2.17 16.7 Zimbabwe -1.37 n.a. 1.9
Sources: Table 5, Appendix 1, and Appendix 2-Table 5. 1/ Range of: -2.5 = less control to +2.5 = better control. 2/ Ranking: 1 = low to 5 = high.
Notwithstanding the assessment above, there is wide acknowledgement that corruption needs to be addressed. All the Anglophone African countries have implemented some form of anticorruption strategy, and are also signatories to international anticorruption conventions. It can be argued that a well designed and implemented Customs administration modernization program will go a long way to enhance integrity notwithstanding the societal values in which the Customs administration operates and the commitment to fighting the vice by the
31
authorities. Imam and Jacobs (November 2007)31 note that those countries that have implemented comprehensive revenue reform and modernization programs have had a mitigating impact on corruption—in Anglophone Africa, examples would include Ghana, Rwanda, South Africa, Tanzania, and Zambia.
C. Impact of Regional Trade Arrangements
Most Anglophone African countries have to effectively manage trader compliance with rules of origin, but despite anecdotal evidence of the lack of capacity, many continue to negotiate more trade arrangements. Multilateral or bilateral trading commitments generally entail preferential tariff treatment of goods using defined rules of origin. In circumstances where a country is committed to more than one trading arrangement, each with different requirements, capacity to manage the multiplicity of rules of origin, and predictability for customs administration and traders become critical issues. The lack of capacity generally complicates tariff management and provides opportunities for origin fraud and abuse. With little likelihood of members pulling out of the multiple regional trade arrangements, and presumably minimal chance of harmonizing rules of origin, the remedy seems to lie in better inter-customs administration cooperation, supplemented by strong intelligence and risk management approaches, and robust information technology systems.
It is observed that opportunities for deeper inter-country customs cooperation have not been fully exploited despite countries being members of various trading blocs. These opportunities include: harmonization of customs processes and procedures; and joint intelligence and risk management systems through the extensive sharing of information on customs declarations, traders and passenger clearance. The regional electronic interface of customs automated systems is still in its infancy with successful attempts having only been made recently, for example, in the use of RADDEX to link the Kenya and Uganda automated Customs administration systems.
It is also of note that revenue pooling and sharing arrangements are proving to be a difficult issue in SACU and more recently in the EAC. In the latter case, the partner states had set July 1, 2010 to start collecting customs revenue at the first point of entry into the customs territory and then share it out using an agreed formula, just as SACU is doing. However, due to lack of agreement and preparedness, the measure was postponed to a future date. South Africa also called for the review of the SACU revenue sharing formula in early 2010 given the negative effects on imports revenue by the global financial crisis. There are indications that the 2002 formula is placing a larger burden on the country.32
31 Patrick Imam, and Davina Jacobs (November 2007). 32 See: van den Bosch, Servaas (March 17, 2010).
32
V. THE OUTSTANDING REFORMS AGENDA
FAD TA support to a number of Anglophone African Customs administration reforms can be traced back to the mid-1990s. The guidance provided revolves around four key areas outlined in Keen 2003, namely: (1) establishing coherent trade policies and clear legislation; (2) adopting modern, simple procedures; (3) increasing self-assessment by traders, supported by a movement away from physical and toward post-release controls; and (4) ensuring organizational structures and human resources practices conducive to effectiveness and integrity in Customs administration. Further, that the Customs administration must be free of political interference, have a clear mandate in the law, and be organizationally placed so that it can interact closely with other branches of revenue administration.
A. Outstanding Reforms
The same reform issues addressed since the early-1990s are still observed to recur during the late 2000s. A review of FAD technical assistance assessments of Customs administration reform progress in 13 of the 19 Anglophone African countries33 during 2006 to mid-2010, identify common weaknesses and outstanding reform issues that may vary by country, but are still present in their Customs administrations. These are summarized in Table 10 below:
Diagnostic assessments by the WCO that cover Anglophone Africa lend credence to the FAD findings,34 indicating that: (1) although most of the countries assessed recognize the principles of modern Customs management such as use of risk management, PCA, and advance binding rulings, implementation is still inadequate; and (2) a number of countries still focus on revenue collection and a large percentage of physical inspections, the latter stance reflecting some distrust of risk management techniques and the belief that more inspections mean more revenue.
B. Conclusion
Since the early 1990s, Customs administration reform progress in Anglophone African countries has been relatively slow and is yet to yield the desired revenue and trade facilitation impacts. Nevertheless, it is observed that countries with stronger economic and resource capacity such as South Africa have made considerable progress. Noticeable process improvements have also occurred in Ghana, Mauritius, Sierra Leone, Tanzania, and Uganda. Control of corruption is observed to be better in the SACU countries (other than Swaziland), Mauritius, Seychelles, and Rwanda. The latter also stands out as a strong reformer. The other key conclusions are:
Anglophone Africa’s Customs administration reforms have been prominent in the tariff and automation areas, with the latter also influencing process and procedural reforms.
33 No Customs administration missions were conducted to Mauritius and the SACU countries during this period. 34 World Customs Organization (June 2007).
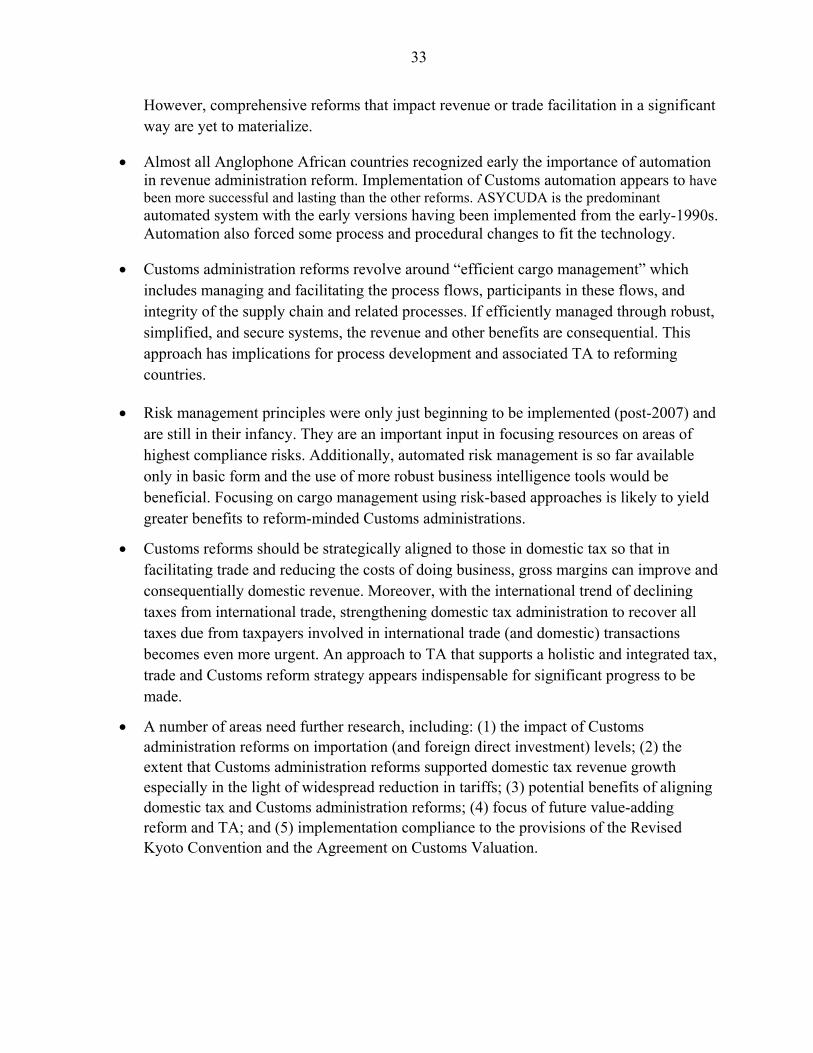
33
However, comprehensive reforms that impact revenue or trade facilitation in a significant way are yet to materialize.
Almost all Anglophone African countries recognized early the importance of automation in revenue administration reform. Implementation of Customs automation appears to have been more successful and lasting than the other reforms. ASYCUDA is the predominant automated system with the early versions having been implemented from the early-1990s. Automation also forced some process and procedural changes to fit the technology.
Customs administration reforms revolve around “efficient cargo management” which includes managing and facilitating the process flows, participants in these flows, and integrity of the supply chain and related processes. If efficiently managed through robust, simplified, and secure systems, the revenue and other benefits are consequential. This approach has implications for process development and associated TA to reforming countries.
Risk management principles were only just beginning to be implemented (post-2007) and are still in their infancy. They are an important input in focusing resources on areas of highest compliance risks. Additionally, automated risk management is so far available only in basic form and the use of more robust business intelligence tools would be beneficial. Focusing on cargo management using risk-based approaches is likely to yield greater benefits to reform-minded Customs administrations.
Customs reforms should be strategically aligned to those in domestic tax so that in facilitating trade and reducing the costs of doing business, gross margins can improve and consequentially domestic revenue. Moreover, with the international trend of declining taxes from international trade, strengthening domestic tax administration to recover all taxes due from taxpayers involved in international trade (and domestic) transactions becomes even more urgent. An approach to TA that supports a holistic and integrated tax, trade and Customs reform strategy appears indispensable for significant progress to be made.
A number of areas need further research, including: (1) the impact of Customs administration reforms on importation (and foreign direct investment) levels; (2) the extent that Customs administration reforms supported domestic tax revenue growth especially in the light of widespread reduction in tariffs; (3) potential benefits of aligning domestic tax and Customs administration reforms; (4) focus of future value-adding reform and TA; and (5) implementation compliance to the provisions of the Revised Kyoto Convention and the Agreement on Customs Valuation.
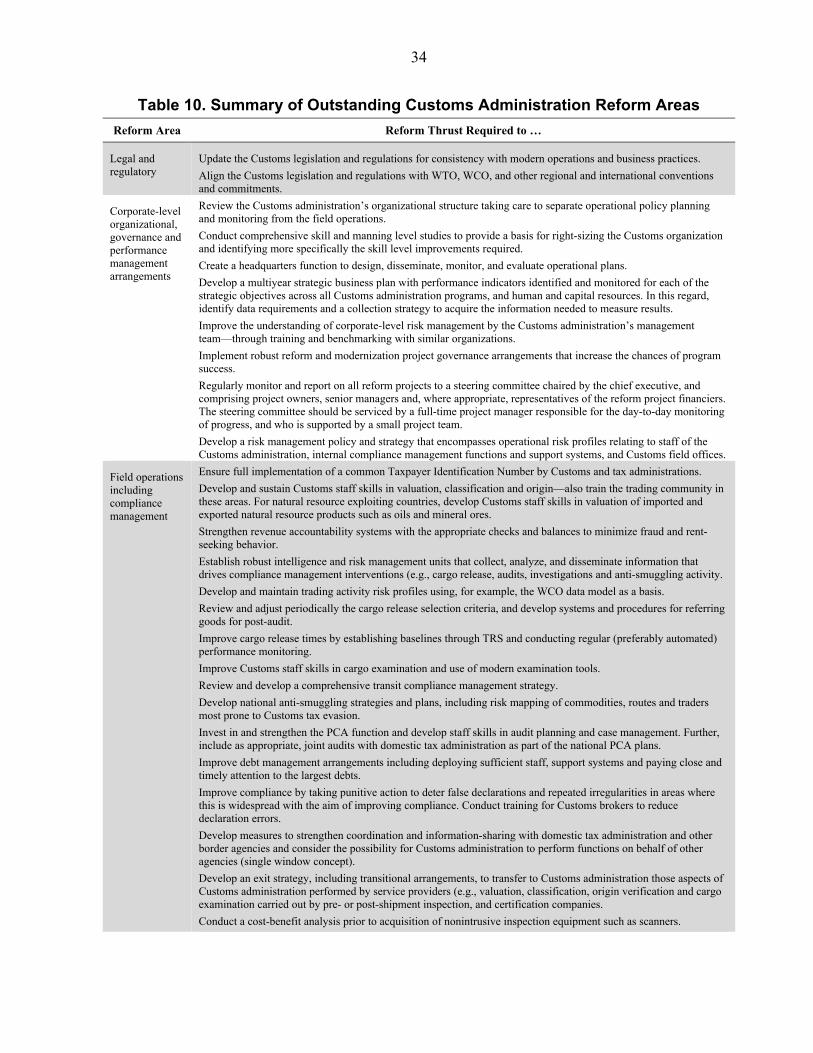
34
Table 10. Summary of Outstanding Customs Administration Reform Areas
Reform Area Reform Thrust Required to …
Legal and regulatory
Update the Customs legislation and regulations for consistency with modern operations and business practices.
Align the Customs legislation and regulations with WTO, WCO, and other regional and international conventions and commitments.
Corporate-level organizational, governance and performance management arrangements
Review the Customs administration’s organizational structure taking care to separate operational policy planning and monitoring from the field operations.
Conduct comprehensive skill and manning level studies to provide a basis for right-sizing the Customs organization and identifying more specifically the skill level improvements required.
Create a headquarters function to design, disseminate, monitor, and evaluate operational plans.
Develop a multiyear strategic business plan with performance indicators identified and monitored for each of the strategic objectives across all Customs administration programs, and human and capital resources. In this regard, identify data requirements and a collection strategy to acquire the information needed to measure results.
Improve the understanding of corporate-level risk management by the Customs administration’s management team—through training and benchmarking with similar organizations.
Implement robust reform and modernization project governance arrangements that increase the chances of program success.
Regularly monitor and report on all reform projects to a steering committee chaired by the chief executive, and comprising project owners, senior managers and, where appropriate, representatives of the reform project financiers. The steering committee should be serviced by a full-time project manager responsible for the day-to-day monitoring of progress, and who is supported by a small project team.
Develop a risk management policy and strategy that encompasses operational risk profiles relating to staff of the Customs administration, internal compliance management functions and support systems, and Customs field offices.
Field operations including compliance management
Ensure full implementation of a common Taxpayer Identification Number by Customs and tax administrations.
Develop and sustain Customs staff skills in valuation, classification and origin—also train the trading community in these areas. For natural resource exploiting countries, develop Customs staff skills in valuation of imported and exported natural resource products such as oils and mineral ores.
Strengthen revenue accountability systems with the appropriate checks and balances to minimize fraud and rent-seeking behavior.
Establish robust intelligence and risk management units that collect, analyze, and disseminate information that drives compliance management interventions (e.g., cargo release, audits, investigations and anti-smuggling activity.
Develop and maintain trading activity risk profiles using, for example, the WCO data model as a basis.
Review and adjust periodically the cargo release selection criteria, and develop systems and procedures for referring goods for post-audit.
Improve cargo release times by establishing baselines through TRS and conducting regular (preferably automated) performance monitoring.
Improve Customs staff skills in cargo examination and use of modern examination tools.
Review and develop a comprehensive transit compliance management strategy.
Develop national anti-smuggling strategies and plans, including risk mapping of commodities, routes and traders most prone to Customs tax evasion.
Invest in and strengthen the PCA function and develop staff skills in audit planning and case management. Further, include as appropriate, joint audits with domestic tax administration as part of the national PCA plans.
Improve debt management arrangements including deploying sufficient staff, support systems and paying close and timely attention to the largest debts.
Improve compliance by taking punitive action to deter false declarations and repeated irregularities in areas where this is widespread with the aim of improving compliance. Conduct training for Customs brokers to reduce declaration errors.
Develop measures to strengthen coordination and information-sharing with domestic tax administration and other border agencies and consider the possibility for Customs administration to perform functions on behalf of other agencies (single window concept).
Develop an exit strategy, including transitional arrangements, to transfer to Customs administration those aspects of Customs administration performed by service providers (e.g., valuation, classification, origin verification and cargo examination carried out by pre- or post-shipment inspection, and certification companies.
Conduct a cost-benefit analysis prior to acquisition of nonintrusive inspection equipment such as scanners.
35
Table 10. Summary of Outstanding Customs Administration Reform Areas
Reform Area Reform Thrust Required to …
Trade facilitation
Provide more complete information and training that enables the trading community to meet their Customs obligations.
Strengthen partnerships and hold regular and formalized dialogue with the trading community and particularly consult them when changes in processes, procedures, and systems are being contemplated.
Implement credible importer trade facilitation programs including the AEO scheme.
Encourage and enforce minimum record keeping standards for commercial international trade transactions.
Business processes and automation
Articulate the future Customs business direction in light of regional and international developments, including implementation of single window arrangements.
Conduct business process reviews and streamline processes and procedures by removing those that do not add value.
Develop a Customs information and communication technology strategy and action plan that aligns with the future business direction and streamlined processes and procedures.
Plan to roll out automated systems to Customs offices that cover at least 95 percent of the business.
Enhance the functionality of existing systems from mere transactions-processing to decision-support systems as appropriate, including implementation of dynamic risk management support modules.
Provide access of the automated system to all Customs staff, including cargo examination staff.
Develop plans for longer-term expansion and a medium-term strategy for capital equipment replacement and communication solutions.
Dispute resolution
Set up a clear, transparent, and timely dispute resolution framework that is mindful of costs to the trading community and the Customs administration.
Ethics and integrity
Complete an integrity diagnosis (preferably using the WCO diagnostic tools) and develop an integrity action plan that indentifies actions to be taken, with clear responsibility assigned, priorities identified, and general timeframes indicated.
Develop or update the codes of staff conduct using the results of the integrity diagnosis, while ensuring alignment with national and international integrity guidelines and best practice.
Implement a transparent and equitable disciplinary framework that also provides for the prosecution of offenders and confiscation of ill-gotten assets.
Regional integration and customs union issues—where applicable
Establish a regional Customs union reform and modernization governance structure with a steering committee preferably chaired, on a rotation basis, by one of the chief executives of the region’s Customs administrations. The steering committee should be supported by a full-time project manager and small team chosen from the region’s Customs administrations.
Review and consult closely all stakeholders on Customs administration issues and the proposed harmonization of processes, procedure and systems, taking into account the maturity levels of partner state institutional arrangements and their impact on integration or convergence plan.
Pilot agreed policies, procedures, processes, and systems within a project implementation framework that has clear benchmarks and review milestones.
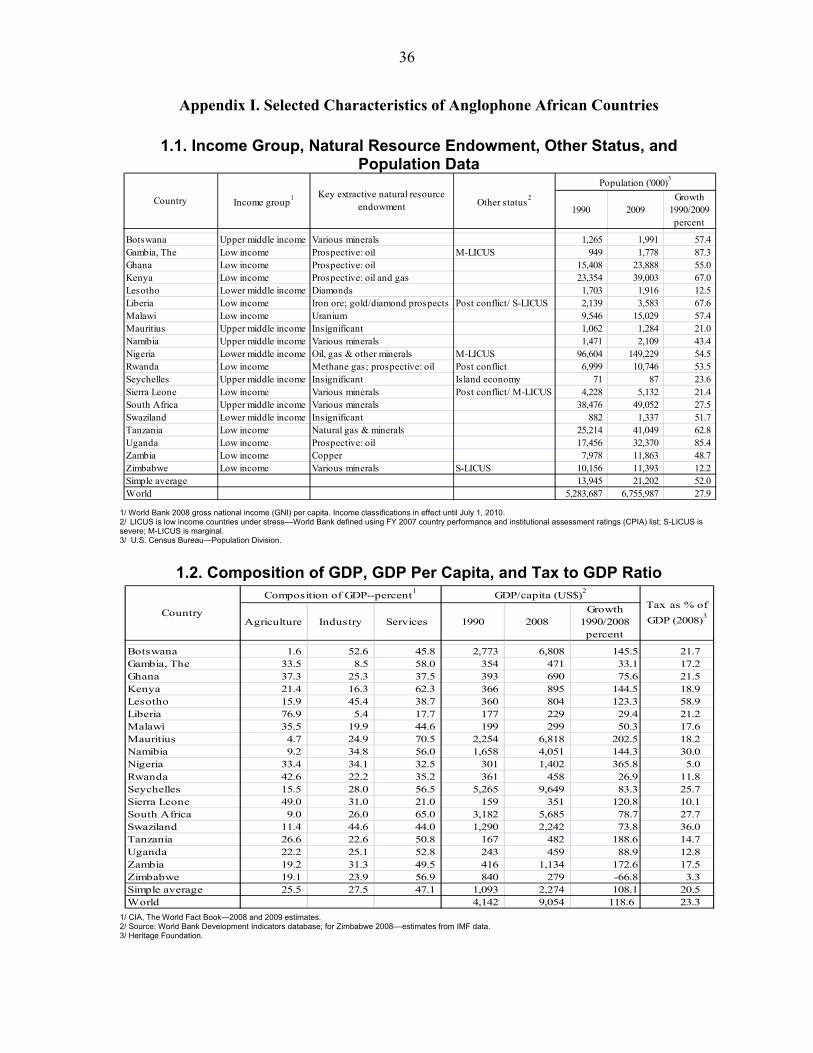
36
Appendix I. Selected Characteristics of Anglophone African Countries
1.1. Income Group, Natural Resource Endowment, Other Status, and Population Data
1/ World Bank 2008 gross national income (GNI) per capita. Income classifications in effect until July 1, 2010. 2/ LICUS is low income countries under stress––World Bank defined using FY 2007 country performance and institutional assessment ratings (CPIA) list; S-LICUS is severe; M-LICUS is marginal. 3/ U.S. Census Bureau—Population Division.
1.2. Composition of GDP, GDP Per Capita, and Tax to GDP Ratio
1/ CIA, The World Fact Book—2008 and 2009 estimates. 2/ Source: World Bank Development Indicators database; for Zimbabwe 2008––estimates from IMF data. 3/ Heritage Foundation.
1990 2009Growth
1990/2009 percent
Botswana Upper middle income Various minerals 1,265 1,991 57.4 Gambia, The Low income Prospective: oil M-LICUS 949 1,778 87.3 Ghana Low income Prospective: oil 15,408 23,888 55.0 Kenya Low income Prospective: oil and gas 23,354 39,003 67.0 Lesotho Lower middle income Diamonds 1,703 1,916 12.5 Liberia Low income Iron ore; gold/diamond prospects Post conflict/ S-LICUS 2,139 3,583 67.6 Malawi Low income Uranium 9,546 15,029 57.4 Mauritius Upper middle income Insignificant 1,062 1,284 21.0 Namibia Upper middle income Various minerals 1,471 2,109 43.4 Nigeria Lower middle income Oil, gas & other minerals M-LICUS 96,604 149,229 54.5 Rwanda Low income Methane gas; prospective: oil Post conflict 6,999 10,746 53.5 Seychelles Upper middle income Insignificant Island economy 71 87 23.6 Sierra Leone Low income Various minerals Post conflict/ M-LICUS 4,228 5,132 21.4 South Africa Upper middle income Various minerals 38,476 49,052 27.5 Swaziland Lower middle income Insignificant 882 1,337 51.7 Tanzania Low income Natural gas & minerals 25,214 41,049 62.8 Uganda Low income Prospective: oil 17,456 32,370 85.4 Zambia Low income Copper 7,978 11,863 48.7 Zimbabwe Low income Various minerals S-LICUS 10,156 11,393 12.2 Simple average 13,945 21,202 52.0 World 5,283,687 6,755,987 27.9
Country Income group1
Other status2Key extractive natural resource
endowment
Population ('000)3
Agriculture Industry Services 1990 2008Growth
1990/2008 percent
Botswana 1.6 52.6 45.8 2,773 6,808 145.5 21.7Gambia, The 33.5 8.5 58.0 354 471 33.1 17.2Ghana 37.3 25.3 37.5 393 690 75.6 21.5Kenya 21.4 16.3 62.3 366 895 144.5 18.9Lesotho 15.9 45.4 38.7 360 804 123.3 58.9Liberia 76.9 5.4 17.7 177 229 29.4 21.2Malawi 35.5 19.9 44.6 199 299 50.3 17.6Mauritius 4.7 24.9 70.5 2,254 6,818 202.5 18.2Namibia 9.2 34.8 56.0 1,658 4,051 144.3 30.0Nigeria 33.4 34.1 32.5 301 1,402 365.8 5.0Rwanda 42.6 22.2 35.2 361 458 26.9 11.8Seychelles 15.5 28.0 56.5 5,265 9,649 83.3 25.7Sierra Leone 49.0 31.0 21.0 159 351 120.8 10.1South Africa 9.0 26.0 65.0 3,182 5,685 78.7 27.7Swaziland 11.4 44.6 44.0 1,290 2,242 73.8 36.0Tanzania 26.6 22.6 50.8 167 482 188.6 14.7Uganda 22.2 25.1 52.8 243 459 88.9 12.8Zambia 19.2 31.3 49.5 416 1,134 172.6 17.5Zimbabwe 19.1 23.9 56.9 840 279 -66.8 3.3Simple average 25.5 27.5 47.1 1,093 2,274 108.1 20.5World 4,142 9,054 118.6 23.3
CountryTax as % of
GDP (2008)3
Composition of GDP--percent1
GDP/capita (US$)2

37
1.3. World Governance Indicators1
1/ World Bank—the six governance indicators are measured in units ranging from about -2.5 to 2.5, with higher values corresponding to better governance outcomes—data sorted in descending order on consolidated index for 2008. 2/ Author computations—average of all six indices.
2008 1998 2008 1998 2008 1998 2008 1998 2008 1998 2008 1998 2008 1998
Mauritius 0.88 1.01 0.84 0.63 0.60 0.31 0.95 0.33 0.88 0.82 0.53 0.48 0.78 0.60Botswana 0.55 0.73 0.96 0.82 0.67 0.66 0.52 0.75 0.64 0.56 1.00 0.74 0.72 0.71Namibia 0.57 0.35 0.96 0.54 0.31 0.39 0.13 0.18 0.36 0.29 0.59 0.66 0.49 0.40South Africa 0.68 0.85 -0.04 -0.88 0.75 0.95 0.63 0.24 0.12 0.14 0.30 0.60 0.41 0.31Seychelles -0.04 0.02 0.91 0.98 -0.01 0.56 -0.65 -0.48 0.24 0.53 0.23 0.45 0.11 0.34Ghana 0.48 -0.43 0.06 -0.21 -0.08 -0.22 0.08 -0.10 -0.10 -0.44 -0.06 -0.31 0.06 -0.28Lesotho 0.04 -0.77 -0.03 -0.22 -0.31 -0.10 -0.63 -0.41 -0.30 0.09 0.04 -0.19 -0.20 -0.27Tanzania -0.09 -0.55 0.01 -0.23 -0.45 -0.61 -0.39 -0.31 -0.28 -0.37 -0.51 -1.12 -0.29 -0.53Zambia -0.09 -0.49 0.29 -0.22 -0.66 -1.06 -0.33 -0.01 -0.50 -0.58 -0.48 -0.92 -0.30 -0.55Malawi -0.18 -0.09 0.05 -0.16 -0.65 -0.17 -0.39 -0.14 -0.29 -0.56 -0.59 -0.36 -0.34 -0.25Rwanda -1.24 -1.34 -0.14 -2.13 -0.20 -1.17 -0.49 -1.08 -0.50 -1.48 0.03 -0.87 -0.42 -1.35Gambia -0.97 -0.99 0.14 0.62 -0.77 -0.61 -0.44 -0.36 -0.25 0.03 -0.78 -0.54 -0.51 -0.31Swaziland -1.20 -1.23 0.22 -0.08 -0.66 -0.67 -0.57 -0.42 -0.51 -0.58 -0.38 -0.02 -0.52 -0.50Uganda -0.47 -0.89 -0.88 -1.30 -0.51 -0.56 -0.08 0.08 -0.51 -0.67 -0.79 -0.92 -0.54 -0.71Kenya -0.16 -0.87 -1.25 -1.04 -0.60 -0.71 -0.07 -0.37 -0.98 -1.11 -1.01 -1.13 -0.68 -0.87Sierra Leone -0.28 -1.47 -0.23 -2.17 -1.13 -1.41 -0.86 -1.29 -1.03 -1.18 -1.07 -0.94 -0.77 -1.41Liberia -0.29 -1.12 -0.99 -1.75 -1.36 -1.83 -1.32 -2.06 -1.23 -2.07 -0.60 -1.73 -0.96 -1.76Nigeria -0.60 -1.19 -2.01 -0.98 -0.98 -1.06 -0.62 -0.93 -1.12 -1.30 -0.92 -1.17 -1.04 -1.10Zimbabwe -1.52 -0.81 -1.56 -0.85 -1.56 -0.47 -2.18 -0.68 -1.81 -0.53 -1.37 -0.43 -1.67 -0.63
Anglophone Africa average -0.21 -0.49 -0.14 -0.45 -0.40 -0.41 -0.35 -0.37 -0.38 -0.44 -0.31 -0.40 -0.30 -0.43
World Average 0.00 -0.02 0.00 -0.08 0.00 0.00 0.00 -0.02 0.00 -0.05 0.00 -0.01 0.00 -0.03
Government Effectiveness Regulatory Quality Rule of Law Control of CorruptionCountry Consolidated Index
2Voice &
Accountability
Political Stability & No Violence/
Terrorism
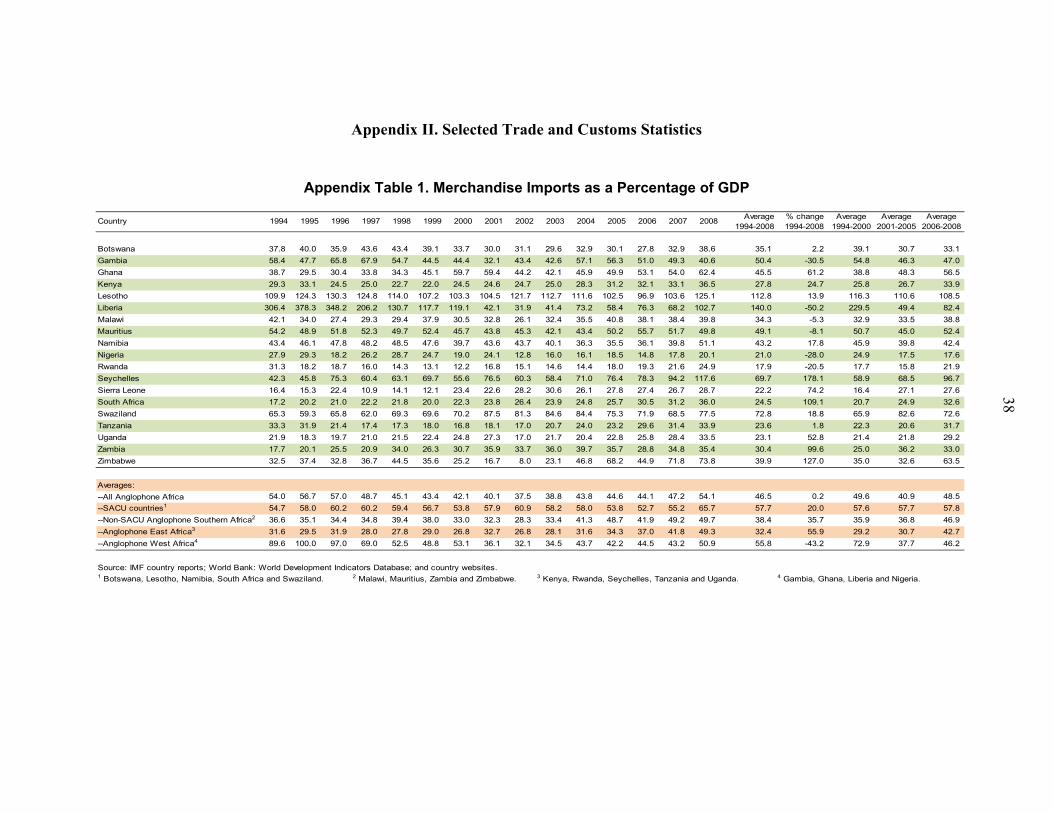
Appendix II. Selected Trade and Customs Statistics
Appendix Table 1. Merchandise Imports as a Percentage of GDP
Country 1994 1995 1996 1997 1998 1999 2000 2001 2002 2003 2004 2005 2006 2007 2008Average
1994-2008% change 1994-2008
Average 1994-2000
Average 2001-2005
Average 2006-2008
Botswana 37.8 40.0 35.9 43.6 43.4 39.1 33.7 30.0 31.1 29.6 32.9 30.1 27.8 32.9 38.6 35.1 2.2 39.1 30.7 33.1
Gambia 58.4 47.7 65.8 67.9 54.7 44.5 44.4 32.1 43.4 42.6 57.1 56.3 51.0 49.3 40.6 50.4 -30.5 54.8 46.3 47.0
Ghana 38.7 29.5 30.4 33.8 34.3 45.1 59.7 59.4 44.2 42.1 45.9 49.9 53.1 54.0 62.4 45.5 61.2 38.8 48.3 56.5
Kenya 29.3 33.1 24.5 25.0 22.7 22.0 24.5 24.6 24.7 25.0 28.3 31.2 32.1 33.1 36.5 27.8 24.7 25.8 26.7 33.9
Lesotho 109.9 124.3 130.3 124.8 114.0 107.2 103.3 104.5 121.7 112.7 111.6 102.5 96.9 103.6 125.1 112.8 13.9 116.3 110.6 108.5
Liberia 306.4 378.3 348.2 206.2 130.7 117.7 119.1 42.1 31.9 41.4 73.2 58.4 76.3 68.2 102.7 140.0 -50.2 229.5 49.4 82.4
Malawi 42.1 34.0 27.4 29.3 29.4 37.9 30.5 32.8 26.1 32.4 35.5 40.8 38.1 38.4 39.8 34.3 -5.3 32.9 33.5 38.8
Mauritius 54.2 48.9 51.8 52.3 49.7 52.4 45.7 43.8 45.3 42.1 43.4 50.2 55.7 51.7 49.8 49.1 -8.1 50.7 45.0 52.4
Namibia 43.4 46.1 47.8 48.2 48.5 47.6 39.7 43.6 43.7 40.1 36.3 35.5 36.1 39.8 51.1 43.2 17.8 45.9 39.8 42.4
Nigeria 27.9 29.3 18.2 26.2 28.7 24.7 19.0 24.1 12.8 16.0 16.1 18.5 14.8 17.8 20.1 21.0 -28.0 24.9 17.5 17.6
Rwanda 31.3 18.2 18.7 16.0 14.3 13.1 12.2 16.8 15.1 14.6 14.4 18.0 19.3 21.6 24.9 17.9 -20.5 17.7 15.8 21.9
Seychelles 42.3 45.8 75.3 60.4 63.1 69.7 55.6 76.5 60.3 58.4 71.0 76.4 78.3 94.2 117.6 69.7 178.1 58.9 68.5 96.7
Sierra Leone 16.4 15.3 22.4 10.9 14.1 12.1 23.4 22.6 28.2 30.6 26.1 27.8 27.4 26.7 28.7 22.2 74.2 16.4 27.1 27.6
South Africa 17.2 20.2 21.0 22.2 21.8 20.0 22.3 23.8 26.4 23.9 24.8 25.7 30.5 31.2 36.0 24.5 109.1 20.7 24.9 32.6
Swaziland 65.3 59.3 65.8 62.0 69.3 69.6 70.2 87.5 81.3 84.6 84.4 75.3 71.9 68.5 77.5 72.8 18.8 65.9 82.6 72.6
Tanzania 33.3 31.9 21.4 17.4 17.3 18.0 16.8 18.1 17.0 20.7 24.0 23.2 29.6 31.4 33.9 23.6 1.8 22.3 20.6 31.7
Uganda 21.9 18.3 19.7 21.0 21.5 22.4 24.8 27.3 17.0 21.7 20.4 22.8 25.8 28.4 33.5 23.1 52.8 21.4 21.8 29.2
Zambia 17.7 20.1 25.5 20.9 34.0 26.3 30.7 35.9 33.7 36.0 39.7 35.7 28.8 34.8 35.4 30.4 99.6 25.0 36.2 33.0
Zimbabwe 32.5 37.4 32.8 36.7 44.5 35.6 25.2 16.7 8.0 23.1 46.8 68.2 44.9 71.8 73.8 39.9 127.0 35.0 32.6 63.5
Averages:
--All Anglophone Africa 54.0 56.7 57.0 48.7 45.1 43.4 42.1 40.1 37.5 38.8 43.8 44.6 44.1 47.2 54.1 46.5 0.2 49.6 40.9 48.5
--SACU countries1 54.7 58.0 60.2 60.2 59.4 56.7 53.8 57.9 60.9 58.2 58.0 53.8 52.7 55.2 65.7 57.7 20.0 57.6 57.7 57.8
--Non-SACU Anglophone Southern Africa2 36.6 35.1 34.4 34.8 39.4 38.0 33.0 32.3 28.3 33.4 41.3 48.7 41.9 49.2 49.7 38.4 35.7 35.9 36.8 46.9
--Anglophone East Africa3 31.6 29.5 31.9 28.0 27.8 29.0 26.8 32.7 26.8 28.1 31.6 34.3 37.0 41.8 49.3 32.4 55.9 29.2 30.7 42.7
--Anglophone West Africa4 89.6 100.0 97.0 69.0 52.5 48.8 53.1 36.1 32.1 34.5 43.7 42.2 44.5 43.2 50.9 55.8 -43.2 72.9 37.7 46.2
Source: IMF country reports; World Bank: World Development Indicators Database; and country websites.1 Botswana, Lesotho, Namibia, South Africa and Swaziland. 2 Malawi, Mauritius, Zambia and Zimbabwe. 3 Kenya, Rwanda, Seychelles, Tanzania and Uganda. 4 Gambia, Ghana, Liberia and Nigeria.
38
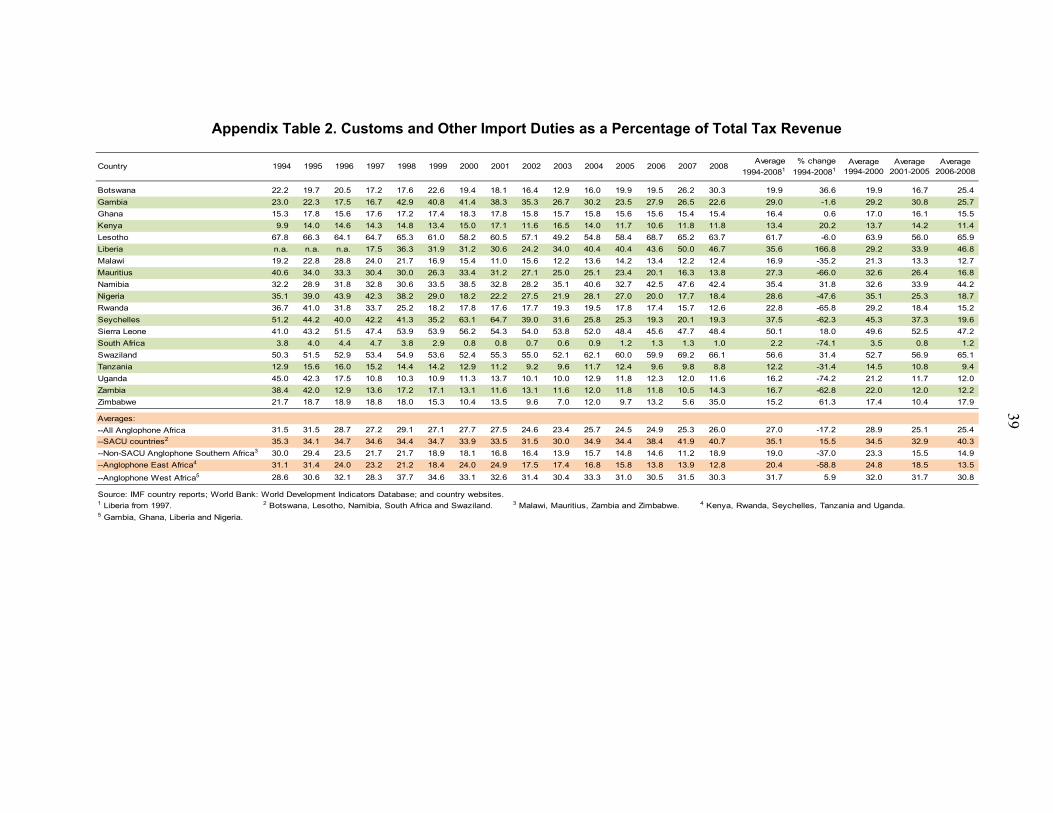
Appendix Table 2. Customs and Other Import Duties as a Percentage of Total Tax Revenue
Country 1994 1995 1996 1997 1998 1999 2000 2001 2002 2003 2004 2005 2006 2007 2008Average
1994-20081
% change
1994-20081Average
1994-2000Average
2001-2005Average
2006-2008
Botswana 22.2 19.7 20.5 17.2 17.6 22.6 19.4 18.1 16.4 12.9 16.0 19.9 19.5 26.2 30.3 19.9 36.6 19.9 16.7 25.4
Gambia 23.0 22.3 17.5 16.7 42.9 40.8 41.4 38.3 35.3 26.7 30.2 23.5 27.9 26.5 22.6 29.0 -1.6 29.2 30.8 25.7
Ghana 15.3 17.8 15.6 17.6 17.2 17.4 18.3 17.8 15.8 15.7 15.8 15.6 15.6 15.4 15.4 16.4 0.6 17.0 16.1 15.5
Kenya 9.9 14.0 14.6 14.3 14.8 13.4 15.0 17.1 11.6 16.5 14.0 11.7 10.6 11.8 11.8 13.4 20.2 13.7 14.2 11.4
Lesotho 67.8 66.3 64.1 64.7 65.3 61.0 58.2 60.5 57.1 49.2 54.8 58.4 68.7 65.2 63.7 61.7 -6.0 63.9 56.0 65.9
Liberia n.a. n.a. n.a. 17.5 36.3 31.9 31.2 30.6 24.2 34.0 40.4 40.4 43.6 50.0 46.7 35.6 166.8 29.2 33.9 46.8
Malawi 19.2 22.8 28.8 24.0 21.7 16.9 15.4 11.0 15.6 12.2 13.6 14.2 13.4 12.2 12.4 16.9 -35.2 21.3 13.3 12.7
Mauritius 40.6 34.0 33.3 30.4 30.0 26.3 33.4 31.2 27.1 25.0 25.1 23.4 20.1 16.3 13.8 27.3 -66.0 32.6 26.4 16.8
Namibia 32.2 28.9 31.8 32.8 30.6 33.5 38.5 32.8 28.2 35.1 40.6 32.7 42.5 47.6 42.4 35.4 31.8 32.6 33.9 44.2
Nigeria 35.1 39.0 43.9 42.3 38.2 29.0 18.2 22.2 27.5 21.9 28.1 27.0 20.0 17.7 18.4 28.6 -47.6 35.1 25.3 18.7
Rwanda 36.7 41.0 31.8 33.7 25.2 18.2 17.8 17.6 17.7 19.3 19.5 17.8 17.4 15.7 12.6 22.8 -65.8 29.2 18.4 15.2
Seychelles 51.2 44.2 40.0 42.2 41.3 35.2 63.1 64.7 39.0 31.6 25.8 25.3 19.3 20.1 19.3 37.5 -62.3 45.3 37.3 19.6
Sierra Leone 41.0 43.2 51.5 47.4 53.9 53.9 56.2 54.3 54.0 53.8 52.0 48.4 45.6 47.7 48.4 50.1 18.0 49.6 52.5 47.2
South Africa 3.8 4.0 4.4 4.7 3.8 2.9 0.8 0.8 0.7 0.6 0.9 1.2 1.3 1.3 1.0 2.2 -74.1 3.5 0.8 1.2
Swaziland 50.3 51.5 52.9 53.4 54.9 53.6 52.4 55.3 55.0 52.1 62.1 60.0 59.9 69.2 66.1 56.6 31.4 52.7 56.9 65.1
Tanzania 12.9 15.6 16.0 15.2 14.4 14.2 12.9 11.2 9.2 9.6 11.7 12.4 9.6 9.8 8.8 12.2 -31.4 14.5 10.8 9.4
Uganda 45.0 42.3 17.5 10.8 10.3 10.9 11.3 13.7 10.1 10.0 12.9 11.8 12.3 12.0 11.6 16.2 -74.2 21.2 11.7 12.0
Zambia 38.4 42.0 12.9 13.6 17.2 17.1 13.1 11.6 13.1 11.6 12.0 11.8 11.8 10.5 14.3 16.7 -62.8 22.0 12.0 12.2
Zimbabwe 21.7 18.7 18.9 18.8 18.0 15.3 10.4 13.5 9.6 7.0 12.0 9.7 13.2 5.6 35.0 15.2 61.3 17.4 10.4 17.9
Averages:
--All Anglophone Africa 31.5 31.5 28.7 27.2 29.1 27.1 27.7 27.5 24.6 23.4 25.7 24.5 24.9 25.3 26.0 27.0 -17.2 28.9 25.1 25.4
--SACU countries2 35.3 34.1 34.7 34.6 34.4 34.7 33.9 33.5 31.5 30.0 34.9 34.4 38.4 41.9 40.7 35.1 15.5 34.5 32.9 40.3
--Non-SACU Anglophone Southern Africa3 30.0 29.4 23.5 21.7 21.7 18.9 18.1 16.8 16.4 13.9 15.7 14.8 14.6 11.2 18.9 19.0 -37.0 23.3 15.5 14.9
--Anglophone East Africa4 31.1 31.4 24.0 23.2 21.2 18.4 24.0 24.9 17.5 17.4 16.8 15.8 13.8 13.9 12.8 20.4 -58.8 24.8 18.5 13.5
--Anglophone West Africa5 28.6 30.6 32.1 28.3 37.7 34.6 33.1 32.6 31.4 30.4 33.3 31.0 30.5 31.5 30.3 31.7 5.9 32.0 31.7 30.8
Source: IMF country reports; World Bank: World Development Indicators Database; and country websites.1 Liberia from 1997. 2 Botswana, Lesotho, Namibia, South Africa and Swaziland. 3 Malawi, Mauritius, Zambia and Zimbabwe. 4 Kenya, Rwanda, Seychelles, Tanzania and Uganda.5 Gambia, Ghana, Liberia and Nigeria.
39
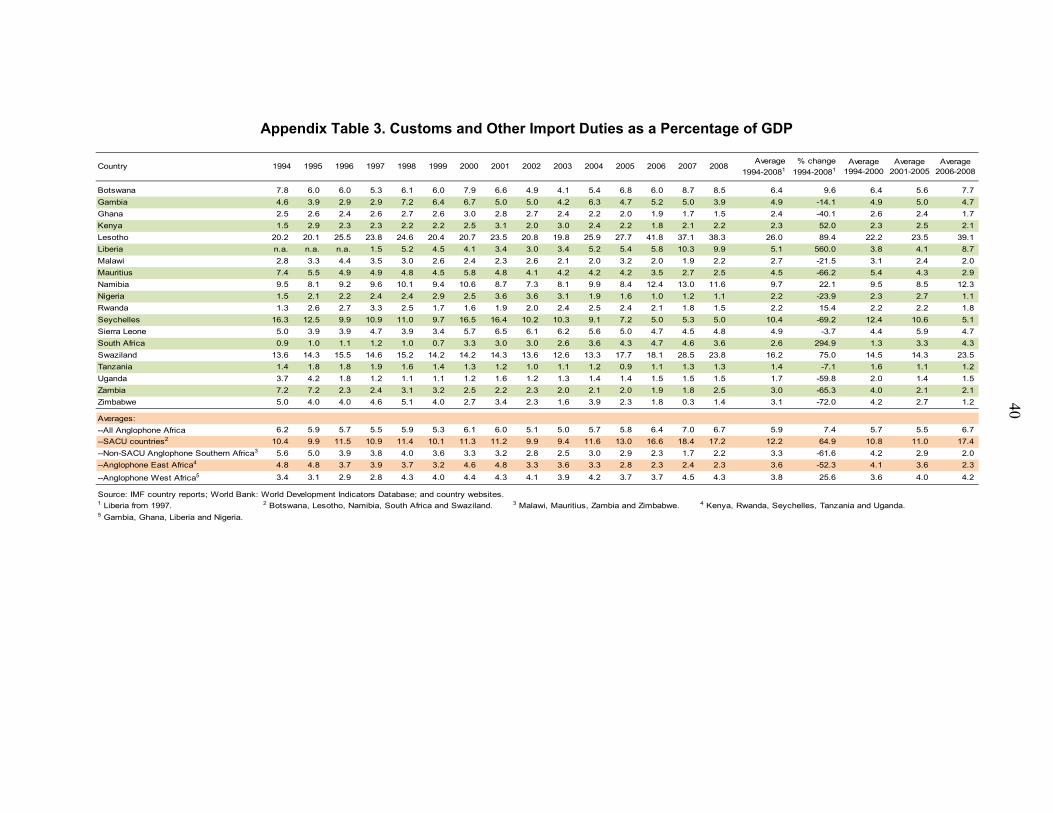
Appendix Table 3. Customs and Other Import Duties as a Percentage of GDP
Country 1994 1995 1996 1997 1998 1999 2000 2001 2002 2003 2004 2005 2006 2007 2008Average
1994-20081
% change
1994-20081Average
1994-2000Average
2001-2005Average
2006-2008
Botswana 7.8 6.0 6.0 5.3 6.1 6.0 7.9 6.6 4.9 4.1 5.4 6.8 6.0 8.7 8.5 6.4 9.6 6.4 5.6 7.7
Gambia 4.6 3.9 2.9 2.9 7.2 6.4 6.7 5.0 5.0 4.2 6.3 4.7 5.2 5.0 3.9 4.9 -14.1 4.9 5.0 4.7
Ghana 2.5 2.6 2.4 2.6 2.7 2.6 3.0 2.8 2.7 2.4 2.2 2.0 1.9 1.7 1.5 2.4 -40.1 2.6 2.4 1.7
Kenya 1.5 2.9 2.3 2.3 2.2 2.2 2.5 3.1 2.0 3.0 2.4 2.2 1.8 2.1 2.2 2.3 52.0 2.3 2.5 2.1
Lesotho 20.2 20.1 25.5 23.8 24.6 20.4 20.7 23.5 20.8 19.8 25.9 27.7 41.8 37.1 38.3 26.0 89.4 22.2 23.5 39.1
Liberia n.a. n.a. n.a. 1.5 5.2 4.5 4.1 3.4 3.0 3.4 5.2 5.4 5.8 10.3 9.9 5.1 560.0 3.8 4.1 8.7
Malawi 2.8 3.3 4.4 3.5 3.0 2.6 2.4 2.3 2.6 2.1 2.0 3.2 2.0 1.9 2.2 2.7 -21.5 3.1 2.4 2.0
Mauritius 7.4 5.5 4.9 4.9 4.8 4.5 5.8 4.8 4.1 4.2 4.2 4.2 3.5 2.7 2.5 4.5 -66.2 5.4 4.3 2.9
Namibia 9.5 8.1 9.2 9.6 10.1 9.4 10.6 8.7 7.3 8.1 9.9 8.4 12.4 13.0 11.6 9.7 22.1 9.5 8.5 12.3
Nigeria 1.5 2.1 2.2 2.4 2.4 2.9 2.5 3.6 3.6 3.1 1.9 1.6 1.0 1.2 1.1 2.2 -23.9 2.3 2.7 1.1
Rwanda 1.3 2.6 2.7 3.3 2.5 1.7 1.6 1.9 2.0 2.4 2.5 2.4 2.1 1.8 1.5 2.2 15.4 2.2 2.2 1.8
Seychelles 16.3 12.5 9.9 10.9 11.0 9.7 16.5 16.4 10.2 10.3 9.1 7.2 5.0 5.3 5.0 10.4 -69.2 12.4 10.6 5.1
Sierra Leone 5.0 3.9 3.9 4.7 3.9 3.4 5.7 6.5 6.1 6.2 5.6 5.0 4.7 4.5 4.8 4.9 -3.7 4.4 5.9 4.7
South Africa 0.9 1.0 1.1 1.2 1.0 0.7 3.3 3.0 3.0 2.6 3.6 4.3 4.7 4.6 3.6 2.6 294.9 1.3 3.3 4.3
Swaziland 13.6 14.3 15.5 14.6 15.2 14.2 14.2 14.3 13.6 12.6 13.3 17.7 18.1 28.5 23.8 16.2 75.0 14.5 14.3 23.5
Tanzania 1.4 1.8 1.8 1.9 1.6 1.4 1.3 1.2 1.0 1.1 1.2 0.9 1.1 1.3 1.3 1.4 -7.1 1.6 1.1 1.2
Uganda 3.7 4.2 1.8 1.2 1.1 1.1 1.2 1.6 1.2 1.3 1.4 1.4 1.5 1.5 1.5 1.7 -59.8 2.0 1.4 1.5
Zambia 7.2 7.2 2.3 2.4 3.1 3.2 2.5 2.2 2.3 2.0 2.1 2.0 1.9 1.8 2.5 3.0 -65.3 4.0 2.1 2.1
Zimbabwe 5.0 4.0 4.0 4.6 5.1 4.0 2.7 3.4 2.3 1.6 3.9 2.3 1.8 0.3 1.4 3.1 -72.0 4.2 2.7 1.2
Averages:
--All Anglophone Africa 6.2 5.9 5.7 5.5 5.9 5.3 6.1 6.0 5.1 5.0 5.7 5.8 6.4 7.0 6.7 5.9 7.4 5.7 5.5 6.7
--SACU countries2 10.4 9.9 11.5 10.9 11.4 10.1 11.3 11.2 9.9 9.4 11.6 13.0 16.6 18.4 17.2 12.2 64.9 10.8 11.0 17.4
--Non-SACU Anglophone Southern Africa3 5.6 5.0 3.9 3.8 4.0 3.6 3.3 3.2 2.8 2.5 3.0 2.9 2.3 1.7 2.2 3.3 -61.6 4.2 2.9 2.0
--Anglophone East Africa4 4.8 4.8 3.7 3.9 3.7 3.2 4.6 4.8 3.3 3.6 3.3 2.8 2.3 2.4 2.3 3.6 -52.3 4.1 3.6 2.3
--Anglophone West Africa5 3.4 3.1 2.9 2.8 4.3 4.0 4.4 4.3 4.1 3.9 4.2 3.7 3.7 4.5 4.3 3.8 25.6 3.6 4.0 4.2
Source: IMF country reports; World Bank: World Development Indicators Database; and country websites.1 Liberia from 1997. 2 Botswana, Lesotho, Namibia, South Africa and Swaziland. 3 Malawi, Mauritius, Zambia and Zimbabwe. 4 Kenya, Rwanda, Seychelles, Tanzania and Uganda.5 Gambia, Ghana, Liberia and Nigeria.
40
40
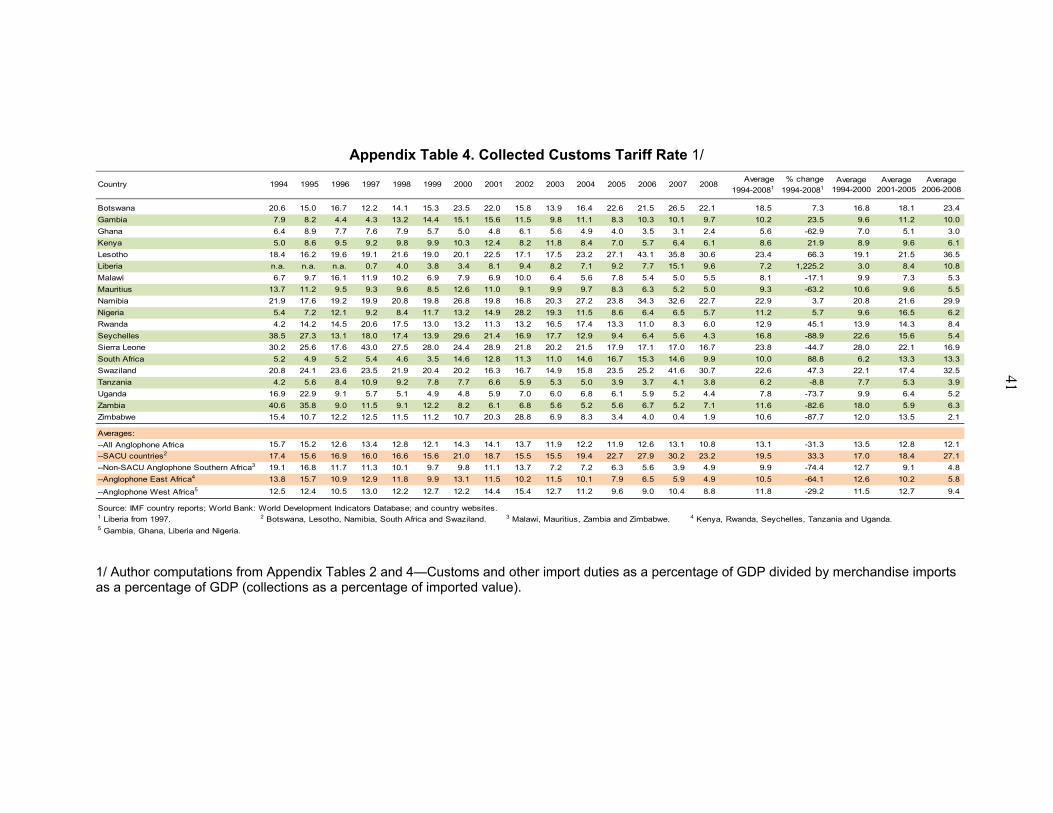
Appendix Table 4. Collected Customs Tariff Rate 1/
Country 1994 1995 1996 1997 1998 1999 2000 2001 2002 2003 2004 2005 2006 2007 2008Average
1994-20081
% change
1994-20081Average
1994-2000Average
2001-2005Average
2006-2008
Botswana 20.6 15.0 16.7 12.2 14.1 15.3 23.5 22.0 15.8 13.9 16.4 22.6 21.5 26.5 22.1 18.5 7.3 16.8 18.1 23.4
Gambia 7.9 8.2 4.4 4.3 13.2 14.4 15.1 15.6 11.5 9.8 11.1 8.3 10.3 10.1 9.7 10.2 23.5 9.6 11.2 10.0
Ghana 6.4 8.9 7.7 7.6 7.9 5.7 5.0 4.8 6.1 5.6 4.9 4.0 3.5 3.1 2.4 5.6 -62.9 7.0 5.1 3.0
Kenya 5.0 8.6 9.5 9.2 9.8 9.9 10.3 12.4 8.2 11.8 8.4 7.0 5.7 6.4 6.1 8.6 21.9 8.9 9.6 6.1
Lesotho 18.4 16.2 19.6 19.1 21.6 19.0 20.1 22.5 17.1 17.5 23.2 27.1 43.1 35.8 30.6 23.4 66.3 19.1 21.5 36.5
Liberia n.a. n.a. n.a. 0.7 4.0 3.8 3.4 8.1 9.4 8.2 7.1 9.2 7.7 15.1 9.6 7.2 1,225.2 3.0 8.4 10.8
Malawi 6.7 9.7 16.1 11.9 10.2 6.9 7.9 6.9 10.0 6.4 5.6 7.8 5.4 5.0 5.5 8.1 -17.1 9.9 7.3 5.3
Mauritius 13.7 11.2 9.5 9.3 9.6 8.5 12.6 11.0 9.1 9.9 9.7 8.3 6.3 5.2 5.0 9.3 -63.2 10.6 9.6 5.5
Namibia 21.9 17.6 19.2 19.9 20.8 19.8 26.8 19.8 16.8 20.3 27.2 23.8 34.3 32.6 22.7 22.9 3.7 20.8 21.6 29.9
Nigeria 5.4 7.2 12.1 9.2 8.4 11.7 13.2 14.9 28.2 19.3 11.5 8.6 6.4 6.5 5.7 11.2 5.7 9.6 16.5 6.2
Rwanda 4.2 14.2 14.5 20.6 17.5 13.0 13.2 11.3 13.2 16.5 17.4 13.3 11.0 8.3 6.0 12.9 45.1 13.9 14.3 8.4
Seychelles 38.5 27.3 13.1 18.0 17.4 13.9 29.6 21.4 16.9 17.7 12.9 9.4 6.4 5.6 4.3 16.8 -88.9 22.6 15.6 5.4
Sierra Leone 30.2 25.6 17.6 43.0 27.5 28.0 24.4 28.9 21.8 20.2 21.5 17.9 17.1 17.0 16.7 23.8 -44.7 28.0 22.1 16.9
South Africa 5.2 4.9 5.2 5.4 4.6 3.5 14.6 12.8 11.3 11.0 14.6 16.7 15.3 14.6 9.9 10.0 88.8 6.2 13.3 13.3
Swaziland 20.8 24.1 23.6 23.5 21.9 20.4 20.2 16.3 16.7 14.9 15.8 23.5 25.2 41.6 30.7 22.6 47.3 22.1 17.4 32.5
Tanzania 4.2 5.6 8.4 10.9 9.2 7.8 7.7 6.6 5.9 5.3 5.0 3.9 3.7 4.1 3.8 6.2 -8.8 7.7 5.3 3.9
Uganda 16.9 22.9 9.1 5.7 5.1 4.9 4.8 5.9 7.0 6.0 6.8 6.1 5.9 5.2 4.4 7.8 -73.7 9.9 6.4 5.2
Zambia 40.6 35.8 9.0 11.5 9.1 12.2 8.2 6.1 6.8 5.6 5.2 5.6 6.7 5.2 7.1 11.6 -82.6 18.0 5.9 6.3
Zimbabwe 15.4 10.7 12.2 12.5 11.5 11.2 10.7 20.3 28.8 6.9 8.3 3.4 4.0 0.4 1.9 10.6 -87.7 12.0 13.5 2.1
Averages:
--All Anglophone Africa 15.7 15.2 12.6 13.4 12.8 12.1 14.3 14.1 13.7 11.9 12.2 11.9 12.6 13.1 10.8 13.1 -31.3 13.5 12.8 12.1
--SACU countries2 17.4 15.6 16.9 16.0 16.6 15.6 21.0 18.7 15.5 15.5 19.4 22.7 27.9 30.2 23.2 19.5 33.3 17.0 18.4 27.1
--Non-SACU Anglophone Southern Africa3 19.1 16.8 11.7 11.3 10.1 9.7 9.8 11.1 13.7 7.2 7.2 6.3 5.6 3.9 4.9 9.9 -74.4 12.7 9.1 4.8
--Anglophone East Africa4 13.8 15.7 10.9 12.9 11.8 9.9 13.1 11.5 10.2 11.5 10.1 7.9 6.5 5.9 4.9 10.5 -64.1 12.6 10.2 5.8
--Anglophone West Africa5 12.5 12.4 10.5 13.0 12.2 12.7 12.2 14.4 15.4 12.7 11.2 9.6 9.0 10.4 8.8 11.8 -29.2 11.5 12.7 9.4
Source: IMF country reports; World Bank: World Development Indicators Database; and country websites.1 Liberia from 1997. 2 Botswana, Lesotho, Namibia, South Africa and Swaziland. 3 Malawi, Mauritius, Zambia and Zimbabwe. 4 Kenya, Rwanda, Seychelles, Tanzania and Uganda.5 Gambia, Ghana, Liberia and Nigeria.
1/ Author computations from Appendix Tables 2 and 4—Customs and other import duties as a percentage of GDP divided by merchandise imports as a percentage of GDP (collections as a percentage of imported value).
41
44
REFERENCES
Bornhorst, Fabian, Sanjeev Gupta, and John Thornton (July 2008), “Natural Resource Endowments, Governance, and the Domestic Revenue Effort: Evidence from a Panel of Countries,” WP/08/170 (Washington: International Monetary Fund).
Christ, Nannette, and Michael J. Ferrantino (2009), “Land Transport for Exports: The Effects of Cost, Time, and Uncertainty in Sub-Saharan Africa,” (U.S. International Trade Commission).
Coughlin, Cletus c. (September/October 2010), Measuring International Trade Policy: A Primer on Trade Restrictiveness Indices, pp. 381–94 (Federal Reserve Bank of St. Louis Review).
Crown Agents (February 19, 2010), “Facilitating Cross Border Trade: Presentation on the Concept of OSBP to the Oyo State Government Delegation,” www.cbcglobal.org.
Culpeper, Roy and Aniket Bhushan (July/August 2010), “Why Enhance Domestic Resource Mobilisation in Africa?” Trade Negotiations Insights, Issue 6, Volume 9, pp. 5–7, acp-eu-trade.org/library/files/tni_en_9-6.pdf
de Wulf, Luc, and José B. Sokol, editors (2005), Customs Modernization Handbook (Washington: World Bank).
________, (2004), Customs Modernization Handbook (Washington: World Bank).
François, Renaud, (January 2009), “Why Should World Governance Be Evaluated, and for What Purpose?” http://www.world-governance.org (Forum for a New World Governance).
Fofack, Hippolyte (May, 2010), “Fiscal Adjustment and Growth in Sub-Saharan Africa: Overview and Lessons from the Current Downturn,” Working Paper WPS5306, World Bank Institute, Poverty Reduction and Economic Management Division, World Bank.
Gordhan, Pravin (March 2007), Customs in the 21st Century, World Customs Journal, Vol. 1, No. 1, pp. 49–54.
Haughton, Michael, and Remi Desmeules (2001), Recent Reforms in Customs Administrations, The International Journal of Logistics Management, Vol. 12, No. 1, pp. 65–82.
Hausman, Warren H., Hau L. Lee, and Uma Subramanian (2005), “Global Logistics Indicators, Supply Chain Metrics, and Bilateral Trade Patterns,” Fifth Draft (October 10, 2005) (Washington: World Bank).
Heaver, Trevor D. (1992), The Role of Customs Administration in the Structure and Efficiency of International Logistics: An International Comparison, The International Journal of Logistics Management, Vol. 3, No. 1, pp. 63–72.
Hors, Irène (2001), “Fighting Corruption in Customs Administration: What Can We Learn From Recent Experiences?” Working Paper No. 175, OECD Development Centre.
Imam, Patrick, and Davina Jacobs (2007), “Effect of Corruption on Tax Revenues in the Middle East,” IMF Working Paper WP/07/270 (Washington: International Monetary Fund).
44
Institute of Management Accountants, (2008), Managing the Total Costs of Global Supply Chains, Statements of Management Accounting No. 67.
International Chamber of Commerce, http://www.iccwbo.org/.
International Monetary Fund, various country reports.
Kaufmann, Daniel, Aart Kraay, and Massimo Mastruzzi (June 2009), "Governance Matters VI: Governance Indicators for 1996–2008" World Bank Policy Research Working Paper No. 4978 (Washington: World Bank).
Keen, Michael, and Mario Mansour (2009), “Revenue Mobilization in Sub-Saharan Africa: Challenges from Globalization,” WP/09/157 (Washington: International Monetary Fund.
________, ed. (2003), “Changing Customs: Challenges and Strategies for the Reform of Customs Administration,” (Washington: International Monetary Fund).
Kloeden, David, forthcoming, “Revenue Administration Reforms in Anglophone Africa since the Early-1990s,” IMF Working Paper (Washington: International Monetary Fund).
Lane, Michael H. (1998), Customs Modernization and the International Trade Superhighway (Greenwood Press).
Lorenz, Akiva J. (February 28, 2008), “US Container Security: Feasible or Fantasy,” http://www.maritimeterrorism.com/2008/02/28/us-container-security-feasible-or-fantasy/
Munyaradzi, Ranga (March 2009), “Technical Report: TKC Authorized Economic Operators Based Accreditation Scheme,” a report submitted to USAID/South Africa, Southern Africa Global Competitiveness Hub.
Portugal-Perez, Alberto, and John S. Wilson (June 2008), “Lowering Trade Costs for Development in Africa: A Summary Overview,” Development Research Group, Working Draft (Washington: The World Bank).
Sawhney, Ranjeev, and Narendar Sumukadas (2005), Coping with Customs Clearance Uncertainties in Global Sourcing, International Journal of Physical Distribution and Logistics Management, Vol. 35, No. 4, pp. 278–95.
Stasavage, David and Cécile Daubrée (1998), “Determinants of Customs Fraud and Corruption: Evidence from Two African Countries,” Working Paper No. 138, OECD Development Centre.
South African Revenue Service, Annual Report 2008/09.
UNCTAD, (January 2008), “Use of Customs Automation Systems,” Trust Fund for Trade Facilitation Negotiations Technical Note No. 3 (New York).
________, (July 2008), “Separating Release from Clearance Procedures”, Trust Fund for Trade Facilitation Negotiations Technical Note No.19 (New York).
USAID, (May 2009), “Customs Clearance Issues Related to the Import of Goods for Public Health Programs,” Deliver Project Task Order 1.
44
van den Bosch, Servaas (March 17, 2010), “Southern Africa: Unexpected Low Custom Revenue Causes Budget Shortfalls,” http://www.globalissues.org/news/2010/03/17/4884 (Inter Press Service).
Wilson, Norbert L. W. (2007), What a Difference a Day Makes: An Estimate of Potential Gains from Trade Facilitation, Selected Paper # 174227, prepared for presentation at the American Agricultural Economics Association Annual Meeting, July 29–August 1, 2007 (Portland, Oregon).
World Bank (2006), “Where is the Wealth of Nations: Measuring Capital for the 21st Century,” (Washington: The World Bank).
________, (2007), “Confronting the Challenges of Gender Equality and Fragile States,” Global Monitoring Report 2007 (Washington: World Bank).
________, World Bank Development Indicators Database, http://data.worldbank.org/ (Washington: World Bank).
_________, World Bank, Doing Business 2009 Report (Washington: World Bank).
_________, World Bank, Logistics Performance Index, http://info.worldbank.org/etools/tradesurvey/mode1b.asp (Washington: World Bank).
World Customs Organization (June 2007), “A Capacity Building Estimate: Moving from Words to Action,” WCO Trends and Patterns Report, Issue One.
_________, “Compendium of Authorized Economic Operator (AEO) Programmes” www.tulli.fi/fi/yrityksille/asiakkaana.../AEO/.../WCO_kooste.pdf
World Trade Organization, (January 2010), “Trade and Market Access Data for Policy Makers.”


