Customer perceptions of fairness in hotel revenue management./67531/metadc4934/m2/1/high... ·...
135
APPROVED: Johnny Sue Reynolds, Major Professor Lou E. Pelton, Minor Professor Bharath Josiam, Committee Member Lea Dopson, Chair of the Division of Hospitality Management Judith Forney, Dean of the School of Merchandising and Hospitality Management Sandra L. Terrell, Dean of the Robert B. Toulouse School of Graduate Studies CUSTOMER PERCEPTIONS OF FAIRNESS IN HOTEL REVENUE MANAGEMENT Punit Sanghavi, B.S. Thesis Prepared for the Degree of MASTER OF SCIENCE UNIVERSITY OF NORTH TEXAS December 2005
Transcript of Customer perceptions of fairness in hotel revenue management./67531/metadc4934/m2/1/high... ·...

APPROVED: Johnny Sue Reynolds, Major Professor Lou E. Pelton, Minor Professor Bharath Josiam, Committee Member Lea Dopson, Chair of the Division of
Hospitality Management Judith Forney, Dean of the School of
Merchandising and Hospitality Management
Sandra L. Terrell, Dean of the Robert B. Toulouse School of Graduate Studies
CUSTOMER PERCEPTIONS OF FAIRNESS IN HOTEL REVENUE MANAGEMENT
Punit Sanghavi, B.S.
Thesis Prepared for the Degree of
MASTER OF SCIENCE
UNIVERSITY OF NORTH TEXAS
December 2005

Sanghavi, Punit. Customer perceptions of fairness in hotel revenue
management. Master of Science (Hospitality Management), December 2005, 123 pp.,
60 tables, references, 21 titles.
The purpose of the study was to determine customer perceptions of fairness
concerning pricing policies charged by the hotel industry, and to examine how different
outcomes in pricing policies affect customer perceptions of fairness.
Convenience-Interception survey sampling was used to collect 460 sample data
at the Dallas Love Field Airport. After analyzing data, one can infer that when revenue
management information was provided, customers are satisfied. Further, age,
education, Airline FFP enrolled and redeem miles, and pricing based on marketing
channels plays an imperative role in this study.

ii
Copyright 2005
by
Punit Sanghavi

iii
ACKNOWLEDGMENTS
I would like to express my sincere appreciation to my major professor, Dr.
Johnny Sue Reynolds, whose gentle guidance caused me to discover capabilities within
myself of which I was unaware. I give special thank to my committee: Dr. Lou E. Pelton
in assisting me periodically, Dr. Bharath Josiam in motivating me, and Dr. Priscilla
Connors who graciously gave her time and talents into the thesis.
More personally, I thank Dallas Love Field Airport, specifically Mr. Robert Miville
and his staff without which the “survey” process would have been a bigger mountain to
climb.
I give heartfelt thanks to my parents and my brother in Mumbai, India for
supporting, encouraging, and believing in me in-spite staying thousands miles away.
Close to my heart I thank my cousins, aunts, and uncles who have been there for
every moment when I needed them.
iv
TABLE OF CONTENTS
Page
ACKNOWLEDGMENTS................................................................................................iii LIST OF TABLES.........................................................................................................vii Chapters
I. INTRODUCTION ..................................................................................... 1 Purpose of the Study Research Questions Rationale Limitations Assumptions Operational Definitions
II. REVIEW OF LITERATURE ................................................................... 11
Introduction Review of Previous Research
Revenue Management Customer Satisfaction Perceived Price Fairness Customers’ Evaluation of Fairness
Distributive Justice Procedural Justice Interactional Justice
Summary III. METHODOLOGY .................................................................................. 20
Research Design Data Collection Instrument Development Statistical Analysis Conclusion
v
IV. DATA ANALYSIS................................................................................... 33 Introduction Characteristics of Sample Frequency Analysis Report
Demographic Profile of Respondents Hotel Frequent Guest Program Enrolled &Redeemed Airline Frequent Flier Program Enrolled & Redeemed Ethical Issues Frequent Travelers Fixed Price and Negotiated Pricing Hotel Revenue Management Information Provided Hotel Revenue Management Information Not Provided Customer Satisfaction
Statistical Analysis Research Question 1 Research Question 2 Research Question 3
V. SUMMARY, IMPLICATIONS AND RECOMMENDATIONS................. 101
Summary of Findings Research Question 1 Research Question 2 Research Question 3
Limitations Implications Recommendations
Appendices
A. QUESTIONNAIRE ............................................................................... 112 B. SUMMARY OF INSTRUMENT BY VARIABLES AND TYPE OF DATA
............................................................................................................. 116

vi
C. INSTITUTIONAL REVIEW BOARD APPROVAL................................. 119 REFERENCES.......................................................................................................... 121

vii
LIST OF TABLES
Page
1. Frequency for Demographics ........................................................................... 35
2. Frequency for Hotel Frequent Guest Program Enrolled & Redeemed.............. 36
3. Frequency for Airline Frequent Flier Program Enrolled & Redeemed............... 36
4. Frequency for Ethical Issues ............................................................................ 38
5. Frequency for Frequent Travelers .................................................................... 39
6. Frequency of Fixed & Negotiated Pricing for Business & Leisure Travelers..... 41
7. Frequency of Hotel Revenue Management Information Provided .................... 42
8. Frequency of Hotel Revenue Management Information not Provided .............. 43
9. Frequency for Customer Satisfaction (Scenario 1,2,3,4 & 5)............................ 45
10. Significant & Non-Significant Variables for Research Question 1..................... 46
11. Research Question 1: Cross-tabulation Analysis for Relationship Between Hotel Revenue Management Information Provided & Gender ................................... 47
12. Research Question 1: ANOVA Analysis for Relationship Between Hotel Revenue Management Information Provided & Gender .................................................. 48
13. Research Question 1: ANOVA Analysis for Relationship Between Hotel Revenue Management Information Provided & Ethical Issue Relating to Customer Perceptions of Pricing Fluctuations Based on Marketing Channel ................... 48
14. Research Question 1: Pearson’s correlation Analysis for Relationship Between Hotel Revenue Management Information Provided & Age & Leisure-Negotiated Price ................................................................................................................. 49
15. Significant & Non-Significant Variables for Research Question 2..................... 50
16. Research Question 2: Cross-tabulation Analysis for Relationship Between Hotel Revenue Management Information not Provided & Gender ............................. 51
17. Research Question 2: Cross-tabulation Analysis for Relationship Between Hotel Revenue Management Information not Provided & Ethnicity ........................... 52
18. Research Question 2: Cross-tabulation Analysis for Relationship Between Hotel Revenue Management Information not Provided & Ethical Issue Relating to Customer Perceptions of Capitalism as a Basis for Market-Based Pricing....... 53
viii
19. Research Question 2: ANOVA Analysis for Relationship Between Hotel Revenue Management Information not Provided & Gender ............................................ 54
20. Research Question 2: ANOVA Analysis for Relationship Between Hotel Revenue Management Information not Provided & Customer who were Enrolled in Hotel Frequent Guest Program.................................................................................. 55
21. Research Question 2: ANOVA Analysis for Relationship Between Hotel Revenue Management Information not Provided & Ethical Issue Relating to Customer Perceptions of Capitalism as a Basis for Market-Based Pricing ....................... 56
22. Research Question 2: Pearson’s correlation Analysis for Relationship Between Hotel Revenue Management Information not Provided & Age ......................... 57
23. Significant and Non-Significant Variables for Research Question 3: Relationship Between Respondent Perceptions of Inconsistency in Pricing Across Multiple Visits and Other Variables– Scenario 1 ............................................................ 58
24. Research Question 3: Cross-tabulation Analysis for Relationship Between Scenario 1 & Customer who were Enrolled in Airline Frequent Flier Program ......................................................................................................................... 59
25. Research Question 3: Cross-tabulation Analysis for Relationship Between Scenario 1 & Customer who Redeemed Airline Frequent Flier Program Miles ......................................................................................................................... 60
26. Research Question 3: Cross-tabulation Analysis for Relationship Between Scenario 1 & Ethical Issue Relating to Customer Perceptions of Capitalism as a Basis for Market- Based Pricing ....................................................................... 61
27. Research Question 3: Cross-tabulation Analysis for Relationship Between Scenario 1 & Ethical Issue Relating to Customer Perceptions of Seasonal Price Adjustments...................................................................................................... 62
28. Research Question 3: Cross-tabulation Analysis for Relationship Between Scenario 1 & Ethical Issue Relating to Customer Perceptions of Pricing Fluctuations Based on Marketing Channel ....................................................... 63
29. Research Question 3: ANOVA Analysis for Relationship Between Scenario 1 & Ethical Issue Relating to Customer Perceptions of Pricing Fluctuations Based on Marketing Channel ........................................................................................... 64
30. Research Question 3: Pearson’s correlation Analysis for Relationship Between Scenario 1 & Level of Education, Leisure Fixed Price, & Hotel Revenue Management Information not Provided............................................................. 65

ix
31. Significant and Non-Significant Variables for Research Question 3: Relationship Between Respondent Perceptions of Inconsistency in Pricing Across Multiple Visits & Other Variables – Scenario 2............................................................... 67
32. Research Question 3: Cross-tabulation Analysis for Relationship Between Scenario 2 & Gender ........................................................................................ 68
33. Research Question 3: Cross-tabulation Analysis for Relationship Between Scenario 2 & Ethnicity ...................................................................................... 69
34. Research Question 3: Cross-tabulation Analysis for Relationship Between Scenario 2 & Customer who Redeem Hotel Frequent Guest Program Points ......................................................................................................................... 70
35. Research Question 3: Cross-tabulation Analysis for Relationship Between Scenario 2 & Ethical Issue Relating to Customer Perceptions of Pricing Fluctuations Based on Marketing Channel ....................................................... 71
36. Research Question 3: ANOVA Analysis for Relationship Between Scenario 2 & Ethnicity ............................................................................................................ 73
37. Research Question 3: ANOVA Analysis for Relationship Between Scenario 2 & Customer who Redeem Hotel Frequent Guest Program Points ....................... 74
38. Research Question 3: ANOVA Analysis for Relationship Between Scenario 2 & Customer who were Enrolled in Airline Frequent Flier Program....................... 74
39. Research Question 3: ANOVA Analysis for Relationship Between Scenario 2 & Customer who Redeem Airline Frequent Flier Program Miles.......................... 75
40. Research Question 3: ANOVA Analysis for Relationship Between Scenario 2 & Ethical Issue Relating to Customer Perceptions of Pricing Fluctuations Based on Marketing Channel ........................................................................................... 76
41. Research Question 3: Pearson’s correlation Analysis for Relationship Between Scenario 2 & Age, Income, Level of Education, & Frequency of Business Travelers .......................................................................................................... 77
42. Significant and Non-Significant Variables for Research Question 3: Relationship Between Respondent Perceptions of Inconsistency in Pricing Across Individuals & Other Variables – Scenario 3 ........................................................................ 79
43. Research Question 3: Cross-tabulation Analysis for Relationship Between Scenario 3 & Ethnicity ...................................................................................... 80
44. Research Question 3: Cross-tabulation Analysis for Relationship Between Scenario 3 & Customer who were Enrolled in Hotel Frequent Guest Program 81

x
45. Research Question 3: Cross-tabulation Analysis for Relationship Between Scenario 3 & Ethical Issue Relating to Customer Perceptions of Capitalism as a Basis for Market-based Pricing......................................................................... 82
46. Research Question 3: Cross-tabulation Analysis for Relationship Between Scenario 3 & Ethical Issue Relating to Customer Perceptions of Pricing Fluctuations Based on Marketing Channel ....................................................... 83
47. Research Question 3: ANOVA Analysis for Relationship Between Scenario 3 & Ethical Issue Relating to Customer Perceptions of Pricing Fluctuations Based on Marketing Channel ........................................................................................... 84
48. Research Question 3: Pearson’s correlation Analysis for Relationship Between Scenario 3 & Hotel Revenue Management Information not Provided............... 85
49. Significant and Non-Significant Variables for Research Question 3: Relationship Between Respondent Perceptions of Inconsistency in Pricing Across Individuals & Other Variables – Scenario 4 ........................................................................ 86
50. Research Question 3: Cross-tabulation Analysis for Relationship Between Scenario 4 & Ethnicity ...................................................................................... 87
51. Research Question 3: Cross-tabulation Analysis for Relationship Between Scenario 4 & Customer who were Enrolled in Airline Frequent Flier Program ......................................................................................................................... 88
52. Research Question 3: ANOVA Analysis for Relationship Between Scenario 4 & Gender ............................................................................................................. 89
53. Research Question 3: ANOVA Analysis for Relationship Between Scenario 4 & Customer who were Enrolled in Airline Frequent Flier Program....................... 90
54. Research Question 3: Pearson’s correlation Analysis for Relationship Between Scenario 4 & Age, Leisure-fixed Price, Business Negotiated Price, Leisure Negotiated Price, & Hotel Revenue Management Information Not Provided.... 91
55. Significant and Non-Significant Variables for Research Question 3: Relationship Between Respondent Perceptions Related to Room Upgrades for Hotel Frequent Guest Program Enrollees – Scenario 5 ............................................................ 94
56. Research Question 3: Cross-tabulation Analysis for Relationship Between Scenario 5 & Ethical Issue Relating to Customer Perceptions of Seasonal Price Adjustments...................................................................................................... 95
57. Research Question 3: ANOVA Analysis for Relationship Between Scenario 5 & Ethical Issue Relating to Customer Perceptions of Capitalism as a Basis for Market-Based Pricing ....................................................................................... 96

xi
58. Research Question 3: Pearson’s correlation Analysis for Relationship Between Scenario 5 & Frequency of Leisure Travelers & Business Negotiated Price .... 97
59. Summary Findings & Issues Related: Cross-tabulation Analysis for Gender & Frequent Business Traveler.............................................................................. 99
60. Summary Findings & Issues Related: Cross-tabulation Analysis for Ethnicity & Frequent Business Traveler.............................................................................. 99
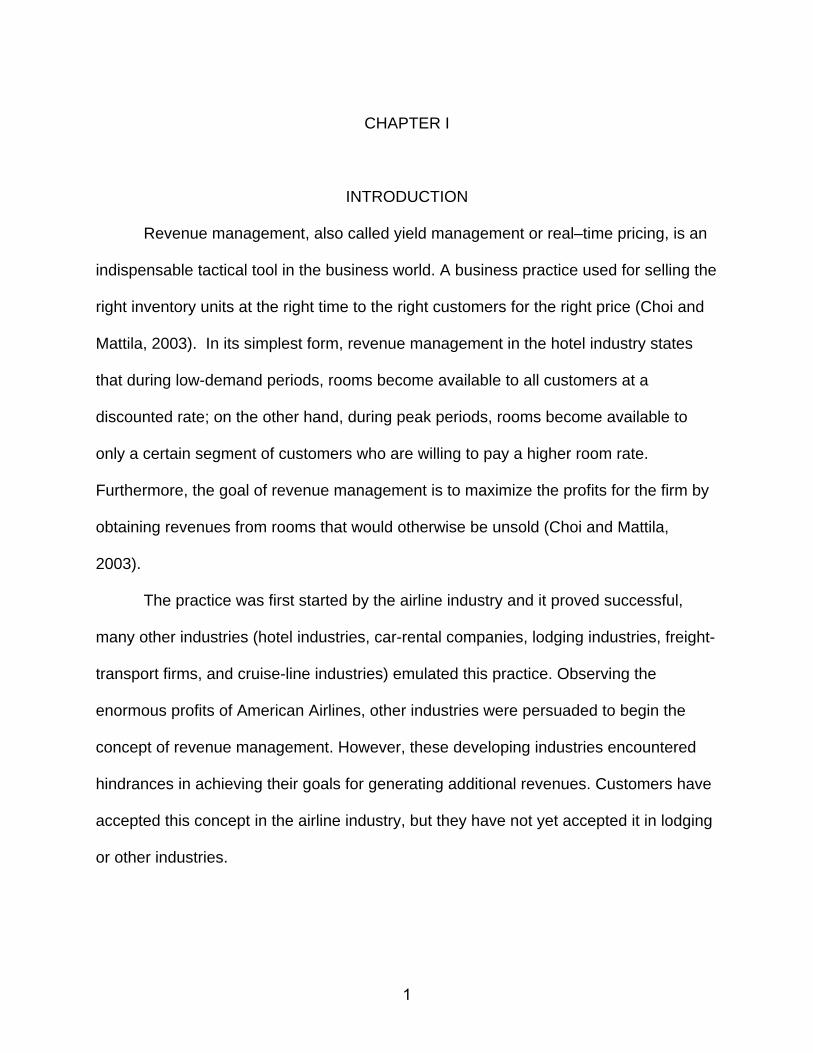
CHAPTER I
INTRODUCTION
Revenue management, also called yield management or real–time pricing, is an
indispensable tactical tool in the business world. A business practice used for selling the
right inventory units at the right time to the right customers for the right price (Choi and
Mattila, 2003). In its simplest form, revenue management in the hotel industry states
that during low-demand periods, rooms become available to all customers at a
discounted rate; on the other hand, during peak periods, rooms become available to
only a certain segment of customers who are willing to pay a higher room rate.
Furthermore, the goal of revenue management is to maximize the profits for the firm by
obtaining revenues from rooms that would otherwise be unsold (Choi and Mattila,
2003).
The practice was first started by the airline industry and it proved successful,
many other industries (hotel industries, car-rental companies, lodging industries, freight-
transport firms, and cruise-line industries) emulated this practice. Observing the
enormous profits of American Airlines, other industries were persuaded to begin the
concept of revenue management. However, these developing industries encountered
hindrances in achieving their goals for generating additional revenues. Customers have
accepted this concept in the airline industry, but they have not yet accepted it in lodging
or other industries.
1

In the hotel industry, the perception of customers being treated fairly has not
been studied sufficiently by researchers (Kimes, 2002). A customer perception of
fairness fluctuates immensely in regard to the room pricing policy. Furthermore, this
type of pricing policy can ostracize customers due to perceived unfairness, leading to
decreased customer satisfaction and lower revenues. Customers believe that firms are
entitled to some profits, but when the profit margin of room rates increases substantially
without any explicit reason, customers feel that this is unfair treatment and may take
their business elsewhere. Kimes (2002, p.3) mentions, “Customers believe that the
value to the firm should equal the value to the customers.” Researchers have proved
that it is important for the hotel industry to maintain good relationships with customers,
not only for the short term but also for the long term, in order to generate more revenue
(Bolton al et., 2003). It is vital that customers perceive Hotel Revenue Management
(HRM) practices as fair, in order for this practice to be viewed positively. Hotel operators
have to collect their competitors’ data, predict the future market accurately, and set the
right price for rooms at the right time. To achieve long-term positive results in HRM and
to attain optimistic customers’ perception is vital in this research study (Kimes, 2002).
However, past researchers have shown that hotel operators using revenue
management processes focus on short-term profits rather than long-term profits,
ignoring the issue of customer perception of fairness. This imbalance between long-
term profits and short-term profits has led to appalling results in the hotel industry
(Lieberman, 2002). Additionally, according to Zeithaml (1988), monetary price is not
equal to the target price in customer minds. Changing this human perception about fair
market price was a challenging dilemma.
2
Purpose of the Study
The purpose of this study was to determine customer perceptions of fairness
concerning pricing policies charged by the hotel industry and to examine how different
outcomes in pricing policies affect customer perceptions of fairness.
Research Questions
1) What was the relationship between revenue management information provided
and…
a) Customer demographics (gender, age, income, level of education, and
ethnicity), frequent business and leisure travelers, booking a hotel room
(fixed price and negotiated price)?
b) Customer who were enrolled and who redeemed Hotel Frequent Guest
Program (HFGP), customer who were enrolled and who redeemed Airline
Frequent Flyer Program (FFP), ethical issues relating to customer
perceptions of capitalism as a basis for market-based pricing, customer
perception of seasonal price adjustments, and customer perceptions of
pricing fluctuations based on marketing channels?
2) What was the relationship between revenue management information not
provided and…
a) Customer demographics (gender, age, income, level of education, and
ethnicity), frequent business and leisure travelers, booking a hotel room
(fixed price and negotiated price)?
b) Customer who were enrolled and who redeemed Hotel Frequent Guest
Program (HFGP), customer who were enrolled and who redeemed Airline
3

Frequent Flyer Program (FFP), ethical issues relating to customer
perceptions of capitalism as a basis for market-based pricing, customer
perception of seasonal price adjustments, and customer perceptions of
pricing fluctuations based on marketing channels?
3) What was the relationship between each of the respondent’s perception related
to inconsistency in pricing across multiple visits (Scenario1 and 2), inconsistency
in pricing across individuals (Scenario 3 and 4), room upgrades for HFGP
enrollees (Scenario 5) and…
a) Customer demographics (gender, age, income, level of education, and
ethnicity), frequent business and leisure travelers, way of booking (fixed
price and negotiated price) a hotel room by leisure and business
travelers?
b) Customer who were enrolled and who redeemed Hotel Frequent Guest
Program (HFGP), customer who were enrolled and who redeemed Airline
Frequent Flyer Program (FFP), revenue management information
provided and not provided to respondents, ethical issues relating to
customer perceptions of capitalism as a basis for market-based pricing,
customer perception of seasonal price adjustments, and customer
perceptions of pricing fluctuations based on marketing channels?
Rationale
According to Oliver’s study (1981), customers assess service quality and price by
“equity” and then express their satisfaction and dissatisfaction about the products or
services rendered. Additionally, Campbell (1999) mentioned that customer perception
4
affects customer satisfaction and customer behavior when they exchange money for
services. Therefore, it is critical that customers and service providers exchange funds
and services appropriately without making their customers unhappy.
If followed systematically, revenue management can create enormous profits in
many different industries. Ellis and Mayer (1997) imply that Las Vegas hotels almost
doubled revenues and room sales by applying the revenue management concept.
In the hotel industry, not much research has taken into consideration the effects
of customer perceptions and the concept of revenue management together (Kimes,
2002). Furthermore, Noone, Kimes, and Renaghan (2003) found that there have not
been any hotel organizations, which experienced long-run profitability and fair customer
perception. Additionally, Noon et al. (2003) mentioned that the hotel industry should
improve its technology, so revenue management can be implemented in an optimum
manner. Belobaba (2001) also stated that there is an extensive need for improvement in
the revenue management system and forecasting of rooms in the hotel industry. Choi
and Mattila (2003) support the need for further study of revenue management by stating
that there are no appropriate measures taken by hotel industries which practice revenue
management regarding customer perceptions. This led to dissatisfaction among
customers. From the above studies, it is clear that further investigation of HRM and its
effects on customer perception of fairness is necessary.
5
Limitations
Before implementing the research study there were few challenges, which
needed some attention. First, only similar hotels could be compared to each other. For
example, research should be done with customers who were staying in Marriott Hotels
and Hyatt Hotels; on the other hand, research cannot be done among customers who
were staying in Marriott Hotels and Super 8 Motels because it was difficult to compare
perception of hotels and motels.
Secondly, from the company’s point of view it was difficult to analyze customer-
spending expectations. For example, customers whose income is high ($100,000 or
more a year) and have paid a $200 room rate (maximum rack rate) for one night expect
more from the hotel and its services than a customer whose income is average
($45,000-$55,000 a year) and has paid a $99 room rate for one night.
The third limitation is the customer’s knowledge of other room rates in the market
place in which the customer will reside. The knowledge of other room rates affects the
customer’s perception of fairness.
The fourth limitation was that the study only represented U.S customer
perceptions of HRM. It did not take into consideration customers who were staying
outside the U.S. The fifth limitation was that it was difficult whether the customer meant
“Hotel” or “Motel” as these two words were used interchangeably.
Assumptions
For the purpose of this study, it was assumed that the survey questions were
answered truthfully, and that the regulatory information obtained was current.
6

Operational Definitions
Business traveler – Customers who travel for business-related work. These customers
are less price-sensitive toward room rates (Vallen & Vallen, 1991).
Customer perception – How customers visualize and value the products or services
rendered by companies or organizations.
Customer behavior – Reactions customers exhibit when obtaining, consuming, and
disposing of products and services (Blackwell et al., 2001).
Customer confidence – The influence of the consumption process on what customers
think will happen in the future (Blackwell et al., 2001).
Customer knowledge – The total amount of information stored in the memory about a
relevant product or service provided to the customers (Blackwell et al., 2001).
Customer satisfaction – This takes place when customers’ exchange money for room(s)
or services rendered by the hotel and the customer is psychologically happy, neutral, or
disappointed with the given exchange (Bei et al.,2001).
Capitalism – An economic system of free market where private and individual
companies compete for the economic growth.
Demand forecasting – Predicting the amount of sales or profits for a product or services
for a company.
Equity – a justice (right or wrong) applied when the exchange of price and service
happens which is influenced by the principles of ethics and fairness.
Ethical – Conforming to approve standards of social or professional behavior.
Front office – The place in the hotel lobby where guest services are managed and
coordinated (Vallen & Vallen,1991).
7

Group travelers – The number of persons with whom the hotel deals as if they are one
party. The hotel bills only one invoice to the company who is paying for rooms, food and
other services (Vallen & Vallen,1991).
Hotels – The term hotel is a type of accommodation where customers ranging from 25
people or more can stay for a given period of time in exchange for money. Furthermore,
the hotel should at least have a swimming pool, a restaurant, and room service,
capabilities (Vallen & Vallen, 1991).
Hotel operator – This person is responsible for the front and back of the house,
including the front office, restaurant, kitchen, guest rooms, and services provided to the
customers in the hotel (Vallen & Vallen, 1991).
HRM – Hotel Revenue Management.
Leisure traveler – Customers who travel for pleasure and entertainment for a specific
period of time. These customers are very price-sensitive toward room rates (Vallen &
Vallen,1991).
Market analysis – The process of analyzing the change in customer trends, current and
potential competitors, technology, company strengths and resources, and economic
environments (Blackwell et al., 2001).
Market segment – A group of customers with similar needs, behaviors, and other
characteristics, identified through the market segmentation process (Blackwell et al.,
2001).
Marketing concept – “The process of planning and executing the conception, pricing,
promotions, distribution of goods and services that satisfy individual and organizational
objectives” (Blackwell et al., 2001).
8

Monetary price – The money the customer is willing to pay when the services are
rendered.
Perceived fairness – How customers think a transaction is conducted and how much a
given service should cost for the rooms or services provided to the customers (Bei et
al., 2001).
Price – The consideration in money given for the purchase of services or products
provided by a company (Vallen & Vallen, 1991).
Rack rate – The standard room rate posted by the hotel.
Revenue Management/ Yield Management/ Real Time Pricing – “An iterative closed-
loop process that employs statistical and financial models to measure customer demand
and optimize prices and promotions consistent with category and enterprise goals for
revenue, profit and price image” (Marriott, 2001) For this study, revenue management
will be used to describe the following in terms of the hotel industry.
Scenario 1 – If the respondent visited the same hotel again and the hotel operator
quoted the respondent a higher price than the last time he/she stayed in that hotel.
Scenario 2 – If the respondent visited the same hotel again and the hotel operator
quoted the respondent a lower price than the last time he/she stayed in that hotel.
Scenario 3 – If the respondent and the respondent’s friend/colleague were staying in
same hotel and had reserved a room in advance on the same day and the respondent
found out that his/her friend/colleague had paid a higher room rate for the same room.
Scenario 4 – If the respondent and the respondent’s friend/colleague were staying in
same hotel and had reserved a room in advance on the same day and the respondent
found out that his/her friend/colleague had paid a lower room rate for the same room.
9

Scenario 5 – If the respondent and respondent’s friend/colleague were staying in
separate standard double bedrooms in a hotel and paid the same room rate, but the
respondent’s friend/colleague was upgraded to a suite because he/she had a hotel
frequent guest program.
Strong relationship – Hotel operators having a good knowledge of their customers and
their needs for staying in the hotel.
Tactical tool – Planning the details, how to accomplish the various strategic elements
that lead to achieving the goal(s) (Bei et al.,2001).
Target price – The fixed price the customer believes to pay for a hotel stay.
10

CHAPTER II
REVIEW OF LITERATURE
Introduction
Hotel Revenue Management (HRM) emerging after deregulation of the airline
industry in the late 1980’s opened new doors for the hotel industry. This new practice
incorporated intricacies, the most important being customer perceptions of fairness. To
comprehend this concept, researche’s have studied the practice of HRM in detail
(Kimes, 2002). But according to Noone, Kimes, & Renaghan (2003) there has been no
empirical study of the customer perceptions of HRM. Furthermore, Belobaba (2001)
states that there is an extensive need for improvement in the revenue management
model and demand forecasting of rooms in the hotel industry. However, Choi and
Mattila (2003) explained in their publications that this dilemma can be eliminated, but it
requires extensive study. Moreover, Bei & Chiao (2001) assert that satisfaction is
interwoven with perceived quality, service, and price fairness.
It is vital that the model of HRM operate systematically to earn profits but also
acknowledge the customer perception of equity in its pricing strategy. To achieve this
goal researchers’ have to present concrete studies of the problem (Hanks et al., 1992).
Review of Previous Research
Revenue Management
Revenue management was accepted in the hotel industry, as this has increased
revenues at a faster rate compared to the other strategies. Revenue management
systems stimulate demand in different time periods (off-peak season, low-medium
11

season, medium-high season, and high season) and from different segments of
customers (business travelers, leisure travelers, group segments, and convention
segments) (Varini et al., 2002).
Movie theaters, telephone companies, and private retailers also use revenue
management. For example, movie theaters set different prices for different segment of
customers. The time of the day the customer is going to watch a movie and customers
age (child rate, senior rate, student rate) are examples. Due to the use of revenue
management used in different sectors of the industry, customers are becoming aware of
the hotel’s willingness to cut deals on room rates. However, the concept of revenue
management and the customers’ channels for booking a hotel room are vital because
“customers who pay for one room may later realize they could have negotiated a lower
room rate might think ill of a hotel” (Hank’s et al., 1992, p. 18). Customers with a
negative perception about the hotel are not satisfied, and this could lead to loss of
revenue in the future. Additionally, the ethics of charging hotel customers different room
rates based on booking practices, like booking a room through telephone or through the
Internet was common. Charging varied rates should also be taken into consideration by
hotel properties who want to increase revenues, as this strategy might upset travelers
because of different prices charged to different customers. Furthermore, to increase
revenues in the hotel industry, it was imperative that hotels differentiate between
business customers, who were willing to pay a higher price for a room rate, and leisure
customers, who wanted to pay a lower price for the same room. Hotel customers had a
wide range of needs, hence it was crucial that hoteliers split the travelers into business
and leisure segments to understand the hotel market effectively and to increase profit.
12

Understanding customers was crucial, as any misunderstanding could jeopardize the
customer’s revisit. This lost customer meant loss of revenue (Hanks et.al, 1992).
Furthermore, Varini, Englemann, Claessen, and Schleusener’s in 2002 study
states that a night in a hotel room is a perishable product. In other words, if the hotel
does not fill the rooms to its capacity on a particular night, the hotel loses that revenue,
which cannot be made up. To avoid this, it was necessary that the revenue
management system be implemented successfully. Ideally, customers should not be
angry if a person was paying more for a hotel room.
According to Noone, Kimes, and Renaghan’s (2003) research reveals that there
should be a strong relationship between customers and the revenue management
system. Lack of understanding by customers of revenue management system could
lead to unwanted misunderstandings. Specific needs of both business and leisure
travelers should be met. Leisure travelers, being price-sensitive, are cautious about
spending and how their needs are fulfilled. On the other hand, business travelers are
not price-sensitive and will spend money according to their needs. For business
travelers the location of the hotel and specific amenities are important. Hotels need to
get as much information as possible about their customers, like name, age, race,
gender, spending level, and what kind of room, and food the customer prefers. This type
of information helps make judgments about the strategies and customers. It is
imperative that the hotels aptly predict customer needs and wants. Meeting them can
generate revenue and satisfied customers (Noon et al., 2003)
13

Observing the increase in revenues for hotels such as Marriott, Hilton, and Hyatt,
many smaller businesses have instituted the revenue management (Belobaba, 2001).
Furthermore, Belobaba’s (2001) study revealed that many companies have invested in
the system with an expectation of increase in revenue. Moreover, Hilton Hotel
encourages its employees/managers to study revenue management system at the
University of Houston because knowing the ideal approach to the system could increase
revenue substantially (McCann, 2000). In the early 1990s, the majority of Las Vegas
hotels and casinos adhered to the concept, but only a few had computerized
management programs in place; most used manual reports (Norman & Mayer, 1997).
Since usage was in its early stages, the system was limited in effect. However, due to
emerging technology, the system has increased performance, causing hotels and
casinos in Las Vegas to implement a computerized management system (Norman &
Mayer, 1997). Noone, Kimes, and Renaghan’s (2003) state that Harrah casinos employ
the concept across its properties. Further, Harrah tracks 70 percent of its total revenue
through the concept of revenue management. Detailed customer information, such as,
name, age, amount of money gambled, the time of arrival and departure, how much
money the customer wins or loses, what kind of segment (business, leisure, group, and
convention) the customer belongs to, and other demographic information is compiled by
Harrah’s system. This information was used to predict high and low seasons, the
amount of gambling during a certain period of time, and changing room rates to meet
the needs of different segments of customers (Noone et al., 2003). According to Hanks,
Cross, and Noland’s (1992) research, price segmentation for different customer groups
was necessary to increase revenue. This approach not only makes money, but also
14

satisfies customers. It is crucial to have the segmentation strategy working properly to
achieve maximum revenue and increase profit for the hotel(s) (Hanks et al., 1992).
However, if revenue management systems were not used properly, revenue
could suffer. It was imperative that the complex system be fully understood and that
predictions and optimization models could be used for optimum results (Belobaba,
2001). Thus, from the above information one could conclude that if the concept of HRM
was followed systematically, it could not only increase revenue for the hotel, but also
satisfy customers.
Customer Satisfaction
Oliver (1981) elucidated that customer satisfaction is a psychosocial
phenomenon in which customer expectations and emotions are met to a certain
standard(s) and if these standards were not met according to expectations, customers
would be unsatisfied. Additionally, Bei and Chiao (2001) revealed that predicting
customer satisfaction was arduous; customers have distinct levels of expectations. To
satisfy all customers at the same time was a challenging task for hotel operators.
Noone, Kimes, and Renaghans (2003) encourage the hotel industry to have better
relationships with customers and to use new technologies to enhance the relationship.
Observing this customer satisfaction method, many hotels such as Radisson,
Wyndham, and Marriott have implemented the strategy to please customers. If this
strategy was followed systematically, customers would be satisfied and would return in
the future (Noone et al., 2003). Parasuraman, Zeithaml, and Berry (1994) accentuated
that service quality, product quality, and price all influence satisfaction level of
customers.
15
Perceived Price Fairness
Zeithaml (1988) relates that to obtain certain kind of services or products, a
customer needs to sacrifice price. The exchange between price and services/products
rendered should be perceived as fair by customers, creating customer satisfaction and
price fairness (Zeithaml, 1988). Moreover, Anderson, Fornell, and Lehmann (1994)
highlighted that price plays an important factor in customer satisfaction because
whenever a product or service is acquired, the customer usually thinks about price as
the first factor. In common parlance, fairness of price is based on customers’ perceived
knowledge in relation to price in the customer’s market. Additionally, Zeithaml (1988)
explains that lower perceived price was linked to lower perceived sacrifice. On the other
hand, lower perceived price does not guarantee higher customer satisfaction.
Customers often look at price as a clue to purchase certain products or services.
Contemporary work in organizational justice has proved that customers are highly
sensitive to issues of inequity, unfair practices of different room rates are likely to
generate appalling results. On the other hand, when information about equity is given to
customers before they make a reservation, customers have positive results and are
satisfied by the quality of products and services provided before they check in (Choi &
Mattila, 2003). According to Bolton, Warlop, and Alba’s study (2003), the majority of
customers have a vague idea about price, cost, and profit in the service sector. This
lack of knowledge could result in unfair pricing policies, which could directly relate to
customer satisfaction (Bolton et al., 2003). To improve this situation, it was necessary
that the function of equity be communicated to customers effectively (Choi & Mattila,
2003). The information provided about equity by the hotel reservationist at the time of
16

reservation gives a vague clue of what to expect from the hotel, setting a cap on the
customer expectation level. Further, given equity information satisfies the customer
need for a sense of fairness in the marketplace. (Kimes & Wirtz, 2002). Additionally, Bei
and Chiao (2001) state that hotel directors need to pay more attention to customer
perception of price fairness, as equity comparison is unswervingly related to customer
satisfaction. Moreover, prior research has provided evidence that price fairness relates
to customer satisfaction and the behavioral intentions of customers (Bolton al et., 2003).
Customers’ Evaluation of Fairness
Customer evaluation of fairness depended on perceived justice, a concept that
provided an in-depth understanding of the complaint process from initiation to
completion. Additionally, researchers have confirmed that customer satisfaction was not
only based on outcomes of service recovery, but also on procedures used to reach
those outcomes (Sparks and McColl-Kenndy, 2001). Perceived justice contained three
significant factors: distributive justice, procedural justice, and interactional justice (Choi
& Mattila, 2003).
Distributive Justice
Distributive justice relates to the overall outcome of the service recovery process.
In simpler words, distributive justice concentrated on whether the customer is satisfied
or dissatisfied with services rendered. The service recovery process may include
financial compensation, refunds, and discounts after defective goods or inappropriate
services were provided to customers (Sparks and McColl-Kenndy, 2001). For example,
Domino’s Pizza installed a service guarantee to deliver pizza within 30 minutes or
customers receive the pizza for free. This promotion was a kind of compensation used
17

to enhance customer satisfaction (Tax et al., 1998). According to Goodwin and Ross
(1990) if there was a cessation in the service sector, customers wanted tangible rather
than intangible compensation.
Procedural Justice
Procedural justice involves rectifying problems in the service recovery process. In
other words, procedural justice concentrates on how to solve problems and at the same
time make sure that the customers are satisfied with services or products rendered by
the company (Sparks and McColl-Kenndy, 2001). Procedural justice includes a voice
aspect. According to Sparks and McColl-Kennedy’s (2001) research, voice performs a
key role in the procedural system. It involved customers’ freedom of speech, that was,
the ability to express their views if certain products or services were undesirable.
Goonwin and Ross (1990) implied that more customer voice can lead to better customer
satisfaction, but failure to consider voice can lead to unfair practices and lack of future
business.
Interactional Justice
Interactional justice involves treatment of customers in the service recovery
process. In simpler terms, it concentrates on how the customer feels about their
treatment by the service industry and quality of communication between
employees/customers and managers/directors. Researchers have proved that
employees are willing to accept, understand, and make passable decisions regarding
certain situation(s) if they (employees) are treated with respect and consideration by
managers (Sparks and McColl-Kenndy, 2001). According to Hocutt, Chakraborty, and
Mowens (1997) customers were most satisfied with the hotel when a high level of
18

sympathy and responsiveness was expressed by the hotel operators and managers
(Choi & Mattila, 2003). In addition, Tax, Brown and Chandrashekaran (2001) explain
that interactional treatment should always be considered as the highest priority. Such
treatment should consist of politeness and concern regarding customer problem(s),
resourceful solutions’ to the given problem, and honesty in the compliance process (Tax
et al., 2001).
Summary
It was critical to discern if customers were satisfied or dissatisfied with
services/products rendered by the hotel. Recognizing customer perceptions to tell if
they were satisfied or dissatisfied could influence the revenue. Furthermore, customer
satisfaction was interwoven with the pricing strategies the hotel used to attract
customers. To gain customer satisfaction, it was absolutely essential to ensure that the
concept of revenue management in the hotel industry was followed fully. (Hanks et al.,
1992).
19

20
CHAPTER III
METHODOLOGY
Research Design
The sampling for this research includes 460 Dallas Love Field Airport customers
who were business travelers, and leisure travelers. To glean the different perceptions of
customers about HRM, the interception method was used to survey customers, when
they entered the airport and before passing through security checkpoint. The
interception sampling method was used to minimize bias among subjects. The
subjective approach of non-probability sampling was used to determine the effects of
customer perceptions of HRM. The participants were provided with a brief definition of
the system and were given two different examples to help them better understand the
concept.
The information helped them to review the scenarios and answer questions on
the questionnaire, which underwent strict Institutional Review Board requirements for
the use of human subjects. An informed-consent disclosure was provided to
respondents. Additionally, the questionnaire did not include any questions based on the
respondent’s name, address, or telephone number, to maintain strict confidentiality.
Answers to the questionnaire have been kept confidential and no analyses have been
done on an individual basis. All analysis were reported on a group basis only. There
were 20,000 travelers, who were business, and leisure, travelers, traveled through the
airport; hence, the best strategy was the interception method. The travelers at the

airport were approached politely, courteously, and asked respectfully to fill the
questionnaire. There was no force or coercion applied to complete the questionnaire.
Data Collection
It was imperative that the process of data collection be systematically handled,
requiring a proper communication approach with respondents. To communicate with the
respondents a “survey” approach was used to acquire results for customer perceptions
of HRM. The questionnaire obtained information about customer perceptions of HRM
based on demographics, HFGP, Airline FFP, ethical issues, frequent travelers, business
and leisure traveler’s preference for fixed or negotiated room rate would be obtained
and analyzed. Because of time constraints authorized by the Aviation Department of
Dallas Love Field Airport and other security constraints, the researcher had limited time
to survey 460 travelers at the Airport. The researcher had to undergo a criminal
background check, present a memo, and make a presentation to the director of aviation.
Due to new rules and regulations after the September 11, 2001 terrorist acts on
America, the researcher had time constraints on surveying travelers. The aviation
department of the airport granted permission to survey travelers, once in mid December
of 2004 and twice in January of 2005, to collect data of 460 respondents. The three time
intervals the researcher surveyed the respondents at the airport were as follows:
1) In December, 2004
- Thursday, 16th from 10 am till 5 pm
- Friday, 17th from 10 am till 5 pm
- Sunday, 19th from 10 am till 5 pm
21

2) In January, 2005
- Thursday, 13th from 9 am till 9 pm
- Friday, 14th from 9 am till 9 pm
- Sunday, 16th from 9 am till 9 pm
3) In January, 2005
- Thursday, 20th from 9 am till 9 pm
- Friday, 21st from 9 am till 9 pm
- Sunday, 23rd from 9 am till 9 pm
The types of data variables listed and classified in the survey were nominal and
ordinal. The sample proportion of incidence was used to estimate the population
proportion and to estimate the population variance.
The nominal method of data collection was used in the questionnaire because
collecting information on variables or by design could be grouped into two or more
categories that would be mutually exclusive. The counting of participants in each group
would be easy with nominal scale data. Further, nominal scale data could facilitate
statistical approaches.
The ordinal method of data collection was used in the questionnaire because it
was an indicator of the order in which the research could be analyzed. Additionally, if
the transitivity postulate was fulfilled, ordinal data was possible. Further, ordinal data
implied a statement of greater than or less than without stating how much was greater
or less in the variables. Thus, both nominal and ordinal data collection methods
provided the necessary combinations and accurate results.
22
Additionally, the following types of questions were used in the survey:
1) Yes, no, and n/a
2) 1 to 7 Likert scale
3) Multiple choice questions
4) Open ended questions
Instrument Development
A questionnaire was developed to assess the areas of concern covered in the
research questions in chapter I. The interception method for the questionnaire was
composed of three sections:
Section one: general information about the respondents’ stay in the hotel, FFP,
HFGP, business and leisure travelers booking preference for a hotel room, and
customer perceptions of revenue management information provided.
Section two: customer perception based on five different scenarios and three
ethical issues. This part of the instrument contained various scenario questions
pertaining to customer satisfaction levels while they stayed in the hotel, using a seven-
point Likert scale, and it also contained ethical issues relating to the hotel industry.
Section three: background information of the respondents, like, demographics,
type and channel of booking a hotel room, and frequency of travel in the past year.
Furthermore, the instrument was pre-tested to determine content validity. The
performance test judged each item to be essentially useful, but not essential, or not
necessary in assessing performance of relevant behavior. The stability of the instrument
was not reliable in the survey approach as it had a few drawbacks, such as time-delay
between measurements, insufficient time between measurements, respondent’s
23

discernment of a disguised purpose, topic sensitivity, and introduction of extraneous
moderating variables between measurements. However, to overcome this, the remedy
interval time between the pre-test and the test was increased. Pre-testing eliminated
wrong questions and was performed on colleagues, friends, other professors in the
hospitality department at the University of North Texas (UNT), and in research
application, research method classes.
The rating scales and categorization scale were used in the response form of the
questionnaire. The rating scale from 1 to 7 was chosen to make the respondent feel
more sensitive about the measurement and extraction of variance. The categorization
scale classified different types of customers (business, leisure, group, and convention)
and their effects on fairness of HRM practices.
Further, the error of leniency was minimized because the questions related to
specific answers were provided on the questionnaire; for example, yes, no, N/A
questions, and multiple-choice questions. However, in questions relating to ordinal data
where the respondent had to express his/her perception toward the question, the error
of leniency could be occurred, as the respondent could be an easy rater or a hard rater.
The error of central tendency was minimized in the instrument because the
usage of points on the scale was spread out, intermediate descriptive phrases were in
bold and capitalized, and the strength of descriptive adjectives was adjusted to fit the
question. The error of halo effect was minimized because the instrument defined HRM
system and provided two examples of the concept.
24
Administrative questions, which were not asked on the questionnaire, were
imperative in analyzing the data, generated from the instrument. The administrative
questions analyzed for this study were as below.
(a) What was the traveler’s frame of mind when the interception occurred with the
survey? For example, was the traveler tired, busy, or late for a flight?
(b) Were there any late or canceled flights, which could upset travelers? And
(c) Were there any security threats, which could distress or traumatize travelers at the
airport?
In the first research question, where respondents received information about
HRM system at the time of booking a hotel room, the travelers were asked to circle their
perception based on a 1-7 Likert scale, where one was “Highly Satisfied” and seven
was “Highly Dissatisfied.” Research question 1 (a) referred to customer demographics
like gender, age, level of income, level of education, and ethnicity. The respondent was
asked to check one box in each subcategory. Further, each subcategory of
demographics was compared with respondent perception when HRM information was
provided to customer at the time of booking a room.
Further, frequency of travel in a year was asked in the questionnaire. Both
business and leisure travelers were nominal data types. The respondents were asked to
check- mark how many times they traveled for business and leisure, starting from “zero”
to “21 and over.” Further, each subcategory of frequent traveler was compared with
respondent perception when HRM information was provided to the customer at the time
of booking a room.
25

Customer preference for booking a hotel room included four categories: 1) when
traveling for business, the respondent preferred fixed price (not worthwhile to look for
deals), 2) when traveling for leisure, the respondent preferred fixed price (not worthwhile
to look for deals), 3) when traveling for business, the respondent preferred to negotiate
price (find the best deals), and 4) when traveling for leisure, the respondent preferred
negotiated price (find the best deals). All four subcategories were ordinal data types.
The respondent was asked to indicate perception on the Likert scale for each category,
where one was “Strongly Agreed” and seven was “Strongly Disagreed.” Each
subcategory of preference for booking a room was compared with respondent
perception when HRM information was provided to the customer at the time of booking
a room.
Research question 1 (b) explained how many different HFGP the respondent
was enrolled in and how many times the respondent redeemed points. Both
subcategories were nominal data types. The respondent was asked to check-mark each
of these categories, and each category of HFGP was compared with respondent
perception when HRM information was provided the customer at the time of booking a
room.
Additionally, the first question regarding Airline FFP asked how many different
FFP the respondent was enrolled in and how many times the respondent redeemed
miles. Both subcategories were nominal data types. The respondent was asked to
check-mark each of these subcategories and each subcategory of FFP was compared
with respondent perception when HRM information was provided to customer at the
time of booking a room.
26

Respondents were asked whether they agree or disagree (check-mark) with
three ethical issues regarding their perceptions of capitalism as a basis for market-
based pricing, seasonal price adjustments, and pricing fluctuations based on marketing
channels. All three subcategories were nominal data types. Further, each subcategory
was compared with respondent perception when HRM information was provided to
customer at the time of booking a room.
In the second research question where respondent did not receive the
information about HRM system at the time of booking a hotel room, the travelers were
asked to indicate their perception on Likert scale, where one was “Highly Satisfied” and
seven was “Highly Dissatisfied.”
Research question 2 (a) referred to customer demographics like gender, age,
level of income, level of education, and ethnicity. The respondent was asked to check
one box in each subcategory. Further, each subcategory was compared with
respondent perception when HRM information was not provided to the customer at the
time of booking a room.
Frequency of business and leisure travelers traveling in a year was asked about
in the questionnaire. Both types revealed nominal data types. The respondent was
asked to check-mark how many times the respondent traveled for business and leisure,
starting from “zero” to “21 and over.” Further, each subcategory was compared with
respondent perception when HRM information was not provided to customers at the
time of booking a room.
27
Customer preference for booking a hotel room included four categories: 1) when
traveling for business, the respondent preferred fixed price (not worthwhile to look for
deals), 2) when traveling for leisure, the respondent preferred fixed price (not worthwhile
to look for deals), 3) when traveling for business, the respondent preferred to negotiate
price (find the best deals), and 4) when traveling for leisure, the respondent preferred
negotiated price (find the best deals). All subcategories were ordinal data types. The
respondent was asked to indicate the perception based on a 1-7 Likert scale for each
category, where one was “Strongly Agreed” and seven was “Strongly disagreed.” Each
subcategory of respondent preference for booking a room was compared with the
respondent perception when HRM information was provided to customer at the time of
booking a room.
Research question 2 (b) explained how many different HFGP the respondent
was enrolled in and how many times the respondent redeemed points. Both
subcategories were nominal data types. The respondent was asked to check-mark each
of these categories. Each category was compared with respondent perception when
HRM information was provided to customer at the time of booking a room.
Additionally, the second question regarding Airline FFP asked how many
different FFP the respondent was enrolled in and how many times the respondent
redeemed miles. Both subcategories were nominal data types. The respondent was
asked to check-mark each of these subcategories, and each subcategory was
compared with the respondent perception when HRM information was provided to
customer at the time of booking a room.
28

Moreover, respondents were asked whether they agree or disagree (check-mark)
with three ethical issues regarding their perceptions of capitalism as a basis for market-
based pricing, seasonal price adjustments, and pricing fluctuations based on marketing
channels. All three subcategories of ethical issues were nominal data types. Each
subcategory was compared with respondent perception when HRM information was
provided to customer at the time of booking a room.
To address the third research question regarding each respondent’s perception
of inconsistency in pricing across multiple visits (Scenario 1 and 2), inconsistency in
pricing across individuals (Scenario 3 and 4), and room upgrades for HFGP enrollees,
(Scenario 5) the travelers were asked to indicate their perception on Likert scale, where
one was “Excited” and seven was “Angry.”
Research question 3 (a) referred to customer demographics like, gender, age,
level of income, level of education, and ethnicity. The respondent was asked to check
one box in each subcategory. Each subcategory of the demographics was compared
with respondent perception of each Scenario 1, 2, 3, 4 and 5.
Frequency of business and leisure travelers traveling in a year was asked about
in the questionnaire. Both were nominal data types. The respondent was asked to
check-mark how many times they traveled for business and leisure, starting from “zero”
to “21 and over.” Further, each subcategory of frequent traveler was compared with
respondent perception of each Scenario 1, 2, 3, 4 and 5.
Customer preference for booking a hotel room included four categories: 1) when
traveling for business, the respondent preferred fixed price (not worthwhile to look for
deals), 2) when traveling for leisure, the respondent preferred fixed price (not worthwhile
29

to look for deals), 3) when traveling for business, the respondent preferred to negotiate
price (find the best deals), and 4) when traveling for leisure, the respondent preferred
negotiated price (find the best deals). All subcategories were ordinal data types. The
respondent was asked to circle the perception based on a 1-7 Likert scale for each
category, where one was “Strongly Agreed” and seven was “Strongly Disagreed.” Each
subcategory was compared with respondent’s perception of each Scenario 1, 2, 3, 4
and 5.
Research question 3 (b) explained how many different HFGP the respondent
was enrolled in and how many times the respondent redeemed points. Both the
subcategories were nominal data types. The respondent was asked to check mark each
of these categories. Each category of HFGP was compared with respondent’s
perception of each Scenario 1, 2, 3, 4 and 5.
Additionally, the third question regarding Airline FFP asked how many different
FFP the respondent was enrolled in and how many times the respondent redeemed the
miles. Both subcategories were nominal data types. The respondent was asked to
check-mark each of these subcategories. Each subcategory of FFP was compared with
respondent’s perception of each Scenario 1, 2, 3, 4 and 5.
Respondents were asked whether they agree or disagree (check-mark) with
three ethical issues regarding their perceptions of capitalism as a basis for market-
based pricing, seasonal price adjustments, and pricing fluctuations based on marketing
channels. All subcategories were nominal data types. Each subcategory of ethical
issues was compared with respondent’s perception of each Scenario 1, 2, 3, 4 and 5.
30

Furthermore, respondents were requested to circle their perception based on
Likert scale when HRM information was provided to them at the time of booking a room.
This type of data was ordinal. This category was compared with respondent’s
perception of each Scenario 1,2,3,4 and 5.
Respondents were requested to circle their perception based on Likert scale
when HRM information was not provided to them at the time of booking a room. This
type of data was ordinal. This category was compared with respondent’s perception of
each Scenario 1,2,3,4 and 5.
Statistical Analysis
After completion of the data collection, the instrument was coded and the data
were entered into a Statistical Package for the Social Sciences (SPSS). Analysis of
variance (ANOVA), cross-tabulation, and Pearson’s correlation were used to determine
if customer perceptions of the fairness of HRM differed based on the type of traveler,
demographics, HFGP enrolled and redeemed, Airline FFP enrolled redeemed,
frequency of business and leisure traveler, three ethical issues, preference of booking a
hotel room, revenue management information provided, revenue management
information not provided, and Scenario 1, 2, 3, 4 and 5.
Conclusions
After the data was collected and analyzed, the research provided information
about customer perceptions of fairness about the HRM system in the hotel industry.
These different types of perceptions would benefit both customers, who would be
residing in hotels, and the hotel operators, who would gain knowledge about the
31

customers’ expectation level. Further, the data collected and analyzed would provide
information to the hotel industry about whether providing information of HRM to
customers would increase revenue. This in turn would increase customer satisfaction
and increase revenue for the hotel industry.
32

CHAPTER IV
DATA ANALYSIS
Introduction
Chapter IV presents the analysis of the data. Again, the purpose of this study
was to determine customer perceptions of fairness concerning pricing policies utilized
by the hotel industry, and to examine how different outcomes in pricing policies affect
customer perceptions of fairness. This research study was designed to answer the
research questions.
The research questionnaire is shown in Appendix A. To analyze the data, a two-
tier process was employed. First, descriptive statistics provided frequencies, chi-
square, cross-tabulations, and Pearson correlations for each measure. In the second
stage, ANOVA was used to assess whether there existed a statistical difference
between groups of data.
Characteristics of Sample
In order to identify perceptions of customers about HRM, both quantitative and
qualitative analysis were conducted. A self-administered questionnaire was distributed
to travelers at Dallas Love Field Airport using an intercept method. The population of
interest was travelers who were traveling through the airport, travelers’
friends/colleagues who were waiting to be picked up from the airport, and airport
employees. Accordingly, 460 travelers were surveyed.
33

Frequency Analysis Report
Demographic Profile for Respondents
As in any study respondents had the choice of not answering any part of the
survey. Accordingly, all completed surveys were received by the researcher for non-
response issues. Where the respondent had left major portions of the survey
incomplete, their surveys were discarded. Where respondents had omitted only few
questions, their responses were included in the data analyses. It will be seen in the
tables that the total sample size varies with each analysis as a result.
Of respondents, 51.1% were male, 48.9% female, 40.4% were in the age group
of 18-29 years, which was the highest number of respondents. On the other hand the
age group of 60-69 years (2.2%) had the lowest number of responses. The most
frequent income group was between $0 and $19,999 (17%). The next income group
close to $0-$19,999 income bracket was the one between $100,000 (16.8%) and over.
However, the lowest number of respondents was in the income group between $90,000
and $99,999 (2.7%). Further, 31.9% had a four-year (bachelor’s degree) college
degree, the most frequent. However, 8.5% respondents had a two-year (associate’s
degree) degree, which was the least frequent occurring. There were 67.6% White-
American, which was the most frequently occurring. Only 1.4% respondents were
Native-American, which was the group with least number of respondents.
34
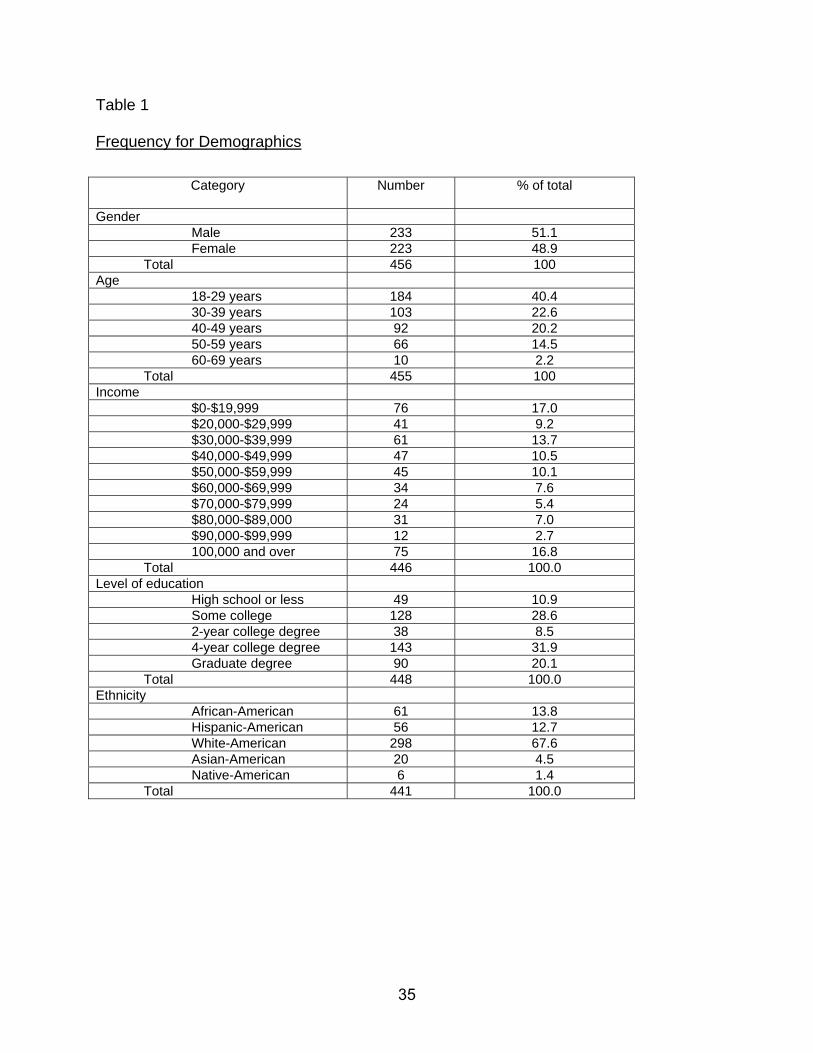
Table 1
Frequency for Demographics
Category Number % of total
Gender Male 233 51.1 Female 223 48.9 Total 456 100 Age 18-29 years 184 40.4 30-39 years 103 22.6 40-49 years 92 20.2 50-59 years 66 14.5 60-69 years 10 2.2 Total 455 100 Income $0-$19,999 76 17.0 $20,000-$29,999 41 9.2 $30,000-$39,999 61 13.7 $40,000-$49,999 47 10.5 $50,000-$59,999 45 10.1 $60,000-$69,999 34 7.6 $70,000-$79,999 24 5.4 $80,000-$89,000 31 7.0 $90,000-$99,999 12 2.7 100,000 and over 75 16.8 Total 446 100.0 Level of education High school or less 49 10.9 Some college 128 28.6 2-year college degree 38 8.5 4-year college degree 143 31.9 Graduate degree 90 20.1 Total 448 100.0 Ethnicity African-American 61 13.8 Hispanic-American 56 12.7 White-American 298 67.6 Asian-American 20 4.5 Native-American 6 1.4 Total 441 100.0
35

Hotel Frequent Guest Program Enrolled and Redeemed
Of respondents, 40.2% were enrolled in the HFGP, while 59.8% reported that
they had not. Further, 21.1% respondents reported that they had redeemed the HFGP,
while 78.9% reported they had not.
Table 2
Frequency for Hotel Frequent Guest Program Enrolled and Redeemed
Category Number % of total
HFGP enrolled Enrolled in HFFP 184 40.2 Not enrolled in HFFP 274 59.8 Total 458 100 HFGP redeemed Redeem HFFP 96 21.1 Does not redeem HFFP 360 78.9 Total 456 100
Airline Frequent Flier Program Enrolled and Redeemed
Of respondents, 57.9% reported that they have enrolled in the FFP, while 42.1%
respondents had not. Furthermore, 37.9% reported that they had redeemed the FFP,
while 62.1% respondents had not done so.
Table 3
Frequency for Airline Frequent Flier Program Enrolled and Redeemed
Category Number % of total
FFP enrolled
Enrolled in Airline FFP 263 57.9 Not enrolled in Airline FFP 191 42.1 Total 454 100 FFP redeemed
Redeem Airline FFP 173 37.9 Does not redeem Airline FFP 283 62.1 Total 456 100
36

Ethical Issues
Customer Perception of Capitalism as a Basis for Market-based Pricing
Of respondents, 88.6% agreed that the U.S. is a capitalist economy and hotels
are entitled to increase their prices, while 11.4% did not agree that the U.S. is a
capitalist economy and hotels should increase their prices to maximize revenue.
Customer Perceptions of Seasonal Price Adjustments
Of respondents, 75.2% agreed that it is ethical to increase and decrease hotel
room prices during high and low seasons in the U.S., while 24.8% responded it is not
ethical to have seasonal price adjustments.
Customer Perceptions of Pricing Fluctuations Based on Marketing Channel
Of respondents, 54.3% reported that it is ethical for hotels to quote two different
prices while booking over the phone and the Internet. On the other hand, 45.7%
reported it is not ethical for hotels to vary price by channel distribution.
37

Table 4 Frequency for Ethical Issues
Category Number % of total
Customer perceptions of capitalism as a basis for market-based pricing
Ethical 398 88.6 Not-Ethical 51 11.4 Total 449 100 Customer perceptions of seasonal price adjustments
Ethical 337 75.2 Not-Ethical 111 24.8 Total 448 100 Customer perceptions of pricing fluctuations based on marketing channel
Ethical 244 54.3 Not-Ethical 205 45.7 Total 449 100
Frequent Travelers
Respondent were asked how frequently they traveled in the last 12 months for
business and leisure. The data of each frequency item was computed, tabulated, and is
presented in Table 5.
Frequency of Business Travel
Of respondents, 53.6% respondents traveled 0-2 times for business in the past
12 months, that category was the most frequently occurring. On the other hand, 2.4%
reported that they traveled 15-20 times a year for business, which was the least
frequent group.
38

Frequency of Leisure Travel
Of respondents, 40.2% respondents traveled 3-5 times for leisure in the past 12
months, the most frequently occurring group. On the other hand, 1.3% respondents
traveled 12-14 and 1.3% traveled 18-20 times a year for leisure, the least frequent
response.
Table 5 Frequency for Frequent Travelers
Category Number % of total
Frequency for business travelers 0-2 241 53.6 3-5 76 16.9 6-8 37 8.2 9-11 21 4.7 12-14 11 2.4 15-17 10 2.2 18-20 11 2.4 21 and over 43 9.6 Total 450 100.0 Frequency for leisure travelers 0-2 145 32.0 3-5 182 40.2 6-8 66 14.6 9-11 27 6.0 12-14 6 1.3 15-17 11 2.4 18-20 6 1.3 21 and over 10 2.2 Total 453 100.0
Fixed Price and Negotiated Pricing
Respondents were asked in regard to booking a hotel room whether they prefer
fixed rate or negotiable rate when traveling for business and leisure in Section One
Question 16 a, b, c, and d of the questionnaire. The data of each frequency item was
computed, tabulated, and is presented in Table 6.
39
Business-fixed Price
Of respondents, 26.6% remained neutral when traveling for business.
Furthermore, 45.7% respondents were satisfied (strongly satisfied, more satisfied, little
satisfied) with a fixed-room rate when traveling for business. However, 27.7%
respondents were not satisfied (strongly dissatisfied, more dissatisfied, little dissatisfied)
with a fixed-room rate when traveling for business.
Leisure-fixed Price
Of the respondents, 16.0% remained neutral when traveling for leisure.
Furthermore, 30.2% respondents were satisfied with a fixed-room rate when traveling
for leisure. However, 53.8% respondents were not satisfied with a fixed-room rate when
traveling for leisure.
Business Negotiable Price
Of respondents, 27.7% remained neutral when traveling for business.
Furthermore, 44.7% respondents were satisfied with a negotiable room rate when
traveling for business. However, 27.5% respondents were not satisfied with a negotiable
room rate when traveling for business.
Leisure Negotiable Price
Of respondents, 15.8% remained neutral when traveling for leisure. Furthermore,
44.7% respondents were satisfied with a negotiable room rate when traveling for
leisure. However, 16.4% respondents were not satisfied with a negotiable room rate
when traveling for leisure.
40

Table 6
Frequency of Fixed Price and Negotiated Pricing for Business and Leisure Travelers
Category Number % of total
Business-fixed price Strongly Satisfied 116 26.1 More Satisfied 58 13.1 Little Satisfied 29 6.5 Neutral 118 26.6 Little Dissatisfied 32 7.2 More Dissatisfied 35 7.9 Strongly Dissatisfied 56 12.6 Total 444 100.0 Leisure-fixed price Strongly Satisfied 71 15.6 More Satisfied 33 7.3 Little Satisfied 33 7.3 Neutral 73 16.0 Little Dissatisfied 41 9.0 More Dissatisfied 77 16.9 Strongly Dissatisfied 127 27.9 Total 455 100.0 Business negotiable price Strongly Satisfied 99 22.5 More Satisfied 49 11.1 Little Satisfied 49 11.1 Neutral 122 27.7 Little Dissatisfied 30 6.8 More Dissatisfied 34 7.7 Strongly Dissatisfied 57 13.0 Total 440 100.0 Leisure negotiable price Strongly Satisfied 165 36.3 More Satisfied 100 22.0 Little Satisfied 43 9.5 Neutral 72 15.8 Little Dissatisfied 22 4.8 More Dissatisfied 26 5.7 Strongly Dissatisfied 27 5.9 Total 455 100.0
41

Hotel Revenue Management Information Provided
Respondents were asked their perceptions of the HRM system information, as
provided in Section Two Question 17. The data of each frequency item was computed,
tabulated, and is presented in Table 7.
Of respondents, 24.7% remained neutral in their perception when revenue
management information was provided to them at the time of booking a room.
Furthermore, 67.9% respondents were satisfied when revenue management information
was provided to them at the time of booking a hotel room, and 7.4% respondents were
not satisfied.
Table 7
Frequency of Hotel Revenue Management Information Provided
Category Number % of total
Revenue management information provided Strongly Satisfied 137 30.5 More Satisfied 92 20.5 Little Satisfied 76 16.9 Neutral 111 24.7 Little Dissatisfied 16 3.6 More Dissatisfied 10 2.2 Strongly Dissatisfied 7 1.6 Total 449 100.0
Hotel Revenue Management Information not Provided
Respondents were asked their perception of HRM system when information is
not provided, in Section Two, Question 18 of the questionnaire. The data of each
frequency item was computed, tabulated, and is presented in Table 8.
Of respondents, 34.4% remained neutral in their perception when revenue
management information was not provided to them at the time of booking a room.
Furthermore, 13.8% respondents were satisfied when revenue management information
42

was not provided to them at the time of booking a hotel room and 51.8% respondents
were not satisfied.
Table 8
Frequency of Hotel Revenue Management Information not Provided
Category Number % of total
Revenue management information not provided Strongly Satisfied 15 3.3 More Satisfied 16 3.6 Little Satisfied 31 6.9 Neutral 154 34.4 Little Dissatisfied 87 19.4 More Dissatisfied 69 15.4 Strongly Dissatisfied 76 17.0 Total 448 100.0
Customer Satisfaction
Respondents were asked their perceptions in relation to the five scenario
questions in Section Two Questions 1,2,3,4, and 5. The data of each frequency item
was computed, tabulated, and is presented in Table 9.
Inconsistency in Pricing Across Multiple Visits
Of respondents, 18.2% remained neutral in their perception when the hotel
operator quoted a higher price than last time the respondent stayed in same hotel.
Furthermore, 8.8% respondents were excited (excited, not too much excited, and little
excited) and 73.0% respondents were angry (little angry, not too much angry, and
angry) when the hotel operator quoted a higher price than last time the respondent
stayed in same hotel.
43

Of respondents, 12.5% remained neutral in their perception when the hotel
operator quoted a lower price than last time the respondent stayed in the same hotel.
Furthermore, 78.2% respondents were excited and 9.4% respondents were angry when
the hotel operator quoted a lower price than last time the respondent stayed in the same
hotel.
Inconsistency in Pricing Across Individuals
Of respondents, 21.4% remained neutral in their perception when a
friend/colleague paid a higher room rate than the respondent for the same room.
Furthermore, 10.0% respondents were excited and 68.6% respondents were angry
when a friend/colleague paid a higher room rate than the respondent for the same
room.
Of respondents, 14.4% remained neutral in their perception when a
friend/colleague paid a lower room rate than the respondent for the same room.
Furthermore, 14.2% respondents were excited and 71.4% respondents were angry
when a friend/colleague paid a lower room rate than the respondent for the same room.
Customer Perceptions of Room Upgrades for Hotel Frequent Guest Program –
Enrollees
From total respondents, 52.2% respondents remained neutral in their perception
when a friend/colleague was upgraded to a suite because he/she was enrolled in
HFGP. Furthermore, 31.3% were excited and 16.5% were angry when friend/colleague
was upgraded to a suite because he/she was enrolled in HFGP.
44

Table 9
Frequency for Customer Satisfaction (Scenario1, 2, 3, 4, and 5)
Category Number % of total
Hotel operator quoted a HIGHER price than previous night Excited 9 2.0 Not too much Excited 20 4.4 Little Excited 11 2.4 Doesn't Bother Me 82 18.2 Little Angry 164 36.4 Not too much Angry 115 25.5 Angry 50 11.1 Total 451 100.0 Hotel operator quoted a LOWER price than previous night Excited 122 27.2 Not too much Excited 120 26.7 Little Excited 109 24.3 Doesn't Bother Me 56 12.5 Little Angry 18 4.0 Not too much Angry 20 4.5 Angry 4 .9 Total 449 100.0 Friend/colleague paid a HIGHER room rate than respondent Excited 7 1.6 Not too much Excited 15 3.4 Little Excited 22 5.0 Doesn't Bother Me 95 21.4 Little Angry 95 21.4 Not too much Angry 131 29.6 Angry 78 17.6 Total 443 100.0 Friend/colleague paid a LOWER room rate than respondent Excited 15 3.4 Not too much Excited 21 4.7 Little Excited 27 6.1 Doesn't Bother Me 64 14.4 Little Angry 79 17.8 Not too much Angry 129 29.1 Angry 109 24.5 Total 444 100.0 Friend/colleague UPGRADED to a suite because enrolled in HFGP Excited 31 6.9 Not too much Excited 59 13.2 Little Excited 50 11.2 Doesn't Bother Me 234 52.2 Little Angry 43 9.6 Not too much Angry 17 3.8 Angry 14 3.1 Total 448 100.0
45

Statistical Analysis
Research Questions
To address the first research question, cross-tabulations, ANOVA, and Pearson
correlations were used as analytical tools. Table 10 provides a summary of significant
and non-significant variables for Research Question One.
Table 10
Significant and Non-Significant Variables for Research Question 1
Name Crosstabs Significant
ANOVA Significant
CorrelationSignificant
Gender Yes Yes N/A Age N/A N/A Yes Income N/A N/A No Education N/A N/A No Ethnicity No No N/A FGP enrolled No No N/A FGP redeemed No No N/A FFP enrolled No No N/A FFP redeemed No No N/A Customer perceptions of capitalism as a basis for market-based pricing No
No
N/A
Customer perceptions of seasonal price Adjustments No
No
N/A
Customer perceptions of pricing based on Marketing channel No
Yes
N/A
Frequency of business traveler N/A N/A No Frequency of leisure traveler N/A N/A No Business-fixed price N/A N/A No Leisure-fixed price N/A N/A No Business-negotiated price N/A N/A No Leisure-negotiated price N/A N/A Yes
46

Table 11 Research Question 1: Cross-tabulation Analysis for Relationship Between Hotel
Revenue Management Information Provided and Gender
Gender Highly
Satisfied (%)
More Satisfied
(%)
Little Satisfied
(%)
Neutral
(%)
Little Dissatisfied
(%)
More Dissatisfied
(%)
Highly Dissatisfied
(%)
Total (%)
Male 25.7 21.3 13.9 30.0 4.3 2.6 2.2 100 Female 35.5 19.4 20.3 19.4 2.8 1.8 .9 100 Total-N 30.4 20.4 17.0 24.8 3.6 2.2 1.6 100
Chi-Square = 13.702. P = .033.
There is a significant relationship between HRM information provided and gender
(Chi-Square = .13.702, P = .033). Further, an overwhelming majority of respondents are
satisfied (67.8%), while a small fraction of respondents are dissatisfied (7.4%). Roughly
25% of the respondents remain neutral in their decision (Table 7). Additionally, 60.9%
males are “Satisfied” and 9.1% males are “Dissatisfied.” Furthermore, 30.0% male
respondents remained neutral in their perception.
When HRM information is provided, 75.3% females are “Satisfied”, whereas
5.5% females are “Dissatisfied.” Additionally, 19.4% females remain neutral. Table 1
states that there more men than women who responded to the survey, however, the
satisfaction percentage of women is higher than for males when HRM information is
provided.
When providing HRM information is provided to females, the majority of them are
satisfied, suggesting females want to know more about pricing strategies. When
sufficient information for the prices is provided, females are more satisfied than
dissatisfied. Hence, one can conclude that when HRM information is provided, females
are significantly more satisfied than males.
47

Table 12 Research Question 1: ANOVA Analysis for Relationship Between Hotel Revenue
Management Information Provided and Gender
Statistics Hotel Revenue Management Information
Provided Male 2.83
Female 2.44 F Value 8.000
Significance .005
Females are significantly more satisfied than males when revenue management
information is provided (F = 8.00, P = .005). The mean value for male is 2.83, inclined
more towards “Little Satisfied” while, female mean value is 2.44, leaning more toward
“More Satisfied.” Hence, one can conclude that revenue management information is
provided at the time booking, females are more satisfied than males.
Table 13
Research Question 1: ANOVA Analysis for Relationship Between Hotel Revenue
Management Information Provided and Ethical Issue Relating to Customer Perceptions
of Pricing Fluctuations Based on Marketing Channel
Statistics Hotel Revenue Management Information Provided
Ethical 2.46 Not-Ethical 2.82
F Value 6.978 Significance .009
Customers who thinks that the pricing fluctuations based on marketing channel is
an ethical issue are significantly more satisfied than customer who donot. (F = 6.978, P
= .009). Table 4 states that more respondents agree that booking a standard room over
the phone and the same room over the Internet would provide two different room rates.
48
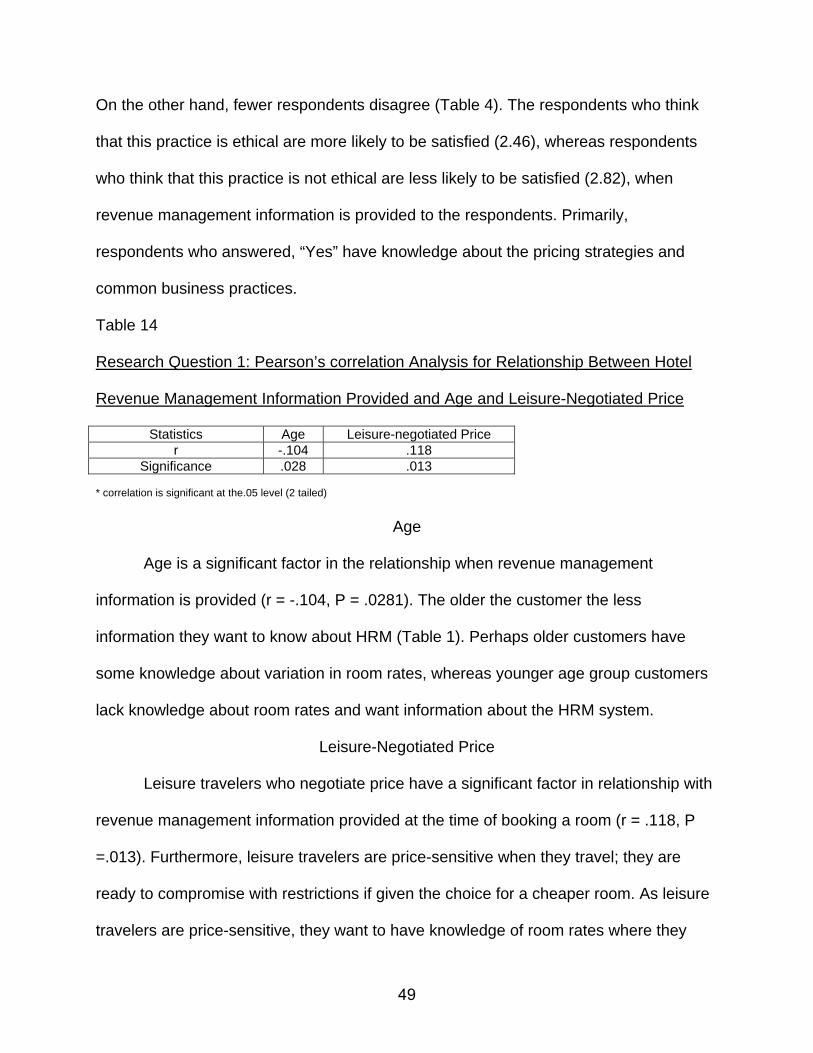
On the other hand, fewer respondents disagree (Table 4). The respondents who think
that this practice is ethical are more likely to be satisfied (2.46), whereas respondents
who think that this practice is not ethical are less likely to be satisfied (2.82), when
revenue management information is provided to the respondents. Primarily,
respondents who answered, “Yes” have knowledge about the pricing strategies and
common business practices.
Table 14
Research Question 1: Pearson’s correlation Analysis for Relationship Between Hotel
Revenue Management Information Provided and Age and Leisure-Negotiated Price
Statistics Age Leisure-negotiated Price r -.104 .118
Significance .028 .013 * correlation is significant at the.05 level (2 tailed)
Age
Age is a significant factor in the relationship when revenue management
information is provided (r = -.104, P = .0281). The older the customer the less
information they want to know about HRM (Table 1). Perhaps older customers have
some knowledge about variation in room rates, whereas younger age group customers
lack knowledge about room rates and want information about the HRM system.
Leisure-Negotiated Price
Leisure travelers who negotiate price have a significant factor in relationship with
revenue management information provided at the time of booking a room (r = .118, P
=.013). Furthermore, leisure travelers are price-sensitive when they travel; they are
ready to compromise with restrictions if given the choice for a cheaper room. As leisure
travelers are price-sensitive, they want to have knowledge of room rates where they
49

want to travel. Providing subsequent information about the HRM system would
decrease their search time for a cheaper room and in turn cause them to be satisfied by
the hotel. Satisfaction of the customers would bring them back and increase revenue for
the hotel (Belobaba, 2001).
To address the second research question, cross-tabulations, ANOVA, and
Pearson correlations were used as analytical tools. Table 15 provides a summary of
significant and non-significant variables for Research Question Two.
Table 15
Significant and Non-Significant Variables for Research Question 2
Name Crosstabs Significant
ANOVA Significant
CorrelationSignificant
Gender Yes Yes N/A Age N/A N/A Yes Income N/A N/A No Education N/A N/A No Ethnicity Yes No N/A FGP enrolled No Yes N/A FGP redeemed No No N/A FFP enrolled No No N/A FFP redeemed No No N/A Customer perceptions of capitalism as a basis for market-based pricing Yes
Yes
N/A
Customer perceptions of seasonal price Adjustments No
No
N/A
Customer perceptions of pricing based on marketing channel No
No
N/A
Frequency of business traveler N/A N/A No Frequency of leisure traveler N/A N/A No Business-fixed price N/A N/A No Leisure-fixed price N/A N/A No Business-negotiated price N/A N/A No Leisure-negotiated price N/A N/A No
50

Table 16
Research Question 2: Cross-tabulation Analysis for Relationship Between Hotel
Revenue Management Information not Provided and Gender
Gender Highly Satisfied
(%)
More Satisfied
(%)
Little Satisfied
(%)
Neutral
(%)
Little Dissatisfied
(%)
More Dissatisfied
(%)
Highly Dissatisfied
(%)
Total (%)
Male 4.4% 2.6% 4.4% 45.0% 16.2% 15.7% 11.8% 100% Female 2.3% 4.1% 9.7% 23.5% 23.0% 14.7% 22.6% 100% Total-N 3.4% 3.4% 7.0% 34.5% 19.5% 15.2% 17.0% 100%
Chi-Square = 31.975. P = .000.
There is a significant relationship between HRM information not provided and
gender (Chi-Square = 31.975, P =.00). When HRM information is not provided, more
respondents are “Highly Dissatisfied” than “Satisfied.” Further, roughly 34% of the
respondents remain neutral in their decision (Table 8). Additionally, 43.7% males are
“Dissatisfied” and 11.4% males are “Satisfied.” Furthermore, 45.0% male respondents
remained neutral in their perception. When HRM information is not provided 60.3%
females are dissatisfied, whereas 16.7% females are satisfied. Additionally, 23.5%
females remain neutral. Table 1 states that there are more men than women who
responded to the survey, however, the dissatisfaction percentage of women is higher
than males when HRM information is not provided.
When information is not provided, the percentage of males who are dissatisfied
(43.7%) and neutral (45.0%) are close to each other. Few male respondents are
satisfied when information on HRM is not provided. Hence, we can conclude that when
HRM information is not provided the majority of male respondents remain unbothered.
51

When information is not provided, majority of females are dissatisfied particularly
in comparison with males. Females want to know more about pricing strategies used by
hotels. When sufficient information on prices is not provided, females are more
dissatisfied than satisfied.
Table 17
Research Question 2: Cross-tabulation Analysis for Relationship Between Hotel
Revenue Management Information not Provided and Ethnicity
Ethnicity Highly Satisfied
(%)
More Satisfied
(%)
Little Satisfied
(%)
Neutral
(%)
Little Dissatisfied
(%)
More Dissatisfied
(%)
Highly Dissatisfied
(%)
Total (%)
African-American
8.5 3.4 5.1 30.5 13.6 10.2 28.8 100%
Hispanic-American
3.6 9.1 9.1 27.3 18.2 10.9 21.8 100%
White-American
2.7 .7 7.5 36.5 21.2 17.1 14.3 100%
Asian-American
0.0 15.0 5.0 25.0 25.0 15.0 15.0 100%
Native –American
0.0 40.0 0.0 20.0 0.0 20.0 20.0 100%
Total 3.5 3.2 7.2 33.8 19.7 15.3 17.4 100% Chi-Square = 62.022. P = .000
There is a significant relationship between HRM information not provided and
ethnicity (Chi-Square = 62.022, P = .00).When HRM information is not provided all
ethnic groups remain more dissatisfied than satisfied. When information is not provided
4 large percentages remains “Neutral” in their perception. Table 8 states that 34.4% of
the respondents remain neutral, rest lean toward dissatisfaction.
Additionally, Table 1 state that White-Americans (67.6%) have dominated when
taking the survey and 52.6% are dissatisfied when HRM information is not provided. Of
the 4.5% Asian-Americans who took the survey, 55% were dissatisfied.
52

Hence, we can conclude that Asian-Americans are more dissatisfied than White-
Americans possibly because they are price-sensitive and want to obtain the cheapest
price possible for a room rate. Further, they want to attain knowledge of the product and
the best price they could pay. When information is not provided, this group is the most
dissatisfied of all ethnic groups.
Table 18
Research Question 2: Cross-tabulation Analysis for Relationship Between Hotel
Revenue Management Information not Provided and Ethical Issue Relating to Customer
Perceptions of Capitalism as a Basis for Market-based Pricing
Statistics Highly Satisfied
(%)
More Satisfied
(%)
Little Satisfied
(%)
Neutral
(%)
Little Dissatisfied
(%)
More Dissatisfied
(%)
Highly Dissatisfied
(%)
Total (%)
Ethical 2.3 3.0 6.1 36.7 19.2 15.2 17.5 100 Not-Ethical 11.8 5.9 13.7 17.6 19.6 17.6 13.7 100
Total-N 3.4 3.4 7.0 34.5 19.3 15.5 17.0 100 Chi-Square = 22.278. P = .001
There is a significant relationship between HRM information not provided and
perceptions of capitalism based on market pricing (Chi-Square = 22.278, P = .001).
Table 4 explains that 88.6% of the respondents agreed and 11.4% of the respondents
disagreed that hotels are entitled to change their pricing strategies to maximize
revenue. When HRM information is not provided 51.9% respondents agreed that they
were dissatisfied whereas 11.4% respondents agreed that they were satisfied and
36.7% respondents remained neutral in their perception.
53

When information is not provided is compared with respondents who disagreed
with ethical issue relating to customer perception of capitalism as a basis for market-
based pricing, 50.9% respondents were dissatisfied whereas 31.4% were satisfied.
Further, 17.6% respondents remained neutral in their perception.
Hence, one can conclude that respondents who agreed on the ethical issue that
capitalism is a basis for market based pricing are dissatisfied when HRM information is
not provided.
Table 19
Research Question 2: ANOVA Analysis for Relationship Between Hotel Revenue
Management Information not Provided and Gender
Statistics Hotel Revenue Management Information not Provided
Male 4.60 Female 4.95 F Value 6.177
Significance .013
Females are significantly more dissatisfied than males when HRM information is
not provided (F = 6.177, P = .013). The male mean value is 4.60, which is in the middle
of “Neutral” and “Little Dissatisfied.” Female mean value is 4.95, inclined toward “Little
Dissatisfied.” Thus, gender is a significant factor when HRM information is not provided.
54
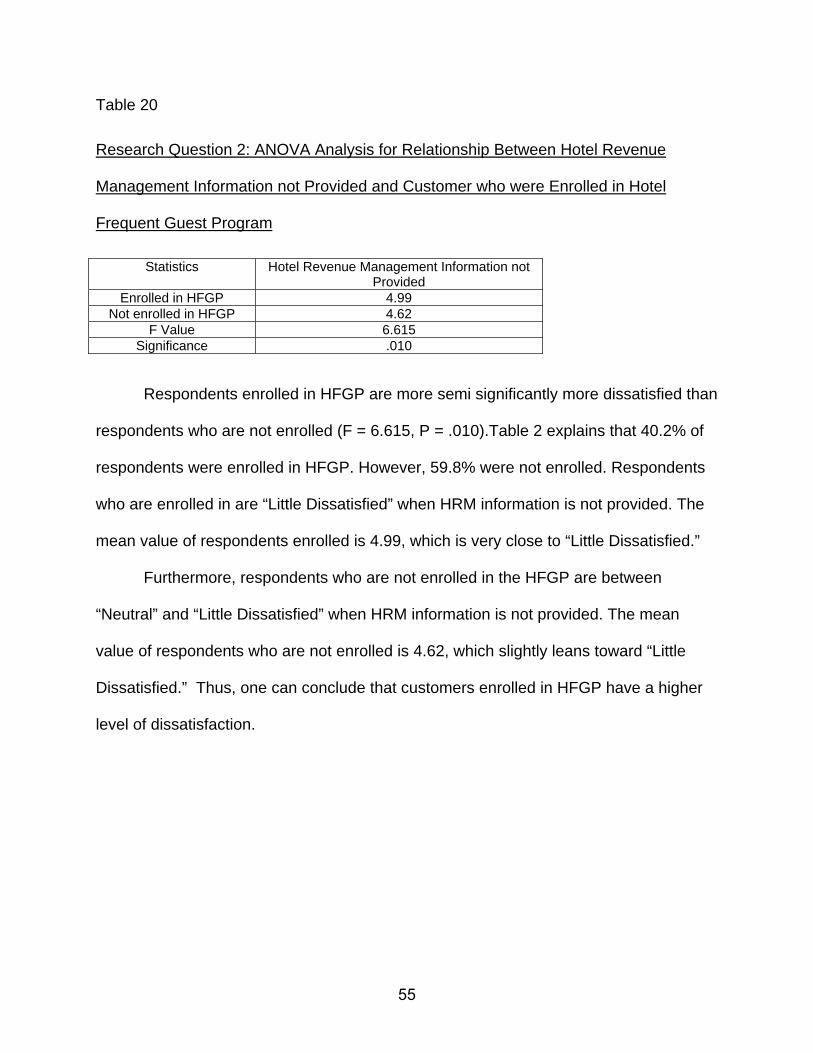
Table 20
Research Question 2: ANOVA Analysis for Relationship Between Hotel Revenue
Management Information not Provided and Customer who were Enrolled in Hotel
Frequent Guest Program
Statistics Hotel Revenue Management Information not Provided
Enrolled in HFGP 4.99 Not enrolled in HFGP 4.62
F Value 6.615 Significance .010
Respondents enrolled in HFGP are more semi significantly more dissatisfied than
respondents who are not enrolled (F = 6.615, P = .010).Table 2 explains that 40.2% of
respondents were enrolled in HFGP. However, 59.8% were not enrolled. Respondents
who are enrolled in are “Little Dissatisfied” when HRM information is not provided. The
mean value of respondents enrolled is 4.99, which is very close to “Little Dissatisfied.”
Furthermore, respondents who are not enrolled in the HFGP are between
“Neutral” and “Little Dissatisfied” when HRM information is not provided. The mean
value of respondents who are not enrolled is 4.62, which slightly leans toward “Little
Dissatisfied.” Thus, one can conclude that customers enrolled in HFGP have a higher
level of dissatisfaction.
55
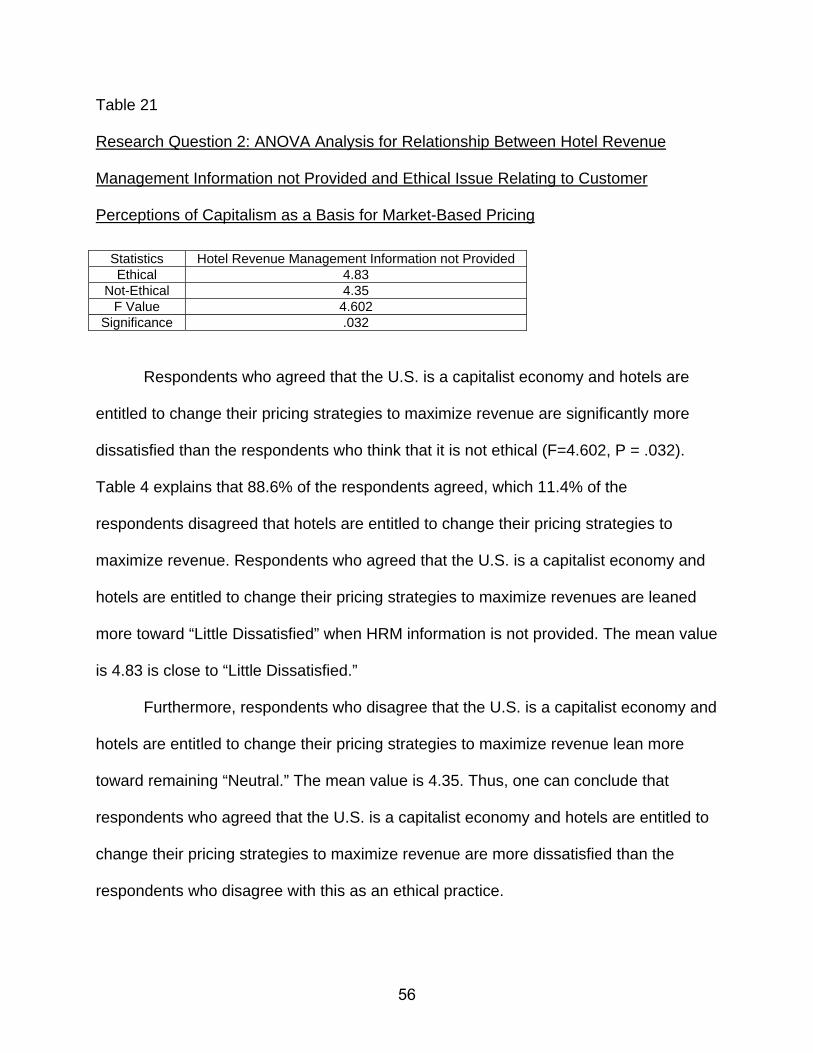
Table 21
Research Question 2: ANOVA Analysis for Relationship Between Hotel Revenue
Management Information not Provided and Ethical Issue Relating to Customer
Perceptions of Capitalism as a Basis for Market-Based Pricing
Statistics Hotel Revenue Management Information not Provided Ethical 4.83
Not-Ethical 4.35 F Value 4.602
Significance .032
Respondents who agreed that the U.S. is a capitalist economy and hotels are
entitled to change their pricing strategies to maximize revenue are significantly more
dissatisfied than the respondents who think that it is not ethical (F=4.602, P = .032).
Table 4 explains that 88.6% of the respondents agreed, which 11.4% of the
respondents disagreed that hotels are entitled to change their pricing strategies to
maximize revenue. Respondents who agreed that the U.S. is a capitalist economy and
hotels are entitled to change their pricing strategies to maximize revenues are leaned
more toward “Little Dissatisfied” when HRM information is not provided. The mean value
is 4.83 is close to “Little Dissatisfied.”
Furthermore, respondents who disagree that the U.S. is a capitalist economy and
hotels are entitled to change their pricing strategies to maximize revenue lean more
toward remaining “Neutral.” The mean value is 4.35. Thus, one can conclude that
respondents who agreed that the U.S. is a capitalist economy and hotels are entitled to
change their pricing strategies to maximize revenue are more dissatisfied than the
respondents who disagree with this as an ethical practice.
56
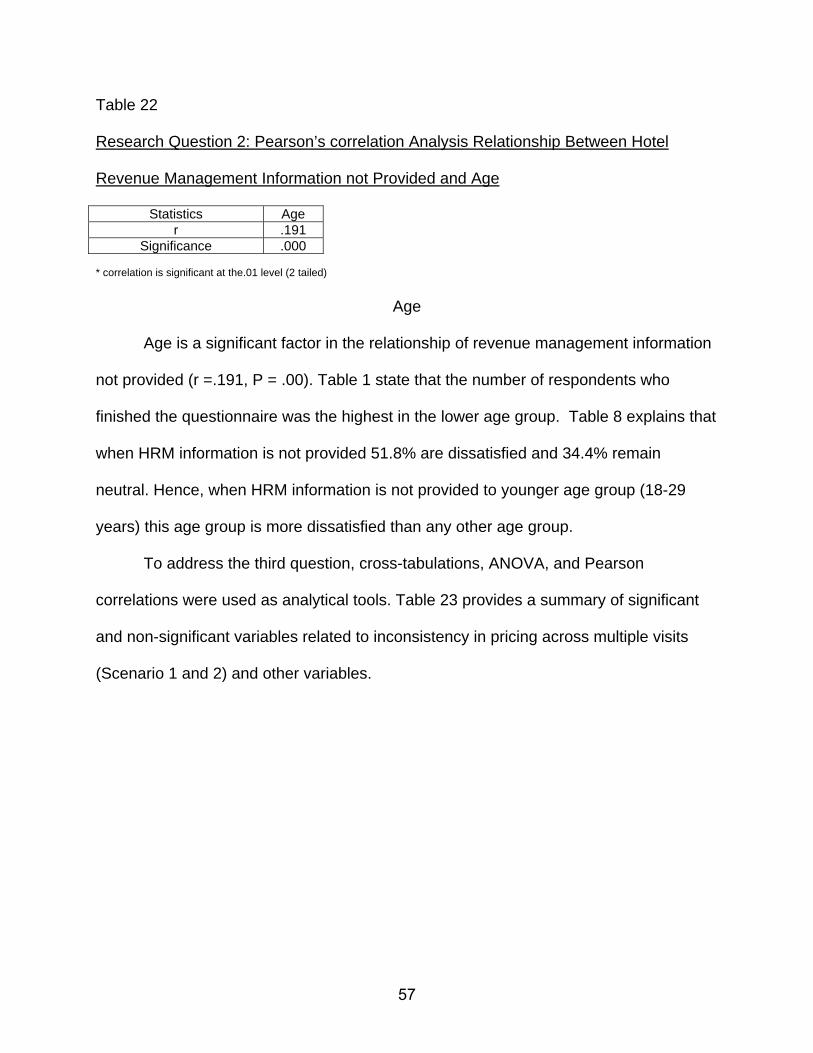
Table 22
Research Question 2: Pearson’s correlation Analysis Relationship Between Hotel
Revenue Management Information not Provided and Age
Statistics Age r .191
Significance .000 * correlation is significant at the.01 level (2 tailed)
Age
Age is a significant factor in the relationship of revenue management information
not provided (r =.191, P = .00). Table 1 state that the number of respondents who
finished the questionnaire was the highest in the lower age group. Table 8 explains that
when HRM information is not provided 51.8% are dissatisfied and 34.4% remain
neutral. Hence, when HRM information is not provided to younger age group (18-29
years) this age group is more dissatisfied than any other age group.
To address the third question, cross-tabulations, ANOVA, and Pearson
correlations were used as analytical tools. Table 23 provides a summary of significant
and non-significant variables related to inconsistency in pricing across multiple visits
(Scenario 1 and 2) and other variables.
57
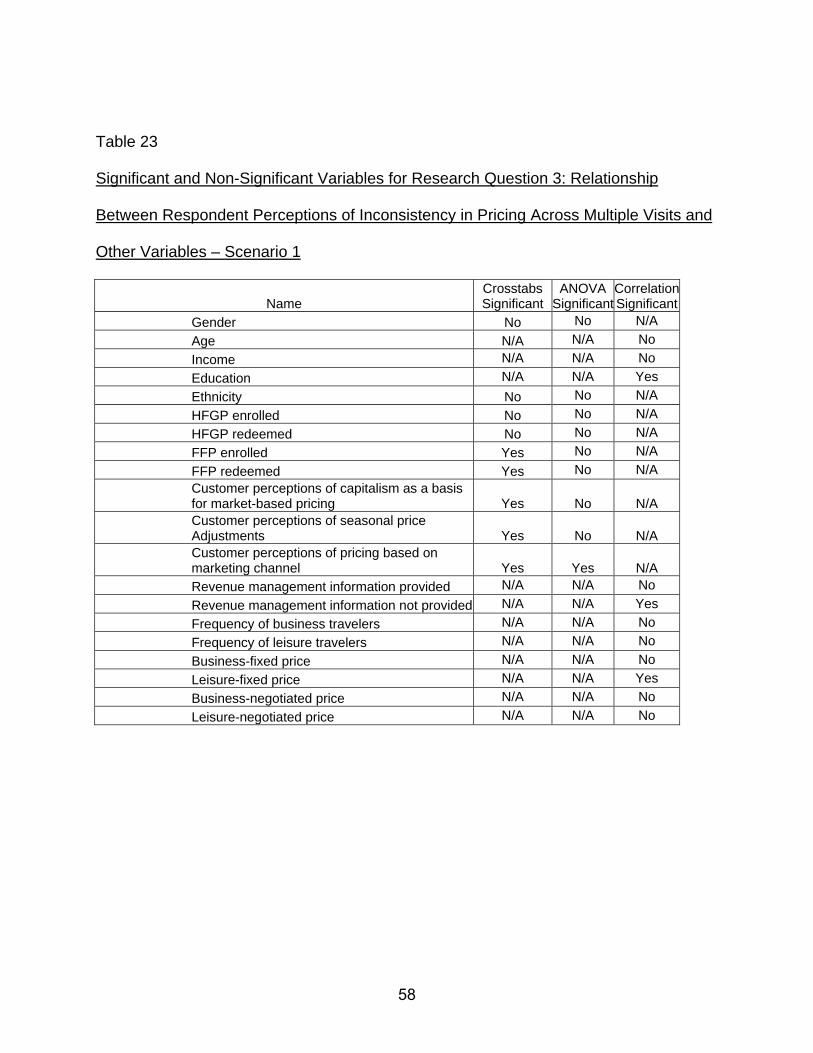
Table 23
Significant and Non-Significant Variables for Research Question 3: Relationship
Between Respondent Perceptions of Inconsistency in Pricing Across Multiple Visits and
Other Variables – Scenario 1
Name Crosstabs Significant
ANOVA Significant
CorrelationSignificant
Gender No No N/A Age N/A N/A No Income N/A N/A No Education N/A N/A Yes Ethnicity No No N/A HFGP enrolled No No N/A HFGP redeemed No No N/A FFP enrolled Yes No N/A FFP redeemed Yes No N/A Customer perceptions of capitalism as a basis for market-based pricing Yes
No
N/A
Customer perceptions of seasonal price Adjustments Yes
No
N/A
Customer perceptions of pricing based on marketing channel Yes
Yes
N/A
Revenue management information provided N/A N/A No Revenue management information not provided N/A N/A Yes Frequency of business travelers N/A N/A No Frequency of leisure travelers N/A N/A No Business-fixed price N/A N/A No Leisure-fixed price N/A N/A Yes Business-negotiated price N/A N/A No Leisure-negotiated price N/A N/A No
58
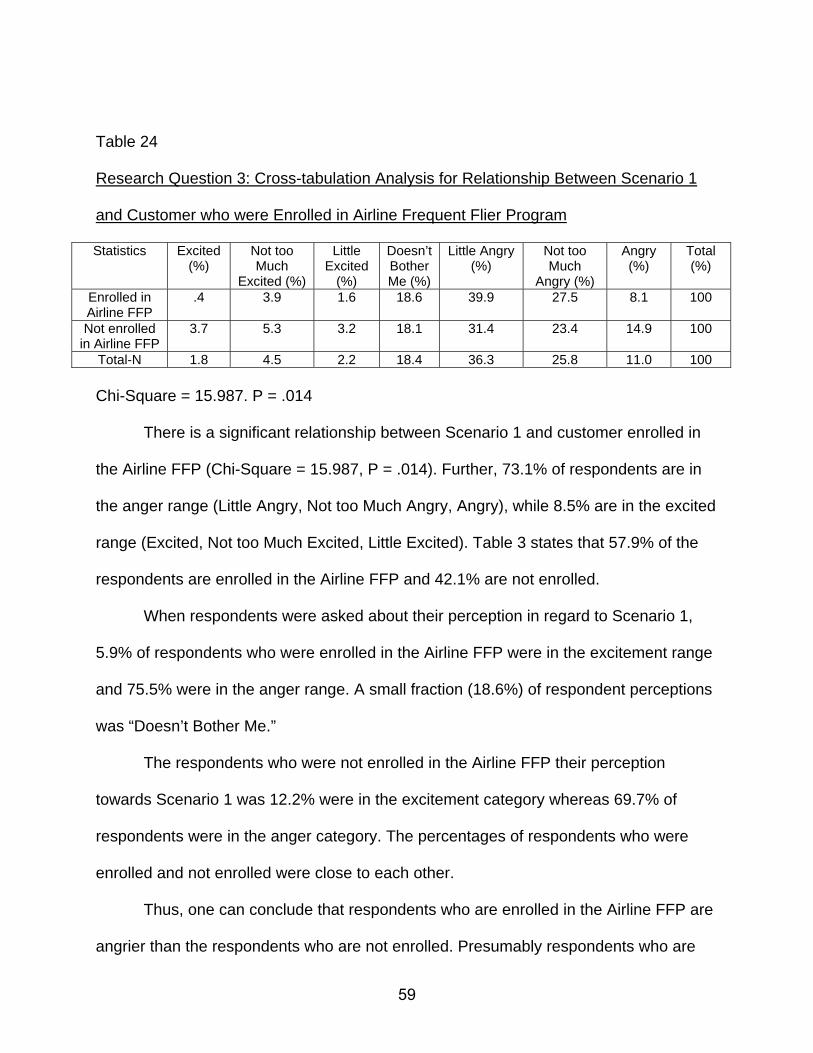
Table 24
Research Question 3: Cross-tabulation Analysis for Relationship Between Scenario 1
and Customer who were Enrolled in Airline Frequent Flier Program
Statistics Excited (%)
Not too Much
Excited (%)
Little Excited
(%)
Doesn’t Bother Me (%)
Little Angry (%)
Not too Much
Angry (%)
Angry (%)
Total (%)
Enrolled in Airline FFP
.4 3.9 1.6 18.6 39.9 27.5 8.1 100
Not enrolled in Airline FFP
3.7 5.3 3.2 18.1 31.4 23.4 14.9 100
Total-N 1.8 4.5 2.2 18.4 36.3 25.8 11.0 100 Chi-Square = 15.987. P = .014
There is a significant relationship between Scenario 1 and customer enrolled in
the Airline FFP (Chi-Square = 15.987, P = .014). Further, 73.1% of respondents are in
the anger range (Little Angry, Not too Much Angry, Angry), while 8.5% are in the excited
range (Excited, Not too Much Excited, Little Excited). Table 3 states that 57.9% of the
respondents are enrolled in the Airline FFP and 42.1% are not enrolled.
When respondents were asked about their perception in regard to Scenario 1,
5.9% of respondents who were enrolled in the Airline FFP were in the excitement range
and 75.5% were in the anger range. A small fraction (18.6%) of respondent perceptions
was “Doesn’t Bother Me.”
The respondents who were not enrolled in the Airline FFP their perception
towards Scenario 1 was 12.2% were in the excitement category whereas 69.7% of
respondents were in the anger category. The percentages of respondents who were
enrolled and not enrolled were close to each other.
Thus, one can conclude that respondents who are enrolled in the Airline FFP are
angrier than the respondents who are not enrolled. Presumably respondents who are
59
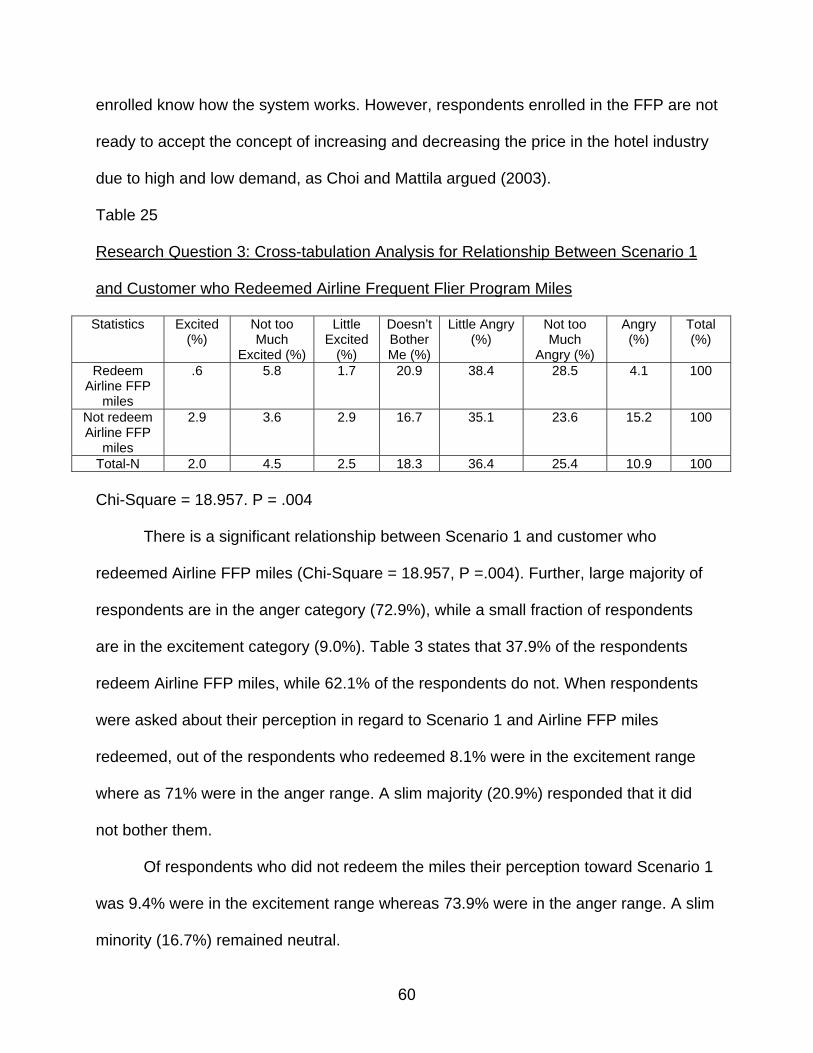
enrolled know how the system works. However, respondents enrolled in the FFP are not
ready to accept the concept of increasing and decreasing the price in the hotel industry
due to high and low demand, as Choi and Mattila argued (2003).
Table 25
Research Question 3: Cross-tabulation Analysis for Relationship Between Scenario 1
and Customer who Redeemed Airline Frequent Flier Program Miles
Statistics Excited (%)
Not too Much
Excited (%)
Little Excited
(%)
Doesn’t Bother Me (%)
Little Angry (%)
Not too Much
Angry (%)
Angry (%)
Total (%)
Redeem Airline FFP
miles
.6 5.8 1.7 20.9 38.4 28.5 4.1 100
Not redeem Airline FFP
miles
2.9 3.6 2.9 16.7 35.1 23.6 15.2 100
Total-N 2.0 4.5 2.5 18.3 36.4 25.4 10.9 100 Chi-Square = 18.957. P = .004
There is a significant relationship between Scenario 1 and customer who
redeemed Airline FFP miles (Chi-Square = 18.957, P =.004). Further, large majority of
respondents are in the anger category (72.9%), while a small fraction of respondents
are in the excitement category (9.0%). Table 3 states that 37.9% of the respondents
redeem Airline FFP miles, while 62.1% of the respondents do not. When respondents
were asked about their perception in regard to Scenario 1 and Airline FFP miles
redeemed, out of the respondents who redeemed 8.1% were in the excitement range
where as 71% were in the anger range. A slim majority (20.9%) responded that it did
not bother them.
Of respondents who did not redeem the miles their perception toward Scenario 1
was 9.4% were in the excitement range whereas 73.9% were in the anger range. A slim
minority (16.7%) remained neutral.
60

Thus, one can conclude that respondents who did not redeem miles are angrier
than those who redeemed them primarily respondents who did not redeem miles do not
know how the pricing strategies of booking system work in the airline industry, or what
benefits a customer can get from redeeming miles.
Table 26
Research Question 3: Cross-tabulation Analysis for Relationship Between Scenario 1
and Ethical Issue Relating to Customer Perceptions of Capitalism as a Basis for Market-
Based Pricing
Statistics Excited (%)
Not too Much
Excited (%)
Little Excited
(%)
Doesn’t Bother Me (%)
Little Angry (%)
Not too Much
Angry (%)
Angry (%)
Total (%)
Ethical 2.0 4.3 2.0 18.9 38.5 24.9 9.3 100 Not-Ethical 2.0 3.9 5.9 11.8 21.6 29.4 25.5 100
Total-N 2.0 4.2 2.5 18.1 36.6 25.4 11.2 100 Chi-Square = 18.536. P = .005
There is a significant relationship between Scenario 1 and customer perceptions
of ethical issue regarding capitalism based in market pricing (Chi-Square = 18.536, P =
.005). Further, overwhelming majority of respondents are in the anger category (73.2%),
while a small fraction of respondents are in the excitement category (8.7%).
Table 4 explains that 88.6% of the respondents agreed and 11.4% disagreed that
the U.S. is a capitalist economy and hotels are entitled to change their pricing strategies
to maximize revenue. When reacting to Scenario 1, 8.3% of respondents were in the
excitement range, whereas 72.7% respondents were in the anger range. A slim minority
(18.9%) of respondents remained neutral.
61

When reacting to Scenario 1, respondents who perceived that it was not-ethical
that the U.S. is a capitalist economy and hotels are entitled to change their pricing
strategy, 11.8% were in the excitement and neutral range whereas, 76.5% were in the
anger range. Hence, one can conclude that respondents whose perception is that it is
not- ethical for hotels to change their prices to maximize revenues are angrier than
those respondents who think that it is ethical.
Table 27
Research Question 3: Cross-tabulation Analysis for Relationship Between Scenario 1
and Ethical Issue Relating to Customer Perceptions of Seasonal Price Adjustments
Statistics Excited (%)
Not too Much
Excited (%)
Little Excited
(%)
Doesn’t Bother Me (%)
Little Angry (%)
Not too Much
Angry (%)
Angry (%)
Total (%)
Ethical 2.7 3.6 1.2 19.3 38.7 25.3 9.2 100 Not-Ethical 0.0 6.3 5.4 14.4 29.7 27.0 17.1 100
Total-N 2.0 4.3 2.2 18.1 36.5 25.7 11.2 100 Chi-Square = 18.766. P = .005
There is a significant relationship between Scenario 1 and customer perceptions
of ethical issue regarding seasonal price adjustments (Chi-Square = 18.766, P =.005).
Further, an overwhelming majority of respondents are in the anger category (73.4%),
while a small fraction of respondents are in the excitement category (8.5%).
Table 4 states that 75.2% of respondents agree and 24.6% disagree on the
ethical issue that hotels can increase the price of the room rate during high seasons and
decrease them during low seasons. When Scenario 1 was presented to respondents
who agreed on the ethical issue that hotels can increase and decrease prices during
high and low seasons, 7.5% were in the excitement range, whereas 73.2% were in the
62

anger range. A slim minority (19.3%) said that the increase and decrease did not bother
them.
When Scenario 1 was presented to respondents who disagreed with the ethical
issue of increases and decreases, 11.7% were in the excitement range, whereas 73.8%
were in the anger range. A slim minority (14.4%) remained neutral. Hence, one can
conclude that the respondents are angry in any circumstances when given Scenario 1.
Table 28
Research Question 3: Cross-tabulation Analysis for Relationship Between Scenario 1
and Ethical Issue Relating to Customer Perceptions of Pricing Fluctuations Based on
Marketing Channel
Statistics Excited (%)
Not too Much
Excited (%)
Little Excited
(%)
Doesn’t Bother Me (%)
Little Angry (%)
Not too Much
Angry (%)
Angry (%)
Total (%)
Ethical 2.9 3.7 2.1 21.0 37.4 26.7 6.2 100 Not-Ethical 1.0 4.9 2.4 14.6 35.6 24.4 17.1 100
Total-N 2.0 4.2 2.2 18.1 36.6 25.7 11.2 100 Chi-Square =17.107. P = .009
There is a significant relationship between Scenario 1 and customer perceptions
of ethical issue regarding pricing fluctuations based on marketing channel (Chi-Square
= 17.107, P = .009). Further, an overwhelming majority of respondents are in the anger
category (73.5%), while a small fraction of respondents are in the excitement category
(8.4%). Table 4 states that 54.3% respondents agree and 45.7% respondents disagree
on the ethical issue that booking a hotel room over the phone and Internet could have
two different room rates.
63

When Scenario 1 was presented to respondents who agreed that booking a hotel
room over the phone and Internet could have two different room rates, 8.7% were in the
excitement range, whereas 70.3% were in the anger range. A slim majority (21.0%)
responded that it did not bother them. When Scenario 1 was presented to respondents
who disagree that booking a hotel room over the phone and Internet could have two
different room rates, 8.3% were in the excitement range, whereas 77.1% were in the
anger range. A slim majority (14.6%) responded that getting two different rates did not
bother them. Hence, one can conclude that when given Scenario 1, respondents who
agreed that it is ethical issue when two different room rates are gained are less angry
than respondents who disagreed that it was an ethical issue.
Table 29
Research Question 3: ANOVA Analysis for Relationship Between Scenario 1 and
Ethical Issue Relating to Customer Perceptions of Pricing Fluctuations Based on
Marketing Channel
Statistics Scenario 1 Ethical 4.91
Not-Ethical 5.20 F Value 5.682
Significance .018
Respondents whose perception is that it is not ethical to price variations based
on marketing channel are significantly angrier than the respondents who perceive that it
is ethical when Scenario 1 is provided (F = 5.628, P = .018). Table 4 explains that
54.3% of respondents agreed and 45.7% respondents disagreed that booking over the
phone and Internet could provide two different room rates. Respondents who agreed
leaned toward “Little Angry” when Scenario 1 is provided. The mean value is 4.91,
64

which is close to “Little Angry.” Furthermore, respondents who disagreed leaned more
toward “Not too Much Angry” when Scenario 1 is provided. The mean value is 5.20,
which is close to “Not too Much Angry.” Thus, one can conclude that the ethical issue of
price fluctuations based on marketing channel is a significant factor when Scenario 1 is
provided.
Table 30
Research Question 3: Pearson’s correlation Analysis for Relationship Between Scenario
1 and Level of Education, Leisure-fixed Price, and Hotel Revenue Management
Information not Provided
Statistics Level of Education
Leisure-fixed Price Hotel Revenue Management Information
NOT Provided r -.125 .126 .113
Significance .009 .008 .017 * correlation is significant at the.05 level (2 tailed)
Level of Education
Level of education is a significant factor in relation to Scenario 1 (r = -.125,
P = .009). Table 1 reflects a high number of respondents had a 4-year college degree
(31.9%). Furthermore, there were few respondents who had less than a high school
diploma (10.9%). As most of the respondents had some level of higher education
probably that have better knowledge about different room rates.
Leisure-fixed Price
Leisure-fixed Price is a significant factor in relationship with Scenario 1 (r = .126,
P = .008). Table 6 states that most of the respondents are dissatisfied (53.8%) when
leisure travelers pay a fixed price for a hotel room. Furthermore, when the price of the
room rate increased than the last time the respondent stayed in the same hotel
65
(Scenario 1), the respondents were angry because the respondents were dissatisfied
with the fixed price when traveling for leisure (Table 6). The dissatisfaction led to anger
towards Scenario 1.Thus, one can conclude that when hotels have a fixed price for
leisure travelers and an increase in price over last time for the same hotel room, it will
upset customers.
Hotel Revenue Management Information not Provided
Revenue management information not provided is a significant factor in
relationship with Scenario 1 (r = .113, P = .017). Table 8 states that a majority of the
respondents are dissatisfied (51.8%) when revenue management information is not
provided. Furthermore, when the price of the room rate increased over the last time the
respondents stayed in the same hotel (Scenario 1), the respondents were angry. When
HRM information is not provided, customers are dissatisfied because they do not know
the different room rates of the given market.
Table 31 provides a summary of significant and non-significant variables related
to inconsistency in pricing across multiple visits (Scenario 1 and 2) and other variables.
66

Table 31
Significant and Non-Significant Variables for Research Question Three: Relationship
Between Respondent Perceptions of Inconsistency in Pricing Across Multiple Visits and
Other Variables – Scenario 2
Name Crosstabs Significant
ANOVA Significant
CorrelationSignificant
Gender Yes No N/A Age N/A N/A Yes Income N/A N/A Yes Education N/A N/A Yes Ethnicity Yes Yes N/A HFGP enrolled No No N/A HFGP redeemed Yes Yes N/A FFP enrolled No Yes N/A FFP redeemed No Yes N/A Customer perceptions of capitalism as a basis for market-based pricing
No
No
N/A
Customer perceptions of seasonal price Adjustments
No
No
N/A
Customer perceptions of pricing based on marketing channel
Yes
Yes
N/A
Revenue management information provided N/A N/A No Revenue management information not provided N/A N/A No Frequency of business travelers N/A N/A Yes Frequency of leisure travelers N/A N/A No Business-fixed price N/A N/A No Leisure-fixed price N/A N/A No Business-negotiated price N/A N/A No Leisure-negotiated price N/A N/A No
67

Table 32
Research Question 3: Cross-tabulation Analysis for Relationship Between Scenario 2
and Gender
Gender Excited (%)
Not too Much
Excited (%)
Little Excited
(%)
Doesn’t Bother Me (%)
Little Angry (%)
Not too Much
Angry (%)
Angry (%) Total (%)
Male 20.6 26.8 30.7 13.2 3.5 4.4 0.9 100 Female 33.6 26.8 17.7 11.8 4.5 4.5 0.9 100 Total-N 27.0 26.8 24.3 12.5 4.0 4.5 0.9 100
Chi-Square = 15.245. P = .018
There is a significant relationship between Scenario 2 and gender (Chi-Square =
15.245, P = .018). Further, an overwhelming majority of respondents are in the
excitement category (78.1%), while a small fraction of respondents are in the anger
category (9.4%). Table 1 state that 51.1% of respondents are male and 48.9% are
female. When respondents were asked about their perception in regard to Scenario 2,
of male respondents 78.1% were in the excitement category, while 8.8% were in the
anger category. A small fraction (13.2%) was in the “Doesn’t Bother Me” category.
Of female respondents who were asked about their perception of Scenario 2,
78.1% were in the excitement category, while 9.9% were in the anger category. Small
fraction (11.8%) was in the “Doesn’t Bother Me” category. Thus, one can conclude that
both male and female respondents are thrilled when a lower price is offered to them
when compared to the last time they stayed in the same hotel.
68

Table 33
Research Question 3: Cross-tabulation Analysis for Relationship Between Scenario 2
and Ethnicity
Ethnicity Excited (%)
Not too Much
Excited (%)
Little Excited
(%)
Doesn’t Bother Me (%)
Little Angry (%)
Not too Much
Angry (%)
Angry (%) Total (%)
African-American
44.3 19.7 8.2 14.8 3.3 9.8 .0 100%
Hispanic-American
32.7 30.9 25.5 7.3 1.8 1.8 .0 100%
White-American
20.4 27.6 28.9 13.3 4.4 4.1 1.4 100%
Asian-American
52.6 26.3 5.3 .0 10.5 5.3 .0 100%
Native –American
20.0 40.0 .0 40 .0 .0 .0 100%
Total 26.7 27.0 24.2 12.4 4.1 4.6 .9 100% Chi-Square = 48.950. P = .002
There is a significant relationship between Scenario 2 and ethnicity
(Chi-Square = 48.950, P = .002). Further, an overwhelming majority of respondents are
in excitement category (77.9%), while a small fraction of respondents are in the anger
category (9.6%). Table 1 states that 13.8% of respondents are African-American, 12.7%
are Hispanic-American, 67.6% are White-American, 4.5% are Asian-American, and
1.4% are Native-American. When respondents were asked about their perception of
Scenario 2, of African-American respondents 72.2% were in the excitement category
and 13.1% were in the anger category. A small fraction (14.8%) was in the “Doesn’t
Bother Me” category.
Of Hispanic-Americans who were asked about their perception of Scenario 2,
89.1% were in the excitement category and 3.6% were in the anger category. Small
fraction (7.3%) was in the “Doesn’t Bother Me” category. Moreover, 76.9% of White-
Americans were in the excitement category and 9.9% were in the anger category with
69

13.3% in the “Doesn’t Bother Me” category. Further, 82.2% of Asian-Americans were in
the excitement category, 15.8% were in the anger category and 0% Asian-Americans
were in the “Doesn’t Bother Me” category.
Additionally, 60% of Native-Americans were in the excitement category and 0%
were in the anger category. Small fraction (40%) was in the “Doesn’t Bother Me”
category. Thus, one can conclude that Hispanic-Americans are more excited when
provided Scenario 2 than other ethnicities, meaning Hispanic-Americans are price-
sensitive customers. To make the Hispanic-American community satisfied, it is
imperative that a cheaper price be provided to them than the regular market price.
Table 34
Research Question 3: Cross-tabulation Analysis for Relationship Between Scenario 2
and Customer who Redeem Hotel Frequent Guest Program Points
Statistics Excited (%)
No too Much
Excited (%)
Little Excited
(%)
Doesn’t Bother Me (%)
Little Angry (%)
Not too Much
Angry (%)
Angry (%) Total (%)
Redeem HFGP points
15.8 28.4 25.3 18.9 6.3 5.3 .0 100
Not redeem HFGP points
30.2 26.2 24.2 10.5 3.4 4.3 1.1 100
Total-N 27.1 26.7 24.4 12.3 4.0 4.5 .9 100 Chi-Square = 12.977. P = .043
There is a significant relationship between Scenario 2 and customer who
redeemed HFGP points (Chi-Square = 12.977, P = .043). Further, an overwhelming
majority of respondents are in the excitement category (78.2%), while a small fraction of
respondents are in the anger category (9.4%).
70

Table 2 states that 40.2% of respondents were enrolled in the HFGP and 59.8%
were not enrolled. When respondents were asked about their perception of Scenario 2,
of respondents who were enrolled 69.5% were in the excitement category and 11.6%
were in the anger category. Small fraction (18.9%) was in the “Doesn’t Bother Me”
category.
Of respondents not enrolled their perception of Scenario 2 was that 80.6% were
in the excitement category, 8.8% were in the anger category, and 10.5% were in the
“Doesn’t Bother Me” category. Hence, one can suggest that respondents not enrolled in
the HFGP are more excited than those enrolled, perhaps because a non-HFGP
customer does not expect any special services or promotions given to him/her by the
hotel. Receiving a lower price for the same room would please the customer. However,
a customer who is a member of a HFGP expects more from the hotel and therefore, is
less excited than a non-HFGP customer.
Table 35
Research Question 3: Cross-tabulation Analysis for Relationship Between Scenario 2
and Ethical Issue Relating to Customer Perceptions of Pricing Fluctuations Based on
Marketing Channel
Statistics Excited (%)
No too Much
Excited (%)
Little Excited
(%)
Doesn’t Bother Me (%)
Little Angry (%)
Not too Much
Angry (%)
Angry (%) Total(%)
Ethical 20.7 26.0 28.5 14.5 5.0 4.5 .8 100 Not-Ethical 35.1 27.3 19.5 9.8 2.9 4.4 1.0 100
Total-N 27.3 26.6 24.4 12.3 4.0 4.5 .9 100 Chi-Square = 15.429. P =. 017
71
There is a significant relationship between Scenario 2 and ethical issue relating
to customer perceptions of pricing fluctuations based on marketing channel
(Chi-Square = 15.429, P = .017). Further, an overwhelming majority of respondents are
in the excitement category (78.3%), while a small fraction of respondents are in the
anger category (9.4%).
Table 4 states that 54.3% of respondents agree and 45.7% disagree that getting
different rates when booking a hotel room over the phone and Internet is an ethical
issue. When Scenario 2 was presented to the respondents who agree, 75.2%
respondents were in the excitement category, 10.3% were in the anger category, and
14.5% of the respondent’s perception was in the “Doesn’t Bother Me” category.
When Scenario 2 was presented to respondents who disagreed, 81.9%
respondents were in the excitement category, 8.3% respondents were in the anger
category, and 9.8% responded that two different rates did not bother them. Hence, one
can state that given Scenario 2, respondents who disagreed two rates signified ethical
issue are more excited than those who agreed. This could be because these
respondents prefer a fixed price be charged when they arrive at the hotel and getting a
lower price than last time, the respondent expectation level towards the hotel is positive
and the respondent is happy and satisfied, as Kimes & Renaghan suggested, (2003)
and Zeithaml (1988) have suggested.
72

Table 36
Research Question 3: ANOVA Analysis for Relationship Between Scenario 2 and
Ethnicity
Statistics Scenario 2 African-American 2.43
Hispanic-American 2.20 White-American 2.71 Asian-American 2.05
Native -American 2.60 F value 2.508
Significance .041
Asian-American ethnic group is significantly most excited than any other ethnic
group when Scenario 2 is provided (F = 2.508, P = .041). Table 1 explains that 13.8% of
the respondents are African-American, 12.7% are Hispanic-American, 67.6% are White-
American, 4.5% are Asian-American, and 1.4% are Native-American.
The perceptions of African-American, Hispanic-American, and Asian-American
respondents in relation to Scenario 2 leaned toward “Not too Much Excited” because
the mean value (2.43, 2.20, 2.05) is much closer to “Not too Much Excited” than “Little
Excited.” On the other hand, the perceptions of White-American and Native-American
respondents in relation to Scenario 2 leaned more towards “Little Excited” because the
mean value (2.71, 2.60) is much closer to “Little Excited” than “Not too Much Excited.”
Hence, one can conclude that ethnicity is a significant factor when Scenario 2 is
provided.
73

Table 37
Research Question 3: ANOVA Analysis for Relationship Between Scenario 2 and
Customer who Redeem Hotel Frequent Guest Program Points
Statistics Scenario 2 Redeem HFGP points 2.87
Not redeem HFGP points 2.48 F Value 5.815
Significance .016
Customers who do not redeem points are significantly more excited than those
who do when Scenario 2 is provided (F = 5.815, P = .016). Table 2 explains that 21.1%
of respondents redeem their HFGP points and 78.9% do not. Respondents who
redeemed points are inclined more toward “Little Excited” when Scenario 2 is provided,
because the mean value is 2.87.
Respondents who did not redeem points leaned more toward “Not too Much
Excited” when Scenario 1 is provided, because the mean value is 2.48, much closer to
“Not too Much Excited.” Thus, customer who redeems HFGP points has a significant
factor when Scenario 2 is provided.
Table 38
Research Question 3: ANOVA Analysis for Relationship Between Scenario 2 and
Customer who were Enrolled in Airline Frequent Flier Program
Statistics Scenario 2 Enrolled in Airline FFP 2.38
Not enrolled in Airline FFP 2.68 F Value 5.036
Significance .025
Customers who are enrolled in the FFP are significantly more excited than the
customers who are not enrolled when Scenario 2 is provided (F = 5.036, P = .025).
Table 3 explains that 57.9% of respondents are enrolled in the Airline FFP and 42.1%
74

are not enrolled. Respondents enrolled leaned more toward “Not too Much Excited”
when Scenario 2 is provided because the mean value is 2.38, which is close to “Not too
Much Excited.”
Additionally, respondents who have not enrolled leaned more towards “Little
Excited” on Scenario 2 because the mean value is 2.68, which is closer to “Little
Excited” than “Not too Much Excited.” Hence, one can conclude that customers who
were enrolled in the Airline FFP were excited when Scenario 2 was provided.
Table 39
Research Question 3: ANOVA Analysis for Relationship Between Scenario 2 and
Customer who Redeem Airline Frequent Flier Program Miles
Statistics Scenario 2 Redeem Airline FFP miles 2.43
Not Redeem Airline FFP miles 2.75 F Value 5.390
Significance .021
Customers who redeem miles are significantly more excited than those who do
not redeem when Scenario 2 is provided (F = 5.390, P =.021). Table 3 explains that
37.9% of respondents redeem their FFP miles and 62.1% do not redeem miles.
Respondents who redeem miles leaned toward “Not too Much Excited” on Scenario 2
because the mean value is 2.43, which is closer to “Not too Much Excited” than “Little
Excited.”
Additionally, respondents who do not redeem miles leaned more toward “Little
Excited” on Scenario 2 because the mean value is 2.75, which is closer to “Little
Excited” than “Not too Much Excited.” Hence, one can conclude that customers who
redeemed Airline FFP miles were excited when Scenario 2 was provided.
75

Table 40
Research Question 3: ANOVA Analysis for Relationship Between Scenario 2 and
Ethical Issue Relating to Customer Perceptions of Pricing Fluctuations Based on
Marketing Channel
Statistics Scenario 2 Ethical 2.74
Not-Ethical 2.35 F Value 8.514
Significance .004
Customers who think that the practice of price fluctuations based on marketing
channel is not ethical are significantly more excited than who think that the practice is
ethical when Scenario 2 is provided (F = 8.514, P = .004). Table 4 explains that 54.3%
of respondents agreed and 45.7% disagreed that booking over the phone and Internet
could provide two different room rates. Respondents who agreed it was an ethical
practice leaned more toward “Little Excited” on Scenario 2 because the mean value is
2.74, which is closer to “Little Excited” than “Not too Much Excited.”
Respondents who disagreed that it is an ethical practice leaned more toward
“Not too Much Excited” on Scenario 2 because the mean value is 2.35, which is closer
to “Not too Much Excited” than “Little Excited.” Hence, customers whose perception was
that this practice is unethical are more excited when Scenario 2 is provided.
76

Table 41
Research Question 3: Pearson’s correlation Analysis for Relationship Between Scenario
2 and Age, Income, Level of Education, and Frequency of Business Travelers
Statistics Age Income Level of Education Frequency of Business Travelers
r .149 .217 .149 .111 Significance .002 .000 .002 .020
* correlation is significant at the.05 level (2 tailed)
Age
Age is a significant factor in relationship with Scenario 2 (r = .149, P = .002).
Table 1 states that 40.4% of respondents were in the age bracket 18-29 years, which is
almost double the number of respondents between 30-39 years and 40-49 years.
Further, 14.5% of the respondents were between the age of 50-59 years and only 2.2%
respondents were between 60-69 years old. Moreover, younger people tend to spend
less on traveling and prefer to spend less on leisure activities. As age increases people
tend to spend more on leisure trips.
Income
Income is a significant factor in relationship with Scenario 2 (r = .217, P = .000).
Table 1 states that 17% of respondents were in the income bracket of $0-$19,999,
13.7% were in the $30,000-$39,999 group. A slim minority (16.8%) had an income of
over $100,000, and the rest of the income brackets held between 2.7% and 10.5%. One
can state that income fell into two extreme levels, one from $0-$19,999 and one above
$100,000.
77

Level of Education
Education is a significant factor in relationship with Scenario 2 (r = .149, P =
.002). Table 1 states that 31% of respondents have a 4-year college degree, 28.6%
have some type of college education, and 20.1% have a graduate degree. In
conclusion, one can suggest that a higher education level than “Some College” plays an
imperative role in the excitement or anger level in the customer on Scenario 2.
Frequency of Business Travelers
Frequency of yearly travel for business is a significant factor in relationship with
Scenario 2 (r = .111, P = .013). Table 5 states that 53.6% of respondents traveled 0-2
times for business, 16.9% traveled 3-5 times, and 29.5% traveled more than five times
in the past 12 months. Thus, one may conclude that people traveling fewer than five
times in a year are highly sensitive to Scenario 2 when the price of the hotel room is
lower than the last time the traveler stayed in the same room.
Table 42 provides a summary of significant and non-significant variables related
to inconsistency in pricing across individuals (Scenario 3 and 4) and other variables.
78

Table 42
Significant and Non-Significant Variables for Research Question 3: Relationship
Between Respondent Perception of Inconsistency in Pricing Across Individuals and
Other Variables – Scenario 3
Name Crosstabs Significant
ANOVA Significant
CorrelationSignificant
Gender No No N/A Age N/A N/A No Income N/A N/A No Education N/A N/A No Ethnicity Yes No N/A HFGP enrolled Yes No N/A HFGP redeemed No No N/A FFP enrolled No No N/A FFP redeemed No No N/A Customer perceptions of capitalism as a basis for market-based pricing
Yes
No
N/A
Customer perceptions of seasonal price Adjustments
No
No
N/A
Customer perceptions of pricing based on marketing channel
Yes
Yes
N/A
Revenue management information provided N/A N/A No Revenue management information not provided N/A N/A Yes Frequency of business travelers N/A N/A No Frequency of leisure travelers N/A N/A No Business-fixed price N/A N/A No Leisure-fixed price N/A N/A No Business-negotiated price N/A N/A No Leisure-negotiated price N/A N/A No
79

Table 43
Research Question 3: Cross-tabulation Analysis for Relationship Between Scenario 3
and Ethnicity
Ethnicity Excited (%)
Not too Much
Excited (%)
Little Excited
(%)
Doesn’t Bother Me (%)
Little Angry (%)
Not too Much
Angry (%)
Angry (%) Total (%)
African-American
3.3 4.9 8.2 19.7 13.1 24.6 26.2 100%
Hispanic-American
.0 3.7 1.9 24.1 11.1 31.5 27.8 100%
White-American
1.0 3.4 4.8 22.1 25.2 30.0 13.4 100%
Asian-American
10.5 .0 5.3 10.5 26.3 31.6 15.8 100%
Native –American
.0 .0 20.0 20.0 40.0 .0 20.0 100%
Total 1.6 3.5 5.1 21.4 21.9 29.1 17.2 100% Chi-Square = 48.950. P = .043
There is a significant relationship between Scenario 3 and ethnicity
(Chi-Square = 48.950, P = .043). Further, an overwhelming majority of respondents are
in the anger category (68.2%), while a small fraction of respondents are in the
excitement category (10.2%). Table 1 states that 4.5% of respondents were Asian-
American, 12.7% of the respondents were Hispanic-American, 13.8% of the
respondents were African- American, 67.6% were White-American, and 1.4% were
Native-American. When respondents were asked about their perception regarding
Scenario 3, 73.7% Asian-American respondents were in the anger category, 15.8%
were in the excitement category, and 10.5% were in the “Doesn’t Bother Me” category.
Of Hispanic-Americans who were asked about Scenario 3, 70.1% were in the
anger category, 5.6% were in the excitement category, and 24.1% were in the “Doesn’t
Bother Me” category. There were 63.9% African-Americans in the anger category,
16.4% were in the excitement category, and 19.7% in “Doesn’t Bother Me” category.
80
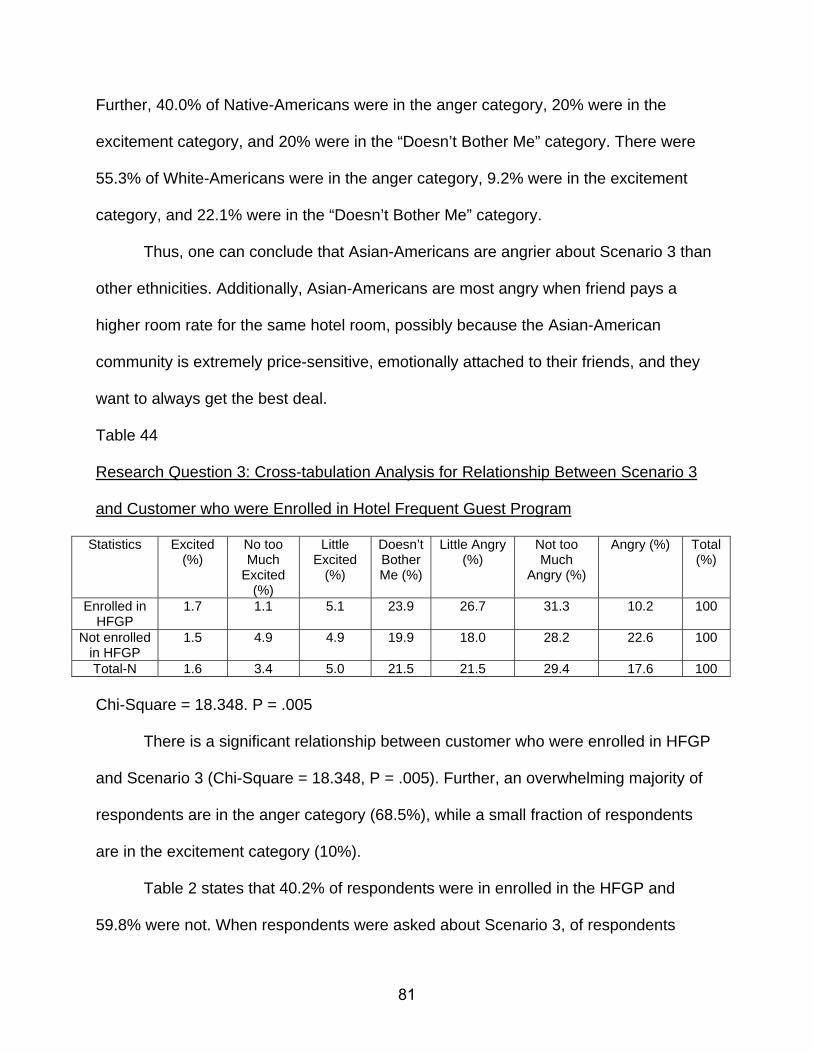
Further, 40.0% of Native-Americans were in the anger category, 20% were in the
excitement category, and 20% were in the “Doesn’t Bother Me” category. There were
55.3% of White-Americans were in the anger category, 9.2% were in the excitement
category, and 22.1% were in the “Doesn’t Bother Me” category.
Thus, one can conclude that Asian-Americans are angrier about Scenario 3 than
other ethnicities. Additionally, Asian-Americans are most angry when friend pays a
higher room rate for the same hotel room, possibly because the Asian-American
community is extremely price-sensitive, emotionally attached to their friends, and they
want to always get the best deal.
Table 44
Research Question 3: Cross-tabulation Analysis for Relationship Between Scenario 3
and Customer who were Enrolled in Hotel Frequent Guest Program
Statistics Excited (%)
No too Much
Excited (%)
Little Excited
(%)
Doesn’t Bother Me (%)
Little Angry (%)
Not too Much
Angry (%)
Angry (%) Total(%)
Enrolled in HFGP
1.7 1.1 5.1 23.9 26.7 31.3 10.2 100
Not enrolled in HFGP
1.5 4.9 4.9 19.9 18.0 28.2 22.6 100
Total-N 1.6 3.4 5.0 21.5 21.5 29.4 17.6 100 Chi-Square = 18.348. P = .005
There is a significant relationship between customer who were enrolled in HFGP
and Scenario 3 (Chi-Square = 18.348, P = .005). Further, an overwhelming majority of
respondents are in the anger category (68.5%), while a small fraction of respondents
are in the excitement category (10%).
Table 2 states that 40.2% of respondents were in enrolled in the HFGP and
59.8% were not. When respondents were asked about Scenario 3, of respondents
81

enrolled, 68.2% were in the anger category, 7.9% of the respondents were in the
excitement category, and 23.9% were in the “Doesn’t Bother Me” category. Of
respondents not enrolled 68.8% were in the anger category on Scenario 3, 11.3% were
in the excitement category, and 19.9% were in the “Doesn’t Bother Me” category.
Hence, one can state that when the customer’s friend pays a higher price, the customer
enrolled in the HFGP is angrier than the customer not enrolled.
Table 45
Research Question 3: Cross-tabulation Analysis for Relationship Between Scenario 3
and Ethical Issue Relating to Customer Perceptions of Capitalism as a Basis for Market-
based Pricing
Statistics Excited (%)
No too Much
Excited (%)
Little Excited
(%)
Doesn’t Bother
Me (%)
Little Angry (%)
Not too Much
Angry (%)
Angry (%) Total (%)
Ethical 1.0 3.8 4.6 23.2 21.9 29.3 16.1 100 Not-Ethical 6.0 .0 8.0 8.0 18.0 30.0 30.0 100
Total-N 1.6 3.4 5.0 21.5 21.5 29.4 17.6 100 Chi-Square = 19.868. P = .003
There is a significant relationship between ethical issue relating to customer
perceptions of capitalism based on market pricing and Scenario 3 (Chi-Square =
19.868, P = .003). Further, an overwhelming majority of respondents are in the anger
category (68.5%), while a small fraction of respondents are in the excitement category
(10.1%).
Table 4 explains that 88.6% of respondents agreed that it’s ethical issue when
the U.S. is a capitalist economy and hotels are entitled to change their prices for the
rooms to maximize revenue. However, 11.4% disagreed. When respondents were
asked about Scenario 3, of respondents who disagreed that it is an ethical issue, 78%
82
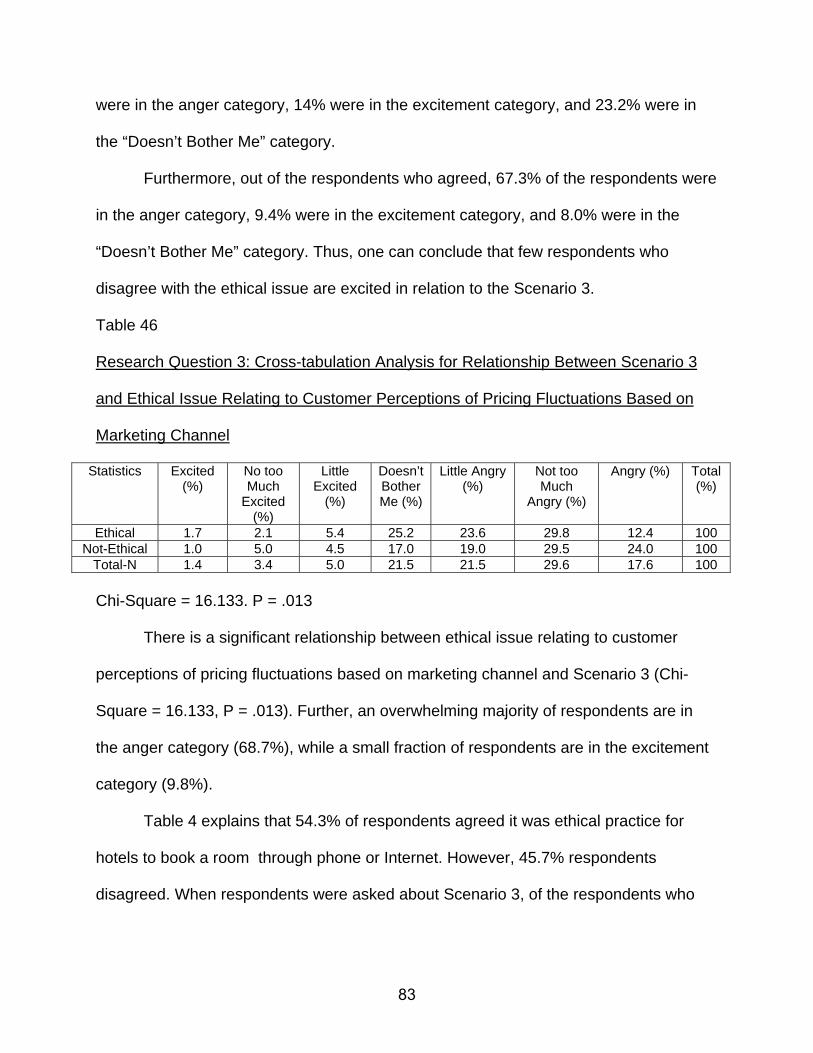
were in the anger category, 14% were in the excitement category, and 23.2% were in
the “Doesn’t Bother Me” category.
Furthermore, out of the respondents who agreed, 67.3% of the respondents were
in the anger category, 9.4% were in the excitement category, and 8.0% were in the
“Doesn’t Bother Me” category. Thus, one can conclude that few respondents who
disagree with the ethical issue are excited in relation to the Scenario 3.
Table 46
Research Question 3: Cross-tabulation Analysis for Relationship Between Scenario 3
and Ethical Issue Relating to Customer Perceptions of Pricing Fluctuations Based on
Marketing Channel
Statistics Excited (%)
No too Much
Excited (%)
Little Excited
(%)
Doesn’t Bother Me (%)
Little Angry (%)
Not too Much
Angry (%)
Angry (%) Total (%)
Ethical 1.7 2.1 5.4 25.2 23.6 29.8 12.4 100 Not-Ethical 1.0 5.0 4.5 17.0 19.0 29.5 24.0 100
Total-N 1.4 3.4 5.0 21.5 21.5 29.6 17.6 100 Chi-Square = 16.133. P = .013
There is a significant relationship between ethical issue relating to customer
perceptions of pricing fluctuations based on marketing channel and Scenario 3 (Chi-
Square = 16.133, P = .013). Further, an overwhelming majority of respondents are in
the anger category (68.7%), while a small fraction of respondents are in the excitement
category (9.8%).
Table 4 explains that 54.3% of respondents agreed it was ethical practice for
hotels to book a room through phone or Internet. However, 45.7% respondents
disagreed. When respondents were asked about Scenario 3, of the respondents who
83
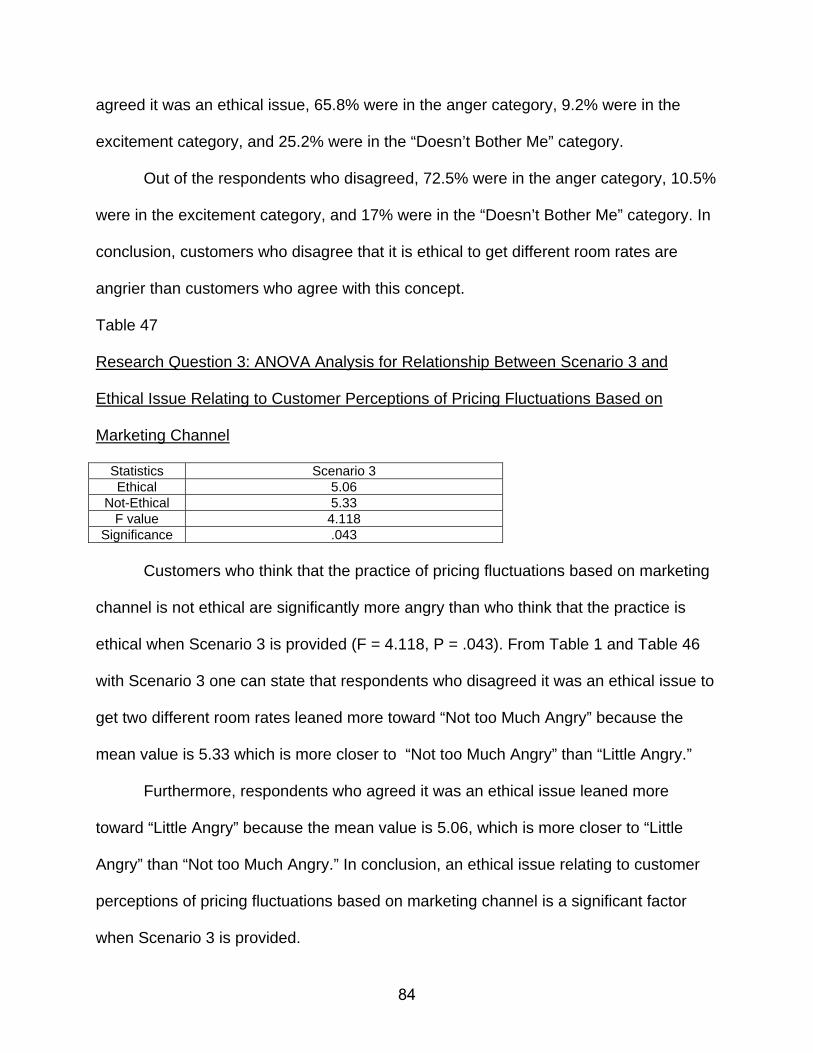
agreed it was an ethical issue, 65.8% were in the anger category, 9.2% were in the
excitement category, and 25.2% were in the “Doesn’t Bother Me” category.
Out of the respondents who disagreed, 72.5% were in the anger category, 10.5%
were in the excitement category, and 17% were in the “Doesn’t Bother Me” category. In
conclusion, customers who disagree that it is ethical to get different room rates are
angrier than customers who agree with this concept.
Table 47
Research Question 3: ANOVA Analysis for Relationship Between Scenario 3 and
Ethical Issue Relating to Customer Perceptions of Pricing Fluctuations Based on
Marketing Channel
Statistics Scenario 3 Ethical 5.06
Not-Ethical 5.33 F value 4.118
Significance .043
Customers who think that the practice of pricing fluctuations based on marketing
channel is not ethical are significantly more angry than who think that the practice is
ethical when Scenario 3 is provided (F = 4.118, P = .043). From Table 1 and Table 46
with Scenario 3 one can state that respondents who disagreed it was an ethical issue to
get two different room rates leaned more toward “Not too Much Angry” because the
mean value is 5.33 which is more closer to “Not too Much Angry” than “Little Angry.”
Furthermore, respondents who agreed it was an ethical issue leaned more
toward “Little Angry” because the mean value is 5.06, which is more closer to “Little
Angry” than “Not too Much Angry.” In conclusion, an ethical issue relating to customer
perceptions of pricing fluctuations based on marketing channel is a significant factor
when Scenario 3 is provided.
84

Table 48
Research Question 3: Pearson’s correlation Analysis for Relationship Between Scenario
3 and Hotel Revenue Management Information not Provided
Statistics Hotel Revenue Management Information not Provided
r .192 Significance .000
* correlation is significant at the.05 level (2 tailed)
Hotel Revenue Management Information not Provided
Revenue management information not provided to the customers at the time of
booking is a significant factor in the relationship to Scenario 3 (r = .192, P = .000). When
the hotel receptionist does not provide information to the customers and the customer
discovers that his/her friend has paid a higher room rate than him/her, the customer will
be dissatisfied and angry with hotel management. In conclusion, revenue management
information provided to the customer is imperative and plays an important role in
customer satisfaction and dissatisfaction level while booking a room. Providing a list of
the prices while the customer reserves a hotel room is very essential, as it can satisfy
customers and in turn increase the profits as Kemis suggested (2002).
Table 49 provides a summary of significant and non-significant variables related
to inconsistency in pricing across individuals (Scenario 3 and 4) and other variables.
85

Table 49
Significant and Non-Significant Variables for Research Question 3: Relationship
Between Respondent Perception of Inconsistency in Pricing Across Individuals and
Other Variables – Scenario 4
Name Crosstabs Significant
ANOVA Significant
CorrelationSignificant
Gender No Yes N/A Age N/A N/A Yes Income N/A N/A No Education N/A N/A No Ethnicity Yes No N/A HFGP enrolled No No N/A HFGP redeemed No No N/A FFP enrolled Yes Yes N/A FFP redeemed No No N/A Customer perceptions of capitalism as a basis for market-based pricing
No
No
N/A
Customer perceptions of seasonal price Adjustments
No
No
N/A
Customer perceptions of pricing based on marketing channel
No
No
N/A
Revenue management information provided N/A N/A No Revenue management information not provided N/A N/A Yes Frequency of business travelers N/A N/A No Frequency of leisure travelers N/A N/A No Business-fixed price N/A N/A No Leisure-fixed price N/A N/A Yes Business-negotiated price N/A N/A Yes Leisure-negotiated price N/A N/A Yes
86
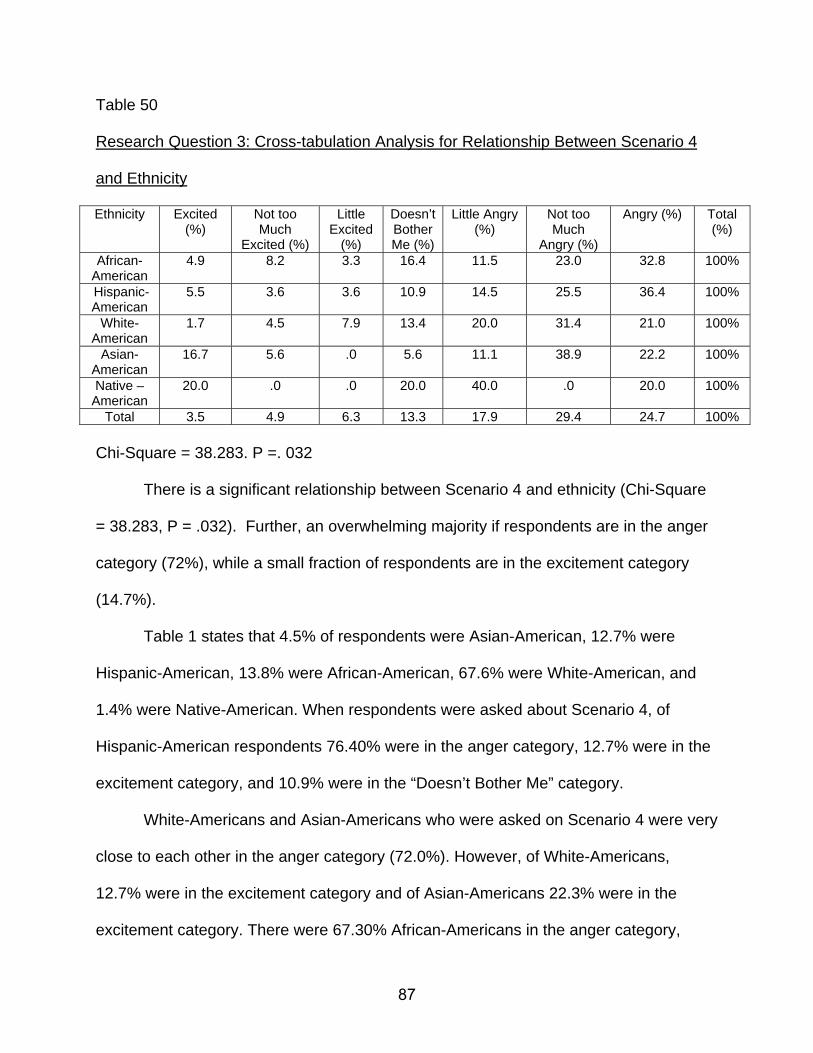
Table 50
Research Question 3: Cross-tabulation Analysis for Relationship Between Scenario 4
and Ethnicity
Ethnicity Excited (%)
Not too Much
Excited (%)
Little Excited
(%)
Doesn’t Bother Me (%)
Little Angry (%)
Not too Much
Angry (%)
Angry (%) Total (%)
African-American
4.9 8.2 3.3 16.4 11.5 23.0 32.8 100%
Hispanic-American
5.5 3.6 3.6 10.9 14.5 25.5 36.4 100%
White-American
1.7 4.5 7.9 13.4 20.0 31.4 21.0 100%
Asian-American
16.7 5.6 .0 5.6 11.1 38.9 22.2 100%
Native –American
20.0 .0 .0 20.0 40.0 .0 20.0 100%
Total 3.5 4.9 6.3 13.3 17.9 29.4 24.7 100% Chi-Square = 38.283. P =. 032
There is a significant relationship between Scenario 4 and ethnicity (Chi-Square
= 38.283, P = .032). Further, an overwhelming majority if respondents are in the anger
category (72%), while a small fraction of respondents are in the excitement category
(14.7%).
Table 1 states that 4.5% of respondents were Asian-American, 12.7% were
Hispanic-American, 13.8% were African-American, 67.6% were White-American, and
1.4% were Native-American. When respondents were asked about Scenario 4, of
Hispanic-American respondents 76.40% were in the anger category, 12.7% were in the
excitement category, and 10.9% were in the “Doesn’t Bother Me” category.
White-Americans and Asian-Americans who were asked on Scenario 4 were very
close to each other in the anger category (72.0%). However, of White-Americans,
12.7% were in the excitement category and of Asian-Americans 22.3% were in the
excitement category. There were 67.30% African-Americans in the anger category,
87

16.4% were in the excitement category, and 16.4% were in the “Doesn’t Bother Me”
category. Additionally, 40.0% of Native-Americans were in the anger category, 20%
were in the excitement category, and 20% were in the “Doesn’t Bother Me” category.
Thus, one may conclude that Hispanic-Americans are angrier at Scenario 4 when
compared to other ethnicities because this group is price-sensitive and wants to get the
best deal whenever possible. Additionally, one can state that Asian-Americans and
White-Americans get upset or angry almost equally at Scenario 4. However, Asian-
Americans get more excited than White-Americans when Scenario 4 is provided to
them. African-Americans and Native-Americans are least excited or angry when the
respondent has to pay a higher price than his/her friend.
Table 51
Research Question 3: Cross-tabulation Analysis for Relationship Between Scenario 4
and Customer who were Enrolled in Airline Frequent Flier Program
Statistics Excited (%)
No too Much
Excited (%)
Little Excited
(%)
Doesn’t Bother Me (%)
Little Angry (%)
Not too Much
Angry (%)
Angry (%) Total (%)
Enrolled in Airline FFP
2.4 2.0 4.7 14.6 21.7 31.2 23.3 100
Not enroll in Airline FFP
4.8 8.1 7.5 14.0 12.4 26.9 26.3 100
Total-N 3.4 4.6 5.9 14.4 17.8 29.4 24.6 100 Chi-Square = 18.452. P = .005
There is a significant relationship between customer enrolled in Airline FFP and
Scenario 4 (Chi-Square = 18.452, P = .005). Further, an overwhelming majority of
respondents are in the anger category (71.8%), while a small fraction of respondents
are in the excitement category (13.9%).
88

Table 3 states that 57.9% of respondents were enrolled in the Airline FFP and
42.1% were not. When respondents were asked about Scenario 4 and FFP miles
enrollment, of respondents enrolled, 9.1% were in the excitement category, 76.20%
respondents were in the anger category, and 14.6% said it did not bother them.
Of respondents not enrolled their perception of Scenario 4 was that 20.4%
respondents were in the excitement category, 65.60% were in the anger category, and
14% remained neutral. Customers enrolled have knowledge about the concept of
revenue management system and can relate the services and concept of FFP to HFGP.
In conclusion, customers enrolled in Airline FFP will expect the same concept to apply
to the HFGP. The customer enrolled in FFP who pays a higher price for a room than
his/her friend is angrier than the customer who is not enrolled. The customer who is not
enrolled lacks the knowledge of the revenue management system and cannot relate the
same concept to the HFGP. Thus, is less angry than the customer who is enrolled.
Table 52
Research Question 3: ANOVA Analysis for Relationship Between Scenario 4 and
Gender
Statistics Scenario 4 Male 5.05
Female 5.43 F value 6.049
Significance .014
Females are significantly angrier than males when Scenario 4 is provided
(F = 6.049, P = .014). Table 1 state explains that 51.1% of respondents were male and
48.9% were females. Male respondents who paid a higher room rate for a room than
their friend (Scenario 4) are inclined more toward “Little Angry” because the mean value
89

is 5.05, which is close to “Little Angry.” Female respondents who paid a higher room
rate than their friend (Scenario 4) leaned toward “Not too Much Angry” because the
mean value is 5.43. Thus, one can conclude that gender is a significant factor when
Scenario 4 is provided.
Table 53
Research Question 3: ANOVA Analysis for Relationship Between Scenario 4 and
Customer who were Enrolled in Airline Frequent Flier Program
Statistics Scenario 4 Enrolled in Airline FFP 5.07
Not enrolled in Airline FFP 5.38 F value 6.049
Significance .014
Customers who were enrolled in the Airline FFP are significantly less angry than
customer who are not enrolled when Scenario 4 is provided (F = 6.049, P = .014). Table
3 and Table 51 state that respondents who paid a higher price for a room rate than a
friend (Scenario 4) and who are enrolled in the Airline FFP leaned more toward “Little
Angry” because the mean value is 5.07, which is close to “Little Angry.” Respondents
who paid a higher price but were not enrolled leaned more toward “Not too Much Angry”
because the mean value is 5.38. In conclusion, customer who was enrolled in the Airline
FFP is a significant factor when Scenario 4 is provided.
90
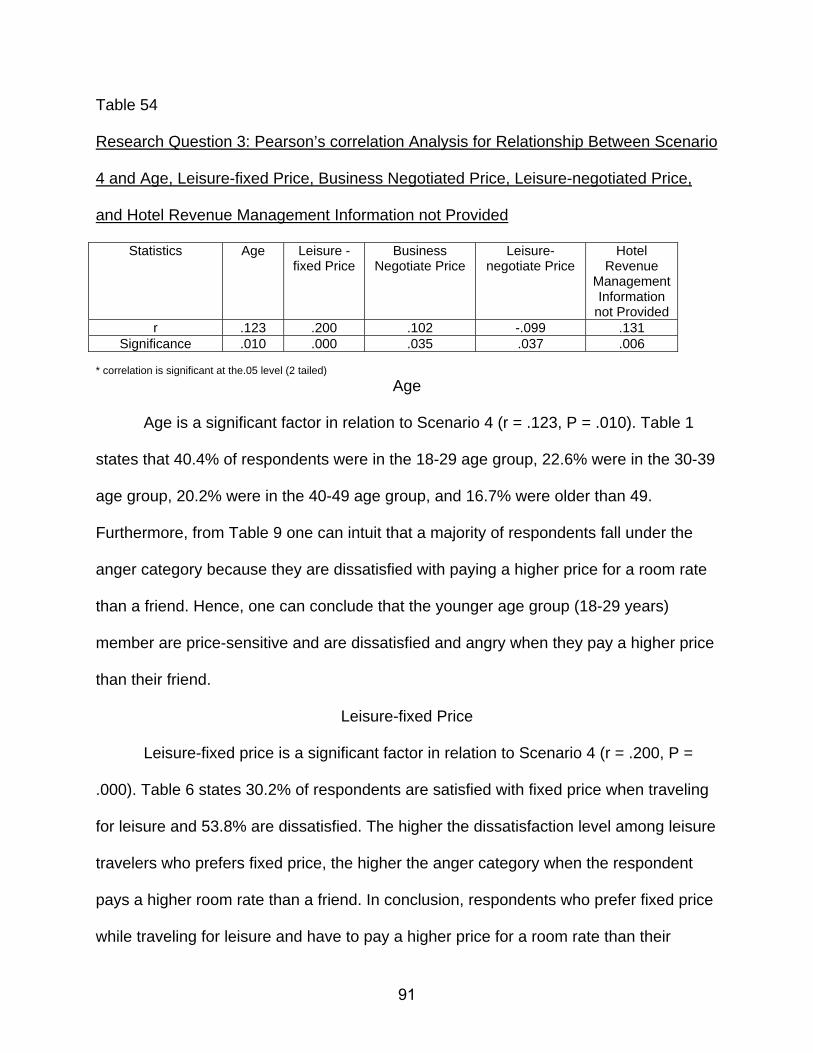
Table 54
Research Question 3: Pearson’s correlation Analysis for Relationship Between Scenario
4 and Age, Leisure-fixed Price, Business Negotiated Price, Leisure-negotiated Price,
and Hotel Revenue Management Information not Provided
Statistics Age Leisure -fixed Price
Business Negotiate Price
Leisure- negotiate Price
Hotel Revenue
Management Information
not Provided r .123 .200 .102 -.099 .131
Significance .010 .000 .035 .037 .006 * correlation is significant at the.05 level (2 tailed)
Age
Age is a significant factor in relation to Scenario 4 (r = .123, P = .010). Table 1
states that 40.4% of respondents were in the 18-29 age group, 22.6% were in the 30-39
age group, 20.2% were in the 40-49 age group, and 16.7% were older than 49.
Furthermore, from Table 9 one can intuit that a majority of respondents fall under the
anger category because they are dissatisfied with paying a higher price for a room rate
than a friend. Hence, one can conclude that the younger age group (18-29 years)
member are price-sensitive and are dissatisfied and angry when they pay a higher price
than their friend.
Leisure-fixed Price
Leisure-fixed price is a significant factor in relation to Scenario 4 (r = .200, P =
.000). Table 6 states 30.2% of respondents are satisfied with fixed price when traveling
for leisure and 53.8% are dissatisfied. The higher the dissatisfaction level among leisure
travelers who prefers fixed price, the higher the anger category when the respondent
pays a higher room rate than a friend. In conclusion, respondents who prefer fixed price
while traveling for leisure and have to pay a higher price for a room rate than their
91
friend fall in the anger category because they are price-sensitive customers and are
ready to sacrifice other types of luxuries if provided a cheaper price. However, a fixed
price charged by hotel to the leisure customers results in more dissatisfaction than
satisfaction among customers, and if leisure travelers’ fixed price is higher than his/her
friend’s, the travelers will be angry.
Business Negotiated Price
Business negotiated price is a significant factor in relation to Scenario 4 (r = .102,
P = .035). Table 6 explains 44.7% of respondents are satisfied with a negotiated price
when traveling for business and 27.5% are dissatisfied or neutral. Table 9 explains that
61.4% of respondents are in the anger category and 14.2% are in the excitement
category. Thus, one can conclude that the satisfaction level among business travelers
who prefer a negotiated price is high. However, given Scenario 4, the business traveler
is in the anger category because the traveler who prefers a negotiated price has put in a
lot of effort to negotiate the best price. His/her friend getting a lower price upsets the
business traveler.
Leisure-Negotiated Price
Leisure-negotiated price is a significant factor in relation to Scenario 4 (r = -.099,
P = .037). Table 6 states 67.8% of respondents are satisfied with negotiated price when
traveling for leisure and 16.4% are dissatisfied. The higher the satisfaction level among
leisure travelers who prefer negotiated price, the higher is the anger category when the
respondent pays a higher room rate than his/her friend. In conclusion, respondents who
prefer a negotiated price while traveling for leisure and have to pay a higher price for a
room rate than his/her friend fall in the anger category because leisure travelers are
92

price-sensitive customers and are ready to sacrifice other types of luxuries if provided a
cheaper price. A price negotiated by leisure travelers leads to satisfaction, whereas if
leisure travelers’ negotiated price is higher than his/her friend’s price for a hotel room,
the travelers will be angry and dissatisfied.
Hotel Revenue Management Information not Provided
Revenue management information not provided is a significant factor in relation
to Scenario 4 (r= .131, P = .006). Table 8 explains that 13.8% of respondents are
satisfied and 51.8% are dissatisfied when revenue management information is not
provided at the time of booking.
The higher the dissatisfaction level when HRM information is not provided, the
higher the anger category when the respondent pays a higher room rate than his/her
friend. Therefore, respondents who have not been provided revenue management
information and have paid a higher price for a hotel room rate than his/her friend are
dissatisfied and angry because the hotel receptionist did not brief the customer about
different pricing strategies and competitor’s prices at the time of booking. The lack of
knowledge about pricing strategies among customers can affect the revenue
management system and in turn lead to dissatisfaction among customers.
Table 55 provides a summary of significant and non-significant variables related
to upgrades for HFGP enrollees (Scenario 5) and other variables.
93

Table 55
Significant and Non-Significant Variables for Research Question 3: Relationship
Between Respondent Perceptions Related to Room Upgrades for Hotel Frequent Guest
Program Enrollees and Other Variables – Scenario 5
Name Crosstabs Significant
ANOVA Significant
CorrelationSignificant
Gender No No N/A Age N/A N/A No Income N/A N/A No Education N/A N/A No Ethnicity No No N/A HFGP enrolled No No N/A HFGP redeemed No No N/A FFP enrolled No No N/A FFP redeemed No No N/A Customer perceptions of capitalism as a basis for market-based pricing
No
Yes
N/A
Customer perceptions of seasonal price Adjustments
Yes
No
N/A
Customer perceptions of pricing based on marketing channel
No
No
N/A
Revenue management information provided N/A N/A No Revenue management information not provided N/A N/A No Frequency of business travelers N/A N/A No Frequency of leisure travelers N/A N/A Yes Business-fixed price N/A N/A No Leisure-fixed price N/A N/A No Business-negotiated price N/A N/A Yes Leisure-negotiated price N/A N/A No
94
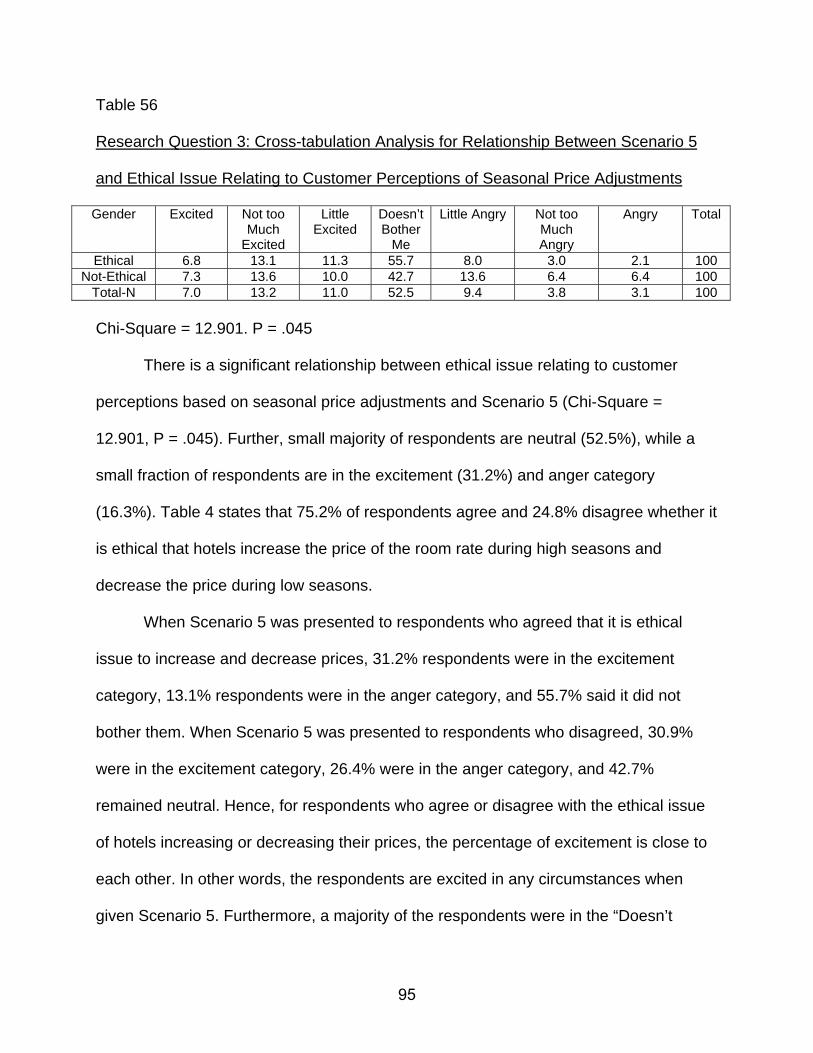
Table 56
Research Question 3: Cross-tabulation Analysis for Relationship Between Scenario 5
and Ethical Issue Relating to Customer Perceptions of Seasonal Price Adjustments
Gender Excited Not too Much
Excited
Little Excited
Doesn’t Bother
Me
Little Angry Not too Much Angry
Angry Total
Ethical 6.8 13.1 11.3 55.7 8.0 3.0 2.1 100 Not-Ethical 7.3 13.6 10.0 42.7 13.6 6.4 6.4 100
Total-N 7.0 13.2 11.0 52.5 9.4 3.8 3.1 100 Chi-Square = 12.901. P = .045
There is a significant relationship between ethical issue relating to customer
perceptions based on seasonal price adjustments and Scenario 5 (Chi-Square =
12.901, P = .045). Further, small majority of respondents are neutral (52.5%), while a
small fraction of respondents are in the excitement (31.2%) and anger category
(16.3%). Table 4 states that 75.2% of respondents agree and 24.8% disagree whether it
is ethical that hotels increase the price of the room rate during high seasons and
decrease the price during low seasons.
When Scenario 5 was presented to respondents who agreed that it is ethical
issue to increase and decrease prices, 31.2% respondents were in the excitement
category, 13.1% respondents were in the anger category, and 55.7% said it did not
bother them. When Scenario 5 was presented to respondents who disagreed, 30.9%
were in the excitement category, 26.4% were in the anger category, and 42.7%
remained neutral. Hence, for respondents who agree or disagree with the ethical issue
of hotels increasing or decreasing their prices, the percentage of excitement is close to
each other. In other words, the respondents are excited in any circumstances when
given Scenario 5. Furthermore, a majority of the respondents were in the “Doesn’t
95

Bother Me” category and few respondents who disagreed or agreed were in the anger
category. In conclusion, the majority of respondents are not affected by Scenario 5.
Table 57
Research Question 3: ANOVA Analysis for Relationship Between Scenario 5 and
Ethical Issue Relating to Customer Perceptions of Capitalism as a Basis for Market-
based Pricing
Statistics Scenario 5 Ethical 3.74
Not-Ethical 3.25 F value 6.271
Significance .013
Customers who think that capitalism based on market based pricing is an ethical
issue, those customers are significantly angry than who think that the practice is not
ethical when Scenario 5 is provided (F = 6.271, P = .013). Table 4 explains that 88.6%
of respondents agreed and 11.4% of the respondents disagreed on ethical issue
relating to the U.S. as a capitalist economy and that hotel are entitled to increase prices
to maximize revenues. Respondents who agreed leaned toward “Doesn’t Bother Me”
category when given Scenario 5 because the mean value is 3.74, which is close to
“Doesn’t Bother Me” category.
Furthermore, respondents who disagreed leaned more toward “Little Excited” on
Scenario 5 because the mean value is 3.25, which is close to “Little Excited” category.
Thus, one can conclude that ethical issue of customer perceptions of capitalism based
on market pricing is a significant factor when Scenario 5 is provided.
96

Table 58
Research Question 3: Pearson’s correlation Analysis for Relationship Between Scenario
5 and Frequency of Leisure Travelers and Business Negotiated Price
Statistics Frequency of Leisure Travelers
Business Negotiate Price
R -.110 .103 Significance .021 .033
* correlation is significant at the.05 level (2 tailed)
Frequency of Leisure Travelers
Frequency of travel for leisure is a significant factor in relation to Scenario 5 (r = -
.110, P = .028). Table 5 states that 32.0% of respondents travel 0-2 times a year, 40.2%
travel 3-5 times a year, 14.6% of the respondents travel 6-8 times a year for leisure, and
13.2% travel more than 9 times a year. Table 9 explains that 31.2% of respondents
were in the excitement category and 16.5% in the anger category. Hence, one can
conclude that the fewer times the respondents travel for leisure the more excited they
will get when a friend has been upgraded to a hotel suite from a standard double
bedroom because he/she had a HFGP card.
Business Negotiated Price
Business negotiated price is a significant factor in relation to Scenario 5 (r = .103,
P = .033). Table 6 explains 44.7% are satisfied with a negotiated price when traveling
for business and 27.5% dissatisfied or neutral. Table 9 explains that 31.2% are in the
excitement category and 16.5% in the anger category. The higher the satisfaction level
when business traveler negotiates price with the hotel receptionist higher the excitement
level when the business traveler’s friend has been upgraded to a suite from a standard
double bedroom because he/she had a HFGP card.
97

Summary of Findings and Issues Related
From analyses of Tables 1 to 58 one can mention that:
1. Hotels should provide to its customers hotel revenue management information.
a) Females are sensitive, want more information, and expect more.
b) Younger age group (18-29 years) doesn’t know much about pricing
strategies.
2. Customer will generally be dissatisfied when paying a higher price for a room
rate than last time and satisfied if paying a lower price.
a) Any degree higher than an Associates degrees helps in the decision
making when Scenario 1 and 2 are provided.
b) Customers enrolled in Airline FFP and who redeem miles have direct
impact on satisfaction level when Scenario 1 and 2 are provided
c) Customers whose perception was that obtaining varying price quotes from
a hotel through different marketing channels is an unethical practice is
particularly important when Scenario 1 and 2 are provided.
3. Customers are dissatisfied if a friend pays a higher or a lower price, as given in
Scenario 4 and 5.
a) Hispanic-Americans and Asian-Americans are highly sensitive to Scenario
4 and 5.
4. When a friend is upgraded to a suite, customers are mostly unbothered.
98

From the above summary findings and issues related, we can infer that this raises
the question whether gender and ethnicity issues are overshadowed by bigger issues of
travel “sophistication” versus infrequent travelers. Perhaps, frequent travelers are
already conversant with variable pricing issues and hence are not emotionally
responsive. To answer these issues, additional analyses were conducted. Cross-
tabulation analyses were conducted and can be referred to Table 59 and 60.
Table 59
Summary Findings and Issues Related: Cross-tabulation Analysis for Gender and
Frequent Business Traveler
Gender Not a Frequent Business Traveler (%)
Frequent Business Traveler (%)
Total (%)
Male (%) 43.5 56.5 100 Female (%) 64.2 35.8 100
Total-N 53.6 46.4 100 Chi-Square = 19.335. P = .000
Table 60
Summary Findings and Issues Related: Cross-tabulation Analysis for Ethnicity and
Frequent Business Traveler
Gender Not a Frequent Business Traveler (%)
Frequent Business
Traveler (%)
Total (%)
African-American (%)
68.9 31.1 100
Hispanic-American (%)
64.2 35.8 100
White-American (%)
49.3 50.7 100
Asian-American (%)
40.0 60.0 100
Native-American (%)
60.0 40.0 100
Total-N 53.6 46.4 100 Chi-Square = 11.822. P = .019
99

From the Table 59 and 60 we can infer that there is a significant difference in the
gender and ethnic profile of frequent business travelers. Among women one third of
respondents are frequent business travelers. On the other hand, more than fifty percent
are males who travel frequently for business. As reported, it would appear that sample
is skewed in favor of male respondents, however, women are under represented among
business travelers.
Among Hispanic-American and African-American respondents one third of the
respondents are frequent business travelers. On the other hand, among White-
American almost half respondents are frequent business travelers. As noted, it would
appear that sample is skewed in favor of White-American, but that woman racial
minorities are under represented among frequent business travelers. This important
issue of potential, which the data set has, should be noted.
100

CHAPTER V
SUMMARY, IMPLICATIONS AND RECOMMENDATIONS
Summary of Findings
In Chapter IV, the data analysis provided some exploratory insights into
consumer perceptions of fairness relative to standard practices in HRM. Specifically,
this study explored factors that may positively influence both hotel revenue and
customer satisfaction. Since customers with a propensity for using hotel services were
the focal population of interest, participants were recruited using an intercept sample
design at a major airport in the Southwest. The sample design yielded data from 460 air
travelers at Dallas Love Field Airport. The data were analyzed using descriptive
statistics (e.g., cross-tabulations, frequencies, and correlations). Some were further
analyzed using ANOVA. In this chapter, I will discuss managerial implications derived
from this exploratory study, and limitations inherent within the research design.
Finally, opportunities for extending this exploratory study to future streams of
research, i.e. utilizing managerial mechanisms for enhancing revenue and customer
satisfaction outcomes in the hospitality industry are offered. This study was conducted
to determine the relationship between the following: customer perceptions of fairness
about HRM, satisfaction level when provided five different scenarios and demographics,
HFGP enrolled and redeemed points, Airline FFP enrolled and redeemed, three
different ethical issues, frequency of business and leisure travelers, and four
101
preferences of booking a hotel room. Specifically, the researcher evaluated the impact
of the HRM system on customer satisfaction.
The sample for the survey was taken from travelers at Dallas Love Field; 446
were usable. The findings and analysis of the data sought to answer the research
questions from Chapter I. Due to the large number of tables generated, only those
tables which had a significant relationship were explained in this study. The non-
significant tables were not analyzed. Furthermore, as explained in the literature review,
the study only took into consideration distributive justice, one of three methods used to
measure how customers evaluate fairness. There has been no direct research
pertaining to the provision of research questions in Chapter I. Given the lack of previous
studies, the author has contributed to the literature by strategizing different topics on
revenue management, customer’s evaluation of fairness, and customer satisfaction.
Research Question 1
For research question one, it was determined that the frequency in Table 7
explains that when revenue management information was provided to customers, the
majority were satisfied with the hotel stay. From relationship of HRM information when
provided to customers and other attributes in the research question one, one can infer
that there was a significant relationship with gender, age, customer perceptions of
pricing fluctuations based on marketing channel, and leisure traveler preference to
negotiate price when booking a hotel room.
A study of revenue management by Hank, Cross, and Noland (1992) stated that
the relationship of revenue management and customers booking a hotel room is vital as
customers always think they want the lowest possible price when staying in the hotel
102

room. Additionally, having two or more different room rates could dissatisfy the
customer, especially if the leisure traveler, who is price- sensitive and wants to receive
the best possible price.
Distributive justice in hotel revenue management plays a vital role as it considers
overall customer’s satisfaction and dissatisfaction level (Sparks and McColl-Kenndy,
2001). There has not been any prior study relating to revenue management information
provided to customers and gender and age of the customers. Furthermore, Belobaba
(2001) stated that the concept of revenue management in the hotel industry needs
extensive improvement and in-depth research.
One can infer data from research question one that hotels can increase the
customer satisfaction level and simultaneously attract customers to their hotels if
revenue management information is provided during booking. Further, to increase
revenue, hotels should consider age and whether the individual supports the price
changes when booking rooms through different marketing channels. It is imperative for
the hotel to distinguish between business and leisure travelers as this differentiation
could increase customer satisfaction. Additionally, from this analysis, one can infer that
when HRM information is provided, hotels should capture the leisure traveler market to
increase satisfaction and repeat customers.
Research Question 2
Data from research question two, it was determined that frequency in Table 8
explains that when revenue management information was not provided to customers,
the majority were dissatisfied with the hotel stay. From relationship of HRM information
not provided to customers and other attributes in research question two, one can infer
103

that there was a significant relationship with gender, age, ethnicity, enrollment in HFGP,
and customer perceptions of capitalism as a basis for market-based pricing.
Furthermore, Oliver (1981) elucidated that consumer satisfaction is based on
expectations and emotions. If these are not met to a certain standards the consumer will
be dissatisfied. Bei and Chiao (2001) revealed that predicting consumer expectation is
arduous and time-consuming; an apt relationship is needed between the consumer and
the hotel operator. In the current study the author revealed that when not provided hotel
revenue management information the customers are dissatisfied and when provided it,
they are satisfied. According to Zeithaml’s (1988) customers are highly sensitive to
issues of inequity and unfair practices. Furthermore, when information about equity is
provided to customers before the reservation is made, they are happy and satisfied.
Therefore, one can state that providing hotel revenue management information to
customers increases their satisfaction level; failing to give information has the reverse
effect.
From research question two one can infer that to increase revenue and
satisfaction level among customers, hotels need to provide HRM information to its
customers. By not providing it, hotels are not satisfying the Asian-American
demographic in particular.
Further, hotels should keep a thorough watch on customers who are enrolled in
the HFGP because they could be dissatisfied easily, as they know how the hotel system
operates. By not providing HRM information, hotels are promoting dissatisfaction among
females and the younger age group (18-29 years). Moreover, hotels need to understand
customers who think that the U.S. is a capitalist economy, because such a belief is
104
interwoven with customer satisfaction. Thus, one can conclude that providing info is
imperative for the hotel industry, as not providing it leads to dissatisfaction among
customers, which in turn could decrease revenue.
Research Question 3
Scenario 1 and 2
Research question three related to inconsistency in pricing across multiple visits
(Scenario 1 and 2). Frequency in Table 9 explains that on Scenario 1 a majority of the
customers were in the anger category. The relationship between Scenario 1 and other
attributes in question three states that there was significant relationship with education,
the customer who was enrolled and who redeemed Airline FFP miles, customer
perceptions of capitalism as a basis for market-based pricing, customer perception of
seasonal price adjustments, customer perceptions of pricing fluctuations based on
marketing channel, revenue management information not provided to customers, and
leisure travelers preference of fixed price.
The frequency in Table 9 explains that on Scenario 2 the majority of the
customers were in the excitement category. The comparison between Scenario 2 and
other attributes in question three states that there was a significant relationship with
gender, age, income, education, ethnicity, customer who redeemed HFGP points,
customer who was enrolled and who redeemed Airline FFP miles, customer perceptions
of seasonal price adjustments, customer perceptions of pricing fluctuations based on
marketing channel, and frequency of business travelers.
Anderson, Fornell, and Lehmann (1994) highlighted price as an imperative factor
in consumer satisfaction because consumers usually think about price as the first factor
105

whenever a product or services are acquired. Furthermore, Zeithaml (1988) states that
lower perceived price links to lower perceived sacrifice of price and vice versa.
Furthermore, Bei and Chiao (2001) explains that hotel operators need to pay more
attention to customer’s perception of price fairness, as equity is compared directly with
customer’s satisfaction. It is imperative that in the minds of customers, they think that
they are paying the right price for the product. This will satisfy the customers, who
evaluate each product or services when they pay.
One can infer that the hotel industry needs to understand from inconsistency in
pricing across multiple visits (Scenario 1 and 2) that demographics of the customer play
a key role in customer satisfaction. The fact is that there is a difference between
customers who are enrolled, not enrolled and, who redeem or not redeem the Airline
FFP miles. Furthermore, the customer who redeems the HFGP has an impact on
customer satisfaction level and increasing revenue for the hotel. Segmenting the
customer into business and leisure travelers for the hotel industry is a must. Getting
information about frequency of travel for business travelers will help increase revenue
for the hotels. Lastly, hotels should take into consideration the three ethical issues
seriously as this could change the level of satisfaction among customers. Implementing
the provision of information at the time of booking a room will allow the industry to better
maximize revenue, increase satisfaction among customers, and ensure a higher
number of return customers.
106

Research Question 3: Scenario 3 and 4
Research question three related to inconsistency in pricing among individuals
(Scenario 3 and 4) concluded that the frequency in Table 9 explains that on Scenario 3
a majority of the customers were in the anger category. The relationship between
Scenario 3 and other attributes in question three states that there was a significant
relationship with ethnicity, enrollment in HFGP, customer perception of capitalism as a
basis for market-based pricing, customer perception of pricing fluctuations based on
marketing channel, and revenue management information not provided.
Furthermore, the frequency in Table 9 explains that on Scenario 4 a majority of
the customers were also in the anger category. The relationship between Scenario 4
and other attributes reveals that there was significant relationship with gender, age,
ethnicity, customer who was enrolled in Airline FFP, revenue management information
not provided, leisure traveler preference of fixed and negotiated price for a room, and
business traveler preference for negotiated price.
According to Varini, Englemann, Claessen, Schleusener (2002) if the revenue
management system is not used adequately by the hotel operators, the hotel would lose
revenue. Hence, it is imperative that hotel operators use the system appropriately.
Moreover, customers should be satisfied with services rendered by the hotel and there
should be a strong relationship between the hotel revenue management system and
customers. It is vital the hotel distinguishes the customers into business travelers and
leisure travelers because business travelers are not price-sensitive and can spend
money to fulfill their needs. However, leisure travelers are price-sensitive and generally
ready to sacrifice price in exchange for restrictions applied to them (Noone, Kimes, and
107

Renaghan, 2003). To know consumers behavior should be the priority for the hotels and
this could be done through proper revenue management systems in place. Further, it is
important that high-end technology is used to run the system as this could increase the
satisfaction level of the consumers (Kimes and Reneghan, 2003). Bolton, Warlop and
Alba’s 2003 study states that consumers have a vague idea about the price they are
going to pay in the service sector. However, the lack of knowledge or little knowledge
the consumer has about the price could result in unfair perceived pricing and in turn
dissatisfy customers.
One can draw the inference that the hotel industry needs to consider
demographic groups as consumers, especially females, Asian-Americans, and
Hispanic-Americans, who are sensitive to inconsistency in pricing. The industry needs
to have knowledge about customer spending levels and know whether the customer
has a general idea about the pricing strategy used in that market. Furthermore, when
there is inconsistency in pricing among individuals, hotels ought to know that enrollment
in HFGP and Airline FFP has great impact on satisfaction level. To increase revenue
and customer satisfaction it is imperative that HRM information be provided to the
customer. As the revenue management system has worked well in other industries, the
hotel industry needs to institutionalize the practice for better customer satisfaction.
Additionally, hotels should segment customers into business and leisure travelers.
Further, the industry must take into consideration that when a friend is paying a higher
or lower room rate, there is a difference in the preference of fixed or negotiated price
paid by business or leisure travelers.
108

Research Question 3: Scenario 5
The frequency in Table 9 explains that a majority of the customers were not
bothered when a friend was upgraded to a suite because of the HFGP. The relationship
between Scenario 5 and other attributes reveals that there was significant relationship
with customer perception of capitalism as a basis for market-based pricing, customer
perception of seasonal price adjustments, frequency of leisure traveler, and business
traveler’s preference to negotiate price.
Due to the lack of research done about HFGP and about upgrading a customer
for HFGP, one may infer that on Scenario 5 frequency of travel plays a major role in
satisfaction among customers. The hotel industry should understand that there is a
difference between traveler preference to negotiate or have a fixed price. Additionally,
hotels should consider the ethical issue of capitalism as basis for market-based pricing
and pricing fluctuations based on marketing channels, as these opinions could increase
customer satisfaction and revenue for the hotel.
Study Limitations
1) Majority of the travelers through Dallas Love Field Airport were business
travelers.
2) The study could only be generalized to travelers in Texas and neighboring states
because airlines (Southwest and Continental Express) traveling from Dallas Love
Field Airport fly only to states adjacent to Texas.
3) Due to a large number of tables generated from the analysis through SPSS, only
attributes which were significant were discussed.
109
4) There were time constraints on days and times the author received permission to
do the survey.
5) It was difficult to judge the mood of travelers at the airport; the mood of
respondents could have a huge impact on the results.
Study Implications
When this research is looked at as a whole, there are several points that stand
out as lessons to be learned. The original objective was to determine customer
perceptions of fairness concerning pricing policies charged by hotel industries, and
examine how different outcomes in pricing policies affect these perceptions. In broad
scope, it was found that not providing HRM information dissatisfied customers, while
providing it increased satisfaction.
Furthermore, the perceptions of customers when the price of the hotel room rate
fluctuates when returning to the same hotel again are significantly different. On the
other hand, the customers are dissatisfied when a friend pays a higher or lower price
than the customer for the hotel room. Customers are not bothered if the friend was
upgraded to a suite for a HFGP. In all scenarios except Scenario 5 (research question
7), HRM information not being provided to customers at the time of booking a hotel
room is a significant factor in perception.
Recommendations for Future Research
Specific suggestions for future research as a result of this study are:
1. The attributes which were not significant during analysis of each research
question should be analyzed.
110

2. The survey should be used to study travelers other than those in Texas and its
bordering states.
3. The survey should be used to study several other categories which were left out,
including a comparison of the sample with groups with similarities and
differences.
4. The survey should be utilized to study the HRM concept in different markets, with
a comparison of sample group similarities and differences.
5. More common types of scenarios used by customers staying in hotels should be
researched and analyzed with the concept of HRM system.
6. Research should be conducted to explore technological needs of the HRM
system.
111

APPENDIX A
QUESTIONNAIRE
112

113

114

115

APPENDIX B
SUMMARY OF INSTRUMENT BY VARIABLES AND TYPE OF DATA
116

Instrument Item Variable Description Data Type
1 Stay at the hotel Nominal
2 Stayed in the same hotel more than once Nominal
3 Visit the same hotel again if satisfied by the services Nominal
4 Paid the same room rate each time stayed in the same hotel Nominal
5 Reside in the U.S Nominal
6 Times paid the same room rate at the same hotel Ordinal
7 Times stayed in the same hotel Ordinal
8 Traveling for BUSINESS MAXIMUM amount spent per night Ordinal
9 Traveling for BUSINESS LEAST amount spent per night Ordinal
10 Traveling for LEISURE MAXIMUM amount spent per night Ordinal
11 Traveling for LEISURE LEAST amount spent per night Ordinal
12 Different Hotel Frequent Guest Programs enrolled in Ordinal
13 Times redeemed Hotel Frequent Guest Programs Ordinal
14 Different Airlines Frequent Flier enrolled in Ordinal
15 Times redeemed Airline Frequent Flier Ordinal
16 Preference – Traveling for BUSINESS fixed price Ordinal
17 Preference – Traveling for LEISURE fixed price Ordinal
18 Preference – Traveling for BUSINESS negotiable price Ordinal
19 Preference – Traveling for LEISURE negotiable price Ordinal
20 Hotel revenue management Information Provided Ordinal
21 Hotel revenue management Information NOT Provided Ordinal
22 Scenario 1- hotel operator quoted HIGHER price than last time Ordinal
23 Scenario 2- hotel operator quoted LOWER price than last time Ordinal
24 Scenario 3- friend paid a HIGHER room rate Ordinal
25 Scenario 4- friend paid a LOWER room rate Ordinal
26 Scenario 5- friend UPGRADED to a suite Ordinal
27 Ethical issue – Customer perceptions of capitalism as a basis for market-based pricing Nominal
28 Ethical issue – Customer perceptions of seasonal price adjustments Nominal
29 Ethical issues – Customer perceptions of pricing fluctuations based on marketing channel Nominal
30 Most common way booking a hotel room - BUSINESS traveler Nominal
(continued)
117
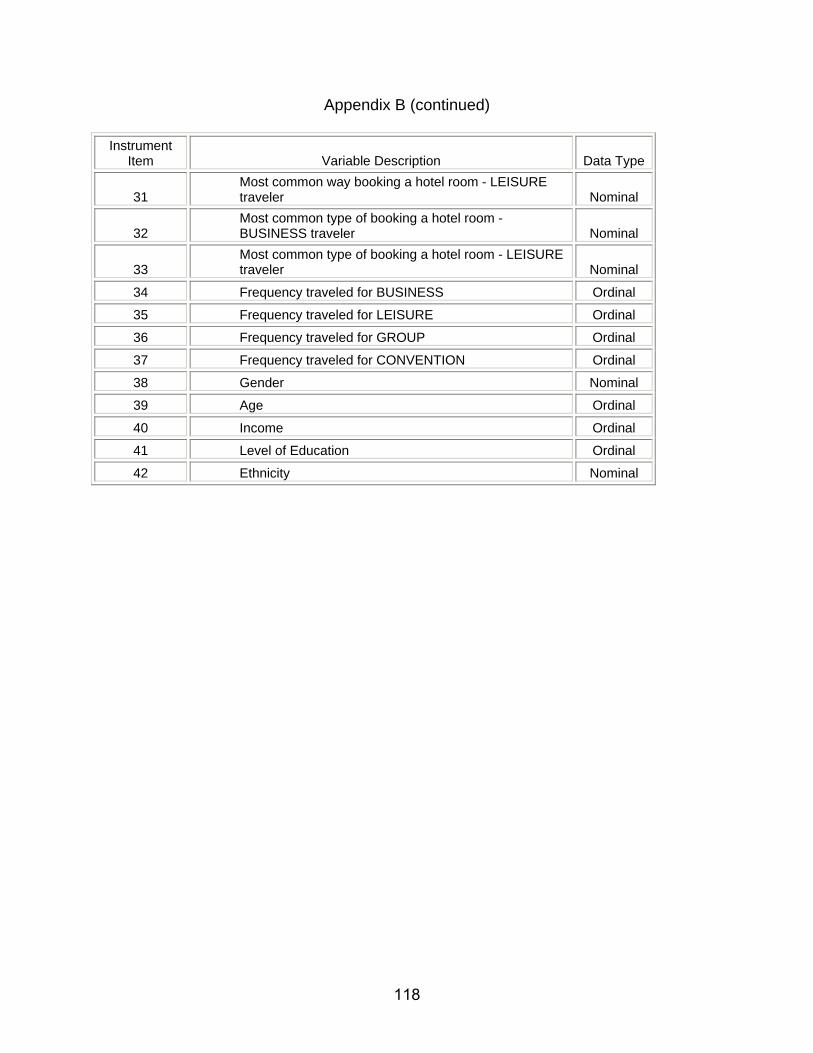
Appendix B (continued)
Instrument Item Variable Description Data Type
31 Most common way booking a hotel room - LEISURE traveler Nominal
32 Most common type of booking a hotel room - BUSINESS traveler Nominal
33 Most common type of booking a hotel room - LEISURE traveler Nominal
34 Frequency traveled for BUSINESS Ordinal
35 Frequency traveled for LEISURE Ordinal
36 Frequency traveled for GROUP Ordinal
37 Frequency traveled for CONVENTION Ordinal
38 Gender Nominal
39 Age Ordinal
40 Income Ordinal
41 Level of Education Ordinal
42 Ethnicity Nominal
118

APPENDIX C
INSTITUTIONAL REVIEW BOARD APPROVAL
119
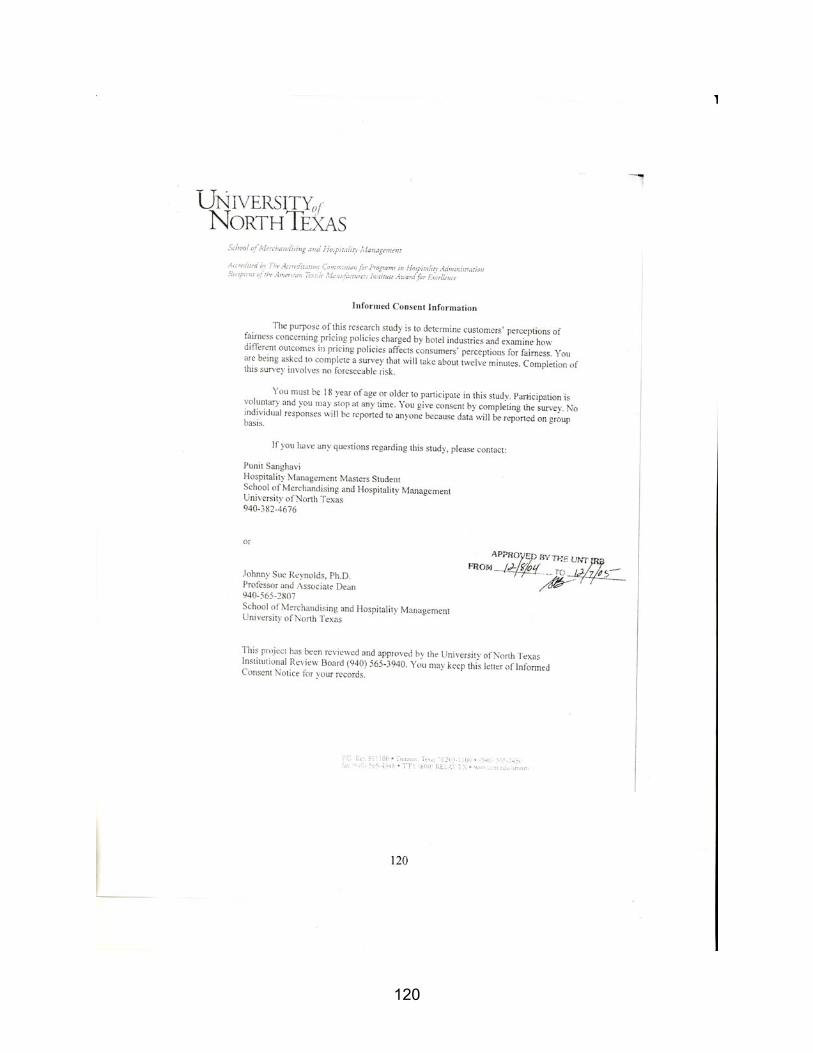
120
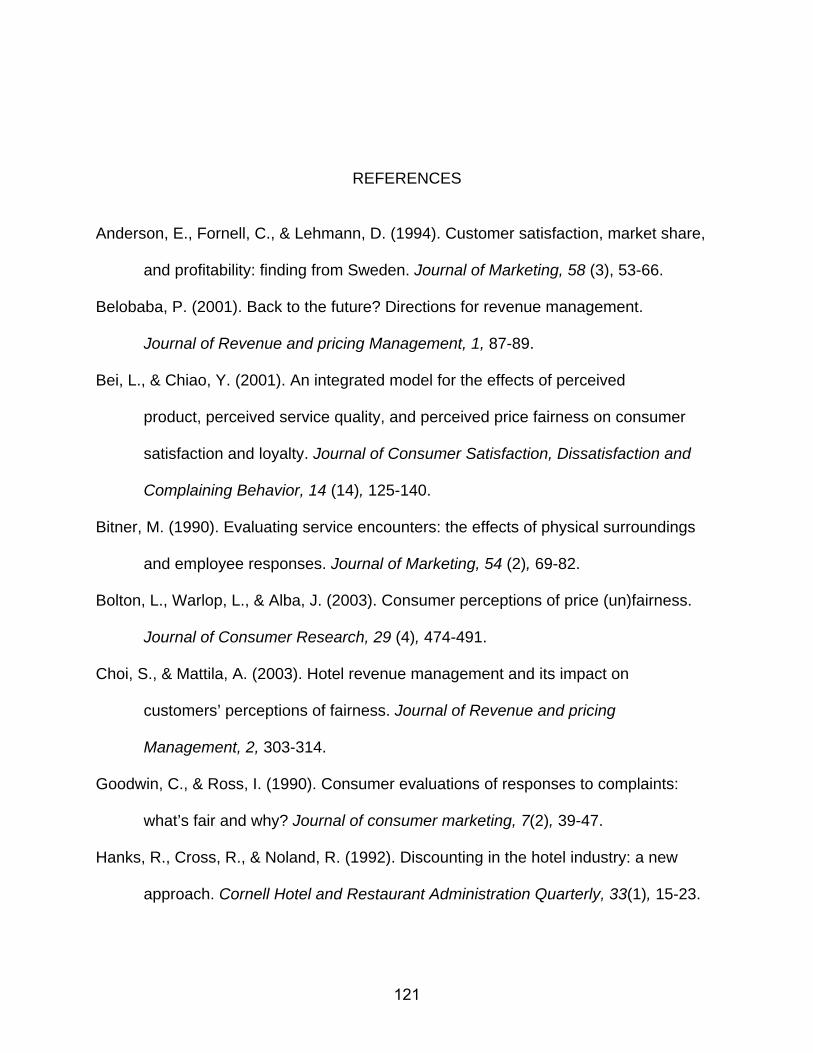
REFERENCES
Anderson, E., Fornell, C., & Lehmann, D. (1994). Customer satisfaction, market share,
and profitability: finding from Sweden. Journal of Marketing, 58 (3), 53-66.
Belobaba, P. (2001). Back to the future? Directions for revenue management.
Journal of Revenue and pricing Management, 1, 87-89.
Bei, L., & Chiao, Y. (2001). An integrated model for the effects of perceived
product, perceived service quality, and perceived price fairness on consumer
satisfaction and loyalty. Journal of Consumer Satisfaction, Dissatisfaction and
Complaining Behavior, 14 (14), 125-140.
Bitner, M. (1990). Evaluating service encounters: the effects of physical surroundings
and employee responses. Journal of Marketing, 54 (2), 69-82.
Bolton, L., Warlop, L., & Alba, J. (2003). Consumer perceptions of price (un)fairness.
Journal of Consumer Research, 29 (4), 474-491.
Choi, S., & Mattila, A. (2003). Hotel revenue management and its impact on
customers’ perceptions of fairness. Journal of Revenue and pricing
Management, 2, 303-314.
Goodwin, C., & Ross, I. (1990). Consumer evaluations of responses to complaints:
what’s fair and why? Journal of consumer marketing, 7(2), 39-47.
Hanks, R., Cross, R., & Noland, R. (1992). Discounting in the hotel industry: a new
approach. Cornell Hotel and Restaurant Administration Quarterly, 33(1), 15-23.
121

Hocutt, M., & Chakraborty, G., & Mowen, J. (1997) The impact of perceived justice on
customer satisfaction and intention to complain in a service recovery.
Advertising consumer research, 24, 457-463.
Kemis, S. (2002). Perceived fairness of yield management. Cornell Hotel and
Restaurant Administration Quarterly, 43(1), 21-30.
Kimes, S., & Wirtz, J. (2002). Perceived fairness of demand- based pricing for
restaurants. Cornell Hotel and Restaurant Administration Quarterly, 43(1), 31-37.
McCann, J. (2000). Revenue management is as hot as it gets for Hilton employee. Hotel
and Motel Management, 215(19), 140-141.
Norman, E., & Mayer, K. (1997). Yield management in Las Vegas casino hotels.
Cornell Hotel and Restaurant Administration Quarterly, 38( 5), 28-33.
Noone, B., Kimes, S., & Renaghan,L. (2003). Integrating customer relationship
management and revenue management: a hotel perspective. Journal of Revenue
and pricing Management, 2(1), 7-21.
Oliver, R. (1981). Measurement and evaluation of satisfaction process in retail
settings. Journal of Retailing, 57(3), 25-48.
Parasuraman, A., Zeithaml, V., & Berry, L. (1994). Reassement of Expectaions as a
comparison standard in measuring service quality: implications for further
research. Journal of Marketing, 58 (1), 111-124.
Parasuraman, A., Zeithaml, V., & Berry, L. (1985). A conceptual model of service
quality and its implications for future results. Journal of Marketing, 49, 41- 50.
122
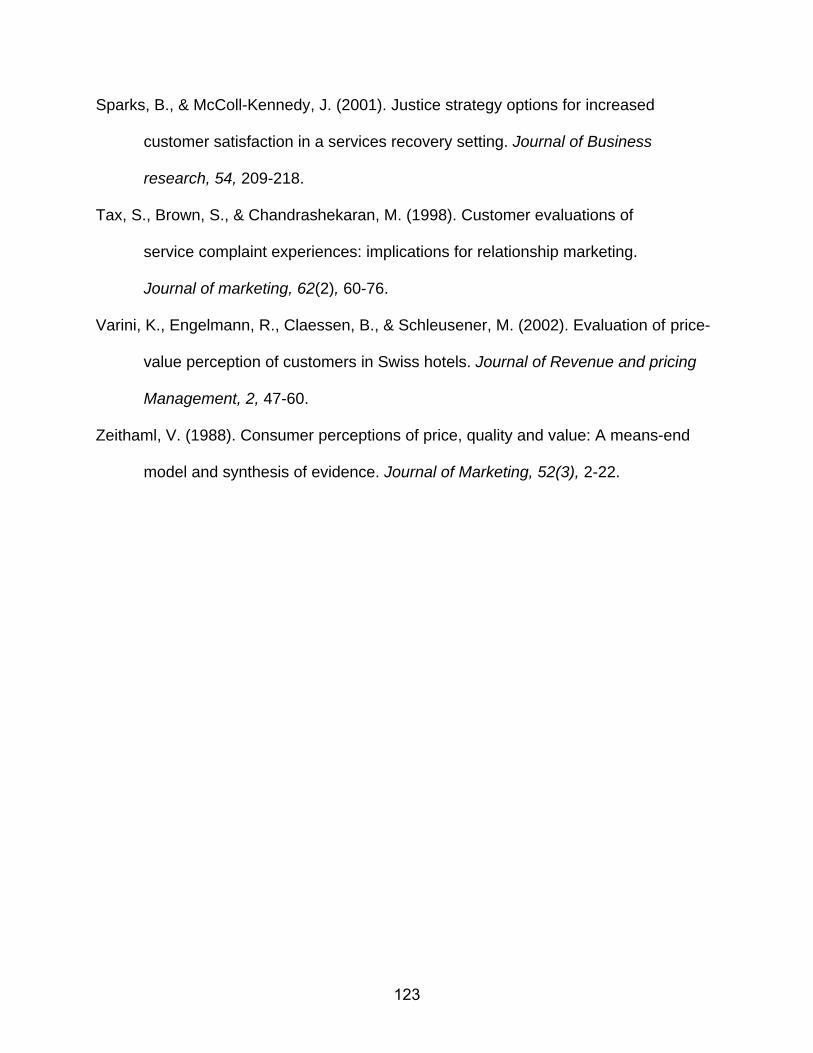
Sparks, B., & McColl-Kennedy, J. (2001). Justice strategy options for increased
customer satisfaction in a services recovery setting. Journal of Business
research, 54, 209-218.
Tax, S., Brown, S., & Chandrashekaran, M. (1998). Customer evaluations of
service complaint experiences: implications for relationship marketing.
Journal of marketing, 62(2), 60-76.
Varini, K., Engelmann, R., Claessen, B., & Schleusener, M. (2002). Evaluation of price-
value perception of customers in Swiss hotels. Journal of Revenue and pricing
Management, 2, 47-60.
Zeithaml, V. (1988). Consumer perceptions of price, quality and value: A means-end
model and synthesis of evidence. Journal of Marketing, 52(3), 2-22.
123