Customer Engagement with the Energy market - Tracking - Ofgem
96
Customer Engagement with the Energy Market - Tracking Survey 2013 Report prepared for Ofgem 12 June 2013 Public Final V14
Transcript of Customer Engagement with the Energy market - Tracking - Ofgem

Customer Engagement with the Energy
Market - Tracking Survey 2013
Report prepared for Ofgem
12 June 2013
Public Final V14

Contents
Introduction and Methodology ...................................................... 2
Selection of Respondents .......................................................................... 2
Quality Control ........................................................................................... 2
Summary ........................................................................................ 5
Incidence of Switching ................................................................ 10
Switching tariffs or payment methods ...................................................... 14
Knowledge and Preconceptions about Switching ..................... 21
Reasons for switching on last occasion .................................... 25
Finding out about the deals available ......................................... 27
Method used to make the last switch ......................................... 30
Expectations of savings on switching ........................................ 32
Customers’ evaluation of switching ........................................... 33
Attitudes to tariff choices ............................................................ 38
Information and communication received from suppliers ........ 43
Attitudes to specific communications ....................................................... 45
Trust in openness and transparency of energy suppliers ........ 52
Household financial stability ....................................................... 54
Appendices ................................................................................... 56
Sample Profile .......................................................................................... 56
Methods of Payment ................................................................................ 57
Online Tariff.............................................................................................. 58
Fixed term tariffs ...................................................................................... 58
Amount spent on home energy ................................................................ 59
Current gas and electricity suppliers ........................................................ 60
Questionnaire and topline results ............................................................. 65

1
© 2013 Ipsos MORI.
Introduction and
Methodology

2
© 2013 Ipsos MORI.
Introduction and Methodology
Ofgem commissioned Ipsos MORI to conduct a face-to-face survey representative of the
population of Great Britain aged 15+. The objective of the research was to enable greater
understanding of switching rates among the population, and vulnerable customers
specifically. Where possible, this report includes year-on-year comparisons with the previous
surveys in March 2012, January 2011 and March 2010 though there are some questionnaire
changes year-on-year.
The research vehicle chosen was Ipsos MORI’s weekly omnibus survey, known as the
Capibus, for which the fieldwork dates were 1-14 March 2013, achieving 1,960 computer-
assisted personal interviews.
All interviews are carried out in-home using computer-assisted personal interviewing (CAPI).
Selection of Respondents
In Britain we use up to 210 sampling points selected every week (i.e. one point per week per
political constituency), employ ACORN1 to improve how representative the sample is across
the social grades and set quota controls specific to each interviewer location. By using this
proven sample design, we represent all sub-sectors of the population – at a national and
regional level.
Quality Control
We employ the strictest quality control procedures. In all markets our interviewers are
trained to a recognised standard and one-in-ten interviews are back-checked by telephone.
Furthermore, we use the CAPI software to monitor both the overall length of each interview
(the average interview length does not exceed approx 26 minutes) and the time taken over
individual questions in the questionnaire.
1 A Classification Of Residential Neighbourhoods : is a geodemographic segmentation of the UK’s population. It
segments households, postcodes and neighbourhoods into 6 categories, 18 groups and 62 types. By analysing significant social factors and population behaviour, it provides precise information and an in-depth understanding of the different types of people

3
© 2013 Ipsos MORI.
In Great Britain, Ipsos MORI is ISO9001, BS7911 and ISO 20252 accredited – a mark of our
commitment to quality.
Data Processing
All Capibus data is processed in-house by Ipsos MORI.
Weighting
A rim weighting system is applied which weights to Market Research Society (MRS) defined
profiles for age, social grade, region and working status - within sex. The idea of rim
weighting is to provide the 'best weighting', or least distorting, by using computing power to
run a large number of solutions from which the best is chosen.
In order to correct minor deviations in terms of the generated sample profile week on week,
omnibus services use a variety of weighting procedures. Clearly, the more effective the
sampling the less the need to rely on weighting to resolve problems.
While the nationally representative sample comprised 1,960 interviews, most of the figures in
this report are based on 1,241 gas customers and 1,408 electricity customers. This reflects
the fact that we excluded from detailed questioning those people who either did not have
mains gas or electricity or who were not responsible (individually or jointly) for paying gas or
electricity bills.
NOTE: Figures in the tables will not always add to 100%, either because of multiple answers
being allowed, or because of rounding. This may particularly affect rating scales where the
“net” of, for example, “very” and “fairly” will not add exactly to the combined “very/fairly”
figure. The difference should not, however, be more than one percentage point.
Tables are headed by actual question wordings and a question number, which relates to the
full questionnaire in the appendix to this report.
Any findings referred to which are not shown in the tables are all available in the original
copy of the computer tabulations held by Ofgem.
Ref: 13-007011

4
© 2013 Ipsos MORI.
Throughout the report an asterisk (*) refers to any proportion less than one half of one per
cent. Where percentages do not sum to 100 this is due to computer rounding or, in the case
of the summary tables, to the exclusion of “don’t know” and “no answer” categories.
Summary

5
© 2013 Ipsos MORI.
Summary
Switching supplier
The proportions of both gas and electricity consumers who switched supplier in the
past year have fallen for the fourth year in succession for gas consumers (by two
points to 11%) and for the fifth year for electricity consumers (also by two points, to
12%). Low switching rates are noted for BME groups, for standard credit and PPM
consumers, for those in rented accommodation and for the 65+ age group. Rural
consumers are more likely to have switched their electricity supplier than urban
consumers. Internet access is a key facilitator for switching; the rate among those
with no access is very low (4% for gas; 5% for electricity).
The previous downward trend in the proportions who say they have “ever switched”
has been arrested – for both fuels it is now 38%, up one point for gas, and up three
points for electricity. This may be attributable to the adjusted wording for the question
“Did you switch your ...supplier at any time before 2012?” which attempts to remind
respondents about earlier switches. The “never switched” consumers are more likely
to pay by standard credit or PPM, to be from DE social grades, to be from the BME
groups, or to rent their homes. They are also more likely to be found in Scotland than
in England or Wales.
Switching tariff or method of payment
The incidence of tariff or method of payment switching has, by contrast, increased
this year by four points to 15%, for both fuels. Tariff switching is lower among the
same sub-groups as supplier switching, and additionally those with a long term
disability are also less likely to have switched tariff. The main method of payment that
consumers are switching away from is standard credit, though it is notable that most
tariff switches (and supplier switches) do not involve a change of payment method.
Recent tariff or method of payment switchers say they made the switch primarily to
save money, but the proportion giving this response is down four points to 58%. The
proportion seeking a fixed price deal is up three points to 8% and switches caused by
moving home are up six points to 7%. Consumers who report that they switched tariff

6
© 2013 Ipsos MORI.
or payment method say they found out about it mainly by online price comparison
websites and, increasingly this year, by ringing the supplier. Fewer mention the
influence of doorstep salespersons. The actual switch is even more likely to have
been made by ringing the supplier directly, particularly by the 15-34 age group. .
Awareness and perceptions surrounding switching supplier, tariff or payment
method
Awareness that it is possible to switch energy supplier (among those who have never
switched) is up four points to 84%. Being “happy with current supplier” remains the
most popular reason for not switching, but at 55% this has declined substantially
since last year (down 23 points). While this difference may have been influenced by a
marginal change in research methodology, it nevertheless seems likely this reflects a
real decline in the proportion who describe themselves as “happy” with their current
supplier. Meanwhile perception that there is not enough difference to make switching
worthwhile is up four points to 17% and the belief that switching is a hassle is up
seven points to 27%.
Those who have never switched consider they would need to save a minimum of
£153 a year on average by switching supplier to be encouraged to do so, a little less
than last year.
Awareness that it is possible to switch tariff or payment method has improved sharply
this year (by 14 points) to 82% of those who have not switched tariff/payment method
in the past year. Vulnerable groups have generally lower awareness, especially social
grade E, and, separately, the same applies to those from BME groups
Experience of switching supplier
The main trigger for respondents’ most recent switch of supplier remains, for both
fuels, the prospect of saving money, with no significant changes in patterns of
answers since the last tracking survey; subsidiary reasons remain infrequently
mentioned. Previously identified trends on sources of information for switching have
continued, with more use of online web comparison services and a decline in
consulting supplier representatives. Phoning the supplier is now the most frequently
used method of making the actual switch for both fuels (29%), having, this year,

7
© 2013 Ipsos MORI.
overtaken online web comparison sites for gas switches, as well as electricity. On the
last occasion, switchers expected to save £195 per year on average, a little more
than last year, though 40% continue to have no idea how much they expected to
save.
Switchers’ evaluations of their last switching experience show some minor change.
Just 68% of those who switched gas supplier to save money believe they actually
saved money, down four points from last year, though this remains above the
2010/11 level. The corresponding figure for electricity switchers is 70%, down three
points, but again ahead of 2010/11. In comparison to last year’s survey, consumers
are slightly less likely to agree it was easy to decide on the deal to switch to, though
most (69%) still rate it as easy. There is no growth in the majorities who express
understanding of the key features of the deals or confidence in their ability to make
the right choice again.
Attitudes to tariff choices available
This year, new questions examined attitudes to tariff choices and to communications
received from suppliers. Consumers are evenly balanced regarding the perceived
difficulty of comparing different tariffs – 37% say they consider it easy and 37% say
they consider it difficult. The main substantive reasons given for finding it difficult are
the number of tariffs and choices, and the lack of standardised information to facilitate
like for like comparisons, though perceived use of technical jargon in communications
about tariffs is also mentioned. There is a strong majority who feel there are too many
tariffs available – 62% say too many, 20% the right number and 5% too few. Just
under half of energy consumers (44%) feel they understand the range of tariffs
completely or a fair amount. By contrast, just over half (54%) feel they understand
“not very much” or “not at all”. The poorest understanding is found among those in
rented accommodation, with no internet access, with a disability or from social grade
E (state supported).
8
© 2013 Ipsos MORI.
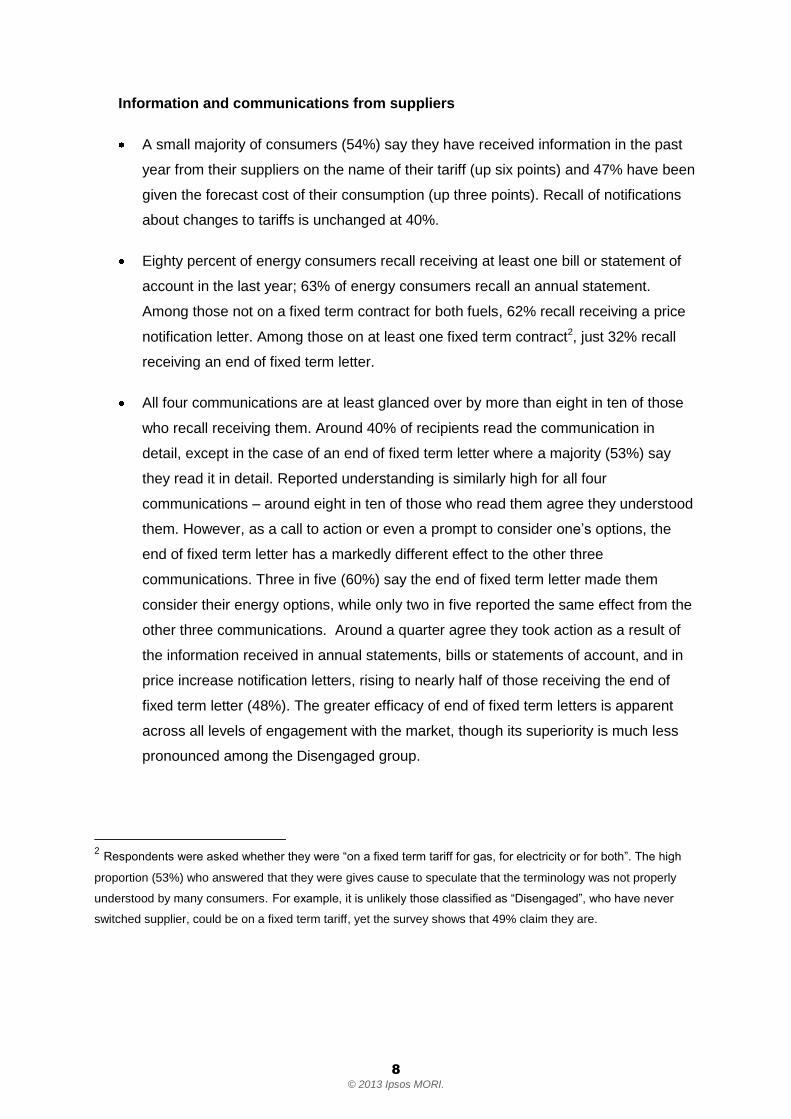
Information and communications from suppliers
A small majority of consumers (54%) say they have received information in the past
year from their suppliers on the name of their tariff (up six points) and 47% have been
given the forecast cost of their consumption (up three points). Recall of notifications
about changes to tariffs is unchanged at 40%.
Eighty percent of energy consumers recall receiving at least one bill or statement of
account in the last year; 63% of energy consumers recall an annual statement.
Among those not on a fixed term contract for both fuels, 62% recall receiving a price
notification letter. Among those on at least one fixed term contract2, just 32% recall
receiving an end of fixed term letter.
All four communications are at least glanced over by more than eight in ten of those
who recall receiving them. Around 40% of recipients read the communication in
detail, except in the case of an end of fixed term letter where a majority (53%) say
they read it in detail. Reported understanding is similarly high for all four
communications – around eight in ten of those who read them agree they understood
them. However, as a call to action or even a prompt to consider one’s options, the
end of fixed term letter has a markedly different effect to the other three
communications. Three in five (60%) say the end of fixed term letter made them
consider their energy options, while only two in five reported the same effect from the
other three communications. Around a quarter agree they took action as a result of
the information received in annual statements, bills or statements of account, and in
price increase notification letters, rising to nearly half of those receiving the end of
fixed term letter (48%). The greater efficacy of end of fixed term letters is apparent
across all levels of engagement with the market, though its superiority is much less
pronounced among the Disengaged group.
2 Respondents were asked whether they were “on a fixed term tariff for gas, for electricity or for both”. The high
proportion (53%) who answered that they were gives cause to speculate that the terminology was not properly
understood by many consumers. For example, it is unlikely those classified as “Disengaged”, who have never
switched supplier, could be on a fixed term tariff, yet the survey shows that 49% claim they are.

9
© 2013 Ipsos MORI.
Trust in energy suppliers
Trust in energy suppliers to be open and transparent in their dealings with consumers
has slipped lower this year – 29% now tend to trust/completely trust suppliers
compared to 34% last year. Distrust is up from 39% to 43%. Only a few minority
groups are more likely to trust the energy suppliers on balance: including the BME
groups (32% trust; 26% distrust) and those with no internet access (40% trust; 30%
distrust). Consumers in Scotland are evenly balanced between trust and distrust.

10
© 2013 Ipsos MORI.
Incidence of Switching
Q12a. Did you switch your gas supplier in 2012?
All 2013 Payment method Ethnicity
Tenure Previous survey years (all)
Monthly/ Quarterly
Direct debit
Standard
credit PPM (gas) White BME
Rent ed
Not rented 2010 2011 2012
Base: All with mains gas who are responsible for the bill
(1,214)
%
(880)
%
(109)
%
(165)
%
(1,093)
%
(116)
%
(338)
%
(876)
%
(1369)
%
(1331)
%
(1232)
%
Yes 11 13 9 7 12 4 7 12 17 15 13
No/ Don’t know
89 87 91 93 88 96 93 88 83 85 87
Source: Ipsos MORI
Switching of gas supplier and switching of electricity supplier both declined further in 2012,
though the year-on-year decline of two percentage points was not statistically significant in
either case. Viewing the year as a continuation of previous trends however, it is apparent that
Q16a. Did you switch your electricity supplier in 2012?
All 2013 Payment method Ethnicity
Tenure Previous survey years (all)
Monthly/ Quarterly
Direct debit
Standard
credit PPM (elec) White BME
Ren ted
Not rented 2010 2011 2012
Base: All with mains electricity who are responsible for the bill
(1,408) %
(986) %
(127) %
(227) %
(1283) %
(119) %
(401)
%
(1007)
%
(1540) %
(1500) %
(1461) %
Yes 12 13 6 9 12 3 8 13 18 17 14
No/ Don’t know
88 87 94 91 88 97 92 87 82 83 86
Source: Ipsos MORI

11
© 2013 Ipsos MORI.
this has been a fourth year of decline for gas customers and a fifth year of decline for
electricity customers.
Switching rates continue to be much higher among direct debit customers than among
standard credit or PPM customers, for both fuels. There is now no significant difference
between standard credit and PPM customers. Ethnicity continues to show a strong contrast:
respondents from the white ethnic group are more than twice as likely to have switched their
gas supplier, and substantially more likely to have switched their electricity supplier than
those from BME groups. Those not in rented accommodation are also more likely to have
switched each fuel, while switching among the rented sector is below the national aggregate.
Small differences by country (i.e. England, Scotland, Wales), age and social grade are not
significant, with the exception of electricity switching among the 65+ age group (just 8%,
which may be linked to the high proportion of the 65+ who have no internet access: 38%),
and which is significantly lower than the 35-64 group (13%). There has been some
convergence, especially across social grade since last year, when it was a more significant
determinant of switching. Gas switching is similarly lower among the 65+ but the smaller
sample size of gas customers renders the difference non-significant. Rural consumers are
more likely to have switched their electricity supplier than urban consumers. The same is true
for rural gas consumers, but the lead over urban gas consumers is not statistically significant.
The proportion of consumers with a long term physical or mental impairment who have
switched supplier in 2012 is 8% for each fuel, slightly lower than for those with no such issue
(12%), but this is not a statistically significant difference.
Q12a/16a. Did you switch your supplier in 2012? - Effect of Internet Access
Q12a. Gas Q16a. Electricity
Internet Access Internet Access
All 2013 Yes No All 2013 Yes No
Base: All with each fuel who are responsible for the bills
(1,214) %
(985) %
(229) %
(1,408) %
(1,132) %
(276) %
Yes 11 12 4 12 13 5
No 89 88 96 88 87 95
Source: Ipsos MORI

12
© 2013 Ipsos MORI.
The availability of internet access continues to be a major factor in the switching of both
fuels; those with internet are significantly more likely to have switched. The survey shows
that 85% of energy customers have internet access, which is up two points compared to last
year. The proportion of gas customers on an online tariff is now 27%, up five points, while the
corresponding figure for electricity customers is up three points to 25%.
Q12a/12b/13. Summary Table – Ever switched gas supplier (to March 2013)3
All 2013
Payment method
Social grade Ethnicity Tenure
Previous survey years (all)
Monthly/Quarterly
Direct debit
Standard credit
PPM (gas) AB DE White BME
Rent ed
Not rented 2010 2011 2012
Base: All with mains
gas who are responsible for the bill
(1,214) %
(880) %
(109) %
(165) %
(279) %
(297) %
(1,093) %
(116) %
(338) %
(876) %
(1,369) %
(1,331) %
(1,232) %
Yes 38 43 23 22 48 29 40 12 23 42 43 41 37
No 62 57 77 78 52 71 60 88 77 58 57 59 63
Source: Ipsos MORI
Q16a/16b/17. Summary Table – Ever switched electricity supplier (to March 2013)4
All 2013
Payment method
Social grade Ethnicity Tenure
Previous survey years (all)
Monthly/Quarterly
Direct debit
Standard credit
PPM (elec) AB DE White BME Rented
Not rented 2010 2011 2012
Base: All with mains electricity who are
responsible for the bill
(1,408) %
(986) %
(127) %
(227) %
(324) %
(363) %
(1,283) %
(119) %
(401) %
(1007) %
(1,540) %
(1,500) %
(1,461) %
Yes 38 43 22 26 49 29 40 14 23 43 42 40 35
No 62 57 78 74 51 71 60 86 77 57 58 60 65
Source: Ipsos MORI
3 In 2012 questionnaire:
Q13 read ‘Did you switch your gas supplier before 2011?’In 2013 questionnaire: Q13 read ‘Did you switch your gas supplier at any time before 2012?’ 4 In 2012 questionnaire:
Q17 read ‘Did you switch your electricity supplier before 2011?’In 2013 questionnaire: Q17 read ‘Did you switch your electricity supplier at any time before 2012?’

13
© 2013 Ipsos MORI.
The long term decline in the proportion of customers who say they have ever switched
supplier to date has reversed this year, possibly due to the small alteration in the question
wording to remind respondents that the switch could have been some time ago. It remains to
be seen whether it will now stabilise at this level. However there is further evidence in this
year’s survey that the group within the population who switch at all is continuing to be limited,
and that switching activity is increasingly concentrated among a limited sub-group. The
proportion of gas switchers who say they have switched four times or more is up a further
two points to 17% of all switchers, while those who have switched once have fallen again to
38%. Similarly among electricity switchers, those who say they have switched four times or
more are up one point to a new peak of 16%, while those who have switched once have
fallen to 42%, the lowest ever measured.
These most frequent switchers are a relatively small group whose sample size does not bear
detailed comparative analysis. However, they can be broadly characterised (for both fuels)
disproportionately as direct debit payers, aged 35-64, ABC1 social grades, white ethnic
group, with internet access and not renting their homes.
Consumers who say they have never switched gas supplier are significantly more likely to
pay by standard credit or PPM, to be from the DE (unskilled and state supported) social
grades, to be from the BME ethnic groups or to rent their homes. Among electricity
consumers the same statistically significant observations can be made, though switching
rates among the more disadvantaged groups are marginally above those for gas.
The proportion who say they have ever switched supplier is significantly larger for both fuels
in England than in Scotland, but Wales lies between the two. Those with internet access are
twice as likely as those without to have switched either fuel. As noted in previous years,
those in rural areas are more likely to have ever switched either gas or electricity supplier
than those in urban areas. Consumers with a long term physical or mental impairment are
marginally less likely to have ever switched either fuel, though the difference is not
statistically significant.

14
© 2013 Ipsos MORI.
Switching tariffs or payment methods
Q15a. Even though you stayed with the same gas supplier in 2012 and so far in 2013, did you change the tariff you have with them or the method by which you pay them?
All
2013 Current Payment
method Social grade
Physical/ Mental
Impairment
Tenure Previous survey
years (all) Monthly/
Quarterly Direct debit
Stand ard
credit PPM (gas) AB DE Yes No
Rented
Not rented 2010 2011 2012
Base: All who did not switch gas supplier in 2012/13
(1,063) %
(758) %
(99) %
(148) %
(238) %
(263) %
(203) %
(860) %
(307) %
(756) %
(1134) %
(1127) %
(1075) %
Yes – tariff
11 13 7 3 14 8 6 12 7 12
Not asked separately
before 2012
9
Yes – payment method
5 4 4 9 5 2 5 5 5 5 4
Yes - changed either
15 17 11 10 18 10 9 17 88 83 10 12 12
No/Don’t know
85 83 89 90 82 90 91 83 88 83 90 88 88
Source: Ipsos MORI

15
© 2013 Ipsos MORI.
This year sees a significant increase in the proportion of those who, while not having
switched supplier in 2012/13, did switch either their tariff or payment method. Among both
gas and electricity consumers this is now 15%, both up three points from last year. The
significant increase is in sharp contrast to the continued decline in rates of switching
suppliers. Tariff switching is significantly lower among standard credit and PPM consumers,
the lower social grades, notably the D (unskilled) category, those who rent their homes and
among those with long term disability.
Those switching supplier in 2012/13 were asked in a new question if they also switched
payment method at the same time. Among gas supplier switchers, just 15% switched their
payment method at the same time; among electricity supplier switchers the proportion was
16%.
Q19a. Even though you stayed with the same electricity supplier in 2012 and so far in 2013, did you change the tariff you have with them or the method by which you pay them?
All 2013
Current Payment method Social grade
Physical/ Mental
Impairment Tenure Previous survey
years (all) Monthly/
Quarterly Direct debit
Stand ard
credit PPM (elec) AB DE Yes No Rented
Not rented 2010 2011 2012
Base: All who did not
switch electricity supplier in 2012/13
(1,234) %
(849) %
(119) %
(202) %
(278) %
(324) %
(246) %
(988) %
(364)
%
(870)
%
(1273) %
(1246) %
(1255) %
Yes – tariff
10 12 4 3 12 6 6 10 4 11
Not asked separately
before 2012
10
Yes – payment method
6 6 4 8 7 5 4 7 8 6 3
Yes – changed either
15 17 8 9 18 10 9 16 12 16 8 10 12
No/Don’t know
85 83 92 91 82 90 91 84 88 84 91 89 88
Source: Ipsos MORI

16
© 2013 Ipsos MORI.
All those who switched tariff or payment method in the past year (whether at the same time
as switching supplier or not) were asked what method they changed from. The sample size is
a little small to be definitive about the direction of change because very few of the switches
involved an actual change of payment method: 72% of gas tariff switchers and 66% of
electricity tariff switchers did not actually change their payment method when they switched
tariff. The most frequently observed change of payment method is from standard credit to
direct debit, for both fuels. Small numbers can also be noted dropping out of direct debit into
PPM, and from quarterly direct debit to monthly direct debit.
Q33. Thinking about the last time you changed your tariff or payment method (without switching supplier) what was the main trigger causing you to change it?
All
2013 Social grade Ethnicity Previous survey
(all) AB C1 C2 DE White BME 2012
Base: All changed tariff/payment method in 2012/13
(219) %
(60) %
(67) %
(53) %
(39) %
(198) %
(19) %
(174) %
Believed new tariff or method was cheaper/ to save money
58 59 64 49 54 60 43 62
Wanted a fixed price5 deal 8 2 10 13 10 8 8 5
Moved home 7 4 6 8 15 6 17 1
Believed new tariff or method offered better benefits
6 11 3 4 4 7 - 7
Wanted a dual fuel package 4 3 3 9 1 3 3 3
Source: Ipsos MORI
The main trigger for switching tariff or payment method is to save money. This proportion is
down a little from last year. A move to fixed price is also marginally more frequently
mentioned this year, though is scarcely mentioned by AB social grades. Moving home is
another notable trigger and this is a significant issue for the DE social grades and for BME
consumers. The AB social grades, on the other hand, are disproportionately more likely to
mention that a new tariff appeared to offer better benefits.
5 See earlier footnote regarding caution over consumer understanding of “fixed term tariff”, which may also relate
to understanding of “fixed price”

17
© 2013 Ipsos MORI.
Q34. How did you find out about the tariff or payment method you changed to?
All Social Grade Age
Internet Access All
AB C1 C2 DE 15-34 35-64 65+ Yes No 2012
Base: All changed tariff or payment method in 2012/13
(219) %
(60) %
(67) %
(53) %
(39) %
(32) %
(114) %
(73) %
(184) %
(35) %
(174) %
Used online/ website price comparison service
24 32 26 26 4 26 27 17 27 6 26
I rang them (only) 17 21 19 7 16 24 18 9 17 12 7
They phoned me 8 5 8 12 9 2 8 13 7 15 8
Supplier representative knocked at my door
8 5 2 12 18 2 9 8 8 6 12
Written communication or marketing material
7 11 6 3 7 2 7 10 8 5 13
Rang them and other suppliers
5 2 4 10 6 11 3 5 5 5 2
Friend or family member told me
4 4 4 5 5 11 2 6 3 14 3
I saw an advert 4 2 6 5 5 9 2 5 5 - 2
Phoned a comparison service
4 - 5 3 7 6 3 3 2 12 7
Looked at supplier’s own website only
4 3 9 - - - 5 3 4 - 4
Spoke to a salesperson in street/ shopping centre
3 2 2 8 3 3 3 3 4 - 5
Looked at websites of more than one supplier
2 2 - - 7 4 1 3 2 - 5
Other 8 6 8 10 8 - 9 10 6 20 5
Don’t know 5 6 5 4 5 10 3 7 4 11 7
Source: Ipsos MORI
Consumers who switched tariff or payment method in 2012/13 used, between them, a wide
range of sources to find out about the tariff. Online price comparison websites are most
frequently mentioned, though the DE social grades are notably less likely to use them. There

18
© 2013 Ipsos MORI.
is an increase in the proportion who called their own supplier to find out about tariff change
(up 10 points to 17%). This now outweighs the proportion called by the supplier and is more
likely to involve the ABC1 and DE social grades, as well as younger people (15-34). Those
with internet access are more likely to have called the supplier than those without. A small
(and falling) proportion was prompted to change tariff or payment method with their existing
supplier following an encounter with a doorstep sales person.
Q35. Thinking about the last time you changed your tariff or payment method with your supplier, how did you change it?
All 2013 Social Grade Age
Internet Access
Previous survey (all)
AB DE 15-34 35-64 65+ Yes No 2012
Base: All changed tariff or payment method in 2012/13
(219) %
(60) %
(39) %
(32) %
(114) %
(73) %
(184) %
(35) %
(174)
%
Phoning supplier 42 38 49 64 34 46 42 43 34
Online price comparison service
20 30 4 8 27 11 22 3 17
Through a salesperson who knocked at my door
10 3 23 11 10 10 10 12 11
Telephone price comparison service
5 2 4 - 3 10 3 13 7
Through suppliers’ website
4 4 - 3 6 3 5 - 7
Written communications 4 4 5 - 3 9 3 8 6
Through a salesperson in street/shopping
centre
3 4 - 3 4 1 4 - 3
Other 7 7 13 2 10 6 6 15 8
Don’t know 4 6 1 9 3 4 4 6 7
Source: Ipsos MORI
The actual switch of tariff or payment method is even more likely this year to have been
made by phoning the supplier – the proportion is up eight points to 42%. The 15-34 age
group is particularly likely to have used this method. Making the switch via an online

19
© 2013 Ipsos MORI.
comparison service is next most popular method, and also marginally more frequently
mentioned this year. The AB social grade, 35-64 year olds and – perhaps unsurprisingly -
those with internet access are most likely to have used this route. One in ten switched via a
doorstep salesman, as in the previous survey.
Q20. Did you know it was possible to change to a different tariff or method of payment with your current supplier?
Total 2013
Method of Payment (electricity) Social Grade Ethnicity
Previous survey
(all)
Monthly/ Quarterly
Direct Debit
Standard
Credit PPM (elec) AB C1 E White BME 2012
Base: All who have not changed gas or electricity tariff/payment method in 2012/13
(1,241) %
(814) %
(113) %
(204) %
(270) %
(340) %
(158) %
(1,105) %
(105) %
(1139) %
Yes – knew possible to change tariff
34 37 36 26 39 31 26 35 23 -
Yes – knew possible to change method of
payment
5 5 9 5 6 6 6 5 6 -
Yes – knew possible to change both
43 43 43 42 43 46 35 44 29 -
No 17 15 11 27 11 17 32 15 42 28
Don’t know 1 * * - 1 * * 1 - 5
All who knew possible to switch either tariff or
payment method for either fuel
82 84 88 73 88 83 68 84 58 68
Source: Ipsos MORI
As questions differed in their wording this year it makes precise comparison difficult, but it is
nevertheless clear that awareness of the possibility of tariff or method of payment switching
is sharply increased this year. In 2012, 68% of those who had not changed tariff or payment
method in the past year said they were aware they could. This is now increased by 14 points
to 82%. The new question format allows us to identify that consumers are more likely to
know about the possibility of tariff change, than specifically payment method change.

20
© 2013 Ipsos MORI.
Awareness of the possibility of tariff or payment method change is significantly lower among
“vulnerable” groups, notably PPM consumers (especially gas PPM, 68%, though electricity
PPM is also significantly lower at 73%), state-supported social grade E and those who rent
their homes. Awareness is also lower among the BME groups.

21
© 2013 Ipsos MORI.
Knowledge and Preconceptions about
Switching
Q21. Did you know it was possible to switch to a different gas or electricity supplier?
Total Area Social grade Ethnicity Previous surveys (all)
2013 Urban Sub-urban Rural AB C2 DE White BME 2010 2011 2012
Base: All responsible for bills who have never switched
gas or electricity supplier
(882) %
(433) %
(229) %
(220) %
(160) %
(219) %
(261) %
(773) %
(105) %
(847) %
(875) %
(934) %
Yes to both
77 67 88 82 82 76 73 79 55 Not asked before 2012
- 79
Yes – Electricity
not gas
2 3 1 2 3 1 2 2 - - - 2
Yes – Gas not
electricity
5 6 4 5 5 5 5 5 6 - - 1
Yes (to either elec
or gas)
84 75 93 89 90 82 79 87 61 83 87 80
No 16 24 6 10 9 17 21 13 39 14 10 16
Don’t know 1 * 1 * 1 1 - 1 - 4 3 3
Source: Ipsos MORI
The proportion of those consumers who say they have never switched energy supplier who
are currently aware that it is possible to switch supplier for either fuel is up four points to 84%
but remains short of its 87% peak in 2011.
Those unaware of the possibility of switching supplier are most likely to be found in urban
areas, among the DE social grades and among BME groups.

22
© 2013 Ipsos MORI.
Q22. For each of the items here, could you please say which of them, if any, apply to you?
Total 2013 Age Social grade Tenure
Previous surveys (all)
15-34 35-64 65+ AB E Rented Not
rented 2011 2012
Base: All responsible for bills but have never switched gas or
electricity supplier
(882) %
(178) %
(415) %
(289) %
(160) %
(123) %
(310) %
(572) %
(875) %
(934) %
I’m happy with my current supplier(s)
55 43 56 63 55 46 46 59 77 78
Switching is a hassle 27 28 30 23 32 27 27 28 22 20
I don’t think there’s any difference between
suppliers to make switching worthwhile
6
17 18 15 21 19 20 16 17 20 13
I’ve checked prices of other suppliers and I think
I’m on the best deal7
12 15 12 8 12 10 10 12 13 9
I am unsure where to get info to help me make a
good choice
6 5 6 5 8 7 2 7 4 2
I wouldn’t know how to switch even if I wanted to
4 5 3 5 3 9 4 4 2 3
I live in rented accommodation and I
don’t think my landlord would allow me to switch
8
3 7 2 1 1 7 7 1 3 3
My supplier has told me I can’t switch
2 2 1 3 1 1 1 2 - 1
I am in debt with my current supplier so I don’t
think I can switch
2 2 2 * - 6 3 1 1 1
Source: Ipsos MORI
While te pattern of reasons for not having switched is similar to last year there are some
notable trends for key statements. This question was previously asked with a paper
showcard, showing the options in two alternative orders. In 2013 the method was altered to
showing options on screen in random order. It is possible this has affected the way
respondents answer, but the effect is likely to be, in our view, no more than marginal. While
“happy with current supplier” is the principal explanation still, mentions of this are down 23
6 2011 wording: I don’t think there is much difference
7 2011 wording: ...and I think I’m already on a good deal
8 2011 wording: I live in a rented house and I don’t think my landlord would allow me to switch

23
© 2013 Ipsos MORI.
points since last year, after having been unchanged since 2011. Since no other responses
show such variation it is more likely this is a real change in opinion, rather than simply a
result of altering the questioning method.
At the same time the proportion who believe “switching is a hassle” is up seven points,
differing substantially from the last two surveys. There are also increasing indications that
consumers feel there is no point in switching – the proportion who believe “there isn’t any
difference between supplier to make switching worthwhile” is up four points and those who
say they have checked prices and believe they are on the best deal are up three points,
though both remain fairly low in absolute terms. While only 6% say they are “unsure where to
get information to help me make a good choice”, this does represent a four-point rise from
last year.
Those most likely to be happy with their current supplier are the 65+ age group, the AB social
grades and those who do not rent their homes. The 65+ age group also show most
scepticism about the differences between suppliers.

24
© 2013 Ipsos MORI.
Q36. What would be the minimum amount of money you would have to save per year in order for it to encourage you to switch your gas or electricity supplier?
Total Age Social grade Internet Access All 15-34 35-64 65+ AB C1 DE Yes No 2012
Base: All never switched supplier giving numerical answer
(419) %
(96) %
(214) %
(109) %
(78) %
(131) %
(111) %
(345) %
(74) %
(412) %
0-£50 28 39 21 34 20 30 36 27 34 23
£51-100 31 36 27 35 30 32 31 29 46 30
£101-£200 26 17 33 18 31 27 19 27 17 26
£201+ 15 8 19 13 19 11 15 17 3 20
MEAN £153 £116 £173 £148 £168 £136 £140 £162 £95 £167
Base: All never switched supplier
(882) %
(943)
%
Not about saving money
12 5 12 19 12 10 13 10 20 15
Don’t know 36 37 33 42 32 32 40 34 42 35
Refused 2 2 2 2 2 1 3 2 2 2
Source: Ipsos MORI
Half of non-switchers are able to give an approximate minimum that they would want to save
per year that would encourage them to switch supplier. Among these, the mean required
saving is £153 per year, which represents a slight fall compared to last year’s figure. Most
(59%) state the minimum saving as up to £100 a year. The 35-64 age group have the highest
expectations of savings. The same is true of the AB social grades. The lowest expectations
are found among those with no internet access (£95) and those in Scotland, for whom the
mean is £87, compared to £162 in England and £160 in Wales.
The group who state it is “not about saving money” is slightly smaller this year (12%). They
are composed disproportionately of rural consumers, those with no internet access, standard
credit consumers and the 65+ age group.
25
© 2013 Ipsos MORI.
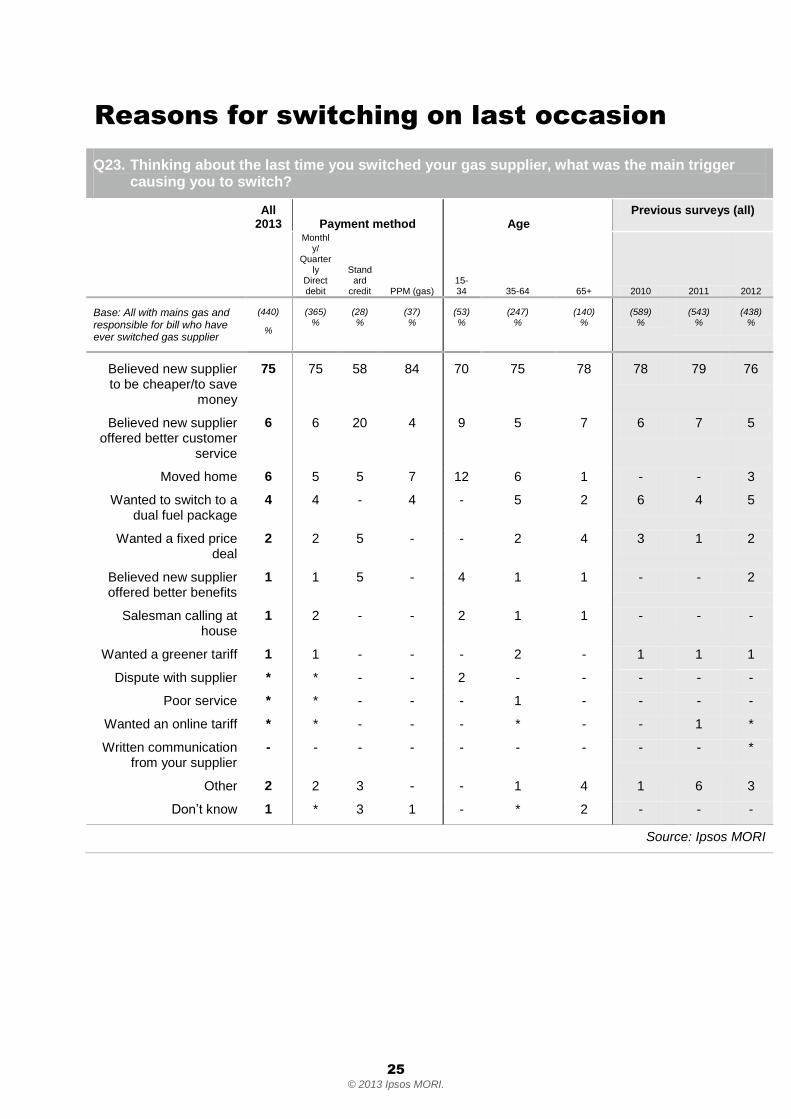
Reasons for switching on last occasion
Q23. Thinking about the last time you switched your gas supplier, what was the main trigger causing you to switch?
All 2013 Payment method
15-34
Age Previous surveys (all)
Monthly/
Quarterly
Direct debit
Standard
credit PPM (gas) 35-64 65+ 2010 2011 2012
Base: All with mains gas and responsible for bill who have ever switched gas supplier
(440)
%
(365) %
(28) %
(37) %
(53) %
(247) %
(140) %
(589) %
(543) %
(438) %
Believed new supplier to be cheaper/to save
money
75 75 58 84 70 75 78 78 79 76
Believed new supplier offered better customer
service
6 6 20 4 9 5 7 6 7 5
Moved home 6 5 5 7 12 6 1 - - 3
Wanted to switch to a dual fuel package
4 4 - 4 - 5 2 6 4 5
Wanted a fixed price deal
2 2 5 - - 2 4 3 1 2
Believed new supplier offered better benefits
1 1 5 - 4 1 1 - - 2
Salesman calling at house
1 2 - - 2 1 1 - - -
Wanted a greener tariff 1 1 - - - 2 - 1 1 1
Dispute with supplier * * - - 2 - - - - -
Poor service * * - - - 1 - - - -
Wanted an online tariff * * - - - * - - 1 *
Written communication from your supplier
- - - - - - - - - *
Other 2 2 3 - - 1 4 1 6 3
Don’t know 1 * 3 1 - * 2 - - -
Source: Ipsos MORI

26
© 2013 Ipsos MORI.
Q28. Thinking about the last time you switched your electricity supplier, what was the main trigger causing you to switch?
All 2013
Payment Method Age Previous surveys (all)
Monthly/Quarterly
direct debit
Stand ard
credit
PPM (elec)
15-34 35-64 65+ 2010 2011 2012
Base: All with mains electricity and responsible for bill who have ever switched gas supplier
(510) %
(362) %
(30) %
(57) %
(60) %
(279) %
(171) %
(633) %
(587) %
(499) %
Believed new supplier to be
cheaper/to save money
76 77 54 84 66 77 78 77 77 77
Moved home 5 4 5 12 13 5 1 - - 3
Believed new supplier offered better customer
service
5 4 22 2 6 4 7 6 5 5
Wanted a dual fuel package
4 4 6 - 2 5 3 7 5 5
Wanted a fixed price deal
2 2 5 2 1 3 2 4 2 1
Wanted a greener tariff
1 2 - - 2 2 - 1 2 *
Believed new supplier offered better benefits
1 1 5 - 2 1 - - - 2
Salesman calling at house
1 1 - - 2 1 1 - -
Dispute with supplier 1 1 - - 2 1 1 - -
Poor service 1 1 - - 2 * 1 - -
Written communication from
your supplier
* * - - - * 1 - - *
Other 2 1 2 - 2 1 4 1 6 2
Don’t know * * 3 1 - * 1 - - -
Source: Ipsos MORI
The pattern of reasons given for switching shows very little change again this year, for either
fuel. Saving money continues to dominate as the chief motivator.

27
© 2013 Ipsos MORI.
Finding out about the deals available
Q24. Thinking about the last time you switched your gas supplier, how did you find out about the deals offered by the supplier you switched to?
All
2013 Social Grade Age
Physical/ Mental Impair ment
Internet Access
Previous surveys (all)
AB E 15-34 35-64 65+ Yes No Yes No 2010 2011 2012
Base: All with mains gas and responsible for bill who have ever switched gas supplier
(440) %
(118) %
(41) %
(53) %
(247) %
(140) %
(74) %
(366) %
(392) %
(48) %
(589) %
(543) %
(438) %
Online/website price comparison service
35 40 11 39 38 25 20 38 37 11 26 21 34
Supplier representative knocked at my door
19 13 48 7 19 25 24 18 18 29 33 31 23
Salesperson in public place
7 4 6 11 7 4 7 7 7 6 7 7 10
Looked at websites of more than one supplier
7 10 - 9 7 4 9 6 7 - 4 3 3
Friend or family member
6 1 4 17 3 5 6 6 5 13 7 6 6
New supplier phoned me
5 4 13 1 4 8 5 5 4 13 8 7 6
I rang them (only) 4 3 2 3 3 6 5 3 4 3 2 3 4
Phoned comparison service
4 5 1 2 3 6 - 4 3 5 4 7 4
I rang them and other suppliers
3 3 5 - 4 4 3 3 3 7 1 2 3
Looked at supplier’s own website only
3 5 3 3 3 2 2 3 3 - 1 4 3
I saw an advert 3 2 1 3 2 4 5 2 3 4 5 4 2
Written communication or marketing material
1 * 1 - 1 3 4 1 1 2 - - 1
Through a collective (group) switching
campaign
1 3 2 1 1 3 1 1 2 - - - -
Other 7 8 8 10 7 5 8 7 7 5 5 5 4
Don’t know 2 3 - 2 2 3 3 2 2 2 3 4 4
Source: Ipsos MORI
28
© 2013 Ipsos MORI.
Q29. Thinking about the last time you switched your electricity supplier, how did you find out about the deals offered by the supplier you switched to?
All
2013 Social Grade Age
Physical/ Mental
Impair- ment
Internet Access
Previous surveys (all)
AB E 15-34 35-64 65+ Yes No Yes No 2010 2011
2012
Base: All with mains electricity and responsible for bill who have ever switched electricity supplier
(510) %
(188) %
(47) %
(60) %
(279) %
(171) %
(84) %
(426) %
(453) %
(57) %
(633) %
(583) %
(499) %
Online/website price comparison service
37 45 11 39 43 22 26 39 40 12 27 24 31
Supplier representative knocked at my door
17 11 41 9 18 19 21 16 16 19 34 29 22
Salesperson in public place
7 5 8 11 6 6 11 6 7 6 6 7 7
Friend or family member
6 3 5 15 3 9 7 6 5 23 7 6 5
I rang them (only) 5 4 4 4 5 5 6 5 5 3 2 4 4
Looked at the websites of more than one
supplier
5 8 - 8 4 4 4 5 5 - 3 2 3
New supplier phoned me
4 4 7 - 4 7 2 4 3 11 8 9 8
Phoned comparison service
4 3 1 2 4 5 3 4 4 6 3 5 5
I rang them and other suppliers
4 3 10 3 4 4 3 4 4 6 2 2 3
I saw an advert 3 4 - 6 2 5 4 3 3 3 4 5 5
Written communication or marketing material
3 4 5 2 2 4 6 2 3 3 1
Looked at supplier’s own website
2 2 3 1 1 3 - 2 2 - 2 4 4
Through a collective (group) switching
campaign
1 2 2 - 1 1 1 1 1 - - - -
Other 7 6 6 11 5 9 7 6 7 4 6 5 3
Don’t know 2 - 2 2 4 2 2 2 5 2 4 3
Source: Ipsos MORI

29
© 2013 Ipsos MORI.
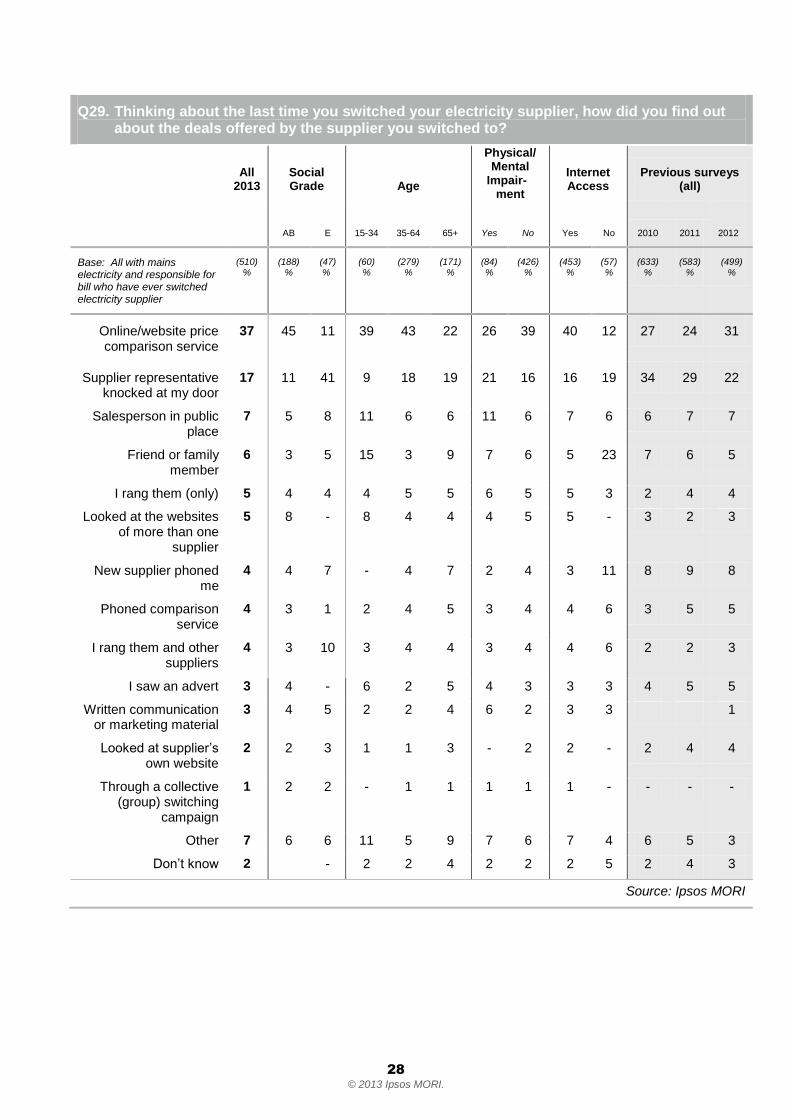
There are continuations of some of the trends identified last year with regard to how
switchers found out about the deals available. The use of online price comparison websites
continues to grow for both fuels. At the same time the influence of salespersons continues to
lessen, both on the doorstep and in other places. The source of information that shows a
notable, though as yet small, increase in influence is looking at the websites of many
suppliers. Collective switching schemes, included for the first time this year, have not yet
made an impression on the market.
Use of online price comparison websites is significantly lower for the 65+ age group, and
they significantly more likely to use doorstep salespersons (in the case of gas only. For
electricity there is no significant difference from the 35-64 age group on this latter measure).
A similar pattern emerges for those with a disability, and there is a relationship with social
grade. Those graded AB and C1 are more likely to use online price comparison sites than
other social grades, especially social grade E, while the DE grades are significantly more
likely to use doorstep sales persons.
Having no internet access oneself is not always a barrier to using online price comparison
services; 11% of gas switchers with no internet access, and 12% of electricity switchers with
no internet access used comparison sites to find out about the deals available. However,
switchers with no access to the internet did not look at any other supplier websites.

30
© 2013 Ipsos MORI.
Method used to make the last switch
Q25. Thinking about the last time you switched your gas supplier, how did you switch?
All
2013 Payment Method Age
Social Grade
Internet Access
Previous
survey (all)
Monthly/Quarterly
Direct Debit
Standard
credit 15-34 35-64 65+ AB DE Yes No 2012
Base: All with mains gas and responsible for bill who have ever switched gas supplier
(440) %
(365) %
(37) %
(53) %
(247) %
(140) %
(133) %
(84) %
(392) %
(48) %
(438) %
Phoning supplier 29 29 32 35 27 30 29 25 28 37 24
Online/website price comparison service
26 28 6 25 31 11 32 12 28 3 27
Through a salesperson who knocked at my door
19 17 27 10 19 24 12 33 18 34 24
Through salesperson in public place
7 6 5 13 7 3 6 10 7 4 7
Through the supplier’s website
5 5 - 6 4 4 7 3 5 - 4
Telephone price comparison service
4 4 8 - 5 5 4 7 4 7 5
Written communications 2 2 - - 2 5 2 - 2 2 1
Through a collective (group) switching
campaign
1 1 - - 1 2 2 - 1 - -
Other 5 5 12 10 3 8 3 8 3 2 7
Source: Ipsos MORI

31
© 2013 Ipsos MORI.
Q30. Thinking about the last time you switched your electricity supplier, how did you switch?
All
2013
Payment Method
Age Social Grade Internet Access
Previous survey
(all)
Monthly/Quarterly
Direct Debit
Standard
credit 15-34 35-64 65+ AB DE Yes No 2012
Base: All with mains electricity and responsible for bill who have ever switched electricity supplier
(510) %
(414) %
(30) %
(60) %
(279) %
(171) %
(156) %
(99) %
(453) %
(57) %
(499) %
Phoning supplier 29 29 42 33 26 35 29 26 28 46 30
Online/website price comparison service
26 29 10 24 32 13 31 12 28 6 25
Through a salesperson who
knocked at my door
17 15 19 7 18 19 12 31 17 19 23
Through salesperson in
public place
7 6 6 15 5 6 4 8 6 9 7
Telephone price comparison service
3 3 7 1 4 3 2 6 3 3 5
Through supplier’s website
6 7 4 6 7 5 10 3 7 - 4
Written communications
3 3 - - 2 5 4 3 3 5 2
Through a collective (group) switching
campaign
1 1 - - 1 2 2 - 1 3 -
Other 5 4 9 13 3 6 3 10 5 9 4
Source: Ipsos MORI
Doorstep salespersons continue to decline as the final means of making switches, though
salespersons in public places also have a (minor) role. Switchers report they are most likely
to phone the new supplier to make the switch, though using online price comparison
websites is a close second.
Phoning the supplier is more popular amongst those on standard credit and with no internet
access. Among gas switchers it is also more popular among the 15-34 age group. Use of
price comparison websites is preferred by the AB social grades and those on direct debit.
Doorstep salespersons are more likely to have a role in the case of the DE social grades, the
65+ age group and those on standard credit.

32
© 2013 Ipsos MORI.
Expectations of savings on switching
Q37. On the last occasion when you decided to switch your supplier, how much did you expect to save per year?
All giving a numerical
answer in 2013 Age Social Grade Previous survey
(all)
15-34 35-64 65+ AB E 2012
Base: all ever switched giving numerical answer
(261) %
(36) %
(149) %
(76) %
(71) %
(20) %
(264) %
0-£50 16 16 14 21 16 6 13
£51-£100 35 33 34 41 32 47 29
£101-£200 34 38 35 30 38 22 37
£201+ 15 14 17 9 15 24 21
MEAN £195 £156 £229 £125 £166 £201 £173
Base: All ever switched either fuel
(551) %
(65) %
(302) %
(184) %
(170) %
(52) %
(550) %
Not about saving money
11 14 12 6 14 15 8
Don’t know 40 29 38 52 44 40 42
Source: Ipsos MORI
As in the previous survey, about half of all who have ever switched supplier are able to
estimate how much they expected to save per year and 40% did not know. On average they
expected to save £195, which is a little more than estimated last year (£173). Around half of
those giving answers (49%) expect to save over £100; 84% expect to save over £50. Sample
sizes of sub-groups are mostly too small to show decisive differences; small sample sizes
can give rise to widely varying average figures.
Fifty-one percent of switchers are unable to give an estimate of their expectations, which
includes 11% who said it was “not about saving money”. This proportion is up three points
since 2012, though this is not a significant increase.
33
© 2013 Ipsos MORI.
Customers’ evaluation of switching
Q26. To the best of your knowledge, do you feel that you are now paying less than you would have if you had not switched? (gas)
All
2013 Area
Previous surveys (all)
Urban Sub
urban Rural 2010 2011 2012
Base: All who switched gas supplier to save money
(328) %
(135) %
(93) %
(100) %
(461) %
(432) %
(336) %
Yes 68 64 63 79 64 62 72
No 19 23 16 17 14 12 17
Don’t know 13 13 21 4 22 26 11
Source: Ipsos MORI
Q31. To the best of your knowledge, do you feel that you are now paying less than you would have if you had not switched? (electricity)
All
2013 Area Previous surveys (all)
Urban Sub urban
Rural 2010 2011 2012
Base: All who switched electricity supplier to save money
(384) %
(146) %
(112) %
(126) %
(491) %
(461) %
(387) %
Yes 70 66 68 76 67 64 73
No 20 24 15 20 12 11 13
Don’t know 10 10 16 4 21 25 14
Source: Ipsos MORI
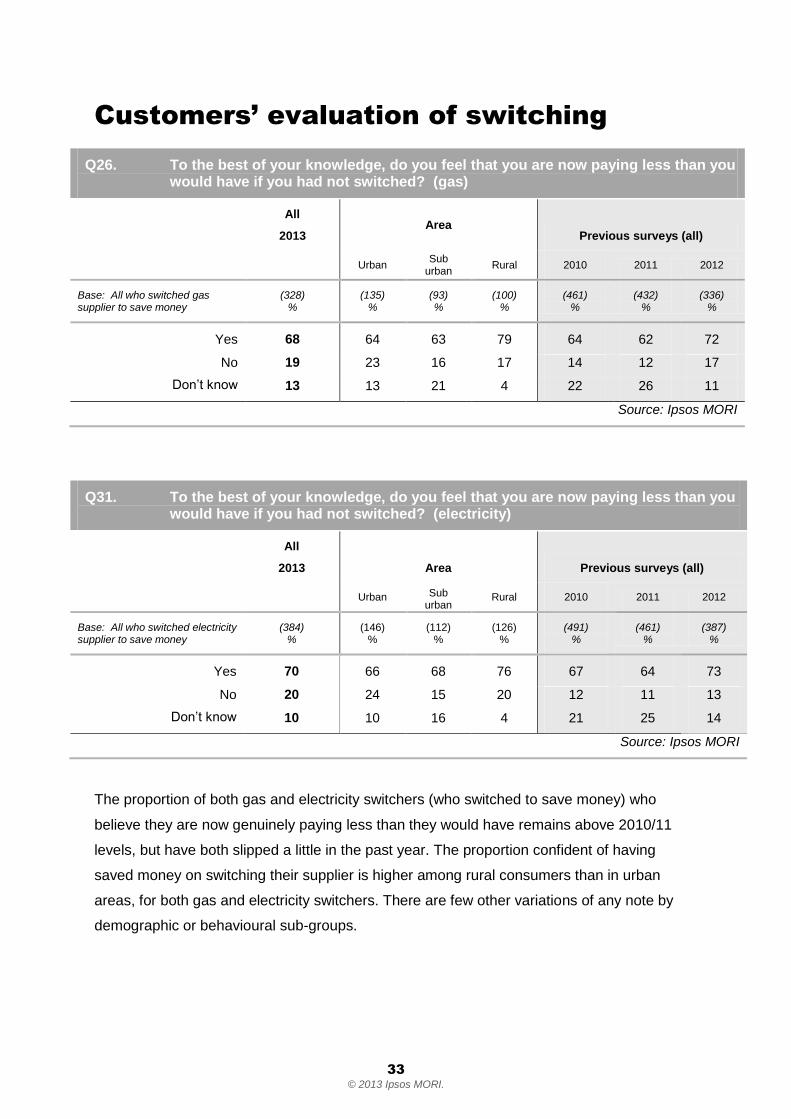
The proportion of both gas and electricity switchers (who switched to save money) who
believe they are now genuinely paying less than they would have remains above 2010/11
levels, but have both slipped a little in the past year. The proportion confident of having
saved money on switching their supplier is higher among rural consumers than in urban
areas, for both gas and electricity switchers. There are few other variations of any note by
demographic or behavioural sub-groups.

34
© 2013 Ipsos MORI.
Q27-1. How much do you agree or disagree that:
“I found it easy to decide which deal to switch my gas to”
All
2013 Area
Previous surveys (all)
Urban Rural 2010 2011 2012
Base: All with mains gas and responsible for bills who have ever switched gas supplier
(440) %
(185) %
(136) %
(589) %
(543) %
(438) %
Agree 69 64 70 72 77 72
Neither 11 11 13 13 8 9
Disagree 19 24 17 14 13 17
No opinion/ Don’t know
* 1 - 1 2 2
Source: Ipsos MORI
Q32-1. How much do you agree or disagree that:
“I found it easy to decide which deal to switch my electricity to”
All
2013 Area
Previous surveys (all)
Urban Rural 2010 2011 2012
Base: All with mains electricity and responsible for bills who have ever switched electricity supplier
(510) %
(198) %
(175) %
(633) %
(587) %
(499) %
Agree 68 68 66 75 77 75
Neither 12 10 13 11 8 7
Disagree 19 21 20 13 12 16
No opinion/ Don’t know
* 1 - 1 2 2
Source: Ipsos MORI
While a majority continue to agree it was easy to decide which deal to switch to, this year’s
figures show a decline in this proportion (in the case of gas switchers, down three points) and
especially electricity switchers (down seven points) and disagreement has increased
marginally in both cases.
35
© 2013 Ipsos MORI.
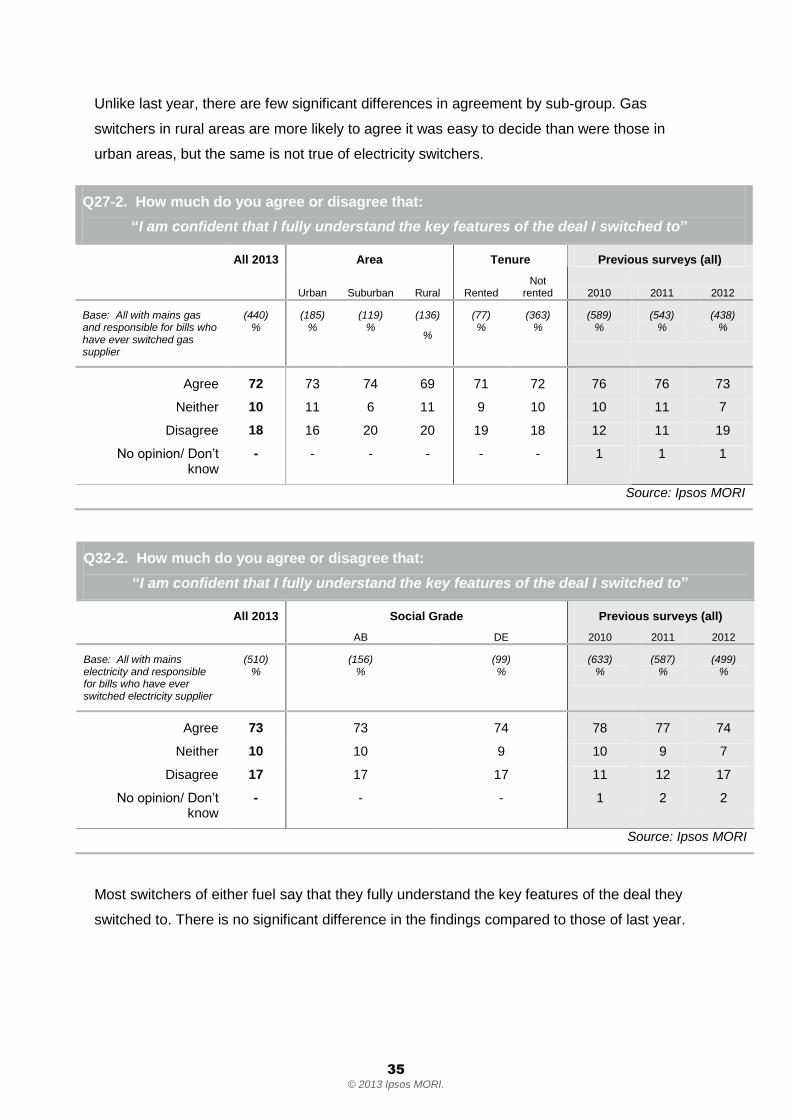
Unlike last year, there are few significant differences in agreement by sub-group. Gas
switchers in rural areas are more likely to agree it was easy to decide than were those in
urban areas, but the same is not true of electricity switchers.
Q27-2. How much do you agree or disagree that:
“I am confident that I fully understand the key features of the deal I switched to”
All 2013 Area Tenure Previous surveys (all)
Urban Suburban Rural Rented
Not rented 2010 2011 2012
Base: All with mains gas and responsible for bills who have ever switched gas supplier
(440) %
(185) %
(119) %
(136)
%
(77) %
(363) %
(589) %
(543) %
(438) %
Agree 72 73 74 69 71 72 76 76 73
Neither 10 11 6 11 9 10 10 11 7
Disagree 18 16 20 20 19 18 12 11 19
No opinion/ Don’t know
- - - - - - 1 1 1
Source: Ipsos MORI
Q32-2. How much do you agree or disagree that:
“I am confident that I fully understand the key features of the deal I switched to”
All 2013 Social Grade Previous surveys (all)
AB DE 2010 2011 2012
Base: All with mains electricity and responsible for bills who have ever switched electricity supplier
(510) %
(156) %
(99) %
(633) %
(587) %
(499) %
Agree 73 73 74 78 77 74
Neither 10 10 9 10 9 7
Disagree 17 17 17 11 12 17
No opinion/ Don’t know
- - - 1 2 2
Source: Ipsos MORI
Most switchers of either fuel say that they fully understand the key features of the deal they
switched to. There is no significant difference in the findings compared to those of last year.

36
© 2013 Ipsos MORI.
Variations by sub-group this year show no significant differences, even on criteria that were
notable last year, such as social grade and home tenure.
Q27-3. How much do you agree or disagree that:
“I would be confident that if I switched again, I would make the right choice for me”
All 2013 Age
Social Grade Internet Previous survey (all)
15-34 35-64 65+ AB DE Yes No 2012
Base: All with mains gas and responsible for bills who have ever switched gas supplier
(440) %
(53) %
(247) %
(140) %
(133) %
(84) %
(392) %
(48) %
(438) %
Agree 70 71 70 72 68 70 71 65 71
Neither 15 19 16 9 14 22 15 14 9
Disagree 14 10 14 18 17 8 14 21 18
No opinion/ Don’t know
* - - 1 - - * - 2
Source: Ipsos MORI
Q32-3. How much do you agree or disagree that:
“I would be confident that if I switched again, I would make the right choice for me”
All 2013 Age
Social Grade Internet access Previous survey (all)
15-34 35-64 65+ AB DE Yes No 2012
Base: All with mains electricity and responsible for bills who have ever switched electricity supplier
(510) %
(60) %
(279) %
(171) %
(156) %
(99) %
(453) %
(57) %
(499) %
Agree 72 74 73 69 73 69 72 71 74
Neither 13 13 12 16 13 17 13 18 8
Disagree 15 13 15 15 14 13 15 10 17
No opinion/Don’t know
- - - - - - - - 2
Source: Ipsos MORI

37
© 2013 Ipsos MORI.
Seven in ten switchers of either fuel are confident that they would make the right choice for
them if they switched again. This is highly consistent with last year’s findings, with no sign of
improvement. Only about one in seven disagree; in the case of gas these are more likely to
be older people (65+) and those with no internet access, though among electricity switchers
the pattern is contradictory – in particular those with internet access appear to be less
confident of making the right choice next time.

38
© 2013 Ipsos MORI.
Attitudes to tariff choices
Q39. Using the answers here, how easy or difficult do you believe it is to compare different tariffs for electricity or gas?
All 2013 Age Internet access Physical/Mental Impairment
15-34 35-64 65+ Yes No Yes No
Base: All with mains electricity or gas and responsible for bills
(1,433) %
(243) %
(717) %
(473) %
(1151) %
(282) %
(272) %
(1161) %
Very easy 13 13 15 12 15 7 13 4
Fairly easy 23 33 22 18 25 15 16 24
Neither easy nor difficult
24 26 21 27 22 31 21 24
Fairly difficult 22 14 24 23 21 24 22 22
Very difficult 15 10 15 20 15 19 24 14
Don’t know 3 3 3 2 2 3 4 2
Source: Ipsos MORI
The issue of confusion over energy tariffs is a key component of the Retail Market Review.
This survey finds energy consumers evenly split on the perceived difficulty of comparing
different tariffs: 37% find it very or fairly easy while 37% find it very/fairly difficult; the
remainder are undecided. Perception of difficulty is apparently related to age: 46% of the 15-
34 age group find it easy compared to just 29% of the 65+ group. In fact, among all those
aged over 34 years of age, tariff comparison is more likely to be judged difficult than easy.
There are also strong differences by internet access – those with internet access find
comparison easy on balance (39% easy; 36% difficult), while those without find it more
difficult (easy 23%; difficult 44%). Similarly those with long-term physical or mental disability
are more likely to find it difficult. Consumers in Scotland are more likely to judge it difficult
(46%) than those in England (36%).
The relationship with social grade, however, is not so clear: while social grade D finds
comparison most difficult, the AB group also finds it, on balance, more difficult than easy.

39
© 2013 Ipsos MORI.
By consumer typology9 (see appendix) the Lapsed Engaged and Recently Engaged, groups
who have previously switched supplier, are more likely than the Disengaged and Partially
Engaged, on balance, to find comparison difficult.
Q40. What is it that makes them difficult to compare?
All Social Grade Internet access Tenure
AB C2 E Yes No Rented Not
Rented
Base: All those who answered ‘very/fairly difficult’ at OG39
(530) %
(141) %
(98) %
(62) %
(410) %
(120) %
(130) %
(400) %
Confusing tariffs/information/
difficult to understand/complicated/
Don’t know how to compare (net)
40 39 44 47 40 43 47 39
Too many tariffs/
multiple rates/ structures/ choices
23
27
26
7
25
13
15
25
Hard to compare like for like/ Not standardised information/ different
deals/ prices in different formats
17
27
8
3
20
5
6
20
Too much jargon/ technical language/
terminology used
8 4 9 14 9 8 13 7
Do not keep to price promised/ hidden costs/
misleading/incorrect/ conflicting info/ not
transparent/ honest (net)
7 6 9 2 7 5 4 7
Not enough information 5 5 5 5 6 2 5 5
Not computer literate/ not financially minded/
too many numbers/ suffer from dyslexia
(net)
3 3 6 4 3 5 1 4
Other 8 9 5 10 8 9 6 9
Don’t know 6 2 7 7 4 13 12 4
Source: Ipsos MORI
9 The analysis shows consumers divided into four typologies based on their switching of supplier, tariff or
payment method: Disengaged, Partially engaged, Lapsed engaged and Recently engaged

40
© 2013 Ipsos MORI.
Those (37%) who rated comparison of tariffs as difficult were asked what it is that makes
them difficult. Many (40%) are unable to articulate more than the general view that tariffs are
too complicated, confusing or not clear, without further elaboration. Of the more specific
issues, the main observation (by 23%) is that there are simply too many tariffs or choices.
Also important is the problem of comparison, which is explained by some in terms of it being
hard to compare like with like, and by a need for more standardised information and formats
(17% mention this). This is disproportionately mentioned by social grade AB. A few people
(8%) mention the jargon or technical language as a barrier to understanding. Some 7% see
the problem more in terms of trust of the suppliers than comprehension of the information –
for example they see it as misleading or dishonest. The proportion who “blame themselves”
for not understanding is very low (3%); they cite issues such as a lack of computer literacy or
dyslexia.
Q41. Thinking about the number of different tariffs available to you, in your view, are there the right number of energy tariffs available, or are there too many tariffs or too few tariffs?
All Social Grade Nation Tenure
AB C2 E England Scotland Wales Rented Not
rented
Base: All those with mains electricity or gas who are responsible for bills
(1,433) %
(330) %
(328) %
(175) %
(1208) %
(148) %
(77) %
(407) %
(1026) %
The right number of tariffs
20 19 17 20 20 22 15 19 20
Too many tariffs 62 63 67 50 61 59 79 55 64
Too few tariffs 5 5 5 6 6 1 4 7 4
Don’t know 14 13 12 23 14 18 2 19 12
Source: Ipsos MORI
The specific issue of the number of energy tariffs on the market was highlighted
spontaneously as important. When asked about this, two-thirds of energy consumers are not
happy with the number available, the vast majority of these (62%) believing there are too
many and just 5% saying there are too few. While the state-supported social grade E are
more likely to give a don’t know answer, it is the C2 social grade (skilled manual workers)
who are most likely to believe there are too many tariffs. This view is also most prevalent in
Wales, though the sample size there is inconclusive. Those not in rented accommodation are
more likely to believe there are too many tariffs, while those in rented accommodation show
41
© 2013 Ipsos MORI.
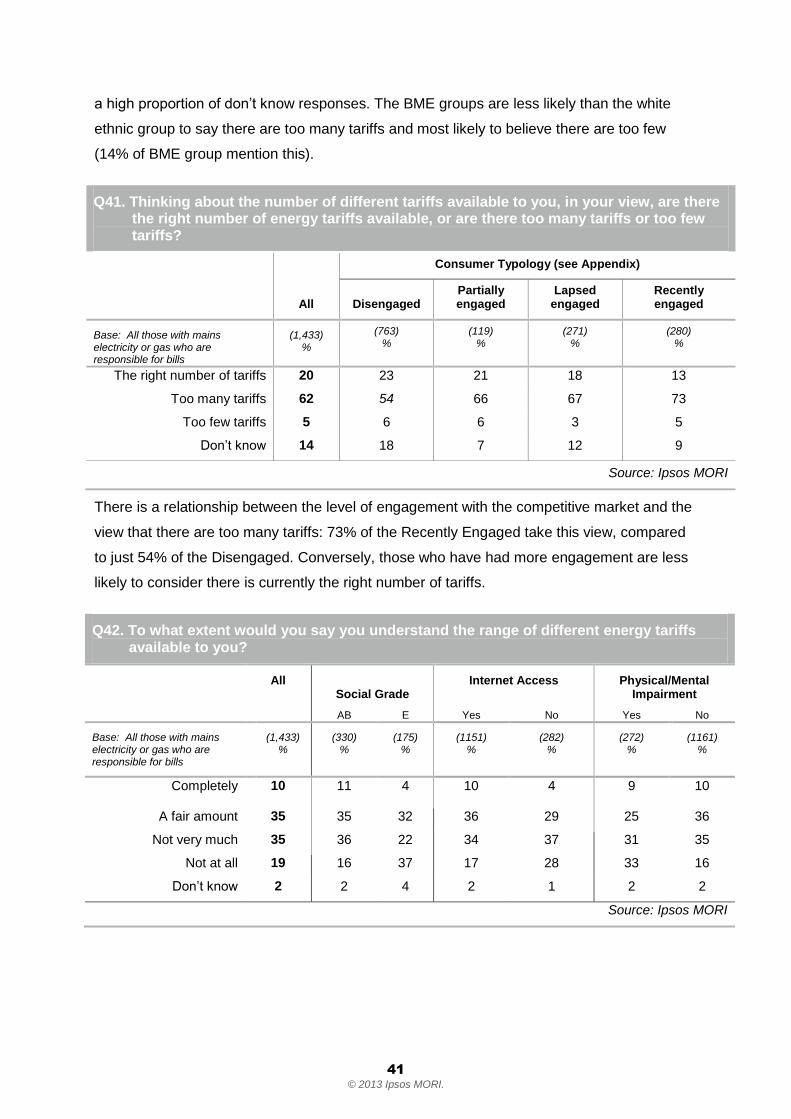
a high proportion of don’t know responses. The BME groups are less likely than the white
ethnic group to say there are too many tariffs and most likely to believe there are too few
(14% of BME group mention this).
Q41. Thinking about the number of different tariffs available to you, in your view, are there the right number of energy tariffs available, or are there too many tariffs or too few tariffs?
All
Consumer Typology (see Appendix)
Disengaged Partially engaged
Lapsed engaged
Recently engaged
Base: All those with mains electricity or gas who are responsible for bills
(1,433) %
(763) %
(119) %
(271) %
(280) %
The right number of tariffs 20 23 21 18 13
Too many tariffs 62 54 66 67 73
Too few tariffs 5 6 6 3 5
Don’t know 14 18 7 12 9
Source: Ipsos MORI
There is a relationship between the level of engagement with the competitive market and the
view that there are too many tariffs: 73% of the Recently Engaged take this view, compared
to just 54% of the Disengaged. Conversely, those who have had more engagement are less
likely to consider there is currently the right number of tariffs.
Q42. To what extent would you say you understand the range of different energy tariffs available to you?
All Social Grade
Internet Access Physical/Mental Impairment
AB E Yes No Yes No
Base: All those with mains electricity or gas who are responsible for bills
(1,433) %
(330) %
(175) %
(1151) %
(282) %
(272) %
(1161) %
Completely 10 11 4 10 4 9 10
A fair amount 35 35 32 36 29 25 36
Not very much 35 36 22 34 37 31 35
Not at all 19 16 37 17 28 33 16
Don’t know 2 2 4 2 1 2 2
Source: Ipsos MORI

42
© 2013 Ipsos MORI.
When asked to rate their own level of understanding of the range of tariffs available only 10%
of energy consumers say they understand completely. Just under half (44%) understand
completely or a fair amount and just over half (54%) say not very much or not at all. Overall
one in five (19%) say “not at all”, rising to 24% among those in rented accommodation, 28%
among those with no internet access, 33% among those with a disability and 37% among
social grade E. Overall, we can point to an association between indices of vulnerability and
poor understanding of the range of tariffs.
Q42. To what extent would you say you understand the range of different energy tariffs available to you?
All
Consumer Typology (see Appendix)
Disengaged Partially engaged
Lapsed engaged
Recently engaged
Base: All those with mains electricity or gas who are responsible for bills
(1,433) %
(763) %
(119) %
(271) %
(280) %
Completely 10 8 12 10 12
A fair amount 35 32 39 34 39
Not very much 35 33 38 38 35
Not at all 19 23 11 17 14
Don’t know 2 4 0 1 0
Source: Ipsos MORI
Engagement with the market also affects reported understanding of the range of different
tariffs available. Just over half (51%) of both the Recently Engaged and the Partially
Engaged feel they understand the range of tariffs completely or a fair amount. This
compares to just 40% of the Disengaged and 44% of the Lapsed Engaged group.
43
© 2013 Ipsos MORI.
Information and communication received
from suppliers
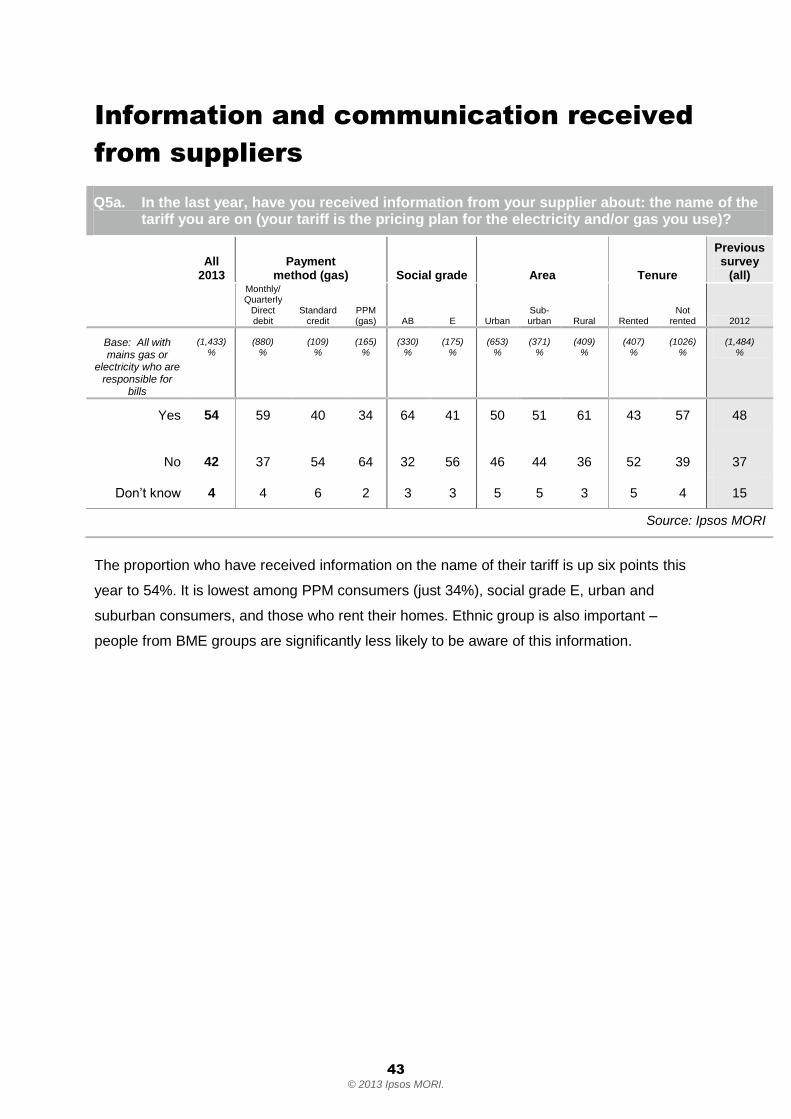
Q5a. In the last year, have you received information from your supplier about: the name of the tariff you are on (your tariff is the pricing plan for the electricity and/or gas you use)?
All 2013
Payment method (gas) Social grade Area Tenure
Previous survey
(all) Monthly/
Quarterly Direct debit
Standard credit
PPM (gas) AB E Urban
Sub-urban Rural Rented
Not rented 2012
Base: All with mains gas or
electricity who are responsible for
bills
(1,433) %
(880) %
(109) %
(165) %
(330) %
(175) %
(653) %
(371) %
(409) %
(407) %
(1026) %
(1,484) %
Yes
54 59 40 34 64 41 50 51 61 43 57 48
No 42 37 54 64 32 56 46 44 36 52 39 37
Don’t know 4 4 6 2 3 3 5 5 3 5 4 15
Source: Ipsos MORI
The proportion who have received information on the name of their tariff is up six points this
year to 54%. It is lowest among PPM consumers (just 34%), social grade E, urban and
suburban consumers, and those who rent their homes. Ethnic group is also important –
people from BME groups are significantly less likely to be aware of this information.

44
© 2013 Ipsos MORI.
Q5b. In the last year, have you received information from your supplier about: any changes to your tariff?
All 2013
Payment method (gas) Social grade Tenure Internet
Previous survey (all)
Monthly/Quarterly
Direct debit
Stand ard
credit PPM (gas) AB C1 DE
Rented
Not rented Yes No 2012
Base: All with mains gas or
electricity who are responsible for
bills
(1,433) %
(880) %
(109) %
(165) %
(330) %
(407) %
(368) %
(407) %
(1026) %
(1,151) %
(282) %
(1,484) %
Yes 40 43 33 23 50 44 29 30 44 43 25 40
No 56 52 63 75 44 52 68 65 52 53 72 48
Don’t know 4 5 3 2 5 5 3 4 4 4 3 12
Source: Ipsos MORI
The proportion saying they are aware of receiving information about changes to their tariff is
unchanged at 40%. As last year, awareness is higher among those on direct debit, those
from ABC1 social grades, those with internet access and those who do not rent their homes.
Q5c. In the last year, have you received information from your supplier about: the forecast cost of your energy consumption over the coming year?
All 2013
Payment method (gas)
Social grade
Internet access
Area Tenure
Previous
survey (all)
Monthly/Quarterly
Direct debit
Stand ard
credit PPM (gas) AB DE Yes No Urban Rural
Rent ed
Not rented
2012
Base: All with mains gas or electricity
who are responsible for bills
(1,433) %
(880) %
(109) %
(165) %
(330) %
(368) %
(1151) %
(282) %
(653) %
(409) %
(407)
%
(1026)
%
(1484)
%
Yes 47 50 50 33 51 41 49 38 43 51 38 50 44
No 48 46 46 64 43 56 46 59 53 45 57 45 43
Don’t know 4 5 4 3 6 3 5 2 4 4 4 4 13
Source: Ipsos MORI

45
© 2013 Ipsos MORI.
While awareness of receiving information about their own forecasted energy consumption is
up three points, this is not a statistically significant improvement over last year. Only among
the AB social grade does the proportion reach a small majority. Awareness of this is low
among PPM consumers, social grade DE, those without internet access and those who rent
their homes. Those in rural areas are significantly more likely to recall receiving information
about their own forecast consumption than those in urban areas.
Attitudes to specific communications
Q43. Please tell me if you recall receiving any of the following in the last year? You may have received these via post or email.
All Age Social Grade Tenure
15-34 35-64 65+ AB C2 DE Rented Not rented
Base: All those with mains electricity or gas who are responsible for bills
(1,433) %
(243) %
(717) %
(473) %
(330) %
(328) %
(368) %
(407) %
(1026) %
An annual statement
Yes 63 55 66 62 69 55 57 54 66
No 34 42 30 35 27 42 39 43 30
Don’t know
4 3 4 3 4 3 4 3 4
At least one bill or statement of
account
Yes 80 70 83 84 88 75 73 70 84
No 18 28 16 14 11 24 26 29 15
Don’t know
1 2 1 2 1 2 1 1 2
Base: All not on a fixed term contract for both electricity and gas
(842)
% (155)
% (429)
% (258)
% (196)
% (178)
% (247)
% (263)
% (579)
%
A price increase notification letter
Yes 62 54 64 63 67 54 56 50 66
No 34 43 30 33 29 41 40 45 29
Don’t know
5 2 6 4 4 5 4 5 5
Base: All on fixed term for at least one fuel
(762)
% (115)
% (360)
% (287)
% (170)
% (185)
% (177)
% (195)
% (567)
%
An end of fixed term letter
Yes 32 26 32 35 38 36 27 24 34
No 66 71 66 64 62 62 68 75 64
Don’t know
2 3 2 2 1 2 4 2 2
Source: Ipsos MORI

46
© 2013 Ipsos MORI.
Bills or statements of account are the most widely recalled communications - by 80% of
energy consumers (88% among social grade AB). This falls to just 65% of social grade E,
and 57% of the BME ethnic group. Among PPM consumers it is 59% for gas and 61% for
electricity.
Just 63% remember receiving an annual statement, falling to 50% of social grade E and 42%
of the BME ethnic group.
Among those not on fixed term tariffs for both fuels, 62% recall receiving a price increase
notification letter (it is likely that all will have seen increased prices in the last year, if they
have been with their supplier long enough). The proportion is very low for social grade E
(50%) those in rented accommodation (50%), those from BME groups (49%) and those on
PPMs (45% for gas; 52% for electricity).
Among those self-identified as being on at least one fixed term tariff, just 32% recall receiving
an end of fixed term letter in the past year. It is, of course, unknown how many fixed term
accounts actually ended during the year, but, aside from that, analysis by levels of
engagement and recent switching behaviour suggests possible consumer confusion resulting
in more respondents claiming to be on fixed term accounts than is likely to be the case (See
Appendix). So the low proportion recalling end of fixed term letters should be treated with
some suspicion. This is least likely of all to be recalled by those in social grade E, in rented
accommodation or those in the BME groups.

47
© 2013 Ipsos MORI.
All forms of communication are more likely to be recalled by older people (aged 35+), by the
AB social grades and by those not in rented accommodation.
Q44/46/48/50. Summary Table – Attention paid to supplier communications
Annual Statement Bill or statement of account
Price increase notification letter
End of fixed term letter
Base: All who received annual statement in
last year
All who received a bill or statement of account
in last year
All who received a price notification letter
in past year
All who received an end of fixed term letter
in past year
(889) %
(1,129) %
(506) %
(248) %
Read it in detail 40 40 39 47
53 37 Glanced over it or skim
read it 49 46
Only saw what it was, but did not read it
7 8 8 7
Did not read it at all 5 6 5 3
Source: Ipsos MORI
While annual statements, bills and price increase notifications all receive similar levels of
attention from consumers, the end of fixed term letter receives much greater scrutiny. Over
half (53%) of recipients read their end of fixed term letter in detail, compared to about 40%
for the other communications. There is some variation in this proportion – it falls to 38% for
social grade E, 37% for those in rented accommodation and just 18% of BMEs. The sub-
sample size is too small to be conclusive about these differences for end of fixed term letters,
but it does follow the same pattern as the other communications, that is, of being read in less
detail by the more vulnerable consumer segments.

48
© 2013 Ipsos MORI.
Q44/46/48/50. Summary Table – Attention paid to supplier communications by typology
Annual Statement Bill or statement of account
Price increase notification letter
End of fixed term letter
Base: All All who received annual statement in
last year
All who received a bill or statement of account
in last year
All who received a price notification letter
in past year
All who received an end of fixed term letter
in past year
Disengaged group (425) %
(546) %
(271) %
(113) %
Read it in detail 37 37 41 46
Glanced over it or skim read it
48 46 45 43
Only saw what it was, but did not read it
9 8 10 7
Did not read it at all 6 8 5 4
Partially engaged group (72) %
(96)
%
(41) %
(32) %
Read it in detail 48 44 41 64
Glanced over it or skim read it
39 37 43 23
Only saw what it was, but did not read it
4 10 11 10
Did not read it at all 9 9 5 4
Lapsed engaged group (204) %
(246)
%
(114) %
(31) %
Read it in detail 39 43 36 58
Glanced over it or skim read it
59 47 52 29
Only saw what it was, but did not read it
6 6 9 13
Did not read it at all 3 4 4 0
Recently engaged group (188) %
(241)
%
(80) %
(72) %
Read it in detail 43 42 40 55
Glanced over it or skim read it
50 48 52 38
Only saw what it was, but did not read it
4 8 4 3
Did not read it at all 3 2 4 3
Source: Ipsos MORI
End of fixed term letters are the most likely of the four communications to have been read in
detail among all four engagement groups, even among the Disengaged. In fact, the Partially
Engaged are apparently most likely of all to have read it (though the sub-sample is too small
to be authoritative). Between the other three communications there is little difference within
each engagement group.

49
© 2013 Ipsos MORI.
Q45/47/49/51. Summary Table – Effect of supplier communications
Annual Statement
Bill or statement of account
Price increase notification letter
End of fixed term letter
Base: All who read in detail/ glanced over annual statement
All who read in detail/ glanced over bill or
statement of account
All who read in detail/ glanced over price
increase notification letter
All who read in detail/ glanced over end of
fixed term letter
(788) %
(969) %
(436) %
(220) %
Agree Dis agree
Agree Dis agree
Agree Dis agree
Agree Dis agree
% % % % % % % %
I understood the information
77 9 77 10 79 10 81 6
The information made me consider my energy
options
43 31 39 37 39 40 60 21
I took action as a result of reading this
information. For example, I looked into,
or actually switched supplier, tariff or
payment method*
28 52 27 55 24 58 49 28
Source: Ipsos MORI
* In Q47 (bill or statement of account), statement reads ‘Other than paying the bill, I took action as a result of reading this information. For example I looked into, or actually switched supplier, tariff or payment method’
End of fixed term letters prove, on the face of it, to be the most effective call to action among
the four communications. Not only do they attract most attention, but they are most likely to
make consumers consider their energy options (60%) and most likely to actually cause
consumers to take action to engage with the market in some way (49%). The other three
forms of communication stimulate consideration and action to a similar degree to each other
– each would motivate about two-fifths to consider their options, and around a quarter to take
action. In all four cases, claimed understanding of the communication is similarly high,
though it is highest of all for end of fixed term letters.
In all cases, there is a relationship between the propensity to take action, or consider options,
and social grade, with ABC1 social grades more likely to act on the information than the DE
groups, especially social grade E. The 65+ age group is also consistently less likely to take
action than younger age groups. The relationship with home tenure and ethnic group is less
clear, however.

50
© 2013 Ipsos MORI.
Q45/47/49/51. Summary Table – Effect of supplier communications by typology
Annual Statement
Bill or statement of account
Price increase notification letter
End of fixed term letter
All who read in detail/ glanced over annual statement
All who read in detail/ glanced over bill or
statement of account
All who read in detail/ glanced over price
increase notification letter
All who read in detail/ glanced over end of
fixed term letter
Agree Dis agree
Agree Dis agree
Agree Dis agree
Agree Dis agree
Disengaged group (362) %
(452) %
(228) %
(99) %
I understood the information
74 11 71 12 76 12 74 9
The information made me consider my energy
options
39 33 32 40 34 44 47 29
I took action as a result of reading this information.
For example, I looked into, or actually switched
supplier, tariff or payment method*
21 55 24 55 21 57 39 39
Partially engaged group
(64) %
(78) %
(35) %
(27) %
I understood the information
83 10 80 5 71 13 82 7
The information made me consider my energy
options
44 30 46 33 42 37 60 16
I took action as a result of reading this information.
For example, I looked into, or actually switched
supplier, tariff or payment method*
26 48 29 50 29 51 49 26
Cont’d . . . . .

51
© 2013 Ipsos MORI.
Cont’d . . . . . .
Annual Statement
Bill or statement of account
Price increase notification letter
End of fixed term letter
All who read in detail/ glanced over annual statement
All who read in detail/ glanced over bill or
statement of account
All who read in detail/ glanced over price
increase notification letter
All who read in detail/ glanced over end of
fixed term letter
Agree Dis agree
Agree Dis agree
Agree Dis agree
Agree Dis agree
Lapsed engaged group
(189) %
(223) %
(101) %
(28) %
I understood the information
82 7 84 5 88 5 90 0
The information made me consider my energy
options
41 37 38 41 35 39 64 10
I took action as a result of reading this information.
For example, I looked into, or actually switched
supplier, tariff or payment method*
24 60 20 63 22 67 35 28
Recently engaged group
(173) %
(216) %
(72) %
(66) %
I understood the information
76 10 80 11 77 12 88 9
The information made me consider my energy
options
54 22 49 29 54 34 74 15
I took action as a result of reading this information.
For example, I looked into, or actually switched
supplier, tariff or payment method*
46 36 38 47 37 51 67 15
Source: Ipsos MORI
Levels of engagement have some influence on claimed propensity to take action or to
consider options, but contrasts between end of fixed term letters and the other three
communications are detectable for all engagement groups, with end of fixed term letters
always apparently more effective motivations. Even among the Disengaged, recipients of
end of fixed term letters are more likely than recipients of other communications to say they
took action or considered their options. The absolute proportions, however, among the
Disengaged (where 39% said they took action and 47% considered options as a result of an
end of fixed term letter) are considerably lower than the corresponding figures among the
Recently Engaged group (67% and 74% respectively).

52
© 2013 Ipsos MORI.
Trust in openness and transparency of
energy suppliers
Q52. Using the words here, please tell me the extent to which you trust or distrust energy suppliers to be open and transparent in their dealings with consumers?
Total 2013 Age Social grade Ethnicity
Internet access
Previous survey
(all) 15-34 35-64 65+ AB DE White BME Yes No 2012
Base: All with mains gas or electricity who are responsible for bills
(1,433) %
(243) %
(717) %
(473) %
(330) %
(368) %
(1,303) %
(124) %
(1,151) %
(282) %
(1,484) %
Trust (completely/
tend to)
29 27 26 37 24 35 29 32 27 40 34
Neither 27 32 25 28 25 23 26 40 26 29 26
Distrust (completely/
tend to)
43 41 48 35 50 42 45 26 46 30 39
Source: Ipsos MORI
Since this question was first asked last year, trust in energy suppliers to be open and
transparent in their dealings with consumers has fallen further, and is now decisively
outweighed by distrust (trust 29%; distrust 43%). Trust is down five points, and distrust is up
four points; both are statistically significant changes.
With such a widespread negative balance of trust, there are now only a few groups among
energy consumers who still trust energy suppliers on balance. They include the BME groups
and consumers with no internet access. Consumers in Scotland, uniquely, are evenly
balanced between trust and distrust, and those in Wales are only very slightly distrustful on
balance.
More engaged energy consumers are more likely to distrust than to trust the suppliers to be
open and honest. Among the Recently Engaged, just 23% trust the suppliers, while 53%
distrust them. Among the Disengaged, the figures are more evenly balanced (34% trust; 37%
distrust).

53
© 2013 Ipsos MORI.
Q52. Using the words here, please tell me the extent to which you trust or distrust energy suppliers to be open and transparent in their dealings with consumers?
Total 2013
Consumer typologies (see appendix)
Disengaged Partially engaged
Lapsed engaged
Recently engaged
Base: All with mains gas or electricity who are responsible for bills
(1,433) %
(763) %
(119) %
(271) %
(280) %
Trust (completely/tend to) 29 34 33 21 23
Neither 27 28 32 25 24
Distrust (completely/tend to) 43 37 36 54 53
Source: Ipsos MORI

54
© 2013 Ipsos MORI.
Household financial stability
Q38. Which of these statements best applies to you?
Total 2013 Tenure Age
Social Grade Previous surveys (all)
Rented
Non-rented 15-34 35-64 65+ AB DE 2010 2011 2012
Base: All with either mains gas or electricity who are responsible for bills
(1,433) %
(407) %
(1026) %
(243) %
(717) %
(473) %
(330) %
(368) %
(1,554) %
(1,525) %
(1,484) %
I am/ We are keeping up with
all the household bills
without any difficulties
62 43 69 50 62 74 80 42 63 62 66
I am/ We are keeping up with
all the household bills,
but it is a struggle from
time to time
27 37 24 33 27 22 17 34 25 25 23
I am/ We are keeping up with
all the household bills,
but it is a constant struggle
8 15 6 12 9 3 2 16 9 8 8
I am/ We are falling behind
with some household bills
1 4 1 3 1 * * 5 1 1 1
I am/ We are having real
financial problems and
have fallen behind with
many bills
1 2 1 3 1 * * 2 1 1 1
Source: Ipsos MORI
Despite the economic slowdown, this question does not reveal any significant change in
views of the affordability of household bills. A consistent two percent of energy consumers
believe they are falling behind, and this is unchanged since 2010. This very low proportion of
energy consumers who admit they are experiencing real difficulties means their sub-sample
size is too small to be able to look at their views and behaviour separately.

55
© 2013 Ipsos MORI.
Appendices

Internal / Client Use Only
56
This work was carried out in accordance with the requirements of the international quality standard for Market Research,
ISO 20252:2006.
© 2013 Ipsos MORI.
Appendices
Sample Profile
QOG01. Do you have mains gas and/or mains electricity in your home?
All 2007
All 2008
All 2010
All 2011
All 2012
All 2013
Base: All respondents (2,020) %
(2,063) %
(1,992) %
(1,992) %
(1,956) %
(1,960) %
Mains gas 78 81 86 85 80 83
Mains electricity 94 95 95 94 94 95
Neither/Don’t know/Refused 5 9 5 3 3 2
Source: Ipsos MORI
QOG02. Are you responsible or jointly responsible for the gas or electricity bills in your household?
All 2007
All 2008
All 2010
All 2011
All 2012
All 2013
Base: All with mains gas or electricity
(1,964) %
(1,981) %
(1,904) %
(1,925) %
(1,884) %
(1,911) %
Yes 77 75 80 77 79 73
No 23 25 20 23 21 27
Source: Ipsos MORI
QOG04. Are you on a dual fuel deal?
All 2007
All 2008
All 2010
All 2011
All 2012
All 2013
Base: All with mains gas and electricity who are responsible for the bill and have same supplier for both (who comprise 89% of all with mains gas and electricity who are responsible for bills (2013))
(1,964) %
(1,005) %
(1,144) %
(1,138) %
(1,066) %
(1,061) %
Yes - 64 72 74 72 75
No - 22 16 15 15 19
Source: Ipsos MORI

Internal / Client Use Only
57
This work was carried out in accordance with the requirements of the international quality standard for Market Research,
ISO 20252:2006.
© 2013 Ipsos MORI.
Methods of Payment
QOG08. How do you pay for the gas you use?
All 2007
All 2008
All 2010
All 2011
All 2012
All 2013
Base: All those with mains gas who are responsible for the bill
(1,243) %
(1,243) %
(1,369) %
(1,331) %
(1,232) %
(1,214) %
Monthly direct debit 62 65 70 70 69 68
Quarterly direct debit - - - - - 8
Pay quarterly in arrears/cheque, cash or card on receipt of bill
23 19 13 14 13 8
Prepayment meter 8 10 11 11 11 12
Fuel Direct * * * 0 - *
Weekly/fortnightly payment scheme
2 1 1 1 1 1
Payment card/book ad hoc 3 3 3 2 2 2
Other 1 1 1 1 2 *
Don’t know 1 1 1 1 2 *
Source: Ipsos MORI
QOG10. How do you pay for the electricity you use?
All 2007
All 2008
All 2010
All 2011
All 2012
All 2013
Base: All those with mains electricity who are responsible for the bill
(1,516) %
(1,519) %
(1,540) %
(1,500) %
(1,461) %
(1,408) %
Monthly direct debit 60 64 68 70 68 65
Quarterly direct debit - - - - - 8
Pay quarterly in arrears/cheque, cash or card on receipt of bill
24 19 15 13 13 8
Prepayment meter 9 11 12 12 12 14
Fuel Direct * * * * - *
Weekly/fortnightly payment scheme
2 2 1 1 1 1
Payment card/book ad hoc 3 3 3 2 2 1
Other 1 1 * 2 2 1
Don’t know 1 1 1 1 1 *
Source: Ipsos MORI
Note: In 2013, ‘Quarterly direct debit’ was included in the questionnaire as a payment method but was not statistically significant enough to report on exclusively.

Internal / Client Use Only
58
This work was carried out in accordance with the requirements of the international quality standard for Market Research,
ISO 20252:2006.
© 2013 Ipsos MORI.
Online Tariff
QOG09. Are you on an online tariff, that is, a gas account that you have to manage over the internet?
2010 2011 2012 2013
Base: All who have mains gas and are responsible for the bill
(1,369) %
(1,331) %
(1,232) %
(1,214) %
Yes 12 21 22 27
No 85 75 73 71
Don’t know 3 4 5 2
Source: Ipsos MORI
QOG11. Are you on an online tariff, that is, an electricity account that you have to manage over the internet?
2010 2011 2012 2013
Base: All who have mains electricity and are responsible for the bill
(1,540) %
(1,500) %
(1,461) %
(1,408) %
Yes 12 19 22 25
No 85 77 73 73
Don’t know 3 3 5 2
Source: Ipsos MORI
Fixed term tariffs
QOG07. Are you on a fixed term tariff for gas, for electricity or for both?
2013
Base: All who have mains gas or electricity who are responsible for bills (1,433) %
Yes – gas 2
Yes – electricity 10
Yes - both 41
Yes – at least one fixed term tariff 53
No 39
Don’t know 9
Source: Ipsos MORI

Internal / Client Use Only
59
This work was carried out in accordance with the requirements of the international quality standard for Market Research,
ISO 20252:2006.
© 2013 Ipsos MORI.
Cross analysis with other questions suggests that many consumers have misinterpreted the
question on fixed term tariffs and answered it incorrectly. For example, 58% of those who
claim to be on “fixed term tariffs” also say they have never switched supplier, which seems
unlikely.
Amount spent on home energy
QOG06. Approximately how much do you spend on home energy, that is electricity and mains gas (if you have it)? (per year)
All giving numerical
answer
Payment method Social Grade Monthly/
Quarterly Direct Debit (gas)
PPM (gas)
Monthly/Quarterly
Direct Debit (elec)
PPM (elec) AB C1 C2 D E
Base: All giving numerical answer
(1,317) %
(803) %
(162) %
(904) %
(223) %
(292) %
(373) %
(303) %
(185) %
(164) %
0-£700 14 10 11 14 14 10 15 16 16 20
£701-£1,200 46 50 36 49 36 46 45 45 52 41
£1,201-£1,500 15 17 10 15 9 18 15 14 11 12
£1,501+ 25 23 43 22 41 26 26 25 21 27
MEAN £1259 £1273 £1494 £1223 £1450 £1356 £1227 £1234 £1195 £1232
Base: All with mains gas or electricity
(1,433)
%
Don’t know 9 9 2 9 2 12 8 8 5 7
Source: Ipsos MORI

Internal / Client Use Only
60
This work was carried out in accordance with the requirements of the international quality standard for Market Research,
ISO 20252:2006.
© 2013 Ipsos MORI.
Current gas and electricity suppliers
QOG53. Who is your current electricity supplier?
Base: All who have mains electricity and responsible for bills
(1408)
%
British Gas 27
E.ON 19
EDF 11
Scottish Power 11
npower 10
Southern Energy 7
SSE 3
Scottish Hydro 2
Swalec 2
First Utility 1
Ecotricity 1
Co-operative Energy *
Ebico *
Good Energy *
Marks & Spencer Energy *
Ovo *
Sainsburys Energy *
Spark Energy *
Other *
Don’t know 2
Source: Ipsos MORI
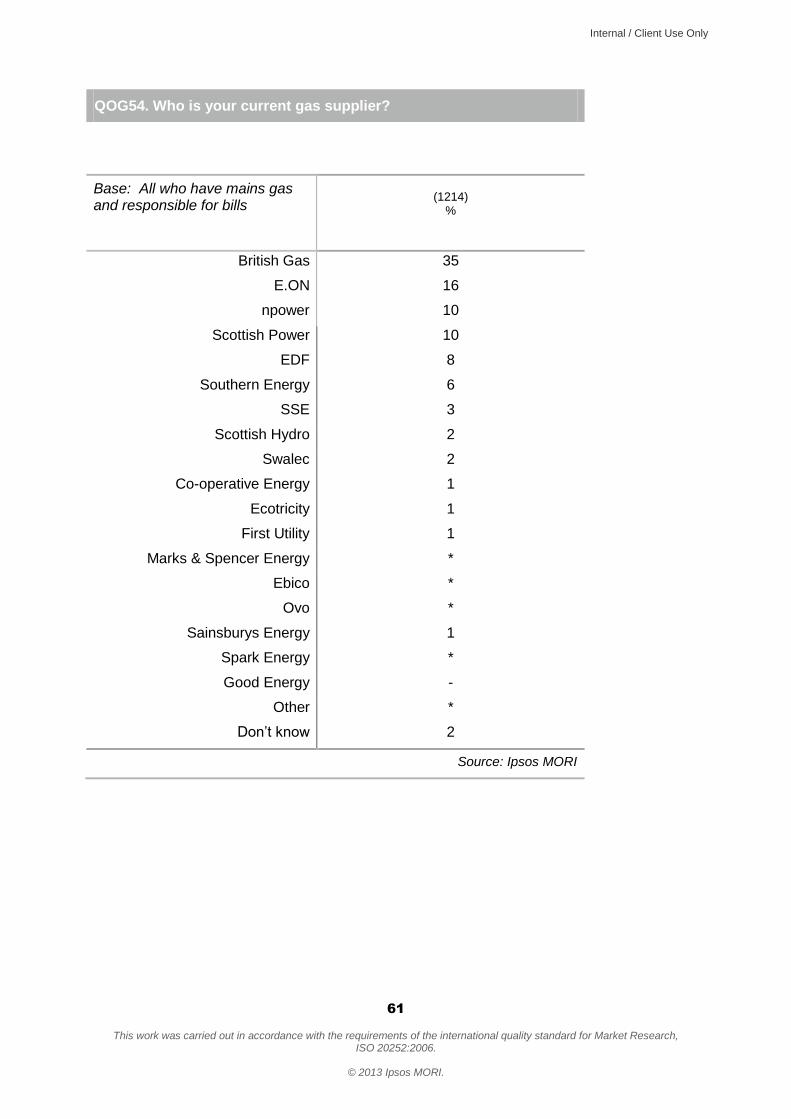
Internal / Client Use Only
61
This work was carried out in accordance with the requirements of the international quality standard for Market Research,
ISO 20252:2006.
© 2013 Ipsos MORI.
QOG54. Who is your current gas supplier?
Base: All who have mains gas and responsible for bills
(1214)
%
British Gas 35
E.ON 16
npower 10
Scottish Power 10
EDF 8
Southern Energy 6
SSE 3
Scottish Hydro 2
Swalec 2
Co-operative Energy 1
Ecotricity 1
First Utility 1
Marks & Spencer Energy *
Ebico *
Ovo *
Sainsburys Energy 1
Spark Energy *
Good Energy -
Other *
Don’t know 2
Source: Ipsos MORI

Internal / Client Use Only
62
This work was carried out in accordance with the requirements of the international quality standard for Market Research,
ISO 20252:2006.
© 2013 Ipsos MORI.
Consumer typologies: Engagement
Proportions of:
All energy consumers
Gas consumers
Electricity consumers
(1,433) %
(1,214) %
(1,408) %
Disengaged – Never switched supplier and not switched tariff/payment method in 2012/13 (either fuel)
51 50 51
Partially engaged – Never switched supplier and switched tariff/payment method in 2012/13 (either fuel)
9 9 9
Lapsed engaged – Switched before 2012 and NEITHER switched supplier in 2012/13 nor switched tariff/payment method in 2012/13 (either fuel)
19 19 19
Recently engaged – Either switched supplier in 2012/13 OR (switched tariff/payment method in 2012/13 (either fuel) AND switched supplier before 2012 (either fuel))
21 22 21

Internal / Client Use Only
63
This work was carried out in accordance with the requirements of the international quality standard for Market Research,
ISO 20252:2006.
© 2013 Ipsos MORI.
Demographics
2013
Weighted
2013
Unweighted
Base: All respondents (1,959) %
(1,960) %
Age
15-34 32 28
35-64 48 44
65+ 20 27
Social Group
AB 26 21
C1 28 28
C2 22 24
DE 24 27
Region
England 86 86
Wales 5 5
Scotland 9 9
Area
Urban 24 26
Suburban 51 51
Rural 24 21
Internet Access
Yes 87 83
No 13 17
Ethnic Group
White 88 87
BME 11 13
Physical/ Mental Impairment
Yes 15 19
No 85 81
Source: Ipsos MORI

Internal / Client Use Only
64
This work was carried out in accordance with the requirements of the international quality standard for Market Research,
ISO 20252:2006.
© 2013 Ipsos MORI.
Questionnaire and topline
results

Internal / Client Use Only
65
This work was carried out in accordance with the requirements of the international quality standard for Market Research,
ISO 20252:2006.
© 2013 Ipsos MORI.
Questionnaire and topline results
Ofgem Switching Omnibus (Customer Engagement Tracker)
Survey 2013 Topline Results
This topline shows the results for a face-to-face survey conducted among a representative quota sample of 1,960 residents of Great Britain in the period 1-14 March 2013. Comparisons, where available, are shown with surveys in 2012, 2011, 2010 and 2008
Data are weighted by sex, age, social class, region and working status
Where results do not sum to 100, this may be due to multiple responses, computer rounding or the exclusion of don’t knows/not stated
Results are based on all respondents unless otherwise stated (most based on all with gas or all with electricity)
An asterisk (*) represents a value of less than one half or one percent, but not zero
OG01. Do you have mains gas and/or mains electricity in your home? March
‘08 March
‘10 January
‘11 March
‘12 March
‘13
% % % % % Yes – Mains electricity 94 95 94 94 95
Yes – Mains gas 78 86 85 80 83
No – Neither 2 2 1 2 2
Don’t know 2 1 1 1 *
Refused 1 2 1 1 - Base: All respondents (1960) OG02. Are you responsible or jointly responsible for the gas or electricity bills in your
household?
March ‘08
March ‘10
January ‘11
March ‘12
March ‘13
% % % % % Yes 75 80 77 79 73
No 25 20 23 21 27 Base: All who have mains electricity and/or gas (1911)

Internal / Client Use Only
66
This work was carried out in accordance with the requirements of the international quality standard for Market Research,
ISO 20252:2006.
© 2013 Ipsos MORI.
OG03. Do you have the same supplier for both electricity and gas?
March ‘08
March ‘10
January ‘11
March ‘12
March ‘13
% % % % % Yes 80 84 87 88 90
No 17 14 12 10 10
Don’t know 3 2 2 2 1 Base: All who have both mains electricity and gas, and are responsible for bills (1189) OG04. IF YES: Are you on a dual fuel deal?
March ‘08
March ‘10
January ‘11
March ‘12
March ‘13
% % % % % Yes 64 72 74 72 75
No 22 16 15 15 19
Don’t know 14 12 11 14 6 Base: All with same supplier for both fuels (1061) OG05.
In the last year, have you received information from your supplier about:
January ‘11 March ‘12 March ‘13 % % % The name of the tariff you are
on (your tariff is the pricing plan for the electricity and/or gas you
use)?1
Yes 42 48 54
No 40 37 42
Don’t know
18 15 4
Any changes to your tariff? Yes 45 40 40
No 44 48 56
Don’t know
11 12 4
The forecast cost of your energy consumption over the
coming year
Yes 45 44 47
No 44 43 48
Don’t know
11 13 4
Base: All with gas or electricity who are responsible or jointly responsible for bills (1433)
1 In 2012 questionnaire, statement read: ‘The name of the tariff you are on (your tariff is the name and
rate of the energy plan you pay your energy supplier for)’

Internal / Client Use Only
67
This work was carried out in accordance with the requirements of the international quality standard for Market Research,
ISO 20252:2006.
© 2013 Ipsos MORI.
OG06. Approximately how much do you spend on home energy, that is electricity and mains gas (if you have it)? You may answer per year, per month or per week if you prefer, but it needs to be on average for the whole year, including the winter. (Replies translated into annual figures)
March ‘12 March ‘13
% %
0-£700 17 13
£701-£1200 40 42
£1201-£1500 12 13
£1501+ 19 23
Don’t know 13 9
Mean £1,259 £1,258
Base: All responsible or jointly responsible for bills (1433) OG07. Are you on a fixed term tariff for gas, for electricity or for both?
1
March ‘12 March ‘13
% %
Yes – gas 2
Yes – electricity 10
Yes (either) 38 53
Yes - both 41
No 42 39
Don’t know 21 9
Base: All responsible or jointly responsible for bills (1433)
1 In 2012 questionnaire, question read: ‘Are you on a fixed term tariff?’ and possible responses were
‘Yes,’ ‘No’ and ‘Don’t know’

Internal / Client Use Only
68
This work was carried out in accordance with the requirements of the international quality standard for Market Research,
ISO 20252:2006.
© 2013 Ipsos MORI.
OG08. How do you pay for the gas you use?
March ‘08
March ‘10
January ‘11
March ‘12
March ‘13
% % % % % Monthly Direct Debit 65 70 70 69 68
Quarterly Direct Debit1 - - - - 8
Pay by cheque, cash or card on receipt of your bill
19 13 14 13 8
Prepayment Meter 10 11 11 11 12
Fuel Direct (where a set amount is deducted from your benefits before you
receive them)
* * - - *
Weekly/Fortnightly payment scheme
1 1 1 1 1
Payment card/book that I use whenever I choose (Ad
Hoc)
3 3 2 2 2
Other 1 1 1 2 *
Don’t know 1 1 1 2 * Base: All with mains gas and responsible for bill (1214) OG09. Are you on an online tariff, that is, a gas account that you have to manage over the
internet?
March ‘10
January ‘11
March ‘12
March ‘13
% % % % Yes 12 21 22 27
No 85 75 73 71
Don’t know 3 4 5 2
Base: All those who have mains gas in their home and are responsible for the bill (1214)
3 New code introduced in 2013

Internal / Client Use Only
69
This work was carried out in accordance with the requirements of the international quality standard for Market Research,
ISO 20252:2006.
© 2013 Ipsos MORI.
OG10. How do you pay for the electricity you use?
March ‘08
March ‘10
January ‘11
March ‘12
March ‘13
% % % % % Monthly Direct Debit 64 68 70 68 65
Quarterly Direct Debit1 - - - - 8
Pay by cheque, cash or card on receipt of your bill
19 15 13 13 8
Prepayment Meter 11 12 12 12 14
Fuel Direct (where a set amount is deducted from your benefits before you
receive them)
* * * - *
Weekly/Fortnightly payment scheme
2 1 1 1 1
Payment card/book that I use whenever I choose (Ad
Hoc)
3 3 2 2 1
Other 1 * 2 2 1
Don’t know 1 1 1 1 * Base: All with mains electricity and responsible for bill (1408) OG11. Are you on an online tariff, that is, an electricity account you have to manage over
the internet?
March ‘10
January ‘11
March ‘12
March ‘13
% % % % Yes 12 19 22 25
No 85 77 73 73
Don’t know 3 3 5 2
Base: All with mains electricity and responsible for bill (1408) OG12a. Did you switch your gas supplier in 2012?
2
March ‘08
March ‘10
January ‘11
March ‘12
March ‘13
% % % % % Yes 20 17 15 13 11
No/Don’t know 80 83 85 87 89 Base: All with mains gas and responsible for bill (1214)
1 New code introduced in 2013
2 In 2012 questionnaire, question read: ‘Did you switch your gas supplier in 2011?’

Internal / Client Use Only
70
This work was carried out in accordance with the requirements of the international quality standard for Market Research,
ISO 20252:2006.
© 2013 Ipsos MORI.
OG12b. And have you switched your gas supplier so far in 2013?
1
March ‘12 March ‘13 % % Yes 4 3
No/Don’t know 96 97 Base: All with mains gas and responsible for bill (1214) OG13. Did you switch your gas supplier at any time before 2012?
2
March ‘08
March ‘10
January ‘11
March ‘12
March ‘13
% % % % % Yes 29 32 30 27 28
No/ Don’t know 71 68 70 73 72 Base: All who did not switch gas supplier during 2012/2013 (1063) OG14. How many times have you ever switched your gas supplier?
March ‘08
March ‘10
January ‘11
March ‘12
March ‘13
% % % % % Once 53 49 56 44 38
Twice 26 26 21 19 25
Three times (“or more” - before 2011)
21 25 12 21 19
Four times or more 11 15 17 Base: All who have ever switched gas supplier (440) OG15a. Even though you stayed with the same gas supplier in 2012 and so far in 2013, did
you change the tariff you have with them or the method by which you pay them?3
March ‘08
March ‘10
January ‘11
March ‘12
March ‘13
% % % % % Yes – changed tariff 9 11
Yes – changed payment method
4 5
Yes (either) 9 10 12 12 15
No 88 88 84 88* 85*
Don’t Know 4 2 4 Base: All who have not switched gas supplier in 2012/13 (1063) * No/DK combined in 2012 and 2013
1 In 2012 questionnaire, question read: ‘And have you switched your gas supplier so far in 2012?’
2 In 2012 questionnaire, question read: ‘Did you switch your gas supplier before 2011?’
3 In 2012 questionnaire, question read: ‘Even though you stayed with the same gas supplier in 2011
and so far in 2012, did you change the tariff you have with them or the method by which you pay them?’

Internal / Client Use Only
71
This work was carried out in accordance with the requirements of the international quality standard for Market Research,
ISO 20252:2006.
© 2013 Ipsos MORI.
OG15b. When you switched gas supplier in 2012 or 2013, did you also change your payment method at the same time?
1
%
Yes 15
No/Don’t know 85
Base: All those who switched gas supplier during 2012/2013 (151) OG15c. What method of payment for gas did you change from?
2
March ‘12 March ‘13 % % Monthly Direct Debit 6 6
Quarterly Direct Debit3 6
Pay by cheque, cash or card on receipt of your bill
10 12
Prepayment Meter 3 1
Fuel Direct (where a set amount is deducted from your benefits before you
receive them)
- -
Weekly/Fortnightly payment scheme
1 1
Payment card/book that I use whenever I choose (Ad
Hoc)
- -
Other (Please specify) 1 2
Did not change payment method
70 71
Don’t know 8 -
Base: All those who have changed tariff or payment method for gas in past year (178) OG16a. Did you switch your electricity supplier in 2012?
4
March ‘08
March ‘10
January ‘11
March ‘12
March ‘13
% % % % % Yes 19 18 17 14 12
No/Don’t know 81 82 83 86 88 Base: All who have mains electricity and are responsible for bill (1408)
1 New question introduced in 2013
2 In 2012 questionnaire, this question was OF15b
3 New code introduced in 2013
4 In 2012 questionnaire, question read: ‘Did you switch your electricity supplier in 2011?’

Internal / Client Use Only
72
This work was carried out in accordance with the requirements of the international quality standard for Market Research,
ISO 20252:2006.
© 2013 Ipsos MORI.
OG16b. And have you switched your electricity supplier so far in 2013?
1
March ‘12 March ‘13 % % Yes 3 2
No/Don’t know 97 98
Base: All who have mains electricity and are responsible for bill (1408) OG17. Did you switch your electricity supplier at any time before 2012?
2
March ‘08
March ‘10
January ‘11
March ‘12
March ‘13
% % % % % Yes 26 30 28 24 29
No 74 70 72 76 71 Base: All who did not switch electricity supplier in 2012/13 (1234) OG18. How many times have you ever switched your electricity supplier?
March ‘08
March ‘10
January ‘11
March ‘12
March ‘13
% % % % % Once 55 46 56 44 42
Twice 23 27 20 22 23
Three times (“or more” -before 2011)
22 26 14 20 19
Four times or more 10 15 16 Base: All who have ever switched electricity supplier (510) OG19a. Even though you stayed with the same electricity supplier in 2012 and so far in
2013, did you change the tariff you have with them or the method by which you pay them?
3
March ‘08
March ‘10
January ‘11
March ‘12
March ‘13
% % % % % Yes – changed tariff 10 10
Yes – changed payment method
3 6
Yes (either) 8 8 10 12 15
No 89 89 86 88* 85*
Don’t Know 4 2 3 Base: All who have not switched electricity supplier in 2012/13 (1234) * No/DK combined in 2012 and 2013
1 In 2012 questionnaire, question read: ‘And have you switched your electricity supplier so far in
2012?’ 2 In 2012 questionnaire, question read: ‘Did you switch your electricity supplie3r before 2011?’
3 In 2012 questionnaire, question read: ‘Even though you stayed with the same66 electricity supplier in
2011 and so far in 2012, did you change the tariff you have with them or the method by which you pay them?’

Internal / Client Use Only
73
This work was carried out in accordance with the requirements of the international quality standard for Market Research,
ISO 20252:2006.
© 2013 Ipsos MORI.
OG19b. When you switched electricity supplier in 2012 or 2013, did you also change your
payment method at the same time?1
%
Yes 16
No/Don’t know 84
Base: All who have switched electricity supplier in 2012/13 (174) OG19c. What method of payment for electricity did you change from?
2
March ‘12 March ‘13 % % Monthly Direct Debit 4 6
Quarterly Direct Debit3 6
Pay by cheque, cash or card on receipt of your bill
14 15
Prepayment Meter 2 3
Fuel Direct (where a set amount is deducted from your benefits before you
receive them)
- -
Weekly/Fortnightly payment scheme
- *
Payment card/book that I use whenever I choose (Ad
Hoc)
1 -
Other (Please specify) 1 2
Did not change payment method
74 66
Don’t know 4 -
Base: All those who have changed tariff or payment method for electricity in past year (205) Summary 1
March ‘07
March ‘08
March ‘10
January ‘11
March ‘12
March ‘13
% % % % % %
Ever switched gas supplier
37 43 43 41 37 38
Ever switched electricity supplier
39 40 42 40 35 38
Base: All who have each fuel and pay bills (1214 gas, 1408 electricity)
1 New question introduced in 2013
2 In 2012 questionnaire, this question was OF19b
3 New code introduced in 2013

Internal / Client Use Only
74
This work was carried out in accordance with the requirements of the international quality standard for Market Research,
ISO 20252:2006.
© 2013 Ipsos MORI.
Summary 2
March ‘07
March ‘08
March ‘10
January ‘11
March ‘12
March ‘13
% % % % % %
Switched either fuel in last year*
24 21 19 18 15 14
Switched either fuel ever 41 45 46 43 38 40 Base: All with either fuel and pay bills (1433) *last year = 2012 OG20. Did you know it was possible to change to a different tariff or method of payment
with your current supplier?1
March ‘12 March ‘13 % % Yes – knew possible to
change tariff* 34
Yes - knew possible to change method of payment*
5
Yes – knew possible to change both*
43
Yes (either) 68 82
No 28 17
Don’t know 5 1
Base: All those who have not changed gas or electricity tariff or payment method (1214) *before 2013, ‘Yes’ option was not segmented 3 ways OG21. Did you know it was possible to switch to a different gas or electricity supplier?
March ‘08
March ‘10
January ‘11
March ‘12
March ‘13
% % % % % Yes (either) 80 83 87 82 84
Yes – knew possible to switch both
79 77
Yes- electricity but not gas 2 2
Yes- gas but not electricity 1 5
No 16 14 10 16 16
Don’t know 4 4 3 3 1 Base: All who have never switched either (882)
1 In 2012 questionnaire, possible responses were ‘Yes,’ ‘No’ and ‘Don’t know’

Internal / Client Use Only
75
This work was carried out in accordance with the requirements of the international quality standard for Market Research,
ISO 20252:2006.
© 2013 Ipsos MORI.
OG22. For each of the items here could you please say which of them, if any, apply to you?
January ‘11 March ‘12 March ‘13
% % % I’m happy with my current
supplier/s 77 78 55
I’ve checked prices of other suppliers and I think I’m on the
best deal1
13 9 12
I don’t think there is any difference between the suppliers to make
switching worthwhile2
20 13 17
Switching is a hassle 22 20 27
I am unsure about where to get information to help me make a
good choice
4 2 6
I am in debt with my current supplier/s so don’t think I can
switch
1 1 2
I live in rented accommodation and don’t think my landlord will
allow me to switch3
3 3 3
I wouldn’t know how to switch even if I wanted to
2 3 4
My supplier has told me I can’t switch
n/a 1 2
Base: All who have never switched either (882)
1 2011 wording: ...and I think I’m on a good deal
2 2011 wording: I don’t think there is much difference...
3 2011 wording: I live in a rented house and I don’t think my landlord would allow me to switch

Internal / Client Use Only
76
This work was carried out in accordance with the requirements of the international quality standard for Market Research,
ISO 20252:2006.
© 2013 Ipsos MORI.
OG23. Thinking about the last time you switched your gas supplier, what was the main
trigger causing you to switch?
March ‘08
March ‘10
January ‘11
March ‘12
March ‘13
% % % % % Believed new supplier was
cheaper/to save money 78 78 79 76 75
Believed new supplier offered better customer service
6 6 7 5 6
Believed new supplier offered better benefits (e.g. loyalty
points)
2 1
Wanted a dual fuel package 3 6 4 5 4
Wanted a fixed-price deal 2 3 1 2 2
Wanted a “greener” tariff 1 1 1 1 * 1
Wanted an online tariff2 0 * 1 0 *
Written communication from your supplier
0 0 0 * -
Moved home#3 0 0 0 3 6
Poor service# 0 0 0 1 *
Other 7 1 1 1 2
Don’t know 2 2 2 1 1 Base: All who have gas and are responsible for bill and have ever switched gas supplier (440) # Codes added post-fieldwork
1 “wanted to switch to a “greener” environmentally friendly tariff or supplier” - 2011
2 2008 wording: “The attraction of an online tariff”
3 New code introduced in 2013

Internal / Client Use Only
77
This work was carried out in accordance with the requirements of the international quality standard for Market Research,
ISO 20252:2006.
© 2013 Ipsos MORI.
OG24. Thinking about the last time you switched gas supplier, how did you find out about
the deals offered by the supplier you switched to? [unprompted]
March ‘08
March ‘10
January ‘11
March ‘12
March ‘13
% % % % % Supplier/representative
knocked at my door1 41 33 31 23 19
Used an on-line/website price comparison service
(e.g. USwitch, Money Supermarket)
21 26 21 34 35
New supplier phoned me2 7 8 7 6 5
I spoke to a salesperson in street/shopping
centre/public place
- 7 7 10 7
A friend or family member told me about it
6 7 6 6 6
I saw an advert 11 5 4 2 3
I phoned a comparison service
- 4 7 4 4
I looked at the websites of more than one supplier
- 4 3 3 7
I rang them only 5 2 3 4 4
I looked at the supplier’s own website only
- 1 4 3 3
I rang them and other suppliers
4 1 2 3 3
Written communication or marketing material from
your supplier3
- - - 1 1
Through a collective (group) switching campaign
organised by a third party (e.g.
council/charity/housing association, Big Switch,
ready to Switch etc)4
- - - - 1
Other 6 5 5 4 7
Don’t know 4 3 4 4 2 Base: All ever switched gas supplier (440)
1 They knocked on my door - 2011
2 They phoned me - 2011
3 In 2012 questionnaire, statement read: ‘Written communication or marketing material’
4 New statement introduced in 2013

Internal / Client Use Only
78
This work was carried out in accordance with the requirements of the international quality standard for Market Research,
ISO 20252:2006.
© 2013 Ipsos MORI.
OG25. Thinking about the last time you switched gas supplier, how did you switch?
[unprompted]
January ‘11 March ‘12 March ‘13
% % % On-line price comparison service 16 27 26
Telephone price comparison service
2 5 4
Phoning supplier 25 24 29
Through the supplier’s website 4 4 5
Through a salesperson who knocked at my door
29 24 19
Through a salesperson in the street/shopping centre/other public
place
6 7 7
Written communications 1 1 1 2
Through a collective (group) switching campaign organised by
a third party (e.g. council/charity/housing
association, Big Switch, ready to Switch etc)2
- - 1
Other 2 7 5
Don’t know 6 3 3 Base: All ever switched gas supplier (440) OG26. To the best of your knowledge, do you feel that you are now paying less than you
would have if you hadn’t switched?
March ‘08
March ‘10
January ‘11
March ‘12
March ‘13
% % % % % Yes 64 64 62 72 68
No 20 14 12 17 19
Don’t know/Not sure 15 22 26 11 13* Base: All who ever switched gas supplier to save money (328) *2013 code ‘Don’t know’ only
1 By letter/mail - 2011
2 New statement introduced in 2013

Internal / Client Use Only
79
This work was carried out in accordance with the requirements of the international quality standard for Market Research,
ISO 20252:2006.
© 2013 Ipsos MORI.
OG27a. How much do you agree or disagree with the following statements: I found it easy to decide which deal to switch my gas to
March ‘10 January ‘11 March ‘12 March ‘13 % % % % Agree strongly 29 32 34 34
Tend to agree 43 45 38 35
Neither agree nor disagree
13 8 9 11
Tend to disagree 9 10 11 13
Disagree strongly 4 3 6 6
Don’t know 1 2 2 * Base: All with gas who have ever switched (440)
OG27b. I am confident that I fully understand the key features of the deal I switched to
March ‘10 January ‘11 March ‘12 March ‘13 % % % % Agree strongly 31 35 37 38
Tend to agree 45 41 37 34
Neither agree nor disagree
10 11 7 10
Tend to disagree 9 8 13 14
Disagree strongly 4 4 6 4
Don’t know 1 1 1 - Base: All with gas who have ever switched (440) OG27c. I would be confident that if I switched again, I would make the right choice for me
March ‘12 March ‘13 % % Agree strongly 38 38
Tend to agree 34 32
Neither agree nor disagree 9 15
Tend to disagree 12 11
Disagree strongly 6 4
Don’t know 2 * Base: All with gas who have ever switched (440)

Internal / Client Use Only
80
This work was carried out in accordance with the requirements of the international quality standard for Market Research,
ISO 20252:2006.
© 2013 Ipsos MORI.
OG28. Thinking about the last time you switched your electricity supplier, what was the main trigger causing you to switch?
March ‘08
March ‘10
January ‘11
March ‘12
March ‘13
% % % % % Believed new supplier was
cheaper/to save money 77 77 77 77 76
Believed new supplier offered better customer
service
6 7 7 5 5
Wanted a dual fuel package
4 6 5 5 4
Wanted a fixed-price deal 2 4 2 1 2
Wanted a greener tariff 1 2 1 2 1 1
Believed new supplier offered better benefits (e.g.
Loyalty points)
- - - 2 1
Written communication from your supplier
- - - * *
Wanted an online tariff* 0 * * * *
Moved home#2 - - - 3 5
Poor service# - - - 1 1
New tenant# - - - * -
Was on a meter# - - - * *
Dispute with supplier# - - - * 1
Other 6 1 1 1 2
No answer - - - 1 *
Don’t know 2 1 2 2 * Base: All who have electricity and are responsible for bill and have ever switched electricity supplier (510) # Codes added post-fieldwork * 2008 wording: “The attraction of an online tariff”
1 Wanted to switch to a “greener” environmentally friendly tariff or supplier - 2011
2 New statement introduced in 2013

Internal / Client Use Only
81
This work was carried out in accordance with the requirements of the international quality standard for Market Research,
ISO 20252:2006.
© 2013 Ipsos MORI.
OG29. Thinking about the last time you switched electricity supplier, how did you find out about the deals offered by the supplier you switched to? [unprompted]
March ‘08
March ‘10
January ‘11
March ‘12
March ‘13
% % % % % Used an on-line/website price
comparison service (e.g. USwitch, Money Supermarket)
22 27 24 31 37
Phoned a comparison service - 3 5 5 4
Looked at the supplier’s own website only
1 2 4 4 2
Looked at the websites of more than one supplier
- 3 2 3 5
Supplier representative knocked at my door1
41 34 29 22 17
Spoke to a salesperson in street/shopping centre/public
place
- 6 7 7 7
New supplier phoned me2 6 8 9 8 4
I saw an advert 12 4 5 5 3
I rang them only 4 2 4 4 5
I rang them and other suppliers
3 2 2 3 4
A friend or family member told me about it
5 7 6 5 6
Written communication or marketing material from your
supplier3
- - - 1 3
Through a collective (group) switching campaign organised
by a third party (e.g. council/charity/housing
association, Big Switch, ready to Switch etc)4
1
Other 6 6 5 3 7
Don’t know 5 2 4 3 2 Base: All who have ever switched electricity supplier (510)
1 They knocked at my door - 2011
2 They phoned me - 2011
3 In 2012 questionnaire, statement read: ‘Written communication or marketing material’
4 New statement introduced in 2013

Internal / Client Use Only
82
This work was carried out in accordance with the requirements of the international quality standard for Market Research,
ISO 20252:2006.
© 2013 Ipsos MORI.
OG30. Thinking about the last time you switched electricity supplier, how did you switch? [unprompted]
January ‘11 March ‘12 March ‘13 % % % Online price comparison site 16 25 26
Telephone price comparison service 2 5 3
Phoning supplier 28 30 29
Through supplier’s website 5 4 6
Through salesperson who knocked on my door
28 23 17
Through a salesperson in the street/shopping centre/other public
place
5 7 7
Written communications1 1 2 3
Through a collective (group) switching campaign organised by a
third party (e.g. council/charity/housing association,
Big Switch, ready to Switch etc)2
1
Other - 4 5
Don’t know 6 2 2
Base: All those who have ever switched electricity supplier (510) OG31. To the best of your knowledge, do you feel that you are now paying less than you
would have if you hadn’t switched?
March ‘08
March ‘10
January ‘11
March ‘12
March ‘13
% % % % % Yes 62 67 64 73 70
No 24 12 11 13 20
Don’t know/Not sure 15 21 25 14 10 Base: All who have ever switched electricity supplier to save money (384) OG32a. How much do you agree or disagree with the following statements:
I found it easy to decide which deal to switch my electricity to
March ‘10 January ‘11
March ‘12 March ‘13
% % % % Agree strongly 31 31 39 38
Tend to agree 43 46 36 30
Neither agree nor disagree
11 8 7 12
Tend to disagree 9 8 10 14
Disagree strongly 4 3 7 5
Don’t know 1 2 2 * Base: All with electricity who have ever switched (510)
1 By letter/mail – 2011 and in 2012 questionnaire, statement read: ‘written communication’
2 New statement introduced in 2013

Internal / Client Use Only
83
This work was carried out in accordance with the requirements of the international quality standard for Market Research,
ISO 20252:2006.
© 2013 Ipsos MORI.
OG32b. I am confident that I fully understand the key features of the deal I switched to
March ‘10 January ‘11 March ‘12 March ‘13 % % % % Agree strongly 32 34 38 40
Tend to agree 46 44 36 33
Neither agree nor disagree
10 9 7 10
Tend to disagree 8 8 11 13
Disagree strongly 3 4 6 3
Don’t know 1 2 2 - Base: All with electricity who have ever switched (510) OG32c. I would be confident that if I switched again, I would make the right choice for me
March ‘12 March ‘13 % % Agree strongly 40 39
Tend to agree 34 33
Neither agree nor disagree 8 13
Tend to disagree 12 10
Disagree strongly 6 5
Don’t know 2 - Base: All with electricity who have ever switched (510) OG33. Thinking about the last time you changed your tariff or payment method (without
switching supplier), what was the main trigger causing you to change it?
March ‘12 March ‘13
% %
Believed new tariff or method was cheaper/to save money
62 58
Believed new tariff or method offered better benefits, for example loyalty
points or a maintenance contract
7 6
Wanted a dual fuel package 3 4
Wanted a fixed price deal 5 8
Wanted a green tariff 2 1
Wanted an online tariff 1 1
Written communication or marketing materials from your supplier
2 1
Moved home1 1 7
Convenience# 1 3
Other 6 3
Don’t know 7 5
Base: All who have gas or electricity and have changed tariff or payment method in 2012/2013 (219) # Code added post fieldwork
1 New statement introduced in 2013

Internal / Client Use Only
84
This work was carried out in accordance with the requirements of the international quality standard for Market Research,
ISO 20252:2006.
© 2013 Ipsos MORI.
OG34. How did you find out about the tariff or payment method you changed to?
March ‘12 March ‘13
% %
Used an online/website price comparison service
26 24
Phoned a comparison service 7 4
Looked at supplier’s own website only 4 4
Looked at websites of more than one supplier
5 2
Supplier representative knocked at my door 12 8
Spoke to a salesperson in the street/shopping centre/other public place
5 3
They phoned me 8 8
I saw an advert 2 4
I rang them only 7 17
I rang them and other suppliers 2 5
A friend or family member told me about it 3 4
Written communication or marketing material from your supplier1
13 7
Other 5 8
Don’t know 7 5
Base: All who have gas or electricity and have changed tariff or payment method in 2012/2013 (219) OG35. Thinking about the last time you changed your tariff or payment method with your
supplier, how did you change it?
March ‘12 March ‘13
% %
Online price comparison service 17 20
Telephone price comparison service 7 5
Phoning supplier 34 42
Through the supplier’s website 7 4
Through a salesperson who knocked at my door
11 10
Through a salesperson in the street/shopping centre/other public
place
3 3
Written communications 6 4
Other 8 7
Don’t know 7 4
Base: All who have gas or electricity and have changed tariff or payment method in 2012/2013 (219)
1 In 2012 questionnaire, statement read: ‘Written communication or marketing material’
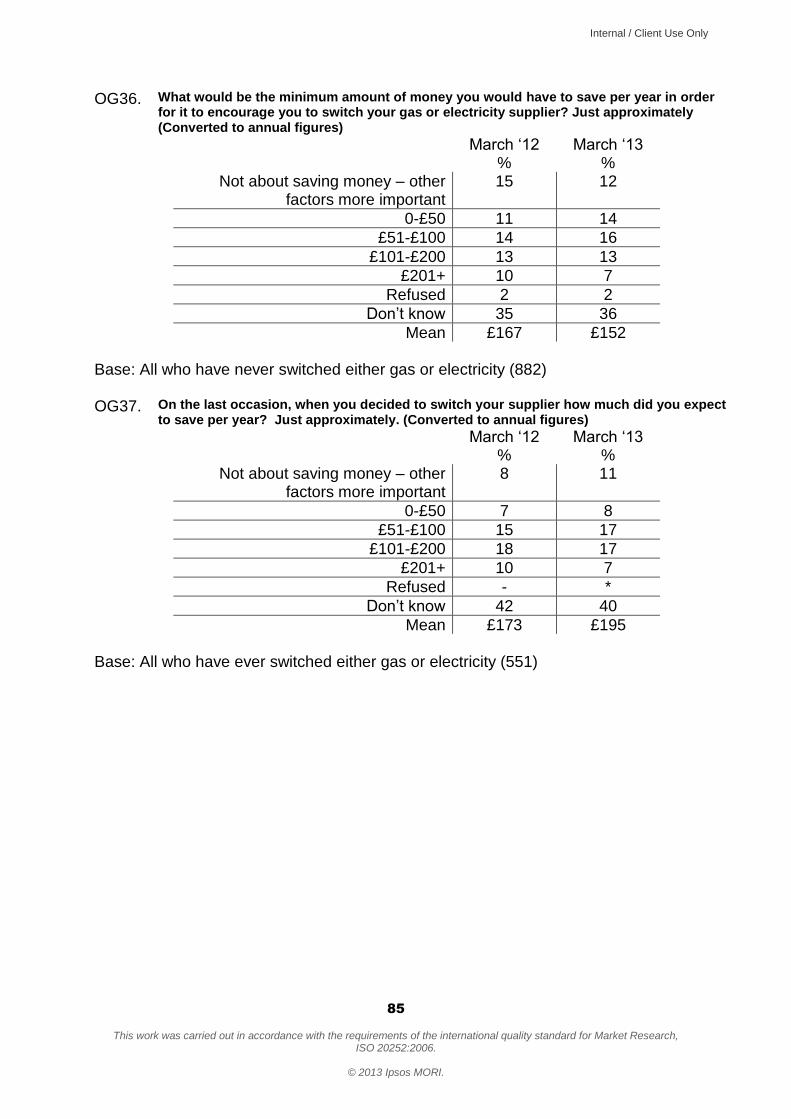
Internal / Client Use Only
85
This work was carried out in accordance with the requirements of the international quality standard for Market Research,
ISO 20252:2006.
© 2013 Ipsos MORI.
OG36. What would be the minimum amount of money you would have to save per year in order for it to encourage you to switch your gas or electricity supplier? Just approximately (Converted to annual figures)
March ‘12 March ‘13
% %
Not about saving money – other factors more important
15 12
0-£50 11 14
£51-£100 14 16
£101-£200 13 13
£201+ 10 7
Refused 2 2
Don’t know 35 36
Mean £167 £152
Base: All who have never switched either gas or electricity (882) OG37. On the last occasion, when you decided to switch your supplier how much did you expect
to save per year? Just approximately. (Converted to annual figures)
March ‘12 March ‘13
% %
Not about saving money – other factors more important
8 11
0-£50 7 8
£51-£100 15 17
£101-£200 18 17
£201+ 10 7
Refused - *
Don’t know 42 40
Mean £173 £195
Base: All who have ever switched either gas or electricity (551)

Internal / Client Use Only
86
This work was carried out in accordance with the requirements of the international quality standard for Market Research,
ISO 20252:2006.
© 2013 Ipsos MORI.
OG38. Which of these statements best applies to you?
March ‘08
March ‘10
January ‘11
March ‘12
March ‘13
% % % % % I am/we are keeping up
with all the household bills without any difficulties
70 63 62 66 62
I am/we are keeping up with all the household bills,
but it is a struggle from time to time
20 25 25 23 27
I am/we are keeping up with all the household bills, but it is a constant struggle
7 9 8 8 8
I am/we are falling behind with some household bills
1 1 1 1 1
I am/we are having real financial problems and have fallen behind with
many bills
2 1 1 1 1
Don’t know 0 2 2 2 * Base: All with mains electricity or gas and responsible for bills (1433) OG39. Using the answers here, how easy or difficult do you believe it is to compare
different tariffs for electricity or gas?1
%
Very easy 13
Fairly easy 23
Neither easy nor difficult 24
Fairly difficult 22
Very difficult 15
Don’t know 3
Base: All with mains electricity or gas and responsible for bills (1433)
1 New question introduced in 2013

Internal / Client Use Only
87
This work was carried out in accordance with the requirements of the international quality standard for Market Research,
ISO 20252:2006.
© 2013 Ipsos MORI.
OG40. What is it that makes them difficult to compare?
1
%
Difficult to understand/complicated/not
clear
31
Too many tariffs/ multiple rates/ structures/ choices
23
Hard to compare like for like
11
Not standardised information/ difficult deals/ prices in different formats
8
Too much jargon/ technical language/ terminology used
8
Other 8
Don’t know 6
Base: All those who answered ‘very/fairly difficult’ at OG39 (530) OG41. Thinking about the number of different tariffs available to you, in your view, are
there the right number of energy tariffs available, or are there too many tariffs or too few tariffs?
2
%
The right number of tariffs 20
Too many tariffs 62
Too few tariffs 5
Don’t know 14
Base: All those with mains electricity or gas and responsible for bills (1433) OG42. To what extent would you say you understand the range of different energy tariffs
available to you?3
%
Completely 10
A fair amount 35
Not very much 35
Not at all 19
Don’t know 2
Base: All with either mains gas or electricity who are responsible for bills (1433)
1 New question introduced in 2013 (Main answer codes only)
2 New question introduced in 2013
3 New question introduced in 2013

Internal / Client Use Only
88
This work was carried out in accordance with the requirements of the international quality standard for Market Research,
ISO 20252:2006.
© 2013 Ipsos MORI.
OG43. Please tell me if you recall receiving any of the following in the last year? You may have received these via post or email.
1
A. An annual statement (A yearly statement containing details about your own energy tariff and energy use)
%
Yes 63
No 34
Don’t know 4
B.
Base: All those with mains electricity or gas and responsible for bills (1433) At least one bill or statement of account
%
Yes 80
No 18
Don’t know 1
C.
Base: All those with mains electricity or gas and responsible for bills (1433) A price increase notification letter (A letter informing you that how much you pay for your energy will be increasing and outlining your options as a consumer.)
%
Yes 62
No 34
Don’t know 5
D.
Base: All not on fixed term contract for both electricity and gas (842) An end of fixed term letter (A letter informing you your fixed term tariff is coming to an end)
%
Yes 32
No 66
Don’t know 2
Base: All on fixed term for at least one fuel (762)
1 New question introduced in 2013

Internal / Client Use Only
89
This work was carried out in accordance with the requirements of the international quality standard for Market Research,
ISO 20252:2006.
© 2013 Ipsos MORI.
OG44. Thinking about the last annual statement you received, in how much detail did you look at it?
1
%
Read it in detail 40
Glanced over it or skim read it
49
Only saw what it was, but did not read it
7
Did not read it at all 5
Base: All received annual statement in the last year (889) OG45. Thinking about last annual statement you received, to what extent do you agree or disagree with
the following statements?2
Strongly
agree Tend
to agree
Neither agree nor
disagree
Tend to disagree
Strongly disagree
No opinion/
don’t know
A) I understood the information
34 43 14 7 2 -
B) The information made me consider my energy options
15 28 25 18 14 -
C) I took action as a result of reading this
information. For example I looked into,
or actually switched supplier, tariff or payment method
12 16 20 23 29 -
Base: All read in detail /glanced over annual statement (788) OG46. Thinking about the last bill or statement of account you received, in how much detail did
you look at it?3
%
Read it in detail 40
Glanced over it or skim read it
46
Only saw what it was, but did not read it
8
Did not read it at all 6
Base: All received bill or statement of account in last year (1129)
1 New question introduced in 2013
2 New question introduced in 2013
3 New question introduced in 2013
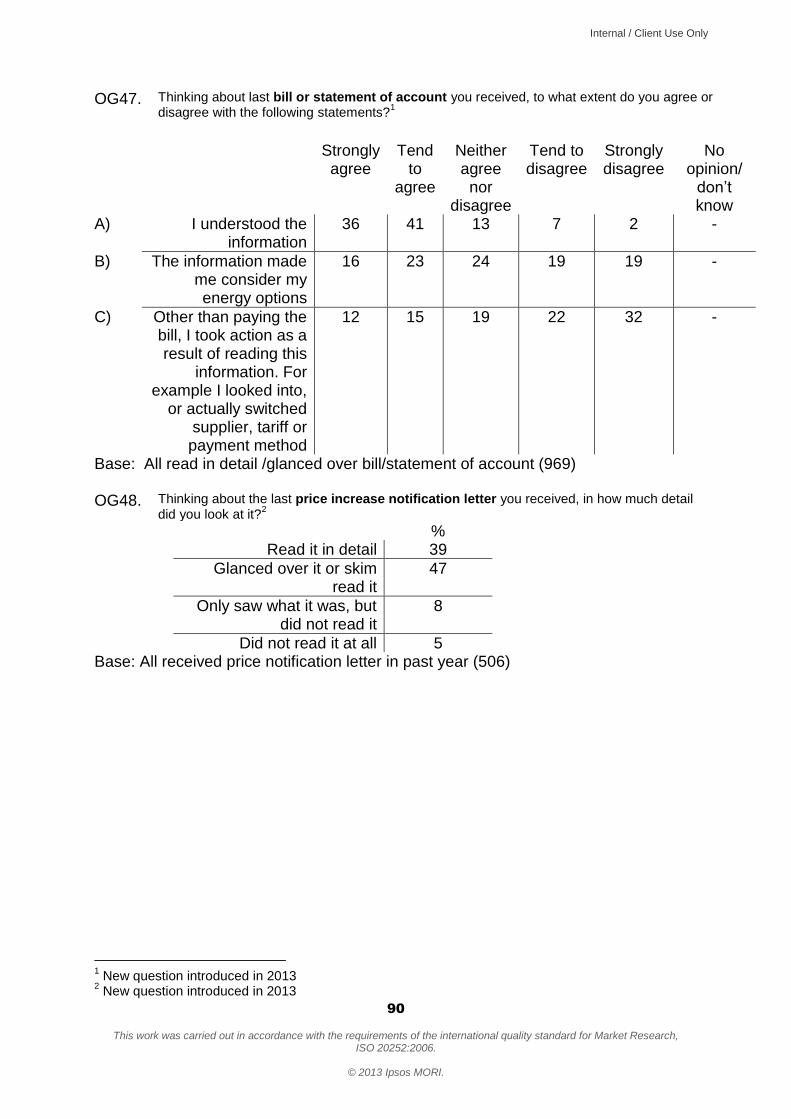
Internal / Client Use Only
90
This work was carried out in accordance with the requirements of the international quality standard for Market Research,
ISO 20252:2006.
© 2013 Ipsos MORI.
OG47. Thinking about last bill or statement of account you received, to what extent do you agree or disagree with the following statements?
1
Strongly
agree Tend
to agree
Neither agree nor
disagree
Tend to disagree
Strongly disagree
No opinion/
don’t know
A) I understood the information
36 41 13 7 2 -
B) The information made me consider my energy options
16 23 24 19 19 -
C) Other than paying the bill, I took action as a result of reading this
information. For example I looked into,
or actually switched supplier, tariff or payment method
12 15 19 22 32 -
Base: All read in detail /glanced over bill/statement of account (969) OG48. Thinking about the last price increase notification letter you received, in how much detail
did you look at it?2
%
Read it in detail 39
Glanced over it or skim read it
47
Only saw what it was, but did not read it
8
Did not read it at all 5
Base: All received price notification letter in past year (506)
1 New question introduced in 2013
2 New question introduced in 2013

Internal / Client Use Only
91
This work was carried out in accordance with the requirements of the international quality standard for Market Research,
ISO 20252:2006.
© 2013 Ipsos MORI.
OG49. Thinking about last price increase notification letter you received, to what extent do you agree or disagree with the following statements?1
Strongly
agree Tend
to agree
Neither agree nor
disagree
Tend to disagree
Strongly disagree
No opinion/
don’t know
A) I understood the information
37 42 11 8 2 -
B) The information made me consider my energy options
15 24 21 21 20 -
C) I took action as a result of reading this
information. For example I looked into,
or actually switched supplier, tariff or payment method
11 14 18 24 33 -
Base: All read in detail /glanced over price notification letter (436) OG50. Thinking about the last end of fixed term letter you received, in how much detail did you
look at it?2
%
Read it in detail 53
Glanced over it or skim read it
37
Only saw what it was, but did not read it
7
Did not read it at all 3
Base: All received end of fixed term letter in past year (248)
1 New question introduced in 2013
2 New question introduced in 2013

Internal / Client Use Only
92
This work was carried out in accordance with the requirements of the international quality standard for Market Research,
ISO 20252:2006.
© 2013 Ipsos MORI.
OG51. Thinking about last end of fixed term letter you received, to what extent do you agree or disagree with the following statements?
1
Strongly
agree Tend
to agree
Neither agree nor
disagree
Tend to disagree
Strongly disagree
No opinion/
don’t know
A) I understood the information
39 42 13 6 * -
B) The information made me consider my energy options
27 33 20 9 12 -
C) I took action as a result of reading this
information. For example I looked into,
or actually switched supplier, tariff or payment method
27 21 23 14 14 -
Base: All read in detail /glanced over end of fixed term letter (220) OG52. Using the words here, please tell me the extent to which you trust or distrust energy suppliers to be open
and transparent in their dealings with consumers?2
March ‘12 March ‘13
% %
Trust completely 6 5
Tend to trust 28 25
Neither trust nor distrust 26 27
Tend to distrust 26 26
Distrust completely 13 18
Don’t know 2 *
Base: All with mains electricity or gas and responsible for bills (1433)
1 New question introduced in 2013
2 New question introduced in 2013

Internal / Client Use Only
93
This work was carried out in accordance with the requirements of the international quality standard for Market Research,
ISO 20252:2006.
© 2013 Ipsos MORI.
OG53. Who is your current electricity supplier?1
%
British Gas 27
E.ON 19
EDF 11
Scottish Power 11
npower 10
Southern Energy 7
SSE 3
Scottish Hydro 2
Swalec 2
First Utility 1
Ecotricity 1
Co-operative Energy *
Ebico *
Good Energy *
Marks & Spencer Energy *
Ovo *
Sainsburys Energy *
Spark Energy *
Other *
Don’t know 2
Base: All with mains electricity and responsible for bills (1408) 1 New question introduced in 2013
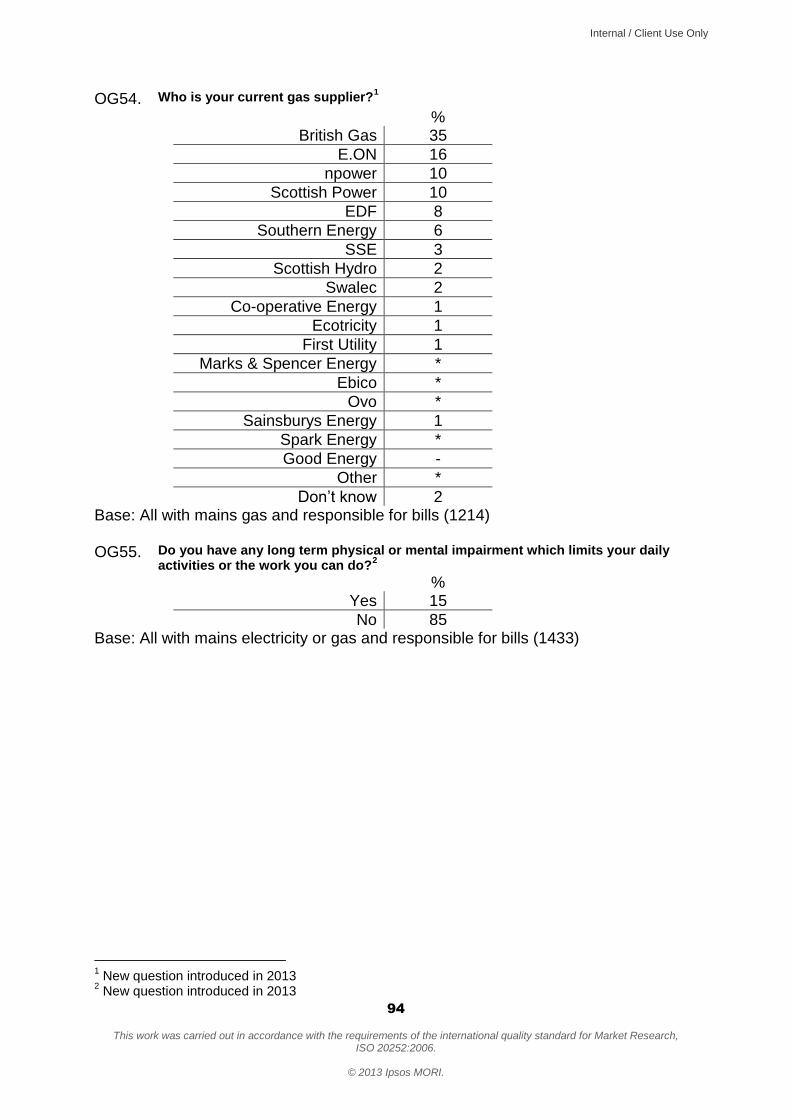
Internal / Client Use Only
94
This work was carried out in accordance with the requirements of the international quality standard for Market Research,
ISO 20252:2006.
© 2013 Ipsos MORI.
OG54. Who is your current gas supplier?1
%
British Gas 35
E.ON 16
npower 10
Scottish Power 10
EDF 8
Southern Energy 6
SSE 3
Scottish Hydro 2
Swalec 2
Co-operative Energy 1
Ecotricity 1
First Utility 1
Marks & Spencer Energy *
Ebico *
Ovo *
Sainsburys Energy 1
Spark Energy *
Good Energy -
Other *
Don’t know 2
Base: All with mains gas and responsible for bills (1214) OG55. Do you have any long term physical or mental impairment which limits your daily
activities or the work you can do?2
%
Yes 15
No 85
Base: All with mains electricity or gas and responsible for bills (1433)
1 New question introduced in 2013
2 New question introduced in 2013