Customer Engagement Study - Ausgrid/media/Files/Network/Planning for the... · 3 Customer...
88
Customer Engagement Study Prepared for: Ausgrid July 2013
Transcript of Customer Engagement Study - Ausgrid/media/Files/Network/Planning for the... · 3 Customer...
Customer Engagement Study Prepared for: Ausgrid July 2013
2
Customer Engagement Study July 2013
1. Contents
1. Background ........................................................................................................................ 3
2. Key Objectives and Areas of Coverage ............................................................................... 4
3. Research Design ................................................................................................................. 6
3.1 Qualitative Research Design ............................................................................................ 6
3.2 Quantitative Research Design .......................................................................................... 7
4. Main Findings................................................................................................................... 11
4.1 Awareness of Ausgrid .................................................................................................... 11
4.3 Safety ............................................................................................................................ 19
4.4 Construction/Design Standards ..................................................................................... 23
4.6 Connection Fees ............................................................................................................ 30
4.7 Energy Efficiency Programs ............................................................................................ 32
4.8 Demand Management ................................................................................................... 35
4.9 Metering Technology ..................................................................................................... 40
4.10 Awareness and Perceptions of Time Based Pricing ...................................................... 47
4.11 Communication and Engagement ................................................................................ 50
4.12 Support for Vulnerable Households ............................................................................. 51
5. Conclusions ...................................................................................................................... 54
APPENDICES…………………………………………………………………………………………………………………………..62
3
Customer Engagement Study July 2013
1. Background
Ausgrid is a state owned corporation whose shareholder is the New South Wales Government. The Ausgrid electricity network provides power to 1.6 million homes and businesses throughout Sydney, the Hunter and the Central Coast.
On 2 March 2011 EnergyAustralia changed its name to Ausgrid, after selling the retail part of its business. Ausgrid has continued to work to provide a safe and reliable electricity network for its customers, both in Sydney and north of the Hawkesbury River.
Ausgrid aims to be a leader in distributing electricity and providing energy services and its main activities include:
• asset ownership and management of the electricity distribution and transmission network;
• infrastructure related construction and maintenance services; • a range of other services, including street lighting, safety check-ups, energy reviews;
and, • metering and 24-hour electrical repairs.
Ausgrid will deliver these activities ensuring that:
• its network is safe and reliable; • its customers value its service; • its staff are proud to work there; and, • its community recognises its values, contributions, citizenship and achievements.
To ensure customer needs, perceptions and preferences are fully understood and to allow a focus on areas where changes can be made and forecasted for, Ausgrid plans to carry out a number of customer engagement activities during 2013.
A part of that customer engagement has involved a large scale consumer and small to medium enterprise qualitative and quantitative research study, gauging satisfaction levels, and perceptions across a range of aspects. This report contains the findings of that research.

4
Customer Engagement Study July 2013
2. Key Objectives and Areas of Coverage This research allowed for sensitive exploration of all of the issues that may be impacting on customers’ perceptions, as well as accurate measurement of the prevalence of these views amongst the customer bases. It involved sensitive qualitative consultation with groups of customers from the various expenditure/usage and income segments, followed by a quantification of the key findings emerging from the qualitative exploration amongst a robust sample of customers across the Ausgrid footprint. The areas of investigation included the following broad areas: 1. Reliability Customer perceptions and experiences regarding power interruptions, their frequency
and duration, and the communication required before, during and after outages; The relationship between reliability and price, and customers willingness to pay to
achieve minimal disruptions; and,
2. Pricing Exploration of perceptions surrounding pricing and the recent increases; The degree to which appliance use and purchase has been impacted as a result, and
the extent to which this is impacted by seasons and temperatures; Future changes/behaviours if price were to remain constant; and, Exploration of reactions to pricing options which reflects costs.
3. Construction/design standards Views regarding connection costs and equity in connection pricing; Customer feelings regarding aspects surrounding construction including the role of
aesthetics and overground/underground options; The perceptions regarding environmental and safety considerations and options; and, Willingness to pay for construction options, and attitudes about a contribution to
connection costs
4. Metering Technology Attitudes towards advanced metering and the perceived value of the various features
of it, such as access to real time information, remote reading and time-based pricing; Willingness to pay for access to the technology
5
Customer Engagement Study July 2013
5. Demand Management/energy efficiency Customer attitudes toward a range of energy efficiency initiatives; Comprehension of and reactions to demand management initiatives; and, Willingness to pay for efficiency and demand management programs.
6. Support for vulnerable households Feelings regarding the support of vulnerable customers, and where responsibility
should lie; Levels of support felt necessary; Views regarding which segments of the community should receive support; and, The extent to which customers are prepared to pay to help ensure this support can be
provided.
7. Communication and Engagement Exploration of customer needs and wants with regard to information provided by
Ausgrid and the level of communication engagement and involvement felt optimal; and,
Ratings of information provided currently with regard to transparency, timeliness, extent of coverage and ease of understanding;,
The above areas of investigation were explored in relation to any individual income/usage segments, and trends or patterns across age, gender, household type and location.
6
Customer Engagement Study July 2013
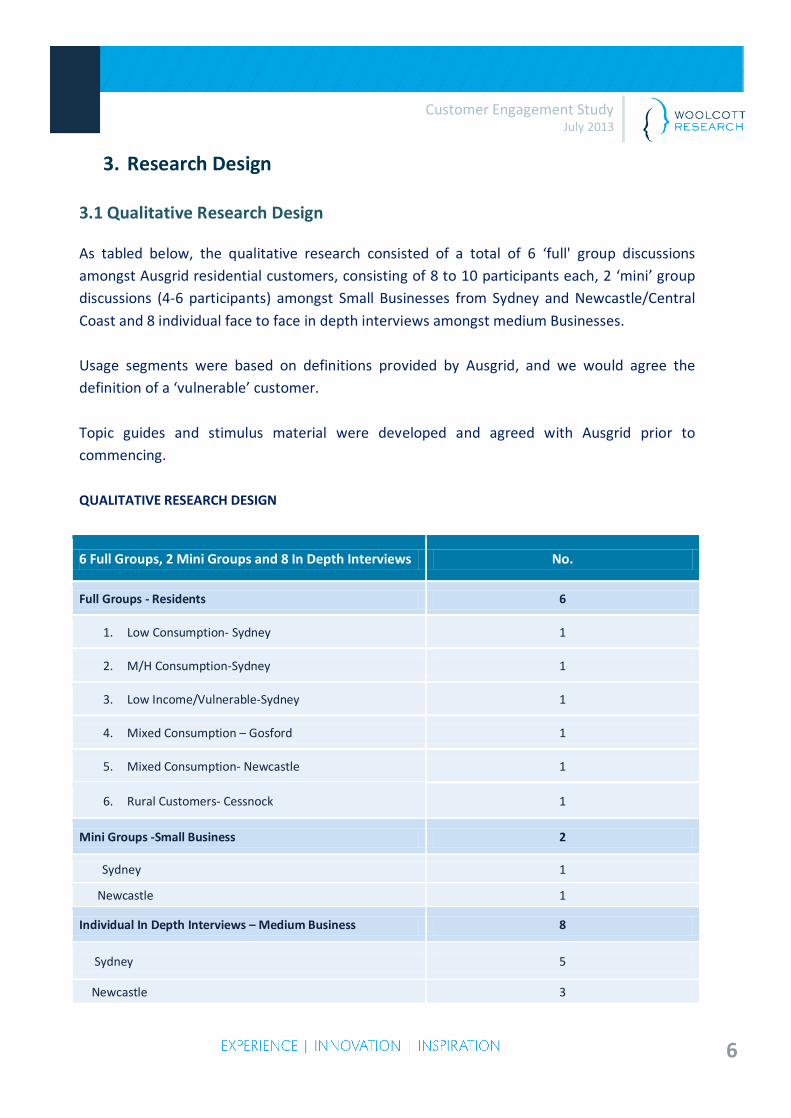
3. Research Design 3.1 Qualitative Research Design As tabled below, the qualitative research consisted of a total of 6 ‘full' group discussions amongst Ausgrid residential customers, consisting of 8 to 10 participants each, 2 ‘mini’ group discussions (4-6 participants) amongst Small Businesses from Sydney and Newcastle/Central Coast and 8 individual face to face in depth interviews amongst medium Businesses. Usage segments were based on definitions provided by Ausgrid, and we would agree the definition of a ‘vulnerable’ customer. Topic guides and stimulus material were developed and agreed with Ausgrid prior to commencing. QUALITATIVE RESEARCH DESIGN
6 Full Groups, 2 Mini Groups and 8 In Depth Interviews No.
Full Groups - Residents 6
1. Low Consumption- Sydney 1
2. M/H Consumption-Sydney 1
3. Low Income/Vulnerable-Sydney 1
4. Mixed Consumption – Gosford 1
5. Mixed Consumption- Newcastle 1
6. Rural Customers- Cessnock 1
Mini Groups -Small Business 2
Sydney 1
Newcastle 1
Individual In Depth Interviews – Medium Business 8
Sydney 5
Newcastle 3
7
Customer Engagement Study July 2013
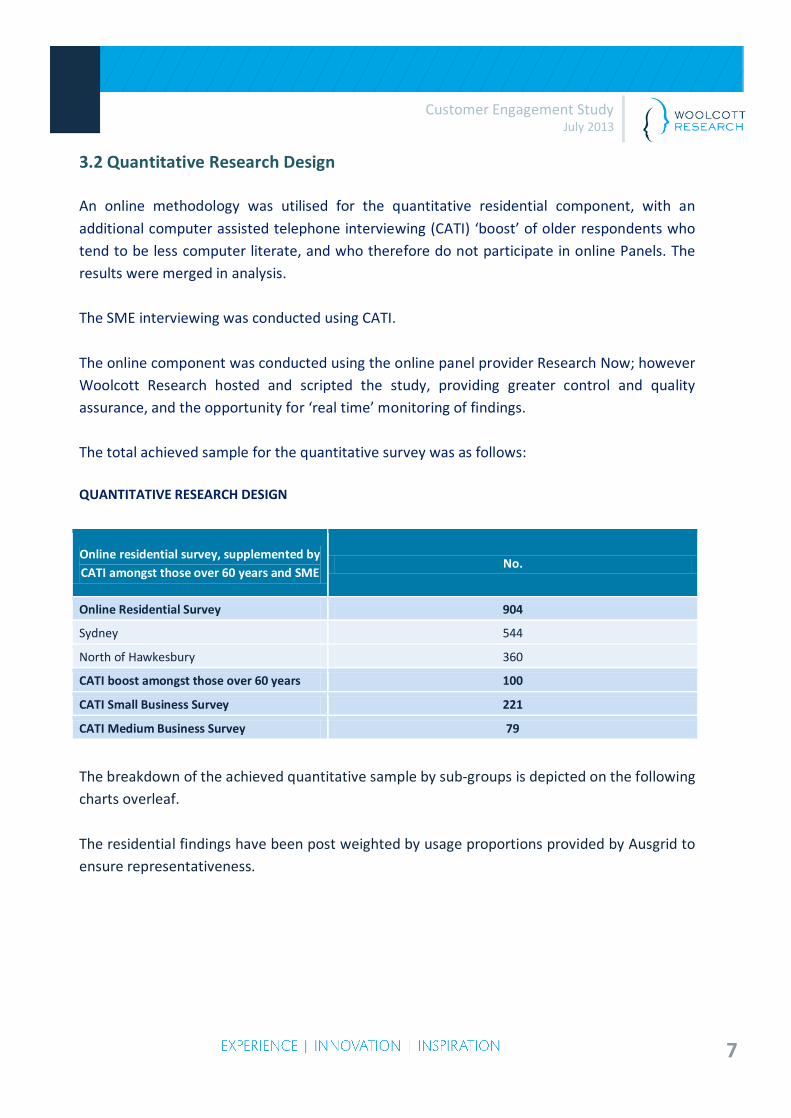
3.2 Quantitative Research Design An online methodology was utilised for the quantitative residential component, with an additional computer assisted telephone interviewing (CATI) ‘boost’ of older respondents who tend to be less computer literate, and who therefore do not participate in online Panels. The results were merged in analysis. The SME interviewing was conducted using CATI. The online component was conducted using the online panel provider Research Now; however Woolcott Research hosted and scripted the study, providing greater control and quality assurance, and the opportunity for ‘real time’ monitoring of findings. The total achieved sample for the quantitative survey was as follows: QUANTITATIVE RESEARCH DESIGN
Online residential survey, supplemented by CATI amongst those over 60 years and SME
No.
Online Residential Survey 904
Sydney 544
North of Hawkesbury 360
CATI boost amongst those over 60 years 100
CATI Small Business Survey 221
CATI Medium Business Survey 79
The breakdown of the achieved quantitative sample by sub-groups is depicted on the following charts overleaf. The residential findings have been post weighted by usage proportions provided by Ausgrid to ensure representativeness.
8
Customer Engagement Study July 2013
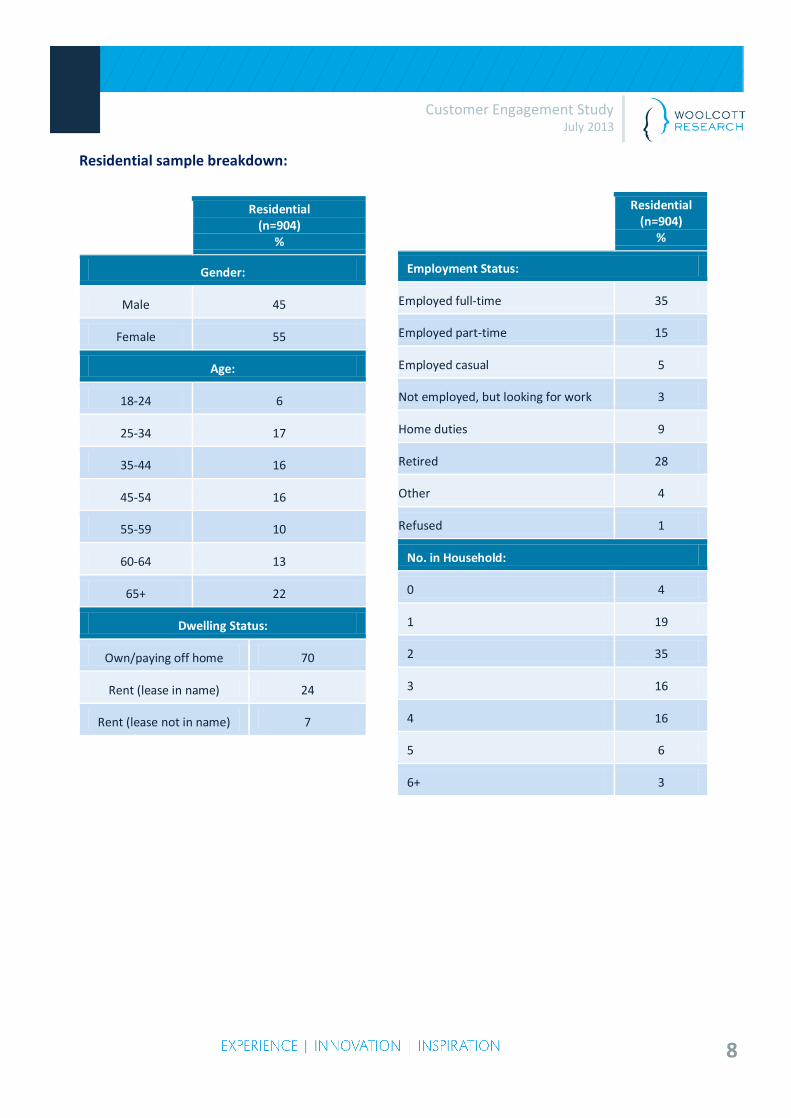
Residential sample breakdown:
Residential (n=904)
%
Employment Status:
Employed full-time 35
Employed part-time 15
Employed casual 5
Not employed, but looking for work 3
Home duties 9
Retired 28
Other 4
Refused 1
No. in Household:
0 4
1 19
2 35
3 16
4 16
5 6
6+ 3
Residential
(n=904) %
Gender:
Male 45
Female 55
Age:
18-24 6
25-34 17
35-44 16
45-54 16
55-59 10
60-64 13
65+ 22
Dwelling Status:
Own/paying off home 70
Rent (lease in name) 24
Rent (lease not in name) 7
9
Customer Engagement Study July 2013
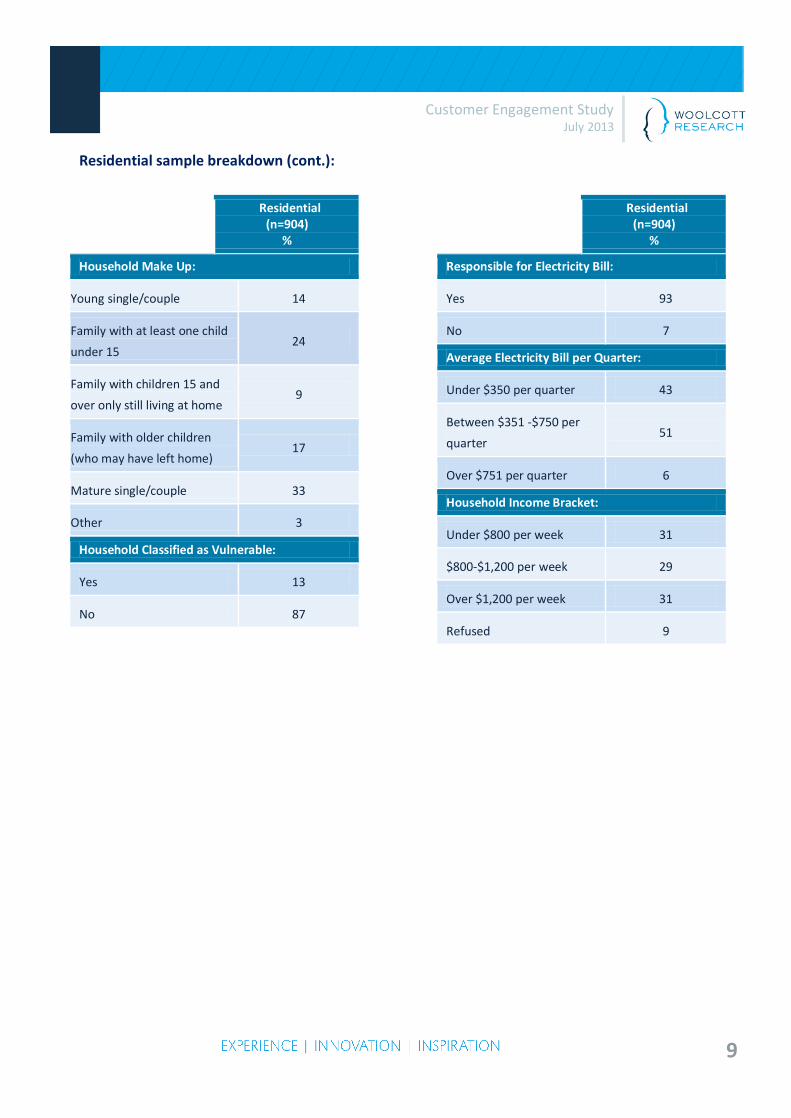
Residential sample breakdown (cont.):
Residential
(n=904) %
Household Make Up:
Young single/couple 14
Family with at least one child
under 15 24
Family with children 15 and
over only still living at home 9
Family with older children
(who may have left home) 17
Mature single/couple 33
Other 3
Household Classified as Vulnerable:
Yes 13
No 87
Residential
(n=904) %
Responsible for Electricity Bill:
Yes 93
No 7
Average Electricity Bill per Quarter:
Under $350 per quarter 43
Between $351 -$750 per
quarter 51
Over $751 per quarter 6
Household Income Bracket:
Under $800 per week 31
$800-$1,200 per week 29
Over $1,200 per week 31
Refused 9
10
Customer Engagement Study July 2013
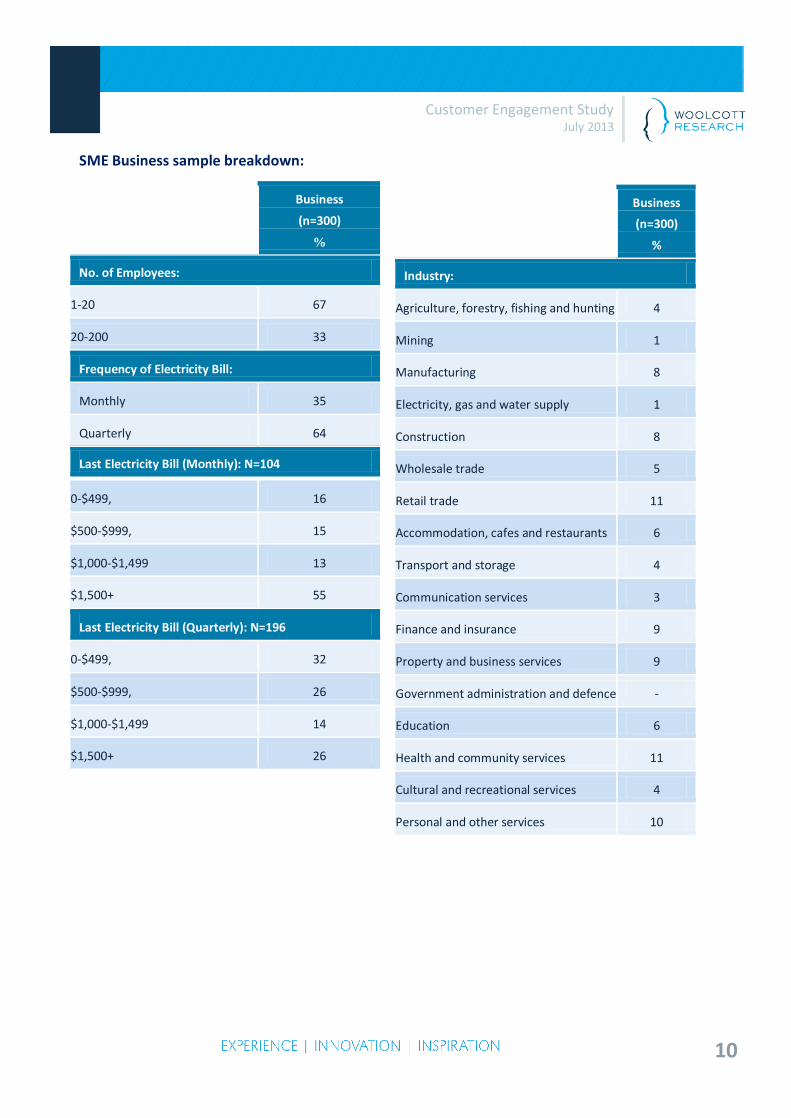
SME Business sample breakdown:
Business
(n=300)
%
Industry:
Agriculture, forestry, fishing and hunting 4
Mining 1
Manufacturing 8
Electricity, gas and water supply 1
Construction 8
Wholesale trade 5
Retail trade 11
Accommodation, cafes and restaurants 6
Transport and storage 4
Communication services 3
Finance and insurance 9
Property and business services 9
Government administration and defence -
Education 6
Health and community services 11
Cultural and recreational services 4
Personal and other services 10
Business
(n=300)
%
No. of Employees:
1-20 67
20-200 33
Frequency of Electricity Bill:
Monthly 35
Quarterly 64
Last Electricity Bill (Monthly): N=104
0-$499, 16
$500-$999, 15
$1,000-$1,499 13
$1,500+ 55
Last Electricity Bill (Quarterly): N=196
0-$499, 32
$500-$999, 26
$1,000-$1,499 14
$1,500+ 26
11
Customer Engagement Study July 2013
4. Main Findings
4.1 Awareness of Ausgrid To assess the level and depth of awareness of Ausgrid, at the beginning of the qualitative research participants were asked whether they knew of Ausgrid prior to that day. The responses indicated there was relatively high awareness of Ausgrid when prompted, however few knew very much about the organisation and its role in any depth. Most of those aware had just heard the name. Some had seen Ausgrid workers in the street, upgrading, digging, or changing power poles, but there was very little awareness of any detail beyond that. Some questioned whether Ausgrid was partly private or Government owned.
“Who owns them? Macquarie Bank??”
A minority had heard that there was talk of privatisation of Ausgrid, and there was some low level awareness that Ausgrid used to be EnergyAustralia, however overall there was a lot of confusion about the roles of the distributor versus the retailers. Overall most in the qualitative research felt that the ‘relationship’ they had was with the retailer only, and the retailer was generally the organisation they thought of in regard to who to call if there was a blackout or problem with supply. Also the retailer sent the bill each quarter and therefore participants clearly saw themselves as ’customers’ of the retailers, rather than the distributor. At the beginning of the qualitative discussions, as soon as it became clear the groups were about energy, recent price rises were immediately and spontaneously raised, in an emotional and somewhat vexed manner. The majority did not understand why there had been recent price rises and where exactly they had come from. Some participants linked them with the Carbon Tax, some with upgrading as a result of previous neglect. There was quite a wide ranging assumption that all energy companies, including Ausgrid were trying to make as much money as possible (for shareholders if they assume it is a private company) or for the government.
“Our usage has gone down but our bill has gone up.”
12
Customer Engagement Study July 2013
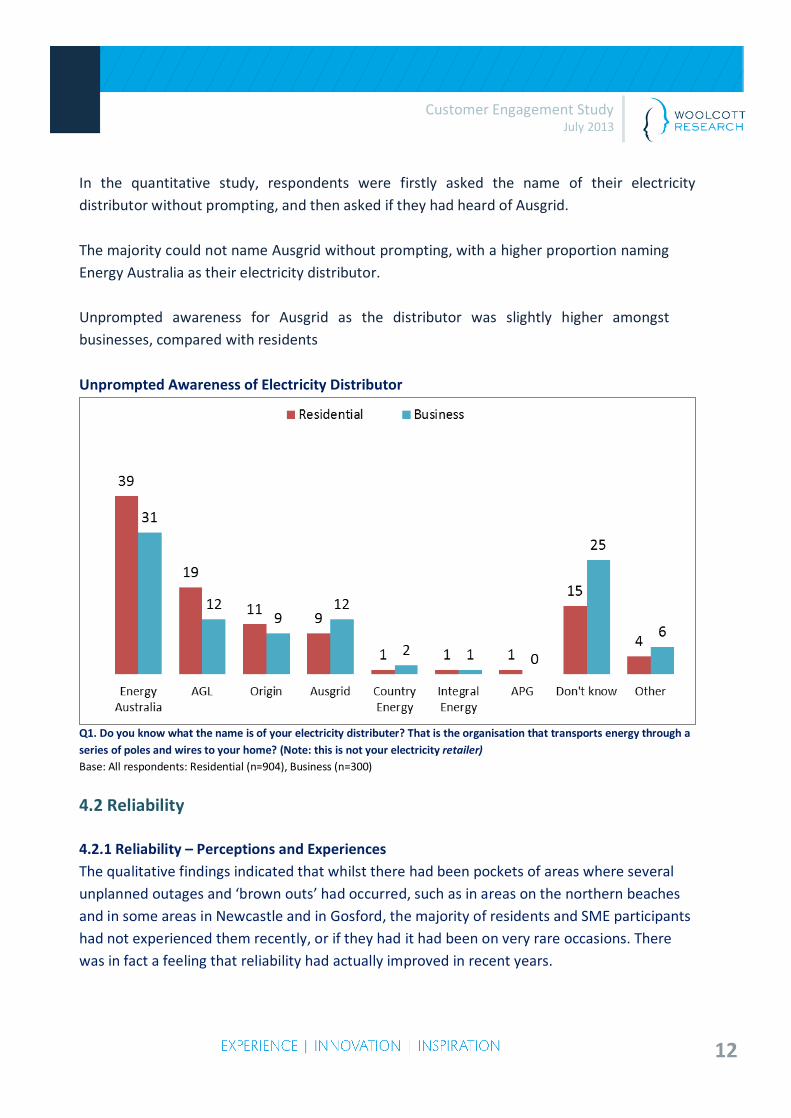
In the quantitative study, respondents were firstly asked the name of their electricity distributor without prompting, and then asked if they had heard of Ausgrid. The majority could not name Ausgrid without prompting, with a higher proportion naming Energy Australia as their electricity distributor. Unprompted awareness for Ausgrid as the distributor was slightly higher amongst businesses, compared with residents Unprompted Awareness of Electricity Distributor
Q1. Do you know what the name is of your electricity distributer? That is the organisation that transports energy through a series of poles and wires to your home? (Note: this is not your electricity retailer) Base: All respondents: Residential (n=904), Business (n=300)
4.2 Reliability 4.2.1 Reliability – Perceptions and Experiences The qualitative findings indicated that whilst there had been pockets of areas where several unplanned outages and ‘brown outs’ had occurred, such as in areas on the northern beaches and in some areas in Newcastle and in Gosford, the majority of residents and SME participants had not experienced them recently, or if they had it had been on very rare occasions. There was in fact a feeling that reliability had actually improved in recent years.
13
Customer Engagement Study July 2013
When outages had occurred, it appeared that the power was generally not interrupted for very long, and so outages were no longer considered a big inconvenience, even for the small to medium businesses.
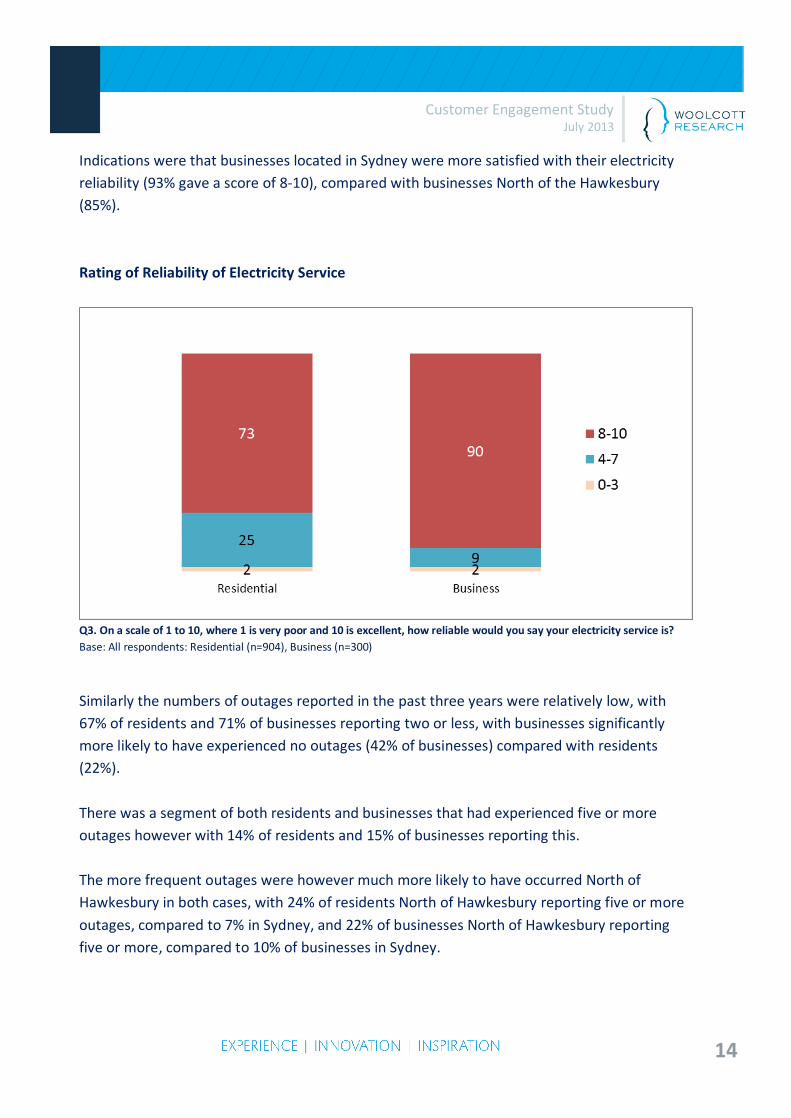
“If it does happen it can be fun. The kids have the candles etc.” Usually the cause for the unplanned outage was assumed to be beyond the distributor’s control, and caused by things such as car crashes or trees and branches coming down on power lines. When there was an outage, those affected initially assessed whether it was just their house or business, or the whole of the street or neighbourhood. After a certain length of time (usually around one or two hours) some would ring their retailer to find out when the power was expected to return, whilst others just waited or asked the neighbours if they knew what was happening. Few of those who had been affected wanted to know very much information about the outage and those who rang the retailer felt that they generally found out all they needed to know. Most only wanted to know when the electricity would come back on, with a minority wanting to know the reason for the outage just to reassure them that there were no serious issues. When ringing a retailer for information a recorded message which provided an estimate of when the electricity would return was felt to be sufficient. The idea of an SMS sent to those affected by an outage was tested in the qualitative research, and the majority felt that this was a very positive idea, however it was felt this should just be one of the sources of information, with others being media commentary or a proactive landline phone call to those without a mobile. For a pre-planned power interruption it was expected a warning by letter or a card would be provided on site, such as under the door, with information about when it would happen and for how long. Most reported that this was usually already provided. In the quantitative research the majority of respondents gave a very high score (of 8-10) for the reliability of their electricity service. Businesses in particular gave a significantly higher rating of scores 8-10.
14
Customer Engagement Study July 2013
Indications were that businesses located in Sydney were more satisfied with their electricity reliability (93% gave a score of 8-10), compared with businesses North of the Hawkesbury (85%). Rating of Reliability of Electricity Service
Q3. On a scale of 1 to 10, where 1 is very poor and 10 is excellent, how reliable would you say your electricity service is? Base: All respondents: Residential (n=904), Business (n=300)
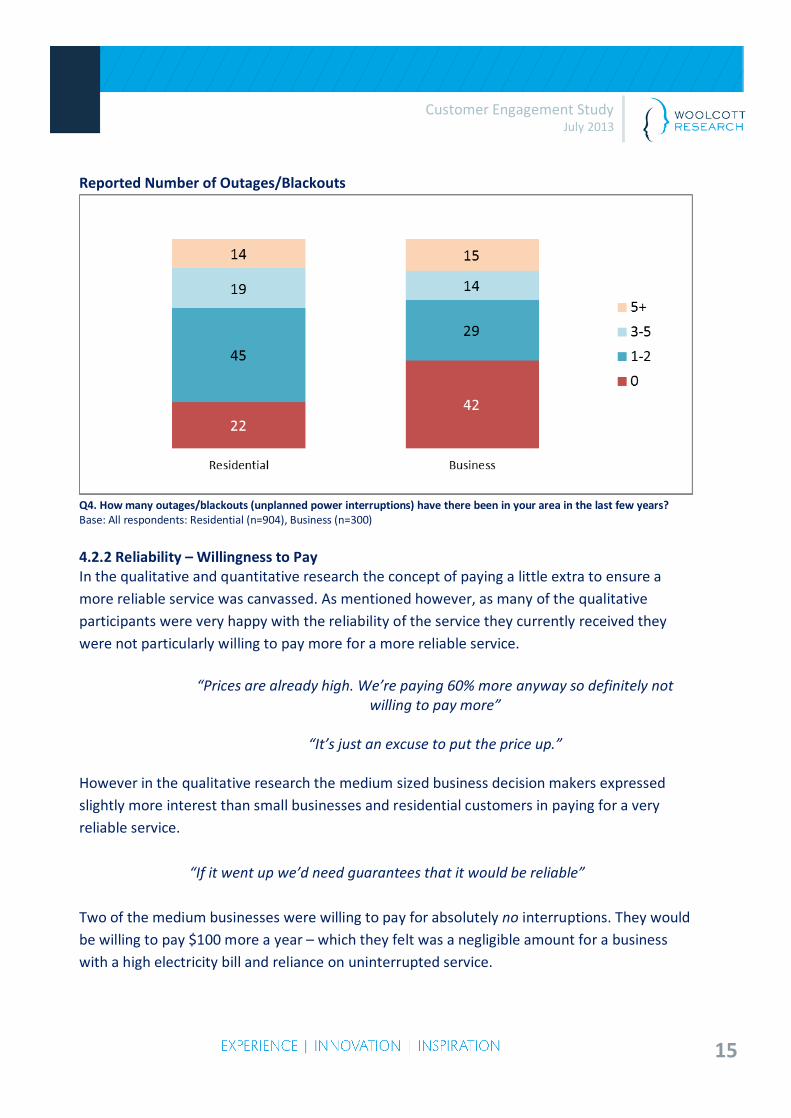
Similarly the numbers of outages reported in the past three years were relatively low, with 67% of residents and 71% of businesses reporting two or less, with businesses significantly more likely to have experienced no outages (42% of businesses) compared with residents (22%). There was a segment of both residents and businesses that had experienced five or more outages however with 14% of residents and 15% of businesses reporting this. The more frequent outages were however much more likely to have occurred North of Hawkesbury in both cases, with 24% of residents North of Hawkesbury reporting five or more outages, compared to 7% in Sydney, and 22% of businesses North of Hawkesbury reporting five or more, compared to 10% of businesses in Sydney.
15
Customer Engagement Study July 2013
Reported Number of Outages/Blackouts
Q4. How many outages/blackouts (unplanned power interruptions) have there been in your area in the last few years? Base: All respondents: Residential (n=904), Business (n=300)
4.2.2 Reliability – Willingness to Pay In the qualitative and quantitative research the concept of paying a little extra to ensure a more reliable service was canvassed. As mentioned however, as many of the qualitative participants were very happy with the reliability of the service they currently received they were not particularly willing to pay more for a more reliable service.
“Prices are already high. We’re paying 60% more anyway so definitely not
willing to pay more”
“It’s just an excuse to put the price up.”
However in the qualitative research the medium sized business decision makers expressed slightly more interest than small businesses and residential customers in paying for a very reliable service.
“If it went up we’d need guarantees that it would be reliable” Two of the medium businesses were willing to pay for absolutely no interruptions. They would be willing to pay $100 more a year – which they felt was a negligible amount for a business with a high electricity bill and reliance on uninterrupted service.
16
Customer Engagement Study July 2013
Some of the medium sized businesses mentioned that they, and other businesses like them, had their own ‘uninterrupted power supply’ (UPS) to keep power going in the event of an outage because the power was so crucial to their business. Participants were also asked if they would be willing to pay less for a less reliable service, however this also was not very well received.There was an assumption that the power supply should be reliable and that this was absolutely expected in a country with the standard of living of Australia. It was expected that a very reliable service should be available all the time.
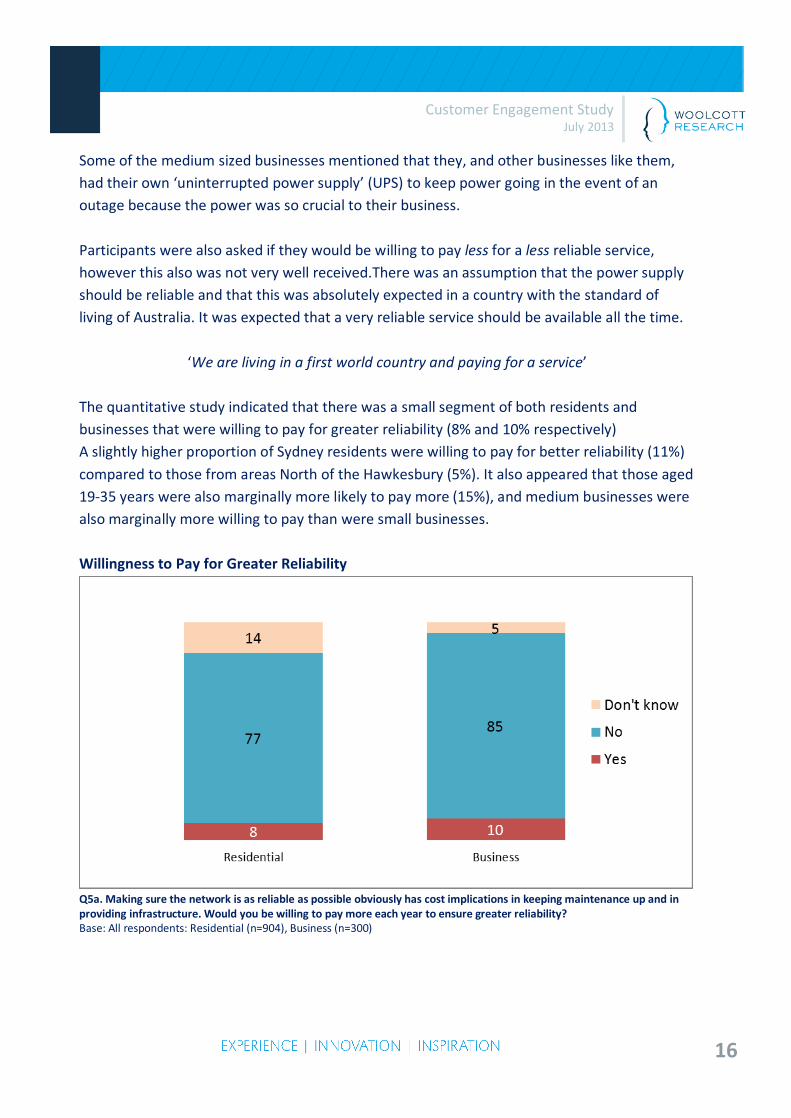
‘We are living in a first world country and paying for a service’ The quantitative study indicated that there was a small segment of both residents and businesses that were willing to pay for greater reliability (8% and 10% respectively) A slightly higher proportion of Sydney residents were willing to pay for better reliability (11%) compared to those from areas North of the Hawkesbury (5%). It also appeared that those aged 19-35 years were also marginally more likely to pay more (15%), and medium businesses were also marginally more willing to pay than were small businesses. Willingness to Pay for Greater Reliability
Q5a. Making sure the network is as reliable as possible obviously has cost implications in keeping maintenance up and in providing infrastructure. Would you be willing to pay more each year to ensure greater reliability? Base: All respondents: Residential (n=904), Business (n=300)
17
Customer Engagement Study July 2013
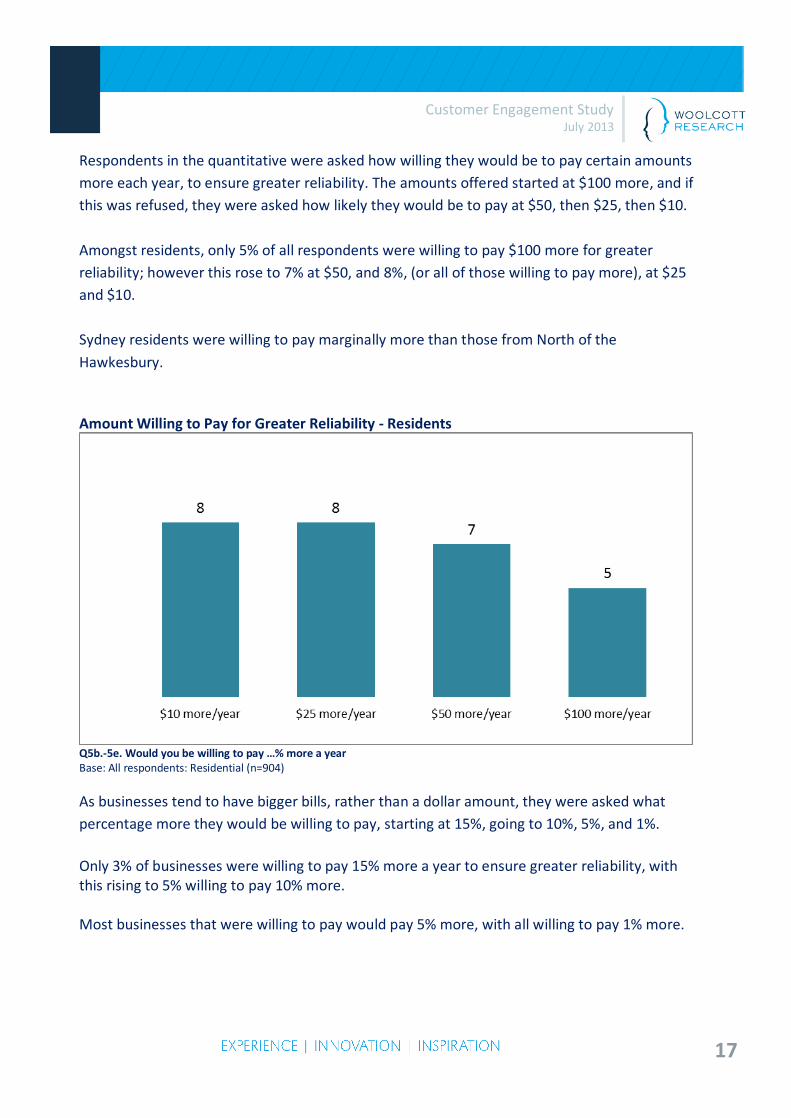
Respondents in the quantitative were asked how willing they would be to pay certain amounts more each year, to ensure greater reliability. The amounts offered started at $100 more, and if this was refused, they were asked how likely they would be to pay at $50, then $25, then $10. Amongst residents, only 5% of all respondents were willing to pay $100 more for greater reliability; however this rose to 7% at $50, and 8%, (or all of those willing to pay more), at $25 and $10. Sydney residents were willing to pay marginally more than those from North of the Hawkesbury. Amount Willing to Pay for Greater Reliability - Residents
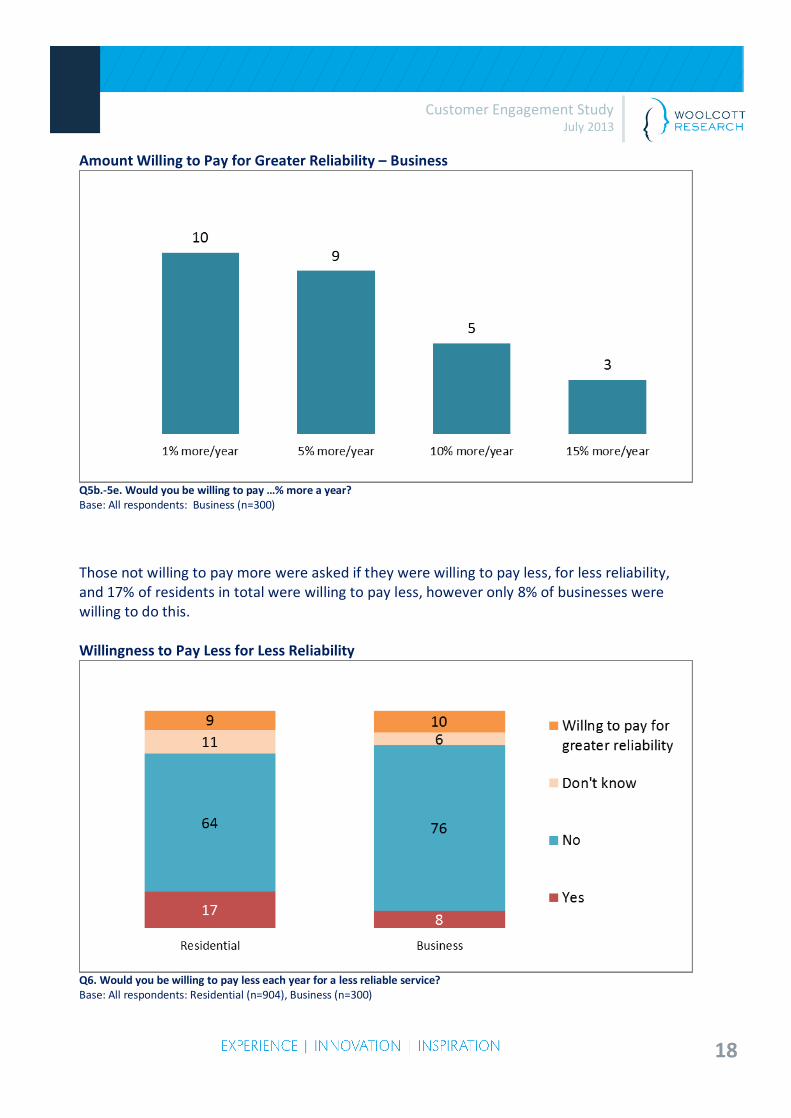
Q5b.-5e. Would you be willing to pay …% more a year Base: All respondents: Residential (n=904) As businesses tend to have bigger bills, rather than a dollar amount, they were asked what percentage more they would be willing to pay, starting at 15%, going to 10%, 5%, and 1%. Only 3% of businesses were willing to pay 15% more a year to ensure greater reliability, with this rising to 5% willing to pay 10% more. Most businesses that were willing to pay would pay 5% more, with all willing to pay 1% more.
18
Customer Engagement Study July 2013
Amount Willing to Pay for Greater Reliability – Business
Q5b.-5e. Would you be willing to pay …% more a year? Base: All respondents: Business (n=300)
Those not willing to pay more were asked if they were willing to pay less, for less reliability, and 17% of residents in total were willing to pay less, however only 8% of businesses were willing to do this. Willingness to Pay Less for Less Reliability
Q6. Would you be willing to pay less each year for a less reliable service? Base: All respondents: Residential (n=904), Business (n=300)
19
Customer Engagement Study July 2013
4.3 Safety 4.3.1 Safety – Perceptions and Experiences When the qualitative participants were asked about what they felt were the safety risks involved in the provision of power, participants generally thought of injuries for workers and of the possibility of power lines coming down and causing fires, but they could envision little beyond those aspects. When prompted with some suggestions, including the possibility that children could be injured if they were able to get into substations, participants were surprised as it was thought that there already was very secure fencing around these facilities. Some thought they had noticed safety precautions such as gravel placed around the outside of substations to prevent fires spreading if they occurred, but most had not thought about the possibility of substations as a safety hazard. A minority mentioned that they thought living near pylons could be dangerous to peoples’ health. Some of the small and medium business decision makers mentioned their OH&S requirements for staff which they thought would be in place for all businesses, and they expected Ausgrid also would have to adhere to them in order to keep their staff safe.
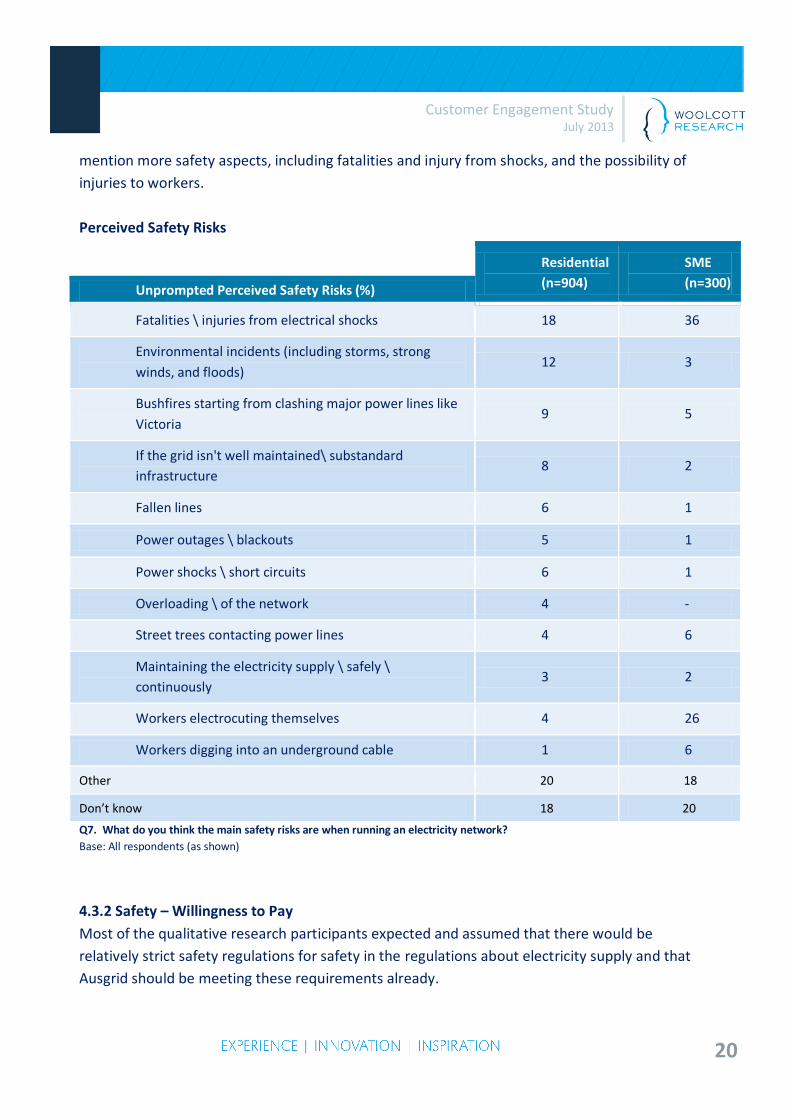
“They have duty of care- like us” There was some slight unprompted recall of the Ausgrid taglines of ‘dial before you dig’ and ‘look up and live’ in regard to safety information that had been provided and these campaigns were well regarded. There was also some vague recall of information about safety that had come with the electricity bill. It was generally thought however that a lot of the safety information would be common sense and that there is not a lot that Ausgrid could do to prevent do about human error and stupid actions. When asked about the need for signage most felt that there were probably enough signs for the general public about safety with regard to electricity, for example on and near substations. In the quantitative research, residents did not mention many of the risks with the possibility of fatalities and electric shocks occurring being the main aspect. Businesses appeared able to
20
Customer Engagement Study July 2013
mention more safety aspects, including fatalities and injury from shocks, and the possibility of injuries to workers. Perceived Safety Risks
Residential (n=904)
SME (n=300) Unprompted Perceived Safety Risks (%)
Fatalities \ injuries from electrical shocks 18 36
Environmental incidents (including storms, strong winds, and floods)
12 3
Bushfires starting from clashing major power lines like Victoria
9 5
If the grid isn't well maintained\ substandard infrastructure
8 2
Fallen lines 6 1
Power outages \ blackouts 5 1
Power shocks \ short circuits 6 1
Overloading \ of the network 4 -
Street trees contacting power lines 4 6
Maintaining the electricity supply \ safely \ continuously
3 2
Workers electrocuting themselves 4 26
Workers digging into an underground cable 1 6
Other 20 18 Don’t know 18 20 Q7. What do you think the main safety risks are when running an electricity network? Base: All respondents (as shown)
4.3.2 Safety – Willingness to Pay Most of the qualitative research participants expected and assumed that there would be relatively strict safety regulations for safety in the regulations about electricity supply and that Ausgrid should be meeting these requirements already.
21
Customer Engagement Study July 2013
Participants trusted that the government regulations would be very stringent and that Ausgrid simply would not be allowed by the authorities to have hazardous old equipment or poor maintenance records. Therefore they did not feel that there would be a real need to have safety requirements over and above the regulations, and many were not willing to pay more for more safety measures when this idea was put to them.
“They should be doing regular maintenance and monitoring anyway”
“That would be passing the ownership of their safety requirements onto my ability to pay. The obligation is theirs not mine.”
“If they charge any more, we’ll have to go back to candles.”
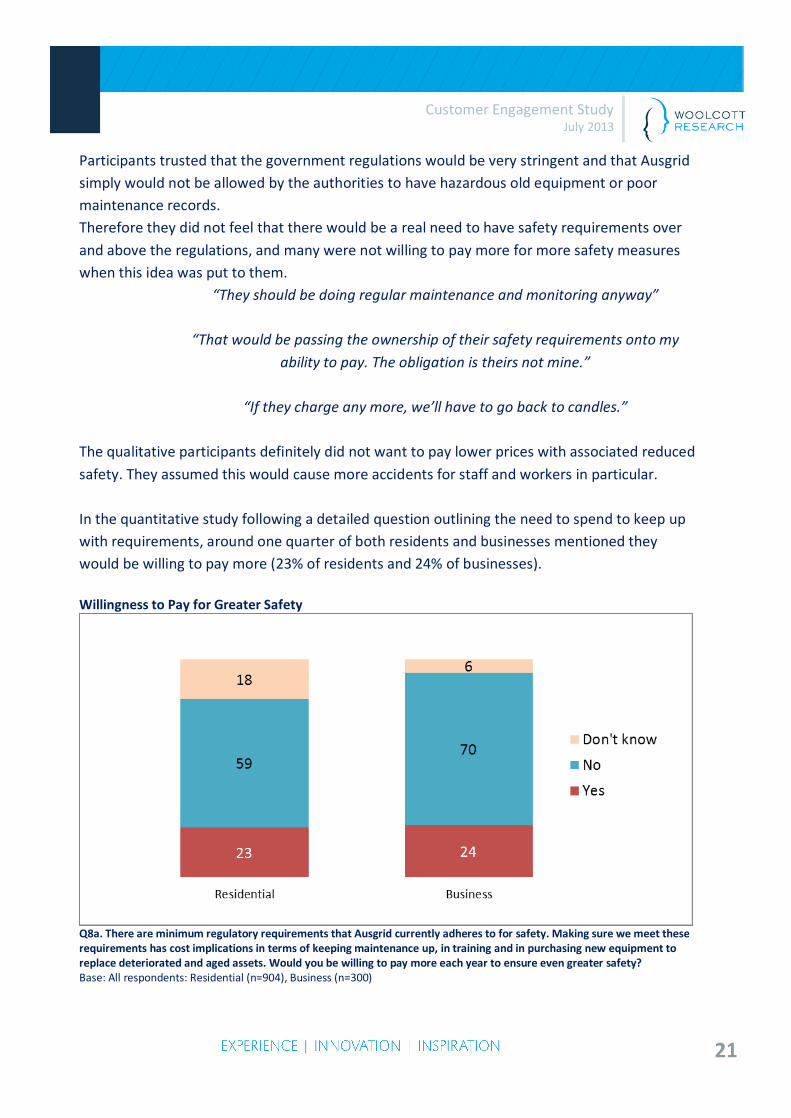
The qualitative participants definitely did not want to pay lower prices with associated reduced safety. They assumed this would cause more accidents for staff and workers in particular. In the quantitative study following a detailed question outlining the need to spend to keep up with requirements, around one quarter of both residents and businesses mentioned they would be willing to pay more (23% of residents and 24% of businesses). Willingness to Pay for Greater Safety
Q8a. There are minimum regulatory requirements that Ausgrid currently adheres to for safety. Making sure we meet these requirements has cost implications in terms of keeping maintenance up, in training and in purchasing new equipment to replace deteriorated and aged assets. Would you be willing to pay more each year to ensure even greater safety? Base: All respondents: Residential (n=904), Business (n=300)
22
Customer Engagement Study July 2013
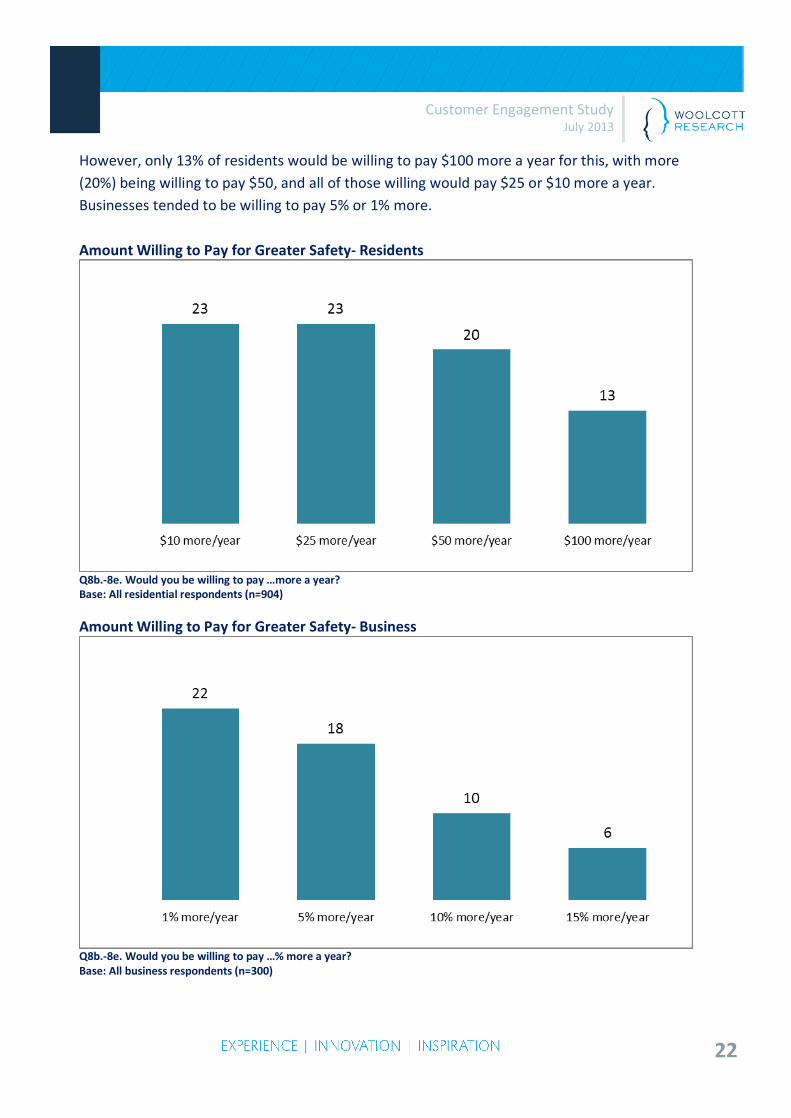
However, only 13% of residents would be willing to pay $100 more a year for this, with more (20%) being willing to pay $50, and all of those willing would pay $25 or $10 more a year. Businesses tended to be willing to pay 5% or 1% more. Amount Willing to Pay for Greater Safety- Residents
Q8b.-8e. Would you be willing to pay …more a year? Base: All residential respondents (n=904)
Amount Willing to Pay for Greater Safety- Business
Q8b.-8e. Would you be willing to pay …% more a year? Base: All business respondents (n=300)
23
Customer Engagement Study July 2013
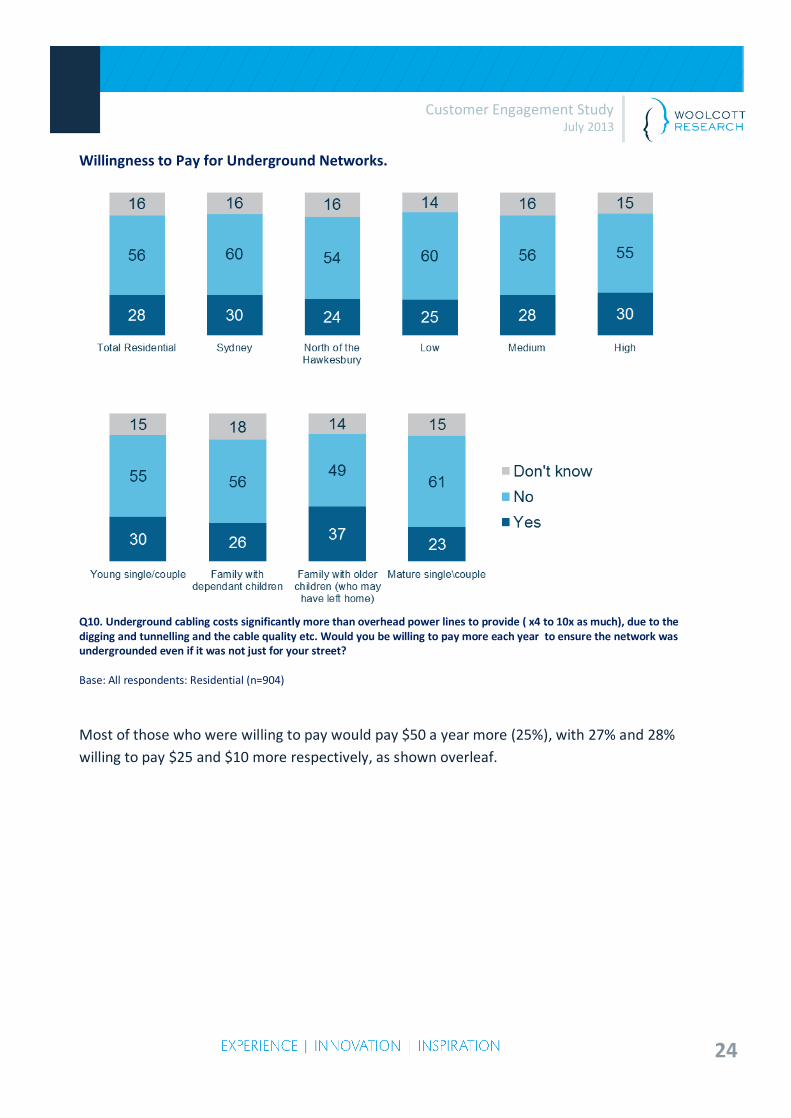
4.4 Construction/Design Standards 4.4.1 Ranking of Construction Factors The qualitative participants were asked to rank the importance of four factors which could be taken into account by Ausgrid in decision making around new construction/design standards. The overall ranking was reasonably consistent across all the groups and amongst residents and businesses. Price was consistently ranked as the most important aspect to take into account in any construction and design standards used by Ausgrid, and this was seen as particularly important at the moment because of the recent price increases which had been seen to be significant. However, whilst the pricing aspect was seen as very important, it was thought that safety standards could not be compromised to any degree in construction and design as a result of using the cheaper options. Safety was not placed at a higher level than price in the rankings however because it was assumed that relatively strict regulations were already in place and that these would remain, and would have to be taken into account in decision making. The aesthetics of the construction style was thought to play a part, and options such as underground or less visible cabling and pole options were thought to be ‘nice to have’ but not essential for most at the expense of price. However it appeared there was a definite segment of residential customers who would be prepared to pay more for this but only if the construction was to be in their street or in their wider local area. These people tended to be those with higher incomes from the higher socioeconomic group. Environmental issues were thought to be important by a relatively small segment of participants but most could not see how construction and design in electricity distribution could have a big impact on the environment, and it therefore was ranked as lower than the other dimensions tested. 4.4.2 Willingness to Pay for Underground Construction The quantitative research indicated that there was indeed a segment of residents in particular who were willing to pay for underground networks; with 28% indicating that they were willing ‘even if it was not just for your street’. Those on higher incomes and those with older children were the most likely segments to pay more.
24
Customer Engagement Study July 2013
Willingness to Pay for Underground Networks.
Q10. Underground cabling costs significantly more than overhead power lines to provide ( x4 to 10x as much), due to the digging and tunnelling and the cable quality etc. Would you be willing to pay more each year to ensure the network was undergrounded even if it was not just for your street? Base: All respondents: Residential (n=904)
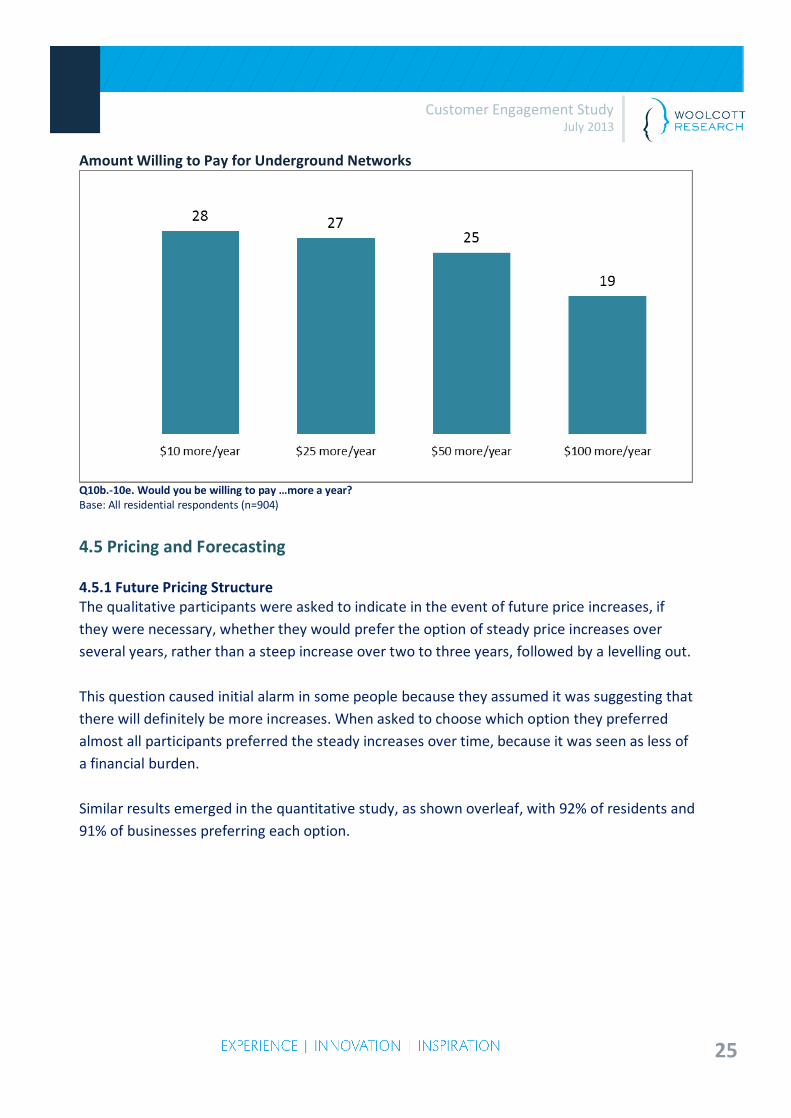
Most of those who were willing to pay would pay $50 a year more (25%), with 27% and 28% willing to pay $25 and $10 more respectively, as shown overleaf.
25
Customer Engagement Study July 2013
Amount Willing to Pay for Underground Networks
Q10b.-10e. Would you be willing to pay …more a year? Base: All residential respondents (n=904)
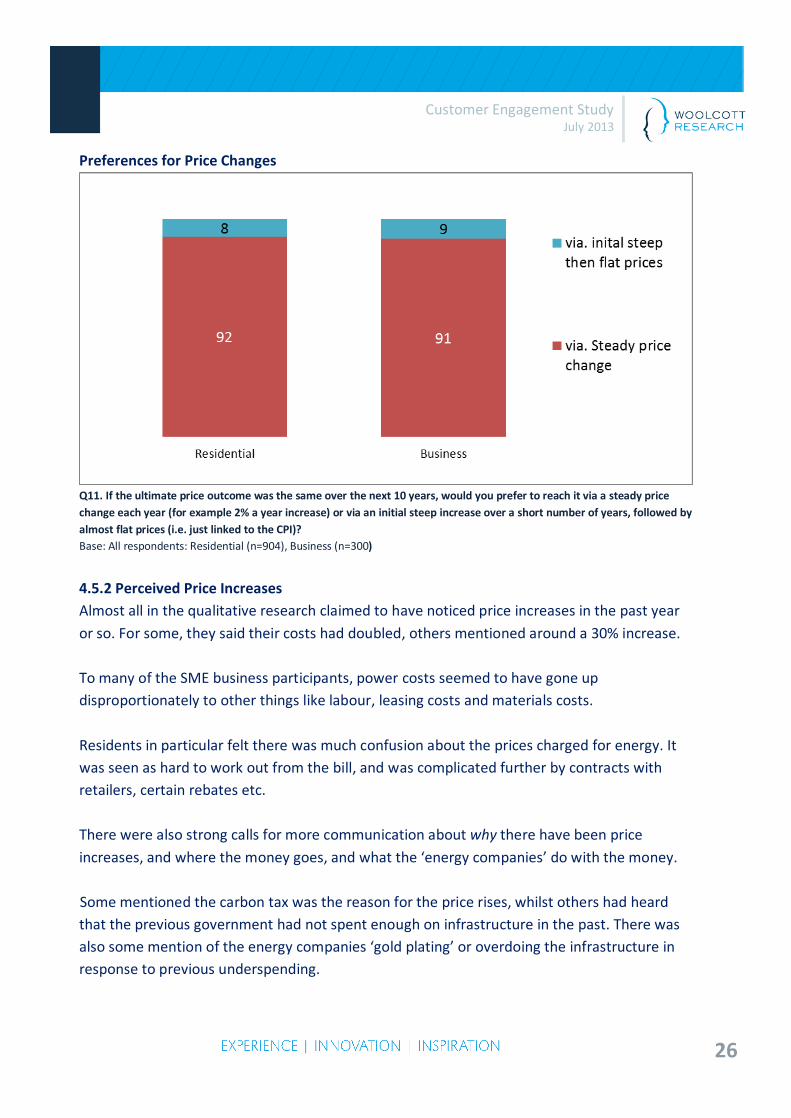
4.5 Pricing and Forecasting 4.5.1 Future Pricing Structure The qualitative participants were asked to indicate in the event of future price increases, if they were necessary, whether they would prefer the option of steady price increases over several years, rather than a steep increase over two to three years, followed by a levelling out. This question caused initial alarm in some people because they assumed it was suggesting that there will definitely be more increases. When asked to choose which option they preferred almost all participants preferred the steady increases over time, because it was seen as less of a financial burden. Similar results emerged in the quantitative study, as shown overleaf, with 92% of residents and 91% of businesses preferring each option.
26
Customer Engagement Study July 2013
Preferences for Price Changes
Q11. If the ultimate price outcome was the same over the next 10 years, would you prefer to reach it via a steady price change each year (for example 2% a year increase) or via an initial steep increase over a short number of years, followed by almost flat prices (i.e. just linked to the CPI)? Base: All respondents: Residential (n=904), Business (n=300)
4.5.2 Perceived Price Increases Almost all in the qualitative research claimed to have noticed price increases in the past year or so. For some, they said their costs had doubled, others mentioned around a 30% increase. To many of the SME business participants, power costs seemed to have gone up disproportionately to other things like labour, leasing costs and materials costs. Residents in particular felt there was much confusion about the prices charged for energy. It was seen as hard to work out from the bill, and was complicated further by contracts with retailers, certain rebates etc. There were also strong calls for more communication about why there have been price increases, and where the money goes, and what the ‘energy companies’ do with the money. Some mentioned the carbon tax was the reason for the price rises, whilst others had heard that the previous government had not spent enough on infrastructure in the past. There was also some mention of the energy companies ‘gold plating’ or overdoing the infrastructure in response to previous underspending.

27
Customer Engagement Study July 2013
The quantitative research confirmed that the majority felt they had experienced significant price rises, with 45% of residents reporting their prices had increased ‘a lot’ and another 31% ‘slightly’. A higher proportion of businesses felt the prices had increased ‘a lot’ (52%), with 20% feeling they had increased ‘slightly’. Awareness of Recent Price Changes
Q12. Have you noticed any change in the level of your electricity bill over the past year or so? Base: All respondents: Residential (n=904), Business (n=300)
4.5.3 Incidence of Reducing Electricity Usage The qualitative residential participants all claimed to have made a lot of changes to the way they used electricity in order to save money, some with considerable success, including:
• changing to low energy light bulbs;
• looking at star ratings for appliances when purchasing;
• making sure power sockets are turned off;
• turning off lights when not in use;
• having full loads for washing machines and dishwashers;
• using cold water to wash in;
• not using dryers unless very wet; and
• some had timers on when in the shower.
Some of the Newcastle and Gosford residents had been visited by somebody doing an energy audit, to help them see how they can save energy. This was felt to be a very comprehensive
28
Customer Engagement Study July 2013
service, and they reportedly left behind devices such as ‘sausages’ for the bottom of the door, energy saving light bulbs, and a letter explaining how to be more efficient.
Most in the qualitative claimed their energy saving behaviours had become habitual, and they believed they would continue this way, even if prices were reduced. Extremes in weather also had an evident effect on some behaviours, causing people to for example use an extra blanket on particularly cold days (e.g. when sitting in front of the TV), draw the curtains on cold/hot days, and only use air-conditioning on ‘extreme’ weather days However, there was some reluctance to trade off air-conditioning usage in order to save electricity, especially on particularly hot days. Many claimed they only used air conditioning quite sparingly anyway. Some had adopted longer term solutions to saving electricity, including lowering the temperature on the water heater, or changing heating to oil or something else. Few had switched from electricity to gas as a result of the increases; although a few were thinking about solar in the future. There was some comment from those in unit blocks around wastage by the building management, and this produced some anger. Things like the outside lights being left on all day, rules around when washing machines and driers can be used (thus limiting off peak usage); and rules about drying clothes on balconies/outside made it difficult for the residents to cut back as much as they would like. Overall there was consternation amongst residents regarding what they would do if prices were to increase more, as most, particularly the lower bill level groups and pensioners, felt they were already doing everything they could. “Everyone’s doing the best they can and it would be hard to do more” A small segment of residents refused to compromise their lifestyle to any great degree, and felt they were justified in using what they wanted if they were paying for it. The business participants felt there was a limitation around what many business owners could do in regards to energy efficient behaviour, for example in cutting back air-conditioning and light usage, due to OH&S regulations, and the employers responsibility to ensure a comfortable workplace.
However changes that had been instigated in the business environment included:
29
Customer Engagement Study July 2013
• Ensuring lights and computers were turned off at night; and,
• Purchasing more energy efficient appliances – especially freezers that had to stay on for 24h
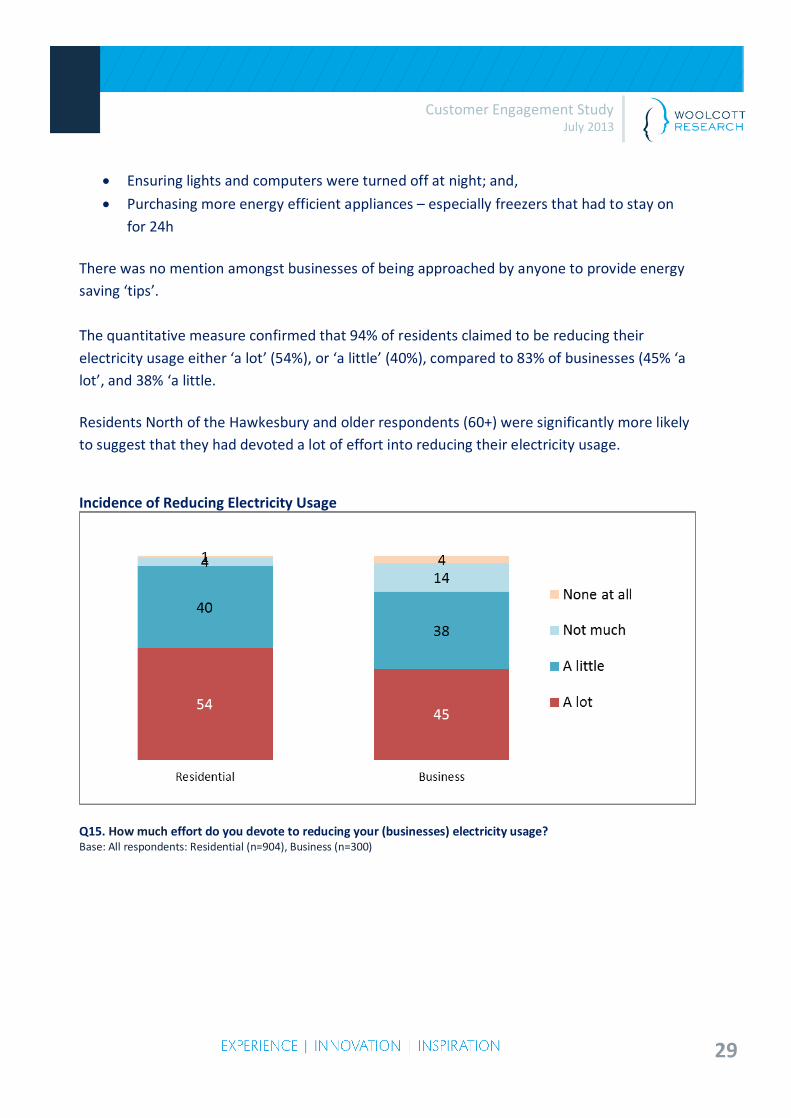
There was no mention amongst businesses of being approached by anyone to provide energy saving ‘tips’. The quantitative measure confirmed that 94% of residents claimed to be reducing their electricity usage either ‘a lot’ (54%), or ‘a little’ (40%), compared to 83% of businesses (45% ‘a lot’, and 38% ‘a little. Residents North of the Hawkesbury and older respondents (60+) were significantly more likely to suggest that they had devoted a lot of effort into reducing their electricity usage.
Incidence of Reducing Electricity Usage
Q15. How much effort do you devote to reducing your (businesses) electricity usage? Base: All respondents: Residential (n=904), Business (n=300)
30
Customer Engagement Study July 2013
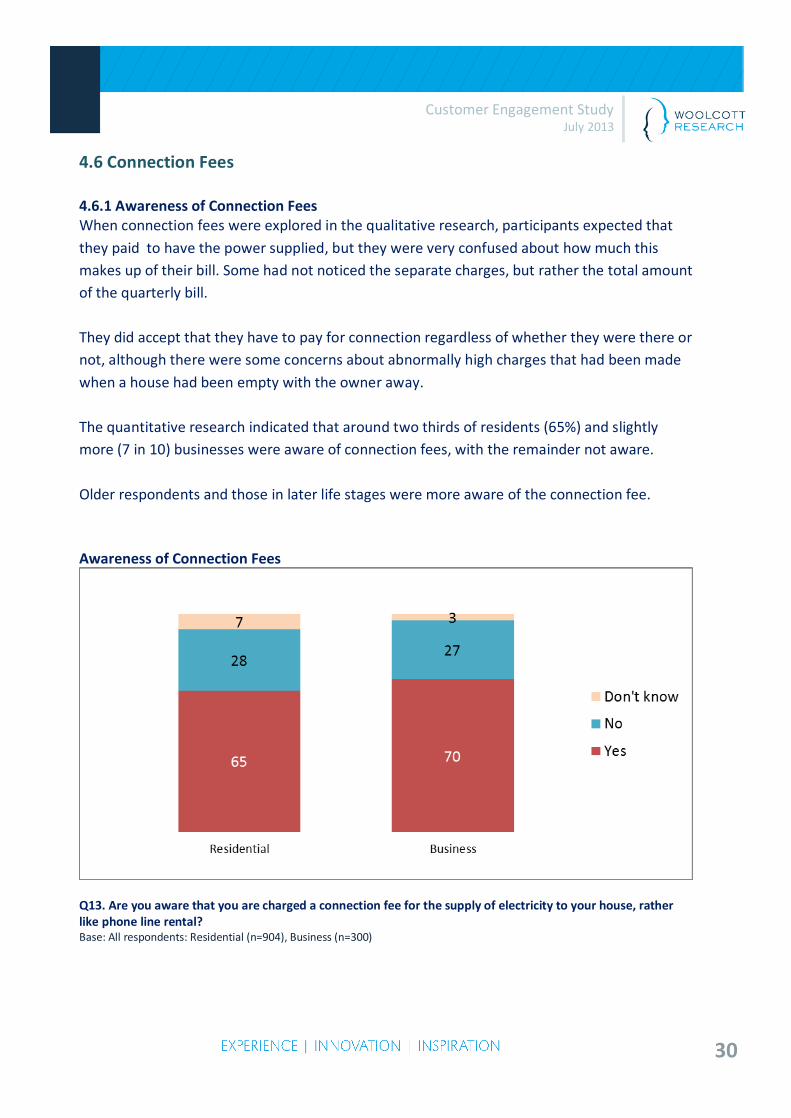
4.6 Connection Fees 4.6.1 Awareness of Connection Fees When connection fees were explored in the qualitative research, participants expected that they paid to have the power supplied, but they were very confused about how much this makes up of their bill. Some had not noticed the separate charges, but rather the total amount of the quarterly bill. They did accept that they have to pay for connection regardless of whether they were there or not, although there were some concerns about abnormally high charges that had been made when a house had been empty with the owner away. The quantitative research indicated that around two thirds of residents (65%) and slightly more (7 in 10) businesses were aware of connection fees, with the remainder not aware. Older respondents and those in later life stages were more aware of the connection fee. Awareness of Connection Fees
Q13. Are you aware that you are charged a connection fee for the supply of electricity to your house, rather like phone line rental? Base: All respondents: Residential (n=904), Business (n=300)
31
Customer Engagement Study July 2013
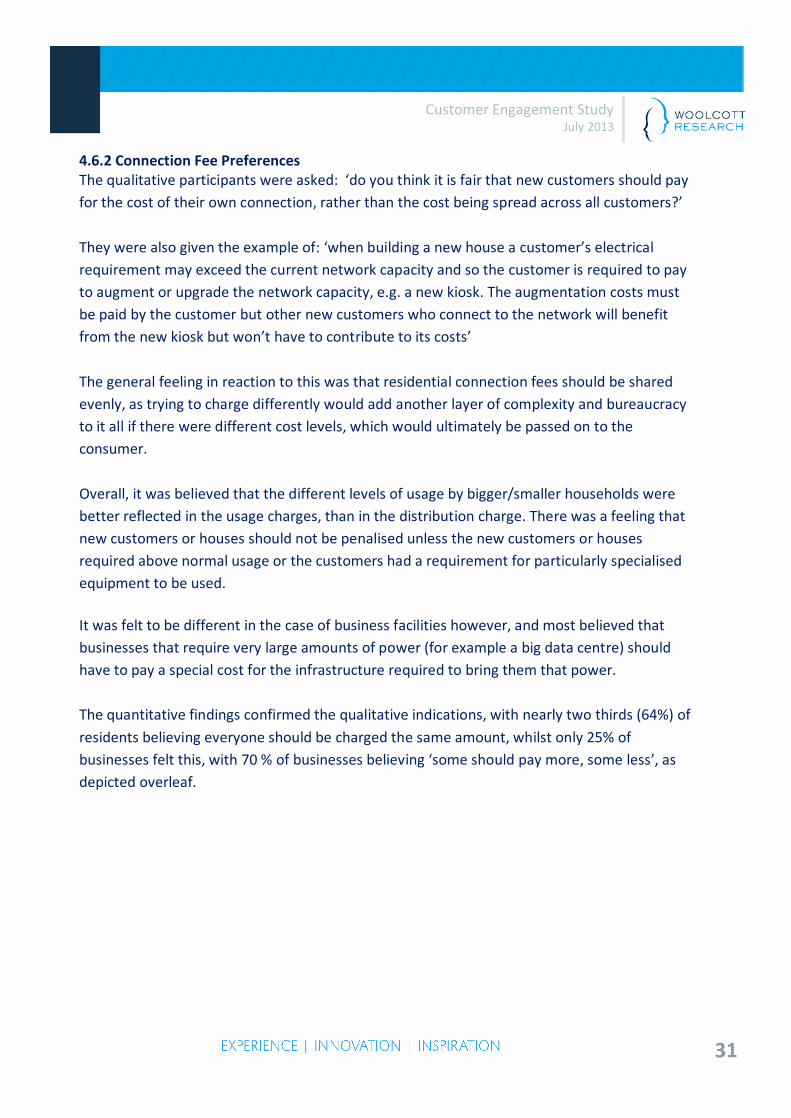
4.6.2 Connection Fee Preferences The qualitative participants were asked: ‘do you think it is fair that new customers should pay for the cost of their own connection, rather than the cost being spread across all customers?’ They were also given the example of: ‘when building a new house a customer’s electrical requirement may exceed the current network capacity and so the customer is required to pay to augment or upgrade the network capacity, e.g. a new kiosk. The augmentation costs must be paid by the customer but other new customers who connect to the network will benefit from the new kiosk but won’t have to contribute to its costs’ The general feeling in reaction to this was that residential connection fees should be shared evenly, as trying to charge differently would add another layer of complexity and bureaucracy to it all if there were different cost levels, which would ultimately be passed on to the consumer. Overall, it was believed that the different levels of usage by bigger/smaller households were better reflected in the usage charges, than in the distribution charge. There was a feeling that new customers or houses should not be penalised unless the new customers or houses required above normal usage or the customers had a requirement for particularly specialised equipment to be used. It was felt to be different in the case of business facilities however, and most believed that businesses that require very large amounts of power (for example a big data centre) should have to pay a special cost for the infrastructure required to bring them that power. The quantitative findings confirmed the qualitative indications, with nearly two thirds (64%) of residents believing everyone should be charged the same amount, whilst only 25% of businesses felt this, with 70 % of businesses believing ‘some should pay more, some less’, as depicted overleaf.
32
Customer Engagement Study July 2013
Preferred Connection Fee Payment Variability
Q14. And do you feel all households should pay the same amount for this connection fee, or do you think some households should pay more, some less? Base: All respondents: Residential (n=904), Business (n=300)
4.7 Energy Efficiency Programs 4.7.1. Awareness of Energy Efficiency Programs In the qualitative research most participants indicated there was quite a lot of activity and encouragement concerning energy efficiency currently, and they mentioned aspects such as pamphlets coming in the bills from retailers, advertising in magazines and TV and participatory in-home energy audits where someone would come to the home and suggest where and how energy savings could be made. In Newcastle, there was some awareness of ‘Honeysuckle Place’ the Smart Grid Smart City showroom, and also some activity in shopping centre kiosks around energy efficiency. But again there was confusion about who was responsible for this. Some also recalled ‘the Government’ had been active in programs such as supplying energy efficient light bulbs. Overall many felt that most people generally know what to do in relation to saving energy and using it efficiently now, although some would like to learn more about specific aspects which
33
Customer Engagement Study July 2013
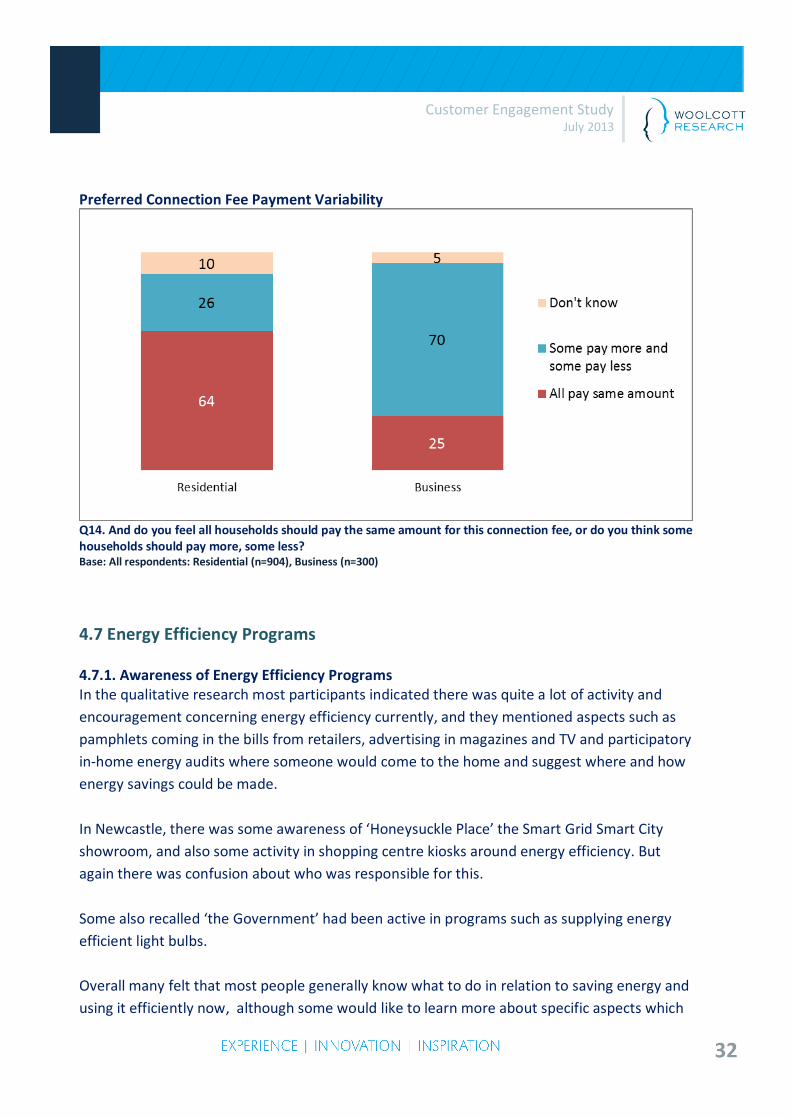
they were still not sure about such as which appliances used more power, and how much power is wasted if appliances are left on standby. 4.7.2 Perceptions Regarding Ausgrid’s Role in Energy Efficiency It was believed by most in the qualitative research that people do still need to be educated about how to use energy efficiently; however some tended to believe it was the retailer responsibility, not necessarily the distributor. Retailers had been seen to be already playing an active role in this area, and it was assumed that they were trying to appear as ‘good citizens’ by doing so and therefore should keep doing it. There was only minor recognition that retailers may not be interested in helping people save power, as this would impact their profits. When the quantitative respondents were asked a direct question about whether Ausgrid should help in this regard, 85% of residences and 84% of businesses believed they should. This feeling was highest amongst medium sized businesses (91% believed Ausgrid should do this). Energy Efficiency Aid
Q16. Do you think Ausgrid should try and help people/businesses to be more energy efficient? Base: All respondents: Residential (n=904), Business (n=300)
34
Customer Engagement Study July 2013
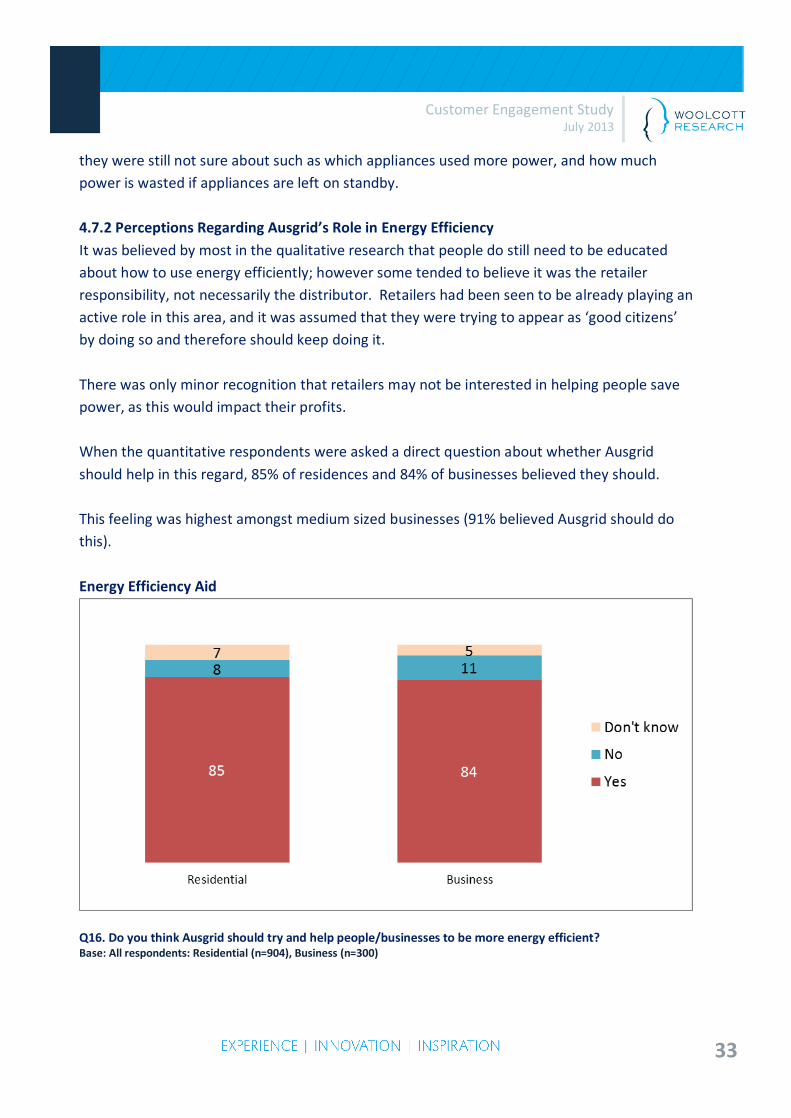
4.7.3 Willingness to Pay for Energy Efficiency Education There was little willingness to pay to have Ausgrid take on energy efficiency initiatives evident in the qualitative exploration, and the quantitative research confirmed that only 14% of residents in total would be willing to pay for this. This level was higher amongst the 18-34 year olds, with a sharp drop off in willingness amongst those aged 35 and over. Willingness to Pay for Energy Efficiency Information, Tools and Incentives- Residents
Q17. Would you be willing to pay more for Ausgrid to provide information, tools and incentives for energy efficiency? Base: All respondents: Residential (n=904) Note: This question was only asked of residents When questioned about the actual amount they would be willing to pay, only around half of those who were willing to pay (6% of all residents ) were willing to pay $100 or more a year, with this proportion increasing to 10% willing to pay $50 a year, and 12% and 13% respectively willing to pay $25 and $10. Amount Willing to Pay for Energy Efficiency Information, Tools and Incentives – Residents

35
Customer Engagement Study July 2013
Q17b.-17e. Would you be willing to pay …more a year? Base: All respondents: Residential (n=904) 4.8 Demand Management 4.8.1 Understanding of Demand Management Most in the qualitative research were aware that demand fluctuates during the day and was dependant on the weather to a degree, but many believed that daytime usage between 9 am and 5 pm would be when demand is at its highest, because of the strain from business usage. Some therefore questioned the example given in the qualitative research of the evening/dinner time usage peak. Some mentioned that they had experienced outages at times of heaviest demand such on abnormally hot days, with heavy use of air conditioning, but these outage occasions were felt to be very rare, and only ever occurred in extreme conditions. The feeling was that the peak times (e.g. during a heat wave or cold spell) were exactly the times that one would want to use the power, for air conditioning or heating, pool use etc. and they expected to have the choice to be able to use as much power as required at those times if that is the level of lifestyle you are willing to pay for.
36
Customer Engagement Study July 2013
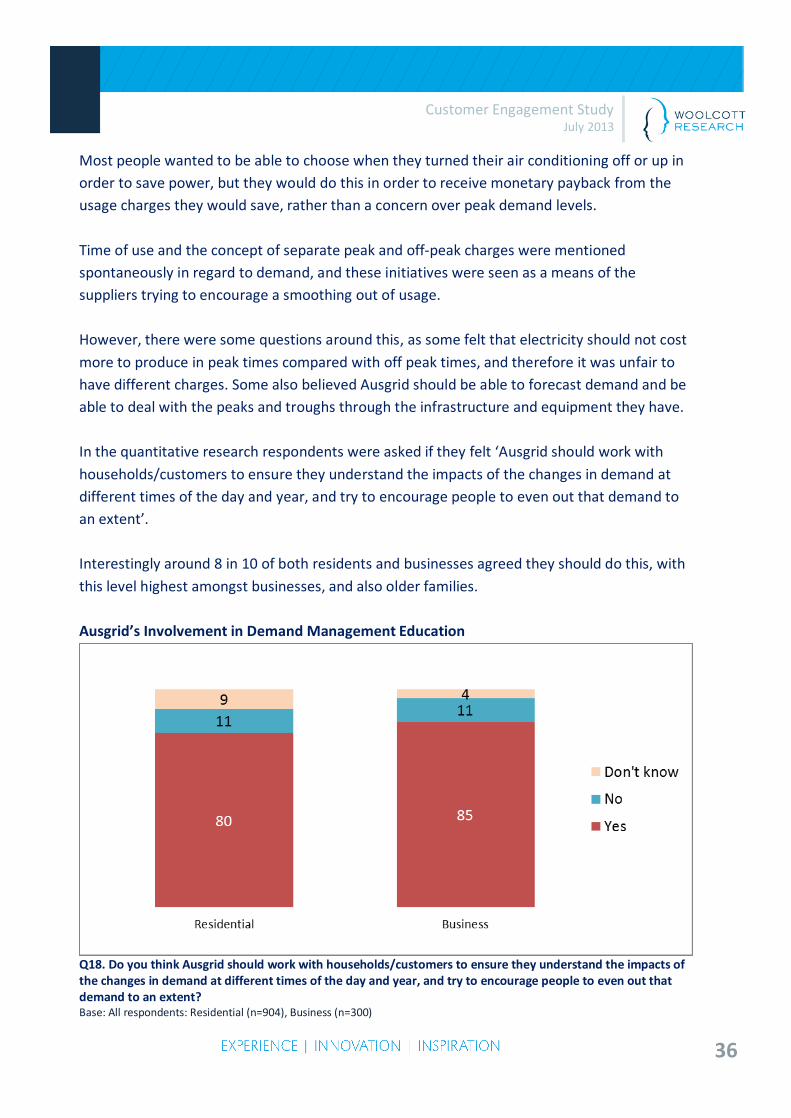
Most people wanted to be able to choose when they turned their air conditioning off or up in order to save power, but they would do this in order to receive monetary payback from the usage charges they would save, rather than a concern over peak demand levels. Time of use and the concept of separate peak and off-peak charges were mentioned spontaneously in regard to demand, and these initiatives were seen as a means of the suppliers trying to encourage a smoothing out of usage. However, there were some questions around this, as some felt that electricity should not cost more to produce in peak times compared with off peak times, and therefore it was unfair to have different charges. Some also believed Ausgrid should be able to forecast demand and be able to deal with the peaks and troughs through the infrastructure and equipment they have. In the quantitative research respondents were asked if they felt ‘Ausgrid should work with households/customers to ensure they understand the impacts of the changes in demand at different times of the day and year, and try to encourage people to even out that demand to an extent’. Interestingly around 8 in 10 of both residents and businesses agreed they should do this, with this level highest amongst businesses, and also older families. Ausgrid’s Involvement in Demand Management Education
Q18. Do you think Ausgrid should work with households/customers to ensure they understand the impacts of the changes in demand at different times of the day and year, and try to encourage people to even out that demand to an extent? Base: All respondents: Residential (n=904), Business (n=300)
37
Customer Engagement Study July 2013
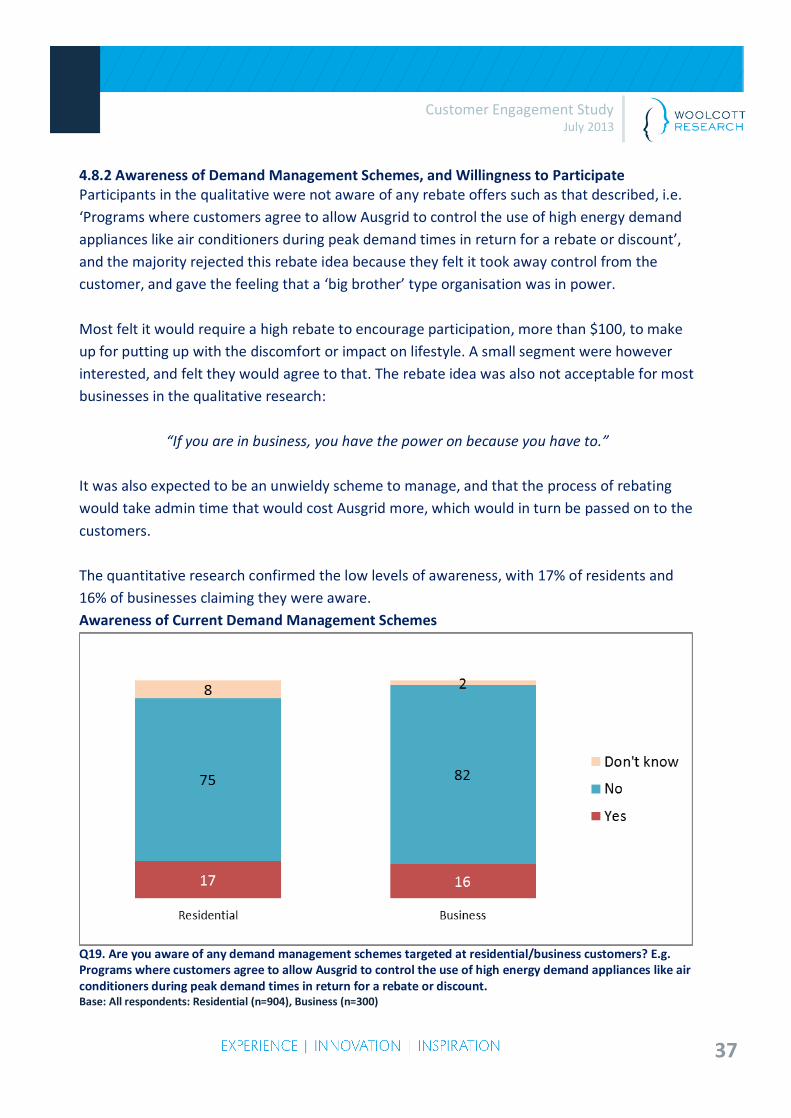
4.8.2 Awareness of Demand Management Schemes, and Willingness to Participate Participants in the qualitative were not aware of any rebate offers such as that described, i.e. ‘Programs where customers agree to allow Ausgrid to control the use of high energy demand appliances like air conditioners during peak demand times in return for a rebate or discount’, and the majority rejected this rebate idea because they felt it took away control from the customer, and gave the feeling that a ‘big brother’ type organisation was in power. Most felt it would require a high rebate to encourage participation, more than $100, to make up for putting up with the discomfort or impact on lifestyle. A small segment were however interested, and felt they would agree to that. The rebate idea was also not acceptable for most businesses in the qualitative research:
“If you are in business, you have the power on because you have to.”
It was also expected to be an unwieldy scheme to manage, and that the process of rebating would take admin time that would cost Ausgrid more, which would in turn be passed on to the customers. The quantitative research confirmed the low levels of awareness, with 17% of residents and 16% of businesses claiming they were aware. Awareness of Current Demand Management Schemes
Q19. Are you aware of any demand management schemes targeted at residential/business customers? E.g. Programs where customers agree to allow Ausgrid to control the use of high energy demand appliances like air conditioners during peak demand times in return for a rebate or discount. Base: All respondents: Residential (n=904), Business (n=300)
38
Customer Engagement Study July 2013
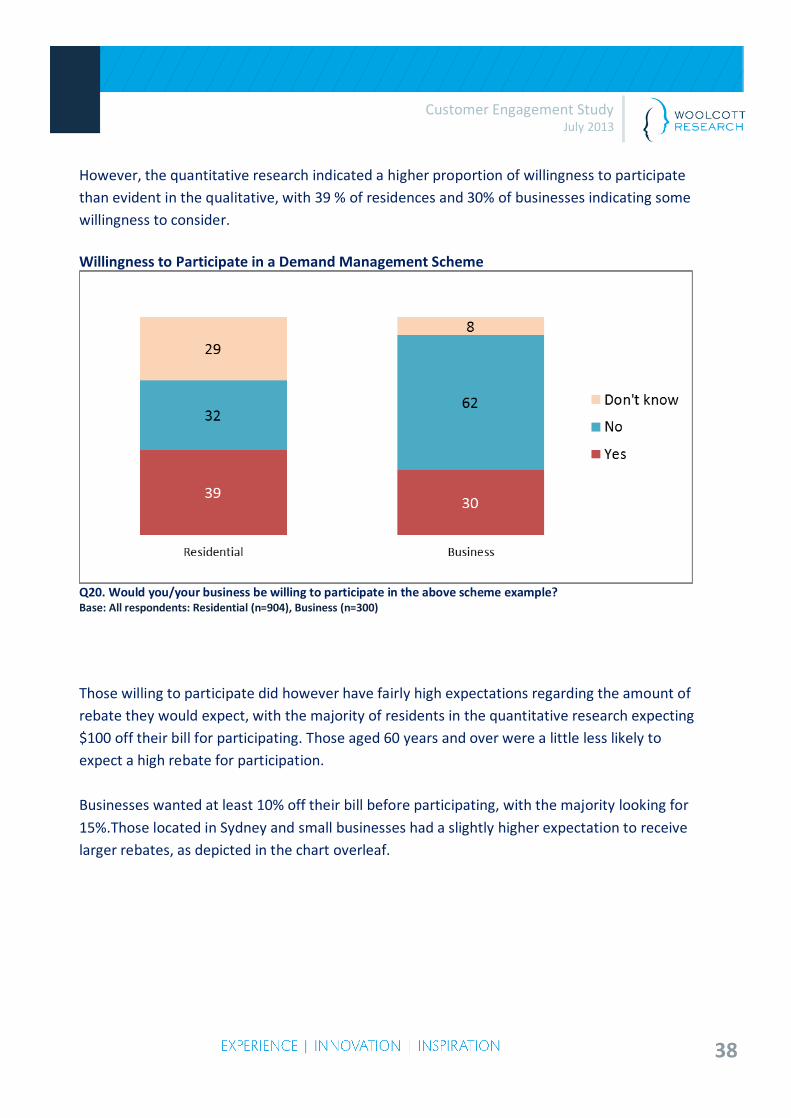
However, the quantitative research indicated a higher proportion of willingness to participate than evident in the qualitative, with 39 % of residences and 30% of businesses indicating some willingness to consider. Willingness to Participate in a Demand Management Scheme
Q20. Would you/your business be willing to participate in the above scheme example? Base: All respondents: Residential (n=904), Business (n=300)
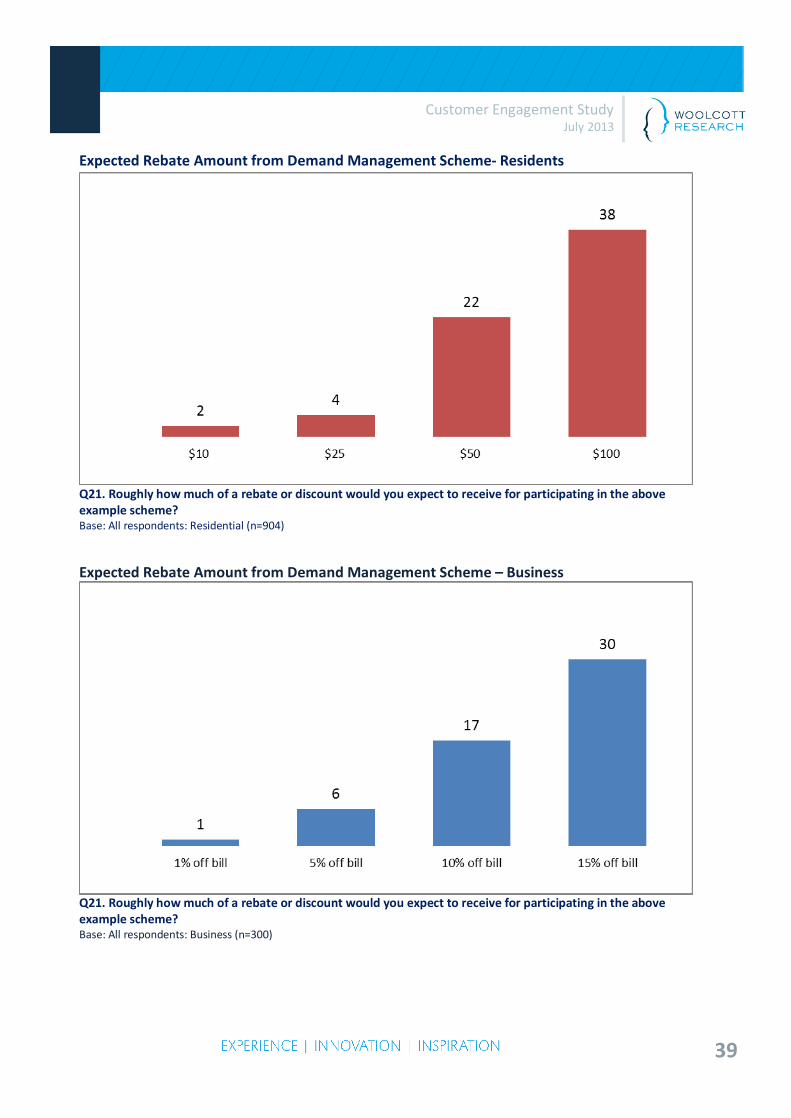
Those willing to participate did however have fairly high expectations regarding the amount of rebate they would expect, with the majority of residents in the quantitative research expecting $100 off their bill for participating. Those aged 60 years and over were a little less likely to expect a high rebate for participation. Businesses wanted at least 10% off their bill before participating, with the majority looking for 15%.Those located in Sydney and small businesses had a slightly higher expectation to receive larger rebates, as depicted in the chart overleaf.
39
Customer Engagement Study July 2013
Expected Rebate Amount from Demand Management Scheme- Residents
Q21. Roughly how much of a rebate or discount would you expect to receive for participating in the above example scheme? Base: All respondents: Residential (n=904)
Expected Rebate Amount from Demand Management Scheme – Business
Q21. Roughly how much of a rebate or discount would you expect to receive for participating in the above example scheme? Base: All respondents: Business (n=300)
40
Customer Engagement Study July 2013
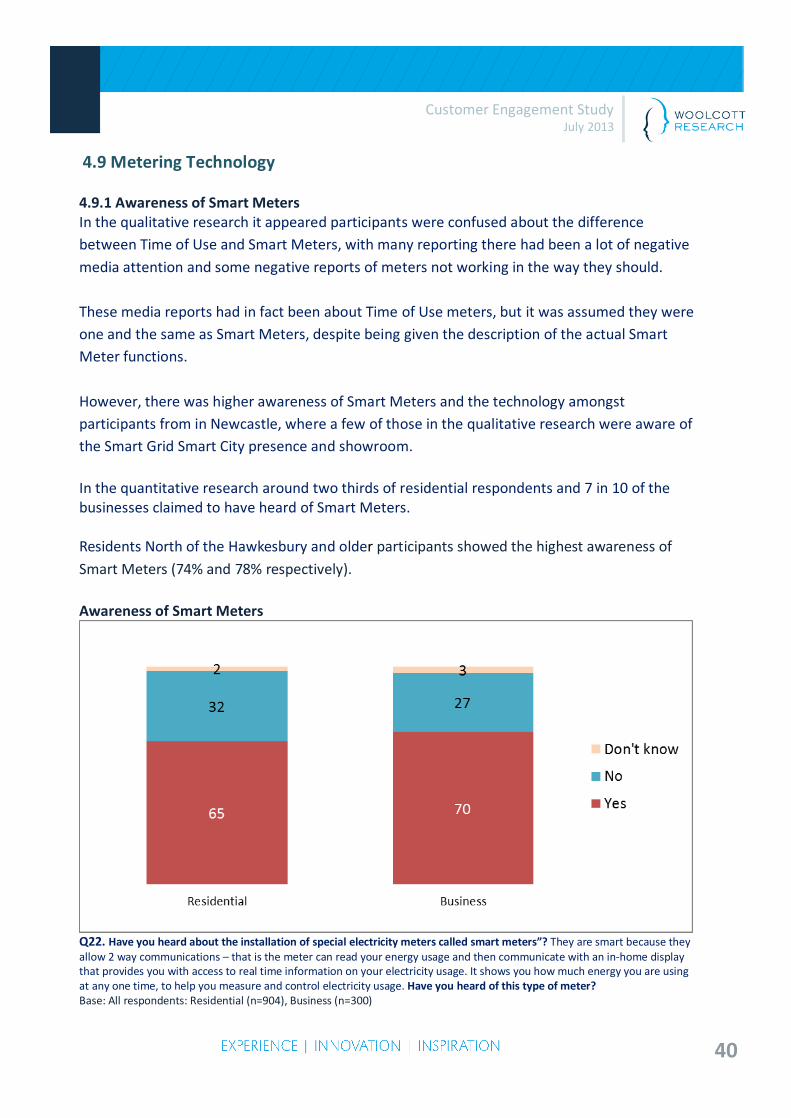
4.9 Metering Technology 4.9.1 Awareness of Smart Meters In the qualitative research it appeared participants were confused about the difference between Time of Use and Smart Meters, with many reporting there had been a lot of negative media attention and some negative reports of meters not working in the way they should. These media reports had in fact been about Time of Use meters, but it was assumed they were one and the same as Smart Meters, despite being given the description of the actual Smart Meter functions. However, there was higher awareness of Smart Meters and the technology amongst participants from in Newcastle, where a few of those in the qualitative research were aware of the Smart Grid Smart City presence and showroom. In the quantitative research around two thirds of residential respondents and 7 in 10 of the businesses claimed to have heard of Smart Meters. Residents North of the Hawkesbury and older participants showed the highest awareness of Smart Meters (74% and 78% respectively). Awareness of Smart Meters
Q22. Have you heard about the installation of special electricity meters called smart meters”? They are smart because they allow 2 way communications – that is the meter can read your energy usage and then communicate with an in-home display that provides you with access to real time information on your electricity usage. It shows you how much energy you are using at any one time, to help you measure and control electricity usage. Have you heard of this type of meter? Base: All respondents: Residential (n=904), Business (n=300)
41
Customer Engagement Study July 2013
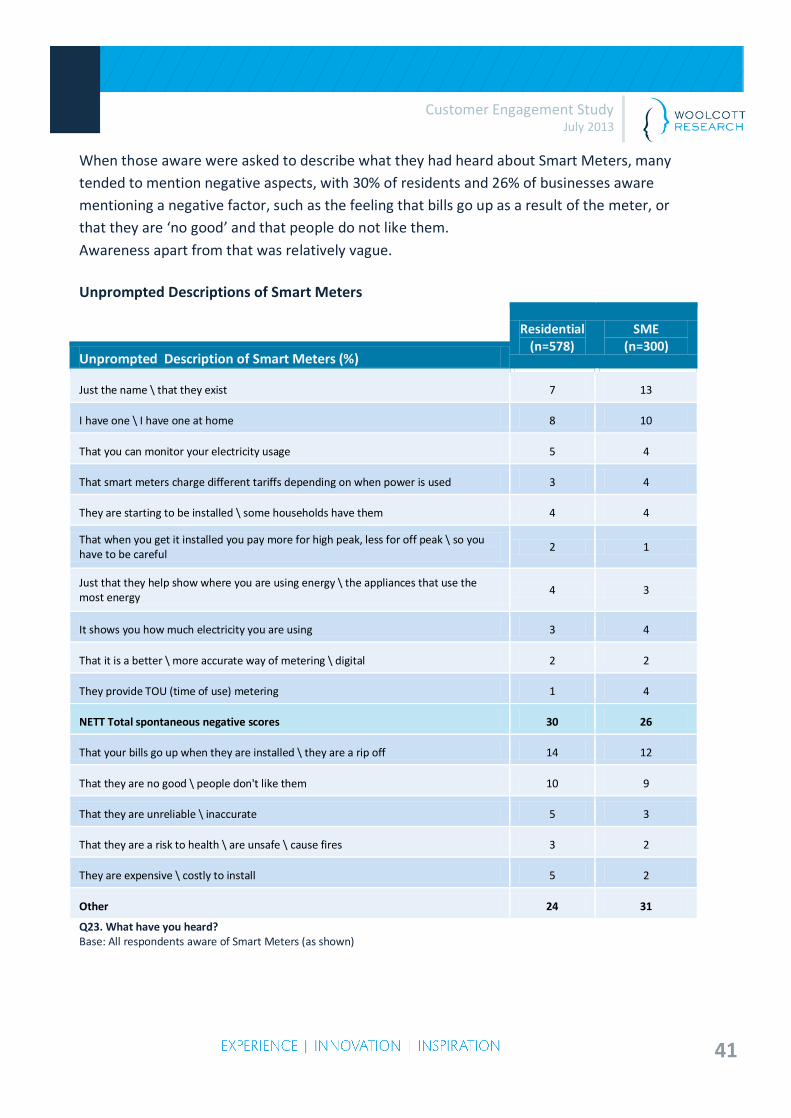
When those aware were asked to describe what they had heard about Smart Meters, many tended to mention negative aspects, with 30% of residents and 26% of businesses aware mentioning a negative factor, such as the feeling that bills go up as a result of the meter, or that they are ‘no good’ and that people do not like them. Awareness apart from that was relatively vague. Unprompted Descriptions of Smart Meters
Residential (n=578)
SME (n=300)
Unprompted Description of Smart Meters (%) Just the name \ that they exist 7 13 I have one \ I have one at home 8 10 That you can monitor your electricity usage 5 4 That smart meters charge different tariffs depending on when power is used 3 4 They are starting to be installed \ some households have them 4 4 That when you get it installed you pay more for high peak, less for off peak \ so you have to be careful 2 1 Just that they help show where you are using energy \ the appliances that use the most energy 4 3 It shows you how much electricity you are using 3 4 That it is a better \ more accurate way of metering \ digital 2 2 They provide TOU (time of use) metering 1 4 NETT Total spontaneous negative scores 30 26 That your bills go up when they are installed \ they are a rip off 14 12 That they are no good \ people don't like them 10 9 That they are unreliable \ inaccurate 5 3 That they are a risk to health \ are unsafe \ cause fires 3 2 They are expensive \ costly to install 5 2 Other 24 31 Q23. What have you heard? Base: All respondents aware of Smart Meters (as shown)
42
Customer Engagement Study July 2013
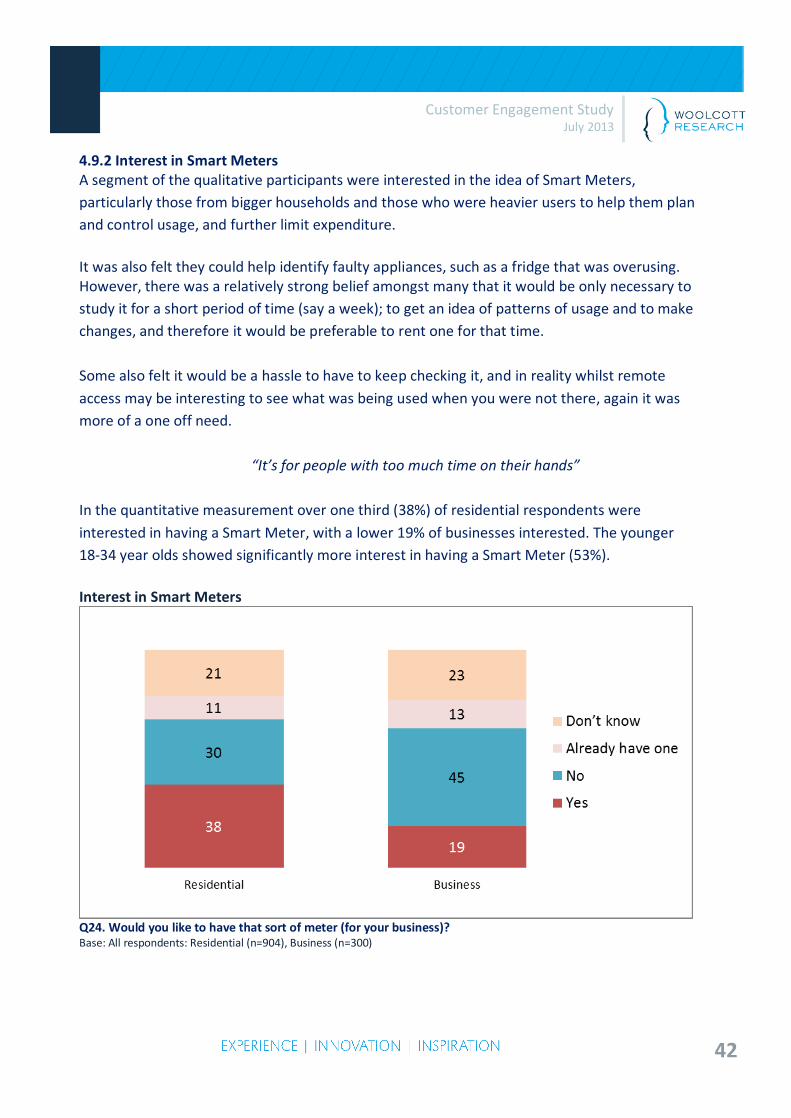
4.9.2 Interest in Smart Meters A segment of the qualitative participants were interested in the idea of Smart Meters, particularly those from bigger households and those who were heavier users to help them plan and control usage, and further limit expenditure. It was also felt they could help identify faulty appliances, such as a fridge that was overusing. However, there was a relatively strong belief amongst many that it would be only necessary to study it for a short period of time (say a week); to get an idea of patterns of usage and to make changes, and therefore it would be preferable to rent one for that time. Some also felt it would be a hassle to have to keep checking it, and in reality whilst remote access may be interesting to see what was being used when you were not there, again it was more of a one off need.
“It’s for people with too much time on their hands”
In the quantitative measurement over one third (38%) of residential respondents were interested in having a Smart Meter, with a lower 19% of businesses interested. The younger 18-34 year olds showed significantly more interest in having a Smart Meter (53%).
Interest in Smart Meters
Q24. Would you like to have that sort of meter (for your business)? Base: All respondents: Residential (n=904), Business (n=300)
43
Customer Engagement Study July 2013
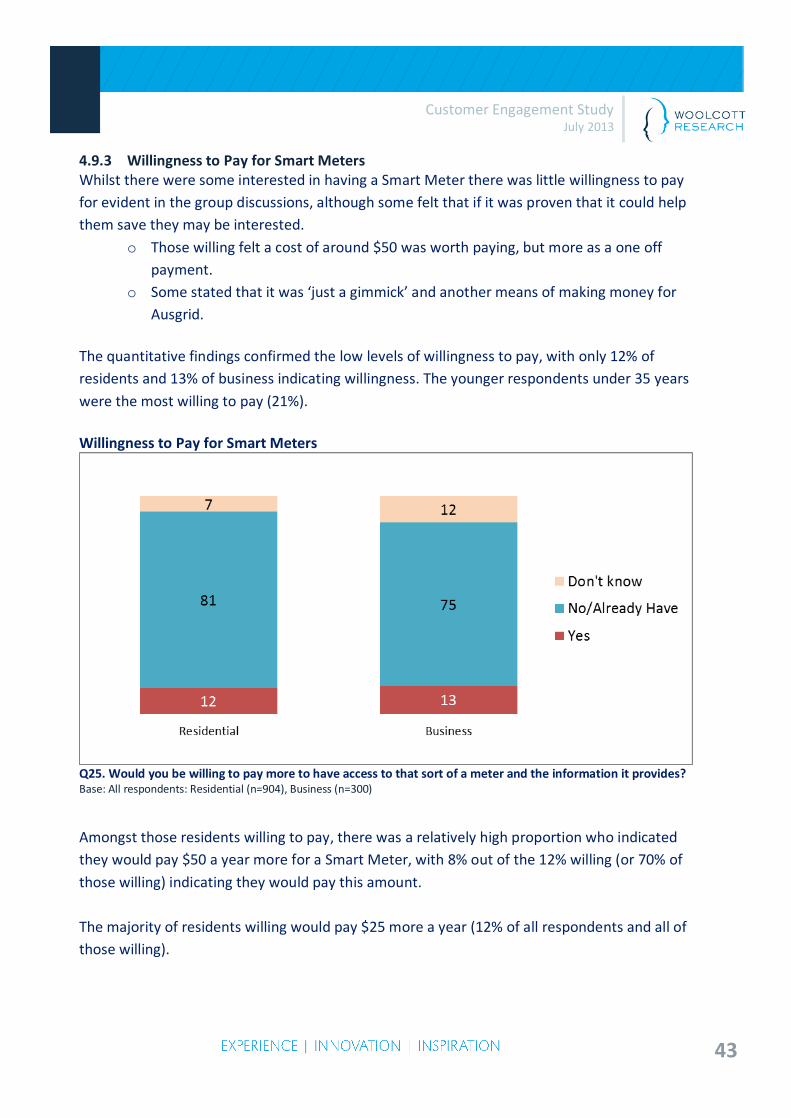
4.9.3 Willingness to Pay for Smart Meters Whilst there were some interested in having a Smart Meter there was little willingness to pay for evident in the group discussions, although some felt that if it was proven that it could help them save they may be interested.
o Those willing felt a cost of around $50 was worth paying, but more as a one off payment.
o Some stated that it was ‘just a gimmick’ and another means of making money for Ausgrid.
The quantitative findings confirmed the low levels of willingness to pay, with only 12% of residents and 13% of business indicating willingness. The younger respondents under 35 years were the most willing to pay (21%).
Willingness to Pay for Smart Meters
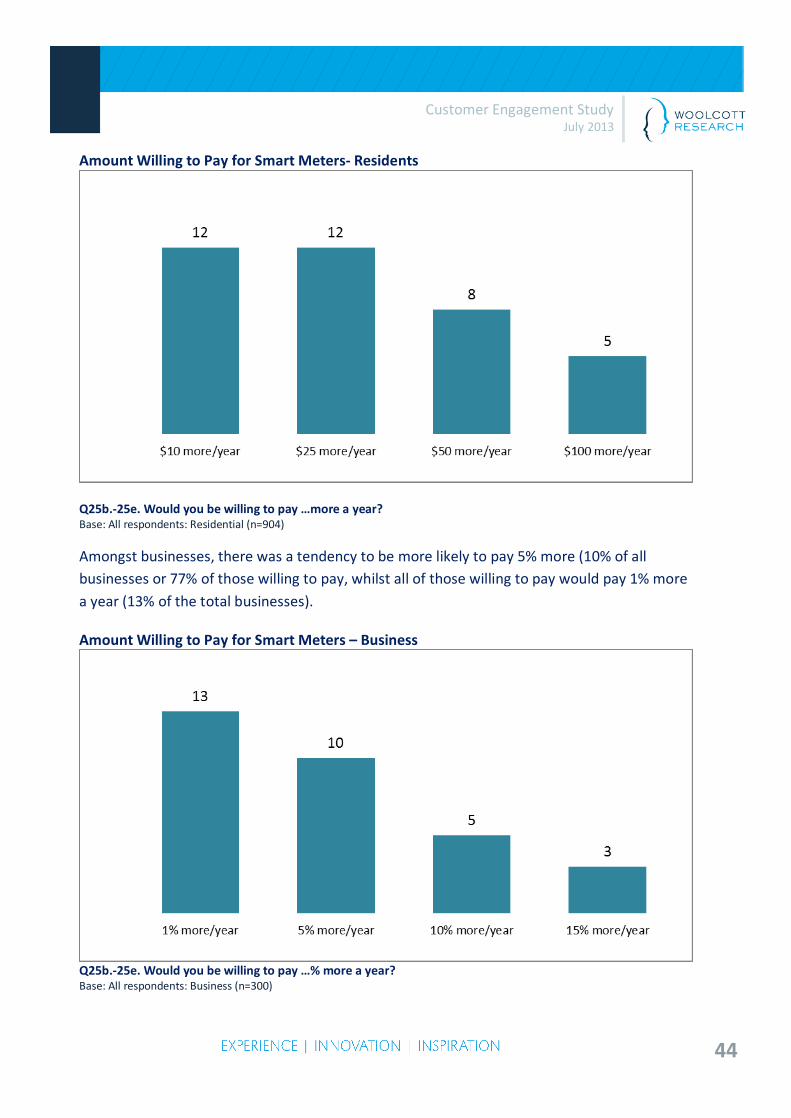
Q25. Would you be willing to pay more to have access to that sort of a meter and the information it provides? Base: All respondents: Residential (n=904), Business (n=300) Amongst those residents willing to pay, there was a relatively high proportion who indicated they would pay $50 a year more for a Smart Meter, with 8% out of the 12% willing (or 70% of those willing) indicating they would pay this amount. The majority of residents willing would pay $25 more a year (12% of all respondents and all of those willing).
44
Customer Engagement Study July 2013
Amount Willing to Pay for Smart Meters- Residents
Q25b.-25e. Would you be willing to pay …more a year? Base: All respondents: Residential (n=904)
Amongst businesses, there was a tendency to be more likely to pay 5% more (10% of all businesses or 77% of those willing to pay, whilst all of those willing to pay would pay 1% more a year (13% of the total businesses). Amount Willing to Pay for Smart Meters – Business
Q25b.-25e. Would you be willing to pay …% more a year? Base: All respondents: Business (n=300)
45
Customer Engagement Study July 2013
4.9.4 Reactions to Metering Charges When the concept of costs involved in the provision and maintenance of meters was raised in the qualitative research, most participants had never considered this aspect. They tended not to see it as a cost that consumers should pay, and presumed it was just a cost of doing business for Ausgrid, which should not be charged to the customer.
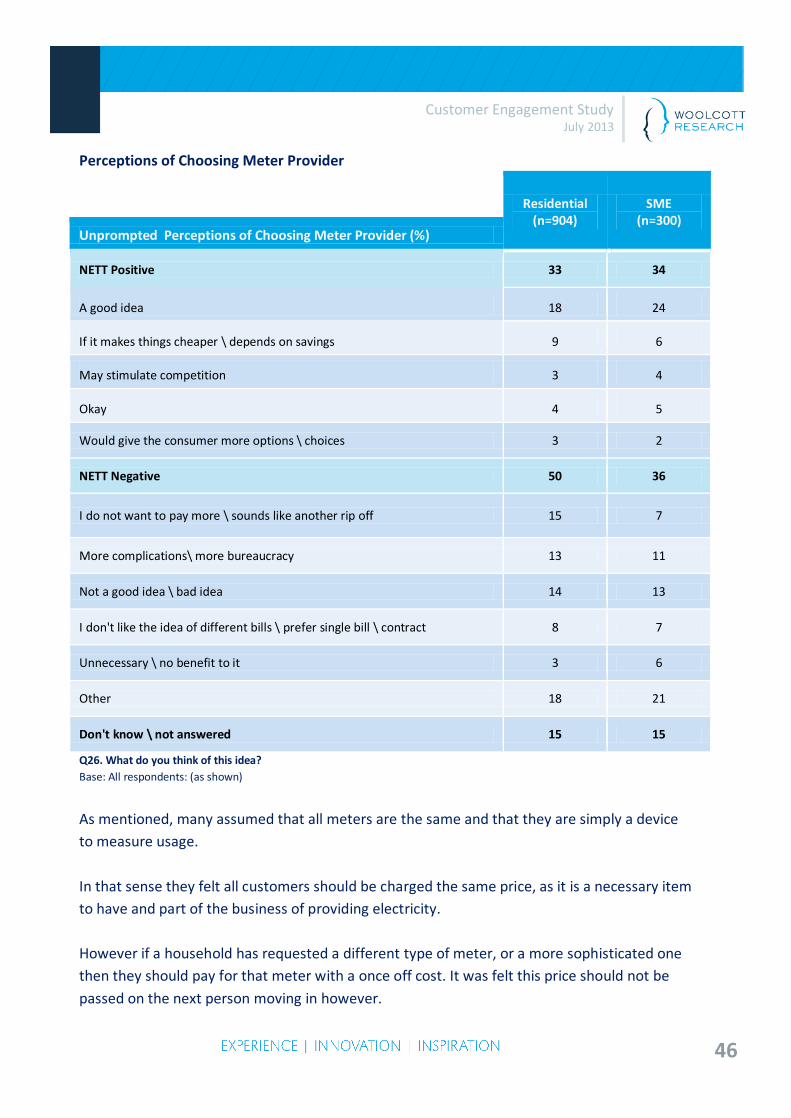
“Providing meters is just part and parcel of the service” Further to that, most felt that the concept of ‘unbundling’ the meter costings from the bill, and having to shop around and take up a separate contract with another supplier was just another complication which they did not need, unless they wanted a particular type of meter. There would have to be significant savings for it to be worthwhile. They also felt that this could lead to cheaper meters being sold by those without expertise, which could impact safety and accuracy. In that sense there was more confidence in Ausgrid as ‘the experts’ in the field. Most could not recall their meter being serviced or repaired, and they could not see the point of replacing something that already works. Across the groups one or two were interested in the opportunity to save money by shopping around, but there were concerns about then having separate bills and keeping track of what was what. One or two of the medium businesses were particularly interested in the concept as it provided another opportunity for them to proactively save costs. The quantitative research also indicated that whilst there was a segment of both residents and businesses who were interested in the idea if it resulted in a cost saving, a higher proportion were negative, seeing it resulting in extra costs, and as being more complex to understand.
46
Customer Engagement Study July 2013
Perceptions of Choosing Meter Provider
Residential
(n=904) SME
(n=300) Unprompted Perceptions of Choosing Meter Provider (%) NETT Positive 33 34 A good idea 18 24
If it makes things cheaper \ depends on savings 9 6
May stimulate competition 3 4
Okay 4 5
Would give the consumer more options \ choices 3 2
NETT Negative 50 36 I do not want to pay more \ sounds like another rip off 15 7
More complications\ more bureaucracy 13 11
Not a good idea \ bad idea 14 13
I don't like the idea of different bills \ prefer single bill \ contract 8 7
Unnecessary \ no benefit to it 3 6
Other 18 21 Don't know \ not answered 15 15 Q26. What do you think of this idea? Base: All respondents: (as shown)
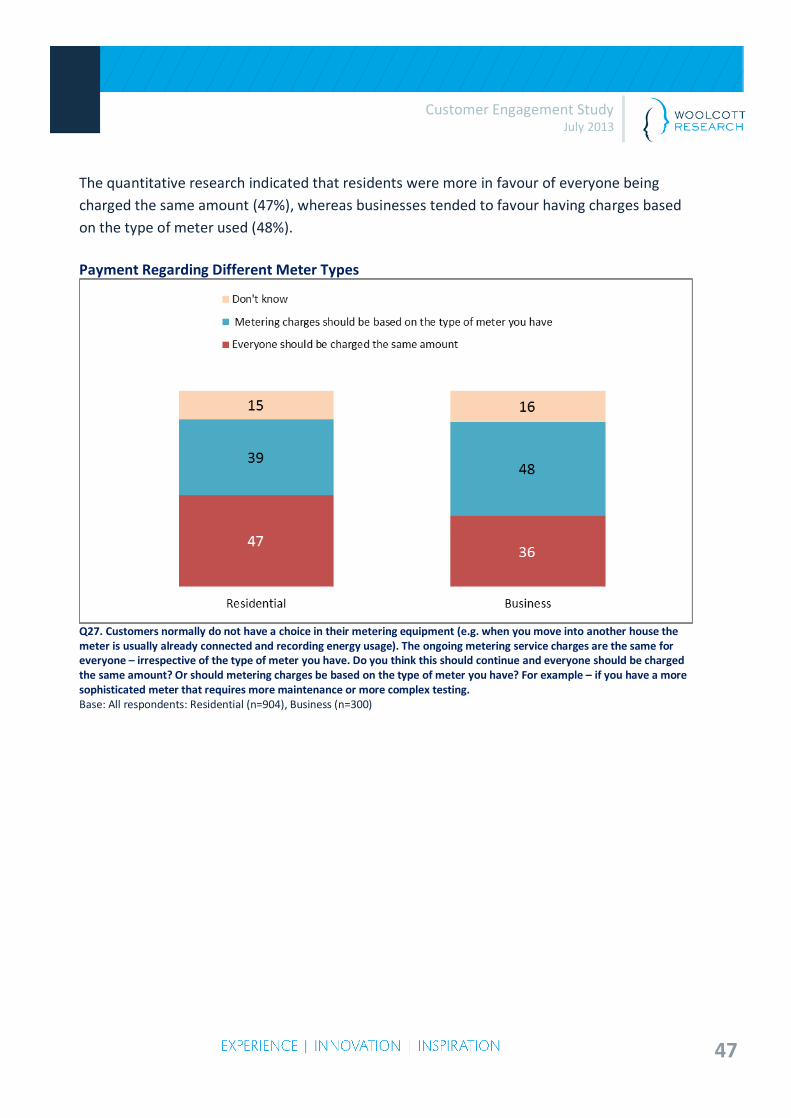
As mentioned, many assumed that all meters are the same and that they are simply a device to measure usage. In that sense they felt all customers should be charged the same price, as it is a necessary item to have and part of the business of providing electricity. However if a household has requested a different type of meter, or a more sophisticated one then they should pay for that meter with a once off cost. It was felt this price should not be passed on the next person moving in however.
47
Customer Engagement Study July 2013
The quantitative research indicated that residents were more in favour of everyone being charged the same amount (47%), whereas businesses tended to favour having charges based on the type of meter used (48%). Payment Regarding Different Meter Types
Q27. Customers normally do not have a choice in their metering equipment (e.g. when you move into another house the meter is usually already connected and recording energy usage). The ongoing metering service charges are the same for everyone – irrespective of the type of meter you have. Do you think this should continue and everyone should be charged the same amount? Or should metering charges be based on the type of meter you have? For example – if you have a more sophisticated meter that requires more maintenance or more complex testing. Base: All respondents: Residential (n=904), Business (n=300)
48
Customer Engagement Study July 2013
4.10 Awareness and Perceptions of Time Based Pricing Some of the qualitative participants, particularly those from Gosford or Newcastle reported that they were using time based pricing now, with mention of off peak, shoulder and peak charges. Those using it felt that it worked well and had helped them better plan and save, for example doing washing/dishwashing late at night. They liked that it offered the opportunity for personal control of usage. Some however could not understand why electricity would cost less at certain times, but they did understand when it was explained in terms of demand. Overall, most felt to be quite a good means of evening out demand, provided the cost of peak use was not too extreme. Many of those living in units tended to believe that it was not possible for them to take full advantage of Time of Use pricing, with body corporate rules about washing and driers, and noise after hours. Others felt that their electricity usage was a necessity when they did use it, and did not want to be hindered from using at peak times, when they felt it was necessary or desirable for them to do so.
“If I’m using it, I’m using it’
The perceived usefulness to business depended very much on what sort of business it was, with some feeling they were simply unable to change their electricity needs from peak to off peak, as the peak hours were when they most needed electricity. Some felt the ‘shoulder’ time was useful for them (2pm till 7pm) as they could schedule some things for that time, and some medium businesses (such as manufacturing and hospitality) felt they could schedule some of their operations for off peak times, (such as regular emailing, other sorts of processing, using shifts of workers) but they did feel that the majority of their usage had to be between daytime hours. “Customers want services during the day” The quantitative research confirmed the high levels of awareness of time based pricing, with 84% of residents and 88% of businesses indicating they were aware of it.
49
Customer Engagement Study July 2013
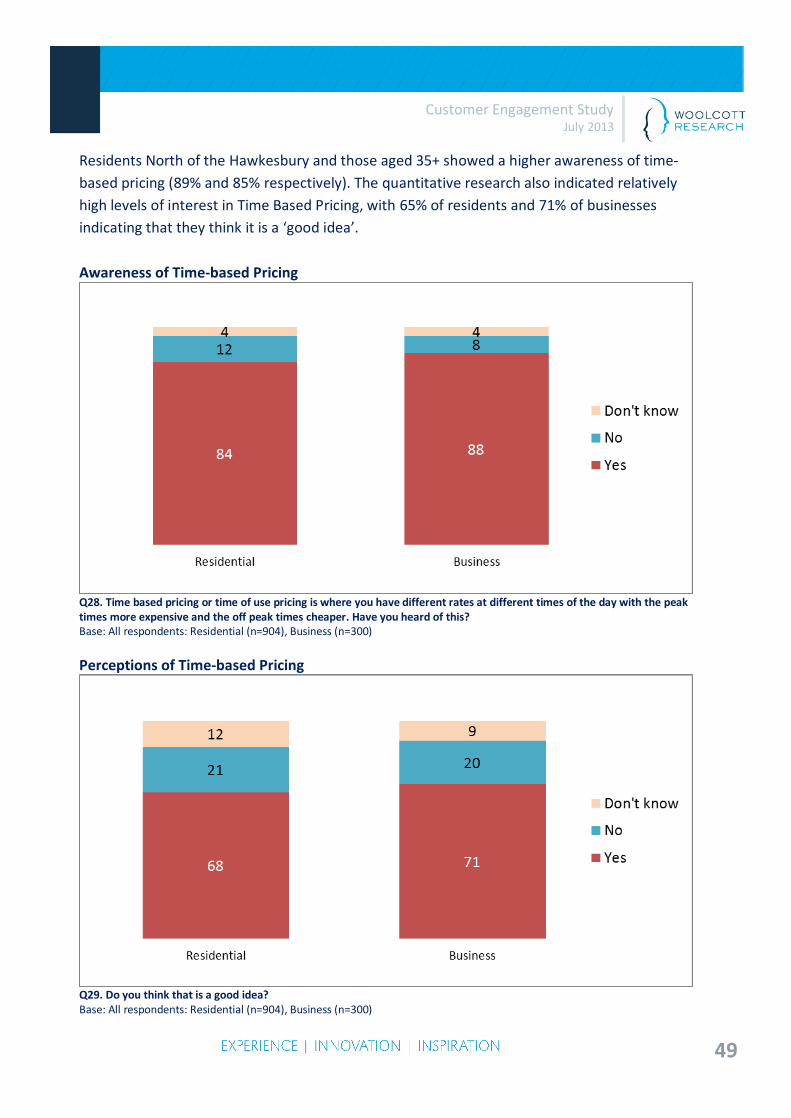
Residents North of the Hawkesbury and those aged 35+ showed a higher awareness of time-based pricing (89% and 85% respectively). The quantitative research also indicated relatively high levels of interest in Time Based Pricing, with 65% of residents and 71% of businesses indicating that they think it is a ‘good idea’. Awareness of Time-based Pricing
Q28. Time based pricing or time of use pricing is where you have different rates at different times of the day with the peak times more expensive and the off peak times cheaper. Have you heard of this? Base: All respondents: Residential (n=904), Business (n=300) Perceptions of Time-based Pricing
Q29. Do you think that is a good idea? Base: All respondents: Residential (n=904), Business (n=300)
50
Customer Engagement Study July 2013
4.11 Communication and Engagement The reactions from the qualitative research suggest that the majority do not expect a great deal of communication from Ausgrid, and most tended to felt they received enough information about electricity currently from either Ausgrid (for example when doing work in the area), or the retailer (with regard to their bills and energy efficiency). Communicating further with customers was not felt to be Ausgrid’s role, particularly if it meant it could impact on costs. However, there was a call for specific communication, particularly to help clarify why electricity costs have increased dramatically, and where the money was going. Some (more particularly the businesses) felt Ausgrid should communicate more about their corporate structure, their governance, and about their relationship with the NSW Government as this was not clear to them, and it impacted on their reactions to price increases. That is, as discussed earlier, some were not sure of the ownership of Ausgrid, and they therefore presumed any increases in charges were to benefit shareholders, possibly corporate organisations. A few were curious to know what the long term thinking was within Ausgrid about energy sources such as solar or nuclear, and some wanted to know more about the technology and products that were available to help them reduce their costs, such as meters and any other options there may be. None were however particularly willing to pay extra for further communication.
51
Customer Engagement Study July 2013
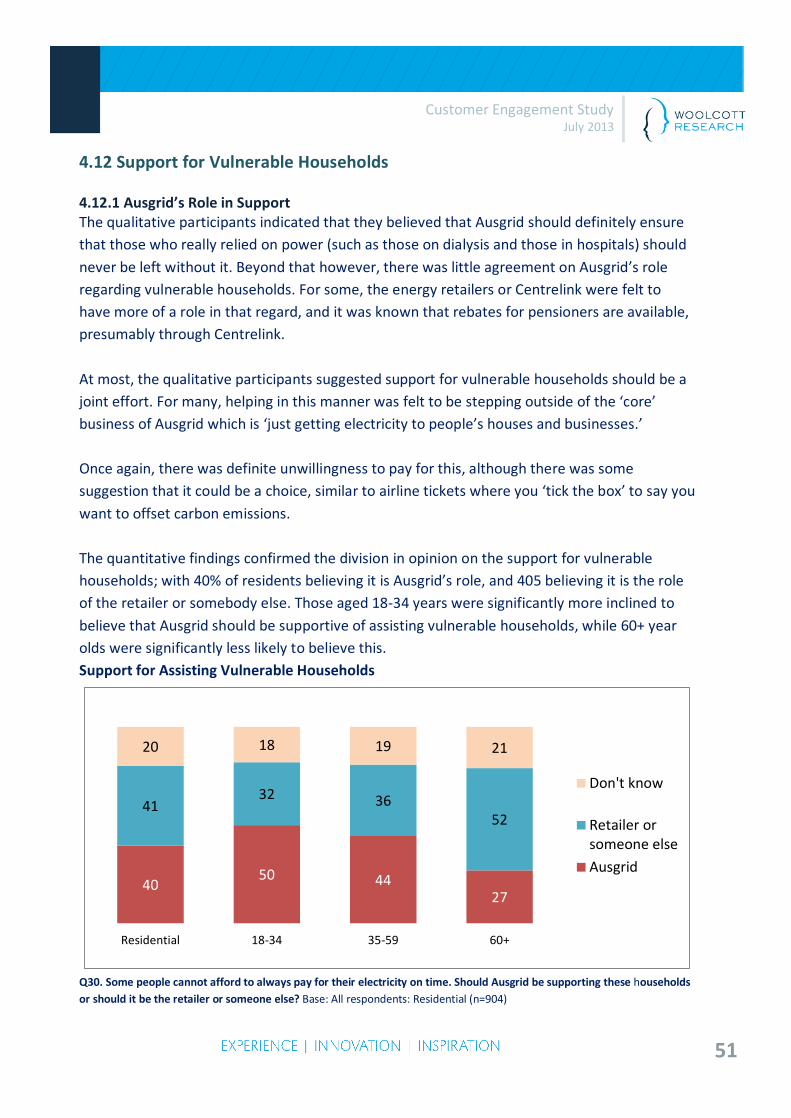
4.12 Support for Vulnerable Households 4.12.1 Ausgrid’s Role in Support The qualitative participants indicated that they believed that Ausgrid should definitely ensure that those who really relied on power (such as those on dialysis and those in hospitals) should never be left without it. Beyond that however, there was little agreement on Ausgrid’s role regarding vulnerable households. For some, the energy retailers or Centrelink were felt to have more of a role in that regard, and it was known that rebates for pensioners are available, presumably through Centrelink. At most, the qualitative participants suggested support for vulnerable households should be a joint effort. For many, helping in this manner was felt to be stepping outside of the ‘core’ business of Ausgrid which is ‘just getting electricity to people’s houses and businesses.’ Once again, there was definite unwillingness to pay for this, although there was some suggestion that it could be a choice, similar to airline tickets where you ‘tick the box’ to say you want to offset carbon emissions. The quantitative findings confirmed the division in opinion on the support for vulnerable households; with 40% of residents believing it is Ausgrid’s role, and 405 believing it is the role of the retailer or somebody else. Those aged 18-34 years were significantly more inclined to believe that Ausgrid should be supportive of assisting vulnerable households, while 60+ year olds were significantly less likely to believe this. Support for Assisting Vulnerable Households
4050 44
27
4132 36
52
20 18 19 21
Residential 18-34 35-59 60+
Don't know
Retailer orsomeone else
Ausgrid
Q30. Some people cannot afford to always pay for their electricity on time. Should Ausgrid be supporting these households or should it be the retailer or someone else? Base: All respondents: Residential (n=904)
52
Customer Engagement Study July 2013
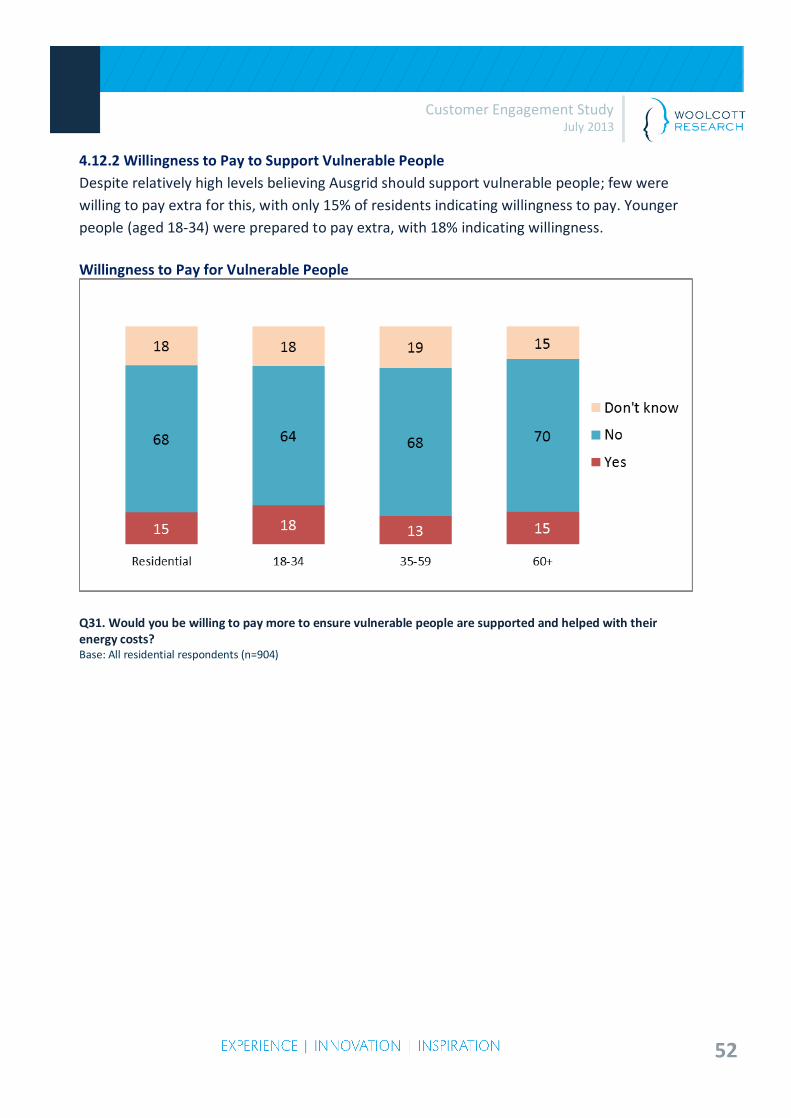
4.12.2 Willingness to Pay to Support Vulnerable People Despite relatively high levels believing Ausgrid should support vulnerable people; few were willing to pay extra for this, with only 15% of residents indicating willingness to pay. Younger people (aged 18-34) were prepared to pay extra, with 18% indicating willingness.
Willingness to Pay for Vulnerable People
Q31. Would you be willing to pay more to ensure vulnerable people are supported and helped with their energy costs? Base: All residential respondents (n=904)
53
Customer Engagement Study July 2013
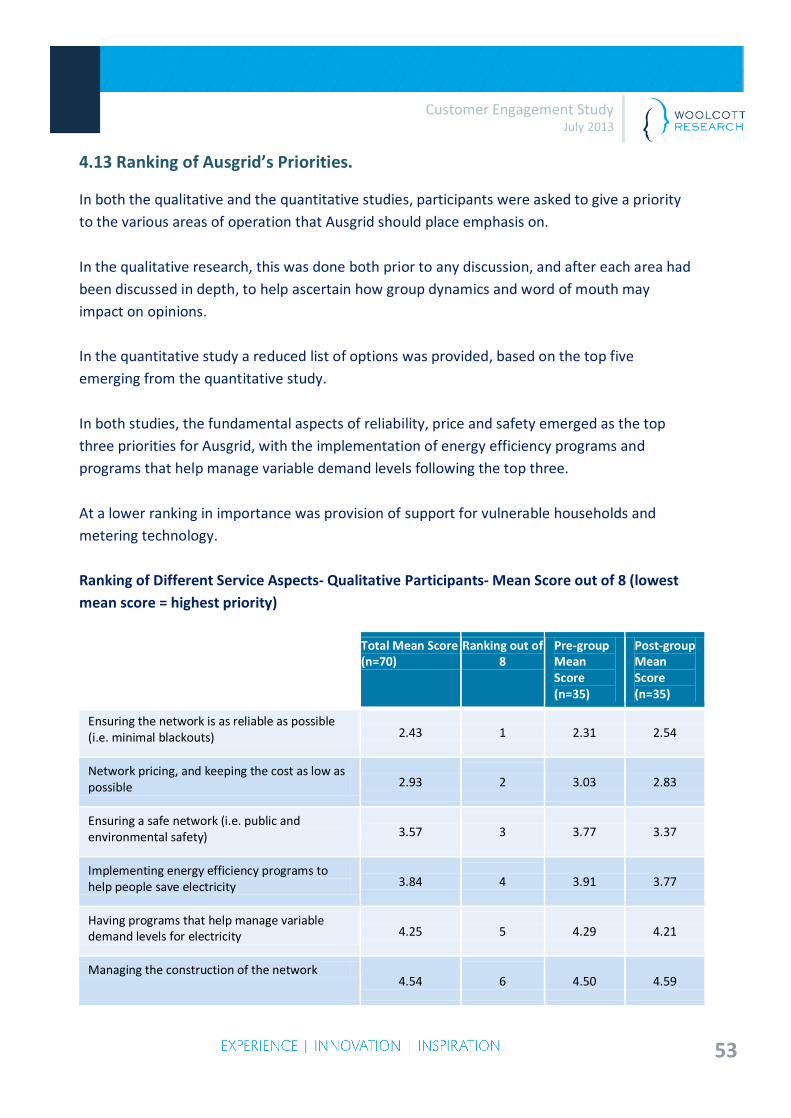
4.13 Ranking of Ausgrid’s Priorities. In both the qualitative and the quantitative studies, participants were asked to give a priority to the various areas of operation that Ausgrid should place emphasis on. In the qualitative research, this was done both prior to any discussion, and after each area had been discussed in depth, to help ascertain how group dynamics and word of mouth may impact on opinions. In the quantitative study a reduced list of options was provided, based on the top five emerging from the quantitative study. In both studies, the fundamental aspects of reliability, price and safety emerged as the top three priorities for Ausgrid, with the implementation of energy efficiency programs and programs that help manage variable demand levels following the top three. At a lower ranking in importance was provision of support for vulnerable households and metering technology. Ranking of Different Service Aspects- Qualitative Participants- Mean Score out of 8 (lowest mean score = highest priority)
Total Mean Score (n=70)
Ranking out of 8
Pre-group Mean Score (n=35)
Post-group Mean Score (n=35)
Ensuring the network is as reliable as possible (i.e. minimal blackouts) 2.43 1 2.31 2.54
Network pricing, and keeping the cost as low as possible 2.93 2 3.03 2.83
Ensuring a safe network (i.e. public and environmental safety) 3.57 3 3.77 3.37
Implementing energy efficiency programs to help people save electricity 3.84 4 3.91 3.77
Having programs that help manage variable demand levels for electricity 4.25 5 4.29 4.21
Managing the construction of the network 4.54 6 4.50 4.59
54
Customer Engagement Study July 2013
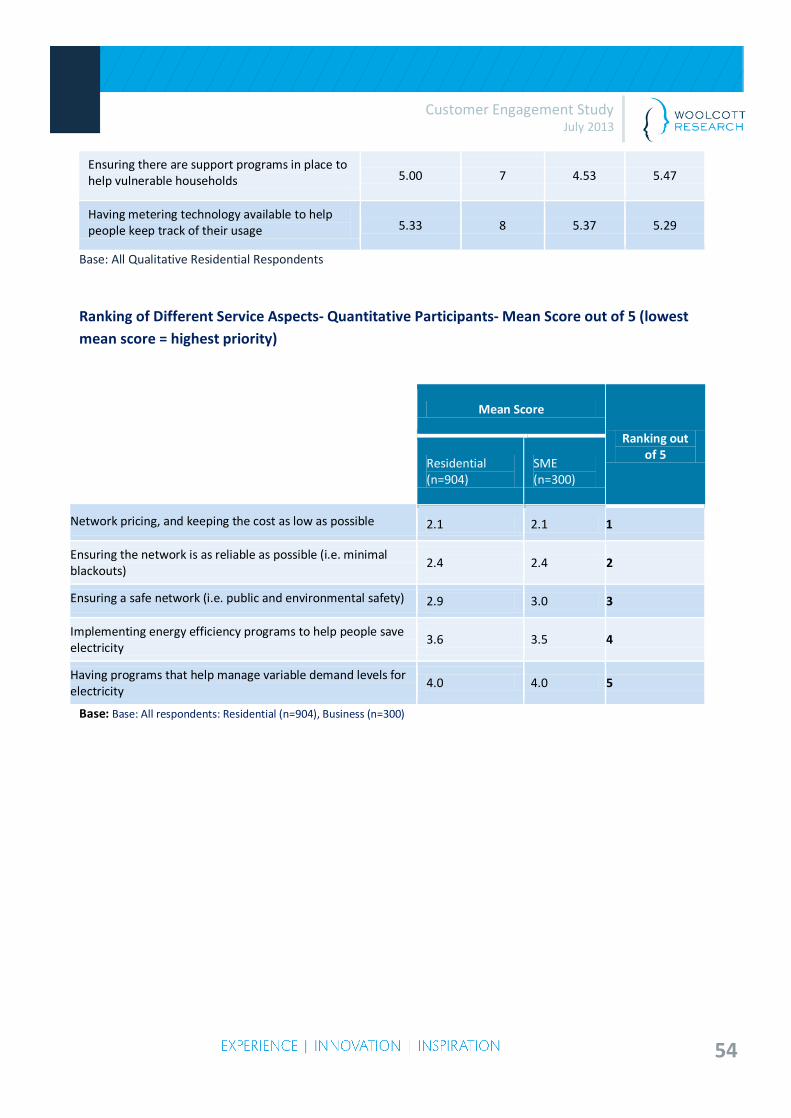
Ensuring there are support programs in place to help vulnerable households 5.00 7 4.53 5.47
Having metering technology available to help people keep track of their usage 5.33 8 5.37 5.29
Base: All Qualitative Residential Respondents Ranking of Different Service Aspects- Quantitative Participants- Mean Score out of 5 (lowest mean score = highest priority)
Mean Score
Ranking out of 5
Residential (n=904)
SME (n=300)
Network pricing, and keeping the cost as low as possible 2.1 2.1 1
Ensuring the network is as reliable as possible (i.e. minimal blackouts)
2.4 2.4 2
Ensuring a safe network (i.e. public and environmental safety) 2.9 3.0 3
Implementing energy efficiency programs to help people save electricity
3.6 3.5 4
Having programs that help manage variable demand levels for electricity
4.0 4.0 5
Base: Base: All respondents: Residential (n=904), Business (n=300)
55
Customer Engagement Study July 2013
5. Conclusions and Implications General Awareness The findings suggest that unprompted awareness of Ausgrid as the electricity distributor was relatively low, with businesses slightly more likely to be aware than residents. When prompted however awareness of the Ausgrid name was high, with businesses being significantly more aware than residents. The qualitative research suggested however that while the ‘brand’ name was known when prompted, actual knowledge of the organisation and its ownership was vague, with some confusion around government or private ownership. This confusion led to some scepticism and lack of trust, with some of those who suspected there was private ownership attributing price rises to the need to provide shareholders with a return. These findings suggest it may be useful for Ausgrid to better inform its customers about the structure and ownership, to eliminate that suspicion. Perceived Reliability Customers were generally very satisfied with the reliability of their service, with the majority of respondents scoring their reliability at over eight points out of ten. Many felt it had improved over recent years. Businesses gave a significantly higher rating in scores 8-10 (90% for businesses compared to 73% for residents. Given this already high standard, there was little willingness to pay more for a higher level of reliability. Safety Many customers found it quite difficult to envision safety risks that might ensue from electricity distribution, with the main risks perceived including the risk of fatalities and injuries from electric shocks; (18% residential, 36% businesses), and workers electrocuting themselves (4% residential, 26% businesses). Around two in ten of both residents and businesses were however willing to pay more for greater levels of safety. Underground vs. Overhead Construction
56
Customer Engagement Study July 2013
Whilst many of the residential customers did not feel underground cabling was worth paying extra for, there was a segment of just over a quarter (28%) of residents who indicated that they that were willing to pay more for this. Families with older children were significantly more willing to pay (37%), and residents with higher incomes were slightly more willing to pay (30%), as were Sydney residents (30%). Pricing/Forecasting A significant proportion of both residents and businesses had seen high increases in their electricity bills over the past year (52% of businesses claimed their bills had risen a lot and 45% of residents felt this). This feeling caused some angry discussion within the qualitative research, with few having a clear understanding of why the increases had been so steep. It would seem there is a need to better explain this if prices were to rise again in the future. These rises did inhibit many from expressing any willingness to pay more for the aspects being covered by the research. When questioned regarding whether they would, in the event of the need for a “one-off’ type price rise, prefer steady increases over several years, rather than an initial steep increase and then a levelling out, there was a clear preference for the steady increases (92% of residents and 91% of businesses) because it reduced the shock of the steep increase in one year. Connection Fees Over two thirds of respondents were aware of connection fees associated with their electricity supply. When questioned about how connection fees should be charged, there was a significant divide between residents and businesses: residents had a strong preference (64%) for everyone paying the same amount while businesses showed a strong preference for some paying more and some paying less (70%). Energy Efficiency Programs The majority of residents in the research claimed they had made some effort (a little or a lot) to reduce their electricity usage as a result of the higher prices (95% of resident and 93% of businesses). Residents North of the Hawkesbury and older respondents (60+) were significantly more likely to suggest that they had devoted ‘a lot’ of effort into reducing usage (63% and 64% respectively).
57
Customer Engagement Study July 2013
Businesses were less likely than residents to have made efforts to reduce their usage, with some of the medium businesses in particular believing that they could not make changes due to the nature of their business. Small businesses were more likely than medium to have tried to make changes (49% indicated that they made a lot of effort). The majority (85% and 84%) of residents and businesses believed that Ausgrid should be aiding people to be more energy efficient and this was highest amongst medium businesses (91%). Few were willing to pay extra for this however. Demand Management Most (81% of residents and 85% of businesses) believed that Ausgrid should be working with households and customers to ensure they understand the impacts of changes in demand. Current awareness of Demand Management schemes was low for both residents and businesses (19% and 16% respectively), however over a third of respondents were willing to participate in such a scheme, suggesting that there is further potential for Ausgrid to educate further about Demand Management and to promote these schemes in future. Residents were more willing to participate than businesses (39% and 30% respectively) were willing to participate). The majority of residents who would participate did expect that they would receive a $100 rebate for taking part, and the majority of businesses expected to receive 15% off their bill for participating Metering Technology Two thirds of respondents had heard of Smart Meters, and residents North of the Hawkesbury showed the highest awareness of Smart Meters (74%). Amongst those aware, there was much negativity surrounding Smart Meters with only a small percentage mentioning their function. Even so, over a third of residents were interested in Smart Meters (38%), and 19% of businesses were interested. The younger 18-34 year olds showed significantly more interest in having a Smart Meter (53%). Few were interested in paying more however, with only 12% of residents and 13% of businesses willing to pay extra for one, indicating that whilst there is some interest in the
58
Customer Engagement Study July 2013
overall idea, it will be difficult to market Smart Meters at a price, without clear evidence of resultant cost savings that might be possible. With regard to choice of meter provider, businesses were less negative about this concept overall, and were significantly less likely to be concerned about it costing more, and being a potential ‘rip off’. These findings suggest that this concept may be able to be offered to businesses as an option, whereas it will be a more difficult idea to market to consumers, who will need clear evidence concerning the benefits of doing this, and reassurance that it should not cost more if the right choices are made. There were also significantly different opinions regarding payments for different meter types according to need, with nearly half of businesses (48%) believing that charges should be tailored to individual needs, while 48% of residents believed everyone should be charged the same amount. Time-based Pricing Apparent awareness of time-based pricing was very high (84% amongst residents and 88% amongst businesses).Residents North of the Hawkesbury and those aged 35+ showed a higher awareness of time-based pricing (89% and 85%). The concept of time-based pricing was thought more highly of by businesses than residents, but the majority of both groups see it as positive (71% of businesses thought it was a good idea compared to 68% of residents), again indicating the likelihood of a positive reception to the promotion of this aspect. Support for Vulnerable Households Two in five residents (40%) felt that Ausgrid should be supporting residents of vulnerable households, while 41% thought that retailers or ‘someone else’ should be assisting them. The younger residents aged 18-34 years old were significantly more inclined to believe that Ausgrid should be supportive of assisting vulnerable households (50%), while 60+ year olds were significantly less likely to think this. Few residents (15%) were however willing to pay extra for Ausgrid to carry out this support. Willingness to Pay Summary
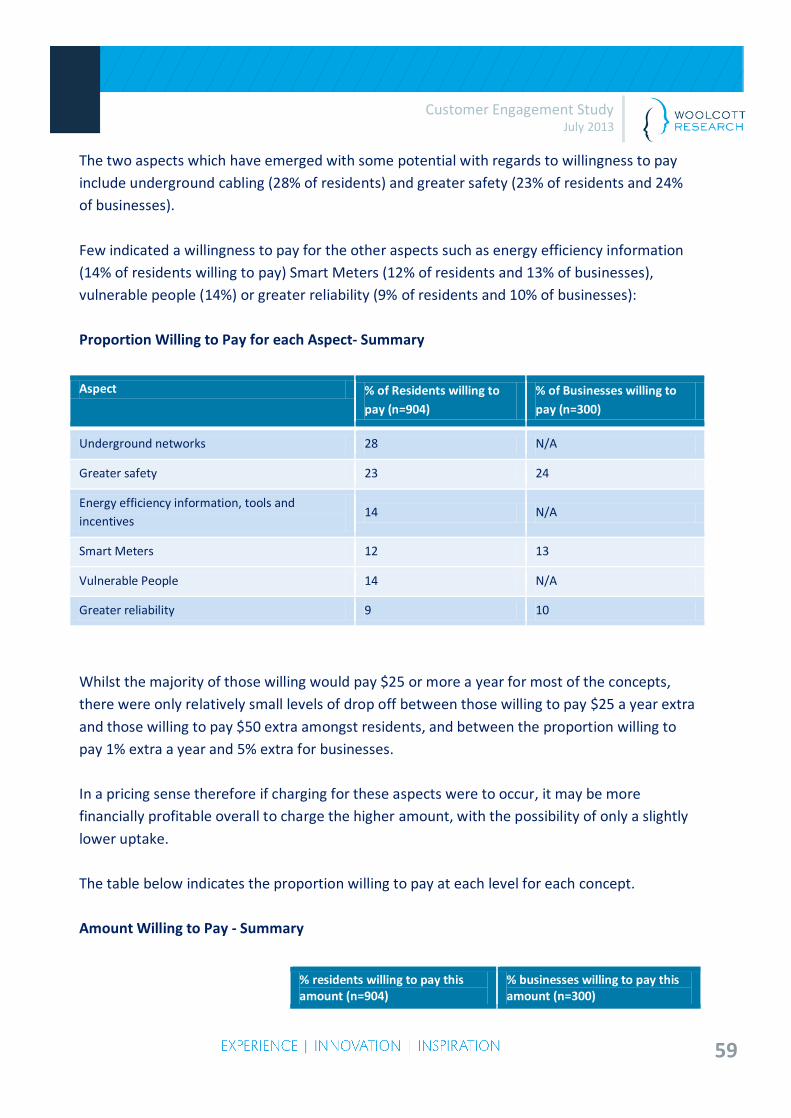
59
Customer Engagement Study July 2013
The two aspects which have emerged with some potential with regards to willingness to pay include underground cabling (28% of residents) and greater safety (23% of residents and 24% of businesses). Few indicated a willingness to pay for the other aspects such as energy efficiency information (14% of residents willing to pay) Smart Meters (12% of residents and 13% of businesses), vulnerable people (14%) or greater reliability (9% of residents and 10% of businesses): Proportion Willing to Pay for each Aspect- Summary
Aspect % of Residents willing to pay (n=904)
% of Businesses willing to pay (n=300)
Underground networks 28 N/A
Greater safety 23 24
Energy efficiency information, tools and incentives
14 N/A
Smart Meters 12 13
Vulnerable People 14 N/A
Greater reliability 9 10
Whilst the majority of those willing would pay $25 or more a year for most of the concepts, there were only relatively small levels of drop off between those willing to pay $25 a year extra and those willing to pay $50 extra amongst residents, and between the proportion willing to pay 1% extra a year and 5% extra for businesses. In a pricing sense therefore if charging for these aspects were to occur, it may be more financially profitable overall to charge the higher amount, with the possibility of only a slightly lower uptake. The table below indicates the proportion willing to pay at each level for each concept. Amount Willing to Pay - Summary
% residents willing to pay this amount (n=904)
% businesses willing to pay this amount (n=300)
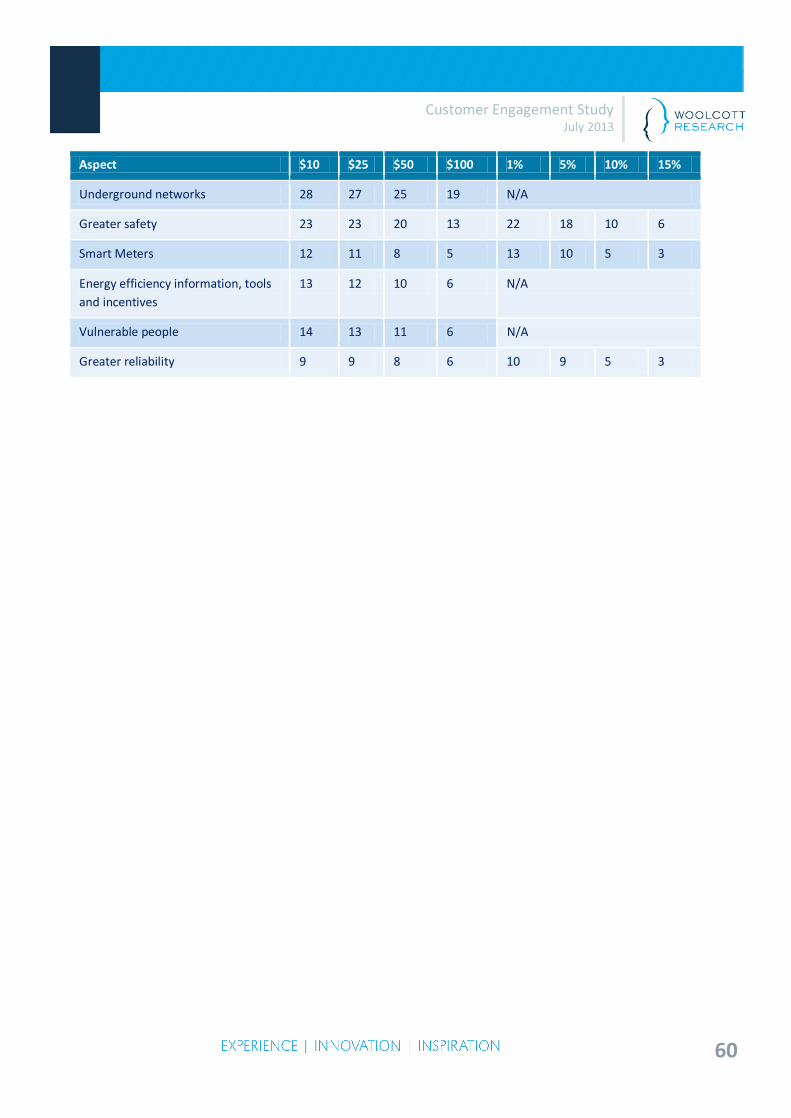
60
Customer Engagement Study July 2013
Aspect $10 $25 $50 $100 1% 5% 10% 15%
Underground networks 28 27 25 19 N/A
Greater safety 23 23 20 13 22 18 10 6
Smart Meters 12 11 8 5 13 10 5 3
Energy efficiency information, tools and incentives
13 12 10 6 N/A
Vulnerable people 14 13 11 6 N/A
Greater reliability 9 9 8 6 10 9 5 3

61
Customer Engagement Study July 2013
APPENDIX: Topic Guide
INTRODUCTION
Good Morning/ Afternoon/Evening, my name is ….from Woolcott Research. Thank you all very much for coming along, please make yourself comfortable, and help yourself to drinks and nibbles as we go along.
It is a very open discussion, and there is no right or wrong answers. This is exploratory research to see what people think or feel.
We do want to record the discussion for our purposes only, as we are doing several of these and we do lose track of what everyone has said.
Today we are going to be talking mostly about the company that is responsible for distributing your electricity…. Do you know who that is?
This research is about Ausgrid.
SHOWCARD AND READ OUT: Ausgrid is called a ‘distributor’ of electricity, and their job is to transport energy through a series of poles and wires to your home or business. Your distributor is determined by the geographic location where your house is – you don’t have a choice of distributor. You pay for this service through your electricity retailer who passes on Ausgrid’s network charges to you in your electricity bill.
We are not going to be discussing your energy retailer, for example companies like EnergyAustralia, AGL, and Origin etc. who are responsible for ‘selling’ the electricity to you. Your retailer is responsible for sending you a regular electricity bill and pursues payment of that bill. Your electricity bill is made up of retail charges for the energy you use, distribution charges that Ausgrid bills to the retailer and then the retailer passes those charges through to you, and metering and service access charges. We are discussing Ausgrid today, the distribution company that is responsible for maintaining a safe and reliable electricity network of poles and wires.
BRIEF BACKGROUND/WARM UP
• ASK PARTICIPANTS TO INTRODUCE THEMSELVES
• We might start off with a very brief discussion about what you know about Ausgrid and where you may have seen them or what you may have heard about them…..
RELIABILITY
SHOWCARD AND READ OUT: Ausgrid is required by law to provide customers with a reliable supply of electricity. This means there are limits on the frequency and duration of interruptions to the supply of electricity. An interruption can be in the form of a brief ‘dip’ to a prolonged outage/blackout. Ausgrid therefore spends money replacing, maintaining or improving the network infrastructure (e.g. poles and wires) to deliver reliability to meet acceptable standards.
Now let’s discuss the reliability of the power service in your area, and what you feel about that…
62
Customer Engagement Study July 2013
• Overall, thinking about power interruptions in your area…say in the past year….have
you had any, have they occurred very often, how long do they tend to last if they have occurred?
• And do you feel you get enough information about outages or interruptions? For example, before one occurs, at the time, and after it occurs?
• How do you receive this information e.g. Ring Ausgrid, check its website for outage information, listen to the radio, twitter, Facebook, etc.
• How would you like to receive information about interruptions? E.g. website, radio, via SMS, on smartphone.
• Ideally what (other) information would you like to have about interruptions….. What sort of things would you expect to be told, and when?
• WILLINGNESS TO PAY making sure the network is as reliable as possible obviously has cost implications in keeping maintenance up and in providing infrastructure….how willing would you be to pay more each year to ensure greater reliability?
• Assuming that greater reliability will cost more, roughly how much extra would you be prepared to pay each year to ensure a high level of reliability….PROBE would you pay $100 more a year, $50 more, $25, $10, no more at all?
• Alternatively how do you feel about paying less, but having a less reliable service? • Whilst power interruptions can occur for a number of reasons, greater demand on the
network due to weather conditions is one cause. Provide scenario that it is Christmas Day/New Year’s Eve with all the family/friends coming over, the weather is extremely hot and the main meal is yet to be cooked (can’t use bbq) when a blackout occurs with no indication of when power will be restored. Does this information change your answer about being willing to experience a less reliable service?
SAFETY There are many safety and environmental things to think about when operating an electricity network.
• What types of safety problems do you think there may be from running an electricity network (This could be a warm up question to get the customer thinking ONLY PROMPT IF NECESSARY) - Fatalities/ injuries from electrical shocks, kids playing inside substations; street trees
contacting power lines; workers digging into an underground cables; workers electrocuting themselves;
- Environmental incidents ( oil spill into waterways) - Bushfires starting from clashing major power lines like Victoria - Asbestos in switchboards
• Do you think a Distributor should have an obligation to ensure these things don’t happen? • Why would these risks occur, and what could the business do to stop it? (this could be guided
activity to assess the level of awareness of these issues: old equipment, bad maintenance, not cutting trees back, not enough safety training for workers , lack of awareness by the public. • To avoid a higher price, would you accept reduced expenditure on safety
• Would you want lower prices if it meant reducing the safety of services provided?
63
Customer Engagement Study July 2013
CONSTRUCTION/DESIGN STANDARDS
SHOWCARD AND READ OUT: Ausgrid often has to design and build new infrastructure (e.g. substations, poles and wires) to connect new customers, meet higher demand and replace old infrastructure. When they do, they have to make decisions on the best design option. Sometimes a more costly design is in response to community concerns such as safety, appearance or the health of the environment.
• TRADE OFF: There are a number of things Ausgrid could do with regards to the supply of electricity…I just want to know what overall aspects are most important to you……..CARD SORT Could we just rank these in terms of how important they are to you overall, and why they are important/not important? So which of these is most important to you in the provision of electricity to the community? Which next, which next, why is that?
o PRICE….keeping the connection costs for households as low as possible o AESTHETICS …..Lessening the visual impact of substations and the poles and wires o SAFETY….delivering improvements to the safety of infrastructure …e.g. with high
grade fencing right around substations o THE ENVIRONMENT….Using equipment and construction methods that have least
impact on the environment.
• WILLINGNESS TO PAY: Underground cabling costs significantly more ( x4 to 10x as much as overhead) to provide, due to the digging and tunneling and the cable quality etc…..Would you be willing to pay more every year to ensure the network was undergrounded even if it was not just for your street?
• Roughly how much more would you be willing to pay? …..$100 more a year, $50 more, $25, $10, no more at all?
• Ausgrid strives to protect the environment and ensure that power is supplied in an environmentally friendly manner e.g. Prevent oil spills and trim trees carefully but this adds extra money each year to everyone’s power bill. Would you be willing to pay more to ensure this was done wherever possible?
o Roughly how much more would you be willing to pay? ….PROBE$100 more a year, $50 more, $25, $10, no more at all?
• Similarly, further safety measures could be used ……how willing would you be to pay more to ensure the most effective safety measure possible were used …for example secure fencing around substations?
PRICING AND FORECASTING
SHOWCARD AND READ OUT: Distributors like Ausgrid are required to prepare budgets based on forecasting the future condition of their network and expected customer usage to determine what future investment is necessary. These forecasts are reviewed and adjusted by the Australian Energy Regulator. This process determines how much Ausgrid can charge for their distribution services. The distribution charge makes up about 40% of your total bill.
64
Customer Engagement Study July 2013
• What would you prefer in terms of prices in the long term? ROTATE For instance, if the
ultimate price outcome was the same over the next 10 years, would you prefer to reach it via a steady price change each year (for example 2% a year increase) or via An initial steep increase over a short number of years, followed by almost flat prices (i.e. just linked to the CPI) Have you noticed any change in the cost of your electricity over the past year or so? Has it moved down or up, or not changed?
• Do you think the prices for the electricity service are fair for consumers, given the costs involved in supplying it? Why, why not?
• Have you made any changes in the way you use electricity within your household in response to price changes? What sorts of things have you done?
• Do you do those things all the time, or just on hottest/coldest days?
• Do you do anything else to save power on very hot or very cold days?
• And have you stopped using or changed any of the appliances or equipment you have in reaction to the price increase, which ones? PROBE What about white goods (fridges, washing machines, gas heaters), or your hot water system, air conditioning, solar PV, energy saving devices, swimming pool pumps/heaters etc.
• Have you switched from electricity to gas or another power source for any purposes as a result of the increases? Do you plan to in the future?
• If prices were to remain steady at the level they are at, say for the next five years, do you think you would continue as you are now, and continue with the changes you have made, or would you go back to what you were doing before?
• Would you do anything further than you have already done if prices remained steady for five years?
• What about if prices were to fall?
• What about if prices were to increase more?
CONNECTION FEES
• Do you think it is fair that new customers should pay for the cost of their own connection, rather than the cost being spread across all customers? Scenario – when building a new house a customer’s electrical requirement may exceed the current network capacity and so the customer is required to pay to augment or upgrade the network capacity, e.g. a new kiosk. The augmentation costs must be paid by the customer but other new customers who connect to the network will benefit from the new kiosk but won’t have to contribute to its costs.
• What if the project also benefits other customers? Should the customer still pay for the full costs?
• Just thinking for a moment about the cost of being connected to the network, and having the supply available to you (i.e. not about the costs for the actual amount you use) …..Were you aware that you are charged separately for this? Are you aware that these charges will apply irrespective of if you use any power, i.e. if the house was vacant you would still need to pay the connection costs?
• Do you think customers should be charged to have the electricity supply available to the house?
65
Customer Engagement Study July 2013
• And do you feel all households should pay the same amount to have the electricity supplied,
or do you think some households should pay more, some less?? Why is that? Who should pay more/less?
ENERGY EFFICIENCY PROGRAMS
• Are you aware of any Ausgrid activities or initiatives which encourage or help households to be more efficient in their use of energy? What are you aware of?
• PROBE Do you know of any information or advice provided by Ausgrid about using energy efficiently?
• Do you think Ausgrid should try and help people to be more energy efficient? Or do you think this should come from the retailer who sells you the power? (Comment – please note if anyone recognises that since retailers sell the power – they may not want to teach customers how to be more efficient and use less of their product)
• WILLINGNESS TO PAY: And how willing would you be to pay extra for Ausgrid to provide this sort of information or tools and incentives?
o Roughly how much more would you be willing to pay for them to do this? …..PROBE $100 more a year, $50 more, $25, $10, no more at all?
DEMAND MANAGEMENT
• Were you aware that there are differing levels of demand for electricity, depending on the time of day or time of year? If required – prompt with example –in the afternoon when everyone gets home and prepares meals etc. or on the few really hot days when everyone turns on their air conditioner.
• Do you think those differing levels might impact on the supply of electricity to any degree? When and how do you think it impacts?
• Do you think Ausgrid should work with households to ensure they understand the impacts of the changes in demand?
• Should they try and encourage people to even out that demand to an extent?
• Are you aware of any demand management schemes targeted at residential customers? If prompting needed – e.g. Programs where customers agree to allow Ausgrid to control the use of high energy demand appliances like air conditioners during peak demand times in return for a rebate or discount.
• Would you be willing to participate in the above scheme example? o Roughly how much of a rebate or discount would you expect to receive for
participating in the above example scheme? …..PROBE $100 less a year, $50 less, $25, $10, no less at all?
METERING TECHNOLOGY
SHOWCARD AND READ OUT: Meters are installed in every home to record the energy usage of each customer. Currently, distributors like Ausgrid are responsible for the meters in their distribution
66
Customer Engagement Study July 2013
area. Meter service costs are currently bundled into the overall network charges that form a component of your energy bill.
• Have you heard anything about the installation of special electricity meters in households to help people measure and control their electricity usage? IF PROMPTING IS NEEDED there are now “smart meters” that are smart because they allow 2 way communication – that is the meter can read your energy usage and then communicate with an in-home display that provides you with access to real time information on your electricity usage. Note – we are not talking about time of use meters. The media have referred to time of use meters as smart meters – this is incorrect. Standard time of use meters do not have the 2 way communication and so are not “smart”. We are only talking about “smart meters” in this section.
• What do you know about this? What do you feel about the idea? What are the benefits? And would there be any drawbacks?
• These meters can show you exactly how much power you are using at any one time….how useful would that be to you? Would that help you save power do you think?
• You may also be able to obtain the information from your meter remotely, when you are not there, through the internet or smart phone application, so you can see how much is being used while you are not in the house….how useful would that be to you?
• Would you like to have access to that sort of meter?
• How willing would you be to pay to have access to that sort of a meter and the information it provides?
• Roughly how much more would you be willing to pay? …..$100 more a year, $50 more, $25, $10, no more at all?
SHOWCARD AND READ OUT: The Australian Energy Regulator is considering separating meters from the distribution businesses and allowing customers to select a meter provider. This would mean that the metering service costs would be unbundled from the network charges and you could have the choice of entering into a contract with a separate meter provider who would bill you for the metering charges.
• If metering services (such as repairs, testing, maintenance and data services) became a separate service that was charged separately on your bill, how would you feel about that?
• Would you actively shop around for a new metering services provider? (For example, you could go to a retailer like a Dick Smith, or another specialist provider rather than Ausgrid providing this)
• If so, why? • Customers normally do not have a choice in their metering equipment (e.g. when you move
into another house the meter is usually already connected and recording energy usage). The ongoing metering service charges that you pay are the same as everyone else – irrespective of the type of meter you have. Do you think this should continue and everyone should be charged the same amount? Or should metering charges be based on the type of meter you have? For example – if you have a more sophisticated meter that requires more maintenance or more complex testing.
TIME BASED PRICING
• Have you heard anything about time based pricing or time of use pricing? That is where you have different rates at different times of the day with the peak times more expensive and the off peak times cheaper….
67
Customer Engagement Study July 2013
• Do you think that is a good idea?
• What do you think would be the benefits of that sort of pricing system? • And the drawbacks?
• Do you feel you would save electricity if you had that system? Why/why not??
COMMUNICATION AND ENGAGEMENT To be reduced if necessary (see shaded text)
• Overall, what information that is provided by Ausgrid are you aware of?
• Have you found the information they provide useful? • Does it come at the right time? Is it generally easy to understand?
• Is there any more information that you would like to receive from them?
• Would you like them to communicate with you more often than they do? Why?
• Would you be willing to pay more if it meant they provided more information, and communicated with you more often?
o Roughly how much more would you be willing to pay? …..$100 more a year, $50 more, $25, $10, no more at all?
SUPPORT FOR VULNERABLE HOUSEHOLDS
• Some people say Ausgrid should do more to help people who cannot afford to always pay for their electricity on time….others believe they should do less. Note – Ausgrid does not bill the customer and Ausgrid does not pursue payment of electricity bills – that is the role of the retailer. Ausgrid gets paid by the retailer irrespective of whether the retailer gets paid by the customer. This means that retailers have a vested interest in offering hardship programs to enable vulnerable customers to pay back their energy debt.
• Are you aware of anything Ausgrid does to help people who have difficulties?
• Should they be supporting these people? And to what degree should they provide support? What categories of people in particular should be helped? If prompting is needed – veterans, the unemployed, customers in hardship, pension card holders.
• WILLINGNESS TO PAY: Would you be willing to pay more to ensure vulnerable people are supported and helped with their energy costs?
o Roughly how much more would you be willing to pay? …..$100 more a year, $50 more, $25, $10, no more at all?
POST QUESTIONNAIRE Now that you may have a better understanding of some of Ausgrid’s areas of operation, I would like you to fill out this questionnaire again for us. Your priorities may have changed or they may still be the same. Just fill it out to reflect what you feel. THANK AND CLOSE
68
Customer Engagement Study July 2013
APPENDIX: Questionnaires
Residential Questionnaire
Survey Introduction
Thank you for taking part in this survey. We have been commissioned by your electricity distributor, to conduct an important study to obtain feedback on your electricity service. The survey will take about 12-15 minutes. Be assured that your answers will remain totally confidential and will simply be reported back in a general sense. If you have any questions regarding the survey, please contact Dale Osborne or Liz Sparham at Woolcott Research on 02 9261 5221. Firstly, we just need to ask some questions to check that you fit the criteria we are looking for.
Screening Questions
S1. Firstly, what is your postcode? WRITE IN _______________________________________ (Ausgrid Network area only, QUOTAS FOR AUSGRID: 60% in the Sydney network area and 40% in the Hunter/Coast area. S2. And what age category do you fall into? 1 Under 18 (TERMINATE)
2 18 – 24
3 25 – 34
4 35 – 44
5 45 – 54`
6 55 – 59
7 60-64
8 65+
NO QUOTAS BUT WEIGHTED DURING ANALYSIS S3. Do you currently own or rent your home 1 Own/paying off home
69
Customer Engagement Study July 2013
2 Rent (lease in in my name)
3 Rent (lease is not in my name) MAJORITY OF RESPONDENTS SHOULD BE CODE 1 OR 2 S4. Are you responsible for paying electricity bills (either solely or jointly)?
1 Yes 2 No
QUOTAS: At least 70% bill payers S5. On average, how much is your electricity bill a quarter?
1 Under $350 per quarter - LOW CONSUMPTION 2 Between $351 - $750 per quarter - MEDIUM CONSUMPTION 3 Over $751 per quarter - HIGH CONSUMPTION
CHECK QUOTAS S6. Could you please tell me which of the following categories best describes your household income before tax?
1 Under $800 per week - LOW INCOME 2 $800-$1,200 per week - MEDIUM INCOME 3 Over $1,200 per week - HIGH INCOME 4 Refused
CHECK QUOTAS Thank you. That’s the end of the screening questions. You will not be screened out from now on.
Awareness
Q1. Do you know what the name is of your electricity distributer? That is the organisation that transports energy through a series of poles and wires to your home? (Note: this is not your electricity retailer)
WRITE IN NAME:_______________________
TO APPEAR AFTER THEY HAVE ANSWERED Q1: Ausgrid is the ‘distributor’ of electricity in your area. Their job is to transport energy through a series of poles and wires to your home. Your distributor is determined by where you live – you don’t have a choice of distributor. You pay for this service through your electricity retailer (e.g. EnergyAustralia, AGL, Origin etc.) who pass on Ausgrid’s network charges to you in your electricity bill.
70
Customer Engagement Study July 2013
Your electricity bill is made up of retail charges for the energy you use, distribution charges that Ausgrid bills to the retailer and then the retailer passes those charges through to you, and metering and service access charges. We are not going to be asking you about your energy retailer in this survey. We will be asking you questions about Ausgrid today, the distribution company that is responsible for maintaining the electricity network.
Q2. Have you heard of Ausgrid before today?
1 Yes 2 No 3 Don’t know
Reliability
Q3. On a scale of 1 to 10, where 1 is very poor and 10 is excellent, how reliable would you say your electricity service is?
V poor 1...............................................10 excellent Ausgrid is required by law to provide customers with a reliable supply of electricity. This means there are limits on the frequency and duration of interruptions to the supply of electricity. An interruption can be in the form of a brief ‘dip’ to a prolonged outage/blackout. Q4. How many outages/blackouts (unplanned power interruptions) have there been in your area in the last few years?
0 1-2 3-5 5+
Q5a. Making sure the network is as reliable as possible obviously has cost implications in keeping maintenance up and in providing infrastructure….would you be willing to pay more each year to ensure greater reliability? 1 Yes 2 No (SKIPTO Q6) 3 Don’t know (SKIPTO Q6) Q5b. IF ANSWERED YES TO Q5....Would you be willing to pay $100 more a year? 1 Yes (GO TO NEXT SECTION) 2 No
71
Customer Engagement Study July 2013
Q5c. IF ANSWERED NO TO Q5b....Would you be willing to pay $50 more a year? 1 Yes (GO TO NEXT SECTION) 2 No Q5d. IF ANSWERED NO TO Q5c....Would you be willing to pay $25 more a year? 1 Yes (GO TO NEXT SECTION) 2 No Q5e. IF ANSWERED NO TO Q5d....Would you be willing to pay $10 more a year? 1 Yes(GO TO NEXT SECTION) 2 No Q6. Would you be willing to pay less each year for a less reliable service? 1 Yes 2 No 3 Don’t know
Safety
Q7. What do you think the main safety risks are when running an electricity network? ___________________________________________________________________________________
Q8a. "There are minimum regulatory requirements that Ausgrid currently adheres to for safety. Making sure we meet these requirements has cost implications in terms of keeping maintenance up, in training and in purchasing new equipment to replace deteriorated and aged assets….would you be willing to pay more each year to ensure even greater safety?"
1 Yes 2 No (SKIPTO Q9) 3 Don’t know (SKIPTO Q9) Q8b. IF ANSWERED YES TO Q8....Would you be willing to pay $100 more a year? 1 Yes (GO TO NEXT SECTION) 2 No Q8c. IF ANSWERED NO TO Q8b....Would you be willing to pay $50 more a year? 1 Yes (GO TO NEXT SECTION) 2 No Q8d. IF ANSWERED NO TO Q8c....Would you be willing to pay $25 more a year?
72
Customer Engagement Study July 2013
1 Yes (GO TO NEXT SECTION) 2 No Q8e. IF ANSWERED NO TO Q8d....Would you be willing to pay $10 more a year? 1 Yes(GO TO NEXT SECTION) 2 No Q9. Would you be willing to pay less each year for a less safe service, which still meets the regulatory safety standards? 1 Yes 2 No 3 Don’t know
Underground v overhead
Q10. Underground cabling costs significantly more than overhead power lines to provide ( x4 to 10x as much), due to the digging and tunnelling and the cable quality etc…..Would you be willing to pay more each year to ensure the network was undergrounded even if it was not just for your street?
1 Yes 2 No (GO TO NEXT SECTION) 3 Don’t know (GO TO NEXT SECTION) Q10b. IF ANSWERED YES TO Q10....Would you be willing to pay $100 more a year? 1 Yes (GO TO NEXT SECTION) 2 No Q10c. IF ANSWERED NO TO Q10b....Would you be willing to pay $50 more a year? 1 Yes (GO TO NEXT SECTION) 2 No Q10d. IF ANSWERED NO TO Q10c....Would you be willing to pay $25 more a year? 1 Yes (GO TO NEXT SECTION) 2 No Q10e. IF ANSWERED NO TO Q10d....Would you be willing to pay $10 more a year? 1 Yes 2 No
Pricing/Forecasting
73
Customer Engagement Study July 2013
Distributors like Ausgrid are required to prepare budgets based on forecasting the future condition of their network and expected customer usage to determine what future investment is necessary. These forecasts are reviewed and adjusted by the Australian Energy Regulator. This process determines how much Ausgrid can charge for their distribution services. The distribution charge makes up about 40% of your total bill. Q11. If the ultimate price outcome was the same over the next 10 years, would you prefer to reach it via a steady price change each year (for example 2% a year increase) or via an initial steep increase over a short number of years, followed by almost flat prices (i.e. just linked to the CPI)?
1 Via steady price change 2 Via initial steep then flat prices
Q12. Have you noticed any change in the level of your electricity bill over the past year or so?
1 Yes, it has gone down a lot 2 Yes, it has gone down slightly 3 No it has not changed 4 Yes, it has increased slightly 5 Yes, it has increased a lot 6 Don’t know
Connection Fees
Q13. Are you aware that you are charged a connection fee for the supply of electricity to your house, rather like phone line rental? 1 Yes 2 No 3 Don’t know Q14. And do you feel all households should pay the same amount for this connection fee, or do you think some households should pay more, some less? 1 All pay same amount 2 Some pay more and some pay less 3 Don’t know
Energy Efficiency Programs
Q15. How much effort do you devote to reducing your electricity usage? 1 A lot 2 A little 3 Not much 4 None at all
74
Customer Engagement Study July 2013
Q16. Do you think Ausgrid should try and help people to be more energy efficient? 1 Yes 2 No 3 Don’t know Q17. Would you be willing to pay more for Ausgrid to provide information, tools and incentives for energy efficiency? 1 Yes 2 No (GO TO NEXT SECTION) 3 Don’t know Q17b. IF ANSWERED YES TO Q17....Would you be willing to pay $100 more a year? 1 Yes (GO TO NEXT SECTION) 2 No Q17c. IF ANSWERED NO TO Q17b....Would you be willing to pay $50 more a year? 1 Yes (GO TO NEXT SECTION) 2 No Q17d. IF ANSWERED NO TO Q17c....Would you be willing to pay $25 more a year? 1 Yes (GO TO NEXT SECTION) 2 No Q17e. IF ANSWERED NO TO Q17d....Would you be willing to pay $10 more a year? 1 Yes 2 No
Demand Management
Q18. Do you think Ausgrid should work with households to ensure they understand the impacts of the changes in demand at different times of the day and year, and try to encourage people to even out that demand to an extent? 1 Yes 2 No 3 Don’t know Q19. Are you aware of any demand management schemes targeted at residential customers? E.g. Programs where customers agree to allow Ausgrid to control the use of high energy demand appliances like air conditioners during peak demand times in return for a rebate or discount. 1 Yes 2 No
75
Customer Engagement Study July 2013
3 Don’t know Q20. Would you be willing to participate in the above scheme example? 1 Yes 2 No (GO TO NEXT SECTION) 3 Don’t know Q21. Roughly how much of a rebate or discount would you expect to receive for participating in the above example scheme?
$100 $50 $25 $10
Metering Technology
Meters are installed in every home to record the energy usage of each customer. Currently, distributors like Ausgrid are responsible for the meters in their distribution area. Meter service costs are currently bundled into the overall network charges that form a component of your energy bill. Q22. Have you heard about the installation of special electricity meters called smart meters”? They are smart because they allow 2 way communication – that is the meter can read your energy usage and then communicate with an in-home display that provides you with access to real time information on your electricity usage. It shows you how much energy you are using at any one time, to help you measure and control electricity usage. Have you heard of this type of meter? 1 Yes 2 No (Skip to Q24) 3 Don’t know (Skip to Q24) Q23. What have you heard? ______________________________________________________________________________ Q24. Would you like to have that sort of meter? 1 Yes 2 No (Skip to Q26) 3 Already have one(Skip to Q26) 4 Don’t know
76
Customer Engagement Study July 2013
Q25. Would you be willing to pay more to have access to that sort of a meter and the information it provides? 1 Yes 2 No (Skip to Q26) 3 Don’t know Q25b. IF ANSWERED YES TO Q25....Would you be willing to pay $100 more a year? 1 Yes (Skip to Q26) 2 No Q25c. IF ANSWERED NO TO Q25b....Would you be willing to pay $50 more a year? 1 Yes (Skip to Q26) 2 No Q25d. IF ANSWERED NO TO Q25c....Would you be willing to pay $25 more a year? 1 Yes (Skip to Q26) 2 No Q25e. IF ANSWERED NO TO Q25d....Would you be willing to pay $10 more a year? 1 Yes 2 No The Australian Energy Regulator is considering separating meters from the distribution businesses and allowing customers to select a meter provider. This would mean that the metering service costs would be unbundled from the network charges and you could have the choice of entering into a contract with a separate meter provider who would bill you for the metering charges. Q26. What do you think of this idea? ___________________ Q27. Customers normally do not have a choice in their metering equipment (e.g. when you move into another house the meter is usually already connected and recording energy usage). The ongoing metering service charges are the same for everyone – irrespective of the type of meter you have. Do you think this should continue and everyone should be charged the same amount? Or should metering charges be based on the type of meter you have? For example – if you have a more sophisticated meter that requires more maintenance or more complex testing.
1 Everyone should be charged the same amount. 2 Metering charges should be based on the type of meter you have 3 Don’t know
77
Customer Engagement Study July 2013
Time-based Pricing
Q28. Time based pricing or time of use pricing is where you have different rates at different times of the day with the peak times more expensive and the off peak times cheaper. Have you heard of this? 1 Yes 2 No 3 Don’t know Q29. Do you think that is a good idea? 1 Yes 2 No 3 Don’t know Support for Vulnerable Households
Q30. Some people cannot afford to always pay for their electricity on time. Should Ausgrid be supporting these households or should it be the retailer or someone else? 1 Yes, Ausgrid should support these households 2 No, Ausgrid should not support these households , it should be the retailer or someone else 3 Don’t know Q31. Would you be willing to pay more to ensure vulnerable people are supported and helped with their energy costs? 1 Yes 2 No (GO TO RANKING QUESTION) 3 Don’t know Q31b. IF ANSWERED YES TO Q31....Would you be willing to pay $100 more a year? 1 Yes (GO TO RANKING QUESTION) 2 No Q31c. IF ANSWERED NO TO Q31b....Would you be willing to pay $50 more a year? 1 Yes (GO TO RANKING QUESTION) 2 No Q31d. IF ANSWERED NO TO Q31c....Would you be willing to pay $25 more a year? 1 Yes (GO TO RANKING QUESTION) 2 No Q31e. IF ANSWERED NO TO Q31d....Would you be willing to pay $10 more a year?
78
Customer Engagement Study July 2013
1 Yes 2 No Q32. Ausgrid’s services involve a number of different aspects. We would like you to rank these by how important you feel they are for Ausgrid to spend money on. Write in the box beside each one whether you think it should be the first priority (1), second priority (2), third (3), fourth (4), or fifth (5). ROTATE OPTIONS Q So how would you rank…
SERVICE ASPECT RANK OUT OF 5 (Write in*)
Having programs that help manage variable demand levels for electricity
Ensuring the network is as reliable as possible (i.e. minimal blackouts)
Network pricing, and keeping the cost as low as possible
Implementing energy efficiency programs to help people save electricity
Ensuring a safe network (i.e. public and environmental safety)
* Note: 1 = most important, 5 = least important
Demographics
D1. Are you: 1 Male 2 Female Programmer: weight by gender for analysis D2. Which of these best describes your household? READ OUT 1 Young single/couple 2 Family with at least one child under 15 3 Family with children 15 and over only still living at home 4 Family with older children (who may have left home) 5 Mature single/couple 6 Other (specify) D3. How many people currently live in your home? ____
79
Customer Engagement Study July 2013
D5. What is your employment status? 1 Employed full-time 2 Employed part-time 3 Employed casual 4 Not employed, but looking for work 5 Home duties 6 Retired 7 Other 8 Refused (do not read out) IF LOW INCOME AT S6. THEN CHECK VULNERABILITY. FOR AUSGRID AND ENDEAVOUR, VULNERABLE CUSTOMERS SHOULD ANSWER YES TO AT LEAST ONE OF QUESTIONS D5 to D9 AS WELL AS BEING ON A LOW INCOME. D5. Is the main language spoken in your home English? Yes No - Record main language spoken D6. Is the primary source of income for this household.... READ OUT Aged pension Disability support pension Centerlink Payments such as unemployment benefits, Newstart allowance, or carers pension Other type of pension None of the above D7. Does anyone in the household have medical requirements that rely on electricity, such as dialysis or life support Yes No D8. Are you currently on an electricity Retailer’s customer hardship program or have you ever contacted your energy Retailer to pay off a bill in smaller instalments rather than in one lump sum? Yes No D9. IF RENT AT S3. Is your property owned by NSW Department of Housing? Yes No That’s the end of the survey. Thank you for taking the time to complete this for us, it is greatly appreciated.
80
Customer Engagement Study July 2013
Business Questionnaire Survey Introduction
"Good... my name is.... and I'm phoning from Woolcott Research, an independent market research company. We have been commissioned by your electricity distributor, to conduct an important study to obtain feedback on your business’s electricity service. I would like to speak to the person in the business who is responsible for paying the electricity bill. Would that be you? IF NO, ASK TO BE PUT THROUGH TO THE PERSON WHO IS. Would you be willing to answer some questions for us? The survey will take about 12-15 minutes. Be assured that your answers will remain totally confidential and will simply be reported back to your distributer in a general sense. If you have any questions regarding the survey, please contact Dale Osborne or Liz Sparham at Woolcott Research on 02 9261 5221. Firstly, I just need to ask some questions to check that your business fits into the criteria we are looking for. Would that be ok? Thank you
Screening Questions
S1. Firstly, what is your postcode? WRITE IN _______________________________________ (Ausgrid Network area only. Outside areas - TERMINATE) S2. How many people does your business employ?
1-20 people – SMALL BUSINESS 21-200 people – MEDIUM BUSINESS Over 200 people – TERMINATE
CHECK QUOTAS S3. What exactly does your business do? ____________________________________________________________________________________________ S4. And what industry does your business operate within? READ OUT
81
Customer Engagement Study July 2013
1. Agriculture, forestry, fishing and hunting 2. Mining 3. Manufacturing 4. Electricity, gas and water supply 5. Construction 6. Wholesale trade 7. Retail trade 8. Accommodation, cafes and restaurants 9. Transport and storage 10. Communication services 11. Finance and insurance 12. Property and business services 13. Government administration and defence 14. Education 15. Health and community services 16. Cultural and recreational services 17. Personal and other services
S4. Does the business get its electricity bill monthly or quarterly?
1. Monthly 2. Quarterly 3. Other (please specify)
S5. Roughly how much was the business’s last electricity bill?
1. 0-$499, 2. $500-$999, 3. $1,000-$1,499 4. $1,500+?
Thank you. That’s the end of the classification questions.
Awareness
Q1. Do you know what the name is of your electricity distributer? That is the organisation that transports energy through a series of poles and wires to your business? (Note: this is not your electricity retailer)
WRITE IN NAME:_______________________
TO BE READ OUT AFTER THEY HAVE ANSWERED Q1:
82
Customer Engagement Study July 2013
Ausgrid is the ‘distributor’ of electricity in your business’s area. Their job is to transport energy through a series of poles and wires to your business. Your distributor is determined by where your business is – you don’t have a choice of distributor. You pay for this service through your electricity retailer (e.g. EnergyAustralia, AGL, Origin etc.) who pass on Ausgrid’s network charges to you in your electricity bill. Your electricity bill is made up of retail charges for the energy your business uses, distribution charges that Ausgrid bills to the retailer and then the retailer passes those charges through to you, and metering and service access charges. We are not going to be asking you about your energy retailer in this survey. We will be asking you questions about Ausgrid today.
Q2. Had you heard of Ausgrid before today?
1 Yes 2 No 3 Don’t know
Reliability
Q3. On a scale of 1 to 10, where 1 is very poor and 10 is excellent, how reliable would you say your electricity service is to your business?
V poor 1...............................................10 excellent Q4. How many outages/blackouts (unplanned power interruptions) have there been to your business in the last few years?
0 1-2 3-5 5+
Q5a. Making sure the network is as reliable as possible obviously has cost implications in keeping maintenance up and in providing infrastructure. Would you be willing to pay more each year to ensure greater reliability? 1 Yes 2 No (SKIPTO Q6) 3 Don’t know (SKIPTO Q6) Q5b. IF ANSWERED YES TO Q5....Would you be willing to pay 15% more a year? 1 Yes (GO TO NEXT SECTION) 2 No Q5c. IF ANSWERED NO TO Q5b....Would you be willing to pay 10% more a year?
83
Customer Engagement Study July 2013
1 Yes (GO TO NEXT SECTION) 2 No Q5d. IF ANSWERED NO TO Q5c....Would you be willing to pay 5% more a year? 1 Yes (GO TO NEXT SECTION) 2 No Q5e. IF ANSWERED NO TO Q5d....Would you be willing to pay 1% more a year? 1 Yes (GO TO NEXT SECTION) 2 No Q6. Would you be willing to pay less each year for a less reliable service? 1 Yes 2 No 3 Don’t know
Safety
Q7. What do you think the main safety risks are when running an electricity network? ___________________________________________________________________________________
Q8a. There are minimum regulatory requirements that Ausgrid currently adheres to for safety. Making sure we meet these requirements has cost implications in terms of keeping maintenance up, in training and in purchasing new equipment to replace deteriorated and aged asset. Would you be willing to pay more each year to ensure even greater safety?
1 Yes 2 No (SKIPTO Q9) 3 Don’t know (SKIPTO Q9) Q8b. IF ANSWERED YES TO Q8....Would you be willing to pay 15% more a year? 1 Yes (GO TO NEXT SECTION) 2 No Q8c. IF ANSWERED NO TO Q8b....Would you be willing to pay 10% more a year? 1 Yes (GO TO NEXT SECTION) 2 No Q8d. IF ANSWERED NO TO Q8c....Would you be willing to pay 5% more a year? 1 Yes (GO TO NEXT SECTION)
84
Customer Engagement Study July 2013
2 No Q8e. IF ANSWERED NO TO Q8d....Would you be willing to pay 1% more a year? 1 Yes (GO TO NEXT SECTION) 2 No Q9. Would you be willing to pay less each year for a less safe service, which still meets the regulatory safety standards? 1 Yes 2 No 3 Don’t know
Pricing/Forecasting
Distributors like Ausgrid are required to prepare budgets based on forecasting the future condition of their network and expected customer usage to determine what future investment is necessary. These forecasts are reviewed and adjusted by the Australian Energy Regulator. Q11. If the ultimate price outcome was the same over the next 10 years, would you prefer to reach it via a steady price change each year (for example 2% a year increase) or via an initial steep increase over a short number of years, followed by almost flat prices (i.e. just linked to the CPI)?
1 Via steady price change 2 Via initial steep then flat prices
Q12. Have you noticed any change in the level of your business’s electricity bill over the past year or so?
7 Yes, it has gone down a lot 8 Yes, it has gone down slightly 9 No it has not changed 10 Yes, it has increased slightly 11 Yes, it has increased a lot 12 Don’t know
Connection Fees
Q13. Are you aware that you are charged a connection fee for the supply of electricity to your business, rather like phone line rental? 1 Yes 2 No 3 Don’t know
85
Customer Engagement Study July 2013
Q14. And do you feel all businesses should pay the same amount for this connection fee, or do you think some should pay more, some less depending on the complexity of the connection to and demand on the network? 1 All pay same amount 2 Some pay more and some pay less 3 Don’t know
Energy Efficiency Programs
Q15. How much effort do you devote to reducing your business’s electricity usage? 1 A lot 2 A little 3 Not much 4 None at all Q16. Do you think Ausgrid should try and help businesses to be more energy efficient? 1 Yes 2 No 3 Don’t know
Demand Management
Q18. Do you think Ausgrid should work with customers to ensure they understand the impacts of the changes in demand at different times of the day and year, and try to encourage people to even out that demand to an extent? 1 Yes 2 No 3 Don’t know Q19. Are you aware of any demand management schemes targeted at business customers? E.g. Programs where customers agree to allow Ausgrid to control the use of high energy demand appliances like air conditioners during peak demand times in return for a rebate or discount. 1 Yes 2 No 3 Don’t know Q20. Would your business be willing to participate in the above scheme example? 1 Yes 2 No (GO TO NEXT SECTION) 3 Don’t know
86
Customer Engagement Study July 2013
Q21. Roughly how much of a rebate or discount would you expect to receive for participating in the above example scheme?
15% of bill 10% 5% 1%,
Metering Technology
Meters are installed in every home and business to record the energy usage of each customer. Currently, distributors like Ausgrid are responsible for the meters in their distribution area.. Q22. Have you heard about the installation of special electricity meters called smart meters? They are smart because they allow 2 way communication – that is the meter can read your energy usage and then communicate with a display that shows real time information on your electricity usage, to help you measure and control it. 1 Yes 2 No (SKIP TO Q24) 3 Don’t know (SKIP TO Q24) Q23. What have you heard? ______________________________________________________________________________ Q24. Would you like to have that sort of meter for your business? 1 Yes 2 No (SKIP TO Q26) 3 Already have one(SKIP TO Q26) 4 Don’t know Q25. Would you be willing to pay more to have access to that sort of a meter and the information it provides? 1 Yes 2 No (SKIP TO Q26) 3 Don’t know (SKIP TO Q26) Q25b. IF ANSWERED YES TO Q25....Would you be willing to pay 15% more a year? 1 Yes (SKIP TO Q26) 2 No Q25c. IF ANSWERED NO TO Q25b....Would you be willing to pay 10% more a year? 1 Yes (SKIP TO Q26)
87
Customer Engagement Study July 2013
2 No Q25d. IF ANSWERED NO TO Q25c....Would you be willing to pay 5% more a year? 1 Yes (SKIP TO Q26) 2 No Q25e. IF ANSWERED NO TO Q25d....Would you be willing to pay 1% more a year? 1 Yes 2 No The Australian Energy Regulator is considering separating meters from the distribution businesses and allowing customers to select a meter provider. This would mean that the metering service costs would be unbundled from the network charges and you could have the choice of entering into a contract with a separate meter provider. Q26. What do you think of this idea? ___________________ Q27. Customers normally do not have a choice in their metering equipment (e.g. when you move into a building the meter is usually already connected and recording energy usage). The ongoing metering service charges are the same for all businesses – irrespective of the type of meter you have. Do you think this should continue and all businesses should be charged the same amount? Or should metering charges be based on the type of meter you have?
4 Everyone should be charged the same amount. 5 Metering charges should be based on the type of meter you have 6 Don’t know
Time-based Pricing
Q28. Time based pricing or time of use pricing is where you have different rates at different times of the day with the peak times more expensive and the off peak times cheaper. Have you heard of this? 1 Yes 2 No 3 Don’t know Q29. Do you think that is a good idea? 1 Yes 2 No 3 Don’t know
88
Customer Engagement Study July 2013
Ranking
Q32. Ausgrid’s services involve a number of different aspects. We would like you to rank these by how important you feel they are for Ausgrid to spend money on. Write in the box beside each one whether you think it should be the first priority (1), second priority (2), third (3), fourth (4), or fifth (5). ROTATE OPTIONS Q So how would you rank…
SERVICE ASPECT RANK OUT OF 5 (Write in*)
Having programs that help manage variable demand levels for electricity
Ensuring the network is as reliable as possible (i.e. minimal blackouts)
Network pricing, and keeping the cost as low as possible Implementing energy efficiency programs to help people save electricity
Ensuring a safe network (i.e. public and environmental safety) * Note: 1 = most important, 5 = least important That’s the end of the survey. Thank you for taking the time to complete this for us, it is greatly appreciated.