Customary and Traditional Use Worksheet
164
Special Publication No. BOF 2010-04 Customary and Traditional Use Worksheet: Salmon, Chitina Subdistrict, Prince William Sound Management Area Prepared by James A. Fall and William E. Simeone Alaska Department of Fish and Game Division of Subsistence For the March 2010 Anchorage Board of Fisheries meeting March 2010 Alaska Department of Fish and Game Division of Subsistence RC 9
Transcript of Customary and Traditional Use Worksheet

Special Publication No. BOF 2010-04
Customary and Traditional Use Worksheet:
Salmon, Chitina Subdistrict, Prince William Sound Management Area
Prepared by
James A. Fall and William E. Simeone
Alaska Department of Fish and Game Division of Subsistence For the March 2010 Anchorage Board of Fisheries meeting
March 2010
Alaska Department of Fish and Game Division of Subsistence
RC 9

Symbols and Abbreviations The following symbols and abbreviations, and others approved for the Système International d'Unités (SI), are used without definition in the reports by the Division of Subsistence. All others, including deviations from definitions listed below, are noted in the text at first mention, as well as in the titles or footnotes of tables, and in figure or figure captions.
Weights and measures (metric) centimeter cm deciliter dL gram g hectare ha kilogram kg kilometer km liter L meter m milliliter mL millimeter mm
Weights and measures (English)
cubic feet per second ft3/s foot ft gallon gal inch in mile mi nautical mile nmi ounce oz pound lb quart qt yard yd
Time and temperature
day d degrees Celsius °C degrees Fahrenheit °F degrees kelvin K hour h minute min second s
Physics and chemistry
all atomic symbols alternating current AC ampere A calorie cal direct current DC hertz Hz horsepower hp hydrogen ion activity (negative log of) pH parts per million ppm parts per thousand ppt, ‰ volts V watts W
General all commonly-accepted abbreviations e.g.,
Mr., Mrs., AM, PM, etc. all commonly-accepted professional titles
e.g., Dr., Ph.D., R.N., etc. Alaska Administrative Code AAC at @
compass directions: east E
north N south S west W copyright ©
corporate suffixes: Company Co. Corporation Corp. Incorporated Inc. Limited Ltd. District of Columbia D.C. et alii (and others) et al. et cetera (and so forth) etc. exempli gratia (for example) e.g. Federal Information Code FIC id est (that is) i.e. latitude or longitude lat. or long. monetary symbols (U.S.) $, ¢ months (tables and figures): first three
letters (Jan,...,Dec) registered trademark ® trademark ™ United States (adjective) U.S. United States of America (noun) USA U.S.C. United States Code U.S. state use two-letter abbreviations
(e.g., AK, WA)
Measures (fisheries) fork length FL mideye-to-fork MEF mideye-to-tail-fork METF standard length SL total length TL
Mathematics, statistics
all standard mathematical signs, symbols and abbreviations
alternate hypothesis HA base of natural logarithm e catch per unit effort CPUE coefficient of variation CV common test statistics (F, t, χ2, etc.) confidence interval CI correlation coefficient (multiple) R correlation coefficient (simple) r covariance cov degree (angular ) ° degrees of freedom df expected value E greater than > greater than or equal to ≥ harvest per unit effort HPUE less than < less than or equal to ≤ logarithm (natural) ln logarithm (base 10) log logarithm (specify base) log2, etc. minute (angular) ' not significant NS null hypothesis HO percent % probability P
probability of a type I error (rejection of the null hypothesis when true) α
probability of a type II error (acceptance of the null hypothesis when false) β
second (angular) " standard deviation SD standard error SE
variance population Var sample var

SPECIAL PUBLICATION NO. BOF 2010-04
CUSTOMARY AND TRADITIONAL USE WORKSHEET: SALMON, CHITINA SUBDISTRICT, PRINCE WILLIAM SOUND MANAGEMENT
AREA
by
James A. Fall Alaska Department of Fish and Game, Division of Subsistence, Anchorage
and
William E. Simeone
Alaska Department of Fish and Game, Division of Subsistence, Anchorage
Alaska Department of Fish and Game Division of Subsistence
333 Raspberry Road Anchorage, Alaska 99518
March 2010

The Division of Subsistence Special Publications series was established for the publication of techniques and procedure manuals, informational pamphlets, special subject reports to decision-making bodies, symposia and workshop proceedings, application software documentation, in-house lectures, and other documents that do not fit in another publications series of the Division of Subsistence. Most Special Publications are intended for readers generally interested in fisheries, wildlife, and the social sciences; for natural resource technical professionals and managers; and for readers generally interested the subsistence uses of fish and wildlife resources in Alaska.
Special Publications are available through the Alaska State Library and on the Internet: http://www.subsistence.adfg. state.ak.us. This publication has undergone editorial and professional review.
The Alaska Department of Fish and Game (ADF&G) administers all programs and activities free from discrimination based on race, color, national origin, age, sex, religion, marital status, pregnancy, parenthood, or
disability. The department administers all programs and activities in compliance with Title VI of the Civil Rights Act of 1964, Section 504 of the Rehabilitation Act of 1973, Title II of the Americans with Disabilities Act (ADA) of
1990, the Age Discrimination Act of 1975, and Title IX of the Education Amendments of 1972. If you believe you have been discriminated against in any program, activity, or facility please write:
ADF&G ADA Coordinator, P.O. Box 115526, Juneau AK 99811-5526 U.S. Fish and Wildlife Service, 4040 N. Fairfax Drive, Suite 300 Webb, Arlington VA 22203
Office of Equal Opportunity, U.S. Department of the Interior, Washington DC 20240 The department’s ADA Coordinator can be reached via phone at the following numbers:
(VOICE) 907-465-6077, (Statewide Telecommunication Device for the Deaf) 1-800-478-3648, (Juneau TDD) 907-465-3646, or (FAX) 907-465-6078
For information on alternative formats and questions on this publication, please contact: ADF&G Division of Subsistence at www.subsistence.adfg.state.ak.us.

i
Preface to the March 2010 Revision to the Chitina Subdistrict Salmon Customary and Traditional Use Worksheet
At its March 2010 statewide meeting in Anchorage, the Alaska Board of Fisheries (BOF) will consider Proposal 201, which, if adopted, would establish a positive customary and traditional use finding for the salmon Oncorhynchus stocks of the Chitina Subdistrict of the Prince William Sound Management Area, and, consequently, change the classification of the Chitina Subdistrict dip net fishery from a personal use fishery to a subsistence fishery.
The Alaska Department of Fish and Game (ADF&G) Division of Subsistence has prepared this 8 criteria worksheet as background for the BOF deliberations on Proposal 201. It is an updated version of the worksheet prepared for the January 2003 BOF meeting, which was also provided, without modifications, at the December 2005 and December 2008 BOF meetings. For the most part, the content of this worksheet is identical to the 2003 worksheet. The formatting has been updated for readability and to follow the guidelines of the ADF&G Writer’s Guide (ADF&G 1999).
Content changes include updated permit data on harvests and participation levels in the fisheries of the Chitina and Glennallen subdistricts, and comparative harvest data for other subsistence and personal use salmon fisheries in Alaska as background for the BOF deliberations on Criterion 8 and Criterion 1.

ii
Preface to the 2008 reprinting of the 2003 Chitina Subdistrict Salmon Customary and Traditional Use Worksheet Report
At its December 2008 meeting in Cordova, the Alaska Board of Fisheries will consider Proposal 1, which, if adopted, would establish a positive customary and traditional use finding for the salmon stocks of the Chitina Subdistrict, and, consequently, change the classification of the Chitina Subdistrict dip net fishery from a personal use fishery to a subsistence fishery.
The Division of Subsistence, ADF&G, prepared this eight criteria worksheet for the January/February 2003 meeting of the Alaska Board of Fisheries (which had been postponed from December 2002). At that meeting, the Board adopted Proposal 42, making a negative customary and traditional use finding for the salmon stocks of the Chitina Subdistrict.
At its December 2005 meeting in Valdez, the Board considered Proposal 3, which also would have reclassified the Chitina Subdistrict salmon fishery from a personal use fishery to a subsistence fishery through a positive customary and traditional use finding for the salmon stocks of the subdistrict. At that meeting, the Board determined that it had received no significant new information relevant to the eight criteria as they apply to the Chitina Subdistrict salmon stocks and fishery and, therefore, left in place the negative customary and traditional use finding from the February 2003 meeting.
The Division of Subsistence has collected no new information on the uses of the salmon stocks of the Chitina Subdistrict since the Board’s February 2003 negative customary and traditional use finding, and we have no other new information to provide for a customary and traditional use analysis of these stocks. Therefore, we have made available to the Board the 2003 customary and traditional use report in its entirety. It has not been modified in any way. We believe that this 2003 staff report remains an accurate summation of the relevant information pertaining to the eight criteria for the state-managed Chitina Subdistrict fishery.

iii
Preface to the 2005 reprinting of the 2003 Chitina Subdistrict Salmon Customary and Traditional Use Worksheet Report
At its December 2005 meeting in Valdez, the Alaska Board of Fisheries will consider Proposal 3, which, if adopted, would establish a positive customary and traditional use finding for the salmon stocks of the Chitina Subdistrict, and change the classification of the Chitina Subdistrict dip net fishery from a personal use fishery to a subsistence fishery.
The Division of Subsistence, ADF&G, prepared this eight criteria worksheet for the January/February 2003 meeting of the Alaska Board of Fisheries (which had been postponed from December 2002). At that meeting, the Board adopted Proposal 42, making a negative customary and traditional use finding for the salmon stocks of the Chitina Subdistrict.
The Division of Subsistence has collected no new information on the uses of the salmon stocks of the Chitina Subdistrict since the Board’s February 2003 negative customary and traditional use finding, and we have no other new information to provide for a customary and traditional use analysis of these stocks. Therefore, we have made available to the Board the 2003 customary and traditional use report in its entirety. It has not been modified in any way. We believe that this 2003 staff report remains an accurate summation of the relevant information pertaining to the eight criteria for the state-managed Chitina Subdistrict fishery.

iv
[intentionally blank]

v
TABLE OF CONTENTS LIST OF TABLES ........................................................................................................................................................ vi
LIST OF FIGURES ...................................................................................................................................................... vi
LIST OF PLATES ......................................................................................................................................................viii
LIST OF APPENDICES ............................................................................................................................................viii
General Background ...................................................................................................................................................... 1
Some Background on Procedures .................................................................................................................................. 3 Organization of this Worksheet and Sources ................................................................................................................. 5
Population of Copper Basin and Adjacent Road-Connected Areas ............................................................................... 6
Regulations .................................................................................................................................................................... 6
Criterion 1 ...................................................................................................................................................................... 8
Historical Background .......................................................................................................................................... 9 Permit Data: Levels of Participation and Harvest ............................................................................................... 13 Findings from the 2000 Survey Related to Criterion 1 ....................................................................................... 16
Criterion 2 .................................................................................................................................................................... 22
Criterion 3 .................................................................................................................................................................... 23
Criterion 4 .................................................................................................................................................................... 26
Criterion 5 .................................................................................................................................................................... 27
Criterion 6 .................................................................................................................................................................... 28
Criterion 7 .................................................................................................................................................................... 29
Criterion 8 .................................................................................................................................................................... 30
FIGURES .................................................................................................................................................................... 33
PLATES ...................................................................................................................................................................... 95
REFERENCES CITED ............................................................................................................................................. 101
APPENDICES ........................................................................................................................................................... 103
Appendix A. Procedures and statutes in effect in the 1980s. ..................................................................................... 105
Appendix B. Results of a survey conducted in 2000 among participants in the Copper River subsistence salmon fishery (with Ahtna tables). ....................................................................................................................................... 111
Appendix C. Summary of historical Copper River data pertaining to the Chitina area. ............................................ 141
Appendix D. Calculation methods and tables. ........................................................................................................... 149

vi
LIST OF TABLES Table Page 1. Some key changes to state regulations and other actions, upper Copper River subsistence and personal
use salmon fisheries. ....................................................................................................................................... 7 2. Population of the Copper River Basin, adjacent (road-connected) areas, and Alaska. .................................... 8 3. Historical Ahtna villages near Chitina. ........................................................................................................... 9 4. Information pertaining to Criterion 1 provided to the BOF by ADF&G, 1984. ............................................ 13 5. Number of permits issued, estimated salmon harvests, and average harvest per permit, Chitina
Subdistrict, 1960 to 2009. .............................................................................................................................. 17 6. Number of permits issued, estimated salmon harvests, and average harvest per permit, Glennallen
Subdistrict, 1960 to 2009. .............................................................................................................................. 18 7. Number of personal use and subsistence dip net permits issued by area of residence, Chitina
Subdistrict, 1988 to 2009. .............................................................................................................................. 20 8. Number of subsistence permits issued by area of residence, Glennallen Subdistrict, 1988 to 2008. ............ 21 9. Historical subsistence salmon harvests, federal Chitina subdistrict permits, 2003–2008. ............................. 22 10. Frequency of fishing by number of years since first fished in the Copper River, by subdistrict. .................. 22 11. Information pertaining to Criterion 2 provided to the BOF by ADF&G, 1984. ............................................ 22 12. Information pertaining to Criterion 3 provided to the BOF by ADF&G, 1984. ............................................ 23 13. Distances to Chitina from selected Alaska communities. ............................................................................. 25 14. Estimate of relative cost of obtaining salmon through dipnetting at Chitina compared to purchasing
salmon in a store (in 1999). ........................................................................................................................... 25 15. Information pertaining to Criterion 4 provided to the BOF by ADF&G, 1984. ............................................ 26 16. Percentage of total permits and location of fish wheels, Glennallen Subdistrict, 1995 and 2001. ................ 27 17. Information pertaining to Criterion 5 provided to the BOF by ADF&G, 1984. ............................................ 27 18. Information pertaining to Criterion 6 provided to the BOF by ADF&G, 1984. ............................................ 28 19. Information pertaining to Criterion 7 provided to the BOF by ADF&G, 1984. ............................................ 29 20. Information pertaining to Criterion 8 provided to the BOF by ADF&G, 1984. ............................................ 30
Appendix Table D-1. 10-year average salmon harvests, 1998–2007, subsistence and personal use fisheries.......... 151 Appendix Table D-2. Average harvest per permit in pounds dressed weight by fishery, 10-year average. ............. 152
LIST OF FIGURES Figure Page 1. Map of the Copper River drainage. ............................................................................................................... 35 2. Location of Glennallen and Chitina subdistricts. .......................................................................................... 36 3. Regulatory classification of Chitina subdistrict salmon fishery: prestatehood to 2009. ................................ 37 4. Population of the Copper Basin and adjacent road-connected areas, 1960 to 2009. ..................................... 38 5. Change in population by decade, Copper Basin, selected road-connected areas, and Alaska. ...................... 39 6. Some attested Ahtna villages, fishing stations, and places, lower Copper River. ......................................... 40 7. Location of fish wheels in the Chitina area, 1958, 1967, 1968, and 1974. .................................................... 41 8. 1975 fish wheel locations, lower Copper River............................................................................................. 42 9. 1977 fish wheel locations, lower Copper River............................................................................................. 43 10. 1978 fish wheel locations, lower Copper River............................................................................................. 44 11. Number of state and federal permits issued, Chitina subdistrict, 1960–2009. ............................................... 45 12. Estimated harvest of salmon, state and federal permits, Chitina subdistrict, 1960–2009. ............................. 46 13. Chitina subdistrict: average number of salmon harvested per dip net permit (state and federal), 1961–
2009. .............................................................................................................................................................. 47 14. Number of state and federal permits issued, Glennallen subdistrict, 1960–2009. ......................................... 48 15. Estimated harvest of salmon, state and federal permits, Glennallen subdistrict, 19602009. ......................... 49 16. Glennallen subdistrict: average number of salmon harvested per permit, 1964–2008. ................................. 50 17. Number of permits issued, Chitina and Glennallen subdistricts, 1960–2009. ............................................... 51 18. Estimated harvests of salmon, Chitina and Glennallen subdistricts, 1960–2009. ......................................... 52

vii
List of Figures, continued Figure Page 19. Average number of salmon harvested per permit, Chitina and Glennallen subdistricts, 1964–2009. ........... 53 20. Residence of Copper River dip net permittees by area, 1982. ....................................................................... 54 21. Residence of Copper River personal use dip net permittees by area, 14-year average, 1988–2001. ............. 54 22. Percentage of permit holders by area of residence, Chitina subdistrict state dip net fishery, 1988–2009. .... 55 23. Area of residence of permit holders, Chitina subdistrict state dip net fishery, 1988–2009. .......................... 56 24. Number of permits issued to Copper Basin residents and other Alaska residents, Glennallen subdistrict,
1988–2009. .................................................................................................................................................... 57 25. Number of subsistence permits by area of residence, Glennallen subdistrict, 1988–2009. ........................... 58 26. Estimated subsistence salmon harvests by Copper Basin residents and other Alaska residents,
Glennallen subdistrict, 1984–2008. ............................................................................................................... 59 27. Average subsistence harvest of salmon per permit, by Copper Basin residents and other Alaska
residents, Glennallen subdistrict, 1984–2008. ............................................................................................... 60 28. Residence of Copper River fish wheel permittees by area, 1982. ................................................................. 61 29. Residence of Copper River fish wheel permittees, by area, 11-year average, 1991–2001. ........................... 61 30. Place of residence of Glennallen subdistrict dip net permit holders, 1991–2001. ......................................... 62 31. Gear of choice by area of residence, 1982 and recent 14-year average, upper Copper River subsistence
and personal use fisheries (combined). ......................................................................................................... 63 32. Subdistrict fished, Copper River subsistence fishery participants, 2000. ...................................................... 64 33. Length of Alaska residency, Copper River subsistence fishery participants, 2000. ...................................... 65 34. Number of years since first participation in the fishery, Copper River subsistence fishery participants,
2000. .............................................................................................................................................................. 66 35. “How often do you fish in the Copper River?”; asked of subsistence fishery participants, 2000. ................ 67 36. Months fished in the Copper River, asked of subsistence fishery participants, 2000. ................................... 68 37. “What months did you fish in the Copper River?”; asked of subsistence fishery participants, 2000. ........... 69 38. Gear type used by surveyed Copper Basin subsistence fishery participants, 2000. ...................................... 70 39. Gear type used by, and regional residence of surveyed Copper River subsistence fishery participants,
2000. .............................................................................................................................................................. 71 40. Percentage of total permits of fish wheels, Glennallen Subdistrict, Copper River subsistence fishery,
1995. .............................................................................................................................................................. 72 41. Percentage of total permits and location of fish wheels, Glennallen Subdistrict, Copper River
subsistence salmon fishery, 2001. ................................................................................................................. 73 42. Disposition of property at fish wheel sites, Glennallen Subdistrict, Copper River subsistence salmon
fishery, 2001. ................................................................................................................................................. 74 43. Answered “yes” to question “Does your fishing site belong to your family?”; surveyed Copper River
subsistence fishers, 2000. .............................................................................................................................. 75 44. “How do you prepare your salmon?”; surveyed subsistence fishers, Copper River subsistence fishery,
2000. .............................................................................................................................................................. 76 45. “Who taught you how to fish on the Copper River?”; surveyed subsistence fishers, Copper River
subsistence fishery, 2000. .............................................................................................................................. 77 46. “How did you learn about the Copper River fishery?”; surveyed subsistence fishers, Copper River
subsistence fishery, 2000. .............................................................................................................................. 78 47. “Do you share your catch?”; surveyed subsistence fishers, Copper River subsistence fishery, 2000. .......... 79 48. “Do you share with family?”; surveyed subsistence fishers, Copper River subsistence fishery, 2000. ........ 80 49. “Do you share with friends?”; surveyed subsistence fishers, Copper River subsistence fishery, 2000. ........ 81 50. “Do you share with others (other than family and friends)?”; surveyed subsistence fishers, 2000. .............. 82 51. :How much of your catch do you share?”; surveyed subsistence fishers, Copper River subsistence
fishery, 2000. ................................................................................................................................................. 83 52. Importance of salmon in the diet of surveyed subsistence fishers, Copper River subsistence fishery,
2000. .............................................................................................................................................................. 84 53. Importance of wild foods in the diet, surveyed subsistence fishers, Copper River subsistence fishery,
2000. .............................................................................................................................................................. 85 54. Employment characteristics, surveyed subsistence fishers, Copper River subsistence fishery, 2000. .......... 86

viii
List of Figures, continued Figure Page 55. Employment type, surveyed subsistence fishers, by subdistrict, Copper River subsistence fishery, 2000. .. 87 56. Employment type, surveyed subsistence fishers, by residency, Copper River subsistence fishery, 2000. .... 88 57. “Did you take time off of work to fish?”; surveyed subsistence fishers, Copper River subsistence
fishery, 2000. ................................................................................................................................................. 89 58. Answered “yes” to question “Did you take off from work to fish?”; surveyed subsistence fishers,
Copper River subsistence fishery, 2000. ....................................................................................................... 90 59. Answers to the question “How many salmon would you like to be able to harvest?”; by subdistrict and
gear type. ....................................................................................................................................................... 91 60. Average harvest of salmon, pounds dressed weight per permit, Alaska subsistence and personal use
fisheries, 1998–2007. .................................................................................................................................... 92 61. Average pounds, dressed weight, harvested per capita per permit, Alaska subsistence and personal use
salmon fisheries. ............................................................................................................................................ 93 62. Percentage of U.S. average per capita consumption of meat, fish, and poultry provided by salmon
harvests in Alaska subsistence and personal use fisheries (19982007). ........................................................ 94
LIST OF PLATES Plate Page 1. Ahtna woman dipnetting salmon from dip net platform, perhaps at Lower Tonsina, approximately
1910. .............................................................................................................................................................. 97 2. Chief Eskilida dipnetting salmon from platform. .......................................................................................... 98 3. Chief Eskilida with salmon in dip net. .......................................................................................................... 99 4. Ahtna fish wheel at Chitina, 1910s. ............................................................................................................. 100 5. Ahtna subsistence salmon harvest drying at Chitina, 1910s. ....................................................................... 100
LIST OF APPENDICES Appendix Page A. Procedures and statutes in effect in the 1980s. ............................................................................................ 105 B. Results of a survey conducted in 2000 among participants in the Copper River subsistence salmon
fishery (with Ahtna tables). ......................................................................................................................... 111 C. Summary of historical Copper River data pertaining to the Chitina area. ................................................... 141 D. Calculation methods and tables. .................................................................................................................. 149 Appendix Table D-1. 10-year average salmon harvests, 1998–2007, subsistence and personal use fisheries.......... 151 Appendix Table D-2. Average harvest per permit in pounds dressed weight by fishery, 10-year average. ............. 152

1
CUSTOMARY AND TRADITIONAL USE WORKSHEET:
SALMON: CHITINA SUBDISTRICT,
PRINCE WILLIAM SOUND MANAGEMENT AREA
GENERAL BACKGROUND Proposal 201, a board-generated proposal that the Alaska Board of Fisheries (BOF) will consider at its March 2010 meeting, would change the negative customary and traditional use (C&T) finding for the salmon Oncorhynchus stocks of the Chitina Subdistrict of the Upper Copper River District in the Prince William Sound Management Area to a positive finding. A fish stock “means a species, subspecies, geographic grouping or other category of fish manageable as a unit” (AS 1605.940[16]). The BOF follows the Joint Boards of Fisheries and Game Subsistence Procedures (5 AAC 99.010; AS 16.05.258[a]) to “identify fish stocks. . . or portions of those stocks . . . that are customarily and traditionally taken or used by Alaska residents for subsistence uses.” The list of the kinds of information required for this procedure is called “the 8 criteria.” The BOF adopts regulations allowing for subsistence uses only of stocks that are found to support customary and traditional uses. Noncommercial, nonrecreational harvest opportunities for stocks with negative C&T findings can be provided through personal use regulations.
Figure 1 depicts the Upper Copper River District and the location of the Glennallen and Chitina subdistricts. Figure 2 provides more detail on the geographic features of the Chitina Subdistrict.
Following is an overview of previous BOF actions on the customary and traditional use status of the salmon stocks of the Chitina Subdistrict. Figure 3 depicts the classification of the Chitina Subdistrict fishery as “subsistence” or “personal use” from prestatehood through 2009.
During its February 1984 meeting in Anchorage, the BOF determined that the salmon stocks of the Chitina Subdistrict of the Upper Copper River District do not support customary and traditional uses. At the same meeting, the BOF made a positive customary and traditional use determination for the salmon stocks of the Glennallen Subdistrict. Accordingly, the BOF amended its Copper River Subsistence Salmon Fisheries Management Plan to include provisions for subsistence salmon fishing only in the Glennallen Subdistrict. While the Chitina Subdistrict was closed to subsistence fishing, a personal use fishery was authorized. A Division of Subsistence technical paper (Fall and Stratton 1984; cf. Stratton 1982) was prepared to provide background information on these fisheries relevant to the 8 criteria. In 1984 (and through 1989), customary and traditional use determinations also identified qualifying rural communities. Participation in the Glennallen Subdistrict subsistence salmon fishery was limited to residents of the Copper River Basin and certain upper Tanana communities.
In 1985, following the Alaska Supreme Court decision in the Madison case, regulations governing subsistence fishing in the Copper River reverted to those in effect prior to 1984, for 1985 only. This change eliminated the distinction between the personal use and subsistence fisheries (everything operated under subsistence regulations) and removed the limitation on participation in subsistence fisheries to rural residents only.
In 1986, following the passage of a new state subsistence statute that included a rural preference, the regulations in effect in 1984 were reinstated. Again, there was a personal use fishery open to all Alaska residents in the Chitina Subdistrict, and a subsistence fishery, open only to residents of qualifying communities and areas, in the Glennallen Subdistrict.
In 1990, following the Alaska Supreme Court decision in the McDowell case in late 1989, the subsistence fishery in the Glennallen Subdistrict was again open to all Alaska residents. This

2
decision had no direct effect on the classification of the fishery in the Chitina Subdistrict as personal use.
In 1993, following the adoption of an amended state subsistence statute in 1992, the BOF determined that the regulations in place for the Upper Copper River District (including both the Glennallen and Chitina subdistricts) were consistent with the requirements of the new statute. This action affirmed the previous customary and traditional use findings for salmon in all of the Prince William Sound Management Area. ADF&G prepared a customary and traditional use worksheet to assist the BOF in making this consistency determination (ADF&G 1993).
At the December 1996 meeting in Cordova, the BOF rejected (by a vote of 0–6) Proposal 50 to make a positive customary and traditional use finding for the Chitina Subdistrict fishery in order to reopen the subdistrict to subsistence fishing. The fishery remained a personal use fishery.
At the December 1999 meeting in Valdez, the BOF adopted (by a vote of 4–2) Proposal 44 to make a positive customary and traditional use finding for the Chitina Subdistrict salmon fishery. The BOF also adopted regulations changing the status of the Chitina Subdistrict dip net fishery from personal use to subsistence.
At the January 2003 meeting in Cordova, following a determination that new information was available, the BOF adopted (by a vote of 4–3), Proposal 42, which reestablished a negative C&T finding for the salmon stocks of the Chitina Subdistrict. The BOF also adopted regulations changing the status of the Chitina Subdistrict dip net fishery from subsistence back to personal use.
At the December 2005 meeting in Valdez, the BOF reviewed Proposal 3, which would have established a positive C&T finding for the salmon stocks of the Chitina Subdistrict. The BOF determined (by a vote of 2–5), that no significant new information was available, thus leaving the 2003 negative C&T finding in place.
At the December 2008 meeting in Cordova, the BOF reviewed Proposal 1, which would have established a positive C&T finding for the salmon stocks of the Chitina Subdistrict. The BOF determined (by a vote of 1–5 [one absent]), that no significant new information was available, thus leaving the 2003 negative C&T finding in place.
On December 31, 2009, the Alaska Superior Court in Fairbanks, in Alaska Fish and Wildlife Conservation Fund v. State of Alaska, Board of Fisheries, ruled that the BOF did not articulate an objective standard when interpreting 5 AAC 99.010(b)(8) in its January 2003 deliberations on Proposal 42. The court directed the BOF to define the term “subsistence way of life,” provide the public with an opportunity to provide additional information to supplement the record in light of the definition, and reapply the 8 criteria in consideration of the new definition and supplemental information. The BOF scheduled a reconsideration of the C&T status of the salmon stocks of the Chitina Subdistrict, as Proposal 201, at its March 2010 meeting in Anchorage.
When the Federal Subsistence Board (FSB) began adopting subsistence fishing regulations for federal lands and waters in the 1990s, it initially adopted the state’s C&T findings for the Glennallen and Chitina subdistricts. However, in 2002, the FSB adopted a proposal that established a positive C&T finding for the salmon stocks of the Chitina Subdistrict in federal regulations. Although the “8 factors” that the FSB reviews in its C&T determinations resemble the “8 criteria” used by the BOF, the federal process only considers use patterns established by rural Alaska residents. In the case of the Chitina Subdistrict, the FSB noted that residents of the Copper Basin obtained state permits to fish in the subdistrict (about 0.5% of state permits are issued annually to Copper Basin residents—see Table 7, below) and that before being displaced by the rapidly growing dip net fishery, Ahtna Athabascans and other local residents had since the 1910s operated fish wheels, and before that, dip nets in the Chitina Subdistrict. Since 2002, the National Park Service (NPS) has issued federal subsistence salmon permits to qualified local rural

3
residents to fish with fish wheels, dip nets, or rod and reel in the Chitina and Glennallen subdistricts. Residents of Copper Basin and Upper Tanana communities are eligible for these permits.
SOME BACKGROUND ON PROCEDURES [The following paragraph and associated appendix tables were included in the original 1999 C&T worksheet to demonstrate that since 1984 there had been no significant changes in the kinds of data the BOF used to evaluate the 8 criteria and make customary and traditional use findings.]
The criteria used by the BOF to make its customary and traditional use findings in 1984 (these criteria were adopted in 1982) are presented in Appendix Table 1 and the state statute in effect at that time (adopted in 1978) appears in Appendix Table 2. The procedures adopted in 1986 are reported in Appendix Table 3 and the 1986 subsistence statute appears in Appendix Table 4. The 8 criteria themselves which formed the core of the Joint Boards’ procedures from 1984 and 1986 are very similar to those applied in 1996 and 1999 and are in effect presently (see below for each present criterion). In each case, the criteria were used to identify customary and traditional uses of “fish resources” (language used in 1982) or “fish stocks” (language used in 1986 statute). Prior to the Alaska Supreme Court decision in McDowell, subsistence uses were defined as “customary and traditional uses by rural Alaska residents,” and the criteria in effect in 1982 and 1986 were also used to identify the rural communities or areas whose residents would be eligible to participate in the subsistence fishery. Although before 1989, the 8 criteria identified communities or areas whose residents were qualified to participate in particular subsistence fisheries, the 8 criteria have not been applied to qualify or disqualify particular individuals from participation in subsistence fisheries. In other words, the C&T process has not been directed towards identifying specific “subsistence users” based on an individual’s or family’s particular history or pattern of use. The key factor for eligibility prior to McDowell was residency in a qualifying rural community or area whose use pattern met the C&T criteria, and not a person’s or family’s particular history of use of the stock. (Individual criteria are applied only in a “Tier II situation” but there were no Tier II fisheries prior to McDowell.) Since McDowell, all Alaska residents are eligible to participate in subsistence fisheries, which are still identified by the 8 criteria, as discussed below. In other words, since McDowell, individuals do not need to live in the rural community or area that has established the C&T use pattern for the stock in order to participate.
[The following paragraphs were added in to the worksheet for the 2003 BOF meeting.]
As just noted, using the 8 criteria, the Board identifies C&T uses of fish stocks by examining a use pattern with a set of criteria (characteristics). It is important to note however that it not possible to describe a use pattern of a fish stock for purposes of a C&T determination without describing how particular groups of people (such as residents of particular communities or members of sociocultural groups) use that stock. Groups of people and communities establish the use pattern through their activities and sustain the traditional use of the stock over time. As the first director of the Division of Subsistence, Thomas Lonner (ADF&G Division of Subsistence 1980:4), advised the Joint Board in 1980 when the state subsistence law was first being implemented:
It is suggested that customary and traditional use, uses, and users are inseparable from one another; that is, if one attempts to describe the use or the uses (what, where, how, and how much), a significant part of the description includes an analysis of who is using and for what purposes.

4
Again, this process does not entail determining who qualifies for participation in the subsistence fishery (determining who the “C&T users” are) but rather discussing the characteristics of particular groups of people and /or communities to determine whether the use pattern of the stock meets the C&T criteria.
[These paragraphs were added to the updated worksheet for the 2003 BOF meeting.]
As added background on the 8 criteria and board procedures for making customary and traditional use determinations, it should be noted that the Board of Fisheries first developed the criteria (originally 10) in 1980 to identify customary and traditional uses of Cook Inlet salmon. For the first time, the 1978 state subsistence statute defined subsistence uses as “customary and traditional uses” and the board needed a procedure for distinguishing between the use patterns associated with particular fish stocks to determine which would be classified as subsistence fisheries. In assisting the Board in developing its procedures Lonner (ADF&G Division of Subsistence 1980:3; see also Lonner 1980) wrote:
The Department encourages the Boards to recognize that while subsistence is characterized as the direct uses or barter of Alaska wild resources, customary and traditional uses actually vary greatly area-by-area, species-by-species, and over time. Subsistence uses may be analyzed along a continuum whose extreme ends, based on current examples, are displayed below:
Long TIME DEPTH Short Rural COMMUNITY BASE Urban Kinship SOCIAL ROLE Individual/family Community and regional economic and regional self-sufficiency
ECONOMIC ROLE Personal use
Food, clothing, fuel, tools, shelter, handicraft, barter, etc.
ACTUAL USES Primarily food
Many resources (fish, game, fowl, vegetation, etc.)
RANGE OF USES Few species
More stable patterns PATTERN OF USES Less stable, opportunistic (area, time, species, gear, efficiency, productivity,
use level, sharing/bartering, division of labor, effort level, etc.)
Due to changing economic and resource conditions, and local population growth
VARIATION IN USE LEVEL AND PATTERN
Due to high urban in-migration
Primarily extended kinship, community, intergenerational, and cultural
SOCIAL AND PSYCHOLOGICAL
Primarily individual and immediate family

5
ORGANIZATION OF THIS WORKSHEET AND SOURCES This worksheet is an updated version of the ones prepared for the BOF in December 1999 and 2003, and provided to the BOF unchanged in 2005 and 2008. Under each criterion, the worksheet summarizes, in table format, the information provided to the BOF by the Alaska Department of Fish and Game (ADF&G) when the original C&T findings for the Chitina and Glennallen subdistricts were made in 1984. ADF&G provided these same summaries to the BOF in written form at the 1996 BOF meeting (Simeone and Fall 1996:40–42) and summarized them orally at that meeting as well. It should be noted that the 1984 finding was organized around a contrast between the Glennallen Subdistrict fish wheel fishery and the Chitina Subdistrict dip net fishery, in accordance with the observations, as summarized in the previous paragraphs, that characteristics of use patterns vary along a continuum.
Therefore, in this worksheet, updated information is provided when available to evaluate the strength and validity of differences between the 2 subdistricts at present. This is not to suggest, however, that the patterns of use in the Glennallen Subdistrict are the standards to be met for a positive C&T finding for the salmon stocks of the Chitina Subdistrict, or any other fish stocks. This worksheet also provides more detailed information on use patterns in the Chitina Subdistrict (and what would become the Glennallen subdistrict beginning in 1977) based upon key respondent interviews with long term dip net fishers and systematic interviews with current participants in the fishery.
Information that is new to this worksheet compared to the one prepared in 1999 fits into 3 categories:
1. Updated harvest data and participation data, based on state and federal permits, for 2000 through 2008 (and 2009, if data are available).
2. Results of a study (Simeone and Kari 2002; Simeone and Fall 2003) conducted by the ADF&G Division of Subsistence, the Copper River Native Association, the Cheesh′na Tribal Council (Chistochina), and the Chitina Tribal Council in 2000, and funded by the U.S. Fish and Wildlife Service (USFWS) Office of Subsistence Management (OSM), which was designed to update information related to the 8 criteria for the fisheries of the Glennallen and Chitina subdistricts. For that study, 509 face-to-face surveys were conducted: 382 with fishers who were not residents of the Copper Basin (“nonlocal residents”) and 127 with local residents who lived in the Copper Basin at the time of the study. Of the 509 people who were interviewed, 313 interviewees (308 nonlocal and 5 local) were participants in the Chitina Subdistrict subsistence fishery (recall that from 2000 to 2002, the Chitina dip net fishery was classified as a subsistence fishery under state regulations), and 196 (122 local and 74 nonlocal) were participants in the Glennallen Subdistrict subsistence fishery. A larger sample of dipnetters was targeted in order to achieve a representative sample of participants in the fishery. Nonlocal survey respondents were chosen opportunistically while they were on the fishing grounds. Local residents were selected because of their known participation in the fishery. The sampling strategy for local residents was chosen to develop results that could be compared with the conclusions of earlier research summarized in Stratton (1982), which focused on local subsistence salmon fishing patterns. Thus, local Copper Basin residents were overrepresented in the survey findings for the Glennallen Subdistrict, and so these findings may not be representative of the full range of Glennallen Subdistrict fishers, many of whom live outside the Copper Basin. Of the local residents interviewed, 109 were Ahtna from the communities of Chistochina, Gakona, Gulkana, Tazlina, and Copper Center. The survey instrument consisted of 35 questions; most required forced answer responses (see Appendix A in Simeone and Fall 2003). The questions were designed to elicit information about harvest patterns, including months fished, types of gear used, preparation of the catch, sharing, and transmission of knowledge. Also examined were employment characteristics, and opinions about the harvest and changes in the quality of salmon. Additionally, William Simeone of the ADF&G Division of Subsistence conducted 6 key respondent interviews with long term participants in the Chitina Subdistrict dip net fishery. Mr. Stan Bloom of the Chitina Dipnetters’ Association helped set up

6
and conduct these interviews. This new information is presented, for the most part, at the end of the section on each criterion to facilitate comparisons with previously available data. Results of the survey and key respondent interviews are also discussed in the final report for the project (Simeone and Fall 2003). Another goal of the study was to the document Ahtna traditional knowledge about fish and fishing. Findings of that portion of the study are reported in Simeone and Kari 2002. Appendix B is a copy of a summary of the survey findings along with additional information that was provided to the BOF at its February 2003 meeting, as well as at its subsequent meetings in December 2005 and December 2008.
3. Added to this 2010 worksheet are comparative data on subsistence salmon fisheries in Alaska. This information is intended to assist the BOF in evaluating “reliance” on the salmon stocks under review and on “a subsistence way of life,” as required by Criterion 8, and as directed by the court in the Alaska Fish and Wildlife Conservation Fund v. State of Alaska, Board of Fisheries case. These data may also assist the BOF when it examines Criterion 1.
Table 1 provides an overview of key state regulatory changes and other actions relating to the subsistence and personal use salmon fisheries of the upper Copper River. An emphasis is placed on actions relating to the fishery in the present Chitina Subdistrict prior to the 1984 C&T finding, as well as subsequent actions that affected the classification of the fishery as subsistence or personal use under state regulations.
Appendix C contains extracts from reports and other written materials that provide background on regulatory and management decisions relating to these fisheries, primarily from the 1950s to the early 1980s. A goal in Appendix C is to provide some “eyewitness” accounts of developments in the fisheries and other details.
POPULATION OF COPPER BASIN AND ADJACENT ROAD-CONNECTED AREAS
A major factor that has shaped patterns of use of upper Copper River salmon is the general accessibility of the Copper River Basin by road to Alaska’s population centers at Fairbanks, the Matanuska–Susitna Borough, and Anchorage. Table 2 reports changes in the population of the Copper River Basin and various areas connected by road to the Copper Basin. Figure 4 illustrates the population growth of these areas in relation to population changes in Copper Basin communities themselves. Since 1980, the population of the Copper Basin has been relatively stable, while the population of the road-connected areas has grown at a faster rate than the state overall (Figure 5).
REGULATIONS For the 2009–2010 regulatory year (5 AAC 77.5910), Alaskans with a valid sport fishing license could obtain a state personal use permit to fish with a dip net in the Chitina Subdistrict. Permits are limited to 1 per household, and holders of these permits may not also obtain a subsistence fishing permit for the Glennallen Subdistrict. Salmon may be taken during open periods between June 1 through September 30. The annual limit is 15 salmon for a household of 1 person and 30 salmon for households of 2 or more persons. Of the total annual limit, only 1 may be a Chinook salmon O. tshawytscha. If ADF&G determines that a weekly surplus of more than 50,000 sockeye salmon O. nerka will be present in the Chitina Subdistrict, permit holders who have already met their annual sockeye salmon limits may obtain supplement permits to harvest 10 additional sockeye salmon. The BOF has established a maximum harvest level for the Chitina Subdistrict personal use salmon fishery of 100,000 to 150,000 salmon, not including any salmon in excess of the inriver goal or salmon taken after August 31 (5 AAC 77.591(f)).
Alaska residents who have not chosen to obtain a Chitina Subdistrict personal use permit may obtain a state subsistence fishing permit for the Glennallen Subdistrict to fish with either a dip net or fish wheel. Only 1 type of gear may be specified on the permit. Permits are limited to 1 per household. Seasonal limits are 30 salmon, with no more than 5 Chinook salmon if taken with a dip net, for households of 1

7
person. Households of 2 persons may harvest 60 salmon, with no more than 5 Chinook salmon harvested by dip net. Seasonal limits increase by 10 salmon for each additional household member, except the limit of 5 Chinook salmon harvested with a dip net does not increase with household size. Upon request, households of 1 person may obtain permits for 200 salmon and households of 2 or more persons may obtain permits for 500 salmon. These permits also limit dip net harvests to 5 Chinook salmon. Fishing is open from June 1 through September 30 with no closed periods within that time period. The amount reasonably necessary for subsistence (ANS) established by the BOF for this fishery is 61,000 to 82,500 salmon, with this total apportioned to 3 subsections within the district (5 AAC 01.616(b)(1).
Table 1.–Some key changes to state regulations and other actions, upper Copper River subsistence and personal use salmon fisheries.
Year Change or action 1960 Subsistence permit required. 1964 All tributaries of the Copper River, and the Copper River above Slana, closed to subsistence fishing. Mid
1960s Seasonal limits based on income and household size adopted. For incomes under $4,000 (later increased to $5,000, and still later to $6,000), allocations were 200 for an individual and 500 for a family. For incomes over the limit, allocations were 20 for an individual and 40 for a family.
1968 Upper river fishery limited to the main Copper River from the confluence of the Slana River downstream to the cable crossing one and a quarter miles below O’Brien Creek.
1975 The lower limit of the subsistence fishery extended to Haley Creek below Wood Canyon. 1977 BOF created the Chitina and Glennallen subsistence subdistricts. In the Glennallen Subdistrict, fish wheels
could be operated 7 days per week. In the Chitina Subdistrict, fish wheels could only be operated from 8 p.m. Tuesday to 8 p.m. Thursday and from 8 p.m. Friday to 8 p.m. Sunday. Dip nets could be used 7 days per week.
1978 The first state subsistence law adopted, establishing subsistence as “customary and traditional uses.” 1979 The BOF eliminates fish wheels from the Chitina Subdistrict for biological reasons. No dip nets allowed in
Glennallen Subdistrict. 1980 “Classes” of subsistence permits created in the Copper River Management Plan, based on age, income,
residency, household size, wage employment, and history of participation in the fishery. 1981 Fish wheel seasonal limits increased to 30 salmon for 1 person, 60 for 2 persons, and 10 for each additional
household member; households with incomes under $12,000 eligible for 500 salmon seasonal limit. 1984 Copper River Salmon Management Plan revised, as follows:
Personal use fishery separated from subsistence fishery; Positive “customary and traditional use” (C&T) determination for the Glennallen Subdistrict; negative
finding for the Chitina Subdistrict; Subsistence permit eligibility limited to Copper Basin and upper Tanana residents; Low income requirement dropped as part of qualification for higher seasonal limit; Dip nets and fish wheels allowed in Glennallen Subdistrict; and 25,000 salmon set aside for the subsistence fishery in the upriver goal (this has since been increased several
times). 1985 Madison decision: all Alaskans eligible to participate in subsistence fishery. 1986 New state subsistence statute; regulations adopted for 1984 back in place. 1990 Nonlocal residents again eligible for subsistence permits in Glennallen Subdistrict following McDowell
decision of December 1989. 1993 BOF found Upper Copper River subsistence regulations consistent with 1992 subsistence statute; affirmed
positive C&T finding for Glennallen Subdistrict; 35,000 allocated to subsistence fishery. 1996 BOF affirmed negative C&T finding for Chitina Subdistrict salmon.
-continued-

8
Table 1. Page 2 of 2. Year Change or action 1999 BOF made a positive C&T determination for Chitina Subdistrict salmon; the fishery again became a
subsistence fishery. 2003 BOF made a negative C&T determination for Chitina Subdistrict salmon; the fishery again became a
personal use fishery. 2005 BOF determined that no significant new information was available to warrant review of C&T status of
Chitina Subdistrict salmon stocks. 2008 BOF determined that no significant new information was available to warrant review of C&T status of
Chitina Subdistrict salmon stocks. 2009 BOF directed by the Fairbanks Superior Court in the Alaska Fish and Wildlife Conservation Fund v State
case to adopt a definition of “subsistence way of life” and reconsider the C&T determination for Chitina Subdistrict salmon stocks in light of the new definition and any new relevant information.
Table 2.–Population of the Copper River Basin, adjacent (road-connected) areas, and Alaska.
Copper Matanuska– Fairbanks– Southeast River census Anchorage Susitna North Star Fairbanks
Year subarea1 Municipality Borough2 Borough3 census area Valdez Alaska 1818 567 1839 300 1880 250 33,426 1890 ND 32,052 1900 ND 315 63,592 1910 553 677 7,675 810 64,356 1920 511 1,856 158 2,182 466 55,036 1930 729 2,277 848 3,446 442 59,278 1940 742 3,495 2,354 5,692 529 72,524 1950 808 11,254 3,534 19,409 554 128,643 1960 2,193 54,076 2,320 15,736 605 555 226,167 1970 1,852 124,542 6,509 45,864 4,179 1,005 302,583 1980 2,721 174,431 17,816 53,983 5,676 3,079 401,851 1990 2,763 226,338 39,683 77,720 5,913 4,068 550,043 2000 3,084 260,283 59,322 82,840 6,174 4,036 626,932 2009 3,219 290,588 84,314 93,779 7,243 3,475 692,314
Sources Rollins 1978; ADOL 1991; ADLWD 2010. 1. “Mednovtze” in 1818 and 1830; “Ahtna villages” in 1880; no Copper River villages listed for 1890 and 1900;
Copper Center District, 1910, 1920: Chitina District 1930, 1940, 1950. 2. Cook Inlet District (Knik and Susitna) in 1910; Knik, Susitna, and Talkeetna in 1920; Wasilla and Talkeetna
districts, 1930; Palmer, Wasilla, and Talkeetna districts 1940 and 1950. 3. Fairbanks District, 1910 through 1950.
CRITERION 1 Criterion 1. A long-term consistent pattern of noncommercial taking, use, and reliance on the fish stock or game population that has been established over a reasonable period of time of not less than one generation, excluding interruption by circumstances beyond the user's control, such as unavailability of the fish or game caused by migratory patterns.

9
HISTORICAL BACKGROUND For centuries the present-day Chitina Subdistrict was used for subsistence salmon fishing by the Ahtna Athabascan villages of the lower Ahtna regional group. Table 3 lists some of the names of Ahtna villages in the general Chitina area. Figure 6 is a map that depicts village locations and other key Ahtna place names. Chitina itself was established during the construction of the Copper River–Northwestern Railroad between 1909 and 1911. The name “Chitina” derives from Tsedi Na' or “copper river,” the Ahtna name for the Chitina River. The community drew Ahtna from surrounding villages. When the railroad closed in 1939, most non-Native people left Chitina. By the mid 1950s, most Native people had also left, although the village remained “home” to many who returned to the area seasonally for subsistence activities and maintained seasonal dwellings there (Reckord 1983a:85–87; 1983b:101–102).
Table 3.–Historical Ahtna villages near Chitina.
Village Location Tats′abaelghi′aaden East bank of Copper River, south of Canyon Creek.Tak′a′s Naghił′aaden Tenas Creek. Taghaelden Taral. Hwt′aa Cae′e Fox Creek; “Dakah De′ nin’s Village.” Tsenghaax Mile 131.5 of Copper River–Northwest Railroad. Nahwt′en Cae′e Mouth of Fivemile Creek. Tay′sdlaexden Horse Creek. Sdates South of Lower Tonsina. Source Reckord 1983b:95–117.
In the general Chitina area, the Ahtna used dip nets (Ahtna ciisi), operated from dip netting platforms (nic'a'iltsiini) to harvest salmon (de Laguna and McClellan 1981; Kari 1990; see also Simeone and Fall 1996:12) (plates 1–3). As summarized by de Laguna and McClellan (1981:647):
In the silty waters of the Copper, Chitina, and other glacial streams, people used dip nets of willow withes. At a few places, there were rocky points from which one could easily dip into the current, but usually the men had to make short fences to deflect the salmon to the ends of dipping platforms. These platforms, poles lashed together and supported on staging that could be moved to suit changing water conditions, were “owned” by the headman of large houses who kept all the fish caught by their households. When they had enough fish, others could use the platform. Both sexes dipped fish.
In the early 1910s, fish wheels (Ahtna ciisi nekeghalts'eli) were introduced into the Copper River subsistence fishery (plates 4 and 5) and very rapidly replaced dip nets1; however, knowledge of how and where to use dip nets was retained by Ahtna elders into the late 20th and early 21st centuries (Simeone and Fall 1996:13,16; de Laguna and McClellan 1981:647; for a full discussion of Ahtna fishing technology see Simeone and Kari 2002:82–101). For example, in 1954, the anthropologist Frederica de Laguna photographed a dip net made by Tenas Charley at Copper Center. It was made of willow twined with
1 The speed at which fish wheels replaced dip nets is reflected in the fact that in 1921 Shirley A. Baker (Baker 1921:13–14), who
was assistant agent in the Bureau of Fisheries and was assigned to investigate the salmon escapement on the upper Copper River, does not mention the use of dip nets at all. Baker interviewed as many Native and non-Native fishers as he could, and also noted the location of fish wheels and tabulated harvests.

10
spruce root. The rim diameter was about 45 cm. It appears virtually identical to the dip net in Plate 1 (de Laguna and McClellan 1981:647).2
Appendix C provides detail on the available documentation of use of fish wheels in the Chitina area. This appendix also summarizes information from ADF&G reports documenting the development of the dip net fishery at Chitina, as well as other observations about the Copper River fisheries. In 1921, about 76 Ahtna were using fish wheels in the general Chitina area (Baker 1921). By 1955, two Ahtna had fish wheels at Chitina and another was operated at Fivemile3 (also called the Chitina Airport site in Stratton [1982]), an area within the present Glennallen Subdistrict and still important today).
Figure 7 shows the locations of fish wheels in the general Chitina area as documented in the available National Marine Fisheries Service (NMFS) and ADF&G records for 1958, 1967, 1968, and 1974. For 1958, there are 4 fish wheels documented for the present day Chitina Subdistrict: 2 near O’Brien Creek and 2 at Chitina itself, plus 2 more at Fivemile. In 1967, 1968, and 1974, one fish wheel operated at O’Brien Creek, and 1 or 2 at Chitina. More fish wheels were used at Fivemile, including 4 in 1967 and 3 in 1974. As best as can be determined, all of the fish wheels documented prior to 1974 were owned by Copper Basin residents.
With the construction of the Richardson Highway in the early 1900s (open to automobile traffic by 1927) and the Glenn Highway in the 1940s, the Copper Basin became accessible to Alaska’s growing population centers at Fairbanks, Anchorage, and the Matanuska Valley.
According to oral tradition, at least one Fairbanks resident fished at Chitina with a dip net as early as 1938. Two residents of Fairbanks interviewed for the 2000 project said that they began dipnetting at Chitina in the late 1940s and 2 others said they began fishing in the 1950s and 1960s (representing the approximately 1% of dipnetters with more than 40 years of participation in the fishery—see below, Figure 34). All said they made regular trips to Chitina after their initial visit. One of the men interviewed said, “Well, the first time I went down there was in 1949. I was working for Northern Consolidated Airlines and I got off work and my wife and I headed down there and got down there about midnight.”
According to these oral traditions, when they first arrived at Chitina, the Fairbanks dipnetters fished at Salmon Point (see Figure 6), a traditional Ahtna fishing station located on the Copper River adjacent to the town of Chitina. According to testimony from two long time dipnetters, they learned about this site from Paddy King, a local Alaska Native man.4 Then in the 1950s a road was opened, providing access to fishing spots on the Copper River between the mouths of Fox and O’Brien creeks. A favorite spot was an eddy created by a large rock located just above O’Brien Creek. In the late 1960s or early 1970s, the road into O’Brien Creek was improved and a bridge was put across the creek so that people could drive down to the creek, but because of logistical problems people seldom went further downriver. According to one long time dipnetter “in the sixties if you wanted to go any further than O’Brien Creek you had to pack, take a pack board and go down that trail.” He went on to say that even if you caught 30 or 40 fish near the road “you had a major operation just packing those 30 fish….Once the fish were caught they were packed in snow and then cleaned at O’Brien Creek before they were taken home to Fairbanks.”
With the passage of the Alaska Native Claims Settlement Act (ANCSA) in 1971, the situation in Chitina changed. Under ANCSA the Chitina Village Corporation claimed land between the mouths of Fox and 2 [Note to the 2010 edition: The 1999 C&T worksheet stated that some Ahtna use of dip nets persisted into the 1950s, but upon
review of available information we find no evidence of this use.] 3 Wallace, R. L. 1955. Report of Richard Lee Wallace, NOAA enforcement agent, regarding fish wheel harvests. Manuscript on
file at the Alaska Department of Fish and Game Glennallen office. Hereinafter cited as Wallace 1955. 4 Paddy King figures prominently in the narratives about the beginning of the dipnet fishery, but not much is actually known
about him. He was born in 1905 and his family was apparently upper Tanana Athabascan from the Nabesna area (not Ahtna). When he was quite young he moved with his parents to Chitina where he lived most of his life (Saleeby 2000:88). In the late 1940s, according to the oral accounts of 2 long-term dipnetters, Paddy King operated a fish wheel at Salmon Point.

11
O’Brien creeks, land that was used by dipnetters. In 1985, the corporation received conveyance to that land, blocked the road to O’Brien Creek, and began to charge an access fee. Once Chitina Corporation began charging a fee, fishers started to gain access to the fishery by using private and chartered boats launched near the Chitina–McCarthy Bridge (Gray 1990:7). At this point the Chitina Dipnetters’ Association became active (Gray 1990:6). According to the key respondents, once trespass on Native owned lands became an issue some people began dipnetting from boats. One man said that “the first time I noticed boats was after the trespass thing [started], people started actually using boats….And now, there’s probably as many people fishing from boats as fish along the sides [of the river].”
The first official mention of the developing dip net fishery at Chitina appears in a NMFS report for 1958 (NMFS 1958) which notes dipnetting by “tourists,” as well as local residents of Chitina, who harvested about 1,000 salmon. In the early years of the development of the Chitina fishery, dipnetting appears to have been almost the exclusive choice of nonlocal fishers. (As discussed below, the dip net remains the gear of choice of the large majority of people who travel to the Copper River to participate in the subsistence fisheries.) However, over time, and especially with the improvements to the Edgerton Highway and development of portable fish wheels at around 1970, some nonlocal people moved into the fish wheel fishery as well. The bridge over the Copper River at Chitina was completed in 1971.
Writing about the mid 1970s, Record (1983a:87) noted that Chitina Alaska Native residents set up fish wheels at several locations, mostly on the west side of the river:
1. “A fish camp located below the airport is used by the local residents and Glennallen and Anchorage people who belong to the Chitina Corporation but do not live in Chitina.”
2. “Another site is located about 2 miles south of the Copper River bridge and is also on the west bank. This site is used by the elderly residents who live in the small cluster of cabins south of town.”
3. “A third site is located on the east bank of the Copper River on either side of the Copper River bridge, but this site is not popular among the Chitina Natives.”
Regarding non-Natives living at Chitina, Record (1983a: 238–239) observed that:
The main fishing sites are located on the Copper River on both sides of the Copper River bridge. On the east bank, fish wheels and dip nets are placed north of the bridge on the bar at the mouth of the river. On the west bank, fish wheels are also placed in the river immediately south of the bridge, but most of the dip netting is also done on the west bank south of the bridge. People with riverboats travel downstream to places where fish wheels have been located. Reportedly fish wheels are sometimes placed as far south as Taral.
As shown in Figure 8, the number of fish wheels in the general Chitina area grew in 1975 to 11, with most within the accessible area near the bridge. Five were above the bridge. None were at O’Brien Creek. By 1977 and 1978 (Figure 9, Figure. 10), a new grouping at O’Brien Creek had appeared and the cluster of fish wheels at the bridge grew. Almost all of these fish wheels were operated by non-Basin residents (Kenneth Roberson, ADF&G Division of Commercial Fisheries 1999 personal communication to William Simeone, ADF&G Division of Subsistence). The Chitina Airport site remained the primary location of local Chitina residents’ fish wheels.
According to testimony provided by an Ahtna resident of Chitina regarding proposed easements at O’Brien Creek (reported in Attachment A in Gray 1990), there were Alaska Native fish wheels and fish racks in the O’Brien Creek area until around the mid 1970s when non-Native people from outside the area arrived at the site and “crowded out” the Ahtna who were fishing and processing salmon there.
Native elders from Chitina interviewed in 1999 said that Ahtna residing in Chitina in the 1950s had fish wheels located just below Salmon Point (this site was also a dip net station before the introduction of the fish wheel) and further downriver, at the mouth of Fox Creek and just above the mouth of O’Brien Creek.

12
In the 1950s the situation changed for several reasons. First, Alaska Native people from Chitina began to move away to find jobs; second, people from Fairbanks began fishing at Chitina, mostly at O’Brien Creek; and third, some Ahtna began having problems with people stealing fish out of their fish wheels, and so moved their fish camps upriver to Fivemile near the present Chitina Airport. At the same time, other Ahtna maintained their fish camps in the vicinity of O’Brien Creek and the mouth of the Chitina River. One Ahtna family from the upper Copper River began fishing at O’Brien Creek in the 1970s after the BOF prohibited subsistence fishing at their traditional site at Tanada Creek. However, by 1978 all Ahtna had left the area around O’Brien Creek because, in the opinion of one elder, they were “crowded out” by dipnetters. (Information from interviews with Millie Buck, Maggie Eskilida, and Al Taylor, October 1999, by William Simeone, ADF&G Division of Subsistence.) In a meeting with members of the BOF held on November 7, 1996, in Glennallen, Ahtna elder Henry Bell made a similar assertion. According the Mr. Bell, the land at O’Brien Creek and the mouth of the Chitina River had belonged to Ahtna people but non-Natives “took the land over” and he was forced out of a place to fish at Chitina. Therefore he had to ask permission from a relative to put in a fish wheel at Copper Center.
In 1977, by BOF action, the Upper Copper River District was divided into 2 subdistricts, creating the Chitina and Glennallen subdistricts. The purpose was to provide ADF&G biologists with more flexibility to manage the fisheries. At the time, the BOF acknowledged differences in the use patterns between the fishery as it was developing at Chitina and the remainder of the Copper River. As reported by ADF&G, the latter area was used primarily by local families with long ties to the fishery and who used fish wheels. The Chitina fishery was characterized by ADF&G as “personal use” and “nontraditional” (Roberson 1977; Kenneth Roberson, ADF&G Division of Commercial Fisheries 1999 personal communication to William Simeone, ADF&G Division of Subsistence).
In 1979, state regulations separated subsistence dip nets and fish wheels by subdistrict. The Chitina Subdistrict became dip net only and the Glennallen Subdistrict became fish wheel only. At the time, this change reflected the geographic distribution of the gear types, in that most (but not all) fish wheels were used above (or near) the Copper River bridge at Chitina. There was also concern on the part of ADF&G biologists with the potential expansion of fish wheel use into the nontraditional area of Wood Canyon, where their harvest efficiency, based on ADF&G experience in operating fish wheels there, would be very high (Kenneth Roberson, ADF&G Division of Commercial Fisheries 1999 personal communication to William Simeone, ADF&G Division of Subsistence).
The Copper River Salmon Management Plan was adopted by the BOF in 1980 to provide further flexibility in the allocation of salmon among user groups. Four “classes” of subsistence permits were created, based on age, income, place of residence, household size, wage employment, and history of participation in the subsistence fishery.
Displacement of local fishers from fishing sites in the Cooper River by nonlocal fishers, which appears to have begun in the 1960s and 1970s, continued into the early 1980s. As just noted, beginning in 1979, fish wheels by regulation were restricted to north of the bridge. In 1982, about 32 wheels (31% of all wheels used that year) and 191 permittees (34%) fished just north of the bridge. Their owners were from 23 different communities; 70% were non-Basin residents. All the wheels were located within a three-quarter mile stretch of river. Conditions were crowded: “Some wheels were as close as five yards apart. The density gave rise to some complaints and various kinds of accommodations among the fishermen. For example, some local residents waited to run their own wheels until others had finished fishing and had pulled their own wheels” (Stratton 1982:30). In other cases, local households found new locations:
Chitina is a site highly favored by non-Basin residents [for operating fish wheels] because of easy access from the road; vehicles are able to travel right to the riverbank. This expedites transporting and placing the fish wheel, as well as transporting the catch. It is possible that the visibility and general knowledge about the Chitina site also have contributed to the popularity of the area for non-Basin fish wheel operators. …. As a

13
result of the growing use of this area, fish wheel sites with access and appropriate wind conditions for drying fish are at a premium in the Chitina area. Some local residents have given up vying for a spot at the bridge and are testing other locations. One such family now puts in a wheel near the Chitina airport, on a gravel island which is reached by crossing over two smaller channels of the river with small driftwood or dead wood bridges that are built each year. In spite of the access difficulties, the users prefer the site for its privacy and usually good conditions for drying fish in June. (Stratton 1982:31–32)
As noted in the background section, in 1984, the BOF changed the status of the Chitina Subdistrict fishery from subsistence to personal use. At the same time, the fishery in the Glennallen Subdistrict maintained its classification as a subsistence fishery. Both fish wheels and dip nets were allowed in the subsistence fishery, but in 1984, only dip nets could be used in the personal use fishery. From 1986 through 1989, the boundary of the personal use fishery was adjusted north of the bridge and was opened to personal use fish wheels. The boundary was moved back to the bridge in 1990 when all Alaska residents could again participate in the subsistence fish wheel fishery in the Glennallen Subdistrict.
Table 4 is a summary of the information relating to Criterion 1 that was provided to the BOF at its February 1984 meeting, during which the first customary and traditional use findings for the Copper River salmon stocks were developed, and as were summarized for the 1996 BOF meeting. Data pertaining to 1982 were used because they were the most complete recent data set at the time of the BOF meeting and because they had been analyzed by the ADF&G Division of Subsistence and reported in Stratton 1982.
Table 4.–Information pertaining to Criterion 1 provided to the BOF by ADF&G, 1984.
Glennallen Subdistrict Chitina Subdistrict In the early 1980s, most participants in the fish wheel fishery of the Glennallen Subdistrict were residents of the Copper River basin (52% in 1983). The indigenous Ahtna Athabascans had used the salmon of the Copper River for subsistence for centuries, adopting the fish wheel in the second decade of the 20th century. In 1982, over 50% of a sample of Basin-resident fish wheel users had used fish wheels for more than 20 years. As many as 75% of the households of communities near the Copper River regularly engaged in fish wheel use (Fall and Stratton 1984).
The vast majority of participants in the dip net fishery at Chitina in the early 1980s (and back to the late 1950s) were non-Copper River Basin residents. In 1982, 98% of dip net permittees were non-Basin residents, with most traveling from Fairbanks (35%), Anchorage (26%), military bases (13%), and the Mat–Su area (6%). A survey conducted in 1982 found that 41% were participating in the fishery for the first time; 72% had participated for 5 years or less; and 2% had participated more than 20 years (Stratton 1982:55). Many of those interviewed indicated that since they first dipnetted at Chitina, there had been intervening years when they had not participated due to employment, being out of state, involvement in another salmon fishery, or having enough salmon from the previous year (Stratton 1982:54).
PERMIT DATA: LEVELS OF PARTICIPATION AND HARVEST Tables 5 through 8 and figures 11 through 31 illustrate participation rates and estimated harvests in the state-managed Chitina Subdistrict dip net fishery and the Glennallen Subdistrict subsistence salmon fishery. Recent trends can be compared with the pattern described for 1982 and with information evaluated by the BOF during previous C&T deliberations.5 Data appearing in tables 5 through 8 and figures 11 through 31 may differ slightly from data summaries prepared by the Division of Sport Fish and
5 [Note to the 2010 edition: Information about harvests in the federal subsistence salmon fishery in the Chitina Subdistrict is
included in the figures, and is presented separately below.]

14
ADF&G, primarily because analyses prepared by the Division of Subsistence for the Alaska Subsistence Fisheries Database develop harvest estimates at the community level, while the Division of Sport Fish estimates are based on a single analysis for the total set of permit holders regardless of residence. The differences in harvest estimates for the fishery overall resulting from these 2 analysis methods are minor and do not affect the identification of patterns in the fishery.
As shown in Figure 11 (see also Table 5), the number of permits issued for the Chitina Subdistrict grew steadily in the 1960s, and more rapidly as road access to the subdistrict improved. The number of permits issued for dipnetting dropped from the record levels of the early 1980s during the mid and late 1980s, but had matched these levels again by the early 1990s. Record numbers of personal use dip net permits were issued in 1998 and 1999, at about 10,000. In short, trends of growth in the dip net fishery, first noted in the 1960s and intensifying in the early 1980s, continued into the late 1990s, and for much the same reasons: accessibility, communications among fishery participants about run strength, and the opportunity to harvest a high quality product for home use. Since 2001, the number of permits issued for the Chitina Subdistrict has dropped from record levels and appeared to have leveled off; the recent (2004 through 2008) 5-year average is 8,260 permits issued per year.
Trends in harvest levels for the Chitina Subdistrict reflect those of the number of permits issued (Figure 12; see also Table 5). Record harvests above 130,000 salmon were achieved in 7 years between 1997 and 2007. The recent 10-year average harvest is 120,133 salmon and the recent 5-year average is 121,424 salmon. From 1999 through 2008, Chitina Subdistrict permit holders harvested 14.6 salmon. From 2004 through 2008, the average harvest per permit holder was 14.7 salmon (Figure 13, Table 5).
As shown in Figure 14 (see also Table 6), the number of permits issued for subsistence fishing in the Glennallen Subdistrict also grew steadily until the early 1980s. Participation levels were lower from 1986 to 1990 compared to the early 1980s, largely due to the restriction on issuing permits to non-Basin residents. Since the fishery has been reopened to all Alaskans, growth in participation rates and harvest levels has resumed. Some of the growth in number of permits issued is a result of subsistence dip net permits being issued to non-Basin residents (see below).
Subsistence salmon harvests in the Glennallen Subdistrict were relatively steady, between 30,000 and 4,000 salmon, in the 1980s, reflecting limits on participation in the fishery to local residents (Figure 15). Since the early 1990s, the harvest has steadily increased, with the recent 10-year average at 78,881 salmon and the recent 5-year average at 83,713 salmon. Average harvests per permit in the Glennallen Subdistrict fishery have been relatively steady since the 1960s. The long term average is about 60 salmon per permit, and the recent 10-year average is 62 salmon per permit (Figure 16, Table 6).
Figures 17, 18, and 19 compare trends in the Chitina and Glennallen subdistricts. Most participants in upper Copper River fisheries continue to choose to fish in the Chitina Subdistrict with dip nets (Figure 17). Also, estimated salmon harvests in the Chitina Subdistrict are greater than those of the Glennallen Subdistrict (Figure 18). However, average harvests per permit are substantially higher in the Glennallen Subdistrict compared to the Chitina Subdistrict (Figure 19).
The patterns of choice of gear and fishing location reflecting area of residence noted in the early 1980s are still evident in the upper Copper River fisheries (Figure 20, Figure 21, Figure 22, Table 7). Over 99% of the participants in the Chitina Subdistrict dip net fishery from 1988 through 2009 have been nonlocal (non-Copper Basin) residents, compared to about 98% in 1982. In 1982, 48% of the Chitina Subdistrict dipnetters were from Fairbanks, as were 43% from 1988 to 2001, and 43% from 1988 through 2009. Anchorage residents made up 35% of the dipnetters in 1982, 35% 1988 through 2001, and 33% from 1988 through 2009. There has been an increase in the percentage of dip net permits issued to Matanuska–Susitna residents, from 6% in 1982 to 13% from 1988 through 2001, and 17% from 2005 through 2009, probably reflecting the rapid population growth in the Matanuska–Susitna Borough. These percentages have been fairly constant over the period 1988 through 2009, except that in the most recent years, the number of personal use permits issued to Matanuska–Susitna residents has increased at a more rapid rate

15
than for other areas, and the relative percentage of permits issued to Fairbanks residents has declined from over half the permits in the late 1980s to about 45% from 2005 through 2009 (Figure 23, Table 7).
Table 8 reports the number of permits and percentage of permits by place of residence in the Glennallen Subdistrict subsistence salmon fishery, combining type of gear and permits issued by either ADF&G or NPS. As illustrated in Figure 24, the number of permits issued to Copper Basin residents has been very consistent over the 22-year period, with a 22-year average of 395 permits and a recent 5-year average of 389 permits. In contrast, since being available to nonlocal residents beginning in 1990, the number of permits issued to nonlocal resident has grown steadily, topping 1,000 permits in 2007 and 2008; this growth accounts for all of the increase in permits in this fishery overall. Figure 25 illustrates the trend in number of permits issued for the Glennallen Subdistrict by area of residence (Copper Basin, Anchorage, Matanuska–Susitna, Fairbanks, and “other Alaska”). Until 1997, the majority of the subsistence salmon harvest in the Glennallen Subdistrict was taken by local Copper Basin residents; since 1997, most of the harvest has been by nonlocal residents (Figure 26). Over the last 5 years (2004–2008), Copper Basin residents harvested about 36% of the harvest and others about 64%. However, Copper Basin residents on average harvest more salmon: 77 per permit from 2004 to 2008 compared to 58 per permit for other participants in the Glennallen Subdistrict fishery (Figure 27).
As shown in Figure 28 and Figure 29, the percentage of permits issued by area of residence in the Glennallen Subdistrict fish wheel fishery in 1982 was also very similar to the pattern for the period 1991 through 2001. In both, just over half the permits were issued to Copper Basin residents, with the next largest group from Anchorage (17% of permits in 1982, 21% in 1991 through 2001), followed by “other Alaska” (largely Upper Tanana and Valdez) at 15% in 1982 and 11% in 1991 to 2001, the Matanuska–Susitna Borough (11% in 1982, 11% in 1991 to 2001), and Fairbanks (5% in 1982, 6% in 1991 to 2001). However, the percentage of fish wheel permits issued to Copper Basin residents declined starting in 1990 as more nonlocal residents entered the fishery, repeating the pattern that developed in the 1970s and 1980s. Since 2002, the NPS has issued subsistence permits to local rural residents. Unlike state permits, federal permits do not specify the type of gear to be used (federal regulations allow fish wheels, dip nets, or rod and reel). Analysis of data from returned permits for 2002, however, showed that of an estimated harvest of 26,093 salmon by Copper Basin residents who held either state or federal permits for the Glennallen Subdistrict, 97% were taken in fish wheels, about 3% with dip nets, and fewer than 1% with rod and reel (Fall et al. 2003:150).
The large majority of the participants in the subsistence dip net fishery of the Glennallen Subdistrict are nonlocal residents (Figure 30). For the period 1991 through 2001, Copper Basin residents received 19% of the Glennallen Subdistrict subsistence dip net permits, compared to 81% to other Alaska residents These is likely movement from the Chitina Subdistrict personal use fishery to the Glennallen Subdistrict subsistence dip net fishery as fishers take advantage of the higher seasonal limits for all salmon in the latter, or the higher limit for Chinook salmon. For example, the average harvest per Glennallen subsistence dip net permit in 1998 was about 31 salmon, compared to 14.6 in the Chitina personal use fishery. For 2001, Glennallen Subdistrict dipnetters harvested an average of 24.2 fish and Chitina Subdistrict dipnetters harvested an average of 15.1 fish. However, for the state permits issued for the Glennallen Subdistrict from 2002 through 2009 (annual average of 422 permits), the average annual harvest was 15.8 salmon, compared to 14.7 salmon in the Chitina Subdistrict from 2004 through 2008). The average harvest for holders of state fish wheel permits for the same period was 72 salmon (average of 639 state permits; an average of 322 federal permits were also issued) (Somerville 2010).
As shown in Figure 31, regardless of the subdistrict fished, in 1982 and from 1988 through 2001, most Copper Basin residents chose to fish with fish wheels: 78% in 1982 and 75% for 1988 through 2001. In contrast, most nonlocal residents who fished in the upper Copper River fisheries in 1982 (95%) and 1988–2001 (96%) chose to fish with dip nets.

16
Table 9 reports estimated harvests in the federal Chitina Subdistrict subsistence salmon fishery from 2002 through 2008. On average, 94 permits have been issued, all to residents of Copper Basin and Upper Tanana communities. The average annual harvest over the 7 years of the fishery has been 1,285 sockeye salmon, 49 coho salmon O. kisutch, and 27 Chinook salmon.
In the discussion under Criterion 8, below, salmon harvests in the Chitina Subdistrict area are compared with other personal use and subsistence fisheries in Alaska. These comparisons may inform deliberations about the extent of “reliance” exhibited by the pattern of use of Chitina Subdistrict salmon, as addressed in Criterion 1, as well as the extent of “reliance” on the “subsistence way of life” exhibited by the pattern of use of Chitina Subdistrict salmon, as addressed by Criterion 8.
FINDINGS FROM THE 2000 SURVEY RELATED TO CRITERION 1 The following figures summarize data collected from a survey conducted by the Division of Subsistence and other collaborators (see “Background,” above) in summer 2000 in which 509 participants in the subsistence fisheries were interviewed. Figure 32 shows that of the 382 nonlocal residents interviewed, 81% fished in the Chitina Subdistrict, while 96% of the local residents interviewed fished in the Glennallen Subdistrict. These results show that the same patterns, noted in the 1984 study, correlating gear choice, fishing location, and area of residence, continue in the upper Copper River fisheries.
Figure 33 shows the differences in length of Alaska residency between fishery participants in the Glennallen and Chitina subdistricts. About 6% of Glennallen subdistrict sample had lived in Alaska for 5 or fewer years, compared to 16% for the Chitina Subdistrict sample. Over 24% of Glennallen Subdistrict sample had lived in the state more than 50 years, compared to 2% for Chitina Subdistrict fishers who were interviewed.
As also found in the 1984 study (see Table 4), the Glennallen Subdistrict participants surveyed in 2000 tended to have a longer history of involvement in the fishery than did Chitina Subdistrict participants (Figure 24). However, history of involvement in the fishery has increased for Chitina Subdistrict fishers compared to 1982, a finding that is not surprising given the passage of 18 years and the continuous annual opportunity to fish at Chitina over that time period. In 1982, 72% of dipnetters had fished at Chitina 5 or fewer years (Table 8); the corresponding finding in 2000 was 43% (Figure 34). Only 2% of Chitina dipnetters had participated more than 20 years in 1982, compared to 19% in 2000.
Figure 35 provides data on the frequency that respondents said they had participated in the fishery. Just over 14% of Chitina Subdistrict fishers interviewed said they were participating in the fishery for the first time, 44% said they fished every year, and 32% said they fished most years. Also, 10% were infrequent participants. In comparison, 8% of Glennallen Subdistrict fishers who were interviewed were participating in the fishery for the first time, 63% said they fished every year, and 20% said they fished most years; 10% were infrequent participants.
Table 10 reports the frequency of participation in the Copper River subsistence fishery for each subdistrict by the number of years that the respondent had first fished in the Copper River. For all 5-year cohorts, a higher percentage of Glennallen Subdistrict fishers fished every year than did Chitina Subdistrict fishers. In total (excepting respondents who were participating for the first year), 51% of Chitina Subdistrict fishers reported that they fished there every year, while 68% of Glennallen Subdistrict fishers said they fished every year.

17
Table 5.–Number of permits issued, estimated salmon harvests, and average harvest per permit, Chitina Subdistrict, 1960 to 2009.
Year Number of
permits issued Estimated harvest
of salmon Average harvest of salmon per permit
1960 32 1,518 47.4 1961 307 2,279 7.4 1962 435 4,139 9.5 1963 514 2,675 5.2 1964 794 5,684 7.2 1965 982 9,314 9.5 1966 1,132 9,806 8.7 1967 1,166 8,053 6.9 1968 1,235 11,614 9.4 1969 1,415 21,767 15.4 1970 3,220 29,785 9.3 1971 4,168 36,338 8.7 1972 3,485 22,971 6.6 1973 3,840 17,546 4.6 1974 3,305 17,269 5.2 1975 2,452 8,871 3.6 1976 2,512 14,011 5.6 1977 3,526 26,738 7.6 1978 3,313 14,416 4.4 1979 2,730 16,626 6.1 1980 2,804 21,099 7.5 1981 3,555 35,573 10.0 1982 5,475 68,377 12.5 1983 6,911 79,267 11.5 1984 5,415 50,734 9.4 1985 4,153 36,328 8.7 1986 4,031 44,047 10.9 1987 4,245 46,908 11.1 1988 4,251 45,855 10.8 1989 4,584 59,681 13.0 1990 5,689 70,662 12.4 1991 6,222 85,882 13.8 1992 6,387 92,036 14.4 1993 7,914 93,716 11.8 1994 7,060 112,566 15.9 1995 6,762 105,972 15.7 1996 7,196 102,656 14.3 1997 9,086 154,650 17.0 1998 10,002 146,431 14.6 1999 9,941 150,845 15.2 2000 8,145 116,347 14.3
-continued-

18
Table 5. Page 2 of 2.
Year Number of
permits issued Estimated harvest
of salmon Average harvest of salmon per permit
2001 9,458 142,905 15.1 2002 6,804 94,782 13.9 2003 6,440 89,332 13.9 2004 8,153 116,476 14.3 2005 8,232 133,546 16.2 2006 8,497 133,410 15.7 2007 8,378 135,990 16.2 2008 8,041 87,699 10.9 2009 7,859 91,868 11.7
Mean, all years 4,845 60,541 12.5 Recent (1999–2008) 10-year average
8,209 120,133 14.6
Recent (2004–2008) 5-year average
8,260 121,424 14.7
Sources ADF&G Division of Subsistence Alaska Salmon Fishing Database (ASFDB), accessed February 2010; Somerville 2010 for 2009 preliminary data.
Table 6.–Number of permits issued, estimated salmon harvests, and average harvest per permit, Glennallen Subdistrict, 1960 to 2009.
Year Number of
permits issued Estimated harvest
of salmon Average harvest ofsalmon per permit
1960 26 7,285 280.2 1961 59 15,927 269.9 1962 117 14,347 122.6 1963 110 15,612 141.9 1964 158 10,656 67.4 1965 143 7,504 52.5 1966 138 12,090 87.6 1967 154 10,954 71.1 1968 143 8,769 61.3 1969 167 7,499 44.9 1970 267 12,972 48.6 1971 374 12,111 32.4 1972 205 9,497 46.3 1973 305 11,702 38.4 1974 288 8,732 30.3 1975 350 6,486 18.5 1976 451 9,612 21.3
-continued-

19
Table 6. Page 2 of 2.
Year Number of
permits issued Estimated harvest
of salmon Average harvest ofsalmon per permit
1977 540 15,077 27.9 1978 392 7,613 19.4 1979 470 14,337 30.5 1980 399 13,982 35.0 1981 523 33,173 63.4 1982 615 41,629 67.7 1983 630 39,461 62.6 1984 562 28,617 50.9 1985 533 27,836 52.2 1986 375 28,417 75.8 1987 431 34,080 79.1 1988 416 33,469 80.5 1989 386 29,587 76.7 1990 406 32,949 81.2 1991 712 40,919 57.5 1992 655 46,900 71.6 1993 773 55,523 71.8 1994 970 71,193 73.4 1995 858 57,280 66.8 1996 850 54,305 63.9 1997 1136 86,483 76.1 1998 1010 67,275 66.6 1999 1102 80,835 73.4 2000 1251 66,032 52.8 2001 1239 86,601 69.9 2002 1308 68,161 52.1 2003 1227 68,612 55.9 2004 1212 87,557 72.2 2005 1235 94,752 76.7 2006 1239 81,743 66.0 2007 1458 91,110 62.5 2008 1455 63,404 43.6 2009 1369
Mean, all years 624 37,361 59.9 Recent (1999–2008) 10-year average
1,273 78,881 62.0
Recent (2004–2008) 5-year average
1,320 83,713 63.4
Sources ASFDB, accessed February 2010; Somerville 2010 for 2009 preliminary data. Note Data for 2009 are incomplete and harvest data from federal permits not available.

Table 7.–Number of personal use and subsistence dip net permits issued by area of residence, Chitina Subdistrict, 1988 to 2009.
Number of permits Percentage of permits
Year Copper Basin Anchorage Matanuska–
Susitna Fairbanks–NSB Other Total Copper Basin AnchorageMatanuska–
Susitna Fairbanks–NSB Other1988 29 1,190 354 2,258 375 4,206 0.7% 28.3% 8.4% 53.7% 8.9%1989 19 1,427 376 2,283 364 4,469 0.4% 31.9% 8.4% 51.1% 8.1%1990 23 1,907 524 2,707 472 5,633 0.4% 33.9% 9.3% 48.1% 8.4%1991 63 2,219 674 2,844 420 6,220 1.0% 35.7% 10.8% 45.7% 6.8%1992 72 2,186 620 2,941 562 6,381 1.1% 34.3% 9.7% 46.1% 8.8%1993 76 2,944 894 3,342 658 7,914 1.0% 37.2% 11.3% 42.2% 8.3%1994 65 2,413 791 3,165 625 7,059 0.9% 34.2% 11.2% 44.8% 8.9%1995 53 2,324 789 2,962 629 6,757 0.8% 34.4% 11.7% 43.8% 9.3%1996 72 2,436 903 3,078 696 7,185 1.0% 33.9% 12.6% 42.8% 9.7%1997 44 3,402 1,392 3,455 793 9,086 0.5% 37.4% 15.3% 38.0% 8.7%1998 61 3,653 1,623 3,785 883 10,005 0.6% 36.5% 16.2% 37.8% 8.8%1999 69 3,435 1,677 3,876 887 9,944 0.7% 34.5% 16.9% 39.0% 8.9%2000 36 2,754 1,388 3,243 724 8,145 0.4% 33.8% 17.0% 39.8% 8.9%2001 59 3,295 1,571 3,610 923 9,458 0.6% 34.8% 16.6% 38.2% 9.8%2002 21 2,016 1,049 3,054 664 6,804 0.3% 29.6% 15.4% 44.9% 9.8%2003 30 1,899 937 2,942 632 6,440 0.5% 29.5% 14.5% 45.7% 9.8%2004 47 2,426 1,316 3,547 817 8,153 0.6% 29.8% 16.1% 43.5% 10.0%2005 37 2,180 1,338 3,845 832 8,232 0.4% 26.5% 16.3% 46.7% 10.1%2006 48 2,303 1,411 3,842 893 8,497 0.6% 27.1% 16.6% 45.2% 10.5%2007 33 2,337 1,379 3,884 745 8,378 0.4% 27.9% 16.5% 46.4% 8.9%2008 44 2,298 1,341 3,485 871 8,039 0.5% 28.6% 16.7% 43.4% 10.8%2009 80 2,308 1,433 3,343 796 7,959 1.0% 29.0% 18.0% 42.0% 10.0%
22-year average 48 2,431 1,064 3,245 689 7,476 0.6% 32.5% 14.2% 43.4% 9.2%Recent 10-year average
43 2,382 1,316 3,479 790 8,011 0.5% 29.7% 16.4% 43.4% 9.9%
Recent 5-year average
48 2,285 1,380 3,680 827 8,221 0.6% 27.8% 16.8% 44.8% 10.1%
Source for preliminary data for 2009: Somerville 2010. Note Percentages for 2009 rounded to nearest whole number and therefore number of permits issued is approximate.
20

Table 8.–Number of subsistence permits issued by area of residence, Glennallen Subdistrict, 1988 to 2008.
Number of permits Percentage of permits
Year Copper Basin Anchorage Fairbanks–NSBMatanuska–
Susitna Other Total Copper Basin Anchorage FairbanksMatanuska–
Susitna Other1988* 402 0 1 11 2 416 96.6% 0.0% 0.2% 2.6% 0.5%1989* 370 2 0 13 1 386 95.9% 0.5% 0.0% 3.4% 0.3%1990 389 1 1 12 3 406 95.8% 0.2% 0.2% 3.0% 0.7%1991 391 131 51 79 60 712 54.9% 18.4% 7.2% 11.1% 8.4%1992 391 126 29 67 42 655 59.7% 19.2% 4.4% 10.2% 6.4%1993 404 178 42 96 53 773 52.3% 23.0% 5.4% 12.4% 6.9%1994 433 271 86 96 84 970 44.6% 27.9% 8.9% 9.9% 8.7%1995 419 210 61 80 88 858 48.8% 24.5% 7.1% 9.3% 10.3%1996 399 228 53 94 73 847 47.1% 26.9% 6.3% 11.1% 8.6%1997 417 307 94 131 187 1,136 36.7% 27.0% 8.3% 11.5% 16.5%1998 390 261 96 103 160 1,010 38.6% 25.8% 9.5% 10.2% 15.8%1999 410 330 112 101 148 1,101 37.2% 30.0% 10.2% 9.2% 13.4%2000 362 378 189 150 172 1,251 28.9% 30.2% 15.1% 12.0% 13.7%2001 363 419 142 144 171 1,239 29.3% 33.8% 11.5% 11.6% 13.8%2002 407 461 162 152 126 1,308 31.1% 35.2% 12.4% 11.6% 9.6%2003 383 393 162 157 132 1,227 31.2% 32.0% 13.2% 12.8% 10.8%2004 414 349 140 161 148 1,212 34.2% 28.8% 11.6% 13.3% 12.2%2005 369 372 159 169 166 1,235 29.9% 30.1% 12.9% 13.7% 13.4%2006 372 337 154 216 160 1,239 30.0% 27.2% 12.4% 17.4% 12.9%2007 409 400 210 261 178 1,458 28.1% 27.4% 14.4% 17.9% 12.2%2008 406 400 236 269 144 1,455 27.9% 27.5% 16.2% 18.5% 9.9%2009
22-year average 395 264 104 122 109 995 39.7% 26.6% 10.4% 12.3% 11.0%Recent 10-year average
387 390 173 187 155 1,292 30.0% 30.2% 13.4% 14.4% 12.0%
Recent 5-year average
389 377 190 229 162 1,347 28.9% 28.0% 14.1% 17.0% 12.0%
Note Data on federal permits not available for 2009. * Only residents of Copper Basin and upper Tanana areas were eligible for permits in 1984 and 1986–1989.
21

22
Table 9.–Historical subsistence salmon harvests, federal Chitina subdistrict permits, 2003–2008.
Permits Estimated salmon harvest Year Issued Returned Chinook Sockeye Coho Chum Pink Total2002 122 90 48 835 0 0 0 8832003 99 71 33 1,316 152 0 0 1,5002004 109 83 9 1,631 28 0 0 1,6682005 77 64 27 1,498 0 0 0 1,5262006 76 62 16 1,681 26 0 0 1,7232007 97 86 29 1,095 41 0 0 1,1652008 81 65 26 939 97 0 0 1,062
Average (2002–2008)
94 74 27 1,285 49 0 0 1,361
Source ASFDB 2009.
Table 10.–Frequency of fishing by number of years since first fished in the Copper River, by subdistrict.
Number of years since first fished 1–5 6–10 11–20 21–30 31–40 41–50 51+ All
Chitina Subdistrict n = 88 n = 44 n = 78 n = 41 n = 14 n = 0 n = 3 n = 268Every year 75% 55% 41% 24% 21% 67% 51%Most years 22% 34% 49% 51% 50% 33% 38%Infrequently 3% 11% 10% 24% 29% 11%
Glennallen Subdistrict n = 21 n = 20 n = 38 n = 29 n = 26 n = 19 n = 24 n = 177Every year 86% 90% 63% 48% 62% 53% 88% 68%Most years 5% 10% 24% 34% 23% 42% 13% 22%Infrequently 10% 13% 17% 15% 5% 10%
Note This table does not include respondents who were fishing for the first time in the Copper River.
CRITERION 2 Criterion 2. A pattern of taking or use recurring in specific seasons of each year. Table 11 presents information relating to Criterion 2 that was provided to the BOF in 1984, and as was summarized for the 1996 BOF meeting. These patterns have not changed.
Table 11.–Information pertaining to Criterion 2 provided to the BOF by ADF&G, 1984.
Glennallen Subdistrict Chitina Subdistrict Most Chinook and sockeye salmon are taken beginning in June through early July; coho salmon are harvested later in the year, mostly in late August and September.
Chinook and sockeye salmon are taken beginning in June and continuing into August; coho salmon are harvested later in the year, late August and September.
Figures 36 and 37 present data collected in the 2000 survey showing contrasting patterns of participation between fishery participants in the 2 subdistricts. Most Glennallen Subdistrict fishers who were interviewed (83%) fished in June, with effort tapering off gradually throughout the rest of the season. Although half of Chitina Subdistrict fishers fished in June, most Chitina Subdistrict fishing took place in July (88% fish in that month) and participation dropped quickly in August (21%) and September (4%).

23
Figure 36 shows that 82% of Glennallen Subdistrict fishers said they fished in June, while 82% said they fished in July and 48% fished in August. In contrast, 88% of Chitina Subdistrict fishers fished in July while 53% said they fished in June and only 21% fished in August. One long time dipnetter said that he used to fish at Chitina in June but now he goes “later in the year.” He said, “Usually I try and go around the 15th of July. It seems there’s more fish, the weather is warmer…” As noted below under Criterion 5, local Copper Basin residents, who mostly fish with fish wheels in the Glennallen Subdistrict, prefer to fish in June because local weather conditions are more favorable for traditional methods of preserving salmon. It should be noted that for the Chitina Subdistrict, fishing time in June has been restricted by regulation.
CRITERION 3 Criterion 3. A pattern of taking or use consisting of methods and means of harvest that are characterized by efficiency and economy of effort and cost. Table 12 presents information relating to Criterion 3 that was provided to the BOF in 1984, and was summarized for the 1996 BOF meeting.
Table 12.–Information pertaining to Criterion 3 provided to the BOF by ADF&G, 1984.
Glennallen Subdistrict Chitina Subdistrict Due to their efficiency, fish wheels had long been the gear of choice among Copper Basin residents, most of whom fished in the Glennallen Subdistrict at sites near their homes.
Dip nets were used exclusively in this subdistrict by regulation in the early 1980s and had predominated in this area since statehood. Most participants traveled from Fairbanks (630 miles by road, round trip), the Matanuska–Susitna area (414 miles from Palmer, round trip), and Anchorage (500 miles, round trip). Of those dipnetters interviewed in 1982, 20% planned to fish one day at Chitina; one-third planned to spend a weekend; one-third planned to stay until they caught their limit; and the remainder planned to make more than one trip (Stratton 1982:56).
As noted above, fish wheels remain the gear of choice among Copper Basin residents. A household survey conducted for 1987–1988 in Copper Basin communities found that 89% of all salmon harvested for home use by Copper Basin households were taken with fish wheels, 7% with rod and reel, 3% with dip nets, and 1% with “other gear” (mostly salmon removed from commercial fisheries outside the local area). Of the estimated 1,222 Copper Basin households in that study year, 409 (34%) harvested salmon with fish wheels, 273 (23%) used rod and reel, and 49 (4%) used dip nets (Simeone and Fall 1996:81).
Copper Basin households continue to use fish wheels at traditional sites near their homes (Simeone and Fall 1996:62–68). There are relatively low travel costs associated with this use pattern.
As noted above, the vast majority of Copper River dipnetters continue to travel to Chitina from Fairbanks, Anchorage, and the Matanuska–Susitna Valley. Table 13 reports approximate distances by road, in miles, between Chitina and selected Alaska locations. For example, a round trip along the road system between Fairbanks and Chitina is approximately 628 miles, between Chitina and Anchorage, 508 miles, and between Palmer and Chitina, 424 miles. Based upon these distances, on average, permit holders in the state Chitina Subdistrict dip net fishery traveled by road approximately 550 miles (round trip) to participate in the fishery over the 10-year period from 1999 through 2008.6
6 This average accounts for approximately 95% of permit holders who travel by road to Chitina and live in one of the areas listed
in Table 13. The remaining 5% come from other areas of the state, primarily off the road system. The average does not account for potential vehicle pooling.

24
Table 14 presents an estimate of the cost of harvesting salmon in the dip net fishery compared to buying salmon in a retail market, using data from 1999. This analysis illustrates a cost efficiency for harvesting salmon in the dip net fishery in that year, consistent with the intent of personal use fisheries (as the Chitina dip net fishery was then classified) to be an efficient alternative to rod and reel fisheries. It should be noted that the cost of gasoline has risen substantially since this analysis was completed: the cost per gallon in Anchorage in February 2010 was about $3.20. (A 1969 analysis 7 found the following “cost per pound of usable fish” for the Chitina fishery: Anchorage, $1.00; Delta Junction, $0.56; Fairbanks, $0.96; Palmer, $0.66; Paxson, $0.23; Tok, $0.34; and Valdez, $1.43. It should be noted that in 1969 there was no sport fishing license requirement or access fee.)
Figures 38 shows that, consistent with permit data, local residents who were interviewed in 2000 preferred to use fish wheels (93% of local fishers used fish wheels; 7% chose dip nets), while non-Basin residents preferred dip nets (89% chose dip nets). Figure 39 presents a more detailed analysis of the data and shows a correlation between choice of gear type and place of residence.
With the introduction of the fish wheel at the beginning of the 20th century, local Alaska Natives and non-Natives alike abandoned dip nets and switched to fish wheels. According to information gathered from Fairbanks residents who began fishing at Chitina in the late 1940s, some people at Chitina were still using dip nets made from chicken wire. One long time dipnetter recollected the first time he traveled to Chitina he did not catch any fish because “…they didn’t have these dip nets that they’re using now. They took chicken wire and made a cone and put a pole on it and usually you couldn’t reach out far enough to get any fish, unless they came in right in close.” Another dipnetter said “…and it was in the period around 1950 when people started to use cloth nets.”
Some dipnetters who have fished at Chitina since the 1950s or 1960s expressed the opinion when interviewed that, for a number of reasons, fish wheels were not as efficient or practical as dip nets. One person explained that he was always too busy to build a fish wheel: “Oh, I was too busy. I could get enough fish [using a dip net]. I was working six days a week with the airlines and building up the homestead.” Another person said that he was thinking about using a fish wheel but that he had “such good luck” dipnetting from a boat that he had no need to use a fish wheel, except, he said “when you go down there once a year and you can use as many fish as we can, if you go fishing below the bridge like they had it this year, there really aren’t enough fish for what we could like to have.” A third respondent said, “I just never had the need to, you know. To me, personally it’s more a pain in the rear than it would be worth, you know?” A fourth person pointed out that even though fish wheels were an “easy way” to catch fish, he was not “raised up with a fish wheel, and, to me, it’s more dangerous.” He went on to say, “I really prefer dipnetting. People say that it is inefficient, but when the fish are running I've pulled up to four fish out in one dip, and the last two years we hit a spot where, if dipnetting is inefficient, I question that, because we caught, last year we caught two hundred fish in less than six hours of dipping.”
7 Larson, C. 1969. Memorandum: Copper River subsistence fishery. November 14, 1969, memorandum to Ken Middleton
located at ADF&G Division of Commercial Fisheries, Glennallen.

25
Table 13.–Distances to Chitina from selected Alaska communities.
Place Distance in miles
One way Round trip Anchorage 254 508 Delta Junction 216 432 Fairbanks 314 628 Eagle River 241 482 Glennallen 65 130 North Pole 299 598 Palmer 212 424 Soldotna 401 802 Tok 204 408 Valdez 116 232 Wasilla 226 452 Source Graef 1999.
Table 14.–Estimate of relative cost of obtaining salmon through dipnetting at Chitina compared to purchasing salmon in a store (in 1999).
Residence Distance to
Chitina (RT) Gas @ 18 m/g
Cost @ $1.50/g Other costs 2
Totalcost
Average catch Price perpound
Purchase per pound1
CannedFish Pounds Whole Fillets Anchorage 512 miles 28.44g $42.67 $40.00 $82.67 15 60 $1.38 5.86 6.99 5.48 Fairbanks 604 miles 33.56g $50.33 $40.00 $90.33 15 60 $1.51 6.18 7.93 5.79 Palmer 428 miles 23.78g $35.67 $40.00 $75.67 15 60 $1.26 5.86 6.99 5.48 Note Assumes all harvest taken in a single trip and all processing done by permittee. 1. Average price for 2 stores. Palmer and Anchorage assumed to be equal. In Fairbanks, Copper River sockeye salmon was $13.98/pound in 1999. 2. Other costs include sport fishing license = $30 (two per permit/family); plus access fee = $10 [note that fee increased to $25 in 2000]; does not include food,
lodging, camping fees, labor, equipment, or time.

26
CRITERION 4 Criterion 4. The area in which the noncommercial, long-term, and consistent pattern of taking, use, and reliance upon the fish stock or game population has been established. Table 15 presents information relating to Criterion 4 that was provided to the BOF in 1984, and was summarized for the 1996 BOF meeting.
Table 15.–Information pertaining to Criterion 4 provided to the BOF by ADF&G, 1984.
Glennallen Subdistrict Chitina Subdistrict In the early 1980s, there were about 10 “clusters” of fish wheels along the Copper River. Owners normally placed their wheels in the same general area each year. Among long term Basin residents, wheels were placed from sites that were recognized as “belonging” to certain families. This right to use a particular site appeared to be inherited through lines of kinship. Long term Basin residents tended to operate their fish wheels from camps with permanent facilities for processing the salmon. Other Basin residents transported their catch to their permanent residences, where processing and storage occurred (Stratton 1982:14; Fall and Stratton 1984:34).
Fishing took place downstream from the bridge over the Copper River at Chitina to the subdistrict boundary, approximately 200 yards upstream of Haley Creek. There was no use of privately-owned or traditional fish camps; many participants arrived in campers (Stratton 1982:56).
Use of fish wheels in the Glennallen Subdistrict remains governed by factors such as kinship relations, traditional rules of access to fishing sites, and land ownership patterns that restrict access so that fish wheels are concentrated in a few areas (Simeone and Fall 1996:69–71). Many of the fish wheel sites listed in Table 16 and shown in figures 40 and 41, such Chistochina, Gulkana, Tazlina, and Copper Center Village, have been occupied since the 1920s. Figure 40 shows the disposition of subsistence permits at major fish wheel sites along the west bank of the Copper River. Note that in only a few places along the Copper River is public property available for nonlocal fishers to put in a fish wheel. Areas with public access include the Chitina Bridge, the Chitina Airport, Gakona (which has a Bureau of Land Management easement), and Slana.
Fewer traditional fish camps are used today than in the early 1980s and before. Most people take their fish home to process rather than leave them at the fish wheel site where they might be stolen. There are a few fishing sites that “belong” to some Ahtna families and these are frequently inherited. As reported in Figure 42, in 2000 when asked if their family owned their fish site, 49% of local residents in the sample answered “yes.” Correspondingly, a large percentage of interviewed Glennallen Subdistrict fish wheel users (42%; this includes any community of residence) and Glennallen Subdistrict subsistence permit holders (35%; any community of residence and either gear type) said their family owned the fishing site. No one interviewed who fished in the Chitina Subdistrict said they owned a site.

27
Table 16.–Percentage of total permits and location of fish wheels, Glennallen Subdistrict, 1995 and 2001.
Place 1995 2001 Batzulnetas 0.7% none Slana 7.0% 12.8% Chistochina 1.9% 1.0% Gakona 8.0% 3.5% Gulkana 4.0% 3.0% Copperville 22.0% 16.1% Tazlina 5.0% 6.6% Copper Center Village 5.0% 3.0% Copper Center Loop 14.0% 9.8% Chitina Airport 10.0% 13.1% Chitina Bridge 14.0% 21.5% Note In addition, in 2001, one federal permit was issued for the Batzulnetas fishery.
CRITERION 5 Criterion 5. A means of handling, preparing, preserving, and storing fish or game that has been traditionally used by past generations, but not excluding recent technological advances where appropriate. Table 17 presents information relating to Criterion 5 that was provided to the BOF in 1984, and was summarized for the 1996 BOF meeting. We had no updated systematic data on this topic for dipnetters when the BOF revisited the C&T determination in 1999. See the case studies in Simeone and Fall (1996:74–80) for examples from local fish wheel users in the mid 1990s. These case studies document patterns of preparing and preserving salmon like those earlier described by Stratton (1982).
Table 17.–Information pertaining to Criterion 5 provided to the BOF by ADF&G, 1984.
Glennallen Subdistrict Chitina Subdistrict Most Basin fish wheel operators used a combination of methods to preserve their salmon harvest, including canning (63%), freezing (59%), smoking (52%), drying (45%), kippering (13%), and salting (11%).
Interviews conducted in 1982 found that freezing was used most frequently by dipnetters. About 46% smoked at least a portion of their catch; only 2% dried salmon (Stratton 1982:57–58).
Figure 44 shows that participants in the Glennallen Subdistrict subsistence fishery continue to prepare their salmon in a wider variety of ways, including drying, freezing, smoking, salting, canning, and kippering, than do those participating in the Chitina Subdistrict fishery. Appendix A in Simeone and Kari 2002 is a photographic essay that illustrates traditional methods used by local subsistence fish wheel operators to process salmon. Most Chitina Subdistrict fishers, on the other hand, only freeze or smoke their fish.
In the early years of the dip net fishery, many participants in the fishery canned their fish at the fishing site. A dipnetter who fished at O’Brien Creek in the 1950s remembered canning fish at the mouth of the creek and then hauling the cans out in a duffel bag. But today, as survey data indicate, freezing has become the most popular method for preserving salmon among dipnetters. One dipnetter described how he used to can fish but now he uses vacuum packaging equipment and then freezes them.

28
Two hundred fish is a lot of fish. We had, I think, twelve ice chests full of fish, and we had some of those great big ice chests that hold lots and lots of fish. It’s a major amount of work to go down there and take care of two hundred fish and then bring them home. Then you’ve got to take them, lately we’ve been, several years ago I bought one of them vacuum packing things and we go out here and filet fish, vacuum pack them and freeze them. Years before I had a canner. My wife likes them primarily, and she’s the main fish eater. I like salmon but she loves it, she’s the main fish eater. She likes them canned in jars, in mason jars and so we have done a lot of that. And I learned early to can them in mason jars and some people even take their jars and stuff down to O’Brien Creek and sit there and process there fish right there and do it that way.
Other long time dipnetters said they still can some fish and tend to use both the meat and heads. One Fairbanks resident who has been fishing at Chitina since the 1950s said he still cans most of his salmon:
Like last summer I did most of the canning. I did 123 pints, I did 40 of those 303 cans, and I did 18 10-ounce jars. Those are the ones that oysters come in. What I do is usually when I trim the belly or something that doesn’t fit in the can, I stick them in those because I’ll just take one of them out and just sit there and eat it. I like those bellies and that front part that’s got the fin on it, the cheeks. That’s my favorite, you know, and gosh I see people down there cutting off those cheeks and throwing them away. They’re throwing the best part of the fish away.
CRITERION 6 Criterion 6. A pattern a taking or use that includes the handing down of knowledge of fishing or hunting skills, values, and lore from generation to generation. Table 18 presents information relating to Criterion 6 that was provided to the BOF in 1984, and was summarized for the 1996 BOF meeting. Updated information for Copper Basin fish wheel users appears in the case studies summarized by Simeone and Fall (1996:74–80) and matches the information reported earlier by Stratton (1982). See also Simeone and Kari (2002) for summaries of Ahtna traditional knowledge of Copper River salmon.
Table 18.–Information pertaining to Criterion 6 provided to the BOF by ADF&G, 1984.
During the gold rush of 1898–1899, thousands of prospectors poured through the Copper River basin on their way to the Klondike; several recorded their observations of Ahtna fishing techniques. Although they often viewed the Ahtna technology as primitive, some, such as Joseph Bourke in 1898 8, caught salmon using an Ahtna dip net before moving on.
As noted previously, the Ahtna and other Copper Basin residents shifted from using dip nets to using fish wheels in the 1910s. As also noted earlier, longtime Fairbanks residents interviewed in October 2000 said that Fairbanks-based dipnetting at Chitina began in the late 1930s and they became involved through
8 Manuscripts archived at the Valdez Museum & Historical Archive, Valdez, Alaska. http://valdezmuseum.org
Glennallen Subdistrict Chitina Subdistrict Among Basin fish wheel operators, fishing groups tended to be composed of relatives (73% in 1982). Knowledge of fish wheel operation and salmon preservation methods was passed down within extended families (Stratton 1982:40).
As noted under Criterion 1, most dipnetters were relatively new to the fishery in the early 1980s. Frequently, their initial involvement stemmed from word-of-mouth reports in their home towns and on military bases (Stratton 1982:54).

29
word of mouth. They also reported that in the late 1940s they learned from a local Chitina Alaska Native man named Paddy King that Salmon Point was a location where salmon could be harvested with a dip net. Several key informants also said that their children and grandchildren now fish at Chitina. One man counted the number of children and grandchildren who fish at Chitina. He said all 5 of his grandchildren
have been there, so we’ve got two son-in-laws and I’ve got two daughters, and the wife and I. So there’d be eleven of us right close, but then there’s Clem and his wife, who are relatives of ours, and there are six of them. They’ve got four kids, so there’s six of them, that’s seventeen that are directly related, you know.
Figure 45 shows that many Glennallen Subdistrict fishers who were interviewed learned how to fish in the Copper River from their parents (38%) or another relative (28%). Most Chitina Subdistrict fishers said they taught themselves (43%) or learned from friends (44%). Figure 46 shows a pattern similar to that depicted in Figure 45, indicating that most Chitina Subdistrict fishers learned about the fishery through word of mouth (42%) or from friends (48%). Interviewed Glennallen Subdistrict fishers were far more likely to have learned about the fishery from relatives (41%).
CRITERION 7 Criterion 7. A pattern of taking, use, and reliance where the harvest effort or products of that harvest are distributed or shared, including customary trade, barter, and gift-giving. Table 19 presents information relating to Criterion 7 that was provided to the BOF in 1984, and was summarized for the 1996 BOF meeting. The household survey pertaining to 1987–1988 conducted among Copper Basin households again found salmon to be one of the most commonly shared resources. As noted in Simeone and Fall (1996), it was very common for Copper Basin residents to share use of their fish wheels with others from local communities and from outside the Basin. Several Fairbanks residents interviewed for the 2000 project and who participated regularly in the Chitina dip net fishery said that they commonly shared salmon with family and friends. For example, one man said that he shared his fish
with lots and lots of people in Fairbanks. And, part of that, the fish from last year were used in some potlatches and they were used by some searchers: they had a Native guy that drowned down here in the Chena River and they spent two weeks looking for him and Harry came over and told me and said “Hey, I’m using your fish for to feed those guys that are searching.”
Another man said that he shared with elderly people who could not fish or hunt for themselves:
I can remember coming in here with about maybe close to two hundred fish. I mean, you could have all you wanted, you know, and none of them went to waste. We had a lot of old timers who couldn’t do it anymore. We’d give everybody fish.
Table 19.–Information pertaining to Criterion 7 provided to the BOF by ADF&G, 1984.
Glennallen Subdistrict Chitina Subdistrict Sharing of salmon was found to be common among Copper Basin families; salmon was an important food served at potlatches (Stickney and Cunningham 1980:13; Stratton and Georgette 1984).
A minority (44%) of nonlocal residents who participated in the Copper River fishery (most of whom fished with dip nets at Chitina) shared salmon with relatives or friends outside their household. This was likely related in part to relatively low harvests (Stickney and Cunningham 1980:13–14).
Figures 47 through 51 show the results of the 2000 survey and compare and contrast some characteristics of sharing of participants in the Copper River subsistence salmon fisheries. A majority of interviewed Glennallen Subdistrict fishers (86%) and Chitina Subdistrict fishers (80%) said they shared their catch

30
(Figure 47), and about the same percentages said they shared with family members outside their households: 89% for the Glennallen Subdistrict and 72% for the Chitina Subdistrict (Figure 48). Most fishers also shared with friends: 62% of Glennallen Subdistrict fishers and 71% of Chitina Subdistrict (Figure 49). When asked if they shared with other nonrelatives (for example, elders or people with whom they were not well acquainted), 27% of Glennallen Subdistrict fishers said they did, compared to 3% of Chitina Subdistrict fishers (Figure 50). When asked how much of their catch they shared, Glennallen Subdistrict fishers tended to share half or more (55%) while Chitina Subdistrict fishers tended to share less than half (74%) (Figure 51).
CRITERION 8 Criterion 8. A pattern that includes taking, use, and reliance for subsistence purposes upon a wide diversity of the fish and game resources and that provides substantial economic, cultural, social, and nutritional elements of the subsistence way of life. Table 20 presents information relating to Criterion 8 that was provided to the BOF in 1984, and was summarized for the 1996 BOF meeting.
Table 20.–Information pertaining to Criterion 8 provided to the BOF by ADF&G, 1984.
Glennallen Subdistrict Chitina Subdistrict Salmon comprised a large portion of many Basin households’ supplies of food. Most fishing and hunting by Basin households took place within the Basin. Few Basin households participated in salmon fisheries in other parts of the state (Fall and Stratton 1984:39,51). In Copper Basin communities, the monetary sector of the local economy was largely confined to government services, tourism, and construction. Wage employment was predominately seasonal, and mean household incomes were low (Fall and Stratton 1984:48).
Non-Basin participants in the Copper River subsistence fishery largely harvested other resources outside the Basin; in 1982, 37% of dipnetters interviewed also used salmon fisheries outside the Basin (Fall and Stratton 1984:51). In 1979, nonlocal participants in the Copper River subsistence fishery (most of whom fished with dip nets at Chitina) reported more full time wage employment, more employed household members, and higher monetary incomes that did Basin residents (Stickney and Cunningham 1980:10–11).
Figure 52 shows that 74% of the interviewed Glennallen Subdistrict fishers, compared to 63% of Chitina Subdistrict fishers, said that salmon was very important in their diet. Few of those interviewed from either subdistrict ranked salmon as “not very important” to their diet. Asked about the significance of wild foods to their diet, 80% of Glennallen Subdistrict fishers said they were very important, compared to 60% of Chitina Subdistrict fishers (Figure 53).
As shown in Figure 54, 62% of the interviewed participants in the Glennallen Subdistrict subsistence fishery held some form of cash employment in 2000, 17% were retired, and the remainder (21%) had no job. Most Chitina Subdistrict fishers were employed (87%) and most of the rest were retired (11%). In both fisheries, of those who held employment, most were employed full time: 86% of interviewed Glennallen Subdistrict fishers and 93% of those fishing in the Chitina Subdistrict (Figure 55).
However, differences in the economies of the Copper River Basin and more urbanized areas of the state were reflected in responses to the 2000 survey. This is important for evaluating the relative economic importance of the Copper River fisheries, as called for under Criterion 8. As noted previously, most local residents fish in the Glennallen Subdistrict with fish wheels, and this use pattern was the basis for previous BOF findings in support of a positive C&T finding for that subdistrict; the vast majority of participants in the Chitina Subdistrict fishery live in more populous and developed areas of the state. When asked if they were employed full time, part time, or seasonal, just 53% of local residents said they were employed full time, compared to 94% of nonlocal residents. More local residents were employed

31
part time (18%) or seasonally (29%) than were nonlocal residents (2% part time and 4% seasonally) (Figure 56). When asked if they took time off from work to fish, 23% of local residents said yes, compared to 50% of nonlocal residents (Figure 57). When the survey responses are sorted by subdistrict, 30% of Glennallen Subdistrict fishers said yes, as did 51% of Chitina Subdistrict fishers (Figure 58). This means that most local residents did not have full time jobs from which to take time off, or, because of the proximity of their fishing sites to their homes and places of work, that taking time off was not necessary. This suggests that subsistence fishing in the Glennallen Subdistrict is integrated into the round of economic activities in the Copper River Basin, in contrast to the predominant pattern in the Chitina Subdistrict, where fishing is more likely to be a break from work activities (see Wolfe and Ellanna 1983:256).
Survey respondents were asked “How many salmon would you like to be able to harvest?” Figure 57 reports the respondents by 3 groups: participants in the Chitina Subdistrict dip net fishery, the Glennallen Subdistrict dip net fishery, and the Glennallen Subdistrict fish wheel fishery. The most frequent responses for Chitina dipnetters were 21 to 30 salmon (43%) and 31 to 40 salmon (32%). For dipnetters who chose to fish in the Glennallen Subdistrict, the most frequent responses were 41 to 50 salmon (21%), and 101 to 200 salmon (18%). Participants in the Glennallen Subdistrict fish wheel fishery had the highest harvest goals, with the largest number (38%) saying they would like to harvest 401 to 500 salmon.
Salmon harvests in the Chitina Subdistrict may be compared with those of other personal use and subsistence salmon fisheries in Alaska as one means to assess whether the use patterns of these stocks exhibit “reliance” on a “subsistence way of life.” (The following information may also be relevant to Criterion 1). For this discussion, annual average harvests of salmon in pounds usable weight per fishery participant for the period 1998 through 2007 were estimated, using methods described in Appendix D.
Figure 60 depicts the average harvest of salmon in pounds dressed weight per permit for the 10-year period from 1998–2007 for subsistence and personal use fisheries. The average for the Chitina Subdistrict dip net fishery for this time period was 68 pounds per permit. This average is very similar to other personal use salmon fisheries, including Kachemak Bay (65 pounds per permit), Tanana River (65 pounds per permit), and the Kenai Peninsula (Kenai River, Kasilof River, and Fish Creek fisheries) (63 pounds per permit), as well as the federal subsistence fishery in the Chitina Subdistrict (72 pounds per permit). Most personal use salmon fisheries are subject to a statewide seasonal limit of 25 salmon for a household head and 10 salmon for each additional household member (5 AAC 77.525(c)).
The average harvest per permit for all state subsistence salmon fisheries from 1998–2007 was 332 pounds, with a range from 549 pounds per permit for the Bristol Bay fishery to 67 pounds per permit for the Copper River Flats fishery. There is a wide range of harvest limits for subsistence salmon fisheries, ranging from no limits (Bristol Bay, Kuskokwim, and Yukon, for example) to daily bag limits (portions of the Southeast Region).
All of the state subsistence salmon fisheries in Figure 60 have positive C&T determinations, as established by the BOF. The relatively low average harvests per permit for certain fisheries may be explained by local ecological or regulatory circumstances, which should be reviewed when comparing the fisheries in this figure for consideration of criteria 1 and 8. For example, the salmon fisheries in the Unalaska and Adak districts focus on relatively small local stocks, and residents of communities that use these salmon fisheries traditionally take more Pacific halibut Hippoglossus stenolepis than salmon. The Seldovia fishery is capped at a maximum harvest of 200 Chinook salmon (5 AAC 01.560(b)(8)(C)). Subsistence fishing openings in the Copper River Flats fishery near Cordova coincide with commercial openings. Because a large percentage of Cordova households participate in the commercial salmon fishery, they do not participate in the subsistence fishery, but rather remove salmon from their commercial harvests for home use. The BOF recognized this pattern when it established 2 ANS ranges for the subsistence fishery: a lower range when the harvestable surplus of salmon allowed for a commercial fishery, and a higher range for years when no commercial salmon fishery occurred (5 AAC 01.616(b)(2)).

32
The harvest estimates for Southeast Alaska include fisheries that occur under both subsistence and personal use regulations, because a single permit is issued for both categories of fishery and harvest estimates do not distinguish between the two. Also, subsistence salmon fisheries in Southeast Alaska are subject to daily bag and possession limits, and underreporting of harvests in these fisheries probably occurs (Fall et al. 2009).
In Figure 61, average salmon harvests in subsistence and personal use fisheries from 1998–2007 are reported in pounds per capita per permit in order to compare them with national food consumption data. The average harvest per capita per permit harvest for the Chitina Subdistrict dip net fishery was 25 pounds, very similar to the other 3 salmon personal use fisheries depicted in the figure. This represents about 12% of the average annual consumption of meat, fish, and poultry in the United States in 2006 (about 201 pounds per person) (U. S. Census Bureau 2010), compared to 60% for all state subsistence salmon fisheries combined (Figure 62).

33
FIGURES

34
[intentionally blank]

35
Figure 1.–Map of the Copper River drainage.

36
Figure 2.–Location of Glennallen and Chitina subdistricts.

37
Figure 3.–Regulatory classification of Chitina subdistrict salmon fishery: prestatehood to 2009.

38
Figure 4.–Population of the Copper Basin and adjacent road-connected areas, 1960 to 2009.

39
Figure 5.–Change in population by decade, Copper Basin, selected road-connected areas, and Alaska.

40
Figure 6.–Some attested Ahtna villages, fishing stations, and places, lower Copper River.
Sources Kari 1986; Reckord 1983b; Kari 1983.

41
Figure 7.–Location of fish wheels in the Chitina area, 1958, 1967, 1968, and 1974.
Source ADF&G Division of Commercial Fisheries.

42
Figure 8.–1975 fish wheel locations, lower Copper River.
Source ADF&G Division of Commercial Fisheries.

43
Figure 9.–1977 fish wheel locations, lower Copper River.
Source ADF&G Division of Commercial Fisheries. Note Regulation changes: BOF creates the Chitina and Glennallen subdistricts. Limit imposed on fish wheels
operating in the Chitina Subdistrict: they can fish Tuesday through Thursday and Friday through Sunday.

44
Figure 10.–1978 fish wheel locations, lower Copper River.
Source ADF&G Division of Commercial Fisheries.

45
Figure 11.–Number of state and federal permits issued, Chitina subdistrict, 1960–2009.

46
Figure 12.–Estimated harvest of salmon, state and federal permits, Chitina subdistrict, 1960–2009.

47
Figure 13.–Chitina subdistrict: average number of salmon harvested per dip net permit (state and federal), 1961–2009.

48
Figure 14.–Number of state and federal permits issued, Glennallen subdistrict, 1960–2009.

49
Figure 15.–Estimated harvest of salmon, state and federal permits, Glennallen subdistrict, 19602009.

50
Figure 16.–Glennallen subdistrict: average number of salmon harvested per permit, 1964–2008.

51
Figure 17.–Number of permits issued, Chitina and Glennallen subdistricts, 1960–2009.

52
Figure 18.–Estimated harvests of salmon, Chitina and Glennallen subdistricts, 1960–2009.

53
Figure 19.–Average number of salmon harvested per permit, Chitina and Glennallen subdistricts, 1964–2009.

54
Figure 20.–Residence of Copper River dip net permittees by area, 1982.
Figure 21.–Residence of Copper River personal use dip net permittees by area, 14-year average, 1988–
2001.

55
Figure 22.–Percentage of permit holders by area of residence, Chitina subdistrict state dip net fishery, 1988–2009.

56
Figure 23.–Area of residence of permit holders, Chitina subdistrict state dip net fishery, 1988–2009.

57
Figure 24.–Number of permits issued to Copper Basin residents and other Alaska residents, Glennallen subdistrict, 1988–2009.

58
Figure 25.–Number of subsistence permits by area of residence, Glennallen subdistrict, 1988–2009.

59
Figure 26.–Estimated subsistence salmon harvests by Copper Basin residents and other Alaska residents, Glennallen subdistrict, 1984–2008.

60
Figure 27.–Average subsistence harvest of salmon per permit, by Copper Basin residents and other Alaska residents, Glennallen subdistrict,
1984–2008.

61
Figure 28.–Residence of Copper River fish wheel permittees by area, 1982.
Figure 29.–Residence of Copper River fish wheel permittees, by area, 11-year average, 1991–2001.

62
Figure 30.–Place of residence of Glennallen subdistrict dip net permit holders, 1991–2001.

63
Figure 31.–Gear of choice by area of residence, 1982 and recent 14-year average, upper Copper River subsistence and personal use fisheries
(combined).

64
Figure 32.–Subdistrict fished, Copper River subsistence fishery participants, 2000.

65
Figure 33.–Length of Alaska residency, Copper River subsistence fishery participants, 2000.

66
Figure 34.–Number of years since first participation in the fishery, Copper River subsistence fishery participants, 2000.

67
Figure 35.–“How often do you fish in the Copper River?”; asked of subsistence fishery participants, 2000.

68
Figure 36.–Months fished in the Copper River, asked of subsistence fishery participants, 2000.

69
Figure 37.–“What months did you fish in the Copper River?”; asked of subsistence fishery participants, 2000.

70
Figure 38.–Gear type used by surveyed Copper Basin subsistence fishery participants, 2000.

71
Figure 39.–Gear type used by, and regional residence of surveyed Copper River subsistence fishery participants, 2000.

72
Figure 40.–Percentage of total permits of fish wheels, Glennallen Subdistrict, Copper River
subsistence fishery, 1995. Note N=665.

73
Figure 41.–Percentage of total permits and location of fish wheels, Glennallen Subdistrict, Copper River subsistence salmon fishery, 2001. Note N=832.

74
Figure 42.–Disposition of property at fish wheel sites, Glennallen Subdistrict, Copper River
subsistence salmon fishery, 2001.

75
Figure 43.–Answered “yes” to question “Does your fishing site belong to your family?”; surveyed Copper River subsistence fishers, 2000.

76
Figure 44.–“How do you prepare your salmon?”; surveyed subsistence fishers, Copper River subsistence fishery, 2000.

77
Figure 45.–“Who taught you how to fish on the Copper River?”; surveyed subsistence fishers, Copper River subsistence fishery, 2000.

78
Figure 46.–“How did you learn about the Copper River fishery?”; surveyed subsistence fishers, Copper River subsistence fishery, 2000.

79
Figure 47.–“Do you share your catch?”; surveyed subsistence fishers, Copper River subsistence fishery, 2000.

80
Figure 48.–“Do you share with family?”; surveyed subsistence fishers, Copper River subsistence fishery, 2000.

81
Figure 49.–“Do you share with friends?”; surveyed subsistence fishers, Copper River subsistence fishery, 2000.

82
Figure 50.–“Do you share with others (other than family and friends)?”; surveyed subsistence fishers, 2000.
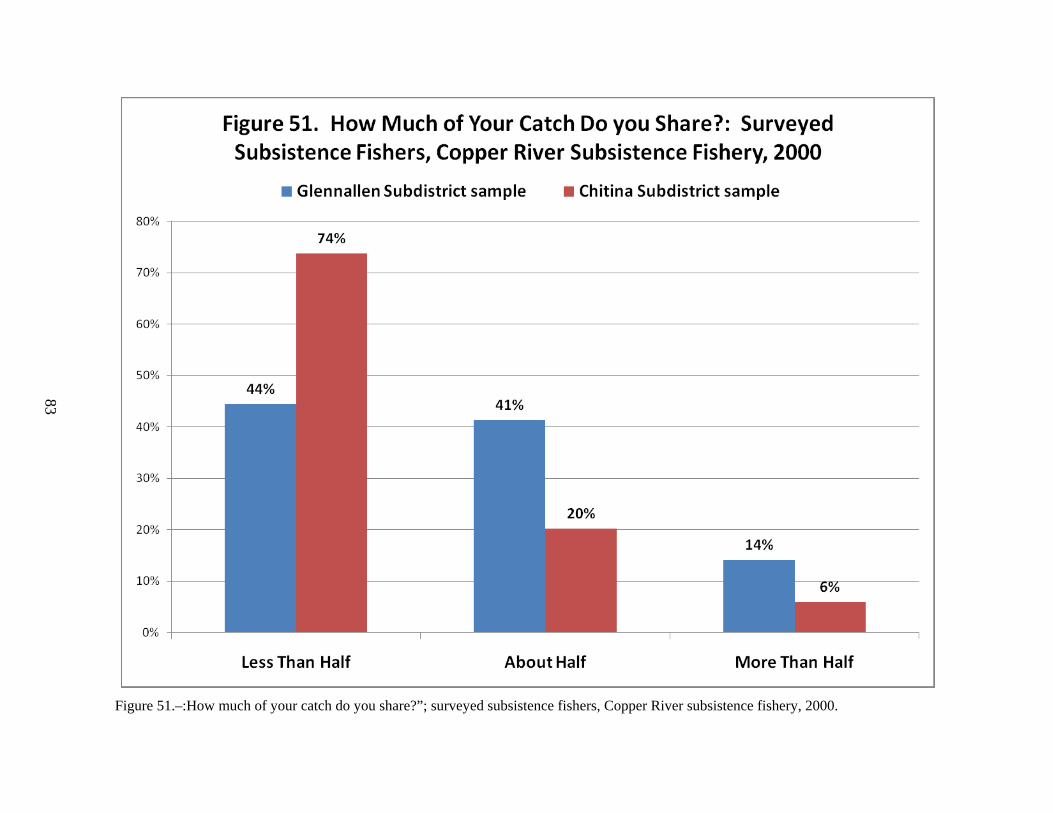
83
Figure 51.–:How much of your catch do you share?”; surveyed subsistence fishers, Copper River subsistence fishery, 2000.

84
Figure 52.–Importance of salmon in the diet of surveyed subsistence fishers, Copper River subsistence fishery, 2000.

85
Figure 53.–Importance of wild foods in the diet, surveyed subsistence fishers, Copper River subsistence fishery, 2000.

86
Figure 54.–Employment characteristics, surveyed subsistence fishers, Copper River subsistence fishery, 2000.

87
Figure 55.–Employment type, surveyed subsistence fishers, by subdistrict, Copper River subsistence fishery, 2000.

88
Figure 56.–Employment type, surveyed subsistence fishers, by residency, Copper River subsistence fishery, 2000.

89
Figure 57.–“Did you take time off of work to fish?”; surveyed subsistence fishers, Copper River subsistence fishery, 2000.

90
Figure 58.–Answered “yes” to question “Did you take off from work to fish?”; surveyed subsistence fishers, Copper River subsistence fishery,
2000.

91
Figure 59.–Answers to the question “How many salmon would you like to be able to harvest?”; by subdistrict and gear type.

92
Figure 60.–Average harvest of salmon, pounds dressed weight per permit, Alaska subsistence and personal use fisheries, 1998–2007.

93
Figure 61.–Average pounds, dressed weight, harvested per capita per permit, Alaska subsistence and personal use salmon fisheries.

94
Figure 62.–Percentage of U.S. average per capita consumption of meat, fish, and poultry provided by salmon harvests in Alaska subsistence
and personal use fisheries (19982007).

95
PLATES

96
[intentionally blank]

97
Plate 1.–Ahtna woman dipnetting salmon from dip net platform, perhaps at Lower Tonsina, approximately 1910.

98
Plate 2.–Chief Eskilida dipnetting salmon from platform.

99
Plate 3.–Chief Eskilida with salmon in dip net.

100
Plate 4.–Ahtna fish wheel at Chitina, 1910s.
Plate 5.–Ahtna subsistence salmon harvest drying at Chitina, 1910s.

101
REFERENCES CITED ADF&G. 1999. ADF&G writer's guide. Alaska Department of Fish and Game, Juneau. ADF&G (Alaska Department of Fish and Game). 1993. Customary and traditional use worksheet II-12: salmon,
Prince William Sound management area (including the Copper River basin). Report prepared for the Alaska Board of Fisheries, January 1993. Alaska Department of Fish and Game Division of Subsistence, Anchorage.
ADF&G Division of Subsistence. 1980. Subsistence: a position paper. Alaska Department of Fish and Game Division of Subsistence Technical Paper No. 66, [Alaska].
http://www.subsistence.adfg.state.ak.us/TechPap/tp066.pdf ADLWD (Alaska Department of Labor and Workforce Development). 2010. Population estimates: place estimates
2000-2009 [Microsoft Excel file]. Research and Development Unit, Alaska Department of Labor and Workforce Development, Juneau. http://laborstats.alaska.gov/?PAGEID=67&SUBID=171
ADOL (Alaska Department of Labor). 1991. Alaska population overview: 1990 census and estimates. Alaska Department of Labor Research and Analysis Section, Juneau.
Baker, S. A. 1921. Report to the Commissioner of Fisheries, Washington, D. C. Department of Commerce, Bureau of Fisheries, Seattle.
Crapo, C., B. Paust, and J. Babbitt. 1993. Recoveries & yields from Pacific fish and shellfish. Marine advisory bulletin #37. University of Alaska Fairbanks Alaska Sea Grant College Program, Fairbanks, Alaska.
de Laguna, F., and C. McClellan. 1981. Ahtna. Pages 641-663 in W. C. Sturtevant, editor. Handbook of the North American Indians, volume 6: Subarctic. Smithsonian Institution, Washington, D.C.
Fall, J. A., C. L. Brown, D. Caylor, S. Georgette, T. Krauthoefer, and A. W. Paige. 2003. Alaska subsistence fisheries 2002 annual report. Alaska Department of Fish and Game Division of Subsistence Technical Paper No. 315, Juneau. http://www.subsistence.adfg.state.ak.us/techpap/tp315.pdf
Fall, J. A. and L. Stratton. 1984. The harvest and use of Copper River salmon: a background report. Alaska Department of Fish and Game Division of Subsistence, Technical Paper No. 96, Anchorage. http://www.subsistence.adfg.state.ak.us/techpap/tp096.pdf
Fall, J. A., M. Turek, and L. Naves. 2009. Overview of amounts reasonably necessary for subsistence uses of salmon in Southeast Alaska. Alaska Department of Fish and Game Division of Subsistence, Special Publication No. BOF 2009-03, Anchorage.
Graef, K., editor. 1999. The milepost: trip planner for Alaska, Yukon Territory, British Columbia, Alberta & Northwest Territories, Spring '99-Spring '00. 51st edition, Vernon Publications, Anchorage.
Gray, G. T. 1990. Memorandum: Chitina dipnet fishery, research request 90.335. Alaska State Legislature Legislative Research Agency, Juneau.
http://archives2.legis.state.ak.us/PublicImageServer.cgi?lra/1990/90-355m.pdf Kari, J., editor. 1983. Ahtna place names list. First edition, compiled by James Kari and Mildred Buck. Copper
River Native Association and the Alaska Native Language Center, [Alaska]. Kari, J. 1986. Tatl'ahwt'aenn Nenn', The headwater people's country. Alaska Native Language Center, Fairbanks. Kari, J. M., editor. 1990. Ahtna Athabaskan dictionary. Alaska Native Language Center, University of Alaska,
Fairbanks. Lonner, T. D. 1980. Subsistence as an economic system in Alaska: theoretical and policy implications. Alaska
Department of Fish and Game Division of Subsistence, Technical Paper No. 67, Anchorage. http://www.subsistence.adfg.state.ak.us/techpap/tp067.pdf NMFS (National Marine Fisheries Service). 1958. Upper Copper River surveys and escapement 1884-1975
annual reports, 1925-1966 file. 1958 annual report, Central District, Prince Wm Sound, Copper River, Bering River, Yakataga (Record Group No. 370). National Marine Fisheries Service of the National Oceanic and Atmospheric Administration-Alaska Region [Alaska].
Reckord, H. 1983a. That's the way we live: subsistence in the Wrangell-St. Elias National Park and Preserve. University of Alaska Anthropology and Historic Preservation, Alaska Cooperative Park Studies Unit Occasional Paper No. 34, Fairbanks.
Reckord, H. 1983b. Where raven stood: cultural resources of the Ahtna region. Occasional paper no. 25, Anthropology and Historic Preservation of the Alaska Cooperative Park Studies Unit, University of Alaska, Fairbanks.
Roberson, K. 1977. A review of the subsistence fishery of the Copper River. Alaska Department of Fish and Game Division of Commercial Fisheries, Prince William Sound Area, [Alaska].

102
References Cited, continued Rollins, A. M. 1978. Census Alaska: Numbers of inhabitants 1792-1970. University of Alaska Anchorage,
Anchorage. Saleeby, B. M. 2000. The quest for gold: an overview of the National Park Service Cultural Resources Mining
Inventory and Monitoring Program (CRMIM). National Park Service, U.S. Department of the Interior, Research/Resource Management Report ARRCR/CRR-2000/37, Anchorage.
Simeone, W. E. and J. A. Fall. 1996. Patterns and trends in the subsistence salmon fishery of the Upper Copper River, Alaska. Report to the Alaska Board of Fisheries, December 1996, Cordova, Alaska. Alaska Department of Fish and Game Division of Subsistence, Anchorage.
Simeone, W. E. and J. A. Fall. 2003. Patterns and trends in the subsistence salmon fishery of the Upper Copper River, Alaska. Part 2 of a report prepared for the U.S. Fish and Wildlife Service by the Alaska Department of Fish and Game Division of Subsistence in collaboration with [the] Copper River Native Association, Cheesh'Na Tribal Council, Chitina Tribal Council, for project no. FIS 00-40., Anchorage.
http://alaska.fws.gov/asm/pdf/fisheries/reports/00-040finalpart2.pdf Simeone, W. E. and J. Kari. 2002. Traditional knowledge and fishing practices of the Ahtna of the Copper River,
Alaska. In collaboration with the Copper River Native Association, Cheesh Na' Tribal Council, Chitina Tribal Council. Prepared for the U.S. Fish and Wildlife Service, Agreement No. 7018101296, project no. FIS 00-40. Alaska Department of Fish and Game Division of Subsistence Technical Paper No. 270, Anchorage. http://www.subsistence.adfg.state.ak.us/techpap/tp270.pdf
Somerville, M. A. 2010. Summary data for the 2009 State of Alaska Upper Copper and Upper Susitna area subsistence, personal use, and sport fisheries. Alaska Department of Fish and Game Division of Sport Fish, Glennallen.
Stickney, A. A. and P. Cunningham. 1980. Report on the survey of permitholders in the Copper River subsistence fishery, 1979. Alaska Department of Fish and Game Division of Subsistence, Technical Paper No. 36, Anchorage. http://www.subsistence.adfg.state.ak.us/techpap/tp036.pdf
Stratton, L. 1982. The dipnet and fishwheel fisheries of the Copper River, 1982. Alaska Department of Fish and Game Division of Subsistence, Technical Paper No. 37, Anchorage.
http://www.subsistence.adfg.state.ak.us/techpap/tp037.pdf Stratton, L. and S. Georgette. 1984. Use of fish and game by communities in the Copper River Basin, Alaska: a
report on a 1983 household survey. Alaska Department of Fish and Game Division of Subsistence, Technical Paper No. 107, Anchorage. http://www.subsistence.adfg.state.ak.us/techpap/tp107.pdf
U. S. Census Bureau. 2010. Table 212: per capita consumption of major food commodities: 1980 to 2007 [Microsoft Excel file]. The 2010 statistical abstract: the national data book: health & nutrition: food consumption and nutrition, Washington, D.C.
http://www.census.gov/compendia/statab/cats/health_nutrition/food_consumption_and_nutrition.html Wolfe, R. J. and L. J. Ellanna, editors. 1983. Resource use and socioeconomic systems: case studies of fishing and
hunting in Alaskan communities. Alaska Department of Fish and Game Division of Subsistence, Technical Paper No. 61, Juneau. http://www.subsistence.adfg.state.ak.us/techpap/tp061.pdf

103
APPENDICES

104
[intentionally blank]

105
APPENDIX A. PROCEDURES AND STATUTES IN EFFECT IN THE 1980S.

106
Appendix A.–Procedures and statutes in effect in the 1980s.

107

108

109

110
[intentionally blank]

111
APPENDIX B. RESULTS OF A SURVEY CONDUCTED IN 2000 AMONG PARTICIPANTS IN THE COPPER RIVER
SUBSISTENCE SALMON FISHERY (WITH AHTNA TABLES).

112
[intentionally blank]

113
Appendix B.–Results of a survey conducted in 2000 among participants in the Copper River subsistence salmon fishery.

114

115

116

117

118

119

120

121

122

123

124

125

126

127

128

129

130

131

132

133

134

135

136

137

138

139

140

141
APPENDIX C. SUMMARY OF HISTORICAL COPPER RIVER DATA PERTAINING TO THE CHITINA AREA.

142
[intentionally blank]

143
Appendix C.–Summary of historical Copper River data pertaining to the Chitina area.

144

145

146

147

148

149
APPENDIX D. CALCULATION METHODS AND TABLES.

150
[intentionally blank]
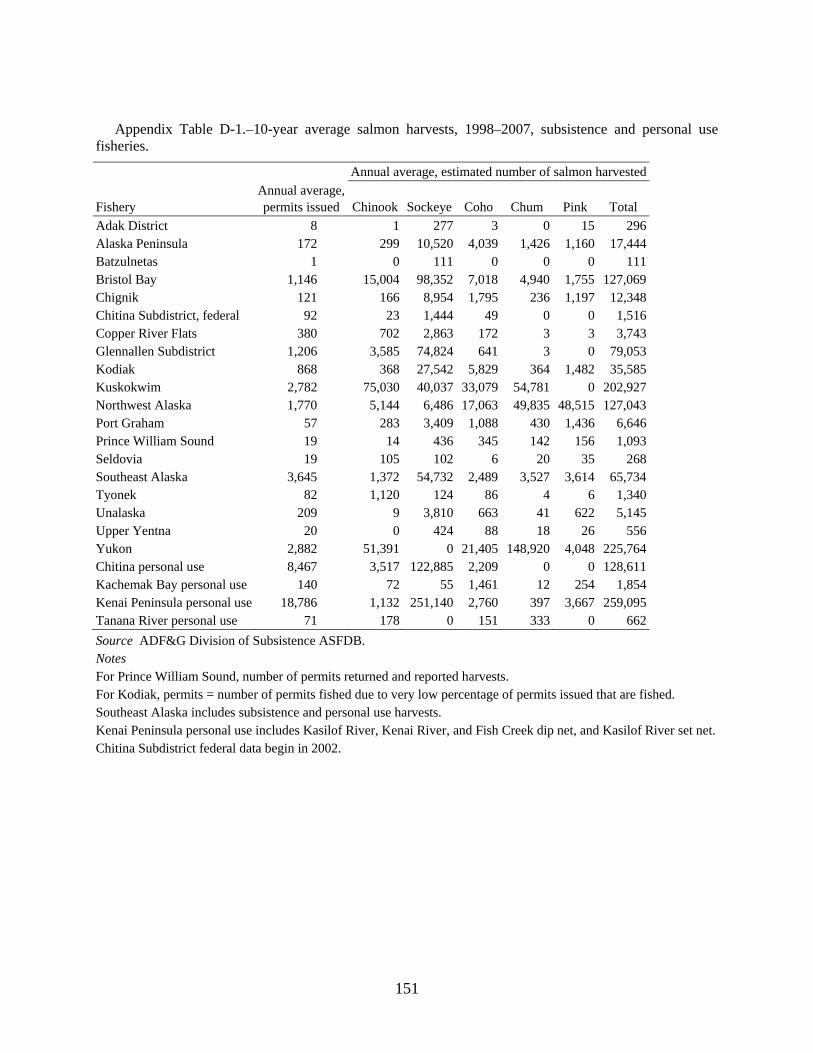
151
Appendix D.–Calculation methods and tables.
Appendix Table D-1.–10-year average salmon harvests, 1998–2007, subsistence and personal use fisheries.
Annual average, estimated number of salmon harvested
Fishery Annual average,permits issued Chinook Sockeye Coho Chum Pink Total
Adak District 8 1 277 3 0 15 296 Alaska Peninsula 172 299 10,520 4,039 1,426 1,160 17,444 Batzulnetas 1 0 111 0 0 0 111 Bristol Bay 1,146 15,004 98,352 7,018 4,940 1,755 127,069 Chignik 121 166 8,954 1,795 236 1,197 12,348 Chitina Subdistrict, federal 92 23 1,444 49 0 0 1,516 Copper River Flats 380 702 2,863 172 3 3 3,743 Glennallen Subdistrict 1,206 3,585 74,824 641 3 0 79,053 Kodiak 868 368 27,542 5,829 364 1,482 35,585 Kuskokwim 2,782 75,030 40,037 33,079 54,781 0 202,927 Northwest Alaska 1,770 5,144 6,486 17,063 49,835 48,515 127,043 Port Graham 57 283 3,409 1,088 430 1,436 6,646 Prince William Sound 19 14 436 345 142 156 1,093 Seldovia 19 105 102 6 20 35 268 Southeast Alaska 3,645 1,372 54,732 2,489 3,527 3,614 65,734 Tyonek 82 1,120 124 86 4 6 1,340 Unalaska 209 9 3,810 663 41 622 5,145 Upper Yentna 20 0 424 88 18 26 556 Yukon 2,882 51,391 0 21,405 148,920 4,048 225,764 Chitina personal use 8,467 3,517 122,885 2,209 0 0 128,611 Kachemak Bay personal use 140 72 55 1,461 12 254 1,854 Kenai Peninsula personal use 18,786 1,132 251,140 2,760 397 3,667 259,095 Tanana River personal use 71 178 0 151 333 0 662 Source ADF&G Division of Subsistence ASFDB. Notes For Prince William Sound, number of permits returned and reported harvests. For Kodiak, permits = number of permits fished due to very low percentage of permits issued that are fished. Southeast Alaska includes subsistence and personal use harvests. Kenai Peninsula personal use includes Kasilof River, Kenai River, and Fish Creek dip net, and Kasilof River set net. Chitina Subdistrict federal data begin in 2002.

152
Appendix Table D-2.–Average harvest per permit in pounds dressed weight by fishery, 10-year average.
Average harvest in pounds dressed weight per permit Average annualpermits issued Chinook Sockeye Coho Chum Pink Total
Adak District 8 1 144 2 0 5 152 Alaska Peninsula 172 16 255 118 44 18 451 Batzulnetas 1 0 463 0 0 0 463 Bristol Bay 1,146 127 370 30 19 4 549 Chignik 121 15 381 83 12 26 517 Chitina Subdistrict federal 92 3 65 3 0 0 72 Copper River Flats 380 29 35 3 0 0 67 Glennallen Subdistrict 1,206 42 259 3 0 0 303 Kodiak 868 3 133 37 2 5 180 Kuskokwim 2,782 277 70 65 99 0 511 Northwest Alaska 1,770 23 20 57 140 56 296 Port Graham 57 73 271 92 41 62 539 Prince William Sound 19 12 106 116 38 20 293 Seldovia 19 82 24 2 6 5 118 Southeast Alaska 3,645 4 71 3 6 3 86 Tyonek 82 202 7 5 0 0 214 Unalaska 209 0 76 16 1 8 101 Upper Yentna 20 0 96 21 5 3 125 Yukon 2,882 224 0 40 237 4 505 Chitina personal use 8,467 6 61 2 0 0 68 Kachemak Bay personal use 140 8 2 50 0 4 65 Kenai Peninsula personal use 18,786 1 61 1 0 0 63 Tanana River personal use 71 32 0 11 22 0 65 All state subsistence fisheries 15,387 111 96 34 82 9 332 All personal use fisheries 27,464 3 60 1 0 0 64 Note Dressed weights based on 2007 average round weights in area commercial fisheries, adjusted by factors
reported in Crapo et al. 1993for “dressed, head off” by species.