Gauging Slacktivism in China: Taking Micro-blog Users as an Example
Upload
the-world-bankCategory
view
329download
0
Africa: Enhancing growth and reducing poverty in a volatile world
Shanta DevarajanWorld Bank
http://blogs.worldbank.org/africacan
Before the global crisis
• Africa was experiencing sustained, relatively rapid economic growth– As fast as all developing countries (except China
and India)

For the first time in 20 years, Africa’s growth is equal to that of developing countries (except China and India)
Per capita income
-4
-2
0
2
4
6
8
1990
1991
1992
1993
1994
1995
1996
1997
1998
1999
2000
2001
2002
2003
2004
2005
2006
2007
2008
Ann
ual c
hang
e in
real
GD
P pe
r ca
pita
(%)
Developing countries Developing countries, excluding China and India
Sub-Saharan Africa High-income countries

Before the global crisis
• Africa was experiencing sustained, relatively rapid economic growth– As fast as all developing countries (except China
and India)– Broad-based: 22 non-oil countries had 4+ percent
average GDP growth from 1998-2008
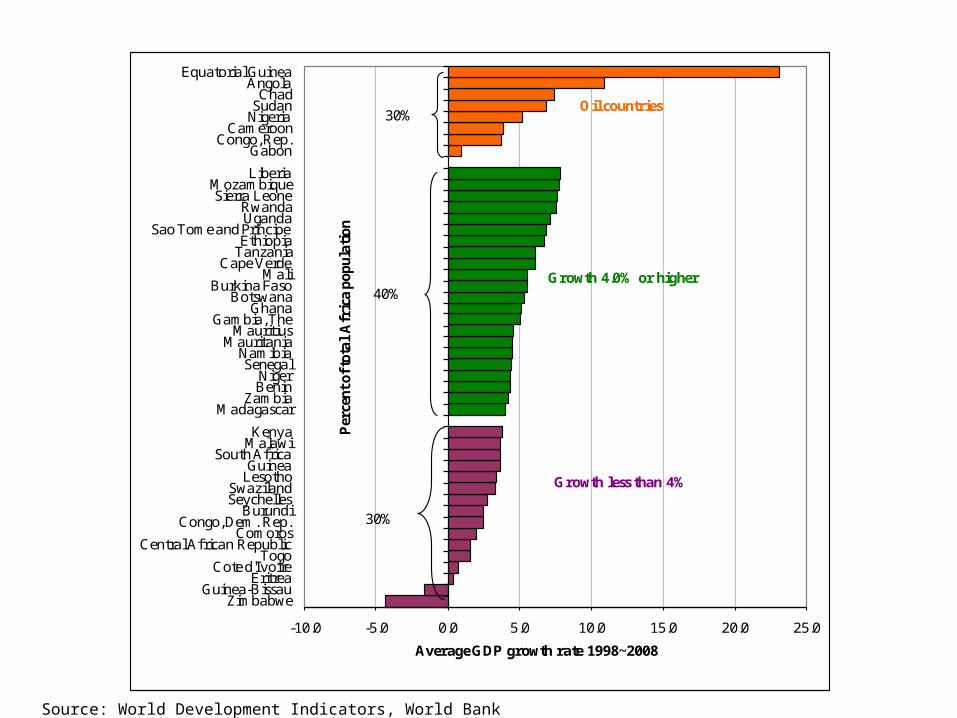
-10.0 -5.0 0.0 5.0 10.0 15.0 20.0 25.0
ZimbabweGuinea-Bissau
EritreaCote d'Ivoire
TogoCentra l African Republic
ComorosCongo, Dem. Rep.
BurundiSeychellesSwaziland
LesothoGuinea
South AfricaMalawiKenya
MadagascarZambia
BeninNiger
SenegalNamibia
MauritaniaMauritius
Gambia, TheGhana
BotswanaBurkina Faso
MaliCape Verde
TanzaniaEthiopia
Sao Tome and PrincipeUgandaRwanda
Sierra LeoneMozambique
LiberiaGabon
Congo, Rep.Cameroon
NigeriaSudanChad
AngolaEquatorial Guinea
Average GDP growth rate 1998~2008
30%
Perc
ent o
f tot
al A
fric
a po
pula
tion
40%
30%
Oil countries
Growth 4.0% or higher
Growth less than 4%
Source: World Development Indicators, World Bank

Before the global crisis
• Africa was experiencing sustained, relatively rapid economic growth– Broad-based: 22 non-oil countries had 4+ percent
average GDP growth from 1998-2008– Due to
• Higher commodity prices• Increases in aid, debt relief and capital flows• Improved macroeconomic policies

Inflation in Africa
1724
29 31 33 31 33 30 3227 28 31 33
13 137 6 6 7 6 5 4 2 3 2 2
0
20
40
60
80
100
120
140
1995
1996
1997
1998
1999
2000
2001
2002
2003
2004
2005
2006
2007
Aver
age
Infla
tion
Rat
e %
0
5
10
15
20
25
30
35
40
45
Num
ber o
f Cou
ntrie
s Inflation>20%
10%<inflation<=20%
Inflation<=10%
Median inflation rate
Although least integrated, Africa may be the worst hit by the crisis
• Private capital flows

Source: IMF, World Economic Outlook, 2008

If FDI flows, more important recently, were to fall, growth would suffer
Europe and Central Asia
Latin America & the Caribbean
Sub Saharan Africa0
5
10
15
20
25
1995-1999
FDI as a percent of fixed investment
Source: World Bank, Global Economic Prospects 2010: Crisis, finance, and growth
Although least integrated, Africa may be the worst hit by the crisis
• Private capital flows• Remittances

Remittances
2006 2007 2008 2009f 2010f$12
$14
$16
$18
$20
$22
$24 Workers' Remittances - SSA
Base Case Low Case
Bill
ions
of U
.S. d
olla
rs
Source: Ratha and Mahopatra (2009)

Although least integrated, Africa may be the worst hit by the crisis
• Private capital flows• Remittances• Tourism

Tourist arrivals(compared with equivalent period in 2008)
Country Percentage change Period
Gambia -32.4 Jan-Apr 09
Tanzania -10.0 Jan-Apr 09
Mauritius -9.9 Jan-Mar 09
Kenya -7.0 Jan-Apr 09
Senegal -6.3 Jan-Apr 09
Source: World Bank staff estimates

Although least integrated, Africa may be the worst hit by the crisis
• Private capital flows• Remittances• Tourism• Primary commodity prices

Terms of trade shocks(change in trade balance as percentage of 2006 GDP)
Bottom 5, 2008Seychelles -13.90Eritrea -11.68Togo -7.79Cape Verde -7.25Senegal -7.07
Top 5, 2008Nigeria 22.92Gabon 28.23Congo, Rep. 30.53Angola 34.77Equatorial Guinea 49.12
Bottom 5, 2009Equatorial Guinea -26.05Angola -19.00Congo, Rep. -17.15Gabon -15.69Nigeria -13.01
Top 5, 2009Ethiopia 1.39
Mauritius 2.44
Togo 3.44
Eritrea 3.39Seychelles 5.92

2007 2008 2009 201014.0
16.0
18.0
20.0
22.0
24.0
26.0
28.0
30.0
Government Revenue in Sub-Saharan Africa
Oil-exporting Coun-treis
Middle-Income Coun-tries
Low-income Countries
Fragile Countries
Gov
ernm
ent R
even
ue, E
xclu
ding
Gra
nts (
% o
f GDP
)
Note: 2008 includes 2008/09 fiscal year; 2009 includes 2009/10 fiscal yearSource: Regional Economic Outlook, IMF (October 2009)

Although least integrated, Africa may be the worst hit by the crisis
• Private capital flows• Remittances• Tourism• Primary commodity prices• Foreign aid
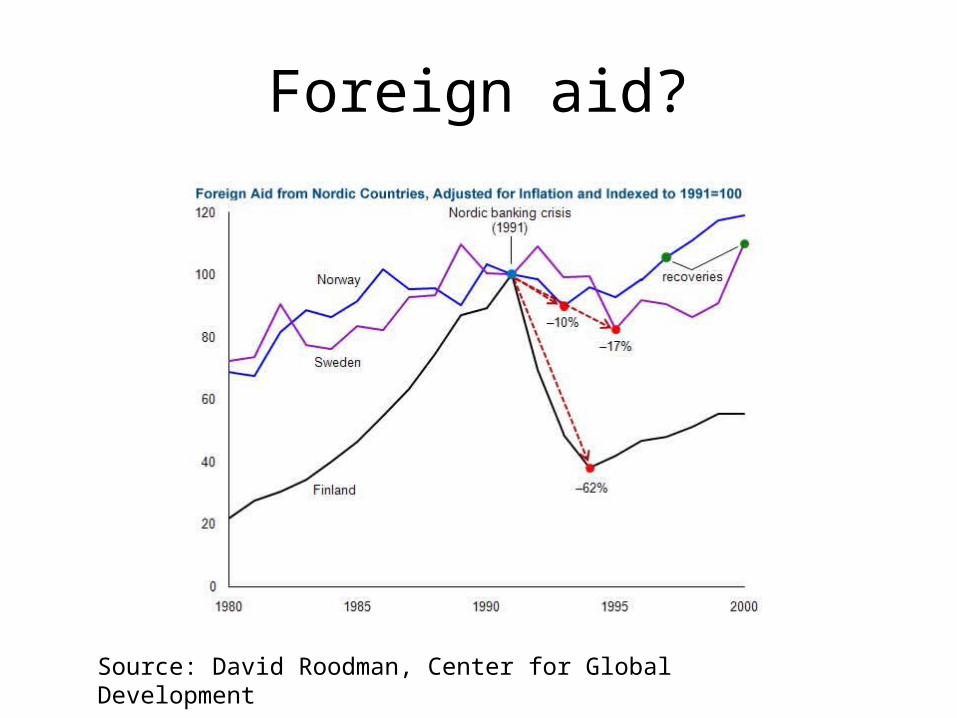
Foreign aid?
Source: David Roodman, Center for Global Development

Impact: Decline in growth
0
1
2
3
4
5
6
Africa Sub-Saharan Africa
2008 (actual)2009 (February forecast)2009 (May forecast)2009 (October forecast)
Source: African Economic Outlook database

Result: Growth declines
• Per capita income declines– For the first time in a decade
• Human crisis– 7-10 million thrown into poverty– 30-50,000 additional children dying before their
first birthday• Possible reversals in economic reforms—
didn’t happen

Revenue, Expenditure and Deficit (relative to earlier projections)
Source: Krumm, Dhar and Choi, “Fiscal Response to the Global Crisis inLow Income African Countries”, August 2009
Fiscal Stance County
Debt Distress Risk
Fiscal Projection Changes
CountryDebt Distress Risk
Fiscal Projection Changes
Revenue Expenditure
Balance(Ex. Grant)
Balance(In. Grant) Revenue Expenditur
eBalance
(Ex. Grant)Balance
(In. Grant)
Fiscal Tightening
Ethiopia Moderate Ghana Moderate
Rwanda Moderate
Partial Adjustment
Mozambi-que Low Uganda Low
No Adjustment Senegal Low Burkina
Faso High
Stimulus
Zambia Low Kenya Low
Tanzania Low
-5
0
5
-0 .5
-4 .1
3.6
2.3
-1.0
0.0
1.0
2.0
0 .31 .1
-0.8
1.3
-2.0
-1.0
0.0
1.0
2.00.5
-1.3
1.9 2.0
-0 .5
-0 .3
-0 .1
0.1
-0.5
-0.1
-0.5
-0.3
-4 .0
-3 .0
-2 .0
-1 .0
0.0
1.0
-2.8-3 .1
0.2
-0.2
-2.5-2.0-1.5-1.0-0.50.00.5
-1.5
0.4
-2 -1.9 -1 .5
-1 .0
-0 .5
0 .0
0 .5
-0 .8
0.0
-1.0
0 .4
-2.0-1.5-1.0-0.50.00.51.0
-1.0
0.8
-1.7
-0.9-2 .0
-1 .0
0.0
1.0
2.0
0.1
1.8
-1.6 -1 .6
-1 .5-1 .0-0 .50.00.51.0
-0 .20 .9
-1.1-1.4

Policy responses
• Time-bound bailout programs– E.g., Tanzania’s emergency rescue program limits
government guarantees and loans to two years• Accelerated reform programs
– E.g., Nigeria is deregulating its downstream petroleum sector, reducing costly and regressive subsidies

Implications
• Policy environment has never been better• External resources are as productive as they
have ever been• Continued reforms and additional resources
could accelerate progress towards the Millennium Development Goals
Africa’s medium-term challenges
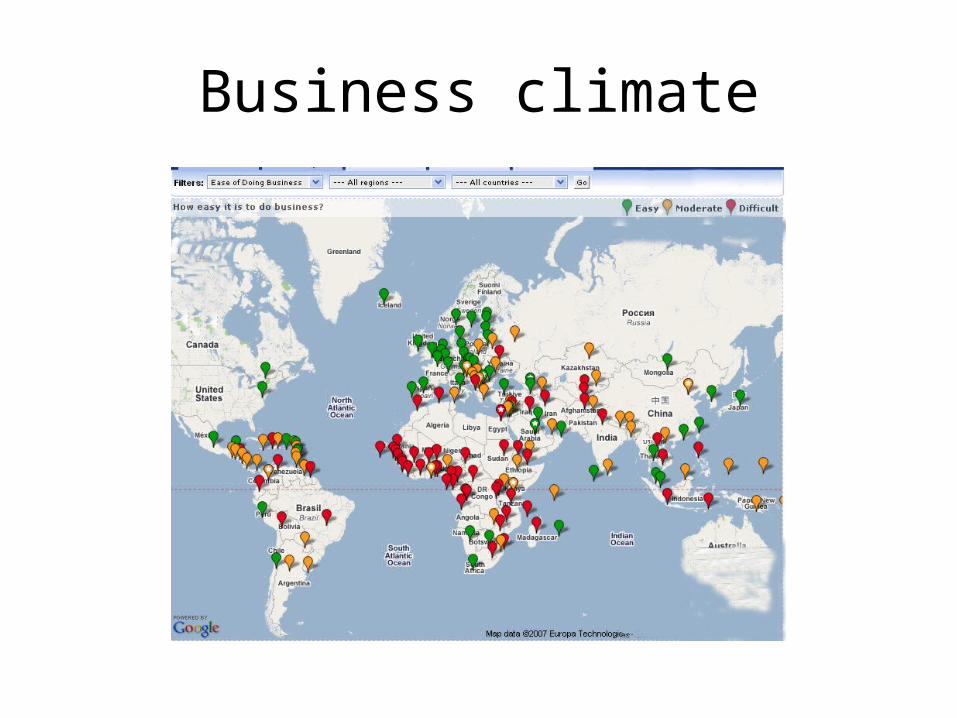
Business climate

Low competitiveness
OECD
Latin America & Caribbean
Middle East & North Africa
East Asia & Pacific
Eastern Europe & Central Asia
South Asia
Sub-Saharan Africa
10.5
18.6
22.5
23.1
26.8
32.4
33.6
Time to export (days)
Source: World Bank, Doing Business Database
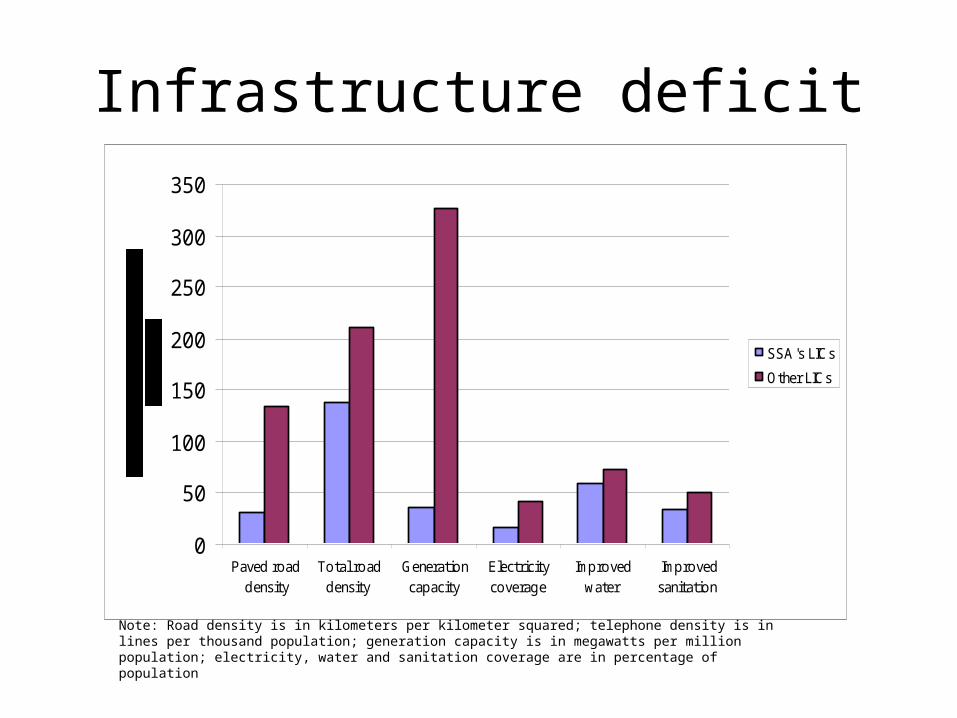
Infrastructure deficit
0
50
100
150
200
250
300
350
Paved roaddensity
Total roaddensity
Generationcapacity
Electricitycoverage
Improvedwater
Improvedsanitation
SSA's LICsOther LICs
Note: Road density is in kilometers per kilometer squared; telephone density is in lines per thousand population; generation capacity is in megawatts per million population; electricity, water and sanitation coverage are in percentage of population

Youth unemployment
Population Pyramid in SSA in 2005 (UN)
10 5 0 5 10
0-4
10-14
20-24
30-34
40-44
50-54
60-64
70-74
80-84
Age
Male (%) Female
Population Pyramid in More developed regions in 2005 (UN)
10 5 0 5 10
0-4
10-14
20-24
30-34
40-44
50-54
60-64
70-74
80-84
Age
Male (%) Female
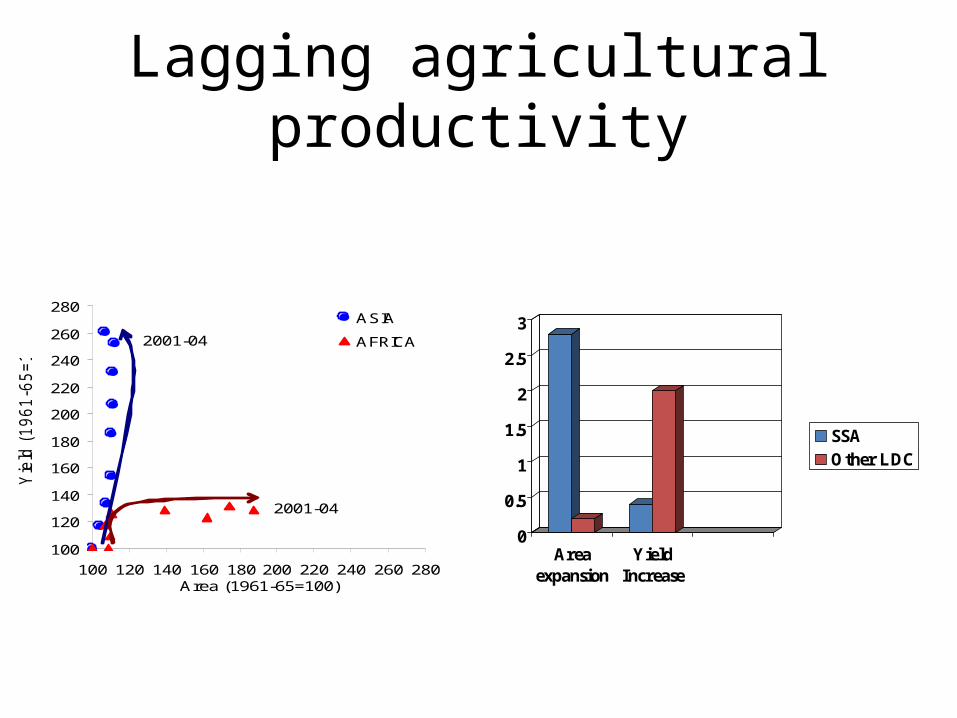
Lagging agricultural productivity
100
120
140
160
180
200
220
240
260
280
100 120 140 160 180 200 220 240 260 280Area (1961-65=100)
Yiel
d (1
961-
65=1
00)
ASIA
AFRICA2001-04
2001-04
0
0.5
1
1.5
2
2.5
3
Areaexpansion
YieldIncrease
SSAOther LDC

Potential Impact of Climate Change on Agriculture: Projected Percentage
Change in Agricultural Productivity in 2080
Note: Scenario: SRES A2.Source: Cline 2007.
Climate Risks and Development: The “Poor Countries’ Danger”

Back to Infrastructure deficit
0
50
100
150
200
250
300
350
Paved roaddensity
Total roaddensity
Generationcapacity
Electricitycoverage
Improvedwater
Improvedsanitation
SSA's LICsOther LICs
Note: Road density is in kilometers per kilometer squared; telephone density is in lines per thousand population; generation capacity is in megawatts per million population; electricity, water and sanitation coverage are in percentage of population

SELECTED CORRIDORS
OF THE STUDY

23.5 4
5 5 57
8
11
02468
101214
Paki
stan
Braz
il
USA
Chi
na
Wes
tern
Euro
pe –
long
dist
ance
Afric
a-D
urba
n-Lu
saka
Afric
a- L
omé
-O
uaga
doug
ou
Afric
a –
Mom
basa
Kam
pala
Afric
a-D
oual
a-N
djam
énaA
vera
ge tr
ansp
ort p
rices
(in
US
cen
ts p
er tk
m)
Central Africa East Africa West Africa Southern Africa France
Variable costs (USD per veh-km) 1.31 0.98 1.67 1.54 0.72
Fixed costs (USD per veh-km) 0.57 0.35 0.62 0.34 0.87
Total transport costs (USD per veh-km) 1.88 1.33 2.29 1.88 1.59
Transport costs are not excessively high in Africa comparing to France for example
However, average transport prices in Africa are high in a global comparison
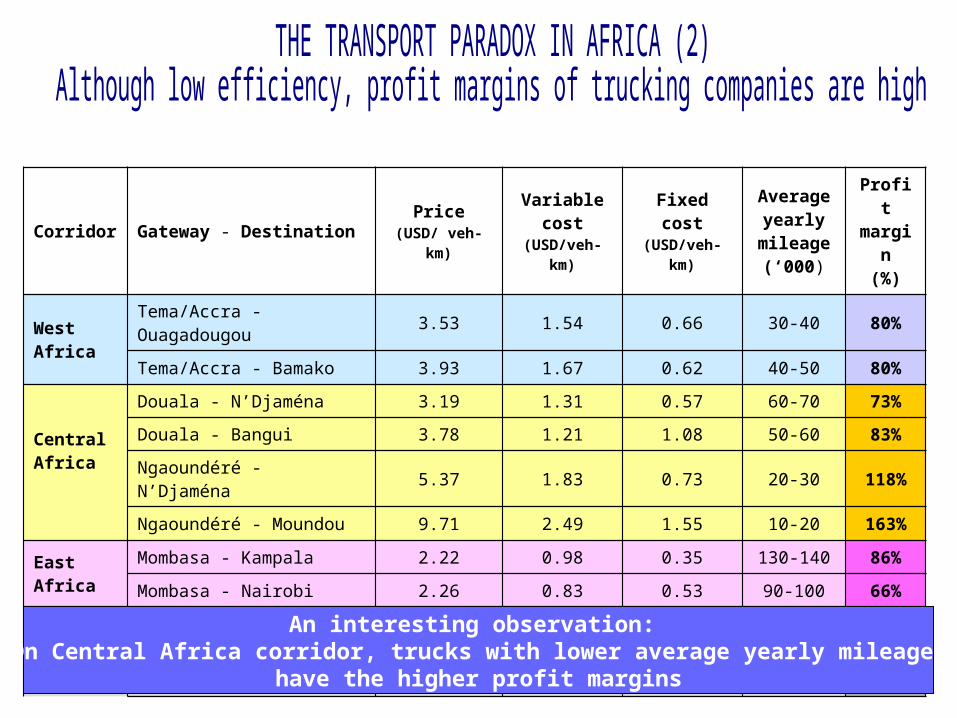
Corridor Gateway - Destination Price(USD/ veh-km)
Variable cost
(USD/veh- km)
Fixed cost(USD/veh- km)
Average yearly
mileage (‘000)
Profit margin
(%)
West Africa
Tema/Accra - Ouagadougou 3.53 1.54 0.66 30-40 80%
Tema/Accra - Bamako 3.93 1.67 0.62 40-50 80%
Central Africa
Douala - N’Djaména 3.19 1.31 0.57 60-70 73%Douala - Bangui 3.78 1.21 1.08 50-60 83%Ngaoundéré - N’Djaména 5.37 1.83 0.73 20-30 118%Ngaoundéré - Moundou 9.71 2.49 1.55 10-20 163%
East Africa
Mombasa - Kampala 2.22 0.98 0.35 130-140 86%
Mombasa - Nairobi 2.26 0.83 0.53 90-100 66%
Southern Africa
Lusaka - Johannesburg 2.32 1.54 0.34 160-170 18%
Lusaka - Dar-es-Salaam 2.55 1.34 0.44 160-170 62%
An interesting observation: On Central Africa corridor, trucks with lower average yearly mileage
have the higher profit margins

Average transport prices (constant and current) from Mombasa to Kigali
0
50
100
150
200
250
300
35019
89
1990
1991
1992
1993
1994
1995
1996
1997
1998
1999
2000
2001
2002
2003
2004
2005
2006
Years
US$
/Ton
0
100
200
300
400
500
600
700
800
900
US$/Ton
Current transport tariffs (left) Real transport tariffs - GDP deflator (right)
After liberalizationBefore liberalization

Africa’s time
• Before the crisis, policies were steadily improving and showing results
• During the crisis, policies continued to improve• Policy environment has never been better• Medium-term challenges, while daunting, can also
be met with a combination of resources and reform• Africa may be poised for sustained, rapid growth, as
India was 20 years ago, and China 30 years ago