
Current water accounts and water quality for the ...
48
A scientific collaboration between the Department of the Environment, Bureau of Meteorology, CSIRO and Geoscience Australia 1 Current water accounts and water quality for the Gloucester subregion Product 1.5 for the Gloucester subregion from the Northern Sydney Basin Bioregional Assessment 9 October 2015
Transcript of Current water accounts and water quality for the ...
A scientific collaboration between the Department of the Environment, Bureau of Meteorology, CSIRO and Geoscience Australia
1 Current water accounts and water quality for the Gloucester subregion Product 1.5 for the Gloucester subregion from the Northern Sydney Basin Bioregional Assessment
9 October 2015
v20151015
The Bioregional Assessment Programme The Bioregional Assessment Programme is a transparent and accessible programme of baseline assessments that increase the available science for decision making associated with coal seam gas and large coal mines. A bioregional assessment is a scientific analysis of the ecology, hydrology, geology and hydrogeology of a bioregion with explicit assessment of the potential direct, indirect and cumulative impacts of coal seam gas and large coal mining development on water resources. This Programme draws on the best available scientific information and knowledge from many sources, including government, industry and regional communities, to produce bioregional assessments that are independent, scientifically robust, and relevant and meaningful at a regional scale.
The Programme is funded by the Australian Government Department of the Environment. The Department of the Environment, Bureau of Meteorology, CSIRO and Geoscience Australia are collaborating to undertake bioregional assessments. For more information, visit http://www.bioregionalassessments.gov.au.
Department of the Environment The Office of Water Science, within the Australian Government Department of the Environment, is strengthening the regulation of coal seam gas and large coal mining development by ensuring that future decisions are informed by substantially improved science and independent expert advice about the potential water related impacts of those developments. For more information, visit http://www.environment.gov.au/coal-seam-gas-mining/.
Bureau of Meteorology The Bureau of Meteorology is Australia’s national weather, climate and water agency. Under the Water Act 2007, the Bureau is responsible for compiling and disseminating Australia's water information. The Bureau is committed to increasing access to water information to support informed decision making about the management of water resources. For more information, visit http://www.bom.gov.au/water/.
CSIRO Australia is founding its future on science and innovation. Its national science agency, CSIRO, is a powerhouse of ideas, technologies and skills for building prosperity, growth, health and sustainability. It serves governments, industries, business and communities across the nation. For more information, visit http://www.csiro.au.
Geoscience Australia Geoscience Australia is Australia’s national geoscience agency and exists to apply geoscience to Australia’s most important challenges. Geoscience Australia provides geoscientific advice and information to the Australian Government to support current priorities. These include contributing to responsible resource development; cleaner and low emission energy technologies; community safety; and improving marine planning and protection. The outcome of Geoscience Australia’s work is an enhanced potential for the Australian community to obtain economic, social and environmental benefits through the application of first class research and information. For more information, visit http://www.ga.gov.au.
ISBN-PDF 978-0-642-70656-0
Citation Rachakonda PK, Zhang YQ, Peña-Arancibia JL and Marvanek SP (2015) Current water accounts and water quality for the Gloucester subregion. Product 1.5 for the Gloucester subregion from the Northern Sydney Basin Bioregional Assessment. Department of the Environment, Bureau of Meteorology, CSIRO and Geoscience Australia, Australia. http://data.bioregionalassessments.gov.au/product/NSB/GLO/1.5.
Authorship is listed in relative order of contribution.
Copyright © Commonwealth of Australia 2015 With the exception of the Commonwealth Coat of Arms and where otherwise noted, all material in this publication is provided under a Creative Commons Attribution 3.0 Australia Licence
http://www.creativecommons.org/licenses/by/3.0/au/deed.en. The Bioregional Assessment Programme requests attribution as ‘© Commonwealth of Australia (Bioregional Assessment Programme http://www.bioregionalassessments.gov.au)’.
Disclaimer The information contained in this report is based on the best available information at the time of publication. The reader is advised that such information may be incomplete or unable to be used in any specific situation. Therefore decisions should not be made based solely on this information or without seeking prior expert professional, scientific and technical advice. The Bioregional Assessment Programme is committed to providing web accessible content wherever possible. If you are having difficulties with accessing this document please contact [email protected].
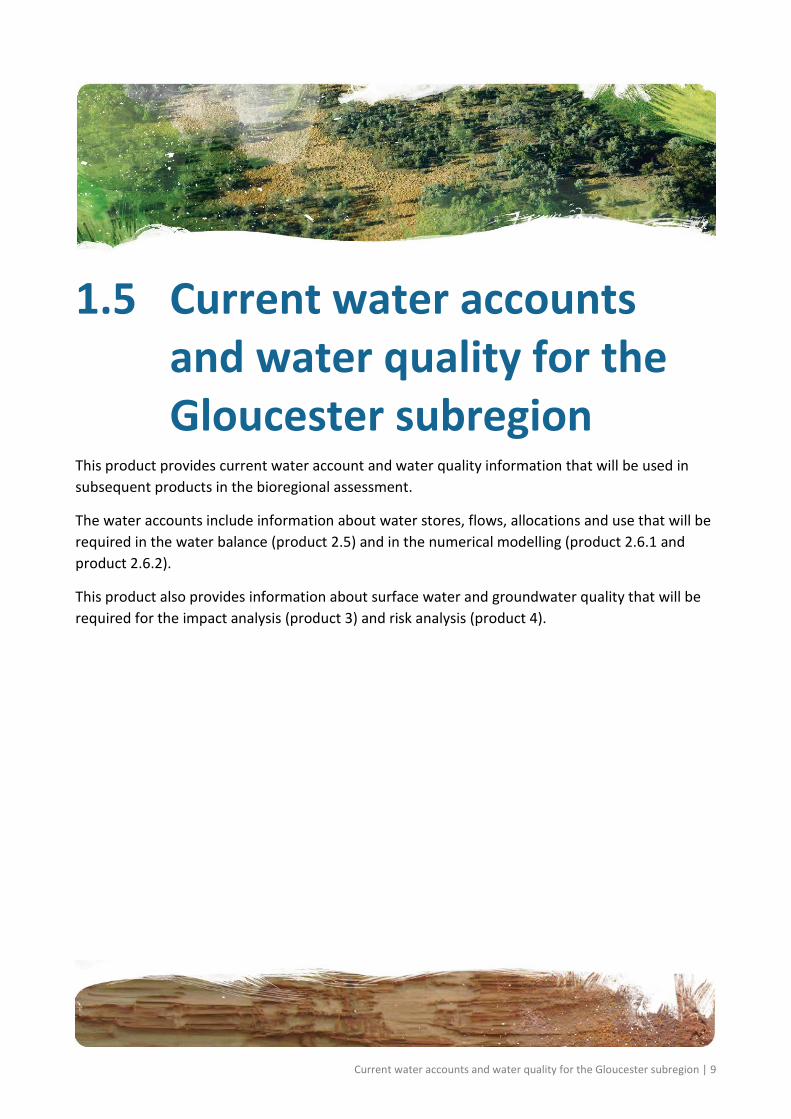
Cover photograph View of the Gloucester valley NSW with the Barrington River and associated riparian vegetation in the foreground and the township Gloucester in the distance looking south from the Kia Ora Lookout, 2013
Credit: Heinz Buettikofer, CSIRO
Current water accounts and water quality for the Gloucester subregion | i
Contents
Contributors to the Technical Programme ................................................................................. iv
Acknowledgements ................................................................................................................... vi
Introduction ............................................................................................................................... 1
The Bioregional Assessment Programme ................................................................................... 1
Methodologies ............................................................................................................................ 3
Technical products ...................................................................................................................... 4
About this technical product ...................................................................................................... 7
References .................................................................................................................................. 7
1.5.1 Current water accounts ................................................................................................... 10
1.5.1.1 Surface water............................................................................................................. 10
1.5.1.1.1 Water accounts in the Gloucester river basin .................................................... 11
1.5.1.1.2 Water accounts in the Karuah river basin .......................................................... 12
1.5.1.1.3 Gaps .................................................................................................................... 13
References ................................................................................................................................ 13
Datasets ................................................................................................................................... 13
1.5.1.2 Groundwater ............................................................................................................. 15
1.5.1.2.1 Current water accounts ...................................................................................... 15
1.5.1.2.2 Water management ............................................................................................ 22
1.5.1.2.3 Gaps .................................................................................................................... 23
References ................................................................................................................................ 24
Datasets ................................................................................................................................... 25
1.5.2 Water quality .................................................................................................................. 27
1.5.2.1 Surface water............................................................................................................. 27
1.5.2.1.1 Water quality in the Gloucester river basin........................................................ 27
1.5.2.1.2 Water quality in the Karuah river basin .............................................................. 28
1.5.2.1.3 Gaps .................................................................................................................... 28
References ................................................................................................................................ 28
1.5.2.2 Groundwater ............................................................................................................. 30
1.5.2.2.1 Total dissolved solids .......................................................................................... 31
1.5.2.2.2 Total dissolved solids distribution ...................................................................... 32
1.5.2.2.3 Trace elements.................................................................................................... 35
1.5.2.2.4 Gaps .................................................................................................................... 37
References ................................................................................................................................ 37
Datasets ................................................................................................................................... 39
ii | Current water accounts and water quality for the Gloucester subregion
Figures
Figure 1 Schematic diagram of the bioregional assessment methodology ......................................... 2
Figure 2 The simple decision tree indicates the flow of information through a bioregional assessment ........................................................................................................................................... 5
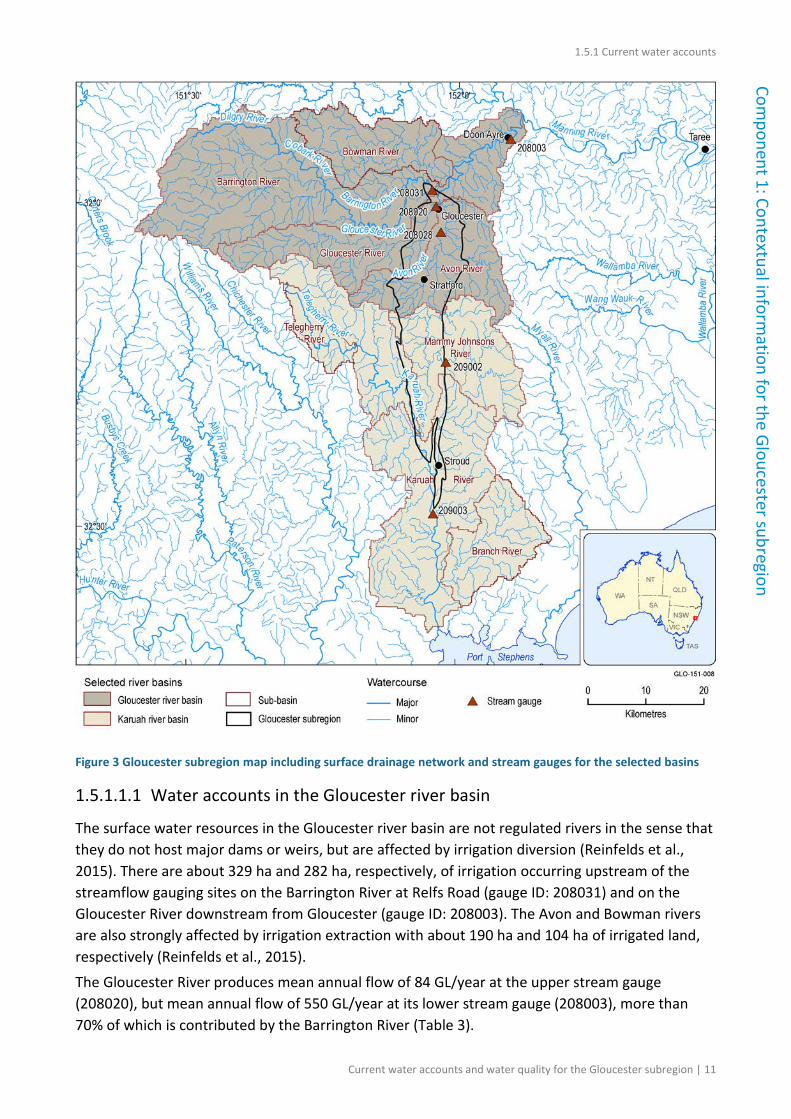
Figure 3 Gloucester subregion map including surface drainage network and stream gauges for the selected basins ............................................................................................................................. 11
Figure 4 Distribution of groundwater licence allocations (ML/year) per bore across the Gloucester subregion ......................................................................................................................... 16
Figure 5 Estimate of groundwater usage per bore across the Gloucester subregion ....................... 18
Figure 6 Distribution of purpose of bores in the Gloucester subregion as per the National Groundwater Information System (NGIS) database .......................................................................... 21
Figure 7 Interpretation showing which aquifer a bore draws groundwater from in the Gloucester subregion ......................................................................................................................... 22
Figure 8 Distribution of total dissolved solids for alluvium aquifers in the Gloucester subregion ... 34
Figure 9 Distribution of total dissolved solids for fractured rock aquifers in the Gloucester subregion ........................................................................................................................................... 36
Current water accounts and water quality for the Gloucester subregion | iii
Tables
Table 1 Methodologies and associated technical products listed in Table 2 ...................................... 3
Table 2 Technical products delivered by the Northern Sydney Basin Bioregional Assessment .......... 6
Table 3 Mean annual flow for major rivers in the Gloucester river basin in the Gloucester subregion ........................................................................................................................................... 12
Table 4 Surface water access licences in the Gloucester river basin in the Gloucester subregion ... 12
Table 5 Mean annual flow for major rivers in the Karuah river basin in the Gloucester subregion . 12
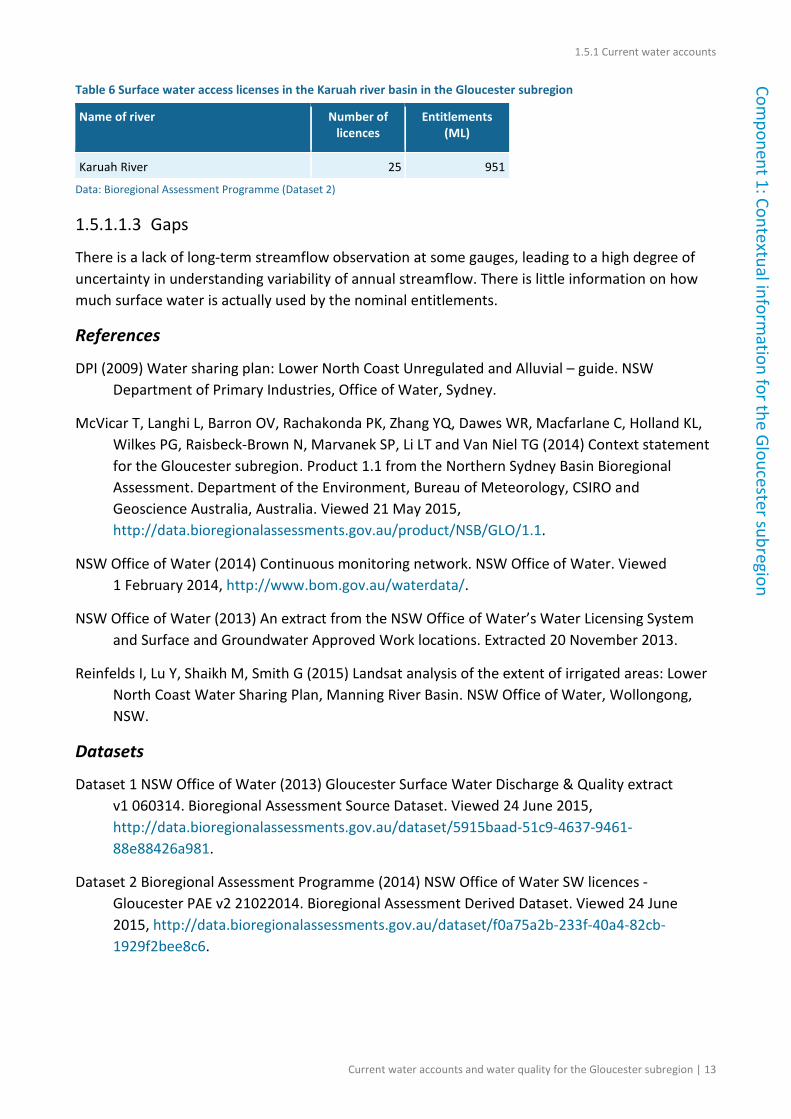
Table 6 Surface water access licenses in the Karuah river basin in the Gloucester subregion ......... 13
Table 7 Groundwater usage by licensed purpose for the Gloucester subregion .............................. 19
Table 8 Groundwater usage per groundwater-bearing unit for the Gloucester subregion .............. 20
Table 9 Groundwater usage per water source area within the Gloucester subregion ..................... 23
Table 10 Total dissolved solids trigger values in the Gloucester subregion ...................................... 31
Table 11 Total dissolved solids range for hydrogeologic units in the Gloucester subregion ............ 31
Table 12 Total dissolved solids exceedance for hydrogeologic units in the Gloucester subregion .. 32
Table 13 Number of analyses and exceedances for trace elements in groundwater of the Gloucester subregion ......................................................................................................................... 35
iv | Current water accounts and water quality for the Gloucester subregion
Contributors to the Technical Programme
The following individuals have contributed to the Technical Programme, the part of the Bioregional Assessment Programme that undertakes bioregional assessments. Leaders are underlined.
Assistant Secretary Department of the Environment: Matthew Whitfort
Programme Director Department of the Environment: Anthony Swirepik
Technical Programme Director Bureau of Meteorology: Bronwyn Ray
Projects Director CSIRO: David Post
Principal Science Advisor Department of the Environment: Peter Baker
Science Directors CSIRO: Brent Henderson
Geoscience Australia: Steven Lewis
Integration Lead Bureau of Meteorology: Richard Mount
Programme management Bureau of Meteorology: Graham Hawke, Louise Minty
CSIRO: Paul Hardisty, Warwick McDonald
Geoscience Australia: Stuart Minchin
Project Leaders CSIRO: Alexander Herr, Tim McVicar, David Rassam
Geoscience Australia: Hashim Carey, Kriton Glenn, Tim Evans, Martin Smith
Bureau of Meteorology: Natasha Herron
Assets and receptors Bureau of Meteorology: Richard Mount, Eliane Prideaux
Department of the Environment: Larry Guo, Glenn Johnstone, Brad Moore, Wasantha Perera, Jin Wang
Bioregional Assessment Information Platform
Bureau of Meteorology: Derek Chen, Trevor Christie-Taylor, Melita Dahl, Lakshmi Devanathan, Angus MacAulay, Christine Panton, Paul Sheahan, Kellie Stuart
CSIRO: Peter Fitch
Department of the Environment: Geraldine Cusack
Geoscience Australia: Neal Evans
Communications Bureau of Meteorology: Karen de Plater
CSIRO: Chris Gerbing
Department of the Environment: Lea Locke, Milica Milanja
Geoscience Australia: Chris Thompson
Current water accounts and water quality for the Gloucester subregion | v
Assistant Secretary Department of the Environment: Matthew Whitfort
Coordination Bureau of Meteorology: Julie Burke, Sarah van Rooyen
CSIRO: Ruth Palmer
Department of the Environment: James Hill, Angela Kaplish, Megan Stanford, Craig Watson
Geoscience Australia: Tenai Luttrell
Ecology CSIRO: Tanya Doody, Brendan Ebner, Kate Holland, Craig MacFarlane, Patrick Mitchell, Justine Murray, Anthony O'Grady, Chris Pavey, Jodie Pritchard, Nat Raisbeck-Brown, Ashley Sparrow, Georg Wiehl
Geology CSIRO: Deepak Adhikary, Luke Connell, Emanuelle Frery, Jane Hodgkinson, James Kear, Manoj Khanal, Zhejun Pan, Kaydy Pinetown, Matthias Raiber, Hayley Rohead-O'Brien, Regina Sander, Peter Schaubs, Garth Warren, Paul Wilkes, Andrew Wilkins, Yanhua Zhang
Geoscience Australia: Stephen Hostetler, Steven Lewis, Bruce Radke
Geographic information systems
CSIRO: Caroline Bruce, Jody Bruce, Steve Marvanek, Arthur Read
Geoscience Australia: Adrian Dehelean
Groundwater modelling CSIRO: Olga Barron, Russell Crosbie, Tao Cui, Warrick Dawes, Lei Gao, Sreekanth Janardhanan, Luk Peeters, Praveen Kumar Rachakonda, Wolfgang Schmid, Saeed Torkzaban, Chris Turnadge, Binzhong Zhou
Hydrogeology CSIRO: Konrad Miotlinski
Geoscience Australia: Rebecca Cassel, Steven Hostetler, Jim Kellett, Jessica Northey, Tim Ransley, Baskaran Sundaram, Gabrielle Yates
Information management Bureau of Meteorology: Belinda Allison, Jill McNamara, Brendan Moran, Suzanne Slegers
CSIRO: Nick Car, Phil Davies, Andrew Freebairn, Mick Hartcher, Geoff Hodgson, Brad Lane, Ben Leighton, Trevor Pickett, Ramneek Singh, Matt Stenson
Geoscience Australia: Luke Caruana, Matti Peljo
Products CSIRO: Maryam Ahmad, Daniel Aramini, Heinz Buettikofer, Simon Gallant, Karin Hosking, Frances Marston, Linda Merrin, Becky Schmidt, Sally Tetreault-Campbell, Catherine Ticehurst
Geoscience Australia: Penny Kilgour, Kathryn Owen
Risk and uncertainty CSIRO: Simon Barry, Jeffery Dambacher, Jess Ford, Keith Hayes, Geoff Hosack, Yang Liu, Warren Jin, Dan Pagendam, Carmel Pollino
Surface water hydrology CSIRO: Santosh Aryal, Mat Gilfedder, Fazlul Karim, Lingtao Li, Dave McJannet, Jorge Luis Peña-Arancibia, Xiaogang Shi, Tom Van Niel, Neil Viney, Bill Wang, Ang Yang, Yongqiang Zhang
vi | Current water accounts and water quality for the Gloucester subregion
Acknowledgements
This technical product was reviewed by several groups:
• Discipline Leaders: Russell Crosbie (groundwater modelling), Neil Viney (surface water hydrology)
• Senior Science Leaders: David Post (Projects Director), Steven Lewis (Science Director, Geoscience Australia), Brent Henderson (Science Director, CSIRO), Becky Schmidt (Products Manager, CSIRO)
• Technical Assurance Reference Group: Chaired by Peter Baker (Principal Science Advisor, Department of the Environment), this group comprises officials from the NSW, Queensland, South Australian and Victorian governments.
Current water accounts and water quality for the Gloucester subregion | 1
Introduction
The Independent Expert Scientific Committee on Coal Seam Gas and Large Coal Mining Development (IESC) was established to provide advice to the federal Minister for the Environment on potential water-related impacts of coal seam gas (CSG) and large coal mining developments.
Bioregional assessments (BAs) are one of the key mechanisms to assist the IESC in developing this advice so that it is based on best available science and independent expert knowledge. Importantly, technical products from BAs are also expected to be made available to the public, providing the opportunity for all other interested parties, including government regulators, industry, community and the general public, to draw from a single set of accessible information. A BA is a scientific analysis, providing a baseline level of information on the ecology, hydrology, geology and hydrogeology of a bioregion with explicit assessment of the potential direct, indirect and cumulative impacts of CSG and coal mining development on water resources.
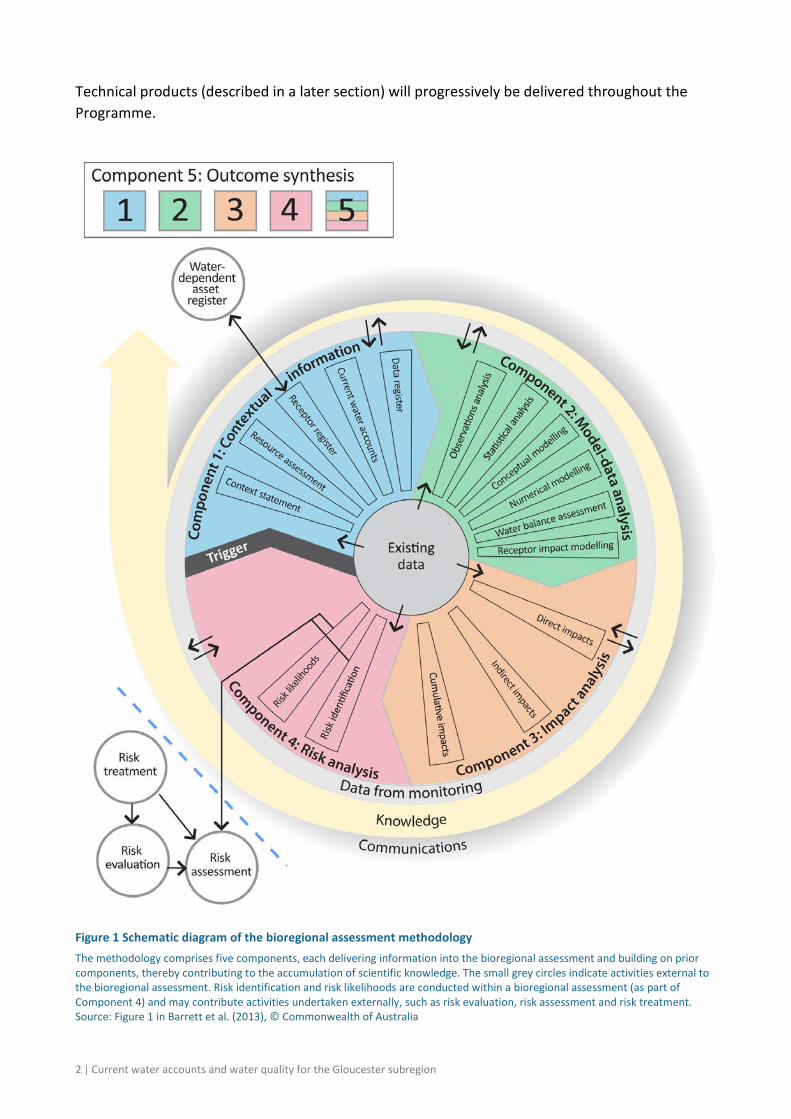
The IESC has been involved in the development of Methodology for bioregional assessments of the impacts of coal seam gas and coal mining development on water resources (the BA methodology; Barrett et al., 2013) and has endorsed it. The BA methodology specifies how BAs should be undertaken. Broadly, a BA comprises five components of activity, as illustrated in Figure 1. Each BA will be different, due in part to regional differences, but also in response to the availability of data, information and fit-for-purpose models. Where differences occur, these are recorded, judgments exercised on what can be achieved, and an explicit record is made of the confidence in the scientific advice produced from the BA.
The Bioregional Assessment Programme The Bioregional Assessment Programme is a collaboration between the Department of the Environment, the Bureau of Meteorology, CSIRO and Geoscience Australia. Other technical expertise, such as from state governments or universities, is also drawn on as required. For example, natural resource management groups and catchment management authorities identify assets that the community values by providing the list of water-dependent assets, a key input.
The Technical Programme, part of the Bioregional Assessment Programme, will undertake BAs for the following bioregions and subregions:
• the Galilee, Cooper, Pedirka and Arckaringa subregions, within the Lake Eyre Basin bioregion
• the Maranoa-Balonne-Condamine, Gwydir, Namoi and Central West subregions, within the Northern Inland Catchments bioregion
• the Clarence-Moreton bioregion
• the Hunter and Gloucester subregions, within the Northern Sydney Basin bioregion
• the Sydney Basin bioregion
• the Gippsland Basin bioregion.
2 | Current water accounts and water quality for the Gloucester subregion
Technical products (described in a later section) will progressively be delivered throughout the Programme.
Figure 1 Schematic diagram of the bioregional assessment methodology The methodology comprises five components, each delivering information into the bioregional assessment and building on prior components, thereby contributing to the accumulation of scientific knowledge. The small grey circles indicate activities external to the bioregional assessment. Risk identification and risk likelihoods are conducted within a bioregional assessment (as part of Component 4) and may contribute activities undertaken externally, such as risk evaluation, risk assessment and risk treatment. Source: Figure 1 in Barrett et al. (2013), © Commonwealth of Australia
Current water accounts and water quality for the Gloucester subregion | 3
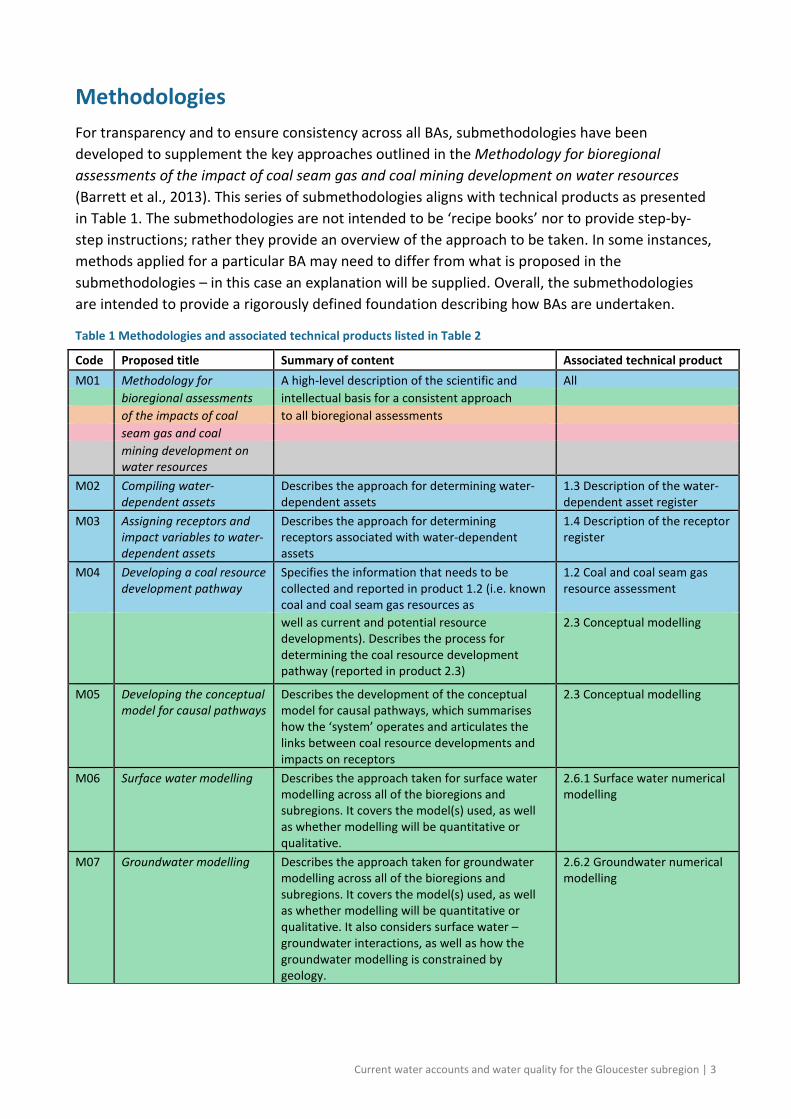
Methodologies For transparency and to ensure consistency across all BAs, submethodologies have been developed to supplement the key approaches outlined in the Methodology for bioregional assessments of the impact of coal seam gas and coal mining development on water resources (Barrett et al., 2013). This series of submethodologies aligns with technical products as presented in Table 1. The submethodologies are not intended to be ‘recipe books’ nor to provide step-by-step instructions; rather they provide an overview of the approach to be taken. In some instances, methods applied for a particular BA may need to differ from what is proposed in the submethodologies – in this case an explanation will be supplied. Overall, the submethodologies are intended to provide a rigorously defined foundation describing how BAs are undertaken.
Table 1 Methodologies and associated technical products listed in Table 2
Code Proposed title Summary of content Associated technical product M01 Methodology for A high-level description of the scientific and All bioregional assessments intellectual basis for a consistent approach of the impacts of coal to all bioregional assessments seam gas and coal mining development on
water resources
M02 Compiling water-dependent assets
Describes the approach for determining water-dependent assets
1.3 Description of the water-dependent asset register
M03 Assigning receptors and impact variables to water-dependent assets
Describes the approach for determining receptors associated with water-dependent assets
1.4 Description of the receptor register
M04 Developing a coal resource development pathway
Specifies the information that needs to be collected and reported in product 1.2 (i.e. known coal and coal seam gas resources as
1.2 Coal and coal seam gas resource assessment
well as current and potential resource developments). Describes the process for determining the coal resource development pathway (reported in product 2.3)
2.3 Conceptual modelling
M05 Developing the conceptual model for causal pathways
Describes the development of the conceptual model for causal pathways, which summarises how the ‘system’ operates and articulates the links between coal resource developments and impacts on receptors
2.3 Conceptual modelling
M06 Surface water modelling Describes the approach taken for surface water modelling across all of the bioregions and subregions. It covers the model(s) used, as well as whether modelling will be quantitative or qualitative.
2.6.1 Surface water numerical modelling
M07 Groundwater modelling Describes the approach taken for groundwater modelling across all of the bioregions and subregions. It covers the model(s) used, as well as whether modelling will be quantitative or qualitative. It also considers surface water – groundwater interactions, as well as how the groundwater modelling is constrained by geology.
2.6.2 Groundwater numerical modelling
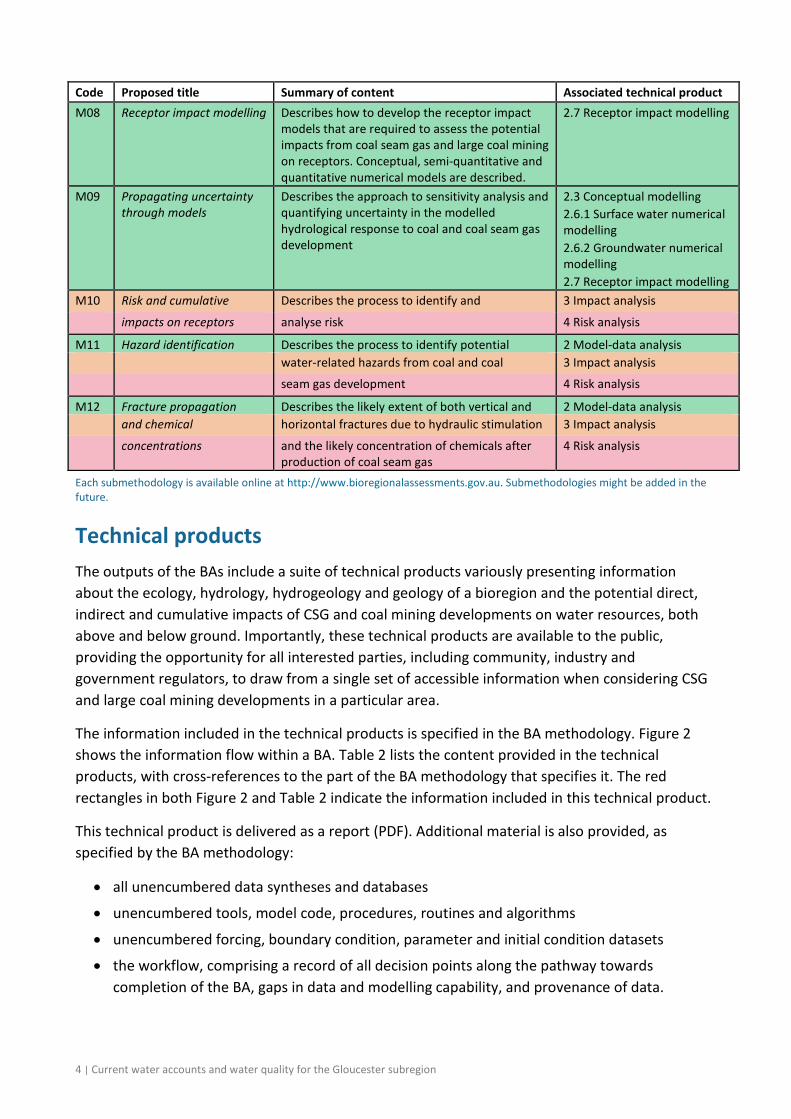
4 | Current water accounts and water quality for the Gloucester subregion
Code Proposed title Summary of content Associated technical product M08 Receptor impact modelling Describes how to develop the receptor impact
models that are required to assess the potential impacts from coal seam gas and large coal mining on receptors. Conceptual, semi-quantitative and quantitative numerical models are described.
2.7 Receptor impact modelling
M09 Propagating uncertainty through models
Describes the approach to sensitivity analysis and quantifying uncertainty in the modelled hydrological response to coal and coal seam gas development
2.3 Conceptual modelling 2.6.1 Surface water numerical modelling 2.6.2 Groundwater numerical modelling 2.7 Receptor impact modelling
M10 Risk and cumulative Describes the process to identify and 3 Impact analysis
impacts on receptors analyse risk 4 Risk analysis
M11 Hazard identification Describes the process to identify potential 2 Model-data analysis water-related hazards from coal and coal 3 Impact analysis
seam gas development 4 Risk analysis
M12 Fracture propagation Describes the likely extent of both vertical and 2 Model-data analysis and chemical horizontal fractures due to hydraulic stimulation 3 Impact analysis
concentrations and the likely concentration of chemicals after production of coal seam gas
4 Risk analysis
Each submethodology is available online at http://www.bioregionalassessments.gov.au. Submethodologies might be added in the future.
Technical products The outputs of the BAs include a suite of technical products variously presenting information about the ecology, hydrology, hydrogeology and geology of a bioregion and the potential direct, indirect and cumulative impacts of CSG and coal mining developments on water resources, both above and below ground. Importantly, these technical products are available to the public, providing the opportunity for all interested parties, including community, industry and government regulators, to draw from a single set of accessible information when considering CSG and large coal mining developments in a particular area.
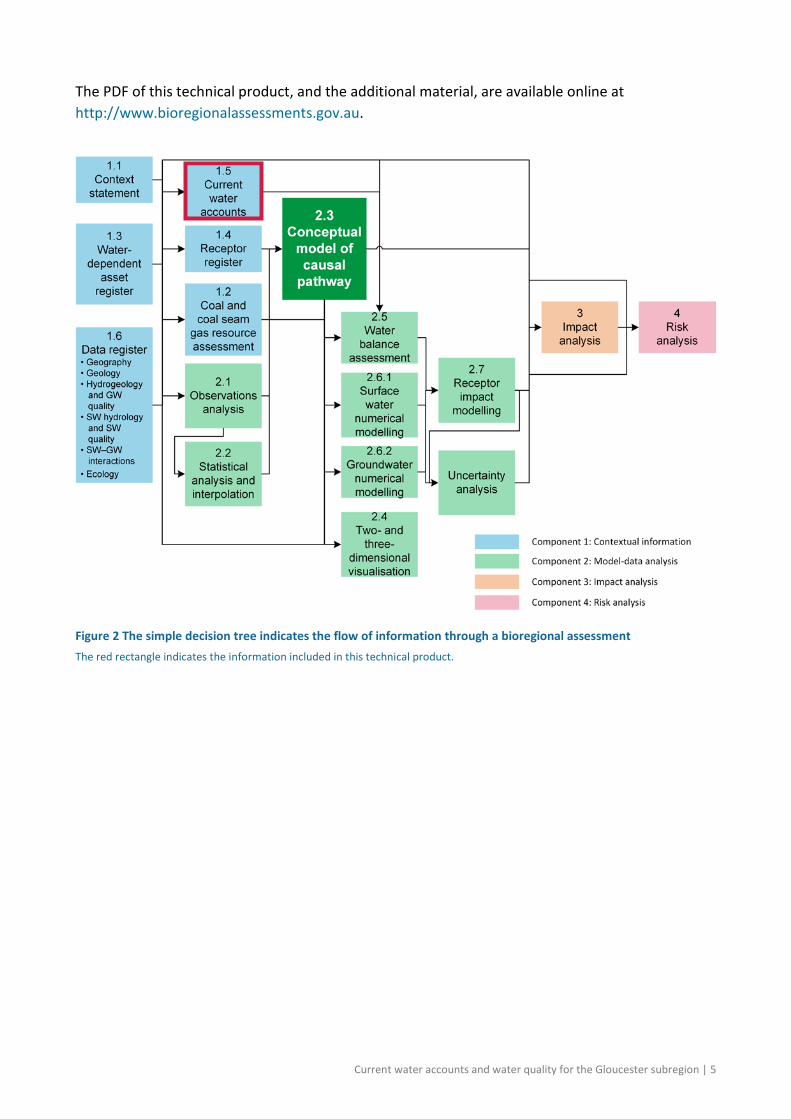
The information included in the technical products is specified in the BA methodology. Figure 2 shows the information flow within a BA. Table 2 lists the content provided in the technical products, with cross-references to the part of the BA methodology that specifies it. The red rectangles in both Figure 2 and Table 2 indicate the information included in this technical product.
This technical product is delivered as a report (PDF). Additional material is also provided, as specified by the BA methodology:
• all unencumbered data syntheses and databases
• unencumbered tools, model code, procedures, routines and algorithms
• unencumbered forcing, boundary condition, parameter and initial condition datasets
• the workflow, comprising a record of all decision points along the pathway towards completion of the BA, gaps in data and modelling capability, and provenance of data.
Current water accounts and water quality for the Gloucester subregion | 5
The PDF of this technical product, and the additional material, are available online at http://www.bioregionalassessments.gov.au.
Figure 2 The simple decision tree indicates the flow of information through a bioregional assessment The red rectangle indicates the information included in this technical product.
6 | Current water accounts and water quality for the Gloucester subregion
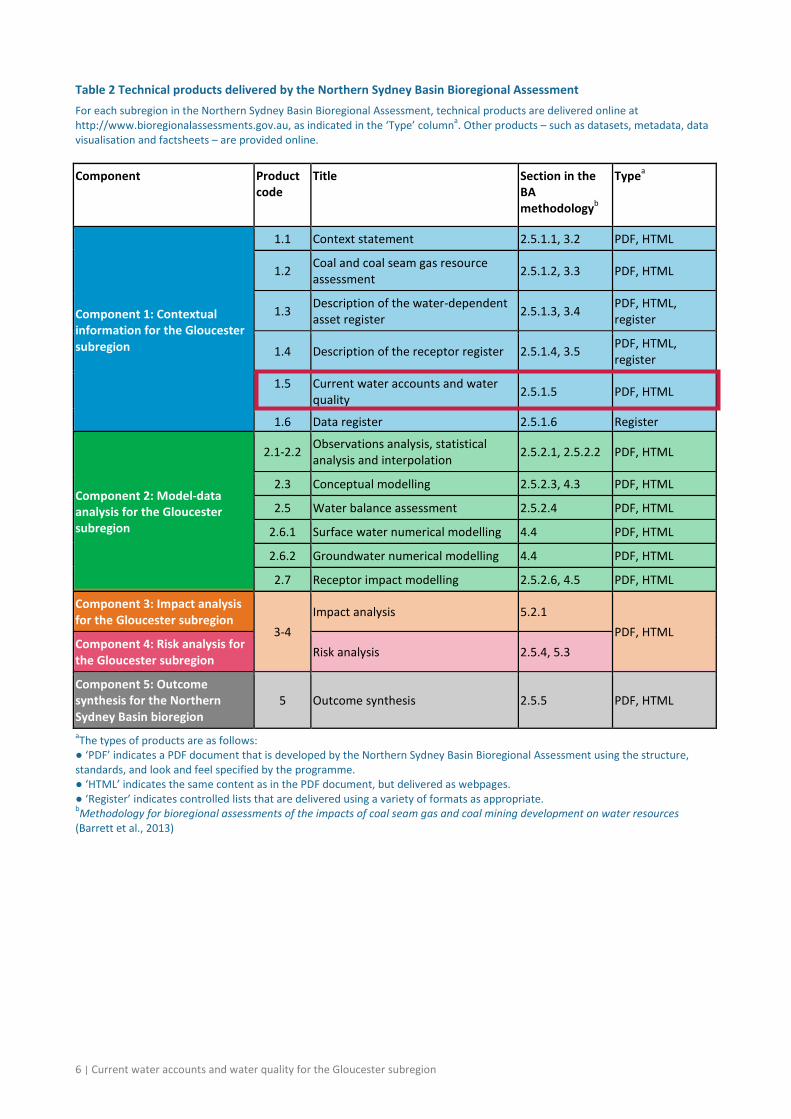
Table 2 Technical products delivered by the Northern Sydney Basin Bioregional Assessment For each subregion in the Northern Sydney Basin Bioregional Assessment, technical products are delivered online at http://www.bioregionalassessments.gov.au, as indicated in the ‘Type’ columna. Other products – such as datasets, metadata, data visualisation and factsheets – are provided online.
Component Product code
Title Section in the BA methodologyb
Typea
Component 1: Contextual information for the Gloucester subregion
1.1 Context statement 2.5.1.1, 3.2 PDF, HTML
1.2 Coal and coal seam gas resource assessment 2.5.1.2, 3.3 PDF, HTML
1.3 Description of the water-dependent asset register 2.5.1.3, 3.4 PDF, HTML,
register
1.4 Description of the receptor register 2.5.1.4, 3.5 PDF, HTML, register
1.5 Current water accounts and water quality 2.5.1.5 PDF, HTML
1.6 Data register 2.5.1.6 Register
Component 2: Model-data analysis for the Gloucester subregion
2.1-2.2 Observations analysis, statistical analysis and interpolation 2.5.2.1, 2.5.2.2 PDF, HTML
2.3 Conceptual modelling 2.5.2.3, 4.3 PDF, HTML
2.5 Water balance assessment 2.5.2.4 PDF, HTML
2.6.1 Surface water numerical modelling 4.4 PDF, HTML
2.6.2 Groundwater numerical modelling 4.4 PDF, HTML
2.7 Receptor impact modelling 2.5.2.6, 4.5 PDF, HTML
Component 3: Impact analysis for the Gloucester subregion
3-4 Impact analysis 5.2.1
PDF, HTML Component 4: Risk analysis for the Gloucester subregion Risk analysis 2.5.4, 5.3
Component 5: Outcome synthesis for the Northern Sydney Basin bioregion
5 Outcome synthesis 2.5.5 PDF, HTML
aThe types of products are as follows: ● ‘PDF’ indicates a PDF document that is developed by the Northern Sydney Basin Bioregional Assessment using the structure, standards, and look and feel specified by the programme. ● ‘HTML’ indicates the same content as in the PDF document, but delivered as webpages. ● ‘Register’ indicates controlled lists that are delivered using a variety of formats as appropriate. bMethodology for bioregional assessments of the impacts of coal seam gas and coal mining development on water resources (Barrett et al., 2013)
Current water accounts and water quality for the Gloucester subregion | 7
About this technical product The following notes are relevant only for this technical product.
• All reasonable efforts were made to provide all material under a Creative Commons Attribution 3.0 Australia Licence.
• All maps created as part of this BA for inclusion in this product used the Albers equal area projection with a central meridian of 151.0° East for the Northern Sydney Basin bioregion and two standard parallels of –18.0° and –36.0°.
• Contact [email protected] to access metadata (including copyright, attribution and licensing information) for all datasets cited or used to make figures in this product. At a later date, this information, as well as all unencumbered datasets, will be published online.
• The citation details of datasets are correct to the best of the knowledge of the Bioregional Assessment Programme at the publication date of this product. Readers should use the hyperlinks provided to access the most up-to-date information about these data; where there are discrepancies, the information provided online should be considered correct. The dates used to identify Bioregional Assessment Source Datasets are the dataset’s published date. Where the published date is not available, the last updated date or created date is used. For Bioregional Assessment Derived Datasets, the created date is used.
References
Barrett DJ, Couch CA, Metcalfe DJ, Lytton L, Adhikary DP and Schmidt RK (2013) Methodology for bioregional assessments of the impacts of coal seam gas and coal mining development on water resources. A report prepared for the Independent Expert Scientific Committee on Coal Seam Gas and Large Coal Mining Development through the Department of the Environment. Department of the Environment, Australia. Viewed 9 October 2015, http://www.iesc.environment.gov.au/publications/methodology-bioregional-assessments-impacts-coal-seam-gas-and-coal-mining-development-water.

8 | Current water accounts and water quality for the Gloucester subregion
Current water accounts and water quality for the Gloucester subregion | 9
1.5 Current water accounts and water quality for the Gloucester subregion
This product provides current water account and water quality information that will be used in subsequent products in the bioregional assessment.
The water accounts include information about water stores, flows, allocations and use that will be required in the water balance (product 2.5) and in the numerical modelling (product 2.6.1 and product 2.6.2).
This product also provides information about surface water and groundwater quality that will be required for the impact analysis (product 3) and risk analysis (product 4).
1.5.1 Current water accounts
10 | Current water accounts and water quality for the Gloucester subregion
Com
pone
nt 1
: Con
text
ual i
nfor
mat
ion
for t
he G
louc
este
r sub
regi
on
1.5.1 Current water accounts
Summary
The Gloucester subregion includes two river basins, with its northern part belonging to the Gloucester river basin, and its southern part belonging to the Karuah river basin. The surface water resources in the two river basins are not subject to major dams or weirs regulation, but are affected by irrigation diversion. The Gloucester River and Karuah River produce mean annual flow of 550 GL/year and 270 GL/year at Doon Ayre and Booral, respectively. For the northern rivers, there are 84 surface water access licences amounting to 6806 ML of water for the stream network; for the southern rivers, there are 25 surface water access licences amounting to 951 ML of water for the stream network.
A water licence is required for a groundwater bore only under certain regulatory conditions. While groundwater usage may be metered as part of water licensing conditions, actual groundwater usage data are not readily available for groundwater bores in the Gloucester subregion. Of the 192 groundwater bores that are currently in use across the Gloucester subregion, 175 bores have water licences allocated to them. In total, some 1864 ML/year of groundwater licenses are allocated across the subregion. Summarising water licence allocations may under estimate the amount of groundwater used in the Gloucester subregion as many bores do not have an associated water licence. Some guidelines for the estimation of groundwater usage are outlined in this product. Groundwater withdrawals by existing resource developments are included in the estimate. Groundwater withdrawals by proposed resource developments will be included in subsequent products when available.
Based on the bore yield values reported in the water licence database (Bioregional Assessment Programme, Dataset 3), it is estimated that for the Gloucester subregion some 2878 ML/year are extracted across the Gloucester subregion. Commercial purpose was the largest user of groundwater followed by dewatering bores. The largest estimated withdrawals occur from the alluvial aquifer. A significant number of bores had insufficient data to be able to determine which aquifer the groundwater was being drawn from.
1.5.1.1 Surface water
The Gloucester subregion contains rivers flowing in two separate river basins, the Gloucester river basin and the Karuah river basin (Figure 3). The Gloucester River, a major tributary of the Manning River, flows through the northern part of the subregion. The main tributaries of the Gloucester River are the Avon, Barrington and Bowman rivers. The main river flowing through the southern part of the subregion is the Karuah River whose main tributaries include the Mammy Johnsons, Telegherry and Branch rivers. Further detail for these rivers and their tributaries can be found in the context statement (see companion product 1.1 for the Gloucester subregion (McVicar et al., 2014)). The water accounts for these river basins are described in the following sections.
1.5.1 Current water accounts
Current water accounts and water quality for the Gloucester subregion | 11
Component 1: Contextual inform
ation for the Gloucester subregion
Figure 3 Gloucester subregion map including surface drainage network and stream gauges for the selected basins
1.5.1.1.1 Water accounts in the Gloucester river basin
The surface water resources in the Gloucester river basin are not regulated rivers in the sense that they do not host major dams or weirs, but are affected by irrigation diversion (Reinfelds et al., 2015). There are about 329 ha and 282 ha, respectively, of irrigation occurring upstream of the streamflow gauging sites on the Barrington River at Relfs Road (gauge ID: 208031) and on the Gloucester River downstream from Gloucester (gauge ID: 208003). The Avon and Bowman rivers are also strongly affected by irrigation extraction with about 190 ha and 104 ha of irrigated land, respectively (Reinfelds et al., 2015).
The Gloucester River produces mean annual flow of 84 GL/year at the upper stream gauge (208020), but mean annual flow of 550 GL/year at its lower stream gauge (208003), more than 70% of which is contributed by the Barrington River (Table 3).
1.5.1 Current water accounts
12 | Current water accounts and water quality for the Gloucester subregion
Com
pone
nt 1
: Con
text
ual i
nfor
mat
ion
for t
he G
louc
este
r sub
regi
on Table 3 Mean annual flow for major rivers in the Gloucester river basin in the Gloucester subregion
Name of river
Mean annual flow (GL)
Average years Stream gauge ID
Avon River 93 2004–2013 208028
Barrington River 435 2010–2013 208031
Gloucester River 84 2003–2013 208020
Gloucester River 550 1945–2013 208003
Data: NSW Office of Water (Dataset 1)
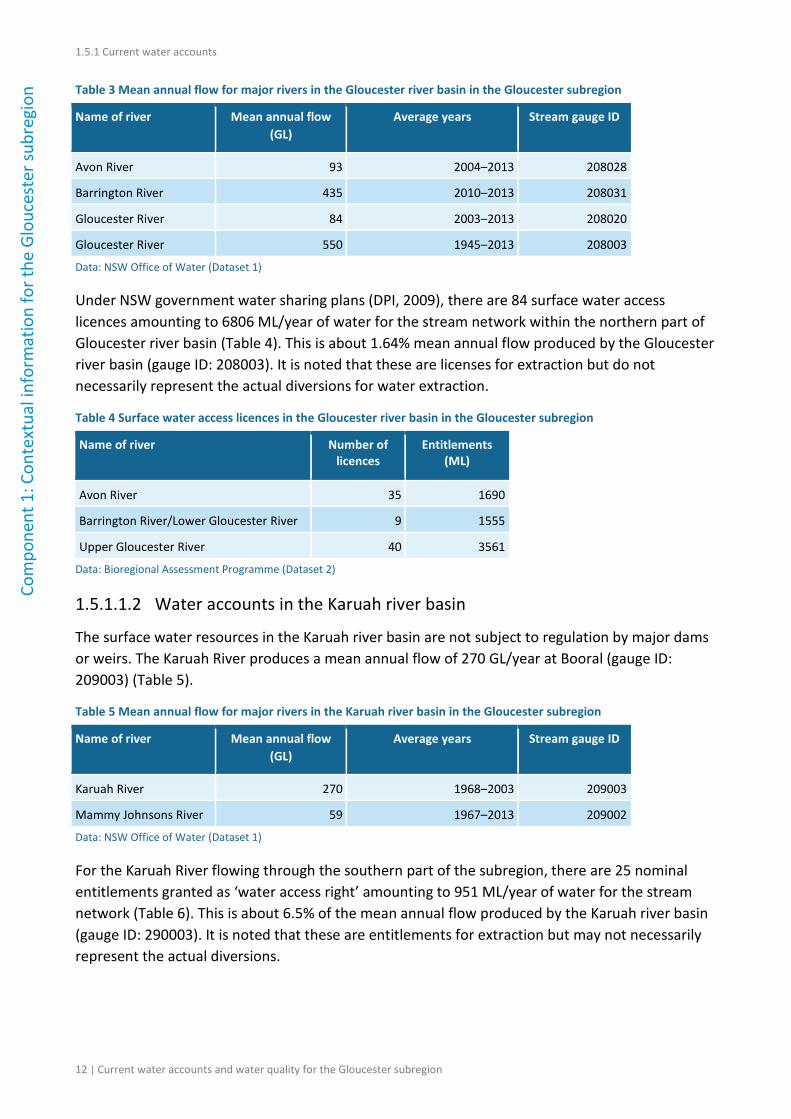
Under NSW government water sharing plans (DPI, 2009), there are 84 surface water access licences amounting to 6806 ML/year of water for the stream network within the northern part of Gloucester river basin (Table 4). This is about 1.64% mean annual flow produced by the Gloucester river basin (gauge ID: 208003). It is noted that these are licenses for extraction but do not necessarily represent the actual diversions for water extraction.
Table 4 Surface water access licences in the Gloucester river basin in the Gloucester subregion
Name of river Number of licences
Entitlements (ML)
Avon River 35 1690
Barrington River/Lower Gloucester River 9 1555
Upper Gloucester River 40 3561
Data: Bioregional Assessment Programme (Dataset 2)
1.5.1.1.2 Water accounts in the Karuah river basin
The surface water resources in the Karuah river basin are not subject to regulation by major dams or weirs. The Karuah River produces a mean annual flow of 270 GL/year at Booral (gauge ID: 209003) (Table 5).
Table 5 Mean annual flow for major rivers in the Karuah river basin in the Gloucester subregion
Name of river
Mean annual flow (GL)
Average years Stream gauge ID
Karuah River 270 1968–2003 209003
Mammy Johnsons River 59 1967–2013 209002
Data: NSW Office of Water (Dataset 1)
For the Karuah River flowing through the southern part of the subregion, there are 25 nominal entitlements granted as ‘water access right’ amounting to 951 ML/year of water for the stream network (Table 6). This is about 6.5% of the mean annual flow produced by the Karuah river basin (gauge ID: 290003). It is noted that these are entitlements for extraction but may not necessarily represent the actual diversions.
1.5.1 Current water accounts
Current water accounts and water quality for the Gloucester subregion | 13
Component 1: Contextual inform
ation for the Gloucester subregion
Table 6 Surface water access licenses in the Karuah river basin in the Gloucester subregion
Name of river Number of licences
Entitlements (ML)
Karuah River 25 951
Data: Bioregional Assessment Programme (Dataset 2)
1.5.1.1.3 Gaps
There is a lack of long-term streamflow observation at some gauges, leading to a high degree of uncertainty in understanding variability of annual streamflow. There is little information on how much surface water is actually used by the nominal entitlements.
References
DPI (2009) Water sharing plan: Lower North Coast Unregulated and Alluvial – guide. NSW Department of Primary Industries, Office of Water, Sydney.
McVicar T, Langhi L, Barron OV, Rachakonda PK, Zhang YQ, Dawes WR, Macfarlane C, Holland KL, Wilkes PG, Raisbeck-Brown N, Marvanek SP, Li LT and Van Niel TG (2014) Context statement for the Gloucester subregion. Product 1.1 from the Northern Sydney Basin Bioregional Assessment. Department of the Environment, Bureau of Meteorology, CSIRO and Geoscience Australia, Australia. Viewed 21 May 2015, http://data.bioregionalassessments.gov.au/product/NSB/GLO/1.1.
NSW Office of Water (2014) Continuous monitoring network. NSW Office of Water. Viewed 1 February 2014, http://www.bom.gov.au/waterdata/.
NSW Office of Water (2013) An extract from the NSW Office of Water’s Water Licensing System and Surface and Groundwater Approved Work locations. Extracted 20 November 2013.
Reinfelds I, Lu Y, Shaikh M, Smith G (2015) Landsat analysis of the extent of irrigated areas: Lower North Coast Water Sharing Plan, Manning River Basin. NSW Office of Water, Wollongong, NSW.
Datasets
Dataset 1 NSW Office of Water (2013) Gloucester Surface Water Discharge & Quality extract v1 060314. Bioregional Assessment Source Dataset. Viewed 24 June 2015, http://data.bioregionalassessments.gov.au/dataset/5915baad-51c9-4637-9461-88e88426a981.
Dataset 2 Bioregional Assessment Programme (2014) NSW Office of Water SW licences - Gloucester PAE v2 21022014. Bioregional Assessment Derived Dataset. Viewed 24 June 2015, http://data.bioregionalassessments.gov.au/dataset/f0a75a2b-233f-40a4-82cb-1929f2bee8c6.
1.5.1 Current water accounts
14 | Current water accounts and water quality for the Gloucester subregion
Com
pone
nt 1
: Con
text
ual i
nfor
mat
ion
for t
he G
louc
este
r sub
regi
on
Dataset 3 Bioregional Assessment Programme (2015) Asset database for the Gloucester subregion 8 April 2015. Bioregional Assessment Derived Dataset. Viewed 24 June 2015, http://data.bioregionalassessments.gov.au/dataset/d559e708-089a-46bc-bad2-dc5068993574.
1.5.1 Current water accounts
Current water accounts and water quality for the Gloucester subregion | 15
Component 1: Contextual inform
ation for the Gloucester subregion
1.5.1.2 Groundwater
1.5.1.2.1 Current water accounts
Product 1.5 provides information on groundwater allocations and an estimate of groundwater usage within the Gloucester subregion. Actual measured groundwater usage data are not readily available for bores in the Gloucester subregion. A groundwater bore may be required to be metered as part of its water licence conditions. While all bores are registered, not all bores (e.g. bores used for stock and domestic entitlements) require a licensed water allocation.
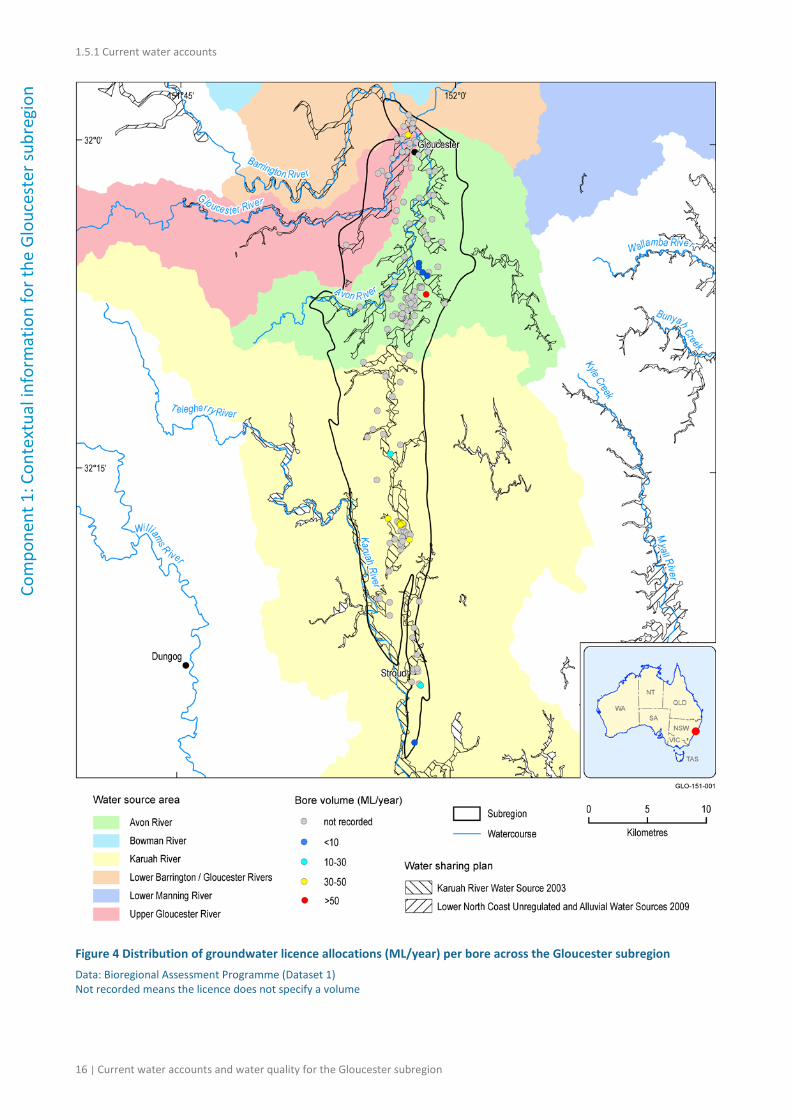
Water licence data for Gloucester were obtained from the Bioregional Assessment Programme (Dataset 1) and coordinate values were obtained from the NSW groundwater bore database (Bioregional Assessment Programme, Dataset 2). Figure 4 shows the distribution of water licence allocations to groundwater bores within the Gloucester subregion. The licensed water allocations represent the maximum amount that can be taken for a particular licence. The proportion of the licence entitlement extracted for consumptive purposes is not available. In the water licence database (Bioregional Assessment Programme, Dataset 1), for water access licences that cannot be linked to a works approval due to lack of specific location information, all remaining licences are aggregated to the corresponding water source location (polygon). This means bores without a location are aggregated and the associated volumes are assigned to their water source, such as a water supply or aquifer.
In total 175 bores have an allocated water licence attached to them. The total share components (a specified share or volume of water that can be extracted within a specified water management area) within the Gloucester subregion equates to 1864 ML/year and is drawn from 18 approved licences. About 25 ML/year of water is allocated for irrigation in the NSW Water Access Licence register whose spatial location is unknown and hence this volume is not considered in the estimation of total share components within the Gloucester subregion. Of the 1864 ML/year, some 50 ML/year of the allocated groundwater licence volume comes from a bore located in the Upper Gloucester River water source area (i.e. the catchment area for that particular water source (river)). Further information on the Upper Gloucester River water source is available in a NSW report (DPI, 2011).
The analysis of water accounts in the Gloucester subregion is restricted to water entitlements or licences and/or share data that is wholly and spatially contained within the subregion. NSW’s Water Sharing Plan for the Lower North Coast Unregulated and Alluvial Water Sources 2009 contains such data for a greater number of sources than contained within the Gloucester subregion and may not be directly comparable in all instances.
1.5.1 Current water accounts
16 | Current water accounts and water quality for the Gloucester subregion
Com
pone
nt 1
: Con
text
ual i
nfor
mat
ion
for t
he G
louc
este
r sub
regi
on
Figure 4 Distribution of groundwater licence allocations (ML/year) per bore across the Gloucester subregion Data: Bioregional Assessment Programme (Dataset 1) Not recorded means the licence does not specify a volume
1.5.1 Current water accounts
Current water accounts and water quality for the Gloucester subregion | 17
Component 1: Contextual inform
ation for the Gloucester subregion
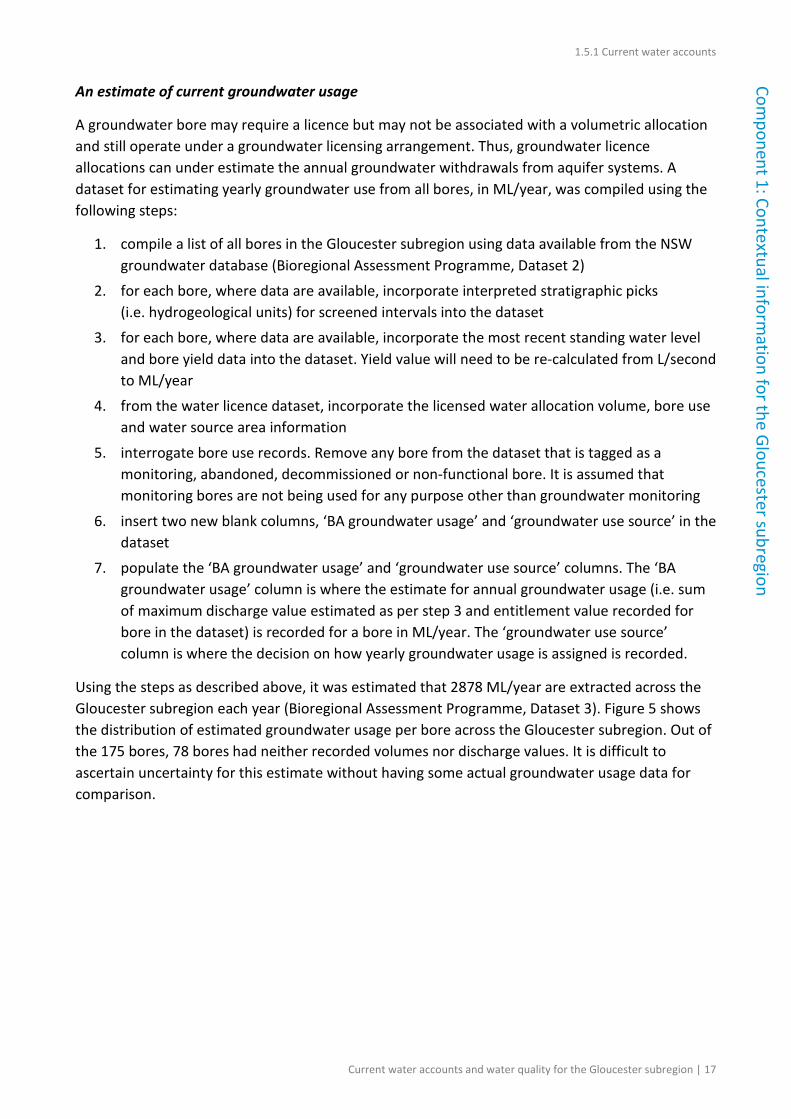
An estimate of current groundwater usage
A groundwater bore may require a licence but may not be associated with a volumetric allocation and still operate under a groundwater licensing arrangement. Thus, groundwater licence allocations can under estimate the annual groundwater withdrawals from aquifer systems. A dataset for estimating yearly groundwater use from all bores, in ML/year, was compiled using the following steps:
1. compile a list of all bores in the Gloucester subregion using data available from the NSW groundwater database (Bioregional Assessment Programme, Dataset 2)
2. for each bore, where data are available, incorporate interpreted stratigraphic picks (i.e. hydrogeological units) for screened intervals into the dataset
3. for each bore, where data are available, incorporate the most recent standing water level and bore yield data into the dataset. Yield value will need to be re-calculated from L/second to ML/year
4. from the water licence dataset, incorporate the licensed water allocation volume, bore use and water source area information
5. interrogate bore use records. Remove any bore from the dataset that is tagged as a monitoring, abandoned, decommissioned or non-functional bore. It is assumed that monitoring bores are not being used for any purpose other than groundwater monitoring
6. insert two new blank columns, ‘BA groundwater usage’ and ‘groundwater use source’ in the dataset
7. populate the ‘BA groundwater usage’ and ‘groundwater use source’ columns. The ‘BA groundwater usage’ column is where the estimate for annual groundwater usage (i.e. sum of maximum discharge value estimated as per step 3 and entitlement value recorded for bore in the dataset) is recorded for a bore in ML/year. The ‘groundwater use source’ column is where the decision on how yearly groundwater usage is assigned is recorded.
Using the steps as described above, it was estimated that 2878 ML/year are extracted across the Gloucester subregion each year (Bioregional Assessment Programme, Dataset 3). Figure 5 shows the distribution of estimated groundwater usage per bore across the Gloucester subregion. Out of the 175 bores, 78 bores had neither recorded volumes nor discharge values. It is difficult to ascertain uncertainty for this estimate without having some actual groundwater usage data for comparison.
1.5.1 Current water accounts
18 | Current water accounts and water quality for the Gloucester subregion
Com
pone
nt 1
: Con
text
ual i
nfor
mat
ion
for t
he G
louc
este
r sub
regi
on
Figure 5 Estimate of groundwater usage per bore across the Gloucester subregion Data: Bioregional Assessment Programme (Dataset 3)
1.5.1 Current water accounts
Current water accounts and water quality for the Gloucester subregion | 19
Component 1: Contextual inform
ation for the Gloucester subregion
Groundwater withdrawals by proposed resource developments are not included in this estimate. However existing resource development – AGL Energy Limited, Stratford Coal Mining Complex and Duralie Coal Mine’s bores (Bioregional Assessment Programme, Dataset 3) – are considered in this estimate. Further detail on the water requirements for the existing and proposed coal and coal seam gas developments will be outlined in companion product 2.6.2 for the Gloucester subregion.
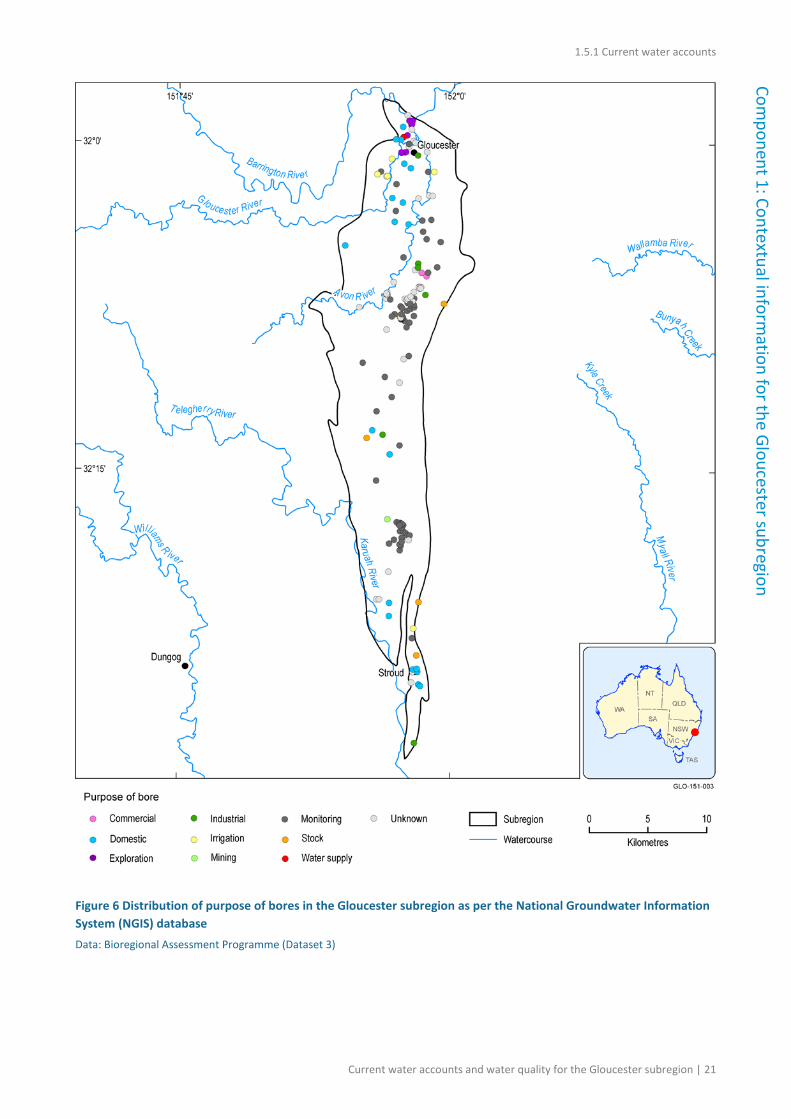
Figure 6 shows the distribution of bores for each purpose defined in the National Groundwater Information System (NGIS) bore database (Bioregional Assessment Programme, Dataset 2) across the subregion. Table 7 shows the number of bores broken down by the licensed purpose (Bioregional Assessment Programme, Dataset 1, Dataset 3). Commercial purpose was the largest user of groundwater at 1467 ML/year from five bores, followed by dewatering bores with an estimated volume of 522 ML/year from nine bores. As estimated volumes are calculated based on the bore yield values, they represent the maximum volume that can be extracted from the bore. A groundwater licence may have a yield which is greater than the licensed entitlement of the work and, as such, yield may not be the optimal measure of usage.
Table 7 Groundwater usage by licensed purpose for the Gloucester subregion
Purpose Number of bores
Estimated volume (ML/y)
Licensed water allocation (ML/y)
Commercial 5 1467 1467
Dewateringa 9 522 297
Town water supply 1 50 50
Irrigationb 1 30 30
Domestic supplyc 2 20 20
Total 18 2089 1864 aMay also include industrial bMay also include stock and domestic cMay also include industrial, irrigation, stock or farming Data: Bioregional Assessment Programme (Dataset 1), Bioregional Assessment Programme (Dataset 3)
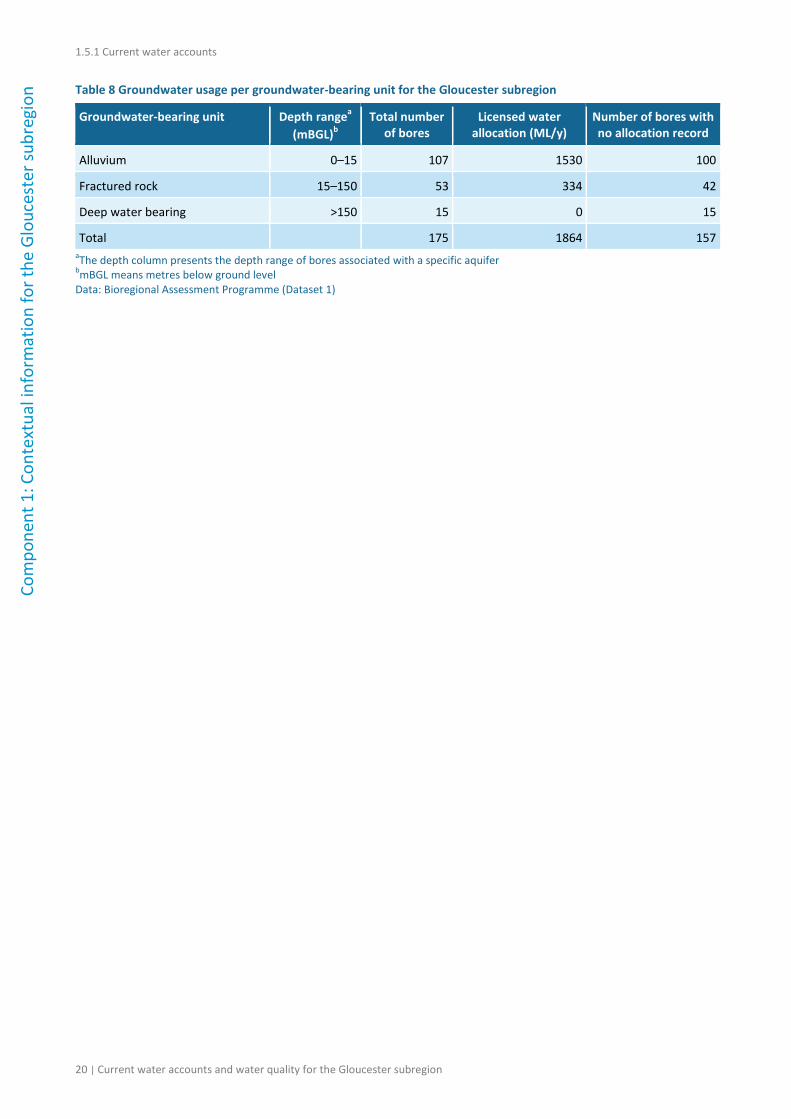
Multiple groundwater studies (Australasian Groundwater and Environmental, 2013; Heritage Computing, 2009, 2012; Parsons Brinckerhoff, 2012a, 2012b, 2012c, 2013) describe four main hydrogeological units within the Gloucester subregion:
1. alluvial aquifers along major creek lines (referred hereafter as alluvium)
2. relatively shallow weathered/fractured rock aquifers (referred hereafter as fractured rock)
3. interburden units of very low permeability which form a thick succession of low permeability coal measures (referred hereafter as deep water bearing)
4. the impermeable Alum Mountain Volcanics Formation that underlies these three hydrogeological units.
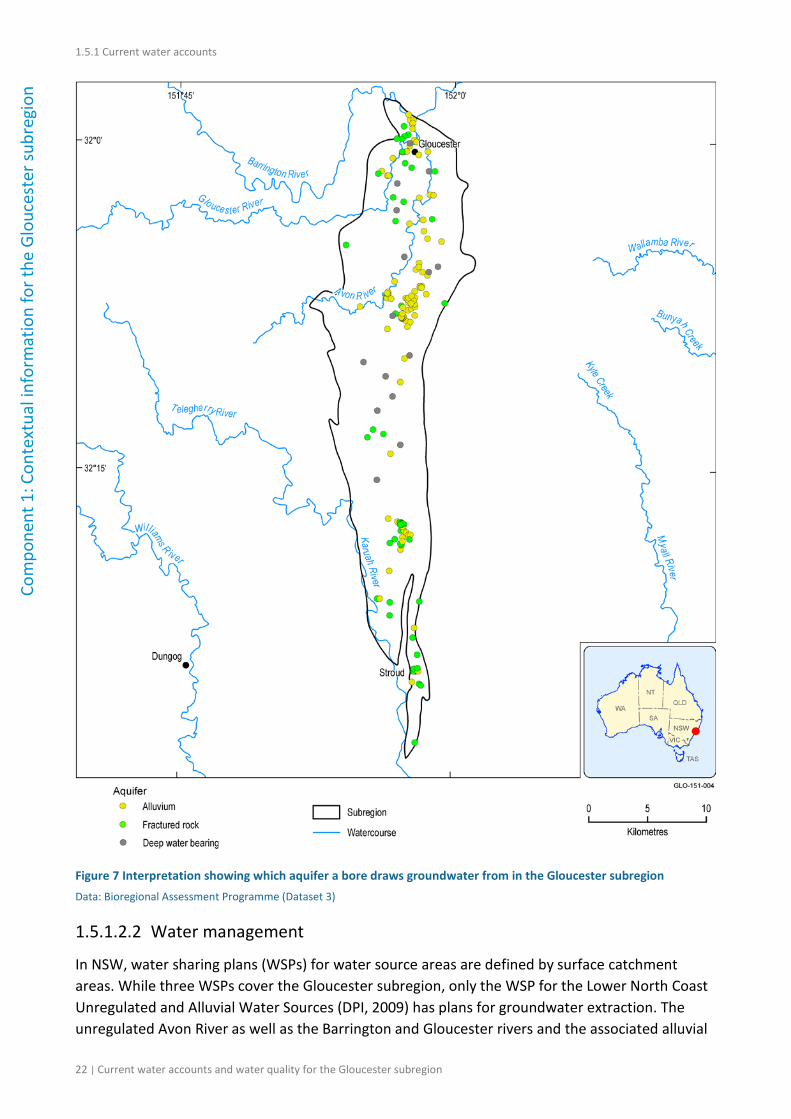
Table 8 shows the number of bores and an estimated volume withdrawn annually on a per aquifer basis. The largest estimated withdrawals on an annual basis occur from fractured rock groundwater-bearing units, followed by withdrawals from the alluvial aquifer system. Figure 7 shows the distribution of bores for each aquifer.
1.5.1 Current water accounts
20 | Current water accounts and water quality for the Gloucester subregion
Com
pone
nt 1
: Con
text
ual i
nfor
mat
ion
for t
he G
louc
este
r sub
regi
on Table 8 Groundwater usage per groundwater-bearing unit for the Gloucester subregion
Groundwater-bearing unit Depth rangea (mBGL)b
Total number of bores
Licensed water allocation (ML/y)
Number of bores with no allocation record
Alluvium 0–15 107 1530 100
Fractured rock 15–150 53 334 42
Deep water bearing >150 15 0 15
Total 175 1864 157 aThe depth column presents the depth range of bores associated with a specific aquifer bmBGL means metres below ground level Data: Bioregional Assessment Programme (Dataset 1)
1.5.1 Current water accounts
Current water accounts and water quality for the Gloucester subregion | 21
Component 1: Contextual inform
ation for the Gloucester subregion
Figure 6 Distribution of purpose of bores in the Gloucester subregion as per the National Groundwater Information System (NGIS) database Data: Bioregional Assessment Programme (Dataset 3)
1.5.1 Current water accounts
22 | Current water accounts and water quality for the Gloucester subregion
Com
pone
nt 1
: Con
text
ual i
nfor
mat
ion
for t
he G
louc
este
r sub
regi
on
Figure 7 Interpretation showing which aquifer a bore draws groundwater from in the Gloucester subregion Data: Bioregional Assessment Programme (Dataset 3)
1.5.1.2.2 Water management
In NSW, water sharing plans (WSPs) for water source areas are defined by surface catchment areas. While three WSPs cover the Gloucester subregion, only the WSP for the Lower North Coast Unregulated and Alluvial Water Sources (DPI, 2009) has plans for groundwater extraction. The unregulated Avon River as well as the Barrington and Gloucester rivers and the associated alluvial
1.5.1 Current water accounts
Current water accounts and water quality for the Gloucester subregion | 23
Component 1: Contextual inform
ation for the Gloucester subregion
groundwater source are managed under the WSP for the Lower North Coast Unregulated and Alluvial Water Sources. Figure 4 shows the distribution of bores in relation to the different water source areas in the Gloucester subregion. Alluvial groundwater extraction within 40 m of the river will be managed via the cease-to-pump rules for surface water. It is likely a similar approach will be adopted for the Karuah WSP once it is remade.
The distribution of water source area in the Gloucester subregion is shown in Figure 4. No water source area is completely encompassed by the Gloucester subregion. For the WSPs of interest, Table 9 provides a breakdown of the number of bores and groundwater usage in ML/year on a per water source area for the Gloucester subregion. Further information on WSPs in the Gloucester subregion is available in Section 1.1.4.1.3 in companion product 1.1 for the Gloucester subregion (McVicar et al., 2014).
Water trades can only take place using a current water licence, for which the intended purpose is non-stock and domestic. There is provision in the Lower North Coast Unregulated and Alluvial Water Sources WSP for temporary and permanent trading (DPI, 2009). The NSW Office of Water provides data on water trades that occurred under the auspices of the WSP for the Lower North Coast Unregulated and Alluvial Water Sources between 1 July 2009 and 30 June 2014 (NSW Office of Water, 2015). These data suggest that there have been water trades in all the water source areas that lie within the Gloucester subregion. The data suggest that the majority of water transfers occurred under the unregulated river category.
Table 9 Groundwater usage per water source area within the Gloucester subregion
Water source area Proportion of
groundwater source
within the Gloucester subregion
(%)
Number of bores Estimated volume (ML/y)
Licensed water allocation (ML/y)
Avon River 45.9 86 1546 1467
Karuah River 8.8 58 1219 347
Upper Gloucester River 16.5 25 113 50
Lower Barrington/Gloucester rivers 1.9 6 0 0
Total 175 2878 1864
Data: Bioregional Assessment Programme (Dataset 3)
1.5.1.2.3 Gaps
Information on stratigraphy and screened intervals for all bores would improve the groundwater use estimates on a per aquifer basis.
For bores with water licences, if actual usage data were to become available this would assist in the provision of a more accurate representation of the distribution of groundwater use for some bores within the Gloucester subregion. Uncertainty of groundwater usage data will be considered in subsequent BA modelling products.
1.5.1 Current water accounts
24 | Current water accounts and water quality for the Gloucester subregion
Com
pone
nt 1
: Con
text
ual i
nfor
mat
ion
for t
he G
louc
este
r sub
regi
on
References
Australasian Groundwater and Environmental (2013) Rocky Hill Coal Project groundwater assessment, Part 4 of the Specialist Consultant Studies Compendium. Technical report by Australasian Groundwater and Environmental Pty Ltd for Gloucester Coal Limited. Australasian Groundwater and Environmental Pty Ltd, Sydney. Viewed 10 September 2013, <http://www.rockyhillproject.com.au/wp-content/uploads/2013/08/80604-Vol-2_Part-4-Groundwater.pdf>.
DPI (2009) Water sharing plan: Lower North Coast Unregulated and Alluvial. In: Department of Primary Industries (ed.). NSW Government, Sydney.
DPI (2011) Report card for Upper Gloucester River water source. In: Department of Primary Industries - Office of Water (ed.). NSW Government, Sydney.
Heritage Computing (2009) Duralie Extension Project groundwater assessment, A hydrogeological assessment of the Duralie Extension Project Environmental Assessment. Technical report by Heritage Computing Pty Limited for Duralie Coal Pty Ltd. Heritage Computing Pty Limited, Sydney. Viewed 10 September 2013, http://www.gloucestercoal.com.au/documents/Enviro_EAD_DCM_2010_Appendix_B_Groundwater%20Assessment.pdf.
Heritage Computing (2012) A hydrogeological assessment in support of the Stratford Coal Project Environmental Impact Statement. Technical report by Heritage Computing Pty Limited for Stratford Coal Pty Ltd. Heritage Computing Pty Limited, Sydney. Viewed 10 September 2013, http://www.stratfordcoal.com.au/documents/environment/eis/Appendix%20A%20-%20Groundwater%20Assessment.pdf.
McVicar TR, Langhi L, Barron OV, Rachakonda PK, Zhang YQ, Dawes WR, Macfarlane C, Holland KL, Wilkes PG, Raisbeck-Brown N, Marvanek SP, Li LT and Van Niel TG (2014) Context statement for the Gloucester subregion. Product 1.1 from the Northern Sydney Basin Bioregional Assessment. Department of the Environment, Bureau of Meteorology, CSIRO and Geoscience Australia, Australia.
NSW Office of Water (2015) NSW Water Register. Department of Primary Industries, NSW Government. Viewed 07 January 2015, http://www.water.nsw.gov.au/Water-licensing/Registers.
Parsons Brinckerhoff (2012a) Gloucester groundwater and surface water monitoring – annual status report. Technical report by Parsons Brinckerhoff Australia Pty Limited for AGL Upstream Investments Pty Ltd. Parsons Brinckerhoff Australia Pty Limited, Sydney. Viewed 10 September 2013, http://www.agl.com.au/~/media/AGL/About%20AGL/Documents/How%20We%20Source%20Energy/CSG%20and%20the%20Environment/Gloucester/Assessments%20and%20Reports/2012/September/Gloucester%202012%20Monitoring%20Report.pdf.
1.5.1 Current water accounts
Current water accounts and water quality for the Gloucester subregion | 25
Component 1: Contextual inform
ation for the Gloucester subregion
Parsons Brinckerhoff (2012b) Groundwater investigation annual monitoring report, Technical report by Parsons Brinckerhoff Australia Pty Limited for Gloucester Coal Limited Pty Ltd. Parsons Brinckerhoff Australia Pty Limited, Sydney. Viewed 10 September 2013, http://www.rockyhillproject.com.au/wp-content/uploads/2013/08/80604-Vol-2_Part-4-Groundwater_Appendices-3-to-6.pdf.
Parsons Brinckerhoff (2012c) Phase 2 groundwater investigations – Stage 1 Gas Field Development Area: Gloucester Gas Project. Technical report by Parsons Brinckerhoff Australia Pty Limited for AGL Upstream Investments Pty Ltd. Parsons Brinckerhoff Australia Pty Limited, Sydney. Viewed 12 Aug 2013, http://agk.com.au/gloucester/assets/pdf/PB%20Gloucester%20Groundwater%20Report%20Phase%202%20Text.pdf.
Parsons Brinckerhoff (2013) Hydrogeological conceptual model of the Gloucester Basin. Technical report by Parsons Brinckerhoff Australia Pty Limited for AGL Upstream Investments Pty Ltd. Parsons Brinckerhoff Australia Pty Limited, Sydney. Viewed 10 September 2013, http://www.agl.com.au/~/media/AGL/About%20AGL/Documents/How%20We%20Source%20Energy/CSG%20and%20the%20Environment/Gloucester/Assessments%20and%20Reports/2013/Conceptual%20model%20email%20version.pdf.
Datasets
Dataset 1 Bioregional Assessment Programme (2015) Asset database for the Gloucester subregion on 8 April 2015. Bioregional Assessment Derived Dataset. Viewed 16 April 2015, http://data.bioregionalassessments.gov.au/dataset/d559e708-089a-46bc-bad2-dc5068993574.
Dataset 2 Bioregional Assessment Programme (2013) Gloucester NGIS bores. Bioregional Assessment Derived Dataset. Viewed 24 June 2015, http://data.bioregionalassessments.gov.au/dataset/e14ca3f6-6a49-4bd2-95b9-3fef6420bf49.
Dataset 3 Bioregional Assessment Programme (2015) Gloucester groundwater usage estimates v20150501. Bioregional Assessment Derived Dataset. Viewed 01 May 2015, http://data.bioregionalassessments.gov.au/dataset/fe43baa5-0fca-4e6a-8d56-0f5749c2da58.

1.5.1 Current water accounts
26 | Current water accounts and water quality for the Gloucester subregion
Com
pone
nt 1
: Con
text
ual i
nfor
mat
ion
for t
he G
louc
este
r sub
regi
on
1.5.2 Water quality
Current water accounts and water quality for the Gloucester subregion | 27
Component 1: Contextual inform
ation for the Gloucester subregion
1.5.2 Water quality
Summary
This product summarises surface water quality for two river basins: Gloucester river basin and Karuah river basin within the Gloucester subregion. No long-term, consistently applied water quality monitoring programme is available for the Gloucester river basin. The NSW Office of Water commenced to monitor surface water quality at two sites on the Avon River from November 2013. Measurements show an increasing trend in electrical conductivity (EC) and a decreasing trend in pH with distance down the Avon River. Other intermittent measurements show that pH on the Avon River is near neutral (pH ranging from 6.6 to 7.4) and EC is less than 500 µS/cm. For the Karuah River, two separate measurements show that EC is less than 400 µS/cm, and pH varies from 6.3 to 8.5.
Groundwater quality in the Gloucester subregion sequences has been assessed against national guidelines for water quality provided by the National Health and Medical Research Council (NHMRC and NRMMC, 2011), and the Australian and New Zealand Environmental and Conservation Council (ANZECC/ARMCANZ, 2000). Both salinity and trace element concentrations are considered, and focus is given to salinity, which is the parameter most commonly reported. Possibilities for beneficial use of water are provided based on median total dissolved solids (TDS) values. An overview is provided on gaps in the dataset and suggestions are given for data standards in future reporting.
1.5.2.1 Surface water
This product summarises surface water quality information in the Gloucester subregion where there are two main sources of surface water quality data. This includes water quality monitored by the NSW Office of Water (NSW Office of Water, 2015), and surface water sampled and monitored by coal mining companies (Gilbert and Associates, 2010; SRK, 2010; Parsons Brinckerhoff, 2012). Two water quality indicators included in this report are electrical conductivity (EC), an indication of salinity, and pH.
1.5.2.1.1 Water quality in the Gloucester river basin
There is no long-term water quality monitoring programme in the Gloucester river basin. Water quality measurements were mainly conducted on the Avon river basin where there exists coal mining and coal seam gas exploration. The NSW Office of Water commenced a surface water quality monitoring program in the Gloucester valley in November 2013 (NSW Office of Water, 2015). The program initially included basic water quality analyses, but was expanded in July 2014. There are two monitoring sites on the Avon River. At the upper site (upstream of Stratford) median field EC and pH readings are 351 µS/cm and 6.76, respectively. At the downstream site (near Gloucester) median EC and pH readings are 2012 µS/cm and 5.86, showing an increasing trend in electrical conductivity and a decreasing trend in pH with distance down the catchment.
Other reported EC values on the Avon River are less than 500 µS/cm. The EC and pH were intermittently measured between 1993 and 2009 on the Avon River, Avondale Creek and Dog Trap
1.5.2 Water quality
28 | Current water accounts and water quality for the Gloucester subregion
Com
pone
nt 1
: Con
text
ual i
nfor
mat
ion
for t
he G
louc
este
r sub
regi
on
Creek (SRK, 2010). Measured ECs vary from 100 to 500 µS/cm and pH is near neutral to slightly alkaline. The EC values were found to be well related with rainfall, with a reduction in EC following rainfall and an increase in EC when flow reduces and baseflow increases. Another water quality sampling programme was undertaken in April 2011 at three monitoring locations on the Avon River (Parsons Brinckerhoff, 2012). Salinity at the time of sampling was fresh with EC values less than 324 µS/cm and showing a slight increase in a downstream direction. The pH is near neutral, with a pH value varying from 6.6 to 7.4.
1.5.2.1.2 Water quality in the Karuah river basin
For the southern part of the Gloucester subregion, surface water sampling was intermittently undertaken by Gloucester Coal Ltd on Karuah River and Mammy Johnsons River from 2002 to 2009 (Gilbert and Associates, 2010). The EC during the observation period was less than 600 µS/cm for the Mammy Johnsons River, and less than 400 µS/cm for the Karuah River; pH for both rivers shows large variation, varying from 6.3 to 8.5.
The NSW Office of Water maintains a long term water quality data set for the Karuah River at Booral (gauge ID: 209003) located downstream of the assessment area. From 2007 to 2014, monthly EC readings ranged from 96 to 346 µS/cm with a median of 225 µS/cm. Values of pH ranged from 6.3 to 7.6 with a median of 6.99.
1.5.2.1.3 Gaps
There is a lack of long-term consistent monitoring of EC and pH for the Gloucester river basin. As a result, the capacity to fully understand what baseline water quality should be for this area is limited.
The NSW Office of Water monitors ambient river water quality at strategic locations and maintains long term data sets for sites across NSW. Attributes currently monitored represent general water quality condition and are most likely to demonstrate change over time from broad scale implementation of natural resource management. The surface water quality data gaps in the Gloucester valley are currently being addressed by NSW Office of Water monitoring programs.
References
ANZECC/ARMCANZ (2000) National Water Quality Management Strategy: Paper No 4 - Australian and New Zealand guidelines for fresh and marine water quality: Volume 1 - The Guidelines. Australian and New Zealand Environment and Conservation Council and the Agriculture and Resource Management Council of Australia and New Zealand, Commonwealth of Australia, Australia.
Gilbert and Associates (2010) Duralie Extension Project: Environmental Assessment – Appendix A (Surface Water Assessment). Consultants report for Duralie Coal Pty Ltd, Duralie Extension Project Environmental Assessment (EPBC Act Referral 2010/5396). Viewed 4 February 2014, www.gloucestercoal.com.au/documents/Enviro_EAD_DCM_2010_Appendix_A_Surface%20Water%20Assessment.pdf.
1.5.2 Water quality
Current water accounts and water quality for the Gloucester subregion | 29
Component 1: Contextual inform
ation for the Gloucester subregion
NHMRC and NRMMC (2011) Australian Drinking Water Guidelines Paper 6 National Water Quality Management Strategy. National Health and Medical Research Council and National Resource Management Ministerial Council. Commonwealth of Australia, Canberra.
NSW Office of Water (2015) Water quality. New South Wales Office of Water. Viewed 10 December 2014, http://www.water.nsw.gov.au/Water-Management/Water-quality/default.aspx.
Parsons Brinckerhoff (2012) Phase 2 groundwater investigations – Stage 1 Gas Field Development Area: Gloucester Gas Project. Technical report by Parsons Brinckerhoff Australia Pty Limited for AGL Upstream Investments Pty Ltd. Parsons Brinckerhoff Australia Pty Limited, Sydney. Viewed 12 August 2013, http://agk.com.au/gloucester/assets/pdf/PB%20Gloucester%20Groundwater%20Report%20Phase%202%20Text.pdf.
SRK (2010) Gloucester Basin Stage 1: Gas Field Development Project. Preliminary groundwater assessment and initial conceptual hydrogeological model. Technical report by SRK Consulting (Australasia) Pty Ltd for AGL Upstream Investments Pty Ltd. West Perth. Viewed 12 August 2013, http://agk.com.au/gloucester/assets/pdf/SRK%20Preliminary%20Groundwater%20Assessment%20-%20Desk%20study.pdf.
1.5.2 Water quality
30 | Current water accounts and water quality for the Gloucester subregion
Com
pone
nt 1
: Con
text
ual i
nfor
mat
ion
for t
he G
louc
este
r sub
regi
on
1.5.2.2 Groundwater
This product provides a baseline assessment of groundwater quality in the Gloucester subregion with a focus on salinity, and information on selected trace elements. Water quality is assessed against national guidelines provided by the National Health and Medical Research Council (NHMRC and NRMMC, 2011) and the Australian and New Zealand Environment and Conservation Council (ANZECC/ARMCANZ, 2000).
Before an assessment of groundwater quality can be carried out it is necessary to have a conceptual understanding of hydrological connectivity between different geological units. To assess the water quality of groundwater in the Gloucester subregion, geological formations were grouped together into hydrogeologic units based on the current conceptual understanding of the hydrodynamics in the subregion. Based on the geological setting and discrete structural-sedimentary formation (see Figures 22 and 23, McVicar et al., 2014), the Gloucester Basin, which underlies the Gloucester subregion, is characterised as a closed hydrogeological system. Multiple groundwater studies (Australasian Groundwater and Environmental, 2013; Heritage Computing, 2009; 2012; Parsons Brinckerhoff, 2012a; 2012b; 2012c; 2013) describe four main hydrogeological units within the basin:
5. the alluvial aquifers along major creek lines (referred hereafter as alluvium)
6. relatively shallow weathered/fractured rock aquifers (referred hereafter as fractured rock)
7. interburden units of very low permeability which form a thick succession of low permeability coal measures (referred hereafter as deep water bearing)
8. the impermeable Alum Mountain Volcanics Formation that underlies these three hydrogeological units.
Groundwater chemistry data for these hydrogeologic units were compiled from the NSW groundwater bore database (Bureau of Meteorology, 2014a). This database contains data from bores drilled from the early 1900s through to the present day. Over the decades there have been significant changes in how data from drill-holes are collected, as well as refinements in the general knowledge of the hydrogeology of the subregion. This can have implications for data quality. Due to the potential for impacts on groundwater levels and quality to cross catchment divides, available groundwater data were considered for the entire subregion.
To assess the potential hazards associated with using groundwater in the subregion, groundwater chemistry data were compared to national guidelines for water quality in which a number of possible water uses were considered. Water uses considered were: human drinking water, stock drinking water and water for long-term irrigation (defined as up to 100 years).
Trigger values were taken from the Australian Drinking Water Guidelines (ADWG) (NHMRC and NRMMC, 2011), and the National Water Quality Management Strategy (NWQMS) (ANZECC/ARMCANZ, 2000).
Groundwater chemistry data were primarily collated from the NSW groundwater database (Bureau of Meteorology, 2014a; 2014b). In total, data for 280 samples were available from 32 bores for the Gloucester subregion. Of these, 268 samples had data for salinity, but only a fraction of samples had trace element analyses. The number of analyses for trace elements is
1.5.2 Water quality
Current water accounts and water quality for the Gloucester subregion | 31
Component 1: Contextual inform
ation for the Gloucester subregion
discussed in Section 2.5.2.1.2. In the absence of any stratigraphic data for bores in the Gloucester subregion, the sample data were assigned to a hydrogeological unit based on the depth of bore. No groundwater quality data for interburden and Alum Mountain Volcanics (deep water-bearing units) are available in the database.
1.5.2.2.1 Total dissolved solids
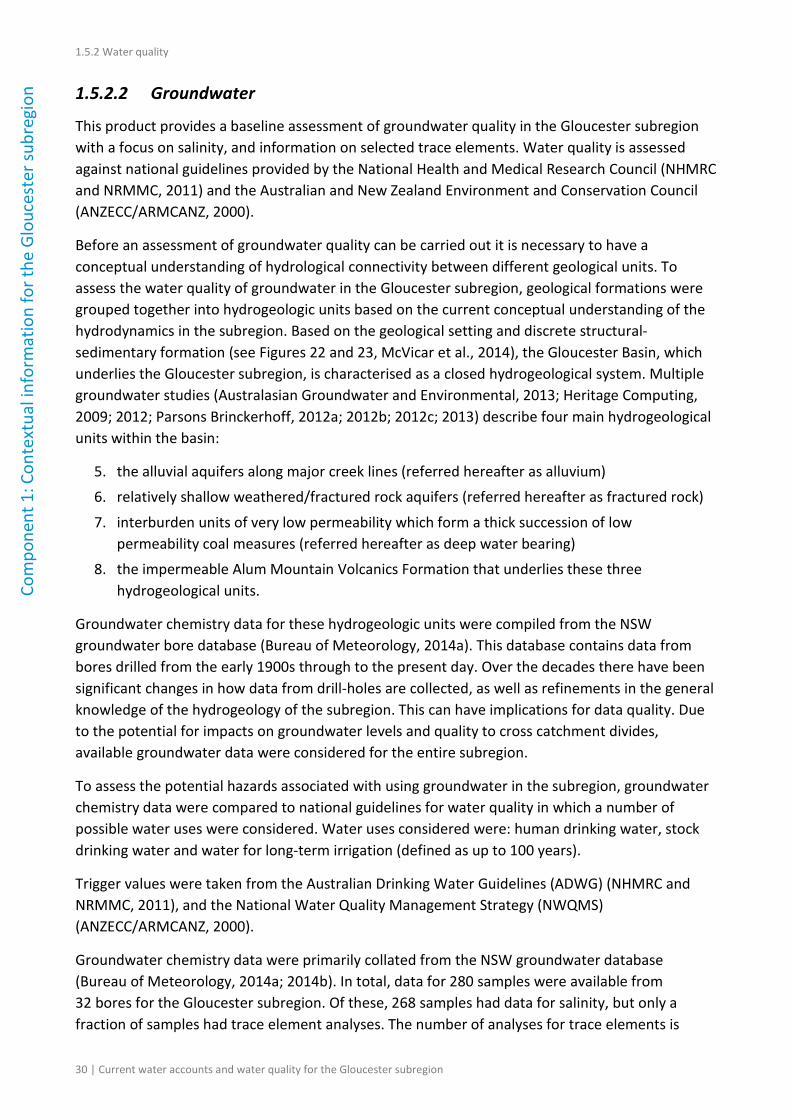
Total dissolved solids (TDS) trigger values were determined using ADWG values for human consumption and the NWQMS for stock and irrigation water. The trigger values used for salinity are given in Table 10.
Table 10 Total dissolved solids trigger values in the Gloucester subregion
Water use Total dissolved solids limit (mg/L)
Reference
Drinking water
1200a National Health and Medical Research Council (NHMRC and NRMMC, 2011)
Irrigation 636b Australian and New Zealand Environment and Conservation Council (ANZECC/ARMCANZ, 2000, Table 4.2.4)c
Stock 4000 Australian and New Zealand Environment and Conservation Council (ANZECC/ARMCANZ, 2000, Table 4.3.1), upper limit for cattle with no adverse effects
aValue is for unacceptable drinking water based on taste consideration bValue is for sensitive crops cAssuming total dissolved solids is equal to 0.67 electrical conductivity Data: Bioregional Assessment Programme (Dataset 1)
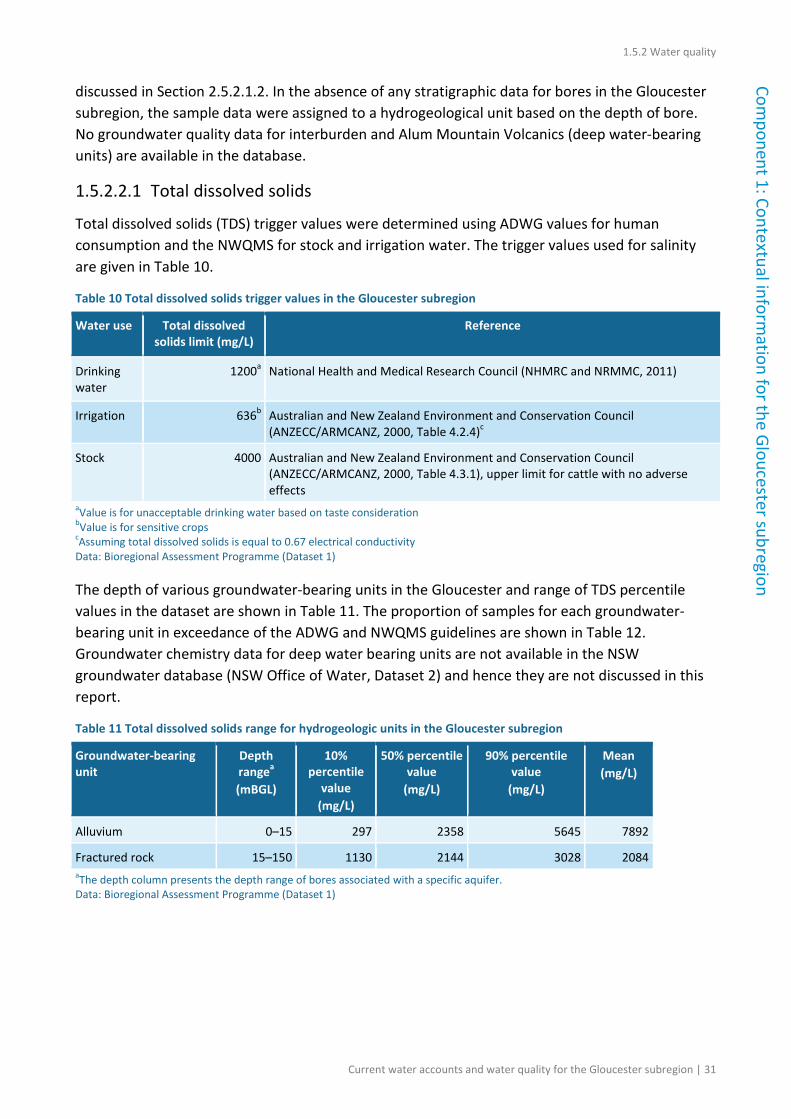
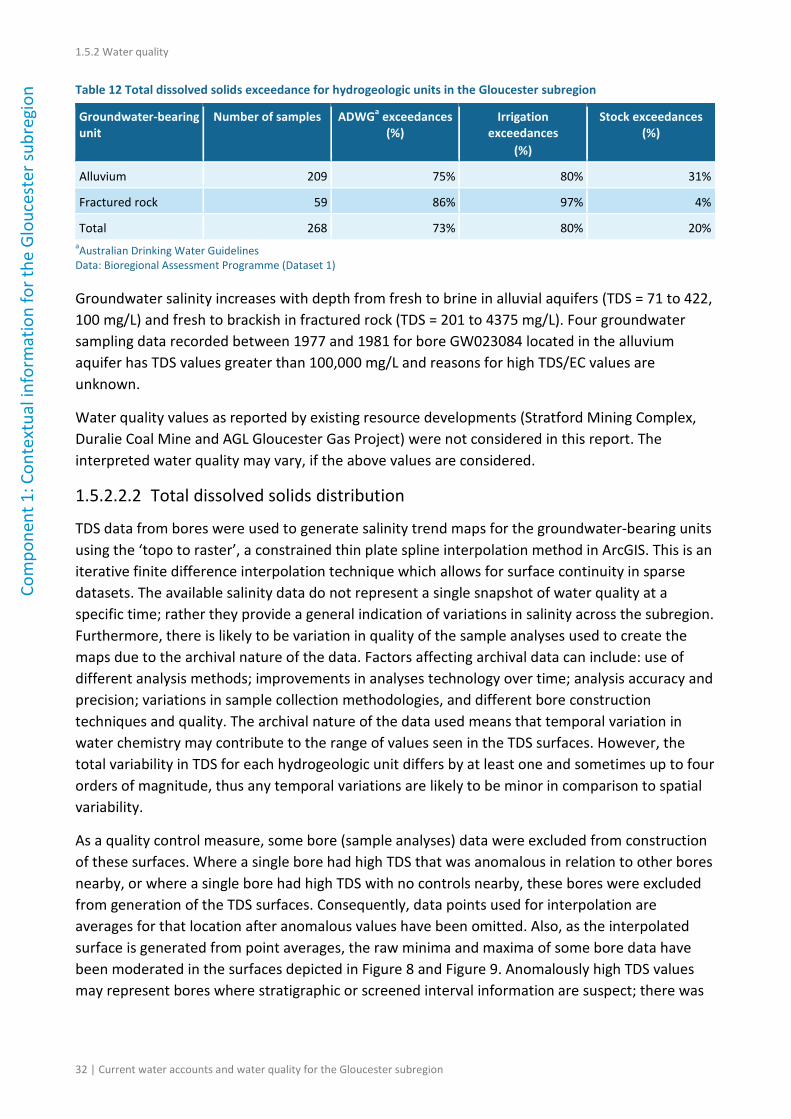
The depth of various groundwater-bearing units in the Gloucester and range of TDS percentile values in the dataset are shown in Table 11. The proportion of samples for each groundwater-bearing unit in exceedance of the ADWG and NWQMS guidelines are shown in Table 12. Groundwater chemistry data for deep water bearing units are not available in the NSW groundwater database (NSW Office of Water, Dataset 2) and hence they are not discussed in this report.
Table 11 Total dissolved solids range for hydrogeologic units in the Gloucester subregion
Groundwater-bearing unit
Depth rangea (mBGL)
10% percentile
value (mg/L)
50% percentile value
(mg/L)
90% percentile value
(mg/L)
Mean (mg/L)
Alluvium 0–15 297 2358 5645 7892
Fractured rock 15–150 1130 2144 3028 2084 aThe depth column presents the depth range of bores associated with a specific aquifer. Data: Bioregional Assessment Programme (Dataset 1)
1.5.2 Water quality
32 | Current water accounts and water quality for the Gloucester subregion
Com
pone
nt 1
: Con
text
ual i
nfor
mat
ion
for t
he G
louc
este
r sub
regi
on Table 12 Total dissolved solids exceedance for hydrogeologic units in the Gloucester subregion
Groundwater-bearing unit
Number of samples ADWGa exceedances (%)
Irrigation exceedances
(%)
Stock exceedances (%)
Alluvium 209 75% 80% 31%
Fractured rock 59 86% 97% 4%
Total 268 73% 80% 20% aAustralian Drinking Water Guidelines Data: Bioregional Assessment Programme (Dataset 1)
Groundwater salinity increases with depth from fresh to brine in alluvial aquifers (TDS = 71 to 422, 100 mg/L) and fresh to brackish in fractured rock (TDS = 201 to 4375 mg/L). Four groundwater sampling data recorded between 1977 and 1981 for bore GW023084 located in the alluvium aquifer has TDS values greater than 100,000 mg/L and reasons for high TDS/EC values are unknown.
Water quality values as reported by existing resource developments (Stratford Mining Complex, Duralie Coal Mine and AGL Gloucester Gas Project) were not considered in this report. The interpreted water quality may vary, if the above values are considered.
1.5.2.2.2 Total dissolved solids distribution
TDS data from bores were used to generate salinity trend maps for the groundwater-bearing units using the ‘topo to raster’, a constrained thin plate spline interpolation method in ArcGIS. This is an iterative finite difference interpolation technique which allows for surface continuity in sparse datasets. The available salinity data do not represent a single snapshot of water quality at a specific time; rather they provide a general indication of variations in salinity across the subregion. Furthermore, there is likely to be variation in quality of the sample analyses used to create the maps due to the archival nature of the data. Factors affecting archival data can include: use of different analysis methods; improvements in analyses technology over time; analysis accuracy and precision; variations in sample collection methodologies, and different bore construction techniques and quality. The archival nature of the data used means that temporal variation in water chemistry may contribute to the range of values seen in the TDS surfaces. However, the total variability in TDS for each hydrogeologic unit differs by at least one and sometimes up to four orders of magnitude, thus any temporal variations are likely to be minor in comparison to spatial variability.
As a quality control measure, some bore (sample analyses) data were excluded from construction of these surfaces. Where a single bore had high TDS that was anomalous in relation to other bores nearby, or where a single bore had high TDS with no controls nearby, these bores were excluded from generation of the TDS surfaces. Consequently, data points used for interpolation are averages for that location after anomalous values have been omitted. Also, as the interpolated surface is generated from point averages, the raw minima and maxima of some bore data have been moderated in the surfaces depicted in Figure 8 and Figure 9. Anomalously high TDS values may represent bores where stratigraphic or screened interval information are suspect; there was
1.5.2 Water quality
Current water accounts and water quality for the Gloucester subregion | 33
Component 1: Contextual inform
ation for the Gloucester subregion
sample contamination; or errors occurred in the analysis. The errors in the analysis can include inherent errors of interpolation technique as well as the data used for constraining the surfaces.
Distribution of bores is often limited to within the vicinity of outcrop areas. Results may also be skewed in part through clustering of bores in areas where there is high production due to the presence of relatively fresh water, or alternatively areas with higher salinity are likely to have fewer bores to constrain interpolation. Interpretation of the TDS surfaces should be considered with these uncertainties in mind, and these maps should be treated as an image of regional trends in salinity for the hydrogeologic units in the subregion rather than a predictive tool for determining water quality where there is little bore coverage.
Values for TDS as reported by existing resource developments were not considered in this report. The interpreted TDS values for alluvium and fractured rock aquifer may vary, if the above values are considered.
Alluvium aquifer
The alluvium aquifer is generally fresh in the north of the subregion, with an area of higher salinity in the central part of the subregion (Figure 8). In absence of salinity data for bores located in the south of the subregion, salinity trends are not represented in Figure 8.
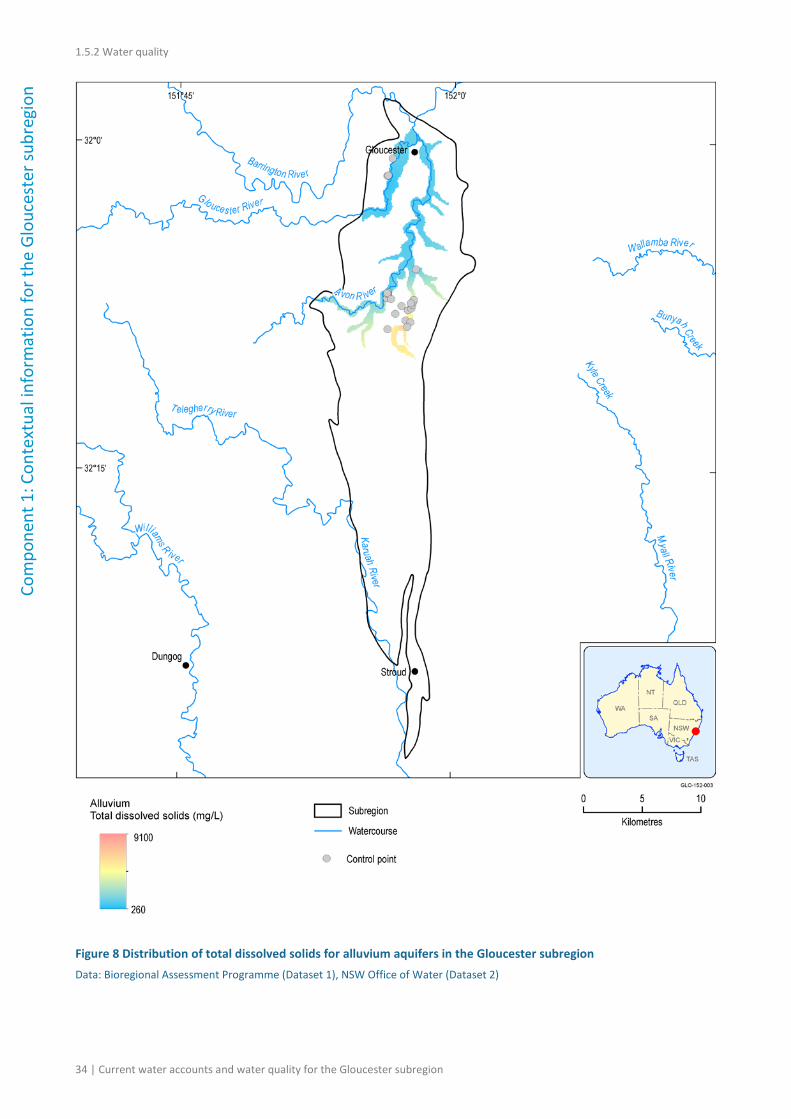
1.5.2 Water quality
34 | Current water accounts and water quality for the Gloucester subregion
Com
pone
nt 1
: Con
text
ual i
nfor
mat
ion
for t
he G
louc
este
r sub
regi
on
Figure 8 Distribution of total dissolved solids for alluvium aquifers in the Gloucester subregion Data: Bioregional Assessment Programme (Dataset 1), NSW Office of Water (Dataset 2)
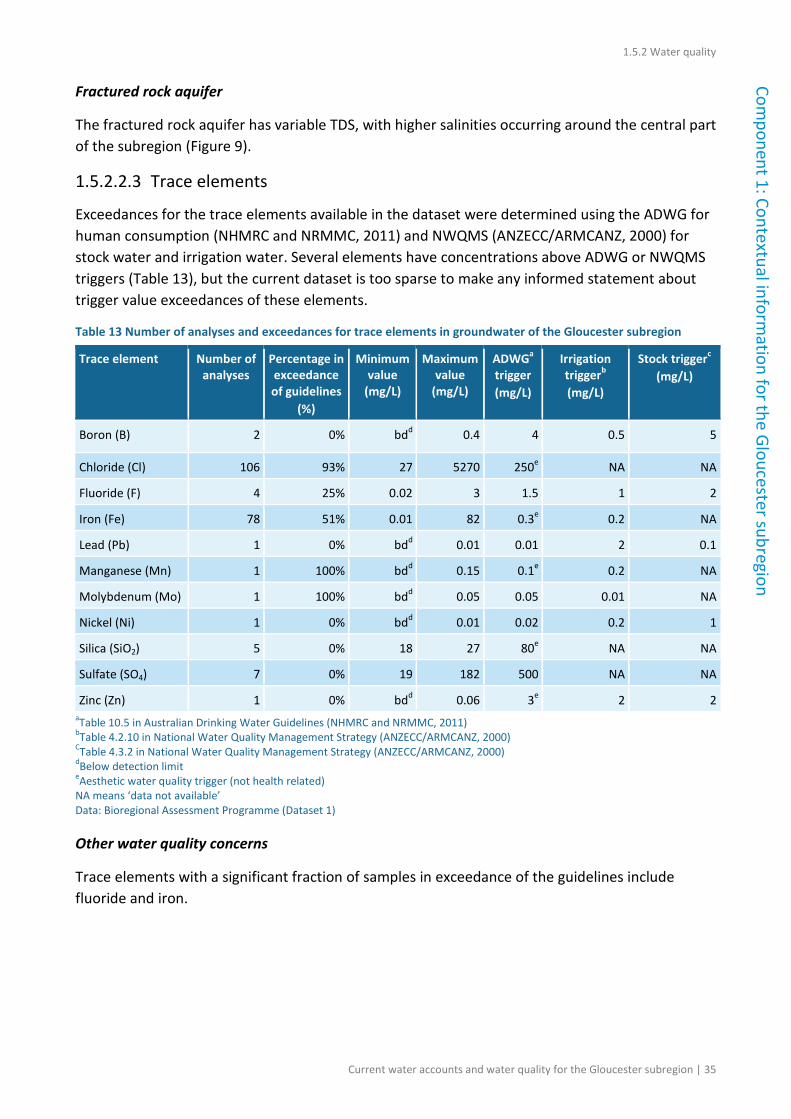
1.5.2 Water quality
Current water accounts and water quality for the Gloucester subregion | 35
Component 1: Contextual inform
ation for the Gloucester subregion
Fractured rock aquifer
The fractured rock aquifer has variable TDS, with higher salinities occurring around the central part of the subregion (Figure 9).
1.5.2.2.3 Trace elements
Exceedances for the trace elements available in the dataset were determined using the ADWG for human consumption (NHMRC and NRMMC, 2011) and NWQMS (ANZECC/ARMCANZ, 2000) for stock water and irrigation water. Several elements have concentrations above ADWG or NWQMS triggers (Table 13), but the current dataset is too sparse to make any informed statement about trigger value exceedances of these elements.
Table 13 Number of analyses and exceedances for trace elements in groundwater of the Gloucester subregion
Trace element Number of analyses
Percentage in exceedance of guidelines
(%)
Minimum value
(mg/L)
Maximum value
(mg/L)
ADWGa trigger (mg/L)
Irrigation triggerb (mg/L)
Stock triggerc (mg/L)
Boron (B) 2 0% bdd 0.4 4 0.5 5
Chloride (Cl) 106 93% 27 5270 250e NA NA
Fluoride (F) 4 25% 0.02 3 1.5 1 2
Iron (Fe) 78 51% 0.01 82 0.3e 0.2 NA
Lead (Pb) 1 0% bdd 0.01 0.01 2 0.1
Manganese (Mn) 1 100% bdd 0.15 0.1e 0.2 NA
Molybdenum (Mo) 1 100% bdd 0.05 0.05 0.01 NA
Nickel (Ni) 1 0% bdd 0.01 0.02 0.2 1
Silica (SiO2) 5 0% 18 27 80e NA NA
Sulfate (SO4) 7 0% 19 182 500 NA NA
Zinc (Zn) 1 0% bdd 0.06 3e 2 2 aTable 10.5 in Australian Drinking Water Guidelines (NHMRC and NRMMC, 2011) bTable 4.2.10 in National Water Quality Management Strategy (ANZECC/ARMCANZ, 2000) CTable 4.3.2 in National Water Quality Management Strategy (ANZECC/ARMCANZ, 2000) dBelow detection limit eAesthetic water quality trigger (not health related) NA means ‘data not available’ Data: Bioregional Assessment Programme (Dataset 1)
Other water quality concerns
Trace elements with a significant fraction of samples in exceedance of the guidelines include fluoride and iron.
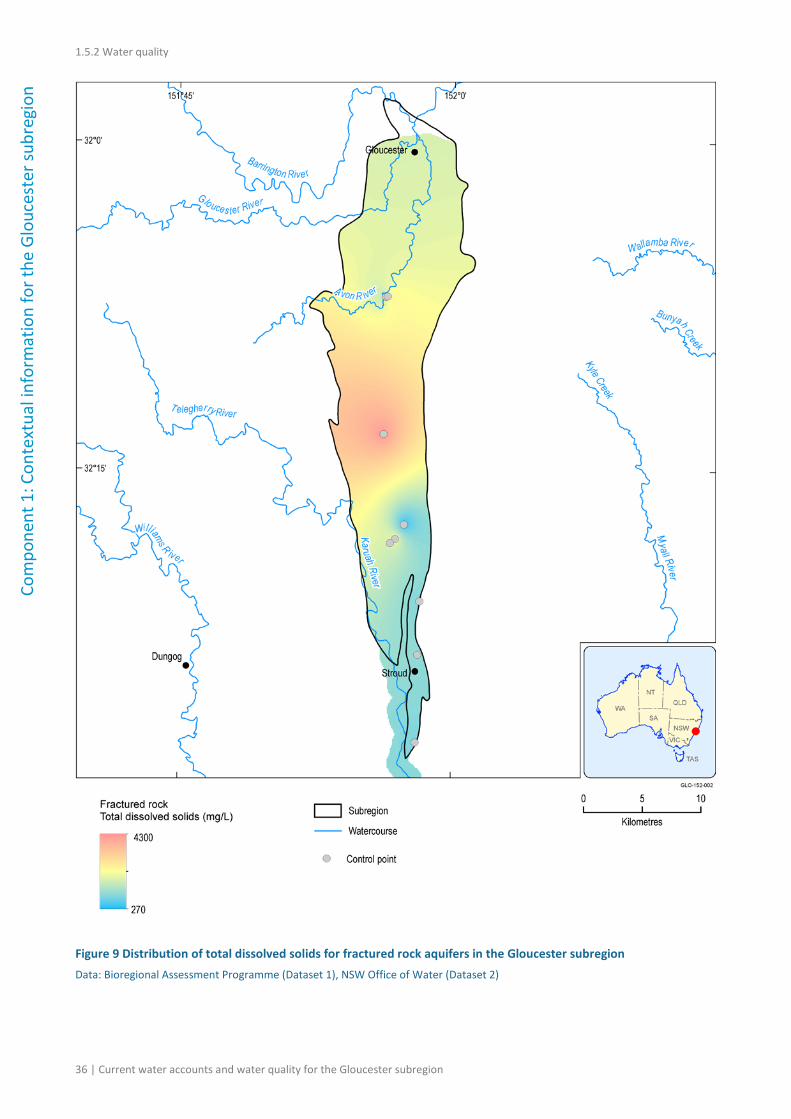
1.5.2 Water quality
36 | Current water accounts and water quality for the Gloucester subregion
Com
pone
nt 1
: Con
text
ual i
nfor
mat
ion
for t
he G
louc
este
r sub
regi
on
Figure 9 Distribution of total dissolved solids for fractured rock aquifers in the Gloucester subregion Data: Bioregional Assessment Programme (Dataset 1), NSW Office of Water (Dataset 2)

1.5.2 Water quality
Current water accounts and water quality for the Gloucester subregion | 37
Component 1: Contextual inform
ation for the Gloucester subregion
1.5.2.2.4 Gaps
Bore coverage is poor for many hydrogeologic units, especially the interburden. This makes assessing the spatial distribution of water quality difficult, and requires assumptions about water quality over large areas with few control points.
The quality of the hydrochemistry data available for this assessment is difficult to determine, as analytical uncertainties are not reported in the dataset. The dataset includes chemical analyses of differing ages, sometimes decades apart, which will have differing levels of accuracy and precision. Additionally, bore screening interval data are unknown and stratigraphic unit information was not assigned in the database. Assigning these bores to stratigraphic units based on depth and local stratigraphic information introduces a considerable amount of uncertainty into the dataset. Useful further work could include cross checking the stratigraphic position assigned to bores with limited stratigraphic information.
A number of potentially harmful trace elements have been omitted from this product due to scarcity or absence of data. Some elements have data available for only one or two hydrogeologic units, while others have no data available at all. Where analyses have been performed several elements have concentrations above ADWG or NWQMS triggers, but the current dataset is too sparse to make any informed statement about trigger value exceedances of these elements. It is possible that hazards will go unidentified due to data scarcity. Further work defining the range and distribution of trace element concentrations in the subregion is required to fully understand the potential hazards they pose.
Trace elements for which there was only limited data are boron, fluoride, lead, manganese, molybdenum, nickel and zinc. Trace elements for which there are no data are aluminium, arsenic, beryllium, cadmium, chromium, cobalt, copper, mercury, selenium, uranium and vanadium.
References
Australasian Groundwater and Environmental (2013) Rocky Hill Coal Project Groundwater Assessment, Part 4 of the Specialist Consultant Studies Compendium, Technical reportby Australasian Groundwater and Environmental Pty Ltd for Gloucester Coal Limited. Australasian Groundwater and Environmental Pty Ltd, Sydney. Viewed 10 September 2013, http://www.rockyhillproject.com.au/wp-content/uploads/2013/08/80604-Vol-2_Part-4-Groundwater.pdf.
ANZECC/ARMCANZ (2000) National Water Quality Management Strategy: Paper No 4 - Australian and New Zealand guidelines for fresh and marine water quality: Volume 1 - The Guidelines. Australian and New Zealand Environment and Conservation Council and the Agriculture and Resource Management Council of Australia and New Zealand, Commonwealth of Australia, Australia.
1.5.2 Water quality
38 | Current water accounts and water quality for the Gloucester subregion
Com
pone
nt 1
: Con
text
ual i
nfor
mat
ion
for t
he G
louc
este
r sub
regi
on
Heritage Computing (2009) Duralie Extension Project Groundwater Assessment, A Hydrogeological Assessment of the Duralie Extension Project Environmental Assessment, Technical report by Heritage Computing Pty Limited for Duralie Coal Pty Ltd. Heritage Computing Pty Limited, Sydney. Viewed 10 September 2013, http://www.gloucestercoal.com.au/documents/Enviro_EAD_DCM_2010_Appendix_B_Groundwater%20Assessment.pdf.
Heritage Computing (2012) A Hydrogeological Assessment in Support of the Stratford Coal Project Environmental Impact Statement, Technical report by Heritage Computing Pty Limited for Stratford Coal Pty Ltd. Heritage Computing Pty Limited, Sydney. Viewed 10 September 2013, http://www.stratfordcoal.com.au/documents/environment/eis/Appendix%20A%20-%20Groundwater%20Assessment.pdf.
McVicar TR, Langhi L, Barron OV, Rachakonda PK, Zhang YQ, Dawes WR, Macfarlane C, Holland KL, Wilkes PG, Raisbeck-Brown N, Marvanek SP, Li LT and Van Niel TG (2014) Context statement for the Gloucester subregion. Product 1.1 from the Northern Sydney Basin Bioregional Assessment. Department of the Environment, Bureau of Meteorology, CSIRO and Geoscience Australia, Australia.
NHMRC and NRMMC (2011) Australian Drinking Water Guidelines Paper 6 National Water Quality Management Strategy. National Health and Medical Research Council and, National Resource Management Ministerial Council, Commonwealth of Australia, Canberra.
Parsons Brinckerhoff (2012a) Gloucester Groundwater and Surface Water Monitoring – Annual Status Report, Technical report by Parsons Brinckerhoff Australia Pty Limited for AGL Upstream Investments Pty Ltd. Parsons Brinckerhoff Australia Pty Limited, Sydney. Viewed 10 September 2013, http://www.agl.com.au/~/media/AGL/About%20AGL/Documents/How%20We%20Source%20Energy/CSG%20and%20the%20Environment/Gloucester/Assessments%20and%20Reports/2012/September/Gloucester%202012%20Monitoring%20Report.pdf.
Parsons Brinckerhoff (2012b) Gloucester Resources Limited, Groundwater Investigation, Annual Monitoring Report, Technical report by Parsons Brinckerhoff Australia Pty Limited for Gloucester Coal Limited Pty Ltd. Parsons Brinckerhoff Australia Pty Limited, Sydney. Viewed 10 September 2013, http://www.rockyhillproject.com.au/wp-content/uploads/2013/08/80604-Vol-2_Part-4-Groundwater_Appendices-3-to-6.pdf.
Parsons Brinckerhoff (2012c) Phase 2 Groundwater Investigations – Stage 1 Gas Field Development Area: Gloucester Gas Project, Technical report by Parsons Brinckerhoff Australia Pty Limited for AGL Upstream Investments Pty Ltd. Parsons Brinckerhoff Australia Pty Limited, Sydney. Viewed 12 August 2013, http://agk.com.au/gloucester/assets/pdf/PB%20Gloucester%20Groundwater%20Report%20Phase%202%20Text.pdf.
1.5.2 Water quality
Current water accounts and water quality for the Gloucester subregion | 39
Component 1: Contextual inform
ation for the Gloucester subregion
Parsons Brinckerhoff (2013) Hydrogeological Conceptual Model of the Gloucester Basin, Technical report by Parsons Brinckerhoff Australia Pty Limited for AGL Upstream Investments Pty Ltd. Parsons Brinckerhoff Australia Pty Limited, Sydney. Viewed 10 September 2013, http://www.agl.com.au/~/media/AGL/About%20AGL/Documents/How%20We%20Source%20Energy/CSG%20and%20the%20Environment/Gloucester/Assessments%20and%20Reports/2013/Conceptual%20model%20email%20version.pdf.
Datasets
Dataset 1 Bioregional Assessment Programme (2014) Gloucester NGIS bores. Bioregional Assessment Derived Dataset. Viewed 24 June 2015, http://data.bioregionalassessments.gov.au/dataset/e14ca3f6-6a49-4bd2-95b9-3fef6420bf49.
Dataset 2 NSW Office of Water (2013) NSW Office of Water Groundwater Quality extract 28_nov_2013. Bioregional Assessment Source Dataset. Viewed 24 June 2015, http://data.bioregionalassessments.gov.au/dataset/74da836a-7b97-4278-9034-c9a259a34fbb.