CURRENT SUSTAINABLE INFRASTRUCTURE … utility... · = x v w { 1 $ ' '&, &,+ 0 -,!. -%% *1...
42
Copyright © 2015 American Water Works Association CURRENT SUSTAINABLE INFRASTRUCTURE PRACTICES 2014: A REPORT FOR AWWA The Current Sustainable Infrastructure Practices (CSIP) project was commissioned by the American Water Works Association (AWWA) Sustainable Infrastructure Committee (SIC) Project Team and funded by the AWWA Technical & Educational Council. Report prepared by Dr. Amy E. Landis, consultant [email protected] December 30, 2014
Transcript of CURRENT SUSTAINABLE INFRASTRUCTURE … utility... · = x v w { 1 $ ' '&, &,+ 0 -,!. -%% *1...

Copyright © 2015 American Water Works Association
CURRENT SUSTAINABLE INFRASTRUCTURE PRACTICES 2014: A REPORT FOR AWWA
The Current Sustainable Infrastructure Practices (CSIP) project was commissioned by the American Water WorksAssociation (AWWA) Sustainable Infrastructure Committee (SIC) Project Team and funded by the AWWA Technical& Educational Council.
Report prepared by Dr. Amy E. Landis, [email protected] 30, 2014


(6)
3)
Sustainability drivers D Who drives (17)* D Sust plan(s) (7)
Key: Check only one Check all that apply Rank FIB *Includes FIB 'other'(#) = # of options able to check including FIB
Sustainability practices
D Factors that influence sust
D Sust tools (17)* D Sust metrics (13)*
Sustainability practices part 2
D Best sust practice D Factors that
influence sust (14)*
Utility characteristics
D Job title (8)*D State
List of techs & practices
W 30 options
D Pop served 6) D MGD Logic WW 40 options D Type ( )
Both 48 options
Figure 1. Overview of survey questions. Survey questions were the same for all respondents with one exception; logic directed respondents of 'type of utility' (i.e. W = water utility, WW = wastewater utility, Both = combined water and wastewater utility) to different sets of technologies and practices relevant to their utility type. FIB = fill in the blank, Sust = sustainability. One additional question (not shown) asked respondents if they would be interested in participating in an interview.
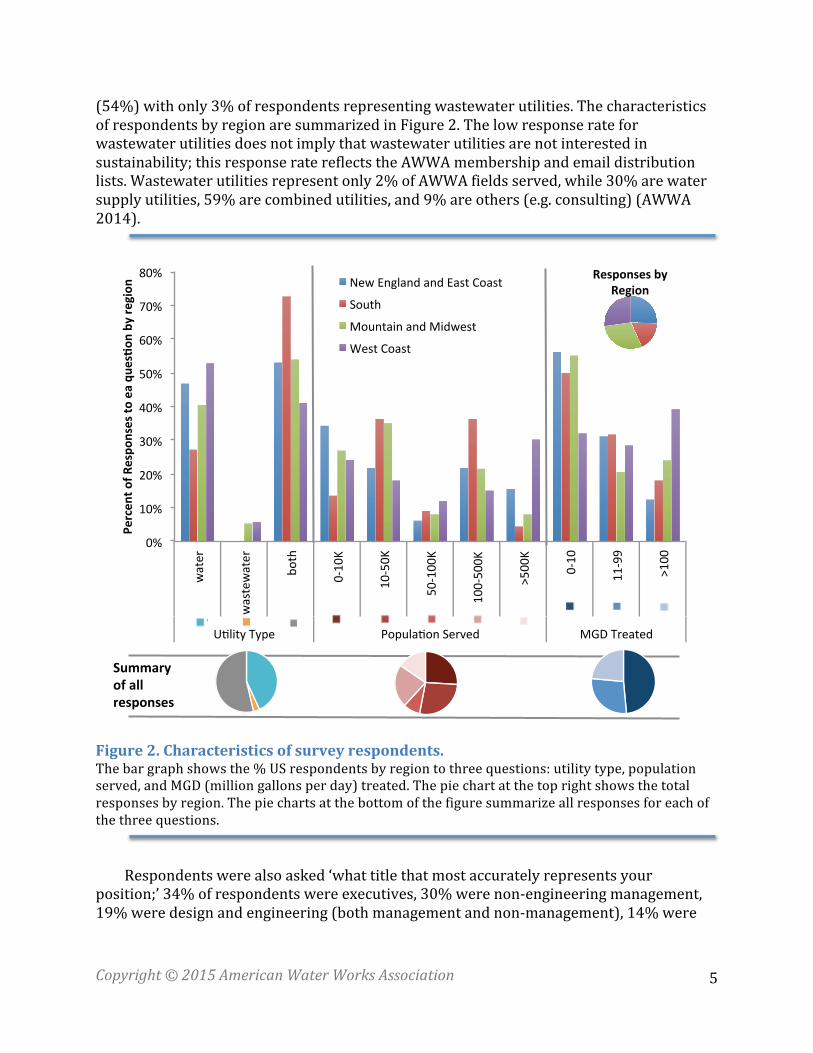
In the analysis, states were grouped by EPA Regions and further grouped by the following classifications: New England & East Coast represent states from EPA Regions 1, 2, & 3 (VA, WV, PA, DE, MD, DC, NY, NJ, ME, VT, NH, MA, RI, CT). South represents states from EPA Regions 4 & 6 (NM, TX, OK, AR, LA, KY, TN, MS, AL, GA, FL, SC, NC). Mountain & Midwest represent states from EPA Regions 5, 7, & 8 (MT, WY, CO, UT, ND, SD, IA, NE, KS, MO, MN, WI, IL, IN, OH, MI). West Coast represents states from EPA Regions 9 & 10 (AK, WA, OR, ID, HI, CA, NV, AZ).
Survey data were analyzed for correlations between responses and the utility characteristics (i.e. type, region, population served, MGD) to determine if there were regional differences or differences in adoption of sustainability practices based on utility type. In many cases there were too few data to determine significance among correlations. For example, only 3% of respondents were wastewater only utilities; as such their responses were too few to determine any trends or correlations. The population served and MGD treated had no significant correlations to any survey questions. Correlations are noted in the results. Where correlations are not noted, no correlation between the survey question and utility characteristics was found.
The survey assessed drivers for sustainability by asking respondents to report who drives sustainability at their organization. The survey also asked utilities whether or not they had a sustainability plan or vision, in addition to specific subsets of sustainability plans, such as a community engagement plan, a service affordability plan, a source water protection plan, and/or a greenhouse gas plan. Both questions used check all that apply boxes.
The survey also reviewed utilities' sustainable infrastructure practices in the form of a set of sustainable technology/practice checklists, a question that asked utilities to rank sustainability factors, a question on sustainability tools, and a question on sustainability
Copyright © 2015 American Water Works Association 3


•
•
••
•••
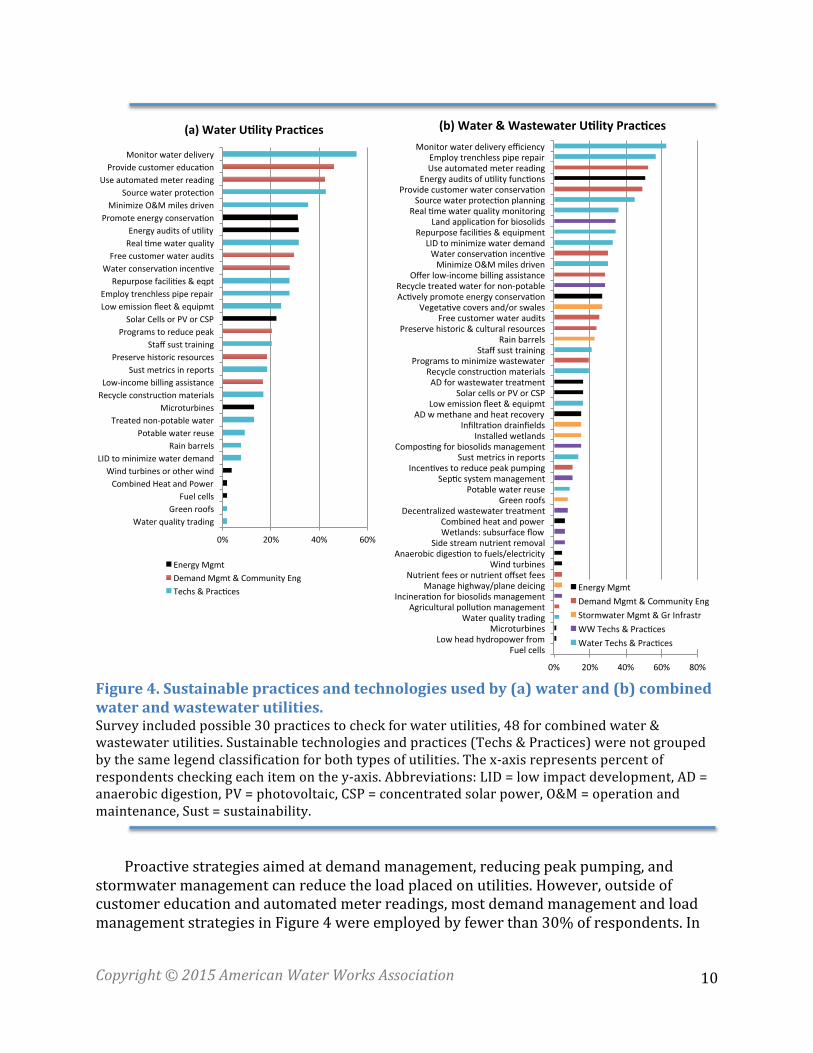

fact, the bulk of sustainability practices (25 out of 30 for water utilities and 38 out of 48 for combined utilities) were used by 30% or fewer of utilities responding to the survey.
Sustainability Tools and Metrics Sustainability tools and metrics are critical to the success of sustainability practices.
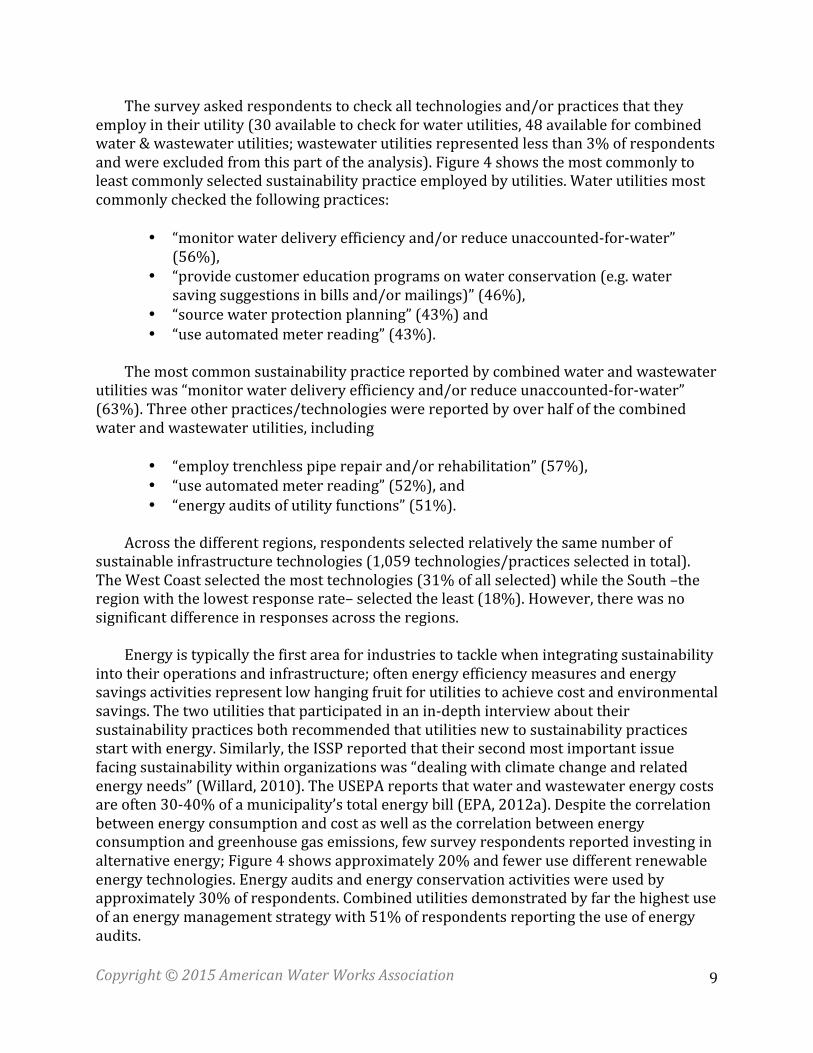
Tools and metrics are used to assist in planning new capital improvement infrastructure projects as well as plan for upgrading existing infrastructure. In addition, tools and metrics aid utilities in monitoring and tracking progress toward sustainability goals; metrics allow for comparison to benchmarks and enable sustainability reporting. Without tools and metrics, utilities can not document, report, or evaluate the effectiveness of sustainability practices. The survey asked, "What tool(s) does your utility use to evaluate the sustainability of your water and/or wastewater infrastructure? (Check all that apply)." There were 16 different tools available for utilities to check in response to this question. Nearly half of respondents (58 out of 125, 46%) checked zero tools; 22% of respondents only reported using one tool (Figure 5). If utilities only use one or two tools, energy or water audits tend to be more often used than any other tools.
50% 45% 40% 35% 30% 25% 20% 15% 10%
5% 0%
Sustainability tools
0 1 2 3 4 5-10 >10 # Tools checked by respondents
NONE
Other
Staff Evals
Labels
LCA/LCC
Audits
Envision
Scorecards
Figure 5. Sustainability tools used by water, wastewater, and combined utilities. Within the Types of Tools: 'Labels' include LEED and EPA's watersense; LCA = life cycle analysis, LCC = life cycle costing; 'Audits' include energy and water audits; 'Other' includes sustainability consultants, ecological footprints, The Natural Step, and EPA's climate ready water utilities toolbox. Utilities checking 5 through 10 tools are combined under 5-10 on the x-axis.
Energy and water audits (30 and 28% of all respondents report using these tools, respectively) were by far the most commonly employed tools used by utilities to evaluate the sustainability of their infrastructure. Across the different regions, respondents selected relatively the same number of tools (188 tools selected in total). The West Coast selected the most tools (34% of all selected) while the South -the region with the lowest response rate- selected the least (18%). Approximately 14% of respondents reported using sustainability scorecards that they either developed themselves or borrowed from other
Copyright © 2015 American Water Works Association 11
% o
f res
pond
ents
Type
of T
ool


•
•
•

•••••••
••••••


•
•
•


Category Criteria Wt Scoring Guidelines Score Characteristic
Eco
nom
y To
tal w
eigh
t = 1
0
Supports economic growth and development
3 5 3 1
Project will directly allow increased development. Project will only serve existing development. Project incidental to existing and/or new development.
Utilization of local employment and manufacturing
3 5 3 1
Oregon/Washington employment and manufacturing. US employment and manufacturing. Outside US employment and manufacturing.
Improves efficiency (1) Improves effectiveness (1) Improves reliability (1) Reduces long-term costs (1) Other economic benefit (1)
4 5 3 1
Five criteria addressed Three criteria addressed One criterion addressed
Soci
ety
Tota
l wei
ght =
10
Meets regulatory or contractual requirement or recognized standards of practice
5 5
3
1
Corrects current violation of regulation, contract, or standards of practice. Prevents future violation of regulation, contract, or standards of practice. Not related to regulation, contract requirements or standards of practice.
Supportive of community esthetics and livability
2 5
3 1
Elements of the project enhance esthetics and livability. Project is neutral to esthetics and livability. Project reduces esthetics and livability.
Improves public/employee safety, including fire protection capacity; improves drinking water quality
3 5 3 1
Exceeds standards for safety / water quality. Meets standards for safety / water quality. Not related to safety / water quality.
Env
iron
men
t To
tal w
eigh
t = 1
0
Construction impact on natural environment
3 5
3
1 0
Minimize impact w/ significant improvement of natural systems. Minimize impact w/ some improvement to natural systems. Minimize impact w/ restoration as found. Negative impact on natural environment
Project Sustainability 3 5 3 1
Significant incorporation of sustainability principles. Modest incorporation of sustainability principles. Low incorporation of sustainability principles.
Supports conservation and/or demand management goals
4 5 3 1
Significant support. Modest support Project not related to conservation or demand management.


![Enhancing Sustainable Utility Regulation [“ENSURE”]”](https://static.fdocuments.us/doc/165x107/616bb70dfaf1a456b7371252/enhancing-sustainable-utility-regulation-ensure.jpg)